Novos Aspectos da Fisiopatologia em Doenças Falciformes e ... · • 0º ao 4º dia...
95
Novos Aspectos da Novos Aspectos da Novos Aspectos da Novos Aspectos da Fisiopatologia em Doenças Fisiopatologia em Doenças Fisiopatologia em Doenças Fisiopatologia em Doenças Falciformes e Talassemias: Falciformes e Talassemias: Falciformes e Talassemias: Falciformes e Talassemias: Contribuição de Estudos Contribuição de Estudos Contribuição de Estudos Contribuição de Estudos Brasileiros Recentes Brasileiros Recentes Brasileiros Recentes Brasileiros Recentes
-
Upload
duongtuyen -
Category
Documents
-
view
212 -
download
0
Transcript of Novos Aspectos da Fisiopatologia em Doenças Falciformes e ... · • 0º ao 4º dia...

Novos Aspectos da Novos Aspectos da Novos Aspectos da Novos Aspectos da Fisiopatologia em Doenças Fisiopatologia em Doenças Fisiopatologia em Doenças Fisiopatologia em Doenças Falciformes e Talassemias: Falciformes e Talassemias: Falciformes e Talassemias: Falciformes e Talassemias:
Contribuição de Estudos Contribuição de Estudos Contribuição de Estudos Contribuição de Estudos Brasileiros RecentesBrasileiros RecentesBrasileiros RecentesBrasileiros Recentes

Talassemias
•• a mais comum das doenças monogênicasa mais comum das doenças monogênicas
•• primeiro grupo de doenças caracterizadas do ponto primeiro grupo de doenças caracterizadas do ponto de vista molecularde vista molecular
•• relação entre fenótipo clínico e patologia molecularrelação entre fenótipo clínico e patologia molecular
•• exemplo de como a seleção natural age na exemplo de como a seleção natural age na diversidade humana diversidade humana -- proteção contra maláriaproteção contra malária
•• primeiro diagnóstico préprimeiro diagnóstico pré--natal por DNA natal por DNA recombinanterecombinante

Formas Clínicas da Doença
• talassemia beta heterozigótica
• talassemia intermediária
• talassemia maior
• MODULADORES GENÉTICOS DE GRAVIDADE
AHSPAHSP
((Alpha Alpha HaemoglobinHaemoglobin Stabilizing ProteinStabilizing Protein))
analysis during human analysis during human erythropoiesiserythropoiesis
and in and in ββββββββ--ThalassemiaThalassemia

AHSP
(Alpha Hemoglobin Stabilizing Protein)
• Proteina eritroide-especifica– Liga-se expecificamente a α-globina
– Estabiliza α-globina em excesso – chaperonamoleculas durante a sintese de Hemoglobina
• Modulador de gravidade em β-thalassemia– Relacao entre gravidade clinica e niveis diminuidos de expressao do gene AHSP

Balancing the components of hemoglobin.
Luzzatto and Notaro, 2002
AHSP binds specifically to αααα-hemoglobin, and suggest that it might thereby
serve a dual purpose: to stabilize these chains and to help in delivering newly
formed αααα-chains to ββββ-chains.

Analise genetica populacional
identifica sequencias variantes que
alteram funcao e expressao do gene
AHSP
Camila O. dos Santos, et.al.American Journal of Hematology,in press,2007

50 individuos provenientes da regiao da Papa Nova Guine
46 individuos provenientes de paises do Mediterranean
50 individuos provenientes de paises da India
46 individuos proveniente de Port Olry (Continente Asiatico)
48 individuos provenientes de paises Afro-Caribenhos
126 individuos provenientes do Brasil
Analise do gene AHSP

Polimorfismos no gene AHSP

Haplotipos do gene AHSP

2.04.3G15AGTTH18
12.215.048.56.4G15AATTH17
1.8A18AATTH16
1.80.91.1A18AGTTH15
8.90.93.2A18GATTH14
62.247.06.42.99.6G15GATTH13
4.525.014.9G15GGTTH12
3.2A18GGTTH11
1.8A18AAGTH10
1.15.01.80.9A18GAGTH9
3.03.61.1G15GAGTH8
1.11.01.8A18AGGCH7
1.8G15GGGCH6
2.1A18GGGCH5
1.14.3G15AGGTH4
7.86.037.521.83.2A18AGGTH3
1.12.77.4G15GGGTH2
13.321.044.657.423.539.4A18GGGTH1
1 2 3 4 5 6
P
(n=92)
NG
(n=100)
M
(n=92)
B
(n=252)
AI
(n=100)
AC
(n=96)
Sequencia de ntHaplotipo
Frequencia (%)
AC – Afro caribenhosAI – IndiaB – BrasilM – MediterraneoNG – Papa Nova GuineP – Port Orly
Distribuicao do haplotipo do gene AHSP na
populacao estudada

AHSP N75I é menos efetiva na proteção contra
geração de ROS
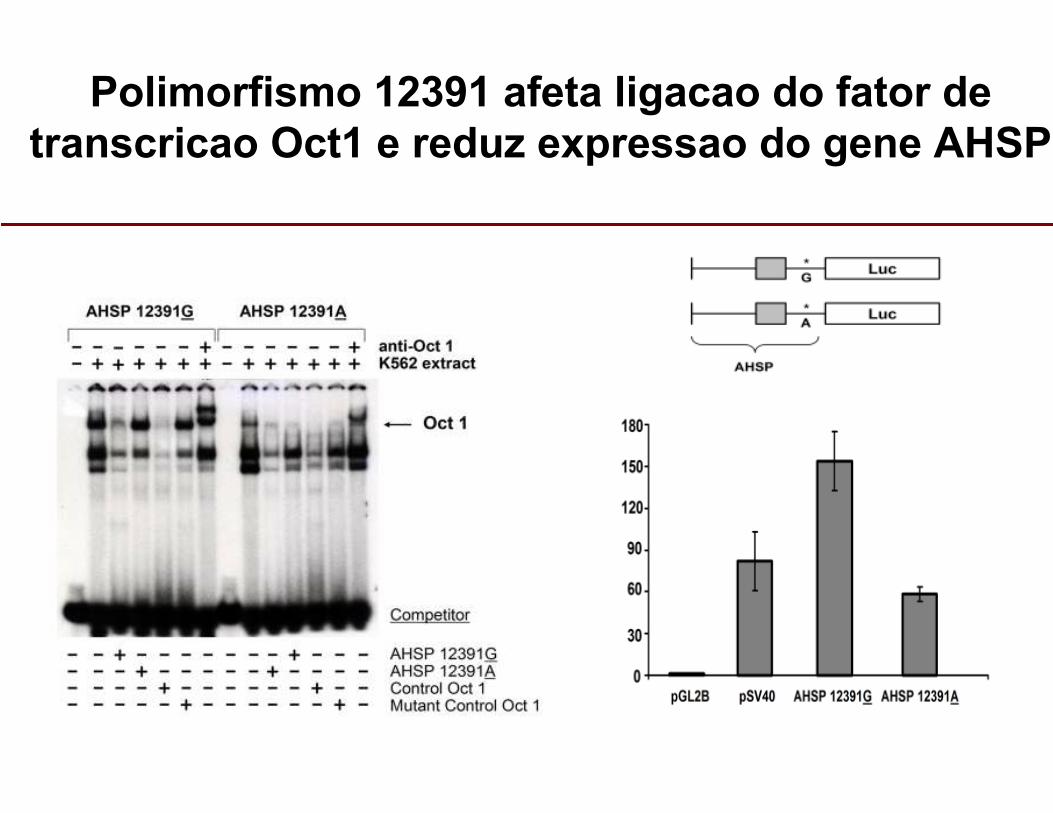
Polimorfismo 12391 afeta ligacao do fator de
transcricao Oct1 e reduz expressao do gene AHSP
Conclusoes
• Mutacoes e ou delecoes no gene AHSP sao raras;
• AHSP N75I e menos efetiva na protecao contra geracao de ROS;
– Possivel implicacoes em β-talassemia
• Ampliacao dos estudos em individuos provenientes do continete Mediterraneo
• Polimorfismo 12391 diminui os niveis de expressao do gene AHSP
– Possivel implicacoes em β-talassemia

CASE 1
ββββ-thalassemia
AHSP N75I
αα/αα5.2410.419676.8N75I/N75Nβ39/βApatient
αα/αα0.75.719.76310.8N75N/N75Nβ39/βAmother
αα/αα0.22.029.789.614.5N75I/N75NβA/βAfather
AA/AA0.22.029.789.614.5N75I/N75NBA/BAfather
AA/AA0.75.719.76310.8N75N/N75NB39/BAmother
AA/AA5.2410.419676.8N75I/N75NB39/BApatient
Family 1
α-globin genesHbFHbA2(%)
Ret (%)
MCH (pg)
MCV (fL)Hb(g/dL)
AHSP geneβ-globin genesSample

Expressão gênica durante diferenciação
eritróide
Cultura de Células em Duas FasesCélulas mononucleares isoladas à partir de sangue de doadores por centrifugação em gradiente de Ficoll-Hypaque. Consiste em cultura primária (+ 7 dias) e em cultura secundária com adição de eritropoetina (+15 dias).
– Coletas para citospin – morfologia celular;
– Coletas para citometria de fluxo – diferenciação;
– Coletas para extração de RNA – cDNA
dos Santos CO et al. Exp. Hematol. 32 (2):157-62, 2004.

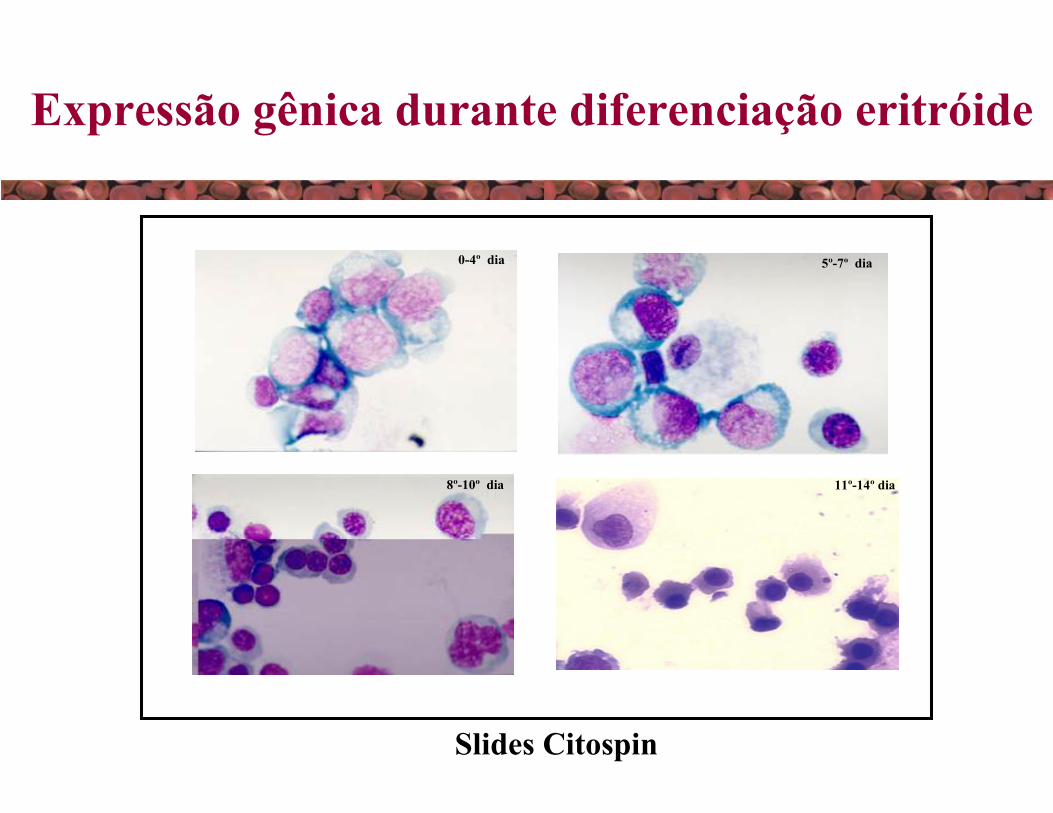
Expressão gênica durante diferenciação
eritróide
Cultura de Células em Duas Fases
– Foram analisadas 5 culturas de células, onde as coletas de cada cultura foram agrupadas em:• 0º ao 4º dia – predominância de pró-eritroblastos
• 5º ao 7º dia – presença de eritroblastos basofílicos
• 8º ao 10º dia – presença de eritroblastos policromatófilos e alguns ortocromáticos
• 11º ao 14º dia – predominância de eritroblastos ortocromáticos
– Análise estatística – Teste não paramétrico de Wilcoxon-Mann-Whitney, sendo significativo se p igual ou menor que 0,05.
0-4º dia 5º-7º dia
8º-10º dia 11º-14º dia
Expressão gênica durante diferenciação eritróide
Slides Citospin
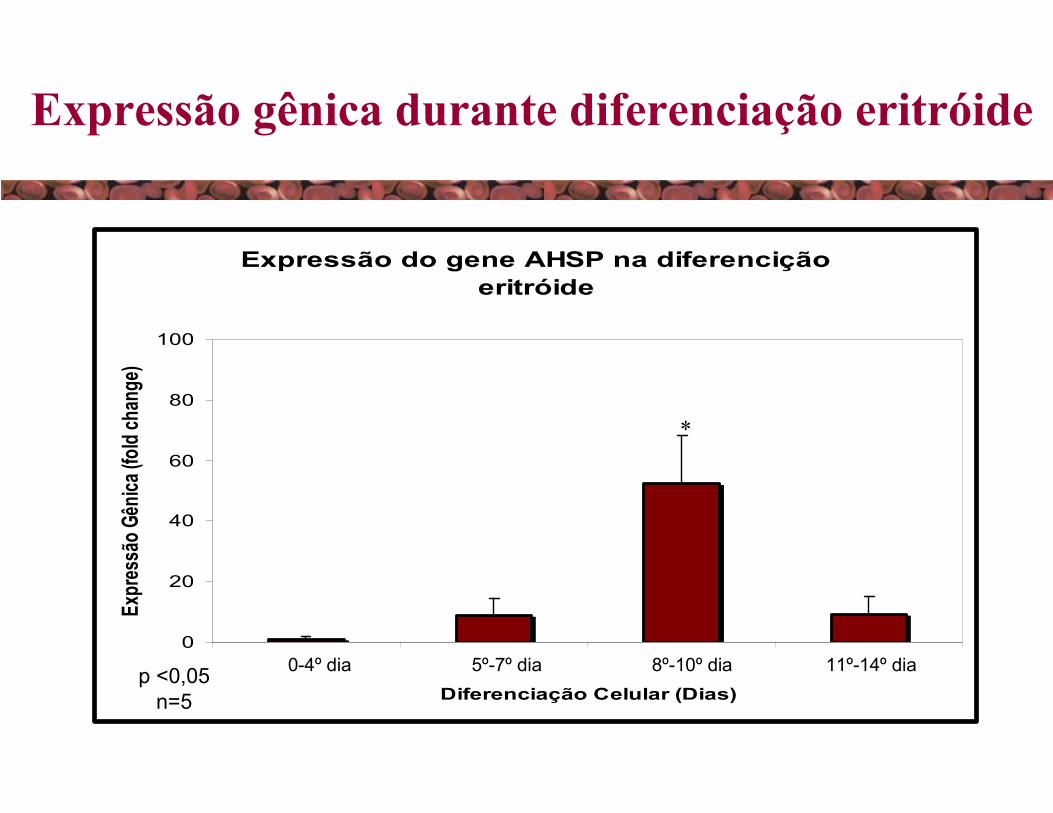
Expressão do gene AHSP na diferencição
eritróide
0
20
40
60
80
100
0-4 days 5-7 days 8-10 days 11-14 days
Diferenciação Celular (Dias)
Exp
ress
ão Gên
ica (fo
ld cha
nge)
0-4º dia 5º-7º dia 8º-10º dia 11º-14º diap <0,05n=5
*
Expressão gênica durante diferenciação eritróide

Expressão do gene Alfa-globina na diferenciação
eritróide
0
100
200
300
400
500
0-4 days 5-7 days 8-10 days 11-14 days
Diferenciação celular (Dias)
Exp
ress
ão Gên
ica (fold chan
ge)
0-4º dia 5º-7º dia 8º-10º dia 11º-14º diap <0,05n=5
*
Expressão gênica durante diferenciação eritróide

Expressão gênica durante diferenciação eritróide
Razão da expressão dos genes AHSP / Alfa-globina na
diferenciação eritróide
0
0,2
0,4
0,6
0,8
1
1-4 dias 5-7 dias 8-10 dias 11-14 dias
Diferenciação Celular (Dias)
Razão
N.S.
0-4º dia 5º-7º dia 8º-10º dia 11º-14º dia

Expressão gênica em pacientes com
ββββ-Talassemia e em controles
Razão da expressão dos genes AHSP/Alfa-globina em pacientes
com B-talassemia e em controles
0,000
0,020
0,040
Intermediaria Maior Controle
Pacientes
Razão
p > 0.05
*
0.04
0.02
0.00

MAIN HYPOTHESIS
Lower AHSP production
severe clinical status
Higher α-globin degradation and precipitation

Consequences of reduction of AHSP
synthesis in hemin-induced K562 cells
and EPO-induced CD34+ cells
The relationship between Hb formation and
alterations in AHSP expression, which may
affect human erythropoiesis, has not yet been
described in human cells.
The aim of this is to examine the effects of
AHSP knockdown in hemin-induced K562 and
EPO-induced CD34+ cells with particular
reference to cellular aspects and gene
expression.

ResultadosResultados
Expressão do gene AHSP
0
1
2
3
4
5
6
7
8
Antes da
transfecção
0h sem
hemina
0h com
hemina
24h com
hemina
48h com
hemina
72h com
hemina
96h com
hemina
Cultura de células K562 transfectadas por Eletroporação
Unidades Arbitrárias
Controle sem Vetor
Vetor Negativo - 15ug
Vetor de RNAi para AHSP - 15ug

(A) AHSP expression profile and the representative AHSP knockdown in human erythroid cells in culture at end stages of maturation.
(Β) α-globin gene expression profile in human erythroid cells in culture at end stages of maturation.
(C) γ-globin gene expression profile in human erythroid cells in culture at end stages of maturation.
Control Negative Control AHSP sh-RNA cells
♦♦ ♦♦KWOWAV (p<0.05)
I
γγ γγ-globinexpression levels
0
0.5
1
1.5
αα αα-globinexpression levels H
0
0.5
1.5
1
G
AHSP expression levels
0
0.2
1
0.6
C10 C13
♦
♦
DCF fluorescence intensity
C10
C13C
10C13
A B CI
γγ γγ-globinexpression levels
0
0.5
1
1.5
αα αα-globinexpression levels H
0
0.5
1.5
1
G
AHSP expression levels
0
0.2
1
0.6
C10 C13
♦
♦
DCF fluorescence intensity
C10
C13C
10C13
A B C

K
Annexin-and PI-labeled cells (%)
0
5
1 0
1 5 ♦♦
L
HbFfluorescence intensity
0
1 , 0 0 0
1 , 5 0 0
5 0 0
♦
J
DCF fluorescence intensity
0
1 0 0
3 0 0
2 0 0♦
♦
HbFfluorescence intensity
0
expression ratioB
1
1 . 5
B T H * H7 2
H1 2 0
H1 6 8
C1 0
C1 3C
1 0C1 3C
1 0C1 31 3
A B C
Control Negative Control AHSP sh-RNA cells
(A) Indirect identification of ROS through DCF fluorescence detection and increase in ROS expression in human AHSP-shRNA mature erythroid cells.
(B) Increase in Annexin and PI labeling in human AHSP-shRNA erythroid cells in culture at end stages of maturation.
(C) Decrease in fetal hemoglobin (HbF) formation in human AHSP-shRNA erythroid cells in culture at end stages of maturation.
♦♦ ♦♦KWOWAV (p<0.05)

ResultadosResultados
Anti-Alfa Anti-BAC
DAPI DAPI
Anti-Alfa Anti-BAC
Eletroporação
Controle Negativo RNAiEletroporação
RNAi para o gene AHSP

• (D) Alpha hemoglobin chain precipitation in AHSP-shRNA mature erythroid cells (bottom and left) in relation to negative control cells (top and left), the inclusion bodies are clearly identifiable (white arrow).
αααα-globinOverlay
with DAPIββββ-actin
3 dyes together
Negative
Control
AHSPshRNA
D αααα-globinOverlay
with DAPIββββ-actin
3 dyes together
Negative
Control
AHSPshRNA
D αααα-globinOverlay
with DAPIββββ-actin
3 dyes together
Negative
Control
AHSPshRNA
D αααα-globinOverlay
with DAPIββββ-actin
3 dyes together
Negative
Control
AHSPshRNA
D
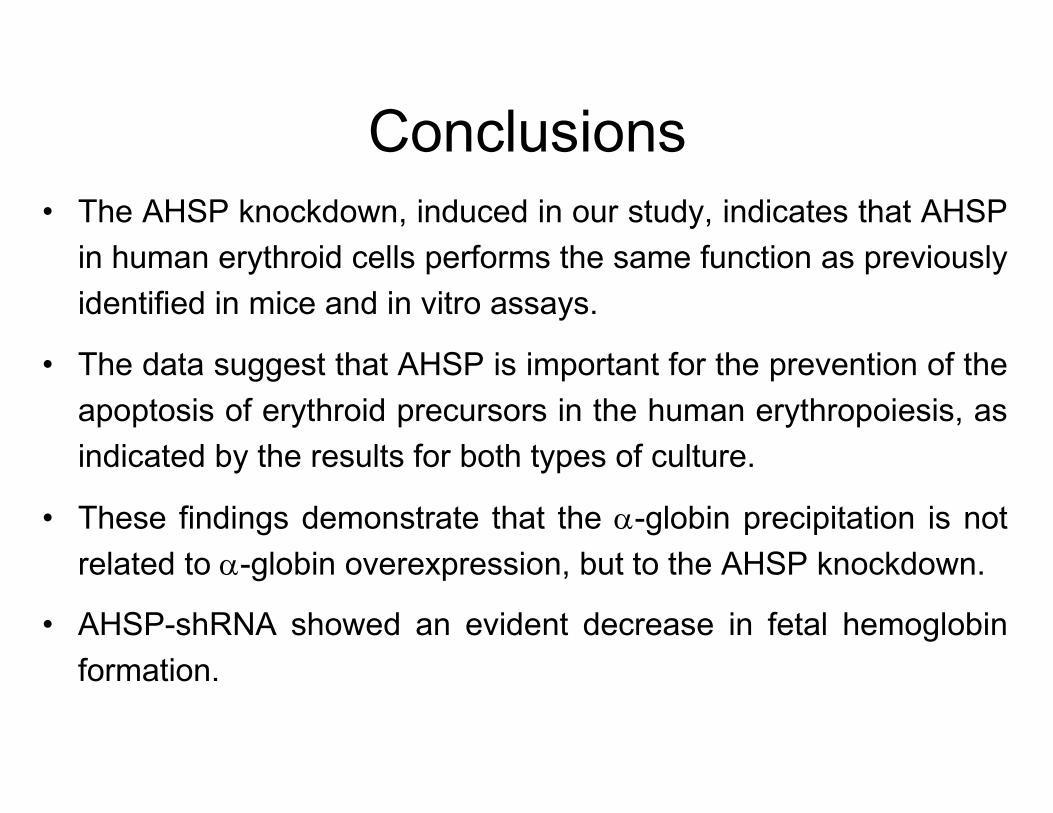
Conclusions• The AHSP knockdown, induced in our study, indicates that AHSP
in human erythroid cells performs the same function as previously
identified in mice and in vitro assays.
• The data suggest that AHSP is important for the prevention of the
apoptosis of erythroid precursors in the human erythropoiesis, as
indicated by the results for both types of culture.
• These findings demonstrate that the α-globin precipitation is not
related to α-globin overexpression, but to the AHSP knockdown.
• AHSP-shRNA showed an evident decrease in fetal hemoglobin
formation.

Conclusions
• Taken together, our data show for the first time a
possibly highly significant role for AHSP in normal
hemoglobin synthesis and cell survival in human
cells. The possibility that AHSP acts as a genetic
modifier in human disease remains to be
demonstrated; however our data strengthen and
support studies regarding this possibility.


PHHF tipo Brasileira
• Mutação –195 C�G promotor γA (Costa e cols., 1990 e Bordin e
col., 1998).
• Experimentos preliminares utilizando gene repórter
da luciferase (Schreiber e cols., 2001).
– Não demonstraram ↑ de expressão na presença da
mutação.
– Hipótese: ausência do LCR

Fatores de Transcrição

Vetores de expressãoTakahashi, T. et. al.Eur J.
Haematol,2003

Quantificação de luciferase na célula K562
0
0,2
0,4
0,6
0,8
1
1,2
1,4
1,6
1,8
2
2,2
2,4
LucHS2normal
LucHS2-195
LucHS2-175
Luc-195
Luc normal

High levels of human γγγγ-globin gene expression in adult mice carrying
a transgene of Brazilian type of Hereditary Persistence of Fetal
Hemoglobin
(Aγγγγ -195 C →→→→G )
• The term, hereditary persistence of fetal hemoglobin (HPFH), describes a
hereditary benign disease, characterized by an increase in fetal hemoglobin
(HbF) during adult life.
• Non-deletional forms of HPFH are characterized by single-base mutations in
the promoter region (most of them between -114 and -202 from the cap site) of
either the Gγ or Aγ -globin gene, resulting in an increase of HbF ranging from 3 to 20% in heterozygotes.
• Many point mutations in this region have been described, including the Aγ -195 C →G mutation that causes the Brazilian type of HPFH (HPFH-B).

LCR ε γG γA ψβ δ β
Embrião
Feto
Adulto
LCR ε γG γA ψβ δ β
Embrião
Feto
Adulto
Embrião
Feto
Adulto
LCR ε γG γA ψβ δ β
Embrião
Feto
Adulto
Aγγγγ -195 C →→→→G
Expressão de gama
globina no adulto
LCR ε γG γA ψβ δ β
Embrião
Feto
Adulto
Aγγγγ -195 C →→→→G
Expressão de gama
globina no adulto
Normal developing
Brazilian type of Hereditary
Persistence of Fetal
Hemoglobin
(HPFH-B)
Embryo
Fetus
Adult
Embryo
Fetus
Adult
Gamma globin
expression during
adult life

RPA (RNAse Protection
Assay)
Single cellembryo Embryos
Transgenicselection
HPFH-BTransgenic mouse
pseudo-pregnant female
F1
Aγγγγ -195 C →→→→G
HPFH-B transgenic mice construction

α
γβ
α
α
RNAse Protection Assay
mRNA levels of human gamma-globin
in fetal liver of transgenic mice
containing mutation were clearly
higher as compared with control
transgenic mice bearing cosmid
construct with wild type sequence
gamma promoter.

Conclusions
• A higher increase in gamma globin transcripts were found in a adult mice
carrying a transgene of Brazilian type of Hereditary Persistence of Fetal
Hemoglobin (Aγ -195 C →G ) showing that the mutation is the unique cause of elevation of HbF.
• These results may help develop the novel clinical approaches for the
increase of the expression of gamma globin in patients with abnormal beta
globin genes, such as sickle cell (HBS) and beta-thalassemia diseases

Anemia FalciformeAnemia Falciforme


Os Leucócitos e a Vaso-oclusão
Frenette & Atweh (2007) J Clin Invest 117: 850


Efeitos do ambiente na Efeitos do ambiente na
evolução clínica da anemia evolução clínica da anemia
falciformefalciforme

Clinical, hematological, andmolecular characterization of sicklecell anemia pediatric patients from
two different cities in Brazil
Caracterização clínica, hematológica e molecular de crianças portadoras
da anemia falciforme em duas diferentes cidades do Brasil
Lyra I. et al. Cadernos de Saúde Pública(FIOCRUZ); 21: (04), 1287-1290, 2005.

100.056100.070Total
8.563.02Atypical
55.03148.034CAR
34.01948.034Ben
São Paulo
n %
Salvador
n %
Chromosome
Chromosome distribution in the cities of Salvador
and São Paulo, Brazil
Table 1

7538124524074TOTAL
125900411Atypical
00151058Ben/Ben
32142810414CAR/CAR
311882322741Ben/CAR
LithiasisStrokeHospital
admissions
infection
Hospital
admissions vaso-
occlusion
LithiasisStrokeHospital
admissions
infection
Hospital
admissions vaso-
occlusion
São PauloSalvadorHaplotype
Frequency of clinical manifestations in different ββββs globin genotypes in Brazilian sickle cell anemia
Table2

Pacientes falcêmicos dos estados da Bahia e São Paulo e características laboratoriais hematológicas. Resultados do teste de Mann - Whitney (z) e do teste "t" de Student ("t").
Característica Ba SP Análiselaboratorial estatística
Ht 23,27 ± 3,21 24,38 ± 3,73 z cal .= 0,91 N.S.
Hb 7,48 1,11 7.8 1,17 "t"cal .= 0,96N.S.
V.C.M. 91,89 8,07 88,84 8,27 "t"cal.=1,5 N.S.
H.C.M. 29,71 3,12 28,61 3,0 "t"cal.=1,43 N.S.
C.H.C.M. 32,28 1,71 31,89 2,25 "t"cal. =0,76N .S.
Hb A 2,41 ± 0,60 2,86 ± 0,64 z cal. =3,12 *
Hb F 6,56 ± 3,22 6,25 ± 3,76 z cal. =0,43N.S.
Idade 9,3 ± 3,91 9,3 ± 4,54 “ t" cal = 0,01 N.S.
molecular modulators of clinicalseverity

UDP – glucunosyltransferase 1 (UGT1A)

Table 1. Laboratory and clinical data of patients with sicklecell anemia subdivided by their UDP-glucuronosyltransferase 1 (UGT1A)
UGT1Agenotype
Mean serum total bilirubin levels (mg/dl)
TA6/ TA6
TA6/ TA7
TA7/ TA7
3.33 = 0.87
3.95 = 1.07
6.88 = 1.52
Mean serumunconjugated bilirubin
levels (mg/dl)
2.42 ± 1.62
3.12 ± 0.94
6.03 ± 1.48
Frequency of cholelithiasis (%)
58.8 (10/17)
70.0 (14/20)
80.0 (8/10)
Frequency of cholecystectomy (%)
5.5 (1/18)
36.8 (7/19)
10.0 (1/10)
Fertrin . et al. Clinical Genetics 64:160-162, 2003.
ASSOCIATION OF THE G-463A MYELOPEROXIDASE
POLYMORPHISM WITH INFECTION IN SICKLE CELL ANEMIA
� Infections constitute a principal cause of morbidity
� and mortality in sickle cell anemia (SCA). Here
� we present evidence to suggest that a polymorphism
� (G-463A MPO) in the gene encoding the
� myeloperoxidase (MPO) enzyme, important for the
� host defense system, may significantly increase
� susceptibility to infection in SCA.
Costa, R.N.P. et al. Haematologica, 90: (07), 977-979, 2005.

Table 2. MPO genotype and allele frequency in SCA patients not experiencing infections and in those having one or more infections during their clinical follow-up.
Genotype Frequency (%)
Allele Frequency (%)
A/A A/G G/G A G Reference Group (n=50)
3
(6.0)
17
(34.0)
30
(60.0)
23.0 77.0
SCA without infections (n=63)
2
(3.2)
20
(31.7)
41
(65.1)
19.0 81.0
SCA with one or more infections (n=28)
2
(7.1)
17
(60.7)
9
(32.1)
37.5 62.5
p=0.0112 p=0.0096 The reference group was formed of racially-matched healthy individuals. Fisher’s exact test was used for the statistical
analyses. p values refer to the comparison of the underlined groups.

Coagulação e Trombose
• Variante da protombina (alelo 20.210 A)
• Fator V de Leiden (677 C→T)
• Variante termolabil da metilenotetrahidrofolatoredutase (MTHFR)
• Plaquetas

Human Platelet Antigen (HPA)-5 system polymorphism is a riskfactor for occlusive vascular complications in Sickle Cell
Anemia patients
Castro,V.et. al.Vox Sang 2004

Table 2- Genotypes, number of alleles and allelic frequencies of HPA-1, 2, 5 systems,
GpIa C807T polymorphism and 5T/C Kozak sequence between sickle cell anemia
patients with (SCA-VC) or without (SCA-N) occlusive vascular complications.
SCA-VC (n=34) SCA-N (n=63)
Genotype (%) N of
alleles
allele
frequency Genotype (%)
N of
alleles
allele
frequency
aa ab bb a b a b aa ab bb a b a b P(*)
HPA-1 64.7 32.4 2.9 55 13 0.809 0.191 73.0 25.4 1.6 108 18 0.857 0.143 NS
HPA-2 76.5 20.6 2.9 59 09 0.868 0.132 60.3 34.9 4.8 98 28 0.778 0.222 NS
HPA-5 44.1 47.1 8.8 46 22 0.676 0.324 77.8 22.2 0.0 112 14 0.889 0.111 0.0002
CC CT TT C T C T CC CT TT C T C T
C807T 61.8 26.5 11.8 51 17 0.750 0.250 46.0 36.5 17.5 81 45 0.643 0.357 NS
Kozak 0.0 41.7 58.3 10 38 0.208 0.792 6.0 32.0 62.0 22 78 0.220 0.780 NS
* Qui-Square P values obtained comparing allele frequencies of each polymorphism between the groups

Epinefrina
Citocinas?AMPc
Célula Endotelial Hemácia
falciforme
BCAM/LU
Laminina
Trombospondina
Fibronectina
VCAM-1 VLA-4
CD36
A Hemácia e a Vaso-oclusão

Therapy with hydroxyurea reduces adhesion molecule gene and protein expression in sickle red cells with a concomitant
reduction in adhesive properties
Gambero et al. (2007) Eu J Haematol 78:144
Aim
Compare the expressions of the CD36 and the VLA-4 integrin subunit genes on
reticulocytes from steady-state SCA patients on/off hyroxyurea therapy.
Adhesion of red cells from these subjects was compared using static adhesion assays
Surface protein expression was compared by flow cytometry.

0
2
4
6
8
10
12
14
16
18
20
AA EH SS SS+HU
% de adesão para FN
**
##
n=9 n=9 n=9n=4
AA: 50.9 x 10⁶ cells/ml
EH: 360.2 x 10⁶ cells/ml
SS: 370.9 x 10⁶ cells/ml
SSHU: 288.2 x 10⁶ cells/ml
The adhesion of SS RBC to FN is significantly greater than that of other patient groups, irrespective of red cell number
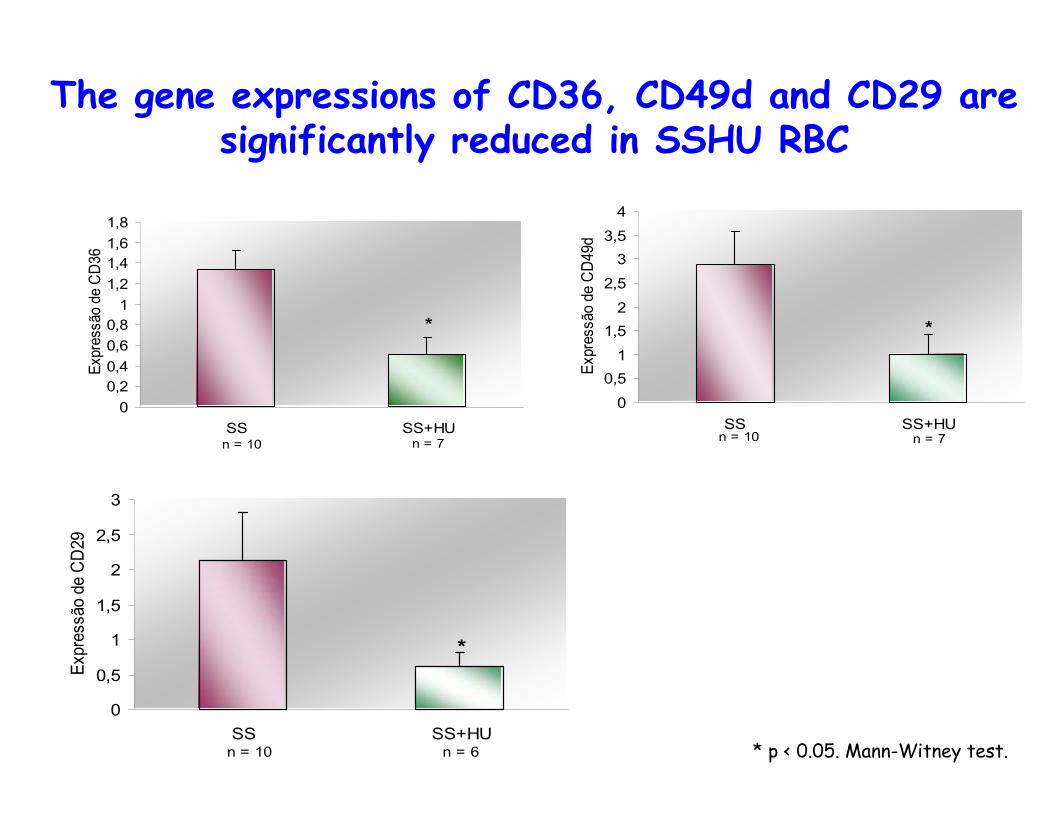
The gene expressions of CD36, CD49d and CD29 are significantly reduced in SSHU RBC
0
0,2
0,4
0,6
0,8
1
1,2
1,4
1,6
1,8
SS SS+HU
Expressão de CD36
*
n = 10 n = 7
0
0,5
1
1,5
2
2,5
3
3,5
4
SS SS+HU
Expressão de CD49d
*
n = 10 n = 7
0
0,5
1
1,5
2
2,5
3
SS SS+HU
Expressão de CD29
*
n = 10 n = 6 * p < 0.05. Mann-Witney test.
Conclusions
• The increased adhesive properties of SSRBC are reversed in patients on HU
therapy;
• This decrease could not be justified solely by altered reticulocyte numbers in
this population
• The decrease in adhesion of SSHU RBC was accompanied by a reduction in the
protein expression of the CD36 and VLA-4 adhesion molecules.
• Our data suggest that these HU-mediated reductions, both in protein
expression and in adhesive properties, may be mediated, in part, by the
decrease in the gene expression of these molecules.

Inhibition of spontaneous apoptosis
in neutrophils from sickle cell disease patients
Conran et al. (2007) Br J Haematol. (in press)
• SCD is a chronic inflammatory condition.
• Leukocytes may play an initiating and propagating role in vaso-occlusion
• Removal of inflammatory cells by apoptosis is fundamental for the resolution of inflammation
• We aimed to determine whether leukocyte apoptosis is altered in SCD.

Leucocytosis
Vascular Inflammation
Prostaglandins
(E1/E2)GM-CSF IL-8
Cytokine Production
IL-6
Intracellular AMPc
Inhibition of spontaneous apoptosis
in neutrophils from sickle cell disease patients
Conran et al., 2007 Br J. Haematol
Conran et al., 2007 Annals Hematol
Neutrophil

Intracellular AMPc
Inhibition of spontaneous apoptosis
in neutrophils from sickle cell disease patients
Neutrophil
Decreased cell death
in vitro
LeukocytosisDelay in the resolution of Inflammation
InflammationInflammation
VasoVaso--occlusionocclusion

Role for cAMP-Protein Kinase A signalling in
augmented neutrophil adhesion and chemotaxis in sickle cell disease
Canalli, Franco-Penteado et al., (2007) Eur J Haematol (in press)
• Leukocytes adhere to the vascular endothelium and play an initiating and propagating role in SCD vaso-occlusion
• What are the signaling pathways that mediate these increased adhesiveproperties?
• Are leukocyte chemotactic properties altered?
Basal
KT5720
Basal
KT 5720
KT 5823
DMSO
0
5
10
15
20
***
SCD
###
Control
A
% adhesion to FN
Basal
IL-8
IL-8+KT5720
Basal
IL-8
IL-8+KT 5720
IL-8+KT 5823
0
5
10
15
20
25
###
B
⊗⊗⊗⊗⊗⊗⊗⊗
SCD
+
Control
% adhesion to FN
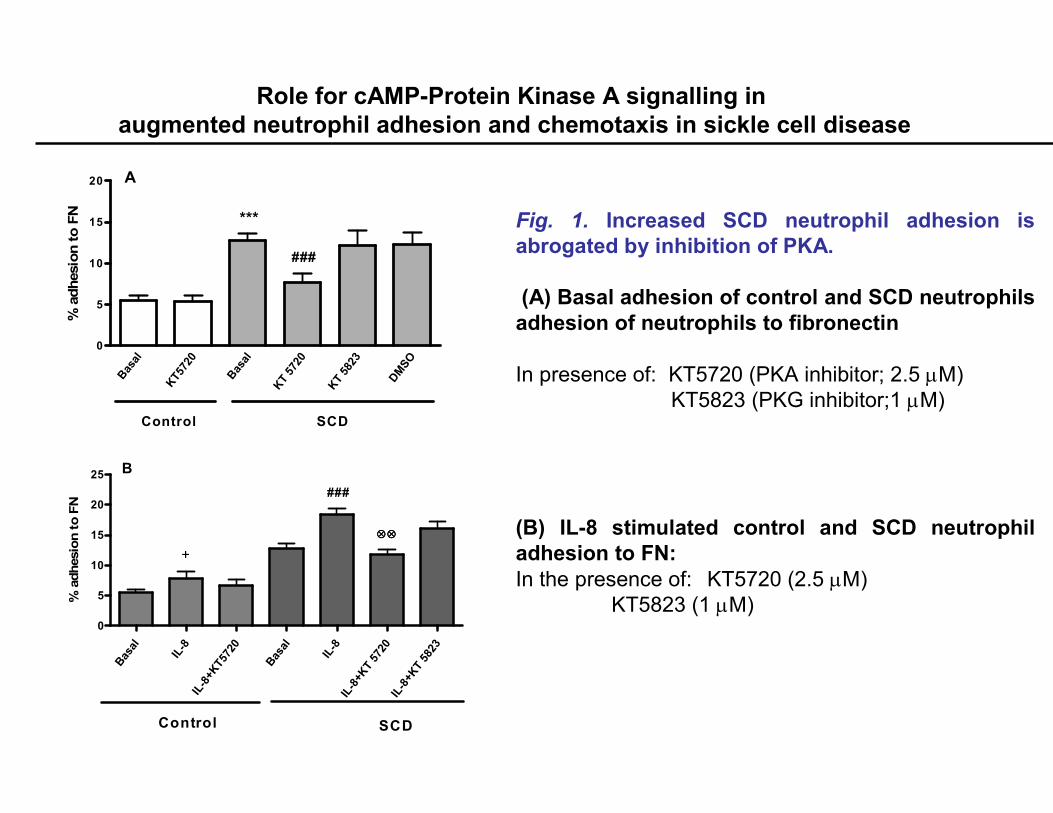
Role for cAMP-Protein Kinase A signalling in
augmented neutrophil adhesion and chemotaxis in sickle cell disease
Fig. 1. Increased SCD neutrophil adhesion is
abrogated by inhibition of PKA.
(A) Basal adhesion of control and SCD neutrophils
adhesion of neutrophils to fibronectin
In presence of: KT5720 (PKA inhibitor; 2.5 µM)KT5823 (PKG inhibitor;1 µM)
(B) IL-8 stimulated control and SCD neutrophil
adhesion to FN:
In the presence of: KT5720 (2.5 µM) KT5823 (1 µM)

Spont KT 5720 Spont KT 5720 KT 58230
5
10
15
Control SCD
**
#
A
Neutrophils x105/ml
IL-8 KT5720 KT5823 IL-8 KT5720 KT58230
5
10
15
20 B
Control SCD
+++
⊗⊗⊗⊗⊗⊗⊗⊗⊗⊗⊗⊗
+
Neutrophils x105/ml
Role for cAMP-Protein Kinase A signalling in
augmented neutrophil adhesion and chemotaxis in sickle cell disease
Fig. 2. Spontaneous and IL-8-stimulated chemotaxis
is increased in SCD neutrophils and reversed by
the PKA inhibitor, KT5720.
(A) Spontaneous chemotaxis of control and SCD
neutrophils
In the presence of: KT5720 (PKA inhibitor,2.5 µM) KT5823 (PKG inhibitor,1 µM)
(B) IL-8-stimulated chemotaxis of control and SCD
neutrophils
In the presence of: KT5720 (PKA inhibitor,2.5 µM) KT5823 (PKG inhibitor,1 µM) .

Intracellular AMPc
Neutrophil
Role for cAMP-Protein Kinase A signalling
in augmented neutrophil adhesion and chemotaxis in sickle cell disease
IncreasedIncreased adhesiveadhesive
propertiesproperties
Role in
Vaso-occlusion
Increased
Chemotaxis
Pulmonary
Inflammation?

� Leukocytes in sickle cell disease (SCD)
important role in vaso-occlusive process
Increased number of leukocytes in SCD
� Nitric oxide (NO)
regulation of vaso-relaxation
platelet aggregation
important in SCD pathophysiology
plasma bioavailability is decreased in SCD
Inhibition of Increased Sickle Neutrophil Adhesion to ICAM-1
by Nitric Oxide Donors and Activation of cGMP Signalling
Canalli et al sumitted by Hematologica in august 2007

� To compare nitric oxide metabolites and cGMP levels (second
messenger for NO) in neutrophils from normal subjects and
neutrophils from SCD patients (SCD neutrophils)
� To compare the adhesive properties of these cells and looked at
the effect of NO donating agents on this adhesion.
Study Design

0
5
10
15
20
25
control SCD
SNP0 0 SNP
neutrophil adhesion
to ICAM-1 (%)
0
5
10
15
20
25
control SCD
0 Deano Deano0
neutrophil adhesion
to ICAM-1 (%) Co-incubation of SCD neutrophils with SNP
(10µµµµM), DEANO (1µµµµM) and Bay 412272 (150 nM)
(reduced their increased adhesion to ICAM-1. In
contrast, these drugs did not significantly affect
normal neutrophil adhesion to ICAM-1
Effect of Nitric Oxide Donors (SNP; DEANO) and Guanylate
Cyclase Activator (Bay 412272) on SCD Neutrophil
Adhesion to ICAM-1
n ≥8
**p=0.009
t- test
n ≥3
**p=0.002
t- test
**
**
0
5
10
15
20
25
0 0
control SCD
Bay Bay
neutrophil adhesion
to ICAM-1 (%)
n ≥4
*p=0.01
t- test
*

�NO bioavailability may be decreased in SCD; however, our data
indicate that NO dynamics are not significantly altered in the
leukocytes of SCD patients (data not show)
� Increased neutrophil adhesive properties in SCD may not be the
consequence of decreased NO bioavailability;
� Other factors, such as altered cytokine levels may mediate
increased cell adhesion.
Conclusions

� However, NO donors were able to reduce increased SCD
neutrophil adhesion to ICAM-1, possibly via a cGMP-dependent
pathway;
� HU appears to decrease SCD neutrophil adhesive properties and
this may be mediated by an increase in intracellular cGMP;
� NO donating drugs may benefit SCD patients by reducing
increased leukocyte adhesion, a mechanism important for the
vaso-occlusive process.
Conclusions

Increased Adhesive Properties of
Eosinophils in Sickle Cell DiseaseCanalli et al; Exp Hematol, 2004.
� Vaso-occlusion of blood vessels is the hallmark of sickle cell
disease (SCD), accounting for much of its morbidity and mortality.
� The pathophysiology of the vaso-occlusive episodes involving
polymerization of the hemoglobin S, interactions between SS
erythrocytes, endothelium, platelets, leukocytes and plasma
constituents.
� Polymorphonuclear cell counts are often higher in SCD patients
and leukocytosis has been correlated with an increased rate of early
death, acute chest syndrome and stroke.

Objective
� The neutrophils of these patients demonstrate increased
adhesion to fibronectin and endothelial layers in static
adhesion assays.
Here we investigate a possible role for the eosinophil in
sickle cell disease (SCD) in process of vaso-occlusion.
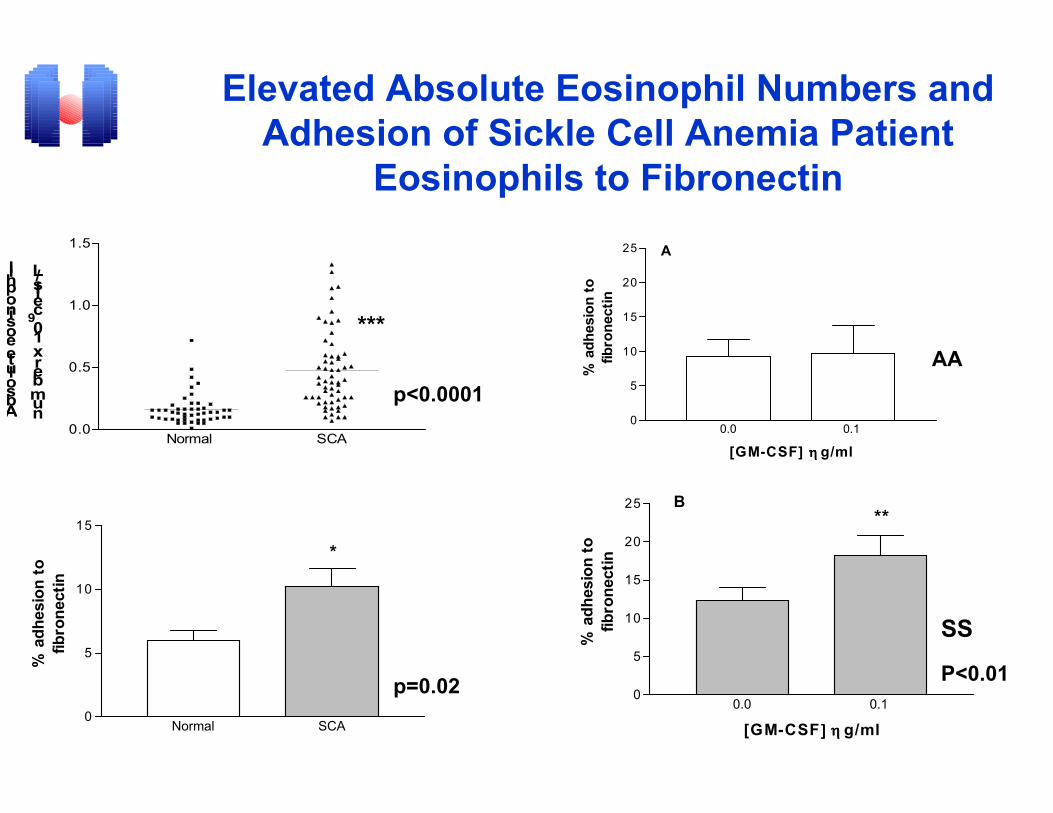
Normal SCA0.0
0.5
1.0
1.5
Absolute eosinophil
number x 109cells/L
Normal SCA0
5
10
15
*
% adhesion to
fibronectin
Elevated Absolute Eosinophil Numbers and
Adhesion of Sickle Cell Anemia Patient
Eosinophils to Fibronectin
0.0 0.1 0
5
10
15
20
25
[GM-CSF] ηηηη g/ml
% adhesion to
fibronectin
A
0.0 0.1 0
5
10
15
20
25 B
[GM-CSF]]]] ηηηη g/ml
% adhesion to
fibronectin
**
AA
SS
***
p<0.0001
p=0.02P<0.01

Conclusions
� We demonstrate, that the eosinophils of SCD individuals, in addition
to being found in increased numbers in the circulation of patients,
present augmented adhesive properties
� These enhanced adhesive properties are mediated, at least in part, by
the ββββ1 and ββββ2 integrins, VLA-4, LFA-1 and Mac-1 and appear to be the
consequence of changes in integrin affinity or avidity rather than
integrin expression (Flow cytometry indicated that expression of
these integrins is unaltered on the surface of SCD eosinophils)
� Further studies are required to determine whether the eosinophil
contributes to vasoocclusion in SCD.

GENE EXPRESSION PROFILES OF BONE
MARROW CELLS CHARACTERISE
SEVERAL MECHANISMS OF THE
ACTION OF HYDROXYUREA IN SICKLE
CELL ANAEMIA
British Journal of Haematology, 2007 Jan;136(2):333-42.

HBS – WITHOUT HU HBSHU – WITH HU
95 85338
146repressed
192induced
HbSHUHbS
differentially expressed tags
Pvalor>0,05Fold>5
Results
Total 518CLASSIFICATION HbS HbSHU
Total Tags 45.014 49.814
Unique Tags 15.357 16.506
Identified genes 8.143 (53%) 9.749 (59%)
ORFs 3.422 (22.3%) 2.685 (16.26%)
Non-identified tags 4.053 (24.7%) 4.074 (24.6%)

Conclusions
� First study showing global gene expression induced by HU in bone marrow of Sickle cell anemia patient
�The results strongly suggest that HU produces significant changes in the gene expression pattern of human bone marrow cells in a SCA patient.
� Our data suggest a recruitment of transcriptional machinery and pathways involved in signal transduction during HU treatment. These pathways may have a direct effect on induction of γ globin gene expression at the transcriptional level.
� Conversely, pathway stimulation associated with channel or pore class transporter activity indicates a possible interference with the decrease in the dehydration status of cells, interfering with the rheological properties of the cell.
�The study of genes associated with these pathways and the description of new genes, up or down regulated by HU, may also represent a potential tool to identify new targets for SCA patient therapy.


Sara T.O. SaadValder R. Arruda
Fernando Lopes AlbertoNicola C. ZorzettoAndreia A. Canali
Camila Oresco dos SantosLuciana HollandaSheley Gambero
Carla F.Franco-PenteadoAnderson CunhaAndre Fattori

PRDX-6 HBG
HSPE-1 EGR-1
EGR-1HSPE-1
PRDX-6
Reticulocyte
Leukocyte
A.
B.
W/o HU With HU
W/o HU With HU
W /o HU With HU
W /o HU With HU
W /o HU With HU W /o HU With HU
W /o HU With HU
PRDX-6 HBG
HSPE-1 EGR-1
EGR-1HSPE-1
PRDX-6
Reticulocyte
Leukocyte
A.
B.
W/o HU With HU
W/o HU With HU
W /o HU With HU
W /o HU With HU
W /o HU With HU W /o HU With HU
W /o HU With HU
Expresssions of EGR1, PRDX-6, HSPE1 and HBG
genes in reticulocytes (A) and EGR1, PRDX-6 and
HSPE1 genes in leukocytes (B) from the
preripheral blood of sickle cell patients on (n=4)
and off (n=4) HC therapy.BAC
HBG
EDF1
EGR1
HSPE1
PRDX6
- HU
+ HUBMC
BAC
HBG
EDF1
EGR1
HSPE1
PRDX6
K562
ERH
STAT5A
A.
B.
1:8 1:16 1:4 1:2 1:2 1:4
1:64 1:64 1:16 1:4 1:16 1:8 1:2 1:64Dilution
Dilution
- HU
+ HU
Results
Semi quantitative RT-PCR analysis of the genes in bone marrow cells
(HBMC) from a SCA patient before and after HC treatment (A) and in
K562 cells lines treated and not treated with HC (B). The cDNAs were
quantified and equal amounts of cDNA were used in RT-PCR with 7
different dilutions for both samples. The dilutions that demonstrated a
difference between samples were loaded on 2% agarose gels and
stained with ethidium bromide. The dilutions are indicated at the
bottom of each figure.