David Losa de Areia Afonso - core.ac.uk · morfologia de adesão celular, arquitectura do...
88
Outubro de 2011 Universidade do Minho Escola de Engenharia David Losa de Areia Afonso Fish Scales as Model for Osteogenic Cells Culture UMinho|2011 David Losa de Areia Afonso Fish Scales as Model for Osteogenic Cells Culture
Transcript of David Losa de Areia Afonso - core.ac.uk · morfologia de adesão celular, arquitectura do...

Outubro de 2011
Universidade do MinhoEscola de Engenharia
David Losa de Areia Afonso
Fish Scales as Model for Osteogenic Cells Culture
UM
inho
|201
1 D
avid
Los
a de
Are
ia A
fons
o F
ish
Sca
les
as
Mo
de
l fo
r O
ste
og
en
ic C
ells
Cu
ltu
re

Dissertação de Mestrado Ciclo de Estudos Integrados Conducentes ao Grau de Mestre em Engenharia Biomédica Área de Especialização em Biomateriais, Reabilitação e Biomecânica
Trabalho realizado sob a orientação do Professor Doutor Rui Luís Reis
Outubro de 2011
Universidade do MinhoEscola de Engenharia
David Losa de Areia Afonso
Fish Scales as Model for Osteogenic Cells Culture
DECLARAÇÃO
Nome: David Losa de Areia Afonso
Endereço electrónico: [email protected] Telefone: +351 968 683 153
Número do Bilhete de Identidade: 13392338
Título dissertação: Fish Scales as Model for Osteogenic Cells Culture
Ano de conclusão: 2011
Orientador: Professor Doutor Rui L. Reis
Designação do Mestrado: Ciclo de Estudos Integrados Conducentes ao Grau de Mestre em Engenharia Biomédica
Área de Especialização: Biomateriais, Reabilitação e Biomecânica
Escola de Engenharia
Departamento de Polímeros
É AUTORIZADA A REPRODUÇÃO PARCIAL DESTA TESE/TRABALHO, APENAS PARA EFEITOS DE
INVESTIGAÇÃO, MEDIANTE DECLARAÇÃO ESCRITA DO INTERESSADO, QUE A TAL SE
COMPROMETE.
Guimarães, ____/____/________
Assinatura: ______________________________________________________

i
Acknowledgements
I would like to acknowledge to all that somehow have contributed for the development of
my work along this year and welfare, especially to:
- My parents, José Afonso and Margarida Afonso, for their support and
advisement during my whole life. Also my brothers, other members of my
family (including Elisa), as well as my friends that were crucial in my growth
as a person.
- Professor Rui L. Reis for the opportunity of developing my work in a place of
excellence such as 3B‟s.
- Professor Antonella Motta, who was my tutor and pathfinder, guiding me in
order to achieve our objectives for this Project.
- Dra. Joana Moreira-Silva, Dr Tiago H. Silva and Dra. Alexandra P. Marques
for their help, availability, support and guidance during the time i worked in
3B‟s.
- Professor Claudio Migliaresi for receiving and supporting me during my
ERASMUS period in a laboratory with extremely good conditions to work.
- Professor João Mano for his advisement and for giving me the opportunity to
study abroad.
- Dr. Fábio Zomer Volpato, who was many times my teacher, helping me to
learn how to work and know my way around a laboratory.
- My colleagues / friends of Biomedical Engineering for the best 5 years of my
life where we shared so many stories that I will never forget.

ii
- All my ERASMUS friends for their friendship and entertaining times we spent
together, especially Nuno, who was my partner along my Erasmus journey.
- All the researchers and workers both from the 3B´s and BIOtech, who were
always ready to help me in all kinds of situations, especially: Lara Reys and
Rogério Pirraco.
iii
Abstract
Considering the fish scales composition of hydroxyapatite and type I collagen fibrils, the
organized and regular pattern of the scales, and also their capability to provide a form of armor
plating to protect fish from injury and disease transmission, its potential biomedical application
might be striking. In this work, fish scales of the specie Lates Calcarifer, also known as White
Seabass, were studied, in particular by the assessment of their potential as model for osteogenic
cells culture.
For this purpose the fish scales were collected in a market in Thailand. The scales
characterization, especially concerning their pattern, was done by observations in SEM and
Confocal Microscope. Results showed that the overall scales pattern is formed by parallel
concentric lines and is highly composed of collagen. An in vitro biological analysis of the scales
when used as films to support cell (osteoblasts) proliferation was also done. In order to infer
about the scales patterning potential on the proliferation of cells, fibroin films with the same
pattern of the fish scales were produced, as well as and films without any pattern. To assess cell
viability and cell proliferation, a technique denominated Alamar Blue was performed, being the
cell proliferation higher on the scales, comparing with the fibroin films. Cell adhesion
morphology, cytoskeleton architecture and alignment were evaluated by observations in the SEM
and Confocal Microscope. The osteoblasts presented an orientation according to the fish scales
pattern alignment and acquired an elongated and narrow shape. The DNA quantification and ALP
test allowed drawing conclusions about the cell activity. The cells on the fibroin samples did not
show any ALP activity during the 14 days of proliferation, although the ones on the scales already
showed some activity after 14 days of the cells seeding.
An in vitro biological analysis of the fish scales using human adipose-derived stem cells
(hASCs) was executed, in the presence or absence of osteogenic differentiation factors. The stem
cells behavior was very similar to the osteoblasts, presenting a strait and elongated shape aligned
with the pattern axis.
Results suggest that the fish scales composition and topography are responsible for a
good cell proliferation and induce modifications in cell organization and morphology.

iv
v
Resumo
Tendo em conta a composição das escamas de peixe em hidroxiapatite e fibras de
colagénio do tipo I, o padrão organizado e regular das escamas, e também a sua capacidade de
proporcionar uma forma de blindagem para proteger o peixe de lesões e transmissão de
doenças, a sua aplicação biomédica poderá ser espantosa. Neste trabalho foram estudadas
escamas de peixe da espécie Lates Calcarifer, referente ao Robalo Asiático, em particular a
avaliação do seu potencial como modelos para cultura de células osteogénicas.
Para este efeito, as escamas de peixe foram trazidas de um mercado na Tailândia. A
caracterização das escamas, tendo predominantemente em conta o seu padrão, foi feita através
de observações no SEM e Microscópio Confocal. Os resultados mostraram que o padrão global
das escamas é constituído por linhas concêntricas paralelas e altamente composto por
colagénio. Uma análise biológica in vitro das escamas quando usadas como scaffolds para
suporte de proliferação celular (osteoblastos) também foi realizada. A fim de inferir acerca do
potencial das escamas na proliferação dessas células foram também produzidos filmes de
fibroína com o mesmo padrão das escamas e filmes sem qualquer padrão. Para avaliar a
viabilidade e proliferação celular foi realizada uma técnica denominada “Alamar Blue”, tendo
sido a proliferação celular maior nas escamas comparando com os filmes de fibroína. A
morfologia de adesão celular, arquitectura do citoesqueleto e alinhamento foram avaliados por
observações no SEM e Microscópio Confocal. Os osteoblastos apresentaram uma orientação de
acordo com o alinhamento do padrão das escamas e adquiriram uma forma alongada e estreita.
A quantificação de DNA e teste de ALP permitiram tirar conclusões acerca da actividade celular.
As células nas amostras de fibroína não mostraram qualquer actividade celular durante os 14
dias de proliferação, contudo nas escamas mostraram já alguma actividade 14 dias depois do
início da cultura das células.
Uma nova análise in vitro das escamas foi feita com células estaminais do tecido
adiposo, na presença e ausência de factores de diferenciação osteogénica. O comportamento
das células estaminais foi semelhante ao dos osteoblastos, apresentando uma forma estreita e
alongada e alinhadas com o eixo do padrão.
Os resultados sugerem que a composição e topografia das escamas são responsáveis
por boa proliferação celular e por induzirem modificações na morfologia e organização celular.

vi
vii
Table of contents
Acknowledgements ................................................................................................ i
Abstract ............................................................................................................... iii
Resumo ................................................................................................................ v
Table of contents ................................................................................................ vii
Abbreviations ....................................................................................................... xi
List of Figures ..................................................................................................... xiii
List of Tables ...................................................................................................... xv
General Introduction ............................................................................ 1
1| Motivation and outline ...................................................................................... 3
2| Bone morphology, problems and therapeutic approaches ................................. 4
3| Fish Scales: Morphology and Potential .............................................................. 6
4| Scaffolds Preparation with Natural Polymeric Materials ................................... 9
4.1. Fibroin ............................................................................................................................ 9
4.2. Collagen ....................................................................................................................... 10
5| Cell Types ....................................................................................................... 11
5.1. Osteoblasts ................................................................................................................... 11
5.2. Adipose-derived Stem Cells ........................................................................................... 12
6| Concluding Remarks ....................................................................................... 12
References ............................................................................................................ 14
Materials and Methods ...................................................................... 19
1| Fish Scales Preparation .................................................................................. 21
2| Fish Scales Characterization ........................................................................... 21
viii
2.1. Morphology .................................................................................................................. 21
2.2. Collagen Imaging .......................................................................................................... 21
3| Fibroin Films ................................................................................................... 22
3.1. Fibroin Production ........................................................................................................ 22
3.2. Construction of fibroin samples with the fish scales pattern (F1) .................................... 22
3.3. Construction of the fibroin samples without pattern (F2) ................................................ 24
4| Collagen films ................................................................................................. 25
4.1. Extraction of collagen from fish scales ........................................................................... 25
4.2. Construction of shark collagen films with scales patterning ............................................ 26
5| In vitro Biological tests ................................................................................... 27
5.1. Cells culture and seeding .............................................................................................. 27
5.2. AlamarBlue Assay ......................................................................................................... 28
5.3. Confocal Laser Microscope (CLM) Analysis .................................................................... 29
5.4. Scanning Electron Microscope (SEM) Analysis ............................................................... 30
5.5. Alkaline Phosphatase (ALP) activity quantification .......................................................... 30
5.6. Macro BCA Protein Assay.............................................................................................. 31
5.7. DNA measurement ....................................................................................................... 32
5.8. Fluorescence Microscopy Analysis ................................................................................. 32
References ............................................................................................................ 33
Fish Scales as Model for Osteogenic Cells Culture ............................. 35
Abstract ................................................................................................................. 37
1| Introduction .................................................................................................... 38
2| Materials and Methods ................................................................................... 41
2.1. Fish scales preparation ................................................................................................. 41
2.2. Fish scales characterization .......................................................................................... 42
2.2.1. Morphology ..................................................................................................................................................... 42
2.2.2. Collagen Imaging .............................................................................................................................................. 42
2.3. Fibroin films ................................................................................................................. 42
2.3.1. Construction of fibroin films with the fish scales patterning (F1) .................................................................... 43
ix
2.3.2. Construction of fibroin films without pattern (F2) .......................................................................................... 43
2.4. In vitro Biological tests .................................................................................................. 44
2.4.1. Cells culture and seeding ................................................................................................................................. 44
2.4.2. AlamarBlue Assay ............................................................................................................................................ 44
2.4.3. Confocal Laser Microscope (CLM) analysis ...................................................................................................... 45
2.4.4. Scanning Electron Microscope (SEM) analysis................................................................................................. 45
2.4.5. Alkaline Phosphatase (ALP) activity quantification ......................................................................................... 46
2.4.6. DNA measurement .......................................................................................................................................... 46
2.4.7. Fluorescence Microscopy Analysis .................................................................................................................. 46
3| Results and Discussion .................................................................................... 47
3.1. Fish scales topography .................................................................................................. 47
3.2. Osteoblast Behavior ...................................................................................................... 48
3.3. Stem cells (hASCs) Behavior ......................................................................................... 53
4| Conclusion ...................................................................................................... 55
References ............................................................................................................ 57
General Discussion and Future Work .................................................. 61
General Discussion and Future Work ..................................................................... 63
References ............................................................................................................ 65
Appendix…………………………………………………………………………………………………………………67

x
xi
Abbreviations
A
ALP - Alkaline Phosphatase
B
BSE – Bovine Spongiform Encephalopathy
BCA - Bicinchoninic Acid
BMSC – Bone Mesenchymal Stem Cells
D
DSC - Differential Scanning Calorimetry
DNA – Deoxyribonucleic Acid
DAPI - 4'-6-Diamidino-2-phenylindole
E
EDTA - Ethylenediamine tetraacetic acid
ECM – Extracellular Matrix
F
FMD - Foot and Mouth Disease
H
hASCs – Human Adipose derived Stem Cells
HAp - Hidroxyapatite
M
MDSC - Modulate Differential Scanning
Calorimetry
MEM – Minimum Essential Medium
P
PEG – Polyethylene Glycol
PDLLA – Polylactic Acid
PBS – Phosphate Buffered Saline
S
SEM – Scanning Electron Microscope
T
TSE - Transmissible Spongiform
Encephalopathy

xii

xiii
List of Figures
Chapter I. General Introduction
Figure 1.1 - Anatomy and microanatomy of bone (adapted from Ralston, Stuart H. Structure and
metabolism of bone. Medicine. 2005).
Figure 1.2 - The hierarchical structure of a fish scale: a) fish; b) staggered multiple scales; c) an
individual scale; d) cross-section of a scale; e) cross-ply collagen structure; f) collagen fibrils
(adapted from Zhu, D., et al. Structure and Mechanical Performance of a „„Modern‟‟ Fish Scale.
Advanced Engineering Materials. 2011).
Chapter II. Materials and Methods
Figure 2.1 - Plate where the scales were glued and covered with silicon to form the molds with
scales patterning.
Figure 2.2 - a), b) - Silicon mold with the negative of the fish scales pattern in the bottom of each
well.
Figure 2.3 - a), b), c) - Pattern of the negatives existent in the bottom of each well of the silicon
mold.
Figure 2.4 - Fibroin samples with a pattern similar to the fish scales.
Figure 2.5 - a), b), c) - Fibroin sample pattern observed in the Optical Microscope.
Figure 2.6 - Fibroin sample without any pattern.
Chapter III. Fish Scales as Model for Osteogenic Cells Culture
Figure 3.1 - Fish scales from group 1 observed in the SEM.
Figure 3.2 - Fish scale observed in the Confocal Microscope with Direct Red 80 staining for
collagen identification: a) center, b) side and c) top areas of the scale.
Figure 3.3 - Percentage of reduced Alamar Blue for each group in the different days of control.
Values are mean±STDEV, bars with like characters are not significantly different (P>0.05).
Abbreviations: G1 – untreated fish scales; G2 – fish scales after a treatment for unnecessary
proteins removal from the surface; G3 – fish scales after demineralization and collagen

xiv
extraction; F1 – fibroin films with the fish scales surface pattern; F2 – fibroin films without
pattern; Cells – controls with cells seeded in the wells-plate.
Figure 3.4 - Quantity of pNP enzyme produced per DNA µg per minute for each group of samples
on different days of control. Abbreviations: G1 – untreated fish scales; G2 – fish scales after a
treatment for unnecessary proteins removal from the surface; G3 – fish scales after
demineralization and collagen extraction; F1 – fibroin films with the fish scales surface pattern;
F2 – fibroin films without pattern.
Figure 3.5 - Results of the Confocal Microscope observation after stainings with DAPI and
Phalloidin Rhodamine. The subscripts indicate the type of sample and the time period after the
cellular seeding. The scale bar is 100 µm.
Figure 3.6 - Results of the SEM observation. The subscripts indicate the type of sample and the
time period after the cell seeding.
Figure 3.7 – Samples of F2 after: a) 1 day; b) 7 days. Along time cells spread without any
specific orientation.
Figure 3.8 - Results of the observation in a Reflected/Transmitted Light Microscope after
stainings with DAPI and Phalloidin Rhodamine. The subscripts indicate the type of culture
medium used and the time period after the cellular seeding. The scale bar is 50 µm.

xv
List of Tables
Chapter II. Materials and Methods
Table 1.1 - Solutions execution for the nine test tubes in order to build the standard curve for ALP
test (osteoblasts).
Table 2.2 - Solutions execution for the nine test tubes in order to build the standard curve for ALP
test (stem cells).
Table 2.3 - Solutions execution for the nine test tubes in order to build the standard curve for
BCA assay.

xvi

Chapter I. General Introduction
1
CHAPTER I.
GENERAL INTRODUCTION

Chapter I. General Introduction
2

Chapter I. General Introduction
3
1| Motivation and outline
“Biomimetics” is a recent definition but in fact the humankind was inspired by Nature
since the beginning of civilization. Creatures and plants possess tools and skills that are attractive
to mimic. Mimicking nature cannot be a goal in itself, once this would hardly represent progress.
The goal is to learn its principles, extract the general physic-chemical processes of the
object/principle to be mimicked, and thereafter transfer it to a synthetic process or new material
[1]. Fish scales study is relevant in order to extract some principles for appliance in different
areas, being the biomedicine a potential environment for this praxis considering the fish scales
composition, structure and functions.
There are many bone diseases that can affect and condition at many levels people‟s
lives. The traditional existent treatments are not, in many cases, an effective response for these
problems, mainly because the bone ability to recover and regenerate is limited. Therefore the
search for alternative and more complex methods for the treatment of bone diseases is a field
where many developments can be achieved as a response to improve many people‟s life quality.
Bone tissue engineering is a developing field, being an attractive approach with great potential for
repairing bone defects since it is based in the body‟s natural biological response combined with
engineering principles.
Tissue engineering is a rich and challenging area to be explored. To achieve great
progress many small/big steps still have to be undertaken, and the testing of many hypotheses
to be made. The fish scales study fits in this context, with great potential, as it will be mentioned
later.
The aims of this project were the characterization of fish scales of Lates Calcarifer more
concerning their pattern, and the study of the scales as scaffolds with the assessment of the cells
behavior such as proliferation, adhesion, alignment and activity. The cells used for this study
were both osteoblasts and, in a later phase, human adipose derived stem cells (hASCs). A first
study using osteoblasts involved the utilization of 3 groups of fish scales, differing in the
treatments they were submitted to, and fibroin films with the same surface pattern found in the
scales, following a biomimetic approach, and without any pattern. In the study of the role of the
fish scales pattern over hASCs, collagen films with the scales pattern were also prepared, and the
cells behavior in the presence and absence of osteogenic differentiation factors were compared.

Chapter I. General Introduction
4
2| Bone morphology, problems and therapeutic approaches
Bone can be regarded as a composite material composed by cells, organic and inorganic
matrices, and an extracellular matrix (ECM). Bone cells can be further subdivided in osteoblasts
(the bone forming cells), osteocytes (the main cells of fully formed bone), and osteoclasts (the
multinucleated giant cells responsible for bone resorption). The organic matrix (approximately
35% of the dry weight of bone) is mainly constituted of type I collagen (approximately 90%).
Collagen is organized in fibers in which mineralized tissue is deposited [2] [3]. The inorganic
matrix (approximately 60%-70% of the dry weight of bone) provides minerals for homeostasis,
such as Ca, O, Na and Mg, and it consists of hydroxyapatite (HAp). This family of materials also
contains other members, like dentin (material that constitutes the inner layers of teeth) and
cementum (thin layer that binds the roots of teeth to the jaw) [4] [5] [6]. The ECM is composed
by non-collagenous proteins, which are responsible for providing the linking structure and
function of cells with soluble signaling factors, thus affecting cell anchorage, proliferation and
expression [7] [8] [9].
Typically, the adult skeleton contains 80% cortical (compact) bone and 20% trabecular
bone. Cortical bone is hard and dense and makes up the shaft surrounding the marrow cavity of
long bones as well as the outer shell of some other bones. Cortical bone is only 10% porous,
allowing room for only a small number of cells and blood vessels. The structural unit of cortical
bone is a cylindrically shaped osteon, which is composed of concentric layers of bone called
lamellae. Blood vessels run through Haversian canals located at the center of each osteon while
nutrient diffusion is further aided by canaliculi, or microscale canals within bone. Osteons are
aligned in the longitudinal direction of bone and, therefore, cortical bone is anisotropic [2] [3] [4]
[5] [6] [7].
Bone tissue is responsible for assuring functional properties, such as mechanical support
and protection of the organs, and a site of attachment for muscles used in locomotion, as well as
physiological activities, such as responsiveness to metabolic needs [4] [10]. It also acts as a
deposit for phosphate and calcium in the preservation of normal mineral homeostasis [6].

Chapter I. General Introduction
5
Figure 1,1 - Anatomy and microanatomy of bone (adapted from Ralston, Stuart H. Structure and metabolism of bone. Medicine. 2005)
Bone is continuously remodeled during the lifespan of most vertebrates, including man.
Bone remodeling is the result of the balance between the activities of two different cell
populations, the osteoclasts and the osteoblasts that are responsible for bone resorption and
deposition, respectively. Bone lesions and defects occur in an ample variety of clinical situations,
and their reconstruction to provide mechanical and functional integrity is an essential step in the
patient‟s rehabilitation. The potential of bone to regenerate spontaneously many bone lesions,
such as fractures, allow the healing with conventional conservative therapy or surgery.
Nevertheless, bone diseases are many and quite different. Current available options for treatment
of orthopedic diseases include grafts and synthetic materials, with their respective advantages
and drawbacks. In the treatment of some bone diseases, biomaterials play an important role and
constitute an outstanding improvement in the quality of life of a large amount of patients, who
would otherwise be confined to their most basic activities and limited to a painful life. Such
diseases include skeletal loss due to trauma or removal of tumors, fractures and joint
malfunctioning, as well as a wide spectrum of specific bone diseases [5] [7] [11] [12] .
The deployment of bone tissue engineering has made it an attractive forthcoming with
great potential for repairing bone defects resulted from trauma, surgical resection and congenital
deformity corrections. Bone tissue engineering provides a promising alternative strategy of
healing severe bone injuries by using the body‟s natural biological response to tissue damage in

Chapter I. General Introduction
6
conjunction with engineering principles. Osteogenic cells, biomaterial scaffolds, and growth
factors are the ground base of the many bone tissue engineering strategies applied to achieve
repair and restoration of damaged tissue. An ideal biomaterial scaffold will offer mechanical
support in an injured site and simultaneously deliver growth factors and cells into the defect to
encourage tissue growth. Besides that, this biomaterial should degrade in a controlled manner
without causing a significant inflammatory response in order to restore damaged bone
structurally and functionally [7] [10] [13] [14] [15] [16].
3| Fish Scales: Morphology and Potential
This study focuses on the fish scales of a species denominated Lates Calcarifer, which is
one of the nine Lates species of the family Centropomidae [17]. The normal maximum size of
these fish is about 120 cm but they can grow up to 180 cm [18].
Like many other structural biological materials, the fish scales structure displays a
characteristic hierarchical structure, built over several distinct length scales (Figure 1.2) [19].
Figure 1.2 - The hierarchical structure of a fish scale: a) fish; b) staggered multiple scales; c) an individual scale; d) cross-section of a scale; e) cross-ply collagen structure; f) collagen fibrils (adapted from Zhu, D., et al.
Structure and Mechanical Performance of a ‘‘Modern’’ Fish Scale. Advanced Engineering Materials. 2011)

Chapter I. General Introduction
7
At the macroscopic level, the scales are staggered together and cover most of the body
of the fish, providing a form of armor plating to protect the fish from injury and disease
transmission, and they also assist in swimming by reducing water friction and resistance [20].
The fish scales are composed of extracellular matrix, mainly type I collagen fibers and
calcium-deficient hydroxyapatite (HAp), which together form a highly ordered three-dimensional
structure. Each scale consists of two distinct regions: an osseous layer and a fibrillary plate
mainly composed of collagen [21]. Then, fish scales are composed by HAp and type I collagen
fibrils with a plywood structure of aligned fibril sheets. This fibrils alignment is similar to those of
bones, tendons and corneas in the human body [22] [23]. Zhu et al. (2011) [19] studied the
mechanical properties of fish scales and concluded that these are high performance natural
protective systems considering the importance of the structure and architecture of the scales in
“amplifying” the properties of their components.
Although the main sources of type I collagen are bovine or porcine dermis, outbreak of
different transmissible diseases in pigs and cattle, restrict the use of collagens and allied
products from these sources [24] [25] [26]. The collagen from the fish scales is unlikely to be
associated with infections such as BSE, TSE and FMD [27] [28]. Collagen isolated from fish
scales is already being studied for biomedical and pharmaceutical applications owing to its cell
attachment capabilities, excellent biocompatibility, biodegradability and weak antigenicity [29].
Therefore, type I collagen derived from fish scales attracted much interest as an alternative
collagen source for artificial substitutes and several authors already extracted collagen from fish
scales and characterized it. Nagai et al. (2004) [25] reported that fish scale collagens were
heterotrimers with chain composition of (α1)2 and α2 and the denaturation temperature was
lower than land animal collagen. Pati et al. (2010) [21] isolated collagen from Rohu and Catla
and this collagen had a denaturation temperature of 36.5ºC, which is promising as an advantage
for biomedical application due to its closeness to mammalian collagen.
Fish scales from different species present variations in size, shape and arrangement. The
general classification includes: placoid, cosmoid, ganoid, and elasmoid (cycloid and ctenoid).
These elasmoid scales are more evolved scales when compared with the other types being
thinner and more flexible, which improved the swimming capability, present greater
hydrodynamic properties and a more resistant protective layer [19]. In this study we have
investigated scales of the elasmoid cycloid type, which are a bit like tree trunks, because, as they
age, they form concentric lines, which provide to scientists a way of determining the age of a fish.

Chapter I. General Introduction
8
The scales pattern allows also the establishment of a correspondence to events occurred in the
life of a fish [30]. A cycloid scale is formed of a rigid surface layer consisting of calcium-based
salts and a fibrous inner layer mainly made of collagen. Two different calcifying mechanisms
function for a growing scale in the fibrillary plate and the osseous layer. Calcification in the
osseous layer happens by nucleation of crystals with generation of larger patches, and in the
fibrillary plate by uniform growth of crystals along the calcifying front [21].
Cells in tissues are arranged in distinct patterns; the orientation and the position of the
cells with respect to each other are established by the tissue type. The study of the ability to
control the placement of cells in an organized micro-pattern, such like the existent in the fish
scales, on a substrate has become increasingly important for tissue engineering applications,
which require that cells can be specifically placed to generate organized structures, such as a
neural network for example [31] [32]. Also the ability to constrain the spreading to a specific cell-
surface contact area has been shown to dramatically affect cellular development. Mechanical
compliance of the cell-adhering substrates can also substantially affect the cells response and
development [33]. Cells were reported to elongate in the direction of the micrometer-size grooves
existent in the pattern and migrate as guided by these grooves, being this phenomenon
denominated as contact guidance [34]. The disintegration and formation of fibrous cellular
components is also influenced by surface topography. There is evidence that cell shape can
control cell growth, gene expression, secretion of proteinases and ECM metabolism. Micro-
patterned tissue engineered constructions are expected to better preserve cell morphology,
differentiation and functionality for long periods of time. The micro-topography provides
directional growth for cells and also can create tissue architecture at cellular and subcellular level
in a reproducible manner [35].
Fish scales study is important in order to extract some principles for application in other
fields, being the biomedicine a potential field for this application considering the fish scales
composition, structure and functions. Another attractive reason to study the fish scales is the
abundance and prosperity of its source and the fact that they are directed to low-added value
ends. Marine capture fisheries mean over 50% of total world fish production and more than 70%
of this production has been utilized for processing. As a result, every year considerable amounts
of total catch are discarded as processing leftovers, consisting more than 30% of this waste of
skin, scale and bone, which are rich in collagen and have received increasing attention as
collagen sources. Recent estimates revealed that discards from the world‟s fisheries exceed 20
Chapter I. General Introduction
9
million tons, meaning 25% of the total production of marine capture fisheries. Therefore, there is
a great potential in marine bioprocess industry to convert and utilize more of these products as
valuable ones [36] [37] [38].
4| Scaffolds Preparation with Natural Polymeric Materials
The main strategy of bone tissue engineering implicates the utilization of artificial
extracellular matrixes as scaffolds in combination with specific types of cells under stimulation of
growth factors in order to restore damaged bone both structurally and functionally.
Biocompatibility and mechanical properties with suitable biodegradability are mandatory
characteristics to be incorporated in these scaffolds. Matrices occurring naturally have
advantages because of their relevant biocompatibility properties [7] [10] [13] [14] [39]. In this
study fibroin and collagen films were prepared to be used as cell proliferation supports.
4.1. Fibroin
Silks are fibrous proteins commonly produced by insects and spiders. They exhibit a
unique and useful conjunction of properties such as being degradable and lightweight with
excellent mechanical and thermal properties. In nature, silks are used, for example, as materials
for web construction and prey capture (spider webs), and reproduction enclosures (cocoons)
where the silkworms are included. These features are also related to the current use of silks as
sutures, nevertheless they are being gradually replaced by synthetic polymers. Silk consists of
two different proteins: fibroin and sericin. Fibroin is the protein responsible for the filaments of
silkworm silk and it can be regenerated in various ways depending on the application. Recently,
researchers have investigated silk proteins, mainly silk fibroin, as one potential candidate
material for biomedical applications, because it has several distinctive biological properties such
as: significant biocompatibility, good oxygen and water vapor permeability, biodegradability,
praiseworthy mechanical strength in the wet state, resistance against enzymatic cleavage, drug
permeability and minimal inflammatory reaction [40] [41]. Beyond their traditional use as
sutures, silk fibroin has been exploited as a biomaterial for cell culture and tissue engineering in
vitro and in vivo since the mid-90s. In early studies, silk films obtained from native silkworm
fibroin collected from glands of Bombyx mori domestic silkworms and Antheraea pernyi wild
Chapter I. General Introduction
10
silkworms were found to support the attachment and proliferation of fibroblasts. Later reports
showed that regenerated silk films prepared by dissolution of silkworm cocoon fibers in 9–9.5 M
LiBr supported the attachment and growth of human and animal cell lines. These studies
provided clues to the use of regenerated silk fibroin as a scaffold or matrix biomaterial for cell
culture and tissue engineering [40] [42] [43].
Numerous studies have already explored regenerated silk fibroin-based biomaterials in
various forms, including films, membranes, mats, nets, hydrogels, and porous sponges for
biomedical applications. The in vivo behavior of biomaterials prepared from silk fibroin solutions
has not been completely demonstrated, despite the fact that the biocompatibility and degradation
of silk sutures, which are prepared from native silk fibers, have been well established. Previous
studies showed that two-dimensional silk fibroin films have good biocompatibility. Recent
progress in processing techniques has yielded three-dimensional porous silk fibroin scaffolds with
control of morphological and structural features [40] [42] [43].
4.2. Collagen
Collagen is the most abundant insoluble fibrous protein in the extracellular matrix and in
the connective tissue. In fact, it is the major protein in vertebrates and in the animal kingdom,
and constitutes about 25% of vertebrate total proteins and approximately 30% of all protein in the
human body. There are at least 16 types of collagen, but 80-90% of the collagen in the human
body consists of types I, II, and III. These collagen molecules pack together forming long
thin fibrils with similar structure. In contrast, type IV forms a two-dimensional reticulum. Other
types of collagen can associate with fibril-type collagens, link between each other or link with
other matrix components. Firstly it was thought that collagens were secreted by fibroblasts in
connective tissue, but is now known that numerous epithelial cells produce certain types of
collagen. The various collagens existent and the structures they form have the same purpose: to
help tissues resist stretching [44].
The collagen fundamental structural unit is a long (300 nm), thin (1.5 nm of diameter)
protein that consists of three coiled subunits: two α1 chains and one α2. Each chain consists
precisely of 1050 amino acids wounded around one another in a typical right-handed triple helix
[45] [46].

Chapter I. General Introduction
11
Type I collagen fibrils have a immense tensile strength, which means that such fibrils can
be highly stretched without being broken. These fibrils, approximately 50 nm in diameter and
several micrometers long, are packed side-by-side in parallel bundles, denominated collagen
fibers, which can be found for example in tendons, where they connect muscles with bones and
have to withstand high tension [44] [47].
In tissue engineering, collagen is being used for development of scaffolds either alone or
in combination with other biomaterials for skin replacement, as artificial blood vessel, heart valve,
bone graft, cartilage and ligament replacement among others. The utilization of collagen in
pharmaceutical applications includes production of wound dressings, vitreous implants and as
carriers for drug delivery. The applications of collagen in drug delivery systems are quite diverse
such as collagen shields in ophthalmology, sponges for burns/wounds, mini-pellets and tablets
for protein delivery, gel formulation in combination with liposomes for sustained drug delivery, as
controlling material for transdermal delivery, and nanoparticles for gene delivery. In addition,
collagen is used as surgical sutures and as haemostatic agent [29] [48] [49] .
There are many attractive characteristics that make the collagen type I a popular ECM of
connective tissue. Some examples are: biocompatible, osteocompatible, fibrous, adhesive,
cohesive, nonfriable, suturable, highly porous, can be combined with other materials, etc. The
main limitation is the inexistence of inherent rigidity [39] [50]. To optimize this mechanical
property and modify the biodegrading rate, an effective method commonly used is the cross-
linking of the collagen or the addition of ceramics, such as hydroxyapatite [51].
5| Cell Types
As previously referred, in bone tissue engineering, cells play a fundamental role for the
bone regeneration. For that reason, the utilization of cells with the ability and potential for
osteogenesis is mandatory.
5.1. Osteoblasts
Osteoblasts are cells of mesenchymal origin responsible for synthesis and mineralization
of bone during both bone formation and bone remodeling. They form a closely packed sheet on
the bone‟s surface, from which cellular processes extend through the developing bone. The
Chapter I. General Introduction
12
goals for scaffolds in bone tissue engineering include suitable chemistry, morphology and
structure in order to promote cell adhesion for osteoblasts, their further migration, and synthesis
of extracellular matrix and mineralization [52] [53] [3].
The osteoblasts form organic, non-mineralized bone matrix and are involved in complex
interactions with a variety of factors, mediators and cell types [54]. Mature osteoblasts are highly
polarized, and present a prominent Golgi apparatus which is typical of highly secretory cells. The
main secretory product of osteoblasts is type I collagen [55].
5.2. Adipose-derived Stem Cells
Tissue engineering and regenerative medicine are multidisciplinary sciences evolved in
parallel with recent biotechnological advances. It combines biomaterials, growth factors, and
stem cells to repair failing organs. Stem cells are characterized by their capability to self-renew
and their ability to differentiate along multiple lineage pathways. Among the several types, human
subcutaneous adipose tissue emerges as a source of adult or somatic stem cells [56].
Due to the increased incidence of obesity all over the world, subcutaneous adipose tissue
is abundant and readily accessible. For example, approximately 400,000 liposuction surgeries
are performed in the United States of America every year. These procedures can yield from
100mL to 3L of lipoaspirate tissue. This resultant material is routinely discarded [57].
Recent developments in the field of stem cells suggested that hASCs can be induced into
adipogenic, osteogenic, chondrogenic, and myogenic lineages under appropriate conditions.
hASCs are easy to obtain, have relatively lower donor site morbidity and a higher yield at harvest,
and can expand more rapidly in vitro compared with BMSCs for example, which are now
commonly used as seed cells for bone repair and regeneration. In addition, hASCs have
multipotency which is independent of serum source and quality. Thus, hASCs might be a novel
and very promising alternative cell source for bone tissue engineering [13].
6| Concluding Remarks
Bone diseases are variable and can affect people in different levels. The existent
treatments are, in many cases, not enough for good recovery of the patient. There is still much

Chapter I. General Introduction
13
room for development of more effective treatment strategies and bone tissue engineering can
provide promising alternatives for more efficient treatments.
Bone tissue engineering has a long path to be explored and the definition of the best
strategies to achieve better results is still not clear. Therefore, attempts to find different
alternatives are important, being the study of the effect of fish scales pattern on osteoblasts and
stem cells the testing of hypothesis that can extend the knowledge of cells behavior when
submitted to different environments.
Fish scales present interesting characteristics attractive for their study as cellular
supports, such as being highly composed of collagen and hidroxyapatite and presenting a very
organized structure.

Chapter I. General Introduction
14
References
1. Antonietti, Markus and Fratzl, Peter. Biomimetic Principles in Polymer and Material
Science. Macromolecular Chemistry and Physics. 211, 2010.
2. Weiner, S. and Wagner, H. D. The Material Bone: Structure--Mechanical Function
Relations. Annual Review of Materials Science. 1998, Vol. 28.
3. Toai, T., et al. In vitro culture and differentiation of osteoblasts from human umbilical cord
blood. Cell Tissue Bank. 2010, Vol. 11.
4. Rho, J., Spearing, L. and Zioupos, P. Mechanical properties and the hierarchical structure
of bone. Medical Engineering & Physics. 1998, Vol. 20.
5. Wang, X., et al. The role of collagen in determining bone mechanical properties. Journal of
Orthopaedic Research. 2001, Vol. 19.
6. Ralston, Stuart H. Structure and metabolism of bone. Medicine. 2005.
7. Mistry, A. and Mikos, A. Tissue Engineering Strategies for Bone Regeneration. Chemistry
and Materials Science. 2005, Vol. 94.
8. Schaeren, S., et al. Effect of bone sialoprotein coating of ceramic and synthetic polymer
materials on in vitro osteogenic cell differentiation and in vivo bone formation. Wiley InterScience.
2009.
9. Chavassieux, P., Seeman, E. and Delmas, P. Insights into Material and Structural Basis
of Bone Fragility from Diseases Associated with Fractures: How Determinants of the
Biomechanical Properties of Bone Are Compromised by Disease. Endocrine Reviews. 2007, Vol.
28.
10. Peel, N. Bone remodelling and disorders of bone metabolism. Surgery. 27, 2008.
11. Patel, Z., et al. Dual delivery of an angiogenic and an osteogenic growth factor for bone
regeneration in a critical size defect model. Bone. 2008, Vol. 43.
12. MacLean, C., et al. Systematic Review: Comparative Effectiveness of Treatments to
Prevent Fractures in Men and Women with Low Bone Density or Osteoporosis. Annals of Internal
Medicine. 2008, Vol. 148.
13. Qihai, Liu, et al. A comparative study of proliferation and osteogenic differentiation of
adipose-derived stem cells on akermanite and b-TCP ceramics. Biomaterials. 29, 2008.
14. Finkemeier, Cristopher G. Bone-Grafting and Bone-Graft Substitutes. The Journal of Bone
and Joint Surgery. 2002.
Chapter I. General Introduction
15
15. Cancedda, R., et al. Tissue engineering and cell therapy of cartilage and bone. Matrix
Biology. 2003, Vol. 22.
16. Schindeler, A., et al. Bone remodeling during fracture repair: The cellular picture.
Seminars in Cell & Developmental Biology. 2008, Vol. 19.
17. Lin, G., et al. The Complete Mitochondrial Genome Sequence and Characterization of
Single-Nucleotide Polymorphisms in the Control Region of the Asian Seabass (Lates calcarifer).
Marine Biotechnology. 2005, Vol. 8.
18. Pusey, Brad, Kennard, Mark J. and Arthington, Angela H. Freshwater fishes of north-
eastern Australia. Australia : Csiro Publishing, 2004.
19. Zhu, D., et al. Structure and Mechanical Performance of a „„Modern‟‟ Fish Scale. Advanced
Engineering Materials. 2011.
20. Bone, Quentin and Moore, Richard H. Biology of Fishes. s.l. : Taylor & Francis Group,
2008.
21. Pati, Falguni, Adhikari, Basudam and Dhara, Santanu. Isolation and characterization
of fish scale collagen of higher thermal stability. Bioresource Technology. 101, 2010.
22. Chen, S., et al. Microstructures and rheological properties of tilapia fish-scale collagen
hydrogels with aligned fibrils fabricated under magnetic fields. Acta Biomaterialia. 2010.
23. Chen, Song, et al. In vitro formation and thermal transition of novel hybrid fibrils from type
I fish scale collagen and type I porcine collagen. Science and Technology of Advanced Materials.
2010.
24. Peng, Yong Y., et al. Evaluation of the immunogenicity and cell compatibility of avian
collagen for biomedical applications. Wiley Interscience. 2009.
25. Nagai, Takeshi, Izumi, Masami and Ishii, Masahide. Fish scale collagen. Preparation
and partial characterization. International Journal of Food Science and Technology. 39, 2004.
26. Duan, R., et al. Properties of collagen from skin, scale and bone of carp (Cyprinus carpio).
Food Chemistry. 2009, Vol. 112.
27. Bama, P., et al. Extraction of Collagen from Cat Fis (Tachysurus Maculatus) by Pepsin
Digestion and Preparation and Characterization of Collagen Chitosan Sheet. International Journal
of Pharmacy and Pharmaceutical Sciences. 2010, Vol. 2, 4.
28. Liu, H., Li, D. and Guo, S. Studies on collagen from the skin of channel catfish (Ictalurus
punctaus). Food Chemistry. 2007, Vol. 101.

Chapter I. General Introduction
16
29. Fish Collagen: A Potential Material for Biomedical. Pati, Falguni, Dhara, Santanu and
Adhikari, Basudam. Kharagpur : s.n., 2010. Proceedings of the 2010 IEEE Students'
Technology Symposium.
30. Discrete model of fish scale incremental pattern: a formalization of the 2D anisotropic
structure. Journal of Marine Science. 61, 2004.
31. Chen, Christopher, et al. Micropatterned Surfaces for Control of Cell Shape, Position, and
Function. Biotechnology. 1998, Vol. 14.
32. Curtis, Adam and Wilkinson, Chris. Topographical control of cells. Biomaterials. 1997,
Vol. 18.
33. Falconnet, Didier, et al. Surface engineering approaches to micropattern surfaces for cell-
based assays. Biomaterials. 2006, Vol. 27.
34. Alves, Natália M., et al. Controlling Cell Behavior Through the Design of Polymer
Surfaces. Small. 6, 2010, Vol. 20, Polymer Surfaces, pp. 2208-2220.
35. Ber, S., Kose, G. T. and Hasirci, V. Bone tissue engineering on patterned collagen films:
an in vitro study. Biomaterials. 2005, Vol. 26.
36. Kim, Se-Kwon and Mendis, Eresha. Bioactive compounds from marine processing
byproducts – A review. Food Research International. 2005, Vol. 39.
37. Nagai, T. and Suzuki, N. Isolation of collagen from fish waste material - skin, bone and
fins. Food Chemistry. 1999, Vol. 68.
38. Arvanitoyannis, I. and Kassaveti, A. Fish industry waste: treatments, environmental
impacts, current and potential uses. International Journal of Food Science and Technology.
2008, Vol. 43.
39. Glowacki, Julie and Mizuno, Shuichi. Collagen Scaffolds for Tissue Engineering.
Biopolymers. 2007, Vol. 89.
40. Min, Byung-Moo, et al. Electrospinning of silk fibroin nanofibers and its effect on the
adhesion and spreading of normal human keratinocytes and fibroblasts in vitro. Biomaterials.
2004, Vol. 25.
41. Minoura, Norihiko, et al. Attachment and growth of fibrolast cells on silk fibroin.
Biochemical and Biophysical Research Communications. 1995, Vol. 208.
42. Wang, Yongzhong, et al. In vivo degradation of three-dimensional silk fibroin scaffolds.
Biomaterials. 2008, Vol. 29.

Chapter I. General Introduction
17
43. Ung-Jin, Kim, et al. Three-dimensional aqueous-derived biomaterial scaffolds from silk
fibroin. Biomaterials. 2005, Vol. 26.
44. Lodish, H., et al. Molecular Cell Biology. New York : W. H. Freeman and Company, 2000.
45. Brinckman, J., Notbohm, H. and Muller, O. K. Collagen: primer in structure,
processing, and assembly. New York : Springer, 2005.
46. Kirkwood, John Edward. Liquid crystalline collagen: Matrices for oriented cell growth.
s.l. : ProQuest LLC, 2008.
47. Fratzl, Peter. Collagen: structure and mechanics. Germany : Springer, 2008.
48. Ogawa, Masahiro, et al. Biochemical properties of bone and scale collagens isolated from
the subtropical fish black drum (Pogonia cromis) and sheepshead seabream (Archosargus
probatocephalus). Food Chemistry. 88, 2004.
49. Lin, Yung Kai and Liu, Deng Cheng. Comparison of physical–chemical properties of type
I collagen from different species. Food chemistry. 99, 2006.
50. Ikoma, T., et al. Physical properties of type I collagen extracted from fish scales of Pagrus
major and Oreochromis niloticas. Biological Macromolecules. 2003, Vol. 32.
51. Ma, L., et al. Collagen/chitosan porous scaffolds with improved biostability for skin tissue
engineering. Biomaterials. 2003, Vol. 24.
52. Venugopal, L., et al. Biocomposite nanofibres and osteoblasts for bone tissue engineering.
Nanothecnology. 2008, Vol. 18.
53. Hyeon, Kim, et al. Bone tissue engineering with premineralized silk scaffolds. Bone. 2008,
Vol. 42.
54. Jayakumar, P. and Silvio, L. Di. Osteoblasts in bone tissue engineering. Journal of
Engineering in Medicine. 2010, Vol. 224.
55. Hollinger, J., et al. Bone Tissue Engineering. s.l. : CRC Press, 2005.
56. Gimble, Jeffrey, Katz, Adam and Bunnell, Bruce. Adipose-Derived Stem Cells for
Regenerative Medicine. Circulation Research. 2007.
57. Izadpanah, R., et al. Biologic Properties of Mesenchymal Stem Cells Derived From Bone
Marrow and Adipose Tissue. Journal of Cellular Biochemistry. 2006.

Chapter I. General Introduction
18

Chapter II. Materials and Methods
19
CHAPTER II.
MATERIALS AND METHODS

Chapter II. Materials and Methods
20
Chapter II. Materials and Methods
21
1| Fish Scales Preparation
The fish scales to be studied were collected from a market in Thailand. The studied fish
specie was Lates Calcarifer, being the common name White Seabass.
The scales preparation procedures were adapted from Ikoma T. et al [26] and Pati F. et
al [5]. In brief, the scales were immersed in distilled water and conserved at 4ºC. A group of
scales was stored in an antibacterial solution of sodium azide 1%wt for further investigation of
this group of untreated fish scales (G1). The remaining scales were washed twice in 10%wt of
NaCl solution, to remove unnecessary proteins on the surface, for 48h. Afterwards, one part of
these scales was washed with distilled water forming a second group (G2), and the remaining
scales were submitted to a process of demineralization and extraction of the soluble collagen, in
order to achieve the third group of scales (G3). For the demineralization, it was used a solution of
0.5 mol/L of EDTA, to immerse the fish scales for 48h. Then the extraction of soluble collagen
was done by the immersion of the scales in a solution of 0.5 mol/L of Tris, HCl buffered at pH
7.5, for 48h. Scales were finally washed with distilled water and kept in it until further use.
2| Fish Scales Characterization
2.1. Morphology
The scales of the 3 groups were observed in the Optical Microscope (Axiotech, Zeiss) and
in the SEM (Supra 40, Zeiss) in order to analyze the surface patterns. They were also observed in
the Polarized Microscope and in the Confocal Laser Microscope (Eclipse, Ti-E, Nikon).
2.2. Collagen Imaging
Confocal Laser Microscope (Eclipse, Ti-E, Nikon) was used to evaluate collagen
architecture on different group samples, and Direct Red 80 [27] was used as unspecific stain for
collagen, typically used for detection in tissue histological section. Samples were stained for 60
minutes in an aqueous solution of 0.1% of Sirius Red F3BA (Sigma Aldrich) saturated with picric
acid, pH 2. After that, samples were washed for 2 minutes in 0.01M HCl, rinsed in ethanol 70%,
and dehydrated with ethanol gradients, 70, 90, and 2x100%.

Chapter II. Materials and Methods
22
3| Fibroin Films
3.1. Fibroin Production
In addition to G1, G2 and G3 groups, two more groups were created. Fibroin films with
the same patterning as the scales (F1), and fibroin films without patterning (F2), in order to allow
drawing conclusions about the pattern role in the cellular behavior.
In order to mimic the fish scales pattern, the material selected was the fibroin. To
prepare the fibroin needed, the process was divided in two steps: degumming and dissolution.
Degumming
Bombyx mori cocoons (kindly provided by Socio Lario, Cassina Rizzardi, Como, Italy)
were degummed for 1.5 hours in a bath of boiling water containing 1.1 g/l Na2CO3 (10 g of silk in
1L of solution), then for 1.5 hours in another bath of boiling water containing 0.4 g/l Na2CO3.
After the two baths cocoons were rinsed thoroughly with distilled warm water to remove salts and
dried in air.
Dissolution
Fibroin-water solutions were prepared by dissolving the fibroin obtained in the previous
step in 9.3 M LiBr (Fluka Chemical) aqueous solution (1g/10ml) at 65°C for 2 hours, followed
by dialysis against distilled water with a 3500 Da MWCO membrane (Slyde-A-Lyzer, Pierce) in
order to eliminate salts.
The concentration of the resultant fibroin solution was measured by UV-VIS
spectrophotometer (Nanodrop). The solution was then diluted to a concentration of 2.5% w/v.
The pH of the solution was 5.
3.2. Construction of fibroin samples with the fish scales pattern (F1)
The first step of this process was the creation of silicon molds with the fish scales
pattern. This was achieved using a plate with nine prominent cylinders with a glued fish scale
with the pattern turned up on the top of each cylinder, as shown in figure 2.1.

Chapter II. Materials and Methods
23
Figure 2.1 - Plate where the scales were glued and covered with silicon to form the molds with scale patterning
The plate was filled with a silicon solution (Sylgard Silicone Elastomer kit 184) and the air
bubbles were removed with the aid of a dissector. Then the plate was transferred to an oven at
65ºC during 24h. The resultant molds contained negatives of fish scales patterns. The result of
this process is shown in figure 2.2, as the bottom of each of its wells transducers the negative of
the fish scales pattern.
Figure 2.2 - a), b) - Silicon mold with the negative of the fish scales pattern in the bottom of each well
Figure 2.3 refers to the pattern seen in one of the resultant negatives using the Optical
Microscope (Axiotech, Zeiss), being similar to the fish scales pattern, as it will be shown further
ahead.
Figure 2.3 - a), b), c) - Pattern of the negatives existent in the bottom of each well of the silicon mold

Chapter II. Materials and Methods
24
To achieve the copy of the pattern of the fish scales, the wells containing the negatives
were filled with the fibroin solution and left drying for 3 days at room temperature. From each
well, a sample of fibroin like the one shown in figure 2.4 was produced.
Figure 2.4 - Fibroin sample with a pattern similar to the fish scales
Figure 2.5 shows the pattern of one of the resultant samples of fibroin observed using
the Optical Microscope, similar to the fish scales, as shown.
Figure 2.5 - a), b), c) - Fibroin sample pattern observed in the Optical Microscope
In order to stabilize the fibroin samples, these were immersed in an aqueous solution of
methanol 80% for 20 minutes, and then washed with distilled water. This procedure was shown
not to affect the pattern.
3.3. Construction of the fibroin samples without pattern (F2)
Fibroin films were prepared by casting aqueous solutions with 2.5% w/v of total protein
content on polyethylene plates at room temperature for 2 days. After that, the film was cut in
circles with controlled diameter. All resulting films were stabilized using the same procedure as
the samples with the scale pattern.
Chapter II. Materials and Methods
25
Figure 2.6 - Fibroin sample without any pattern
4| Collagen films
4.1. Extraction of collagen from fish scales
In a first phase the idea was to construct collagen films with collagen directly extracted
from fish scales. Fish scales were collected from the company Ramirez. These scales were from
the fish kind Sardina pilchardus, being the common name Sardine.
The scales were preserved in the freezer at -80ºC till their utilization. At this time they
were washed several times with water and then completely dried with the aid of a liophilizer in
order to measure their weight. The Sardine fish scales were treated with 10 % NaCl solution
during 48h to remove unnecessary proteins. Then, they were demineralized by immersion in 0.5
mol/L EDTA solution during 48h. To extract the collagen from the scales, these were immersed
in 0,5mol/L Tris-HCl solution, buffered at pH 7.5, at 4 ºC, during 48 hours. The resultant
suspension was centrifuged at 4ºC and 10,000 x g for 20 minutes to separate the collagen. The
resultant residue of this process was dissolved in 0,01M HCl solution. After 48 hours, the
collagen was precipitated from the acid solution by increasing solution pH to 7 by addition of
NaOH solution. The acid soluble collagen was then separated by filtration and washed with
distilled water. The collagen was further purified by dissolution in 0.5M acetic acid, dialized
against 0.1M acetic acid during 2 days.
For the quantification of the collagen existent in the solution after the dialysis was
executed a method named as SIRCOL. Firstly was labeled a set of microcentrifuge eppendorfs.
Then was prepared a standard curve, being the blanks constituted of 100µL of acetic acid 0,1M
and the collagen standards (5, 10, 20, 30, 40µg) and making 100µL by adding acetic acid 0,1M

Chapter II. Materials and Methods
26
and finally vortexing these mixtures. The test samples were done in duplicate having each sample
100µL too. To each eppendorf created was added 1mL of Sircol Dye reagent. The eppendorfs
were placed in a mechanical shaker for 30 minutes for the binding of the Sircol dye with soluble
collagen. The eppendorfs were transferred to a micro centrifuge and spin at 13.000g for 10
minutes. The unbound dye solution was removed by carefully inverting and draining the tubes.
Remaining droplets were removed by gently taping the inverted eppendorf. To each eppendorf
was added 1mL of the Alkali reagent and the bound dye was released into solution using a
vortex. After dissolution, the samples absorbance was measured using the Spectrophotometer
set to a wavelength of 540nm. This data was collected and used to infer about the collagen
existent by comparing the obtained values for the samples with the obtained standard curve. The
yield of collagen extracted was very low, being about 0.01% on dry weight basis.
As an attempt to raise the efficiency of the process of collagen extraction, to the previous
procedure were changed some parameters. This time, the whole procedure was executed at a
temperature of 4ºC; the scales while immersed in the solutions for unnecessary proteins
removal, demineralization and collagen extraction were submitted to constant agitation; the
suspensions centrifugation was done at 20,000 x g for 1 hour; and the dialysis was done against
0,5M acetic acid instead of 0,1M. This attempt succeeded with a raise in the yield of collagen
extracted, being this time of about 0.2% on dry weight basis. Although this method was still very
inefficient, even after executing this procedure five times the collagen collected was still in a very
low quantity for the application it was needed – the production of collagen films.
After this, the encountered way was to produce the collagen films with already available
collagen and with still fish origins, being the solution the production of the films based on shark
skin collagen.
4.2. Construction of shark collagen films with scales patterning
The shark skin collagen used was kindly provided by Ricardo I. Perez-Martin and Carmen
G. Sotelo (CSIC, Inst Invest Marinas, Vigo 36208, Galicia, Spain). For the production of the films
the collagen concentration used was 4% dissolved in acetic acid 0,5M. For the formation of stable
films was then needed the cross-linking of collagen. For the cross-linking the first tries were with
EDC and NHS but these were somehow frustrated because the results were always a gelatin,
being unstable films. The solution found was the utilization of Genipin for the cross-linking. For

Chapter II. Materials and Methods
27
that, Genipin was added to the collagen solution in order to be in a concentration of 10mM.
Then, while stirring, the solution was inserted in a mineral oil bath at 37ºC and controlled while
was getting more and more viscous and changing to a darker color. After about 3h of this
process the solution was already darker and more viscous and was transferred to proper
recipients.
The shark skin collagen films with the fish scales pattern were achieved with the
utilization of silicon molds with wells with the scales pattern which were constructed with a
similar method as the one described in section 2.1.2. Each well of these molds was filled with
1mL of the collagen solution prepared and after 3 days were formed stable dry collagen films
with the fish scales pattern.
5| In vitro Biological tests
The experiment in vitro described below was preceded by a simpler in vitro experiment.
This experiment studied the cellular behavior (osteoblasts) when seeded on the fish scales from
the 3 groups for 5 days. Promising results were achieved by the execution of the Alamar Blue
tests, Confocal Microscope and SEM analysis.
5.1. Cells culture and seeding
Before the in vitro tests, the scales (G1, G2, G3) and fibroin films (F1, F2) were
immersed in ethanol 70% at 4ºC respectively for 24 hours and 2 hours and washed with sterile
distilled water.
Osteoblasts of MG63 cell line were cultured in Minimum Essential Medium (MEM)
(Invitrogen), 10% Fetal Calf Serum, 1% Sodium Piruvate, 100 mM Euroclone, 2% L-glutamine 100
mM Euroclone, Non Essential Aminoacids Gibco, and 1% of Antibiotic / Antimicotic. Cells were
cultured in an atmosphere of 37ºC and 5% CO2. After the cells have reached confluence, they
were detached by the removal of the medium, the washing of the flask with PBS and the addition
of trypsin. The cell concentration was 1,0x10⁵ cells/ml. To execute this protocol, 37 samples
from each group (G1, G2, G3, F1 and F2) were used. After 1 day, 4 samples of each group were
removed from the experiment to be analyzed (2 by SEM and 2 by Confocal Microscope), and
another 4 samples from each group were removed for the ALP test. The same was done after 3,

Chapter II. Materials and Methods
28
7 and 14 days, when the experiment was concluded. It is important to mention that the samples
for the Alamar Blue test were always the same. This means that 5 samples from each group
were used during the whole experiment, since this procedure does not damage the cells. The in
vitro experiment had the duration of 14 days: day 0 was considered the day of seeding; on day 1
all the samples were switched to different well plates in order to remove all the cells not attached
to the samples from the equation, as well as it was the first day of control; day 3 was the second
day of control; on day 5, a change of the medium was done; day 7 was the third day of control;
on days 9 and 11, a change of medium was done; and finally day 14 was the last day of control.
On the days of control, the Alamar Blue test was performed and the samples to be controlled in
that day were submitted to a protocol of fixation.
The potential of fish scales to support the osteogenic differentiation of human adipose
derived stem cells (hASCs) was studied. Scales from Lates calcarifer were submitted to a
treatment for removal of unnecessary proteins on their surface by immersion in NaCl (Panreac)
10%wt during 48h, equivalent to the already mentioned for the G2 samples. All the scales were
cut in circles with 10mm of diameter and immersed in ethanol 70% during 2 hours for
sterilization. After this, scales were washed with sterile PBS. Cells were cultured in basal culture
medium (α-MEM plus 10% FBS and 1% of A/B) and standard osteogenic medium (α-MEM plus
10% FBS and 1% of A/B, and supplemented with 10 mM beta-glycerophosphate, 50 g/mL of
ascorbic acid and 10-8M of dexamethasone). hASCs at passage 2 were seeded at a density of
2000 cells/cm2. The quantity of medium immersing each sample was of 1ml. Tissue culture
polystyrene coverslips (TCPs) were used as controls. Cultures were maintained for 1, 3, 10, 21
and 30 days.
5.2. AlamarBlue Assay
AlamarBlue assay kit (Biosource International Inc., USA) was used to assess metabolic
activity at the end of each experimental time point of the studies with MG63. This technique is a
quantitative process providing a linear measurement over time, being safe and nontoxic for the
cells. It is designed to measure the proliferation of various human and animal cell lines
quantitatively. A higher proliferation causes a larger absorbance value as well as a larger
percentage of reduced alamarBlue. The assay was performed according to the manufacturer‟s
instructions [4].
Chapter II. Materials and Methods
29
In brief, the seeded samples were incubated for 4 hours at 37°C with fresh culture
medium (with reduced serum) supplemented with alamarBlue diluted according to
manufacturer‟s data sheet (simply adding the alamarBlue reagent as 10% of the sample volume).
A total of 3 replicates were used for each sample and each replicate was split into 4 wells for the
final reading. The references were taken from wells with unseeded samples incubated with the
alamarBlue solution, wells with only culture medium, and wells with only cells. Absorbance was
measured at 570 nm and 620 nm with a photometric microplate reader (Multiskan EX,
ThermoLabsystems, Finland) and the percentage of reduced alamarBlue was calculated. The
whole procedure was executed in the absence of light.
The calculations to get the percentage of reduced alamarBlue (being this percentage
directly proportional to the quantity of cells existent) were:
- Subtract the absorbance values of medium only from the absorbance values
of Alamar Blue.
- Calling AOLW = absorbance of form at lower wavelength, and AOHW =
absorbance of oxidized form at higher wavelength, correction factor:
R0 = AOLW / AOHW.
- To calculate the percentage of reduced Alamar Blue in a specific well:
%Reduced = ALW – (AHW x R0) x 100, being ALW the absorbance at 570nm and
AHW the absorbance at 620nm.
Statistical Analysis
Statistical Analysis was performed for the AlamarBlue assay results which are presented
as means ± STDEV (Standard Deviation of the Mean). Friedman Test (non- parametric test
equivalent to One Way Repeated Measurements ANOVA) was performed for each group analyzed
along time. One Way ANOVA on Ranks followed by Tukey Test was performed for each time point
for group comparison (SigmaStat 3.0, SPSS, Chicago, IL, USA).
5.3. Confocal Laser Microscope (CLM) Analysis
Evaluation of cell attachment, distribution, and morphology on fish scales (G1, G2 and
G3) and fibroin films (F1 and F2) seeded with MG63 was performed by confocal laser
microscopy (Nikon Eclipse, Ti-E) after Phalloidin Rhodamine (Biosource International, Invitrogen)
and DAPI (Sigma Aldrich) staining according to the manufacturer‟s protocol. Fixation with a

Chapter II. Materials and Methods
30
formaldehyde solution (4% formaldehyde in PBS solution) and permeabilization with TritonX 100
(0.2% TritonX in PBS solution) were performed before staining.
5.4. Scanning Electron Microscope (SEM) Analysis
Morphological observations were performed with scanning electron microscopy (Supra
40 Zeiss), operating mode: high vacuum, secondary electron detector) on fish scales (G1, G2 and
G3) and fibroin films (F1 and F2) seeded with MG63. At each time point, films were fixed with
gluteraldehyde solution (2,5% gluteraldehyde in cacodylic buffer solution, 0,1 M) to preserve
biological structures. Samples dehydration was performed by soaking in a series of aqueous
ethanol solutions at increasing concentrations from 30% - 100% and drying in air at room
temperature. Before SEM imaging, all samples were sputter coated with gold (SEM Coating Unit
PS3, Assing S.p.A., Rome, Italy).
5.5. Alkaline Phosphatase (ALP) activity quantification
Alkaline Phosphatase (ALP) is the biochemical marker of osteoblastic bone formation
most frequently used. The activity of ALP is evaluated using p-nitrophenol assay. Para-nitrophenyl
phosphate, which is colorless, is hydrolysed by alkaline phosphatase at 37ºC to form free
paranitrophenol, which is colored yellow. The reaction is stopped by addition of NaOH and the
absorbance read at 405 nm.
Osteoblastic activity on fish scales (G1, G2 and G3) and fibroin fims (F1 and F2) was
monitored measuring Alkaline phosphatase activity (ALP) based on the conversion of p-
nitrophenyl phosphate to p-nitrophenol. Firstly, solutions were added in nine test tubes (Sample
Diluent, Buffer Solution and p-Nitrophenol Standard) in order to build a standard curve, as shown
in table 2.1.
Tube # 1 2 3 4 5 6 7 8 9
Sample Diluent (µL) 250 250 250 250 250 250 250 250 250
Buffer Solution (µL) 250 245 240 230 220 210 200 190 180
pNP Standard (µL) 0 5 10 20 30 40 50 60 70
Concentration (µmol/mL) 0 1 2 4 6 8 10 12 14
Table 2.1 - Solutions execution for the nine test tubes in order to build the standard curve for ALP test (osteoblasts)
All the tubes were vortexed and then 100µl from each standard tube were transferred to
a 96-well plate. After this, the same quantity of NaOH solution was added to all the standard

Chapter II. Materials and Methods
31
wells and measured spectrophotometrically at 405 nm in a microplate reader (Multiskan EX,
ThermoLabsystems, Finland), to set up the calibration curve.
To prepare the samples reading, 50µl from each sample (all the samples in
quadruplicate) were put in a 96-well plate, 50µl of 0.05% Triton-X (Sigma) in PBS were put in 6
wells to use as blank, and then 50µl of Buffer Solution were added. Finally the samples were
incubated at 37ºC till the majority of the solutions in the wells turned yellow, which happened
after 3h20mins for the samples from days 1 and 3 of control, and after 1h42mins for the
samples from days 7 and 14 of control.
This procedure presented some differences when executed for the scales of G2 seeded
with hASCs. The following solutions were used: substrate buffer (1M Diethanolamine HCl, pH9.8
- Sigma); substrate solution (0.2% w/v p-nytrophenyl phosphate in substrate buffer); stop solution
and blank (2M NaOH/0.2mM EDTA); product/standard solution (p-nytrophenol stock solution
10µmol/ml – Sigma); and PBS.
In each well of 96-well plates the following mixture was made: 20µl of sample and 60µl
of substrate in triplicate. Then the 96-well plates were incubated at 37ºC for 45min. After the
incubation period, 80µl of stop solution were added to each well. The ALP standards were
prepared according to table 2.2:
pNP Stock Solution (µl) 0.0 0.8 1.6 2.4 3.2
Stop Solution (µl) 160 159.2 158.4 157.6 156.8
Standard Concentration (µmol/ml) 0.00 0.05 0.10 0.15 0.20
Table 2.2 - Solutions execution for the nine test tubes in order to build the standard curve for ALP test
(stem cells)
5.6. Macro BCA Protein Assay
In order to find the protein concentration of all samples, the Macro BCA Protein assay
(micro BCA protein assay kit, Thermo Scientific, USA) was performed. In nine test tubes, the
standard solutions were prepared, using different concentrations of Sample Diluent and Albumin
Standard in each tube, as shown in table 2.3.
Tube # 1 2 3 4 5 6 7 8 9
Sample Diluent (µL) 200 195 190 180 160 140 120 100 80
Albumin Standard (µL) 0 5 10 20 40 60 80 100 120
Concentration (µg/µL) 0 0.05 0.1 0.2 0.4 0.6 0.8 1 1.2
Table 2.3 - Solutions execution for the nine test tubes in order to build the standard curve for BCA assay
Chapter II. Materials and Methods
32
All the tubes were then vortexed and 25µl were transferred in triplicate to a 96-well plate,
in order to measure the absorbance and create the calibration curve.
To prepare the samples absorbance reading, 25µl from each one were transferred in
duplicate to a 96-well plate. Another 6 wells were used as blank, putting 25µl of Sample Diluent
in each one. Then, to each well, including standards, samples and blanks, 200µl of working
solution was added (prepared with two different reagents as indicated in protocol). Finally the
samples were incubated at 37ºC for 30 minutes and read in the microplate reader (Multiskan EX,
ThermoLabsystems, Finland) at 570nm.
5.7. DNA measurement
DNA content in fish scales (G1, G2 and G3) and fibroin fims (F1 and F2) seeded with
MG63 was measured through Picogreen, according to the manufacturer‟s protocol (Quant-iT
PicoGreen dsDNA Assay Kit (Invitrogen). Firstly, the preparation of TE solution and a dilute
PicoGreen solution following a protocol (Quant-iT PicoGreen dsDNA Assay Kit (Invitrogen) was
performed. With the prepared solutions, eight assay tubes were filled with different quantities in
order to set the standard solutions. To the wells of a 96-well plate, 100µl of the standards and
samples in duplicate were transferred, and 100µl of PicoGreen solution were added. Finally, the
plate was read on a fluorescent plate reader, exciting at 485nm and reading at 538nm.
The procedure executed for the DNA quantification for the scales of G2 seeded with
hASCs presented some differences. After the samples defrosting and the preparation of the
necessary solutions following the previously mentioned indications of the assay kit manufacturer,
in each well of 96-well white opaque plates the following mixture was made: 28.7µl of sample or
standard, 71.3µl of Picogreen solution and 100µl of 1XTE. Then the plates were incubated in the
dark for 10min and the fluorescence read using the parameters of excitation of 485nm and
emission of 528nm.
5.8. Fluorescence Microscopy Analysis
Evaluation of stem cell attachment and distribution on the seeded samples was
performed by fluorescence microscopy using a Zeiss Axioimager Z1 microscope (Zeiss, Germany)
after Phalloidin Rhodamine (Sigma) and DAPI (Sigma) staining according to the manufacturer‟s
protocol. Fixation with Formalin 10% (BioOptica) was performed before staining.
Chapter II. Materials and Methods
33
References
1. Ikoma, T., et al. Physical properties of type I collagen extracted from fish scales of Pagrus
major and Oreochromis niloticas. Biological Macromolecules. 2003, Vol. 32.
2. Pati, Falguni, Adhikari, Basudam and Dhara, Santanu. Isolation and characterization of
fish scale collagen of higher thermal stability. Bioresource Technology. 101, 2010.
3. Hughes, L. C., Archer, C. W. and Gwynn, ApI. The ultrastructure of mouse articular
cartilage: collagen orientation and implications for tissue functionality. A polarized light and
scanning electron microscope study and review. European Cells and Materials. 2005, Vol. 9.
4. Invitrogen. alamarBlue Assay. U.S. Patent No.5,501,959 Carlsbad.

Chapter II. Materials and Methods
34
Chapter III. Fish Scales as Model for Osteogenic Cells Culture
35
CHAPTER III.
FISH SCALES AS MODEL FOR
OSTEOGENIC CELLS CULTURE

Chapter III. Fish Scales as Model for Osteogenic Cells Culture
36
Chapter III. Fish Scales as Model for Osteogenic Cells Culture
37
Fish Scales as Model for Osteogenic Cells Culture
David Afonso 1,2, Antonella Motta 3, Joana Moreira-Silva 1,2, Alexandra P. Marques 1,2,
Tiago H. Silva 1,2, Fábio Volpato 3, Rui L. Reis 1,2, João F. Mano 1,2, Claudio Migliaresi3
1 3B‟s Research Group - Biomaterials, Biodegradables and Biomimetics, University of Minho, Headquarters of the
European Institute of Excellence on Tissue Engineering and Regenerative Medicine, AvePark, 4806-909 Taipas,
Guimarães, Portugal
2 ICVS/3B‟s - PT Government Associate Laboratory, Braga/Guimarães, Portugal
3 Department of Materials Engineering and Industrial Technologies and BIOtech Research Centre, University of
Trento, I-38050 Trento, Italy
Abstract
“Biomimetics” refers to human-made substances, processes, devices, or systems that
somehow imitate nature. Creatures and plants possess tools and skills that are attractive to
imitate, being the goal to learn its principles, and thereafter transfer the principle to a synthetic
process or new material. Considering the fish scales composition of hydroxyapatite and type I
collagen fibrils, and also their capability to provide a form of armor plating to protect it from injury
and disease transmission. The fish scales study will allow us to extract some principles for
application in other fields, being the biomedicine a potential field for this application. In the
present work, fish scales of the specie Lates Calcarifer, also known as White Seabass, were
studied. Scales characterization was done by observations in the Optical Microscope, SEM and
Confocal Laser Microscope, with specific focus on their pattern. Fish scales were found to be very
organized consisting mainly of parallel concentric grooved lines. In vitro biological analysis of the
scales was performed using them as patterned films for cell culture. Scales supported cell
proliferation and the cells presented an orientation according to the fish scales patterning

Chapter III. Fish Scales as Model for Osteogenic Cells Culture
38
alignment both for osteoblasts (MG63) and hASCs, acquiring an elongated and narrow shape.
The present work is the first to evaluate cell behavior induced by fish scale patterning.
1| Introduction
“Biomimetics” is a recent definition but in fact the humankind was inspired by Nature
since the beginning of civilization. Creatures and plants possess tools and skills that are attractive
to mimic. Mimicking nature cannot be a goal in itself, once this would hardly represent progress.
The goal is to learn its principles, extract the general physic-chemical processes of the
object/principle to be mimicked, and thereafter transfer it to a synthetic process or new material
[1]. Fish scales study is relevant in order to extract some principles for appliance in different
areas, being the biomedicine a potential environment for this praxis considering the fish scales
composition, structure and functions.
This study focuses on the fish scales of a specie denominated Lates Calcarifer, which is
one of the nine Lates species of the family Centropomidae [2] [3].
At the macroscopic level, fish scales are staggered together and cover most of the body
of the fish, providing a form of armor plating to protect the fish from injury and disease
transmission, and they also assist in swimming by reducing water friction and resistance [4].
The fish scales are composed of extracellular matrix, mainly type I collagen fibers and
calcium-deficient hydroxyapatite (HAp), which together form a highly ordered three-dimensional
structure. Each scale consists of two distinct regions: an osseous layer and a fibrillary plate
mainly composed of collagen [5]. Fish scales are composed by HAp and type I collagen fibrils
with a plywood structure of aligned fibril sheets. This fibrils alignment is similar to those of bones,
tendons and corneas in the human body [6] [7]. Zhu et al. (2011) [8] studied the mechanical
properties of fish scales and concluded that these are high performance natural protective
systems, considering the importance of the structure and architecture of the scales in amplifying
the properties of their components.
Fish scales from different species present variations in size, shape and arrangement. The
general classification includes: placoid, cosmoid, ganoid, and elasmoid (cycloid and ctenoid).
These elasmoid scales are more evolved scales when compared with the other types being
thinner and more flexible, which improved the swimming capability, present greater

Chapter III. Fish Scales as Model for Osteogenic Cells Culture
39
hydrodynamic properties and a more resistant protective layer [8]. In this study we have
investigated scales of the elasmoid cycloid type, which are similar to tree trunks, because, as
they age, they form concentric lines, which provide to scientists a way of determining the age of a
fish. The scales pattern allows also the establishment of a correspondence to events occurred in
the life of a fish [9].
Cells in tissues are arranged in distinct patterns; the orientation and the position of the
cells with respect to each other are established by the tissue type. The study of the ability to
control the placement of cells in an organized micro-pattern, such like the existent in the fish
scales, on a substrate has become increasingly important for tissue engineering applications,
which require that cells can be specifically placed to generate organized structures, such as a
neural network for example [10] [11]. Also the ability to constrain the spreading to a specific cell-
surface contact area has been shown to dramatically affect cellular development. Mechanical
compliance of the cell-adhering substrates can also substantially affect the cells response and
development [12]. Cells were reported to elongate in the direction of the micrometer-size grooves
existing in the pattern and migrate as guided by these grooves. The disintegration and formation
of fibrous cellular components is also influenced by surface topography. There is evidence that
cell shape can control cell growth, gene expression, secretion of proteinases and ECM
metabolism. Micro-patterned tissue engineered constructions are expected to better preserve cell
morphology, differentiation and functionality for long periods of time. The micro-topography
provides directional growth for cells and also can create tissue architecture at cellular and
subcellular level in a reproducible manner [13].
Another attractive reason to study the fish scales is the abundance and prosperity of its
source and the fact that they are directed to low-added value ends. Marine capture fisheries
represent over 50% of total world fish production and more than 70% of this production has been
utilized for fish processing. As a result, every year considerable amounts of total catch are
discarded as processing leftovers, consisting more than 30% of this waste of skin, scale and
bone, which are rich in collagen and have received increasing attention as collagen sources.
Recent estimates revealed that discards from the world‟s fisheries exceed 20 million tons,
meaning 25% of the total production of marine capture fisheries. Therefore, there is a great
potential in marine bioprocess industry to convert and utilize more of these products as added
valuable products [14] [15] [16].
Chapter III. Fish Scales as Model for Osteogenic Cells Culture
40
Silks are fibrous proteins commonly produced by insects and spiders. They exhibit a
unique and useful conjunction of properties such as being degradable and lightweight with
excellent mechanical and thermal properties. In nature, silks are used, for example, as materials
for web construction and prey capture (spider webs), and reproduction enclosures (cocoons)
where the silkworms are included. These features are also related to the current use of silks as
sutures, nevertheless they are being gradually replaced by synthetic polymers. Silk consists of
two different proteins: fibroin and sericin. Fibroin is the protein responsible for the filaments of
silkworm silk and it can be regenerated in various ways depending on the application. Recently,
many researchers have investigated silk proteins, mainly silk fibroin, as one of the candidate
materials for biomedical applications, because it has several distinctive biological properties such
as: significant biocompatibility, good oxygen and water vapor permeability, biodegradability,
praiseworthy mechanical strength in the wet state, resistance against enzymatic cleavage, drug
permeability and minimal inflammatory reaction [17] [18]. Beyond their traditional use as
sutures, silk fibroin has been exploited as a biomaterial for cell culture and tissue engineering in
vitro and in vivo since the mid-90s. In early studies, silk films obtained from native silkworm
fibroin collected from glands of Bombyx mori domestic silkworms and Antheraea pernyi wild
silkworms were found to support the attachment and proliferation of fibroblasts. Later reports
showed that regenerated silk films prepared by dissolution of silkworm cocoon fibers in 9–9.5 M
LiBr supported the attachment and growth of human and animal cell lines. These studies
provided clues to the use of regenerated silk fibroin as a scaffold or matrix biomaterial for cell
culture and tissue engineering. Numerous studies have already explored regenerated silk fibroin-
based biomaterials in various forms, including films, membranes, mats, nets, hydrogels, and
porous sponges for biomedical applications. The in vivo behavior of biomaterials prepared from
silk fibroin solutions has not been completely demonstrated, despite the fact that the
biocompatibility and degradation of silk sutures, which are prepared from native silk fibers, have
been well established. Previous studies showed that two-dimensional silk fibroin films have good
biocompatibility. Recent progress in processing techniques has yielded three-dimensional porous
silk fibroin scaffolds with control of morphological and structural features [17] [19] [20].
Osteoblasts are cells of mesenchymal origin responsible for synthesis and mineralization
of bone during both bone formation and bone remodeling. They form a closely packed sheet on
the bone‟s surface, from which cellular processes extend through the developing bone. The
goals for scaffolds in bone tissue engineering include suitable chemistry, morphology and
Chapter III. Fish Scales as Model for Osteogenic Cells Culture
41
structure in order to promote cell adhesion for osteoblasts, migration, differentiation, synthesis of
extracellular matrix and mineralization [21] [22] [23].
Stem cells are characterized by their capability to self-renew and their ability to
differentiate along multiple lineage pathways. Human subcutaneous adipose tissue emerges as a
source of adult or somatic stem cells [24]. Recent developments in the field of stem cells
suggested that hASCs can be induced into adipogenic, osteogenic, chondrogenic, and myogenic
lineages under appropriate conditions. hASCs are easy to obtain, have relatively lower donor site
morbidity and a higher yield at harvest, and can expand more rapidly in vitro compared with
BMSCs for example, which are now commonly used as seed cells for bone repair and
regeneration. In addition, hASCs have multipotency which is independent of serum source and
quality. Thus, hASCs might be a novel and very promising alternative cell source for bone tissue
engineering [25].
Concluding, the main objective of this study was determining both osteoblasts and stem
cells behavior when submitted to the fish scales pattern.
2| Materials and Methods
2.1. Fish scales preparation
The fish scales to be studied were collected from a market in Thailand. The studied fish
specie was Lates Calcarifer, being the common name White Seabass.
The scales preparation procedures were adapted from Ikoma T. et al [26] and Pati F. et
al [5]. In brief, the scales were immersed in distilled water and conserved at 4ºC. A group of
scales was stored in an antibacterial solution of sodium azide 1%wt for further investigation of
this group of untreated fish scales (G1). The remaining scales were washed twice in 10%wt of
NaCl solution, to remove unnecessary proteins on the surface, for 48h. Afterwards, one part of
these scales was washed with distilled water forming a second group (G2), and the remaining
scales were submitted to a process of demineralization and extraction of the soluble collagen, in
order to achieve the third group of scales (G3). For the demineralization, it was used a solution of
0.5 mol/L of EDTA, to immerse the fish scales for 48h. Then the extraction of soluble collagen

Chapter III. Fish Scales as Model for Osteogenic Cells Culture
42
was done by the immersion of the scales in a solution of 0.5 mol/L of Tris, HCl buffered at pH
7.5, for 48h. Scales were finally washed with distilled water and kept in it until further use.
2.2. Fish scales characterization
2.2.1. Morphology
The scales of the 3 groups were observed in the Optical Microscope (Axiotech, Zeiss) and
in the SEM (Supra 40, Zeiss) in order to analyze the surface patterns.
2.2.2. Collagen Imaging
Confocal Laser Microscope (Eclipse, Ti-E, Nikon) was used to evaluate collagen
architecture on different group samples, and Direct Red 80 [27] was used as unspecific stain for
collagen, typically used for detection in tissue histological section. Samples were stained for 60
minutes in an aqueous solution of 0.1% of Sirius Red F3BA (Sigma Aldrich) saturated with picric
acid, pH 2. After that, samples were washed for 2 minutes in 0.01M HCl, rinsed in ethanol 70%,
and dehydrated with ethanol gradients, 70, 90, and 2x100%.
2.3. Fibroin films
In addition to G1, G2 and G3 groups, two more groups were created. Fibroin films with
the same patterning as the scales (F1), and fibroin films without patterning (F2), in order to allow
drawing conclusions about the pattern role in the cellular behavior.
The material used to mimic the fish scales patterning was fibroin. To isolate the fibroin,
the process was divided in two steps: degumming and dissolution.
Degumming
Bombyx mori cocoons (kindly provided by Socio Lario, Cassina Rizzardi, Como, Italy)
were degummed for 1.5 hours in a bath of boiling water containing 1.1 g/l Na2CO3 (10 g of silk in
1L of solution), then for 1.5 hours in another bath of boiling water containing 0.4 g/l Na2CO3.
After the two baths cocoons were rinsed thoroughly with distilled warm water to remove salts and
dried in air.

Chapter III. Fish Scales as Model for Osteogenic Cells Culture
43
Dissolution
Fibroin-water solutions were prepared by dissolving the fibroin obtained in the previous
step in 9.3 M LiBr (Fluka Chemical) aqueous solution (1g/10ml) at 65°C for 2 hours, followed
by dialysis against distilled water with a 3500 Da MWCO membrane (Slyde-A-Lyzer, Pierce) in
order to eliminate salts.
The concentration of the resultant fibroin solution was measured by UV-VIS
spectrophotometer (Nanodrop). The solution was then diluted to a concentration of 2.5% w/v.
The pH of the solution was 5.
2.3.1. Construction of fibroin films with the fish scales patterning (F1)
The first step of this process was the creation of silicon molds with the fish scales
patterning. This was achieved using a plate with nine prominent cylinders with a glued fish scale
with the pattern turned up on the top of each cylinder. The plate was filled with a silicon solution
(Sylgard Silicone Elastomer kit 184) and the air bubbles were removed with the aid of a vacuum
pump. After, the plate was transferred to an oven at 65ºC for 24h. The resultant molds contained
negatives of fish scales patterning.
To achieve the copy of the pattern of the fish scales, the wells containing the negatives
were filled with the fibroin solution and left to dry for 3 days at room temperature. From each well
resulted a fibroin film with the same pattern of the fish scales. In order to stabilize the fibroin
samples, these were immersed in an aqueous solution of methanol 80% for 20 minutes, and
then washed by some immersions in distilled water.
2.3.2. Construction of fibroin films without pattern (F2)
Fibroin films were prepared by casting aqueous solutions with 2.5% w/v of total protein content
on polyethylene plates at room temperature for 2 days. All resulting films were stabilized using
the same procedure mentioned before for the films with the scale patterning.

Chapter III. Fish Scales as Model for Osteogenic Cells Culture
44
2.4. In vitro Biological tests
2.4.1. Cells culture and seeding
Before the in vitro tests, the scales (G1, G2, G3) and fibroin films (F1, F2) were
immersed in ethanol 70% at 4ºC respectively for 24 hours and 2 hours and washed with sterile
distilled water.
Osteoblasts of MG63 cell line were cultured in Minimum Essential Medium (MEM)
(Invitrogen), 10% Fetal Calf Serum, 1% Sodium Piruvate, 100 mM Euroclone, 2% L-glutamine 100
mM Euroclone, Non Essential Aminoacids Gibco, and 1% of Antibiotic / Antimicotic. Cells were
cultured in an atmosphere of 37ºC and 5% CO2. A cell suspension with a concentration of 1*105
cells/ml and 0.6mL were seeded on the samples. Cultures were maintained for 1, 3, 7 and 14
days.
The potential of fish scales to support the osteogenic differentiation of human adipose
derived stem cells (hASCs) was studied. Scales from Lates calcarifer were submitted to a
treatment for removal of unnecessary proteins on their surface by immersion in NaCl (Panreac)
10%wt during 48h, equivalent to the already mentioned for the G2 samples. All the scales were
cut in circles with 10mm of diameter and immersed in ethanol 70% during 2 hours for
sterilization. After this, scales were washed with sterile PBS. Cells were cultured in basal culture
medium (α-MEM plus 10% FBS and 1% of A/B) and standard osteogenic medium (α-MEM plus
10% FBS and 1% of A/B, and supplemented with 10 mM beta-glycerophosphate, 50 g/mL of
ascorbic acid and 10-8M of dexamethasone). hASCs at passage 2 were seeded at a density of
2000 cells/cm2. The quantity of medium immersing each sample was of 1ml. Tissue culture
polystyrene coverslips (TCPs) were used as controls. Cultures were maintained for 1, 3, 10, 21
and 30 days.
2.4.2. AlamarBlue Assay
AlamarBlue assay kit (Biosource International Inc., USA) was used to assess metabolic
activity at the end of each experimental time point of the studies with MG63. The assay was
performed according to the manufacturer‟s instructions [28].
In brief, the seeded films were incubated for 4 hours at 37°C with fresh culture medium
(with reduced serum) supplemented with 10% of alamarBlue solution according to
manufacturer‟s data sheet. A total of 3 replicates were used for each sample and each replicate

Chapter III. Fish Scales as Model for Osteogenic Cells Culture
45
was split into 4 wells for the final reading. The references were taken from wells with unseeded
samples incubated with the alamarBlue solution, wells with only culture medium, and wells only
with cells. Absorbance was measured at 570 nm and 620 nm in a microplate reader (Multiskan
EX, ThermoLabsystems, Finland) and the percentage of reduced alamarBlue was calculated and
plotted against the time.
Statistical Analysis
Statistical Analysis was performed for the AlamarBlue assay results which are presented
as means ± STDEV (Standard Deviation of the Mean). Friedman Test (non- parametric test
equivalent to One Way Repeated Measurements ANOVA) was performed for each group analyzed
along time. One Way ANOVA on Ranks followed by Tukey Test was performed for each time point
for group comparison (SigmaStat 3.0, SPSS, Chicago, IL, USA).
2.4.3. Confocal Laser Microscope (CLM) analysis
Evaluation of cell attachment, distribution, and morphology, on fish scales (G1, G2 and
G3) and fibroin films (F1 and F2) seeded with MG63, was performed by confocal laser
microscopy (Nikon Eclipse, Ti-E) after Phalloidin Rhodamine (Biosource International, Invitrogen)
and DAPI (Sigma Aldrich) staining according to the manufacturer‟s protocol. Fixation with a
formaldehyde solution (4% formaldehyde in PBS solution) and permeabilization with TritonX 100
(0.2% TritonX in PBS solution) were performed before staining.
2.4.4. Scanning Electron Microscope (SEM) analysis
Morphological observations were performed with scanning electron microscopy (Supra
40 Zeiss), operating mode: high vacuum, secondary electron detector) on fish scales (G1, G2 and
G3) and fibroin films (F1 and F2) seeded with MG63. At each time point, films were fixed with
gluteraldehyde solution (2,5% gluteraldehyde in cacodylic buffer solution, 0,1 M) to preserve
biological structures. Samples dehydration was performed by soaking in a series of aqueous
ethanol solutions at increasing concentrations from 30% - 100% and drying in air at room
temperature. Before SEM imaging, all samples were sputter coated with gold (SEM Coating Unit
PS3, Assing S.p.A., Rome, Italy).

Chapter III. Fish Scales as Model for Osteogenic Cells Culture
46
2.4.5. Alkaline Phosphatase (ALP) activity quantification
Osteoblastic activity on fish scales (G1, G2 and G3) and fibroin films (F1 and F2) was
monitored measuring Alkaline phosphatase activity (ALP) based on the conversion of p-
nitrophenyl phosphate to p-nitrophenol.
A standard curve was firstly prepared using a kit for this assay with concentrations of
pNP Standard ranging from 0 to 14 µmol/mL. The ALP assay was carried out in a 96 well-plate,
where 50µl of each sample medium were put in quadruplicate, 50µl of 0,05% Triton-X (Sigma) in
PBS were put in 6 wells to use as blank, and then 50µl of Buffer Solution from the assay kit were
added to all. Finally the films were incubated at 37ºC till the majority of the wells turned yellow,
which happened after 3h20mins for the samples from days 1 and 3 of control, and after
1h42mins for the samples from days 7 and 14 of control.
2.4.6. DNA measurement
DNA content in fish scales (G1, G2 and G3) and fibroin films (F1 and F2) seeded with
MG63 was measured through Picogreen, according to the manufacturer‟s protocol (Quant-iT
PicoGreen dsDNA Assay Kit (Invitrogen). In brief, a standard curve was prepared with DNA
concentrations ranging from 0 to 2 µg/mL, and to the wells of a 96-well plate, 100µl of the
standards and samples in duplicate were transferred, and 100µl of PicoGreen solution were
added. Finally, the plate was read on a fluorescent plate reader, excitation of 485nm and
emission 538nm.
2.4.7. Fluorescence Microscopy Analysis
Evaluation of stem cell attachment and distribution on the seeded samples was
performed by fluorescence microscopy using a Zeiss Axioimager Z1 microscope (Zeiss, Germany)
after Phalloidin Rhodamine (Sigma) and DAPI (Sigma) staining according to the manufacturer‟s
protocol. Fixation with Formalin 10% (BioOptica) was performed before staining.

Chapter III. Fish Scales as Model for Osteogenic Cells Culture
47
3| Results and Discussion
3.1. Fish scales topography
Lates Calcarifer (white seabass) fish scales present a patterning on only one of their
sides. The other side of the scales present no defined pattern, being mainly composed of
minerals. Using the Optical Microscope, the patterning of the scale could be easily analyzed. The
observations made in the SEM (Figure 3.1) were more detailed and confirmed the observations in
the Optical Microscope.
Figure 3.1 - Fish scales from group 1 observed in the SEM
The overall patterning of fish scales of white seabass is similar to a human fingerprint,
being very organized and consisting mainly of parallel concentric lines. The grooves that delineate
the patterning present widths of about 10-20 µm. Many scales of the three groups of scales
created (G1, G2, G3) were observed and all of them presented similar patterning, although the
third group had a less incisive pattern, most probably due to the performed treatment that
removed soluble collagen.

Chapter III. Fish Scales as Model for Osteogenic Cells Culture
48
The Confocal Microscope analysis using a red staining to identify the collagen confirmed
that the scales are rich in collagen, presenting a more intense staining in the patterning lines
(Figure 3.2), which is due to a higher concentration of collagen in those areas.
Figure 3.2 - Fish scale observed in the Confocal Microscope with Direct Red 80 staining for collagen identification: a) center, b) side and c) top areas of the scale
Fish scales presented an attractive structure for cell culture due to presenting a
organized and regular patterning and also being highly composed of collagen which is a major
protein in the human body.
3.2. Osteoblast Behavior
Theoretically, the percentage of reduced Alamar Blue should be continuously upward
with the advance of the days in the case of cellular proliferation, what would mean an increasing
of the cells number. In the graphic of Figure 3.3 it is shown the percentage of reduced Alamar
Blue based in the calculations from the absorbance results.
Besides the AlamarBlue test, cell proliferation on the different films was evaluated
through the Picogreen assay. The results of this test confirmed the main ideas collected from the
AlamarBlue test, being the same overall tendencies shown, although was evidence cell
proliferation for all groups of samples.
a) b) c)
Chapter III. Fish Scales as Model for Osteogenic Cells Culture
49
Figure 3.3 - Percentage of reduced Alamar Blue for each group in the different days of control. Values are mean ± STDEV, bars with like characters are not significantly different (P>0.05). Abbreviations: G1 – untreated fish scales; G2 – fish scales after a treatment for unnecessary proteins removal from the surface; G3 – fish scales after demineralization and collagen extraction; F1 – fibroin films with the fish scales surface pattern; F2 – fibroin films without pattern; Ctrl – controls with cells seeded in the wells-plate.
Analyzing the resultant graphic (Figure 3) is perceptive the tendency of the three groups
of fish scales (G1, G2 and G3) to have a growth in the percentage of reduced AlamarBlue along
the 14 days of culture, that means an increase of cells amount. After 7 days of culture, the cells
amount presented already a significant increase for G2 and G3 of fish scales. The most
significant cellular proliferation along the 14 days was for group 2 (fish scales after a treatment to
remove unnecessary proteins from their surface).
Concerning the groups of fibroin, the percentage of reduced AlamarBlue did not present
a significant growth in the 14 days. In spite of that, DNA measurement results showed
osteoblasts proliferation for the groups of fibroin, which means that osteoblasts exhibited less
metabolic activity on these samples.
Therefore the fish scales provided good conditions for cellular proliferation, such as good
chemical composition that allowed cellular attachment and induction for multiplication.
The ALP test measures the activity of alkaline phosphatase by the quantification of
hydrolyzed pNPP in the samples, being an indicative of the cells ability to mineralize.

Chapter III. Fish Scales as Model for Osteogenic Cells Culture
50
Figure 3.4 - Quantity of pNP enzyme produced per DNA µg per minute for each group of samples on different days of control. Abbreviations: G1 – untreated fish scales; G2 – fish scales after a treatment for unnecessary proteins removal from the surface; G3 – fish scales after demineralization and collagen extraction; F1 – fibroin films with the fish scales surface pattern; F2 – fibroin films without pattern.
By the Figure 3.4 analysis it can be deduced that the ALP activity on the first 7 days after
the seeding is practically null, however the samples of day 14 already started showing some
activity. The samples of group 2 are the ones presenting higher ALP activity showing more
potential for the mineralization induction.
The fibroin samples presented very low activity, although Altman G. et al. [29] showed
that fibroin films induced osteoblasts mineralization in vitro, when the films were chemically
modified with the peptide RGD to promote integrin interactions for adhesion.
The samples analyzed by Confocal Microscope were stained with Phalloidin Rhodamine
to identify actin filaments in the cytoplasm, and DAPI to identify the cells nuclei.
In Figure 3.5 it is possible to see the cell behavior in the different samples along the the
time, with the exception of the samples F2 for reasons that will be explained further ahead. On
the first days many cells were already noticed, being visible their alignment along the axis of the
pattern of the scale and that they acquired an elongated shape. With the advance of the days it
could be noticed more zones with cells and an increase of cellular density. Even in some
situations when there was high cell density and existed some superimposition between the cells
the alignment and elongated shape was maintained. This was the cell behavior for all the types of
samples, although F1 presented fewer cells with a less elongated shape than the cells in the
scales, but still following the pattern in the fibroin.
0,000
0,100
0,200
0,300
0,400
0,500
0,600
0,700
Day 1 Day 3 Day 7 Day 14
pN
P/D
NA
/min
(u
mo
l/u
g/m
in)
Days of cell culture
ALP test
G1 G2 G3 F1 F2

Chapter III. Fish Scales as Model for Osteogenic Cells Culture
51
Walboomers et al. [30] studied the behavior of fibroblasts in micro-grooved polystyrene
and concluded that the width of the grooves that form a pattern has high influence in the cells
behavior: for a cell to sense the topography of the surface on which it is seeded, the physical
cues should not be greater than the actual size of that cell, although the grooves have to be wide
enough to allow cells to descend. Ber et al. [13] also showed that the cells behavior was not
affected when the grooves were wider than the cells size. The osteoblasts culture in the scales
micro-pattern seems to be ideal, since the normal size of osteoblasts is about 20-30µm in
diameter and the scales grooves are of 10-20µm, allowing the cells to descend but also narrow
enough for cell shape and alignment.
Scales G1 Scales G2 Scales G3 Fibroin F1
Figure 3.5 - Results of the Confocal Microscope observation after stainings with DAPI and Phalloidin Rhodamine. The
subscripts indicate the type of sample and the time period after the cellular seeding. The scale bar is 100 µm.

Chapter III. Fish Scales as Model for Osteogenic Cells Culture
52
The samples of fibroin without any pattern (F2) had some zones with cells, but those
presented different shapes between them. Along time the cell behavior did not change but could
be observed a raise on cellular density.
The observations in the SEM (Figure 3.6) confirmed the results of the Confocal
Microscopy. The cellular orientation due to the existent pattern and their elongated shape was
perceptible.
B
The fish scales samples of the first time point day presented quite similar results
between each other, having some zones with cells although difficult to identify due to being
between the scales pattern. For longer time points an increase of cell density for every sample
was observed. The samples of day 14 presented already high density of cells as can be observed
for example in G2 day 14 corresponding image, where the cells even overlap the pattern.
Scales G1 Scales G2 Scales G3 Fibroin F1
Figure 3.6 - Results of the SEM observation. The subscripts indicate the type of sample and the time period
after the cell seeding.
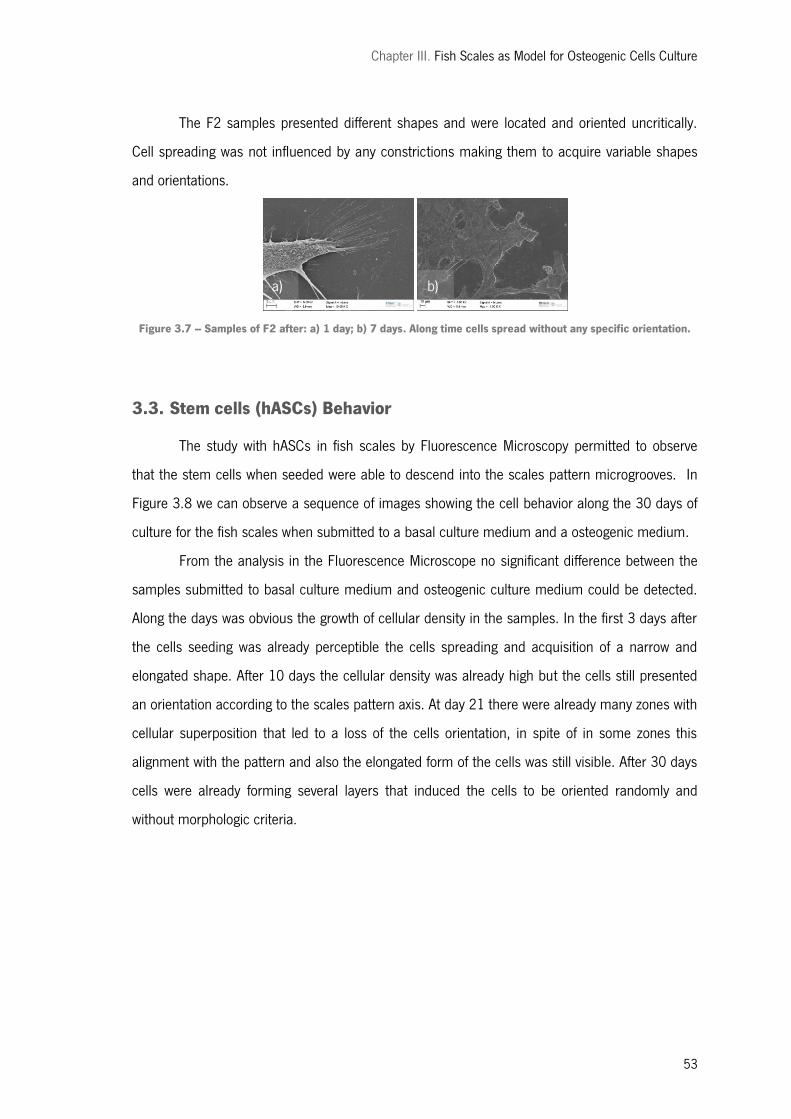
Chapter III. Fish Scales as Model for Osteogenic Cells Culture
53
The F2 samples presented different shapes and were located and oriented uncritically.
Cell spreading was not influenced by any constrictions making them to acquire variable shapes
and orientations.
Figure 3.7 – Samples of F2 after: a) 1 day; b) 7 days. Along time cells spread without any specific orientation.
3.3. Stem cells (hASCs) Behavior
The study with hASCs in fish scales by Fluorescence Microscopy permitted to observe
that the stem cells when seeded were able to descend into the scales pattern microgrooves. In
Figure 3.8 we can observe a sequence of images showing the cell behavior along the 30 days of
culture for the fish scales when submitted to a basal culture medium and a osteogenic medium.
From the analysis in the Fluorescence Microscope no significant difference between the
samples submitted to basal culture medium and osteogenic culture medium could be detected.
Along the days was obvious the growth of cellular density in the samples. In the first 3 days after
the cells seeding was already perceptible the cells spreading and acquisition of a narrow and
elongated shape. After 10 days the cellular density was already high but the cells still presented
an orientation according to the scales pattern axis. At day 21 there were already many zones with
cellular superposition that led to a loss of the cells orientation, in spite of in some zones this
alignment with the pattern and also the elongated form of the cells was still visible. After 30 days
cells were already forming several layers that induced the cells to be oriented randomly and
without morphologic criteria.
a) b)

Chapter III. Fish Scales as Model for Osteogenic Cells Culture
54
Day
1
Day
3
Day
10
Basal culture medium Osteogenic culture medium

Chapter III. Fish Scales as Model for Osteogenic Cells Culture
55
4| Conclusion
The fish scales of Lates Calcarifer presented a very organized pattern consisting mainly
of parallel concentric lines. The three groups of scales created could support a considerable
cellular proliferation showing good capacity for cell attachment, especially G2 (fish scales after a
treatment for removal of unnecessary proteins from the surface). The microgrooves existent in
the scales create a pattern, which influences cell spreading and cause the cells to be narrower
and aligned with surface microgrooves.
It may be true that bone regeneration can be already achieved without the aid of
patterns, nevertheless there is always room for improvement. Patterns could induce faster bone
formation by shortening the cells reorganization periods.
Day
21
Day
30
Figure 3.8 - Results of the observation in a Reflected/Transmitted Light Microscope after stainings with DAPI and
Phalloidin Rhodamine. The subscripts indicate the type of culture medium used and the time period after the cellular
seeding. The scale bar is 50 µm.

Chapter III. Fish Scales as Model for Osteogenic Cells Culture
56
Our results suggest that the fish scales composition and topography are responsible for a
good cell proliferation and induce modifications in cell organization and morphology. Further
studies will be needed to conclude about the hASCs osteogenic activity when submitted to the
fish scales pattern.
Chapter III. Fish Scales as Model for Osteogenic Cells Culture
57
References
1. Antonietti, Markus and Fratzl, Peter. Biomimetic Principles in Polymer and Material
Science. Macromolecular Chemistry and Physics. 211, 2010.
2. Lin, G., et al. The Complete Mitochondrial Genome Sequence and Characterization of Single-
Nucleotide Polymorphisms in the Control Region of the Asian Seabass (Lates calcarifer). Marine
Biotechnology. 2005, Vol. 8.
3. Pusey, Brad, Kennard, Mark J. and Arthington, Angela H. Freshwater fishes of north-
eastern Australia. Australia : Csiro Publishing, 2004.
4. Bone, Quentin and Moore, Richard H. Biology of Fishes. s.l. : Taylor & Francis Group,
2008.
5. Pati, Falguni, Adhikari, Basudam and Dhara, Santanu. Isolation and characterization of
fish scale collagen of higher thermal stability. Bioresource Technology. 101, 2010.
6. Chen, S., et al. Microstructures and rheological properties of tilapia fish-scale collagen
hydrogels with aligned fibrils fabricated under magnetic fields. Acta Biomaterialia. 2010.
7. Chen, Song, et al. In vitro formation and thermal transition of novel hybrid fibrils from type I
fish scale collagen and type I porcine collagen. Science and Technology of Advanced Materials.
2010.
8. Zhu, D., et al. Structure and Mechanical Performance of a „„Modern‟‟ Fish Scale. Advanced
Engineering Materials. 2011.
9. Discrete model of fish scale incremental pattern: a formalization of the 2D anisotropic
structure. Journal of Marine Science. 61, 2004.
10. Chen, Christopher, et al. Micropatterned Surfaces for Control of Cell Shape, Position, and
Function. Biotechnology. 1998, Vol. 14.
11. Curtis, Adam and Wilkinson, Chris. Topographical control of cells. Biomaterials. 1997,
Vol. 18.
12. Falconnet, Didier, et al. Surface engineering approaches to micropattern surfaces for cell-
based assays. Biomaterials. 2006, Vol. 27.
13. Ber, S., Kose, G. T. and Hasirci, V. Bone tissue engineering on patterned collagen films:
an in vitro study. Biomaterials. 2005, Vol. 26.
14. Kim, Se-Kwon and Mendis, Eresha. Bioactive compounds from marine processing
byproducts – A review. Food Research International. 2005, Vol. 39.
Chapter III. Fish Scales as Model for Osteogenic Cells Culture
58
15. Nagai, T. and Suzuki, N. Isolation of collagen from fish waste material - skin, bone and
fins. Food Chemistry. 1999, Vol. 68.
16. Arvanitoyannis, I. and Kassaveti, A. Fish industry waste: treatments, environmental
impacts, current and potential uses. International Journal of Food Science and Technology.
2008, Vol. 43.
17. Min, Byung-Moo, et al. Electrospinning of silk fibroin nanofibers and its effect on the
adhesion and spreading of normal human keratinocytes and fibroblasts in vitro. Biomaterials.
2004, Vol. 25.
18. Minoura, Norihiko, et al. Attachment and growth of fibrolast cells on silk fibroin.
Biochemical and Biophysical Research Communications. 1995, Vol. 208.
19. Wang, Yongzhong, et al. In vivo degradation of three-dimensional silk fibroin scaffolds.
Biomaterials. 2008, Vol. 29.
20. Ung-Jin, Kim, et al. Three-dimensional aqueous-derived biomaterial scaffolds from silk
fibroin. Biomaterials. 2005, Vol. 26.
21. Venugopal, L., et al. Biocomposite nanofibres and osteoblasts for bone tissue engineering.
Nanothecnology. 2008, Vol. 18.
22. Hyeon, Kim, et al. Bone tissue engineering with premineralized silk scaffolds. Bone. 2008,
Vol. 42.
23. Toai, T., et al. In vitro culture and differentiation of osteoblasts from human umbilical cord
blood. Cell Tissue Bank. 2010, Vol. 11.
24. Gimble, Jeffrey, Katz, Adam and Bunnell, Bruce. Adipose-Derived Stem Cells for
Regenerative Medicine. Circulation Research. 2007.
25. Qihai, Liu, et al. A comparative study of proliferation and osteogenic differentiation of
adipose-derived stem cells on akermanite and b-TCP ceramics. Biomaterials. 29, 2008.
26. Ikoma, T., et al. Physical properties of type I collagen extracted from fish scales of Pagrus
major and Oreochromis niloticas. Biological Macromolecules. 2003, Vol. 32.
27. Hughes, L. C., Archer, C. W. and Gwynn, ApI. The ultrastructure of mouse articular
cartilage: collagen orientation and implications for tissue functionality. A polarized light and
scanning electron microscope study and review. European Cells and Materials. 2005, Vol. 9.
28. Invitrogen. alamarBlue Assay. U.S. Patent No.5,501,959 Carlsbad.
29. Altman, G., et al. Silk-based biomaterials. Biomaterials. 2002, Vol. 24.

Chapter III. Fish Scales as Model for Osteogenic Cells Culture
59
30. Walboomers, X. F., et al. Growth behavior of fibroblasts on microgrooved polystyrene.
Biomaterials. 1998, Vol. 19.

Chapter III. Fish Scales as Model for Osteogenic Cells Culture
60

Chapter IV. General Discussion and Future Work
61
CHAPTER IV.
GENERAL DISCUSSION AND FUTURE WORK

Chapter IV. General Discussion and Future Work
62

Chapter IV. General Discussion and Future Work
63
General Discussion and Future Work
Scales of Lates calcarifer, also known as White Seabass, were collected in a market in
Thailand and were not submitted to any treatment till the start of this study. They were then
divided in three groups: untreated fish scales (G1); scales after a treatment for removal of
unnecessary proteins from the surface (G2); and a third group of scales after demineralization
and extraction of the soluble collagen (G3). The pattern of these scales was analyzed and the 3
groups presented a similar organized pattern consisting mainly of parallel concentric lines and
highly composed of collagen, being the pattern in G3 less incisive due to the soluble collagen
extraction.
The potential of the 3 groups of scales created as scaffolds for cell proliferation and the
behavior of osteoblasts MG63 were evaluated. To draw conclusions about it, fibroin films with the
same pattern of the scales and without any pattern were also created. The scales showed the
ability to support cell proliferation obtaining better results than the fibroin samples, both with and
without pattern, being this mostly due to their composition of hydroxyapatite and collagen [1] [2].
The scales of G2 (without undesirable proteins on the surface but still with the presence of high
quantity of collagen) were the ones that supported the highest cell proliferation. The ALP test
results indicated that osteoblasts on the scales presented some activity after 14 days of cell
culture, although this activity was practically inexistent for the fibroin films. The scales of G2 were
again the ones presenting more promising results. Analysis of the samples in the Confocal
Microscope and SEM were conclusive about the osteoblasts behavior on the fish scales. The cells
presented an orientation according to the scales pattern alignment, acquired an elongated and
strait shape. Then, the mechanical stress [3] granted by the scales pattern played a determinant
role in the osteoblasts shape and in the way of their distribution, being this phenomenon
denominated as contact guidance [4].
The culture of stem cells (hASCs) on fish scales presented accordant results with the
previously tested osteoblasts behavior. The scales pattern still guided, oriented and led the cells
to acquire a narrow and elongated shape at least till the cells superposition surpassed the
grooves of the pattern. The stem cells behavior was similar when the samples were submitted
both to a basal culture medium and osteogenic culture medium.
Chapter IV. General Discussion and Future Work
64
Tissue regeneration is a three dimensional event and in this context the presence of
patterns in biomaterials could be helpful with the cells guidance. Then, scales pattern presence
could shorten the tissue formation and the cells reorganization period.
In this work, also collagen films with a pattern similar to the fish scales were achieved.
Although the cross-linking method used using Genipin was not enough to guise the collagen
hydrophilic nature that led to films deterioration via hydrolysis after some time immersed in
culture medium for example. This would also make it difficult to use in long-term applications.
Ber et al. [5] tried to overcome this difficulty with the collagen films subjecting these to a variety
of stabilization treatments. They observed that calcium phosphate deposition was a very good
treatment method, so in future works the collagen films should be submitted to this treatment to
acquire a greater capability to resist in the presence of water. Curiously the films would also get a
similar arrangement to the fish scales, being composed of collagen and calcium phosphate.
Fish scales pattern showed great potential both for osteoblasts MG63 and stem cells
(hASCs), although further studies should be performed to conclude about the hASCs osteogenic
activity when submitted to the fish scales pattern. For future work is believed that this pattern or
adaptations of this depending on the purpose should be tested.

Chapter IV. General Discussion and Future Work
65
References
1. Zhu, D., et al. Structure and Mechanical Performance of a „„Modern‟‟ Fish Scale. Advanced
Engineering Materials. 2011.
2. Pati, Falguni, Adhikari, Basudam and Dhara, Santanu. Isolation and characterization of
fish scale collagen of higher thermal stability. Bioresource Technology. 101, 2010.
3. Falconnet, Didier, et al. Surface engineering approaches to micropattern surfaces for cell-
based assays. Biomaterials. 2006, Vol. 27.
4. Alves, Natália M., et al. Controlling Cell Behavior Through the Design of Polymer Surfaces.
Small. 6, 2010, Vol. 20, Polymer Surfaces, pp. 2208-2220.
5. Ber, S., Kose, G. T. and Hasirci, V. Bone tissue engineering on patterned collagen films:
an in vitro study. Biomaterials. 2005, Vol. 26.

66
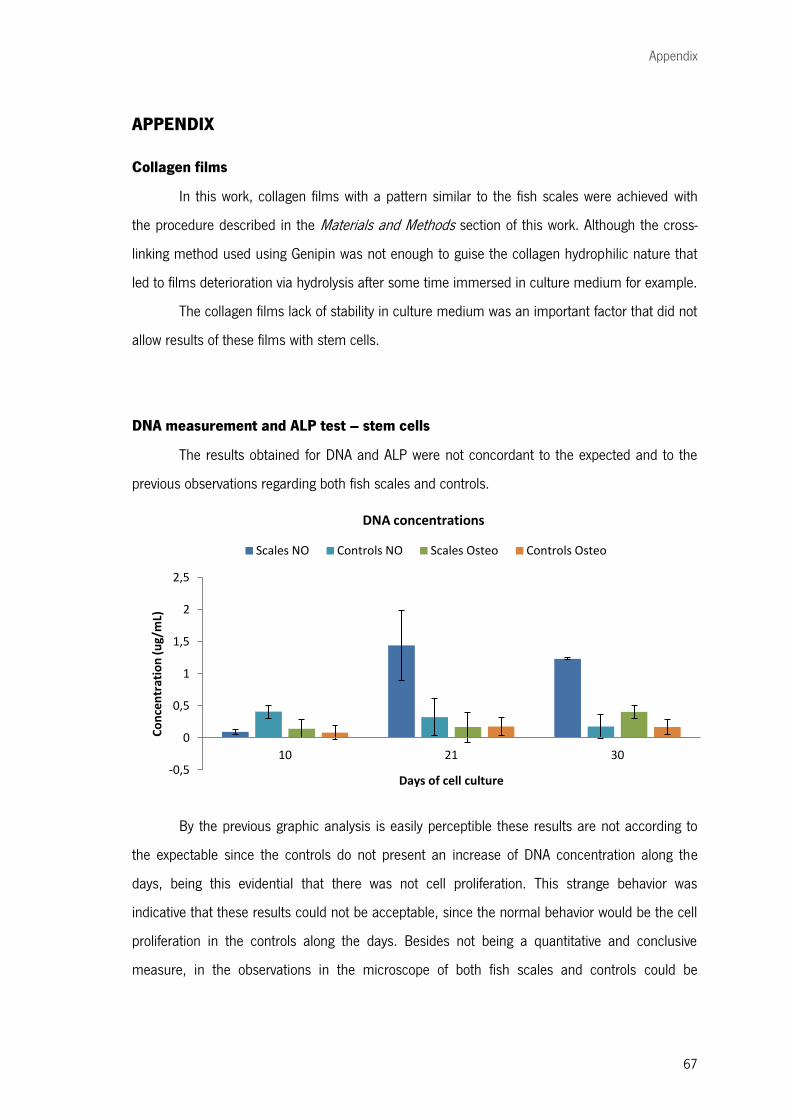
Appendix
67
APPENDIX Collagen films
In this work, collagen films with a pattern similar to the fish scales were achieved with
the procedure described in the Materials and Methods section of this work. Although the cross-
linking method used using Genipin was not enough to guise the collagen hydrophilic nature that
led to films deterioration via hydrolysis after some time immersed in culture medium for example.
The collagen films lack of stability in culture medium was an important factor that did not
allow results of these films with stem cells.
DNA measurement and ALP test – stem cells
The results obtained for DNA and ALP were not concordant to the expected and to the
previous observations regarding both fish scales and controls.
By the previous graphic analysis is easily perceptible these results are not according to
the expectable since the controls do not present an increase of DNA concentration along the
days, being this evidential that there was not cell proliferation. This strange behavior was
indicative that these results could not be acceptable, since the normal behavior would be the cell
proliferation in the controls along the days. Besides not being a quantitative and conclusive
measure, in the observations in the microscope of both fish scales and controls could be
-0,5
0
0,5
1
1,5
2
2,5
10 21 30
Co
nce
ntr
atio
n (
ug/
mL)
Days of cell culture
DNA concentrations
Scales NO Controls NO Scales Osteo Controls Osteo

Appendix
68
perceptible cell growth and the existence of higher cell density along the days that contradict
these results.
Since the ALP test was performed over the same samples of the DNA test, and the
results are also directly connected to the DNA results, no assertive conclusions could be taken
about the cellular activity.
Immunocytochemistry test – stem cells
This test was performed to identify the presence of osteocalcin that would be an
indicative of cell mineralization since it is a secreted protein associated with the mineralized
matrix of bone.
The results obtained of this analysis were not clear since fish scales presented auto-
fluorescence that can be due to their highly mineralized structure. This did not allow clear and
perceptible results regarding the fish scales. Nevertheless with the controls consisting of
coverslips was already possible a better observation of the presence of osteocalcin since these
did not present a background prejudicing the observation. The images got for these controls are
nextly presented.
-0,5
0
0,5
1
1,5
2
2,5
3
10 21 30
ALP
/D
NA
(u
mo
l/u
g)
Days of cell culture
ALP/DNA
Scales NO Controls NO Scales Osteo Controls Osteo
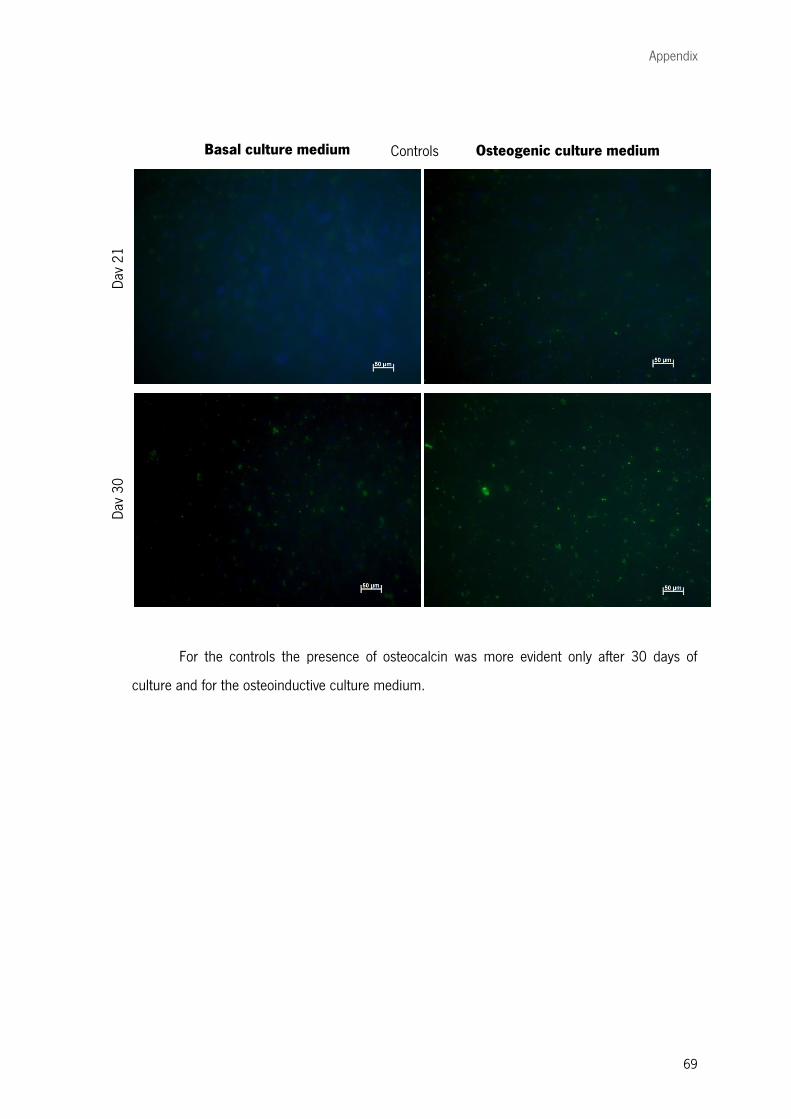
Appendix
69
For the controls the presence of osteocalcin was more evident only after 30 days of
culture and for the osteoinductive culture medium.
Day
21
Day
30
Basal culture medium Osteogenic culture medium Controls