PORTUGUÊS ESTRUTURADO E PSEUDOCÓDIGO Rui Hilário Aplicações Informáticas.

155
Ronderson Queiroz Hilário and Gilberto Fernandes
REM, Int. Eng. J., Ouro Preto, 74(2), 155-163, apr. jun. | 2021
Ronderson Queiroz Hilário1,3
https://orcid.org/0000-0002-0809-9792
Gilberto Fernandes2,4
https://orcid.org/0000-0002-4658-369X
1Universidade Federal de Minas Gerais – UFMG,
Escola de Engenharia, Departamento de
Engenharia de Transportes e Geotecnia,
Belo Horizonte – Minas Gerais - Brasil.
2Fundação Gorceix, Departamento de Análises e
Inovações - DEPAI, Laboratório de Teste de Material
para Ferrovias, Ouro Preto – Minas Gerais - Brasil.
E-mails: [email protected], [email protected]
Use of dynamic ballast testing equipment for analysis of rail aggregate breakdownAbstract
The granulometric range used has a direct influence on the life of the ballast layer when subjected to the load generated by rail traffic. However, in Brazil, we have only two size ranges to be used. The publications related to the subject matter under study express the need for a continuous grain size strip, different from the ones usu-ally used in our railways. This more continuous band would provide less deformation and a reduction of degradation, granting a longer ballast life. To verify the influence of granulometry, a Dynamic Ballast Test Equipment was used to simulate railway traf-fic. The results show that if we use a more uniform granulometry, a direct influence on the deformation and the breakage index is evidenced, and consequently, a shorter useful life. The study highlights the need to study continuous granulometric bands for the rail ballast.
Keywords: railway ballast, dynamic ballast equipment, uniform granulometry.
http://dx.doi.org/10.1590/0370-44672020740076
Civil EngineeringEngenharia Civil
1. Introduction
A railway bed is divided between infrastructure and superstructure. The infrastructure consists of earthworks, as well as all the necessary services to be performed below the earthworks. The superstructure is made up of the follow-ing main elements: sub-ballast, ballast, sleepers, and rails. The latter constitutes the support and rolling surface of railway vehicles (Brina, 1988).
Regarding the granulometric range to be used as ballast, the gravel cannot have large dimensions, as it can function as “wedges” and the leveling of the road would not last for a long time. However, exceedingly small dimensions could cause the gravel to “clog”, causing one of its functions, drainage, to be impaired (Brina, 1988).
According to Paiva (2016), ballast has the following functions: to ensure good drainage, preventing sleepers from being immersed in water; ensure good elasticity to the track, acting as a damper of vibrations from the trains, thus allow-ing a smooth and comfortable traffic; ensure a firm and stable support for the sleepers, absorbing and transmitting the loads to the layers below; prevent sleepers from moving, either in the longitudinal or transverse direction; and ensure speed and efficiency in road maintenance, be it mechanical or manual in leveling and tracing the railroad.
According to Fernandes (2005), de-formations in a railway pavement can be: elastic or resilient (deflections) and plastic or permanent (Sinking). Traditionally, it is
considered permanent deformation to be maintained on the roads, since they are responsible for the unevenness of the road without the presence of traffic.
For the determination of stresses and deformations in all elements of a track, it is important to understand the mechanical behavior of a railway. However, it is not an easy problem to understand because the number of variables that we do not know is large. An example of this is the wide variety of properties of granular media along the entire route. To carry out the analysis of the mechanical behavior of the railway, it must be divided into two stages. The first must be done on the tracks with a constant inertia beam. The next step is analyzing the response of the base that supports the rail, which is formed by
REM, Int. Eng. J., Ouro Preto, 74(2), 155-163, apr. jun. | 2021156
Use of dynamic ballast testing equipment for analysis of rail aggregate breakdown
support plates, rails, sleepers, ballast, and sub-ballast (Bathrust, Keer, 1995).
According to Selig and Waters (1994), the appearance of fines in the ballast layer does not depend only on the rock matrix that is being used as ballast on the track, it also depends on what pur-pose the track is being used for. Analyses were carried out on ballast materials on several railroads in the North American continent, and it was found that approxi-mately 76% of fines present in the road, came from ballast degradation. Of the other 24%, 13% were particles from layers below the ballast, such as sub-ballast or an old ballast layer, 7% from other sources, which entered the ballast layer through
the surface, 3% from the ballast layer. subgrade and 1% of the natural wear of the sleeper.
When we study bands used in other countries, we find that there are many more bands of use. This means that for each type of material and load, the behav-ior and useful life of the ballast becomes different. In some cases, in Brazil, we import granulometric bands used in other countries, especially in the United States, even though we know that the stone char-acteristics of the materials are different. That is why this study is important.
The general objective of the re-search was to develop a methodology and technical procedure for analyzing
the mechanical behavior of railway bal-lasts, using the Dynamic Ballast Testing Equipment, and using as a fundamental criterion for the study, optimization and development of tests reproducing the real scale of the area of focus in order to verify the effect of the granulometry used as ballast in its mechanical behavior, through a cyclic loading.
From the objective described above, the specifics are to analyze the mechanical behavior of the ballast through tests on the Dynamic Ballast Test Equipment - EEDL, and to ana-lyze the deformability parameters and the ballast break index for the particle size studied.
2. Materials and methods
3. Sample preparation for analysis in dynamic ballast test equipment
The present study was developed in an experimental way to verify the ef-ficiency of the particle size range used in Brazil (ABNT Track A).
With the results of the ballast break-age index, we verified the breakage of different sizes of aggregates when sub-jected to a cyclic load of 20 tons/wheel. The reason for using this load is that the equipment was designed to consider the
worst load situation in Brazil, which is the Carajás Railway that has a load capacity of 40 tons/axle, that is, 20 tons / wheel.
The ballast material used was col-lected in a quarry in the city of Santa Bárbara - MG. Its collection took place in the ballast pile that is located inside the company. The collection was carried out in accordance with Annex G of NBR ABNT 5564/2014.
Sub-ballast and sub-grade materi-als are also sourced from the North-South Railway.
The tests carried out on the sub-ballast and subgrade materials were: DNER ME 051/94; DNER ME 122/94; DNER ME 082/94; DNIT 164/2013 ME; DNIT 172/2016 ME. The ballast material characterization tests were those specified by NBR ABNT 5564/2014.
The particle size band was placed on the Dynamic Ballast Testing Equipment, to verify the particle size efficiency, study-ing its breakage index and the ballast use-ful life. With this study, it was possible to verify that the ballast's useful life and its breakage index are directly influenced by the granulometric range used. That is why equipment analysis is important.
Typical requests (in terms of stress-es) of a railway structure were reproduced using a metal box to model the layers of what is usually projected on the railway infrastructure. This state-of-the-art cyclic load application equipment was designed and built to investigate the strength, defor-mation and degradation characteristics of ballast, sub-ballast, subgrade, sleeper, and rails under cyclic loading. The sequence of layer thicknesses is described below. The choice of these thicknesses was based on a type section of a real railway:
• Subgrade: 35 cm;• Sub-ballast: 20 cm;• Ballast: 30 cm below the underside
of the sleeper.For the preparation of the subgrade
and sub-ballast layers, it was necessary to
leave the materials at optimum moisture content before compaction. The materials at the optimum moisture content were taken to be compacted in the equipment, first the subgrade and then the sub-ballast. Immediately after compacting the subgrade layer, the settlement rods were positioned in the appropriate places. These two rods are used to measure the repression of the subgrade layer. To avoid friction between the stem/soil, PCV tubes were placed on each stem. After this process, the sub-ballast was compacted, and two more rods were positioned. These are for the purpose of measuring the settlement of the sub-ballast layer. To make sure that the layer was ready and compacted correctly, two tests were performed: Speedy and the Sand Jar. The standard used to certify the values were ISF-207/2017 and the Infrastructure Services Specification - Landfill (VALEC, 2017). After these two layers were ready, the ballast was sieved according to the granulometry to be analyzed. It was ho-mogenized and placed inside the metal box. As soon as the ballast was posi-tioned, manual crushing of the gravel was
carried out. When it reached a height of 30 cm, the sleeper was positioned in place along with the rail and fasteners. After this sequence, the extensometers were positioned on the four rods and two on the sleeper. The strain gauges positioned on the sleeper are used to measure how much the ballast is repressing.
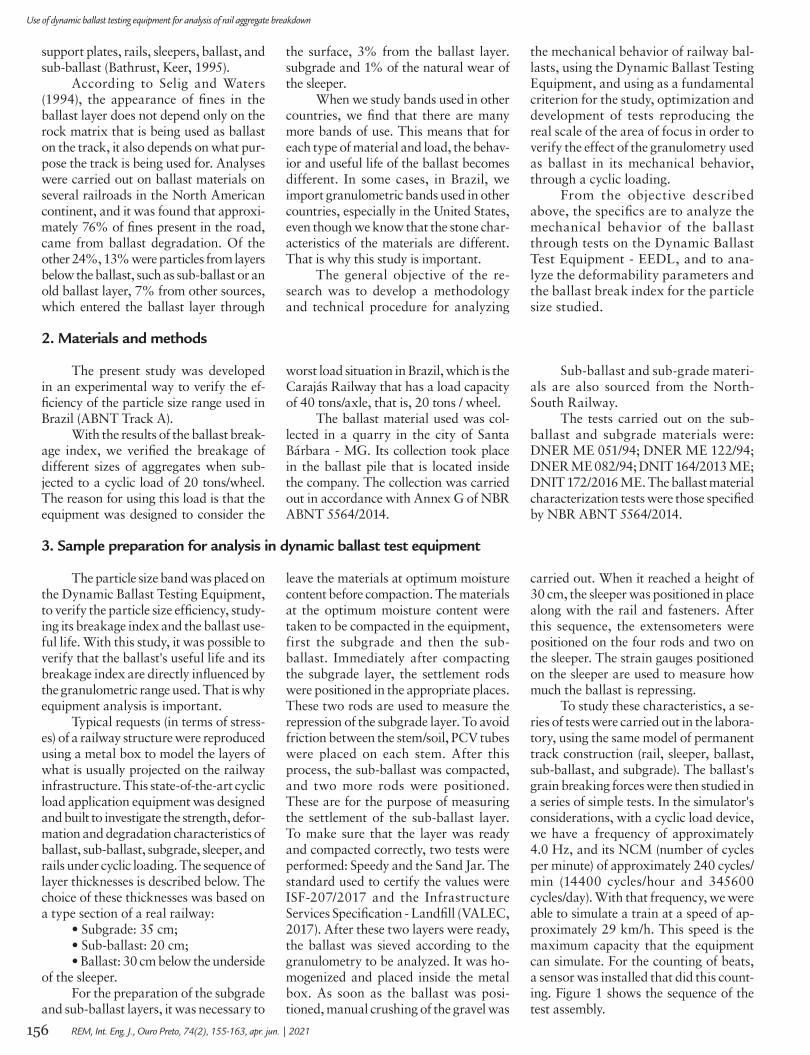
To study these characteristics, a se-ries of tests were carried out in the labora-tory, using the same model of permanent track construction (rail, sleeper, ballast, sub-ballast, and subgrade). The ballast's grain breaking forces were then studied in a series of simple tests. In the simulator's considerations, with a cyclic load device, we have a frequency of approximately 4.0 Hz, and its NCM (number of cycles per minute) of approximately 240 cycles/min (14400 cycles/hour and 345600 cycles/day). With that frequency, we were able to simulate a train at a speed of ap-proximately 29 km/h. This speed is the maximum capacity that the equipment can simulate. For the counting of beats, a sensor was installed that did this count-ing. Figure 1 shows the sequence of the test assembly.

157
Ronderson Queiroz Hilário and Gilberto Fernandes
REM, Int. Eng. J., Ouro Preto, 74(2), 155-163, apr. jun. | 2021
Table 1 below shows the results of the percentage of material retained in the
subgrade and sub-ballast sieves. Table 2 shows the results of typical particle sizes
and Cu (Non-Uniformity Coefficient), Cc (Curvature coefficient).
Having identified that the materials under study are predominant in the sand fraction, we move on to the next analysis. The sub-ballast material has a higher per-centage of gravel. Soils can be well graded or poorly graded. When the soil is well graded, it presents grains in different diam-eters, which may indicate a better behavior
for its use in engineering. When we have the presence of smaller particles, these oc-cupy the voids corresponding to the larger grains, creating an overlap, causing less compressibility and consequently greater resistance. For that, we analyzed the values of Cu and Cc. By the calculated values, we can conclude that the granulometric curves
of the subgrade and sub-ballast materi-als are non-uniform and poorly graded. Regarding the Cu value, it shows us soils that have a granulometric distribution that allows a good use in engineering works, since it presents grains in different sizes.
Table 3 presents the values of the Atterberg limits.
Sieve 3/4" 3/8" 4 10 16 30 40 60 80 200
% Passing - Subgrade 100 98.45 97.38 96.5 96.31 95.82 91.42 73.48 54.94 30.31
% Passing – Sub-ballast 99.32 85.12 73.47 59.97 51.01 45.33 42.77 34.87 28.78 18.74
Layer D10 (mm) D30 (mm) D50 (mm) D60 (mm) Cu Cc
Subgrade 0.006 0.02 0.151 0.17533 31 0.42
Sub-ballast 0.08 0.19 1.20 2.00485 25 0.22
Layer LL (%) PL (%) PI (%)
Subgrade 23.4 19 4.4
Sub-ballast N/A N/A N/A
Table 1 - Results of the granulometry test.
Table 2 - Results of typical particle sizes and Cu, Cc.
Table 3 - Atterberg limits.
4. Results and analysis
4.1 Subject and Sub-Ballast
Figure 1 – a) Repression rods positioned on top of the subgrade layer; b: Booster rods positioned on top of the sub-ballast layer; c) placing the gravel; d) installation of the sleeper, rail and fastening elements; e) installed strain gauges; f) beat sensor and counter.
(a)
(f)
(b) (c)
(e)(d)
Although the subgrade material has a predominance of the sand fraction, which could cause the material not to have

REM, Int. Eng. J., Ouro Preto, 74(2), 155-163, apr. jun. | 2021158
Use of dynamic ballast testing equipment for analysis of rail aggregate breakdown
For the subgrade layer, the compaction energy to be used is normal, the expansion value must be less than or equal to 2% and CBR must be greater than 5%, according to ISF-207/2017 and the Specification of Infra-structure Services - Landfill (VALEC, 2017) for landfill body. According to Pinto (2006), fine lateritic clay sands, even if the sand frac-tion is poorly graded, can present optimum humilities of 12 to 14%, with maximum dry specific masses of 1.9 g / cm³. The material under study had an optimum humidity (Wót) of 14.4% and a dry specific mass (ρmáx) of 1.896 g/cm³. This shows that the material fits the materials of the same specificities. Accord-ing to Santos (2017), for fine soils, including
sandy soils, the CBR ranges from 8 to 20%. According to the Railway Service Instruction Permanent Track Superstructure Project - Ballast and Sub-ballast (ISF-212/2015) and the Infrastructure Services Specification - VALEC Landfill (2017), energy to be used in the test must be the intermediate and the CBR value must be equal to or greater than 20%, with a maximum expansion of 1%. According to Pinto (2006), for soils where the fractions of sand with gravel, well graded and not very clayey, present high maximum dry specific masses, in the order of 2.0 to 2.1 g / cm³. Regarding the optimum moisture content, its value is also low, in the order of 9 to 10%. The material under study showed
an optimum humidity of 8.8% and a dry density of 2.308 g / cm³. This shows that the material fits the materials of the same speci-ficities, since the values found were close to the technical reference.
According to Santos (2017), for coarse soils, such as boulders and graded gravel, the CBR values are above 50%. The soil under study has an awfully close fraction of gravel and sand, and the CBR value was close to 50%. The CBR value was given by the fact that the sub-ballast material has a predomi-nance of more granular materials (sand + gravel). According to the TRB classification (A-1-b), the CBR of the material, the CBR values vary from 20 to more than 80.
4.3 Ballast characterization
4.2 Subject and Sub-ballast – compaction, California Bearing (CBR) ratio and expansion The Transportation Research
Board (TRB) classification of the sub-grade was A-2-4 and the sub-ballast material was A-1-b. Table 4 presents
the results of the compaction, CBR and materials expansion tests.
Table 5 shows the ballast classification results.
Table 5 – Ballast characterization results.
Test Result
Average particle shape Cubic
Non-cubic particles 1%
Apparent specific mass 2640 kg/m³
Water absorption 0.30%
Apparent Porosity 0.78%
Weather resistance 1.65%
Resistance to axial compression 164.56 MPa
Shock resistance 15.18%
Content of soft and friable fragments 0.1%
Powdery material 0%
Clay clods 0.05%
Unit mass limit 1.33 g/cm³
Wear resistance - Abrasion Los Angeles 22.2%
Layer Wót (%) ρmáx (g/cm³) Expansion (%) CBR (%)
Subgrade 14.4 1.896 0 17.5
Sub-ballast 8.8 2.308 0.02 45.3
Table 4 - Compression, CBR and Expansion.
Based on the results presented, the ballast material meets the specifications of the NBR ABNT 5564/2014 standard.
plasticity, since sand has no cohesion, yet a PI value was found. The fact of having some plasticity is because the material has 30.31% of particles passing through the 0.075 mm sieve. With this, we can con-clude that the material under study meets the requirements to be used as a subgrade layer. Regarding the results of LL (Liquidity
Limit) and PI (Platicity Index) of the sub-ballast, we can conclude that because the fraction of sand and gravel are predomi-nant, it showed us that the soil has no plas-ticity. This is in line with the sand material. Sand has no cohesion, so it does not have plasticity. The Railway Service Instruction - Permanent Track Superstructure Project -
Ballast and Sub-ballast (ISF-212/2015) and the VALEC 2017 Infrastructure Services Specification - Sub-ballast recommend that the maximum value of the LL should be 25 % and the maximum PI value must be 6%. Regarding the results of these param-eters found, the materials are to be used, since they fit the specifications.

159
Ronderson Queiroz Hilário and Gilberto Fernandes
REM, Int. Eng. J., Ouro Preto, 74(2), 155-163, apr. jun. | 2021
The first tests that were carried out during the assembly of the equipment were
the tests of moisture content and degree of compaction in the layers of subgrade and
sub-ballast. The results are described in Table 6 below.
Table 7 shows the results of typical particle sizes, Cu, Cc and Fineness Module.
Granulometry D10 (mm) D30 (mm) D50 (mm) D60 (mm) Cu Cc
FINENESS MODULE
ABNT Initial 28.00 32.00 40.00 41.00 1.46 0.89 8.53
ABNT final 26.00 31.00 38.00 40.00 1.54 0.92 8.39
Figure 2 shows the granulometric curves of the initial and final cycle of Track A of ABNT.
Figure 2 – Granulometric curve of the initial and final cycle ABNT.
Table 7 – Results of typical particle sizes, Cu, Cc and Fineness Module.
Analyzing the Cu and Cc results of the tests, we can see that the initial particle size curve has a very uniform and poorly graded curve. When comparing with the result at the end of the cycles, there was an improvement in the parameters of Cc and Cu. The curve approached a better graded material. Regarding Cu, there was also an increase in this parameter, but the curve remained very uniform.
According to the unified classifica-tion, coarse materials, such as rail ballast, for Cu values greater than 4 and Cc between 1 and 3 are considered well graded. How-ever, Indraratina and Salim (2002) recom-mend that the ideal value for Cu should be between 2.3 and 2.6. These values provide
a reduction in permanent deformation and breakage, without compromising the drainage of the road. Cu values usu-ally range from 1.7 to 2.0. Regarding the Curvature Coefficient, the strip presented a badly graded curve. Knowing this, com-paring the Cu value found in the initial and final granulometry, the result started to be closer to that recommended by Indraratina and Salim (2002).
Analyzing the results, the grain size range needs to be better distributed, as this way, there will be a better overlapping of the grains. They will have a greater friction angle and a greater resistance to deformation. An example of this is a re-search by Muniz (2002), who questioned
the granulometric range used by ABNT NBR 5564 because, according to him, it is very uniform with a predominance of materials in the upper sieves, making the ballast break more significant.
The fineness modulus of the initial curve was 8.53. The fineness module evaluates whether the ballast is thicker or thinner, and the higher this value, the heavier the material.
The fineness modulus of the final cycle curve was 8.39. Compared to the fineness module of the initial cycle, there was a reduction. The material became thinner, with the voids being filled by these finer materials. The greater quantity of materials of smaller particle size, causes
4.4 Dynamic Ballast Testing Equipment – EEDL
Subgrade Sub-ballast
Moisture content (%) 14.28 8.67
Degree of Compaction (%) 100.22 100.29
Table 6 – Results of the tests of moisture content and degree of compaction.

REM, Int. Eng. J., Ouro Preto, 74(2), 155-163, apr. jun. | 2021160
Use of dynamic ballast testing equipment for analysis of rail aggregate breakdown
Table 8 – Behavior of granulometry by test cycle - ABNT.
Table 9 – Material breakdown by weight cycle - ABNT.
Analyzing the evolution behavior of the ballast break, we can observe an exces-sive material break in the 2” sieve, going from 4.63% initially to 3.32% at the end of the 500,000 beats cycle. This represents a reduction of 7,470 grams in weight and a percentage reduction of 28.4% in rela-tion to the initial value. The break in the material of the 1 ½” sieve started quite accentuated, with a stabilization in the break percentage between the cycle of 100,000 to 300,000. Between the cycle of 300,000 and 400,000, there was again a significant drop, returning to a stabiliza-tion of its break. Comparing the initial and final values, the reduction in the amount
of ballast in the 1 ½” sieve was 11.43%. This percentage is equivalent to 32,983.0 grams. Regarding the material retained in the 1” sieve, there was an increase in the percentage retained. In terms of weight, there was an increase of 12,903.0 g, which represented in percentage an increase of 5.1% of material in relation to the initial. If we analyze the amount of material that broke in the 2” and 1 ½” screens, this break resulted in an increase of 12,903.0 grams in the 1” screen. The sum of the breakage of these two sieves was 40453 grams, compared to the initial value with the final one. In the ¾” sieve, initially there was no material. As the cycles passed, the
percentage retained increased to 3.8%. That in weight, the accumulated was 21,298.2 grams. Analyzing the amount of material retained in the 1” sieve, there was a significant increase in relation to the ini-tial cycle compared to the final one, show-ing that the application of the 20-ton load had less interference in this material. This load interference was more pronounced in the screens above (2” and 1 ½”), where there was a considerable reduction in these screens. And the breakdown of materials presents in these two screens, the big-gest accumulation was in the screens of 1” (12,903.0 grams) and ¾” (21,298.2 grams). The material present in the 1/2"
Sieves Retained Material (%)
Number (mm) Initial 100,000 200,000 300,000 400,000 500,000
2 1/2" 63 0.00 0.00 0.00 0.00 0.00 0.00
2" 50 4,63 4.12 3.78 3.63 3.56 3.32
1 1/2" 38 50.76 47.39 47.17 47.09 45.19 44.95
1" 25 42.30 44.31 44.29 43.52 45.18 44.68
3/4" 19 0.00 1.74 2.44 3.49 3.64 4.38
1/2" 12.5 2.31 2.13 1.81 1.48 1.34 1.32
3/8" 9.5 0.00 0.03 0.06 0.07 0.08 0.12
1/4" 6.3 0.00 0.07 0.09 0.12 0.14 0.19
4 4.8 0.00 0.03 0.04 0.10 0.11 0.14
200 0.074 0.00 0.14 0.24 0.36 0.59 0.64
Flange 0.00 0.04 0.07 0.14 0.17 0.27
Total 100.00 100.00 100.00 100.00 100.00 100.00
Sieves Retained Material (g)
Number (mm) Initial 100,000 200,000 300,000 400,000 500,000
2" 50 26,328.0 23512.0 21,501.0 20,629.0 20,231.0 18,858.0
1 1/2" 38 288,518.0 269365.0 268,155.0 267,655.0 256,867.0 255,535.0
1" 25 240,476.0 251899.0 251,760.0 246,886.0 256,844.0 253,379.0
3/4" 19 0.0 9879.0 13,895.0 19,765.7 20,413.4 21,298.2
1/2" 12,5 13,127.0 11677.0 9,859.0 7,289.2 4,786.7 6,432.9
3/8" 9,5 0.0 501.0 743.0 1,599.8 2,466.8 2,253.9
1/4" 6,3 0.0 412.0 519.0 1,207.1 1,899.1 1,792.3
4 4,8 0.0 188.0 240.0 586.3 635.7 772.0
200 0,074 0.0 808.0 1,361.0 2,033.6 3,327.5 3,617.0
Prato 0.0 201.0 405.0 785.3 965.6 1,307.8
Total 568,449.0 568442.0 568,438.0 568,437.0 568,436.8 565,246.1
the void index to decrease, producing bet-ter imbrication of the grains, making the grain size curve more continuous.
Analyzing the breakage of the material together with the repression
of the layers, we can verify if there was an improvement in the parameter of de-formability of the ballast in relation to its breakage. We can see if the grain overlap was more efficient.
Table 8 shows the percentages retained in each sieve according to the number of cycles. Table 9 presents the results by breakdown by weight of materials per cycle.

161
Ronderson Queiroz Hilário and Gilberto Fernandes
REM, Int. Eng. J., Ouro Preto, 74(2), 155-163, apr. jun. | 2021
0 – 100,000 100,00 – 200,000 200,000 – 300,000 300,000 – 400,000 400,000 – 500,00
Initial Final Initial Final Initial Final Initial Final Initial Final
Rod 1 (ballast) 0 16.01 0 14.15 0 13.13 0 11.55 0 11.16
Rod 2 (subgrade) 0 0.05 0.05 0.06 0.06 0.06 0.06 0.06 0.06 0.06
Rod 3 (sub-ballast) 0 0.19 0.19 0.20 0.20 0.20 0.20 0.20 0.20 0.20
Rod 4 (sub-ballast) 0 0.18 0.18 0.19 0.19 0.19 0.19 0.19 0.19 0.19
Rod 5 (subgrade) 0 0.07 0.07 0.08 0.08 0.08 0.08 0.08 0.08 0.08
Rod 6 (ballast) 0 16.04 0 14.04 0 13.05 0 11.47 0 11.22
Table 10 – Layers settlement (mm) - ABNT.
Table 11 – Variation of settlement of layers (%) - ABNT.
Rod 1 (ballast)
Rod 2 (subgrade)
Rod 3 (sub-ballast)
Rod 4 (sub-ballast)
Rod 5 (subgrade)
Rod 6 (ballast)
Final 100,000 Cycles/Final 200,000 cycles 12.24 20.00 5.26 5.55 14.29 12.47
Final 200,000 Cycles/Final 300,000 cycles 6.54 0.00 0.00 0.00 0.00 7.05
Final 300,000 Cycles/Final 400,000 cycles 12.03 0.00 0.00 0.00 0.00 12.10
Final 400,000 Cycles/Final 500,000 cycles 3.37 0.00 0.00 0.00 0.00 2.18
By doing a joint analysis of the material breakdown and the repression of the ballast layer, we can verify that the repression of the material had a reduction in the initial cycle compared to the end. One of the hypotheses is that there was an improvement in the mosaic of the grain overlap, making it work better on its deformability, making the fit between the grains more efficient. This is best demonstrated by the reduc-tion of the material's fineness module. There was a filling of the voids with the material that broke. When we analyzed the percentage of settlement by cycle, as shown in Table 11, we noticed that the biggest differences were when there was a significant break in the material. When this break was not so marked, the difference in settlement was small.
The hypothesis that the reduction of the repression of the initial cycle in comparison to the final cycle is related to the increase in fines can be discarded be-cause the number of fines produced was little. The breakdown of the material oc-curred because the granulometric curve is not ideal to be used for rail ballast.
The fineness module shows us a very coarse material, with little or no presence of materials with a slightly smaller particle size. This caused the number of voids to be greater, so there are no fines to avoid minor grain-to-grain contact. With this greater contact, there was a greater contact between the grains, providing fractures in the ag-gregates, and consequently, the breaking of the material. By reducing the fineness module, there will be thinner materials
to better fill these empty spaces, auto-matically, making the layer work better, reducing permanent deformation and reducing ballast breakage. As previously described, Muniz (2002) questioned the ballast band used in Brazil, needing to carry out studies to use a more continu-ous curve. But for that, this strip will depend on the rock matrix that is being used and the load applied to the track.
With a standard for quantifying the fines present in the ballast layer, the index that was called “Fouling Index (Fi)” was proposed. If we translate this term into Portuguese, terms like transla-tion: contamination index. However, we must avoid using this term, as it can be understood as if the material has some type of contaminant. For this reason, it is advisable to use the term clogging
sieve had a reduction of approximately 51% comparing the initial quantity with the final quantity, in relation to its weight. The loss in grams was 6694.1. Initially in the 3/8” sieve there was no material. At the end of the cycles, 2,253.9 grams were retained in this sieve. In the ¼” sieve, initially there was no material retained; at the end of the cycle, it was
1792.3 grams. In the number 4 sieve (4.8 mm aperture), it has 772.0 grams. In the number 200 sieve (0.075 mm opening), 3,717.0 grams. And on the plate, 1,307.8 grams were retained. Adding up the amounts retained in these sieves, we came to 9743.0 grams. If we analyze the break in the ballast of the ½” sieve, it contributed with the
value of 6,694.1 grams. The value of 3,048.9 grams to complete the sum of 9,743.0 grams came from materials from sieves above ½”. Table 10 presents the results of the settlement of the lay-ers according to the cycles. Table 11 shows the variation of the settlement of the layers in percentage at the end of each cycle.

REM, Int. Eng. J., Ouro Preto, 74(2), 155-163, apr. jun. | 2021162
Use of dynamic ballast testing equipment for analysis of rail aggregate breakdown
and / or degradation, to indicate the presence of fines in the ballast layer. Fi is defined by the sum of percent-ages of passing material in the sieve of No. 4 (P4) and No. 200 (P200) (Selig
and Wates, 1994). Regarding the test on the Dynamic Ballast Test Equipment, it is possible to make a prediction of how many cycles will be necessary to make the ballast material unguarded. Sgavioli
et al (2015) present a solution to renew 50% of the contaminated ballast, which is the most economical for maintaining the layer. The following Table 12 shows the "Fi" values per cycle.
Table 12 – Fouling Index (Fi) at the end of each cycle.
Number of cycles
Granulometry 0 100,000 200,000 300,000 400,000 500,000
ABNT 0 0.21 0.38 0.63 0.93 1.17
Considering the forecast of a 50% breakdown of the ballast material, the
graph in the Figure 3 below shows a projection to reach this value.
Figure 3 – Graph of number of cycles x Fi.
Using the equation generated by the previous graph, the projection of
cycles of unmanning was made. Con-sidering the generation of 50% of fines,
we would need 25,018,350 to reach this percentage.
With the result of the material break, it was observed that a range rec-ommended by NBR ABNT 5564 (2014) is very uniform, which affects the ballast's useful life. This uniformity reduces the overlapping of the grains, which offers a greater break, as the elasticity of the trail is impaired. Studies show that we need a more continuous grain size range. A more continuous grain size would provide a better imbrication of the grains, that is, a better definition of the particles, causing less breaks, better elasticity and with that, an increase in the useful life
of the layer. In relation to the test on the Dynamic Ballast Testing Equipment, it proved to be efficient regarding the pro-posal to simulate rail traffic and provide the breaking of the ballast material.
This study presented above is in line with the proposal of the Dynamic Ballast Testing Equipment. In it, we can study several rocky matrices that are used in Brazilian railways, stipulating the useful life according to their break-age index. In addition to studying the best particle size ranges for materials, does not use only NBR ABNT 5564
(2014) Range A, which is the range for main lines or even less use granulo-metric ranges used in other countries that use stone materials with physical characteristics and mechanics different from ours. We can simulate rail traffic for years in a few months on laboratory equipment, which would reduce the costs of field studies. Knowing the use-ful life of the material that is being used as ballast, we can make a better study in relation to cycles of stripping, which can provide savings in the maintenance cost of the road.
I thank the Graduate Program in Geotechnics at the School of Mines of the
Federal University of Ouro Preto, CAPES and the Federal University of Minas Gerais.
5. Conclusions
Acknowledgments

163
Ronderson Queiroz Hilário and Gilberto Fernandes
REM, Int. Eng. J., Ouro Preto, 74(2), 155-163, apr. jun. | 2021
ASSOCIAÇÃO BRASILEIRA DE NORMAS TÉCNICAS. ABNT NBR 5564: Via férrea – Lastro ferroviário – Requisitos e métodos de ensaios. Rio de Janeiro: ABNT, 2014. 26 p.
BATHURST, L. A.; KEER, A. D. An improved analysis for the determination of required ballast depth. In: American Railway Engineering and Maintenande of Eay Association – Conference, 1995, Chicago, Illinois. Proceedings […]. Chicago: AREMA, 1995.
BRINA, H. L. Estradas de ferro. Rio de Janeiro: LTC, 1988.DEPARTAMENTO NACIONAL DE ESTRADAS DE RODAGEM. DNER-ME 082: Solos – determinação do
limite de plasticidade. Rio de Janeiro: DNER, 1994.DEPARTAMENTO NACIONAL DE ESTRADAS E RODAGEM. DNER-ME 093: Solos – análise granulométrica.
Rio de Janeiro: DNER, 1994.DEPARTAMENTO NACIONAL DE ESTRADAS E RODAGEM. DNER-ME 122: Limites de consistência. Rio de
Janeiro: DNER, 1994.DEPARTAMENTO NACIONAL DE INFRA-ESTRUTRA DE TRANSPORTES. DNIT 164 ME: Solos –
Compactação utilizando amostras não trabalhadas – Método de Ensaio. Rio de Janeiro: DNIT, 2013.DEPARTAMENTO NACIONAL DE INFRA-ESTRUTRA DE TRANSPORTES. DNIT 172 ME: Solos –
Determinação do Índice de Suporte Califórnia utilizando amostras não trabalhadas – Método de Ensaio. Rio de Janeiro: DNIT, 2016.
FERNANDES, G. Comportamento de estruturas de pavimentos ferroviários com utilização de solos finos e resíduos de mineração de ferro associados a geossintéticos. 2005. 282 f. Tese (Doutorado em Geotecnia) – Faculdade de Tecnologia, Universidade de Brasília, Brasília, 2005.
INDRARATNA, B.; SALIM, W. Modelling of particle breakage of coarse aggregates incorporating strength and dilatancy. Geotechnical Engineering, Proceedings of the Institution of Civil Engineers, London, v. 155, n. 4., p. 243-252, 2002.
INSTRUÇÃO DE SERVIÇO FERROVIÁRIO. ISF-207: estudos geotécnicos. Rio de Janeiro: DNIT, 2015.INSTRUÇÃO DE SERVIÇO FERROVIÁRIO. ISF-212: Projeto de superestrutura da via permanente: lastro e
sublastro. Rio de Janeiro: DNIT, 2015.MUNIZ, L. F. M. Fundamentos teórico-experimentais da mecânica dos pavimentos ferroviários e esboço de um
sistema de gerência aplicado à via permanente. 2002. 333 f. Tese (Doutorado em Engenharia Civil) - COPPE, Universidade Federal do Rio de Janeiro, Rio de Janeiro, 2002.
PAIVA, C. E. L. Super e infraestrutura de ferrovias: critérios para projetos. Rio de Janeiro: Elsevier: Campus, 2016.PINTO, C. S. Curso básico de mecânica dos solos: em 16 aulas. 3. ed. São Paulo: Oficina de Textos, 2016.SANTOS, L. D. F. Estudo do comportamento do solo melhorado com cimento. 2017. 55 f. Trabalho de Conclusão
de Curso (Bacharelado em Engenharia Civil) – Escola de Engenharia, Universidade Federal Fluminense, Niterói, 2017.
SELIG, E. T.; WATERS, J. M. Track technology and substructure management. London: Thomas Telford, 1994.SGAVIOLI, F.; BERNUCCI, L.; COSTA, R.; MOTTA, R.; MOURA, E. Análise do custo do ciclo de vida do lastro
ferroviário na estrada de ferro Vitória Minas. Transportes, v. 23, n. 4, p. 5-12, 2015.VALEC. Especificação de serviços de infraestrutura: Aterro. Brasília: VALEC - Engenharia, Construções e Ferrovias,
2017. 15 p.VALEC. Especificação de serviços de infraestrutura: Sub-lastro. Brasília: VALEC - Engenharia, Construções e
Ferrovias, 2017. 6 p.
References
All content of the journal, except where identified, is licensed under a Creative Commons attribution-type BY.
Received: 3 June 2019 - Accepted: 08 December 2020.