Purificação de Proteínas - Estratégias, handbook
167
GE Healthcare i i Strategies or Protein Puriication Handbook
-
Upload
denyse-cruz -
Category
Documents
-
view
213 -
download
0
Transcript of Purificação de Proteínas - Estratégias, handbook

8/22/2019 Purificação de Proteínas - Estratégias, handbook
http://slidepdf.com/reader/full/purificacao-de-proteinas-estrategias-handbook 1/167
GE Healthcare
i
Strategies orProtein Puri icationHandbook

8/22/2019 Purificação de Proteínas - Estratégias, handbook
http://slidepdf.com/reader/full/purificacao-de-proteinas-estrategias-handbook 2/167
Handbooksfrom GE Healthcare
GST Gene Fusion System
Handbook
18-1157-58
Afnity Chromatography
Principles and Methods
18-1022-29
Antibody Purication
Handbook
18-1037-46
Ion Exchange Chromatography and
Chromatofocusing
Principles and Methods
11-0004-21
Cell Separation Media
Methodology and Applications
18-1115-69
Purifying Challenging Proteins
Principles and Methods
28-9095-31
Isolation of mononuclear cells
Methodology and Applications
18-1152-69
High-throughput Process Developmentwith PreDictor Plates
Principles and Methods
28-9403-58
Gel Filtration
Principles and Methods
18-1022-18
Recombinant Protein Purication Handbook
Principles and Methods
18-1142-75
Hydrophobic Interaction and
Reversed Phase Chromatography
Principles and Methods
11-0012-69
2-D Electrophoresis using
immobilized pH gradients
Principles and Methods80-6429-60
Microcarrier Cell Culture
Principles and Methods
18-1140-62
Nucleic Acid Sample Preparation for
Downstream Analyses
Principles and Methods
28-9624-00
Strategies for Protein Purication
Handbook
28-9833-31

8/22/2019 Purificação de Proteínas - Estratégias, handbook
http://slidepdf.com/reader/full/purificacao-de-proteinas-estrategias-handbook 3/167
28-9833-31 AA 1
Strategies for
Protein PurificationHandbook

8/22/2019 Purificação de Proteínas - Estratégias, handbook
http://slidepdf.com/reader/full/purificacao-de-proteinas-estrategias-handbook 4/167
2 28-9833-31 AA
Contents
Introduction..........................................................................................................................................5Common acronyms and abbreviations used in this handbook ..................................................................5Chromatography terminology ....................................................................................................................................7Symbols used in this handbook .............................................................................................................................. 11
Chapter1Briehistoryoproteinpurifcation...............................................................................................13Advances in methodology ......................................................................................................................................... 13New chromatography media ..................................................................................................................................13Genomics and proteomics ......................................................................................................................................... 14Where we are today ....................................................................................................................................................14
Chapter2Proteinpurifcationmethods..........................................................................................................17Afnity chromatography (AC) .................................................................................................................................... 17
Immobilized metal ion afnity chromatography (IMAC) ............................................................................... 20Gel ltration (GF) .............................................................................................................................................................. 21Ion exchange chromatography (IEX) ..................................................................................................................... 23Hydrophobic interaction chromatography (HIC) ............................................................................................. 25Chromatofocusing ......................................................................................................................................................... 27Reversed phase chromatography (RPC) .............................................................................................................. 28
Chapter3Desalting,buerexchange,andproteinconcentration............................................................31GF for desalting, removal of low-molecular-weight substances, and buffer exchange .............. 31Other methods for desalting and buffer exchange ....................................................................................... 36
Protein concentration using ultraltration ......................................................................................................... 37Other methods for protein concentration .......................................................................................................... 38
Chapter4Purifcationstrategies......................................................................................................................39Three-stage purication strategy (CIPP) .............................................................................................................. 39Capture................................................................................................................................................................................41Intermediate purication ............................................................................................................................................ 42Polishing.............................................................................................................................................................................. 44Selection and combination of purication methods .................................................................................... .45
Chromatography media .............................................................................................................................................. 49Chapter5Planning...............................................................................................................................................51Dene objectives ............................................................................................................................................................ 52Describe properties of the target protein and critical impurities ............................................................54Develop analytical assays .......................................................................................................................................... 55Create a purication table ......................................................................................................................................... 56
Chapter6Samplepreparation..........................................................................................................................57Source materials ............................................................................................................................................................. 58Cell harvesting and extraction ................................................................................................................................. 59Clarication .......................................................................................................................................................................60Protein stability—selection of conditions ............................................................................................................ 62Removal of specic impurities ................................................................................................................................. 66

8/22/2019 Purificação de Proteínas - Estratégias, handbook
http://slidepdf.com/reader/full/purificacao-de-proteinas-estrategias-handbook 5/167
28-9833-31 AA 3
Fractional precipitation ............................................................................................................................................... 67Extraction of membrane proteins .......................................................................................................................... 69Extraction of inclusion body proteins ................................................................................................................... 70
Chapter7Purifcationormats..........................................................................................................................73Manual purication formats .................................................................................................................................... 73Automated purication using chromatography systems ..........................................................................78
Columns for ÄKTA design systems .........................................................................................................................81Purication from unclaried samples ................................................................................................................... 85Scale-up .............................................................................................................................................................................. 85
Chapter8Analysisandcharacterization........................................................................................................87Target protein identity and quantitation .............................................................................................................88Total protein concentration ....................................................................................................................................... 91Activity ................................................................................................................................................................................. 94Purity .................................................................................................................................................................................... 95
Size homogeneity .........................................................................................................................................................101Other homogeneity issues .......................................................................................................................................103Protein stability ..............................................................................................................................................................106
Chapter9Purifcationexamples.....................................................................................................................109One-step purication of a GST-tagged protein and on-column tag removal .................................109Two-step purication of an MBP-tagged protein ..........................................................................................110Two-step purication of a mouse monoclonal IgG
1....................................................................................111
Three-step purication of a protein without afnity tag ...........................................................................112Unattended multistep purication and tag removal ...................................................................................114
Micropurication ...........................................................................................................................................................116Two-step purication of membrane proteins .................................................................................................117Screening of conditions for membrane protein purication ...................................................................118Matrix-assisted refolding of proteins expressed as inclusion bodies ..................................................119Screening and scaling up matrix-assisted protein refolding ...................................................................121
Chapter10Large-scalepurifcation.................................................................................................................125Process development .................................................................................................................................................125High-throughput process development ............................................................................................................126Practical considerations in scale-up ...................................................................................................................127
Chapter11Chromatographyprinciplesandconsiderations.......................................................................129Chromatograpic purication ..................................................................................................................................129Resolution ........................................................................................................................................................................130Peak broadening ...........................................................................................................................................................132Handling backpressure..............................................................................................................................................134
Appendices
Appendix1Biological buffers ..........................................................................................................................................................139
Appendix2Ammonium sulfate precipitation ..........................................................................................................................141

8/22/2019 Purificação de Proteínas - Estratégias, handbook
http://slidepdf.com/reader/full/purificacao-de-proteinas-estrategias-handbook 6/167
4 28-9833-31 AA
Appendix3Column packing and preparation ........................................................................................................................143
Appendix4Protein determination by absorbance measurements ..............................................................................147
Appendix5Converting from linear ow (cm/h) to volumetric ow rates (ml/min) and vice versa .................149
Appendix6Amino acid data ............................................................................................................................................................150
Productindex....................................................................................................................................152
Relatedliterature............................................................................................................................153
Orderinginormation......................................................................................................................154

8/22/2019 Purificação de Proteínas - Estratégias, handbook
http://slidepdf.com/reader/full/purificacao-de-proteinas-estrategias-handbook 7/167
28-9833-31 AA 5
Introduction
Strategies for Protein Purication is focused on chromatographic purication of proteins at
research scale. Beginners can use the handbook to get a quick start when entering the eld;
experienced protein puriers may also nd valuable information.
The handbook describes how to design a protein purication procedure, how to select and combinechromatography methods and purication formats, and how to monitor and evaluate protein
purication. It gives an overview of the available methods and provides advice on how to avoid
pitfalls in all operations, from initial sample preparation to nal analysis of the puried protein.
The handbook is a complement to the series of handbooks from GE Healthcare that describe the
different chromatographic purication methods in more detail. The Recombinant Protein Purication
Handbook, another handbook from GE Healthcare, gives a large number of detailed protocols
for the purication of recombinant proteins. For further reading on the various purication
methods, see the list of all handbooks in the "Related literature" section at the end of this book.
Most purications are today performed with afnity-tagged proteins. This greatly simplies
purication of many proteins. It is, however, relatively common that the target protein is unstable
under the conditions used for purication, or it may be difcult to obtain in sufciently pure form.
In such situations, more thorough purication protocol development may be needed to establish
suitable conditions for purication of active protein. Not all proteins to be puried are afnity
tagged. Sometimes proteins are overexpressed without a tag because the tag would interfere
with subsequent use of the protein. In other cases proteins from natural sources are puried.
Under these circumstances, several chromatographic purication steps are usually required to
obtain sufcient purity. This handbook describes a strategy for development of such protocols.
Common acronyms and abbreviations used in this handbookA
280UV absorbance at specied wavelength, in this example, 280 nanometers
AAA amino acid analysisAb antibodyAC afnity chromatographyAEBSF aminoethyl benzylsulfonyl uoride (serine protease inhibitor)AIEX anion exchange chromatographyAPMSF 4-aminophenyl-methylsulfonyl uoride (serine protease inhibitor)BCA bicinchoninic acidBSA bovine serum albumin
CDN 1-chloro-2,4-dinitrobenzeneCF chromatofocusingcGMP current good manufacturing practicesCHAPS 3-[(3-cholamidopropyl) dimethylammonio]-1-propanesulfonate (detergent)CIEX cation exchange chromatographyCIP cleaning-in-placeCIPP Capture, Intermediate Purication, and PolishingCMC critical micellar concentrationcP centiPoiseCV column volume
CYMAL™-7 cyclohexyl-n-heptyl-β-D-maltoside (detergent)DAOCS deacetoxycephalosporin C synthaseDDM n-dodecyl-β-D-maltoside (detergent)DIGE differential gel electrophoresis (sometimes referred to as 2-D DIGE)

8/22/2019 Purificação de Proteínas - Estratégias, handbook
http://slidepdf.com/reader/full/purificacao-de-proteinas-estrategias-handbook 8/167
6 28-9833-31 AA
DM n-decyl-β-D-maltoside (detergent)DNA deoxyribonucleic acidDNase deoxyribonucleaseDS desalting (here usually group separation by gel ltration; sometimes
referred to as buffer exchange)DSC differential scanning calorimetryDTT dithiothreitol, also 1,4 dithiothreitol (reducing agent, Cleland’s reagent)
DTE dithioerythritol, also 1,4 dithioerythritol (reducing agent)E. coli Escherichia coli
ECL enhanced chemiluminescenceEDTA ethylenediaminetetraacetic acid (chelating agent)EGTA ethylene glycol tetraacetic acid (chelating agent)ELISA enzyme-linked immunosorbent assayESI-MS electrospray ionization-mass spectrometryFF Fast FlowFC12 Fos-choline™-12 (detergent)FPLC™ fast protein liquid chromatographyGF gel ltration (sometimes referred to as SEC; size exclusion chromatography)GFP green uorescent proteinGSH reduced glutathioneGST glutathione S-transferaseGua-HCl guanidine hydrochlorideHAC hydroxyapatite chromatographyHECAMEG™ 6-O-(N-heptylcarbamoyl)methyl-α-D-glucoside (detergent)HIC hydrophobic interaction chromatographyHMW high molecular weightHP high performanceHPLC high performance liquid chromatographyHRP horseradish peroxidaseHTPD high-throughput process developmentIEX ion exchange chromatography (also seen as IEC in the literature)IMAC immobilized metal ion afnity chromatographyIPTG isopropyl β-D-thiogalactosideLDAO lauryldimethylamine oxide (detergent)LMW low molecular weightLPS lipopolysaccharidesMAb monoclonal antibodyMALDI-MS matrix assisted laser desorption ionization-mass spectrometry
MBP maltose binding proteinMMC Multimodal cation exchange(r)MPa megaPascalM
rrelative molecular weight
mRNA messenger RNAMS mass spectrometryMW molecular weightMWCO molecular weight cutoff N number of theoretical plates (column efciency)N/m number of theoretical plates per meter (column efciency)
NG n-nonyl-β-D-glucoside (detergent)NHS N-hydroxysuccinimide (reagent for covalent coupling of proteins to
chromatography media)OG n-octyl-β-D-glucoside
8/22/2019 Purificação de Proteínas - Estratégias, handbook
http://slidepdf.com/reader/full/purificacao-de-proteinas-estrategias-handbook 9/167
28-9833-31 AA 7
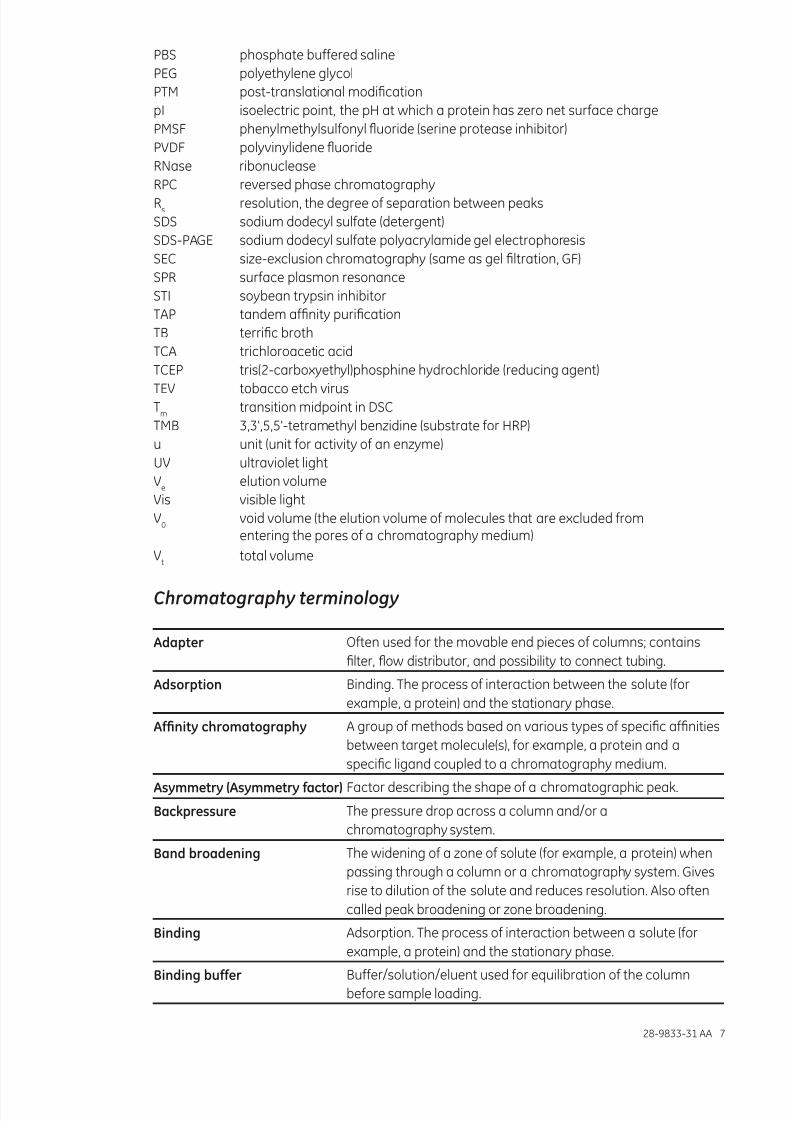
PBS phosphate buffered salinePEG polyethylene glycolPTM post-translational modicationpI isoelectric point, the pH at which a protein has zero net surface chargePMSF phenylmethylsulfonyl uoride (serine protease inhibitor)PVDF polyvinylidene uorideRNase ribonuclease
RPC reversed phase chromatographyR
sresolution, the degree of separation between peaks
SDS sodium dodecyl sulfate (detergent)SDS-PAGE sodium dodecyl sulfate polyacrylamide gel electrophoresisSEC size-exclusion chromatography (same as gel ltration, GF)SPR surface plasmon resonanceSTI soybean trypsin inhibitorTAP tandem afnity puricationTB terric brothTCA trichloroacetic acid
TCEP tris(2-carboxyethyl)phosphine hydrochloride (reducing agent)TEV tobacco etch virusT
mtransition midpoint in DSC
TMB 3,3',5,5'-tetramethyl benzidine (substrate for HRP)u unit (unit for activity of an enzyme)UV ultraviolet lightV
eelution volume
Vis visible lightV
0void volume (the elution volume of molecules that are excluded fromentering the pores of a chromatography medium)
Vt
total volume
Chromatography terminology
Adapter Often used for the movable end pieces of columns; contains
lter, ow distributor, and possibility to connect tubing.
Adsorption Binding. The process of interaction between the solute (for
example, a protein) and the stationary phase.
Afnitychromatography A group of methods based on various types of specic afnities
between target molecule(s), for example, a protein and a
specic ligand coupled to a chromatography medium.
Asymmetry(Asymmetryactor) Factor describing the shape of a chromatographic peak.
Backpressure The pressure drop across a column and/or a
chromatography system.
Bandbroadening The widening of a zone of solute (for example, a protein) when
passing through a column or a chromatography system. Gives
rise to dilution of the solute and reduces resolution. Also often
called peak broadening or zone broadening.
Binding Adsorption. The process of interaction between a solute (for
example, a protein) and the stationary phase.
Bindingbuer Buffer/solution/eluent used for equilibration of the column
before sample loading.

8/22/2019 Purificação de Proteínas - Estratégias, handbook
http://slidepdf.com/reader/full/purificacao-de-proteinas-estrategias-handbook 10/167
8 28-9833-31 AA
Bindingcapacity The maximum amount of material that can be bound per ml of
chromatography medium. See also Dynamic binding capacity.
Capacityactor The degree of retention of a solute (for example, a protein)
relative to an unretained peak.
Chromatoocusing Method that separates proteins on the basis of pI.
Chromatogram A graphical presentation of detector response(s) indicating the
concentration of the solutes coming out of the column duringthe purication (volume or time).
Chromatography From Greek chroma, color, and graphein, to write.
Chromatographymedium/media
The stationary phase, also called resin. The chromatography
medium is composed of a porous matrix that is usually
functionalized by coupling of ligands to it. The matrix is in
the form of particles (beads) or, rarely, a single polymer block
(monolith).
CIP(cleaning-in-place) Common term for cleaning chromatography columns
and/or systems with the purpose of removing unwanted/nonspecically bound material.
Column Usually column hardware packed with chromatography medium.
Columnequilibration Passage of buffer/solution through the chromatography
column to establish conditions suitable for binding of selected
sample components. For example, to establish correct pH and
ionic strength, and ensure that proper counter ions or counter
ligands are present.
Columnhardware The column tube and adapters. All pieces of the column except
the chromatography medium/the packed bed.
Columnhardwarepressure The pressure inside the column. Column hardware pressure
that is too high can break the column.
Columnpacking Controlled lling of the column hardware with chromatography
medium to obtain a packed bed.
Columnvolume The geometrical volume of the column interior/the
chromatography bed.
Counterion Ion of opposite charge that interacts with an ion exchange
chromatography medium after the column equilibration. The
counter ion is displaced by a protein that binds to the ion
exchanger. If a high concentration of the counter ion is applied,
it will compete with the bound protein and elute it from the
chromatography column.
Counterligand Substances that interact with ligands of a chromatography
medium and can be displaced by a solute (for example, protein)
binding to the ligand.
Deadvolume The volume outside the packed chromatography bed. Can be
column dead volume or chromatography system dead volume.
The dead volume contributes to band broadening.
Degassing Removal of dissolved air from buffers/solutions.Desorption Elution. Release or removal of bound substances from the
chromatography medium.

8/22/2019 Purificação de Proteínas - Estratégias, handbook
http://slidepdf.com/reader/full/purificacao-de-proteinas-estrategias-handbook 11/167
28-9833-31 AA 9
Dynamicbindingcapacity The binding capacity determined by applying the target using
ow through a column, as opposed to equilibrium binding
capacity determined by batch experiment.
Efciency Measured as number of theoretical plates. High efciency
means that sharp peaks will be obtained.
Euent The mobile phase leaving the column (= eluate).
Eluate The mobile phase leaving the column (= efuent).Eluent The buffer/solution used during chromatography (= mobile
phase).
Elutionbuer Buffer/solution used for elution (desorption) of bound solutes
(for example, proteins) from a column.
Elutionvolume The volume of buffer/solution (eluent) required to elute the
solute for example, a protein (= retention volume).
Elutiontime The time required for elution of a solute (protein) (= retention time).
Flowrate Volumetric ow (ml/min) or linear ow rate (cm/h).
Measurement of ow through a column and/orchromatography system.
Flowthrough Material passing the column during sample loading (without
being bound).
Frit Type of deep lter often used at top and bottom of columns.
Gelfltration(GF) Size-exclusion chromatography. Separates solutes (for
example, proteins) according to size.
Gradientelution Continuous increased or decreased concentration of a
substance (in the eluent) that causes elution of bound solutes
(for example, proteins).
Hydrophobicinteractionchromatography(HIC)
Method based on the hydrophobic interaction between solutes
(for example, proteins) and the chromatography medium in the
presence of high salt concentration.
Hydroxyapatitechromatography
Mixed-mode ion exchange chromatography method.
Immobilizedmetalionafnitychromatography(IMAC)
Method based on the afnity of proteins with His, Cys, or
Trp amino residues on their surface and metal ions on the
chromatography medium.
Ionexchangechromatography(IEX)
Method based on electrostatic interactions between solutes (forexample, proteins) and chromatography medium.
Isocraticelution Elution of the solutes without changing the composition of the
buffer/solution (eluent).
Ligand The specic molecular group that is coupled to the matrix to
give some decided function to the chromatography medium.
Liganddensity Related to ligand concentration. The distribution of ligands on
the surfaces (also surfaces inside pores) of the chromatography
matrix.
Linearvelocity The ow rate normalized by the column cross section (cm/h).
Masstranser Movement of a solute (for example, a protein) in and out of the
stationary phase. Important factor for column efciency.

8/22/2019 Purificação de Proteínas - Estratégias, handbook
http://slidepdf.com/reader/full/purificacao-de-proteinas-estrategias-handbook 12/167
10 28-9833-31 AA
Matrix The matrix is the nonfunctional base for the chromatography
medium. The matrix has a porous structure that provides a
large surface that can be modied with ligands that introduce
possibilities for protein binding.
Mobilephase The uid (buffer/solution) carrying the solutes during
chromatography (= eluent).
Peakbroadening Same as band broadening.Peakcapacity The number of peaks that can be separated using a
chromatography column.
Peaktailing Broadening at the end of a peak due to additional delay of a
fraction of the solute. Results in increased asymmetry factor.
Pore Cavity in a chromatography matrix.
Porevolume The total volume of the pores in a chromatography medium.
Pressureoverthepackedbed The pressure drop across the packed bed upon passage of
solution through the column. Caused by ow resistance in the
packed bed.Recovery The relative amount of target protein that is retrieved after
purication compared with amount loaded on the column.
Resin The term is sometimes used instead of the more generic term,
chromatography medium.
Resolution Measurement of the ability of a packed column to separate two
solutes (peaks).
Retentionvolume Same as elution volume.
Retentiontime Same as elution time.
Reversedphasechromatography(RPC)
Method based on hydrophobic interactions between
solutes (sample components) and ligands coupled to the
chromatography medium. Organic modiers (for example,
acetonitrile) in the eluent are used for elution.
Sample The material loaded on the chromatography column/medium,
or to be analyzed.
Sampleapplication Applying/loading sample on the column.
Sampleloading Loading/applying sample on the column.
Samplevolume Usually the volume of the sample loaded on the
chromatography column/medium.
Selectivity Measure of the relative retention of two solutes in a column.
Related to the distance between two peaks.
Solute The dissolved substance (for example, a protein) in, for example,
the mobile phase.
Stationaryphase Often called resin, chromatography beads, chromatography
material, chromatography medium or media.
Stepgradientelution Stepwise increase in concentration of the substance that
affects elution of bound solutes.
Voidvolume The elution volume of solutes that do not enter the pores
or interact with the chromatography medium, thus passing
between the beads in the packed bed.

8/22/2019 Purificação de Proteínas - Estratégias, handbook
http://slidepdf.com/reader/full/purificacao-de-proteinas-estrategias-handbook 13/167
28-9833-31 AA 11
Wash Wash step. Removal of unbound or weakly bound material from
a column after the sample loading.
Washbuer Buffer/solution used for washing the column after sample
loading.
Washvolume Volume of buffer/solution used for the wash step.
Yield Amount of target protein (or other solute) obtained after a
purication step, or after the entire purication (multiple steps).Zonebroadening Same as peak broadening.
Symbols used in this handbook
This symbol indicates general advice to improve procedures or recommend action
under specic situations.
This symbol denotes mandatory advice and gives a warning when special care
should be taken.

8/22/2019 Purificação de Proteínas - Estratégias, handbook
http://slidepdf.com/reader/full/purificacao-de-proteinas-estrategias-handbook 14/167
12 28-9833-31 AA

8/22/2019 Purificação de Proteínas - Estratégias, handbook
http://slidepdf.com/reader/full/purificacao-de-proteinas-estrategias-handbook 15/167
28-9833-31 AA 13
Chapter 1Brief history of protein purication
This chapter presents a brief and somewhat narrow description of the history of laboratory-
scale protein purication. Opinion may differ regarding details of when and how a contribution
or breakthrough was made and by whom.
The term “protein” comes from the Greek, “standing in front.” The term was suggested by
Jöns Jacob Berzelius in 1838. At the time there were ongoing discussions about whether
proteins were macromolecules or colloidal aggregates, a debate that lasted until 1930. In 1901
Hermann Emil Fischer synthesized a dipeptide, demonstrating that amino acids can be linked
together, and the following year Franz Hofmeister suggested that proteins are amino acids
linked by peptide bonds. Many years later (1926) James B. Sumner crystallized the enzyme
urease and showed by chemical analysis that the substance was a protein. This was the rst
proof that enzymes are proteins. Linus Pauling and co-workers proposed in 1951 that the
primary structural motifs of proteins are α helices and β sheets. In 1957 Christian B. Annsenand colleagues showed that ribonuclease (RNase) could be refolded into its native structure
and regain its activity after complete unfolding and reduction (disulde bonds broken).
Annsen later suggested that the native structure of a protein is the thermodynamically most
stable structure with the given amino acid sequence. The same year, Max Perutz and John
Kendrew determined the structure of myoglobin.
Advances in methodologyProtein purication has been developed in parallel with the discovery and further studies of proteins.
See Table 1.1 for some of the milestones in the history of protein purication. The selection of
milestones might be controversial and is biased toward the content of this handbook.
Protein purication has been performed for more than 200 years. In 1789 Antoine Fourcroy
prepared substances from plants that had similar properties to egg white (mainly albumin). Until
the beginning of the 20th century, the only available separation technologies were methods
such as ltration, precipitation, and crystallization. In 1840 Felix Hoppe-Seyler prepared the
rst crystals of hemoglobin. Repeated crystallization was used by Hofmeister in 1889 to purify
ovalbumin. During World War II there was an acute need for blood proteins. Cohn fractionation
of plasma was developed for the purication of albumin and other plasma proteins. The
method is based on multiple precipitation steps where pH, ethanol concentration, temperature,
and protein concentration is varied for each step. This precipitation method and others, forexample, ammonium sulfate precipitation, are still used today. In 1903 the botanist Mikhail
Tswett described his work on separation of plant pigments on a column of calcium carbonate.
Later, in 1906, he introduced the term chromatography. In 1924 Theodor Svedberg showed that
proteins can be separated by centrifugation. During the next several decades, other important
protein separation methods were developed: electrophoresis and afnity chromatography (AC) in
the 1930s and ion exchange chromatography (IEX) in the 1940s. Hydroxyapatite, which can be
regarded as a mixed-mode ion exchanger, was developed in 1956 by Arne Tiselius and co-workers.
New chromatography mediaDuring the 1950s and 1960s several new hydrophilic chromatography matrices were invented.
The matrices are the solid (often porous) material to which functional groups (ligands) are
coupled to obtain a chromatography medium. In 1955 starch was used to separate proteins
based on differences in size. In 1959, Jerker Porath, Per Flodin, and Bjorn Ingelman developed

8/22/2019 Purificação de Proteínas - Estratégias, handbook
http://slidepdf.com/reader/full/purificacao-de-proteinas-estrategias-handbook 16/167
14 28-9833-31 AA
cross-linked dextran, which was more suitable for this purpose. During the 1960s other
hydrophilic materials for electrophoresis and chromatography where developed: polyacrylamide,
methacrylate, porous silica, and agarose. The introduction of cyanogen bromide activation by
Rolf Axén and co-workers (1967) allowed ligand coupling to polysaccharides such as in agarose.
This discovery is the foundation of modern AC media. The AC method (1968) is attributed to
Pedro Cuatrecasas and co-workers, who described the concept in 1968. In the 1960s and 1970s
reversed phase chromatography (RPC), hydrophobic interaction chromatography (HIC), and
immobilized metal ion afnity chromatography (IMAC) were developed.During the 1970s and 1980s a large number of chromatography media were developed, and
protein purication was developed in parallel. In 1982, Pharmacia (now GE Healthcare) launched
a completely integrated chromatography system called FPLC System (Fast Protein Liquid
Chromatography). FPLC has since become synonymous with reproducible chromatographic
purication of proteins. During this time most purications were undertaken starting with natural
sources, where extremely low concentration of target protein in the source organisms often
made purication of even a few micrograms difcult and time consuming. Process-scale protein
purication—for large amounts of proteins used in laundry detergents or for enzymatic synthesis
of complicated substances, as well as in biopharmaceuticals—is now common. Kilograms or
even tonnes of a protein are now manufactured each year in some purication facilities.
Genomics and proteomicsIn the 1970s recombinant DNA technology was developed. Molecular cloning allowedmodication and heterologous overexpression of a selected protein. During the 1980s and 1990safnity tagging of proteins became popular, and it allowed efcient AC purication. Because thesame afnity tag could be used on many different proteins, generic and time-saving puricationprotocols could be developed. This was important for the efciency of structural genomicsinitiatives that were started during the 1990s and 2000s with the aim of determining the
structure of thousands of proteins. The generic protocols allowed the throughput in the proteinpurication process to be further enhanced by automation of up to four purication steps.Monoclonal antibody technology (1975) involves the establishment of stable cell lines producinga single, selected antibody. This method, in conjunction with highly selective chromatographymedia based on Protein A and Protein G ligands, has made monoclonal antibodies available fora large number of applications in research and as pharmaceuticals.
The Human Genome Project (1990 to 2003) and other DNA sequencing initiatives have madeavailable complete genome sequences for several organisms. In order to understand themolecular biology of an organism, the genome sequence information must be combined withgene expression information in different cells or tissue, such as messenger RNA (mRNA) levels and
protein levels, as well as protein structure and function. An important development was thereforepeptide mass ngerprinting, where mass spectrometry (MS) of peptide fragments of proteinscombined with searches of databases with known protein sequences allowed identication of proteins present in a sample. Proteomics (1997) aims at the large-scale study of the structure andfunction of the proteins in a given organism, the proteome. In proteomics, the protein separationis often aimed at simplifying complex samples to allow qualitative and quantitative analysis of
multiple proteins in the same experiment, rather than purifying a single target protein.
Where we are today
Protein purication is now performed in scales from micrograms and milligrams in research
laboratories to kilograms and tonnes in industrial settings. In some laboratories, proteins
are puried in parallel, using automated chromatography systems. The efciency gained
by the generic purication approaches based on afnity tagging of the target protein has
revolutionized protein purication, and today many proteins can be puried very easily and

8/22/2019 Purificação de Proteínas - Estratégias, handbook
http://slidepdf.com/reader/full/purificacao-de-proteinas-estrategias-handbook 17/167
28-9833-31 AA 15
efciently. It should be noted, however, that these methods do not always provide sufcient
purity, and additional physicochemical-based chromatography methods, for example, gel
ltration (GF), IEX, and HIC may thus have to be added to the protocol. Proteins that may be
fairly easy to obtain in a pure state are not always stable under the rst conditions tested.
Some proteins may be very challenging to purify in an active and stable form, for example,
integral membrane proteins, unstable protein complexes, proteins expressed as insoluble
aggregates, and proteins with a specic set of post-translational modications. The challenges
in protein purication that still remain make it worthwhile to gain solid knowledge about proteinpurication so that the available methods can be selected and applied in an optimal way.
Table1.Some milestones in the history of protein purication
Precipitation 1789 Fourcroy
Crystalline ovalbumin 1889 Hofmeister
Chromatography 1903 Tswett*
Ultracentrifugation 1924 Svedberg
Moving boundary electrophoresis 1937 Tiselius
Ion exchange chromatography 1940s The Manhattan Project
Two-phase partitioning 1955 Albertsson (1)
Size-exclusion chromatography (gel ltration)† 1955, 1959 Lindqvist and Storgårds (2), Porath andFlodin (3), Ingelman
Hydroxyapatite chromatography 1956 Tiselius, et al. (4)
Sephadex™ (gel ltration medium) 1959 Pharmacia (now GE Healthcare)
Polyacrylamide gel electrophoresis 1959 Raymond and Weintraub (5)
Isoelectric focusing‡ 1959 Kolin (6)
High-performance liquid chromatography (HPLC)§ 1941; 1966 Martin and Synge (7)
Sepharose™ 1967 Pharmacia (now GE Healthcare)
SDS-PAGE 1967 Shapiro, et al. (8)Afnity-ligand coupling chemistry for afnitychromatography¶
1967 Axén, et al. (9)
Afnity chromatography 1968 Cuatrecasas, et al. (10)
Reversed-phase chromatography 1970s Kirkland (11); Molnar and Horvath (12)
Protein A adsorbent for IgG purication 1972 Hjelm, et al. (13); Kronvall (14)
Hydrophobic interaction chromatography 1973 Porath (15); Hjertén (16)
Two-dimensional chromatography 1975 O’Farrel l(17)
Immobilized metal ion afnity chromatography 1975 Porath, et al. (18)
Chromatofocusing 1977** Sluyterman and Wijdenes (19)
Capillary electrophoresis 1981†† Jorgenson and Lukacs (20)
Fast Protein Liquid Chromatography 1982 Pharmacia (now GE Healthcare)
Histidine afnity tagging 1988‡‡ Smith et al. (21), Hochuli et al. (22)
ÄKTA™ design 1996 Pharmacia Biotech (now GE Healthcare)
* Separation of plant pigments on a chalk (calcium carbonate) column† In 1955, size-exclusion separation was performed on starch. See reference 2. In 1959, cross-linked dextran was introduced
by Porath and Flodin. This material became useful in practice for protein purication. See reference 3‡ Performed using a sucrose/buffer gradient
§ Martin and Synge suggested use of small particles and high pressure for high-performance separation. See reference 7Horvath coined the term high-performance liquid chromatography (HPLC) in 1966
¶ CNBr-method for coupling afnity ligands to chromatography materials. See reference 9** See, for example, reference 19
†† Others, for example, Hjertén, performed electrophoresis in narrow tubing even earlier. See also reference 20‡‡ Smith et al. presented the concept of a peptide afnity tag for IMAC in 1986. In 1988 the histidine tag was developed.
See references 21 and 22

8/22/2019 Purificação de Proteínas - Estratégias, handbook
http://slidepdf.com/reader/full/purificacao-de-proteinas-estrategias-handbook 18/167
16 28-9833-31 AA
References
1. Albertsson, P.-Å. History of aqueous polymer two-phase systems, in Partitioning in aqueous
two-phase systems (Walter et al. eds.), Academic Press, Inc. (1985).
2. Lindqvist, B. and Storgårds, T. Molecular-sieving Properties of Starch. Nature, Lond. 175:
511-512 (1955).
3. Porath, J. and Flodin, P. Gel ltration: a method for desalting and group separation. Nature
183: 1657-1659 (1959).4. Tiselius, A. et al. Protein chromatography on calcium phosphate columns. Arch. Biochem.
Biophys.65: 132-155 (1956).
5. Raymond, S. and Weintraub, L. Acrylamide gel as a supporting medium for zone
electrophoresis. Science130: 711 (1959).
6. Kolin, A. Isoelectric spectra and mobility spectra: A new approach to electrophoretic
separation. Proc. Natl. Acad. Sci. USA41, 101-110 (1955).
7. Martin, A. J. and Synge, R. L. Separation of the higher monoamino-acids by counter-current
liquid-liquid extraction: the amino-acid composition of wool. Biochem. J.35: 91-121 (1941).
8. Shapiro, A. L., et al. Molecular weight estimation of polypeptide chains by electrophoresis inSDS-polyacrylamide gels. Biochem. Biophys. Res. Commun. 28: 815-820 (1967).
9. Axén, R., et al. Chemical coupling of peptides and proteins to polysaccharides by means of
cyanogen halides. Nature 214: 1302-1304 (1967).
10. Cuatrecasas, P, et al. Selective enzyme purication by afnity chromatography. Proc. Natl.
Acad. Sci. USA 61: 636-643 (1968).
11. Kirkland, J. J. High speed liquid-partition chromatography with chemically bonded organic
stationary phases. J. Chromatogr. Sci. 9, 206-214 (1971).
12. Molnar, I. and Horvath, C. Reverse-phase chromatography of polar biological substances:
separation of catechol compounds by high-performance liquid chromatography.
Clin. Chem. 22: 1497-1502 (1976).
13. Hjelm, H., et al. Protein A from Staphylococcus aureus. Its isolation by afnity
chromatography and its use as an immunosorbent for isolation of immunoglobulins.
FEBS Lett.28(1):73–76 (1972).
14. Kronvall, G. A surface component in group A, C, and G streptococci with non-immune
reactivity for immunoglobulin G. J. Immunol.111:1401–1406 (1973).
15. Porath, J., et al. Salting-out in amphiphilic gels as a new approach to hydrophobic
adsorption. Nature 245: 465-466 (1973).
16. Hjertén S. Some general aspects of hydrophobic interaction chromatography. J. Chrom. A.
87: 325–331 (1973).17. O'Farrell, P. H. High resolution two-dimensional electrophoresis of proteins. J. Biol. Chem.
250: 4007-4021 (1975).
18. Porath, J., et al. Metal chelate afnity chromatography, a new approach to protein
fractionation. Nature 258: 598-599 (1975).
19. Sluyterman, L. A. A. E. and Elgersma O. Chromatofocusing: Isoelectric focusing on ion
exchange columns. I. General principles. J. Chromatogr. 150: 17-30 (1978).
20. Jorgenson, J. W. and Lukacs, K.D. Free-zone electrophoresis in glass capillaries.
Clin. Chem. 27: 1551-1553 (1981).
21. Smith, M. C. et al. Chelating peptide-immobilized metal ion afnity chromatography. A newconcept in afnity chromatography for recombinant proteins. J. Biol. Chem. 263: 7211-7215 (1988).
22. Hochuli, E., et al. Genetic approach to facilitate purication of recombinant proteins with a
novel metal chelate adsorbent. Bio/Technology 6: 1321-1325 (1988).

8/22/2019 Purificação de Proteínas - Estratégias, handbook
http://slidepdf.com/reader/full/purificacao-de-proteinas-estrategias-handbook 19/167
28-9833-31 AA 17
Chapter 2Protein purication methods
The most common methods for preparative purication of proteins all involve chromatography.
The methods separate according to differences between the properties of the protein to be
puried (the target protein) and the properties of other substances in the sample. Examples of
protein properties used in different chromatography methods are given in Table 2.1.
Table2.1.Protein properties used for chromatographic purication
Proteinproperty Method
Specic ligand recognition (biospecic or nonbiospecic) Afnity chromatography (AC)
Metal ion binding Immobilized metal ion afnity chromatography (IMAC)
Charge Ion exchange chromatography (IEX)
Size Gel ltration (GF)Hydrophobicity Hydrophobic interaction chromatography (HIC)Reversed phase chromatography (RPC)
Isoelectric point Chromatofocusing
AC is the common rst purication step when the target protein is afnity tagged. If further
purication is needed, additional methods are used to remove remaining impurities. Purication
of untagged proteins often requires the use of several purication steps applying different
methods in suitable order. This chapter gives a brief overview of the key purication methods
presented in Table 2.1. Further details regarding method descriptions and practical advice,
including many examples, can be found in other handbooks from GE Healthcare.
Afnity chromatography (AC)AC separates proteins on the basis of a reversible interaction between the target protein (or
group of proteins) and a specic ligand attached to a chromatography matrix (Fig 2.1). The
interaction can be biospecic, for example, antibodies binding Protein A or a receptor binding
a hormone, or nonbiospecic, for example, a protein binding a dye substance or histidine-
containing proteins binding metal ions (as in IMAC, which, due to its importance will be described
separately in the following section). AC offers high selectivity, hence high resolution, and
intermediate to high capacity. Elution can often be performed under mild conditions.In AC, the target protein is specically and reversibly bound by a complementary binding
substance (ligand). The sample is applied under conditions that favor specic binding to the
ligand. Unbound material is washed out of the column, and bound target protein is recovered
by changing conditions to those favoring elution. Elution is performed specically, using a
competitive ligand, or nonspecically, by changing, for example, pH, ionic strength, or polarity.
The target protein is eluted in a puried and concentrated form. The key stages in an AC
separation are shown in Figure 2.2.

8/22/2019 Purificação de Proteínas - Estratégias, handbook
http://slidepdf.com/reader/full/purificacao-de-proteinas-estrategias-handbook 20/167
18 28-9833-31 AA
Fig2.1.Schematic depicting AC.
Column volumes (CV)
begin sampleapplication
change toelution buffer
x CV 2–5 CV
>1
CV2 CV 2–3 CV
equilibration regeneration of mediaadsorption of sample and
flowthrough of unbound material
washingto removeunboundmaterial
elution of bound
protein(s)A280
Fig2.2.Typical afnity purication.
AC can sometimes be used for single-step purication because of high selectivity or in instances
when some impurities can be accepted. It is, however, more common for AC to be used as
the rst purication step (capture step; see Chapter 4), followed by a second purication step
(polishing step) to remove remaining impurities or aggregates. In other cases when very high
purity is required, one or more additional purication steps may need to be applied.
Today, most laboratory-scale purications are performed with afnity-tagged proteins. A large
number of different afnity tags as well as chromatography media and prepacked columnsare available to allow selection of optimal conditions for each target protein and purication
task. The most common is purication of histidine-tagged proteins using IMAC or glutathione
S-transferase (GST)-tagged proteins using media with immobilized glutathione. AC is also used
to remove specic contaminants, for example, Benzamidine Sepharose 4 Fast Flow for removal
of serine proteases. Pre-activated chromatography media can be used for covalent coupling
of various ligands, for example, antibodies can be raised to the target protein and coupled on
NHS-activated Sepharose for immunoafnity purication of the desired protein. Table 2.2 shows
examples of prepacked columns available from GE Healthcare; see ordering information for
more details. Other formats for purication are also available; see Chapter 7.
Bound target protein
Unbound impurities

8/22/2019 Purificação de Proteínas - Estratégias, handbook
http://slidepdf.com/reader/full/purificacao-de-proteinas-estrategias-handbook 21/167
28-9833-31 AA 19
Table2.2.HiTrap™, HiPrep™, and HiScreen™ afnity columns for laboratory-scale purication
Application Columns
Purifcationoimmunoglobulins
IgG, fragments, and subclasses HiTrap MabSelect™ SuRe™, 1 ml and 5 ml
HiTrap MabSelect , 1 ml and 5 ml
HiTrap MabSelect Xtra™, 1 ml and 5 ml
HiTrap rProtein A FF, 1 ml and 5 mlHiTrap Protein A HP, 1 ml and 5 ml
HiScreen MabSelect SuRe, 4.7 ml
HiScreen MabSelect, 4.7 ml
HiScreen MabSelect Xtra, 4.7 ml
IgG, fragments, and subclasses including human IgG3
Strong afnity for monoclonal mouse IgG1
and rat IgGHiTrap Protein G HP, 1 ml and 5 ml
MAbTrap™ Kit
Avian IgY from egg yolk HiTrap IgY Purication HP, 5 ml
Mouse and human IgM HiTrap IgM Purication HP, 1 ml
Purifcationorecombinantproteins
Histidine-tagged proteins HisTrap™ FF, 1 ml and 5 ml
HisTrap HP, 1 ml and 5 ml
HisTrap FF crude, 1 ml and 5 ml
HisTrap FF crude Kit
HisPrep™ FF 16/10, 20 ml
GST-tagged proteins GSTrap™ 4B, 1 ml and 5 ml
GSTrap FF, 1 ml and 5 ml
GSTrap HP, 1 ml and 5 ml
GSTPrep™ FF 16/10, 20 ml
MBP-tagged proteins MBPTrap™ HP, 1 ml and 5 mlStrep-tag™ II proteins StrepTrap™ HP, 1 ml and 5 ml
Group-specifcpurifcation
Albumin and nucleotide-requiring enzymes HiTrap Blue HP, 1 ml and 5 ml
Proteins and peptides with exposed His, Cys, or Trp IMAC columns that are not precharged with metal ion:
HiTrap Chelating HP, 1 ml and 5 ml
HiTrap IMAC HP, 1 ml and 5 ml
HiTrap IMAC FF, 1 ml and 5 ml
Biotinylated substances HiTrap Streptavidin HP, 1 ml
DNA binding proteins and coagulation factors HiTrap Heparin HP, 1 ml and 5 ml
HiPrep Heparin FF 16/10, 20 mlTrypsin-like serine proteases including Factor Xa,thrombin, and trypsin
HiTrap Benzamidine FF (high sub), 1 ml and 5 ml
Phosphorylated proteins and peptides IMAC columns charged with Fe3+
Titanium oxide based separation can be performedusing TiO
2Mag Sepharose
Matrix for preparation of afnity media. Coupling viaprimary amines.
HiTrap NHS-activated HP, 1 ml and 5 ml
For further information please refer to Afnity Chromatography Handbook: Principles and
Methods, Antibody Purication Handbook, and Recombinant Protein Purication Handbook:
Principles and Methods from GE Healthcare (see also the "Related literature" section at theend of this handbook).

8/22/2019 Purificação de Proteínas - Estratégias, handbook
http://slidepdf.com/reader/full/purificacao-de-proteinas-estrategias-handbook 22/167
20 28-9833-31 AA
Immobilized metal ion afnity chromatography (IMAC)IMAC is based on the interaction of proteins with histidine residues (or Trp and Cys) on their
surface with divalent metal ions (e.g., Ni2+, Cu2+, Zn2+, Co2+) immobilized via a chelating ligand.
Histidine-tagged proteins have an extra high afnity in IMAC because of the multiple (6 to 10)
histidine residues and are usually the strongest binder among all the proteins in a crude sample
extract (e.g., a bacterial lysate), while other cellular proteins will not bind or will bind weakly.
IMAC purication begins with equilibration of the column with a binding buffer containinga low concentration of imidazole. When using columns packed with Ni Sepharose, 20 to
40 mM imidazole should be used. Columns from other suppliers usually use much lower
concentrations. The imidazole binds to the immobilized metal ion and becomes the counter
ligand. The sample should be adjusted to the same imidazole concentration as the binding
buffer before being loaded on the column. Proteins with histidines bind the column while
displacing the imidazole counter ligands. The column is washed using the binding buffer.
Elution of bound proteins is performed using a gradient of imidazole up to 100 to 500 mM or by
step elution. Gradient elution (Fig 2.3) often gives two peaks, an early peak corresponding to
naturally binding proteins in the lysate and a later peak corresponding to the histidine-tagged
protein, which has higher afnity for the medium. Step elution (Fig 2.4) gives a single peak, withthe histidine-tagged protein often of slightly lower purity, but it is a powerful capture step that
can be combined with a second purication step, for example, GF, to obtain higher purity.
We recommend binding at neutral to slightly alkaline pH (pH 7 to 8) in the presence of
500 mM NaCl. Including salt in the buffers and samples eliminates ion-exchange effects.
Avoid chelating agents such as EDTA or citrate in buffers, because they may strip off the
metal ions from the chromatography medium.
60
0
1000
2000
3000
4000
A280 (mAU)
0
20
40
60
80
100%B
0 10 20 30 40 50 70 Volume (ml)
C
2 +
Target protein
Fig2.3. Typical IMAC purication with gradient elution.
0 5 10 2015 30 35 Volume (ml)25
4000
3000
2000
1000
0
A280 (mAU) Target protein
0
20
40
60
80
100%B
Fig2.4. Typical IMAC purication with step elution.

8/22/2019 Purificação de Proteínas - Estratégias, handbook
http://slidepdf.com/reader/full/purificacao-de-proteinas-estrategias-handbook 23/167
28-9833-31 AA 21
Histidine tags are small and generally less disruptive than other tags to the properties of
the proteins on which they are attached. Because of this, tag removal after purication of a
histidine-tagged protein may not always be of high priority. Histidine-tagged protein expressed
in E. coli can accumulate in two main forms, as biologically functional soluble proteins or as
large insoluble aggregates of more or less unfolded, inactive target protein. Preparation of active
protein from such inclusion bodies will be addressed in Chapters 6 and 9.
For further information please refer to Afnity Chromatography Handbook: Principles and
Methods and Recombinant Protein Purication Handbook: Principles and Methods fromGE Healthcare (see also the "Related literature" section at the end of this handbook).
Gel ltration (GF)GF is simple to use and allows separation of substances with differences in molecular size, under
mild conditions. GF is also called size-exclusion chromatography, which more closely describes
the separation mechanism. GF can be used for protein purication (Fig. 2.6) or for group
separation in which the sample is separated in two major groups (Fig. 2.7). Group separation is
mainly used for desalting and buffer exchange of samples; see Chapter 3.
GF is a non-binding method (Fig 2.5), which means that no concentration of the sample
components takes place. In fact, the sample zone is broadened during the passage through
the column, resulting in dilution of the sample. The loaded sample volume must be kept small.
In preparative GF, maximum resolution can be obtained with sample volumes of 0.5% to 2%
of the total column volume; however, up to 5% may give acceptable separation. Even larger
samples volumes can be appropriate if the resolution between target protein and the impurities
to be removed is high. To increase capacity, the sample can be concentrated before GF. Avoid
concentrations above 70 mg/ml, because viscosity effects may cause severe band broadening
(so-called viscous ngering) that reduces the resolution.
Fig2.5. Schematic depicting GF.
Sample components are eluted isocratically (single buffer, no gradient). Separation can be
performed within a broad pH, ionic strength, and temperature range, and the medium accepts
a variety of additives: co-factor, protein stabilizers, detergents, urea, and guanidine hydrochloride.
The buffer composition does not usually affect resolution, although including a low concentrationof salt , for example, 25 to 150 mM NaCl, is recommended to eliminate any weak electrostatic
interactions between proteins and the GF matrix. Buffer conditions are selected to suit the
sample type and to maintain target protein activity, because the proteins are transferred to the
Large molecule that cannot enter thepores of chromatography beads
Target protein that can use a fractionof the pore volume of the beads
Salt or other low-molecular-weightsubstances that can use the entirepore volume of the beads

8/22/2019 Purificação de Proteínas - Estratégias, handbook
http://slidepdf.com/reader/full/purificacao-de-proteinas-estrategias-handbook 24/167
22 28-9833-31 AA
buffer used for equilibration of the column. Equilibration buffer can thus be selected according
to conditions required for further purication, analysis, storage, or use.
The selection of chromatography medium is the key parameter for optimization of resolution in GF.
The loading sample volume is the most important factor for high resolution.
Select conditions that maintain target protein stability and that are suitable for
subsequent work.
Capacity can be increased by concentrating the sample.
Resolution can be increased by lowering the ow rate.
Avoid sample volumes larger than 4% of the total column volume when separating proteins
by GF. Group separations allow sample volumes of up to 30% of the column volume.
Avoid protein concentrations above approximately 70 mg/ml, because high viscosity
may severely affect resolution.
Column volumes (CV)
sampleinjectionvolume
equilibration
igmolecular
weight
intermediatemolecular weight
lowmolecular
weight
1 CV
A280
Fig2.6. Principles of GF purication.
0.15
0.10
0.05
0.00
UV 280 nm
Conductivity
(Histidine)6-protein
Inject
2 Time (min)10
Vt
A280
Vo
Salt
Fig2.7.Typical example of group separation used for desalting of protein.
GF is a powerful method for purication of proteins that have passed one or several initial
purication steps. After those steps, the material has been concentrated and bulk impurities
have been removed. GF can now be used to remove remaining impurities; it will also remove
oligomers or aggregates of the target protein. The puried target protein obtained after GF will
thus also be homogeneous in size. GF is rarely used as a rst purication step, but can be usefulfor small samples with moderate complexity.
For further information please refer to Gel Filtration Handbook: Principles and Methods
from GE Healthcare (see also the "Related literature" section at the end of this handbook).

8/22/2019 Purificação de Proteínas - Estratégias, handbook
http://slidepdf.com/reader/full/purificacao-de-proteinas-estrategias-handbook 25/167
28-9833-31 AA 23
Ion exchange chromatography (IEX)IEX separates proteins with differences in surface charge to give high-resolution separation
with high sample loading capacity (Fig 2.8). The separation is based on the reversible
interaction between a charged protein and an oppositely charged chromatography medium.
Target proteins are concentrated during binding and collected in a puried, concentrated form.
IEX media can be used at high ow rates because binding kinetics for IEX are fast, and rigid
chromatography particles can be used.
The net surface charge of proteins varies according to the surrounding pH (Fig. 2.9). Typically,
when above its isoelectric point (pI) a protein will bind to a positively charged anion exchanger;
when below its pI a protein will bind to a negatively charged, cation exchanger. It should be
noted, however, that even if the protein has a net negative charge it may bind to a negatively
charged cation exchanger, because there might be positively charged clusters on the protein
surface that could be sufcient for binding. This may of course also be true for the opposite
case, with a net positively charged protein binding to a positively charged anion exchanger.
Unexpected binding or absence of binding can also be caused by pH changes in the micro-
environment inside the beads compared with the bulk buffer (Donnan effect). This can increase
the effective pH in anion exchangers and decrease it in cation exchangers.
Fig2.8.Schematic depicting IEX.
SelectivitypH of mobile phase
V V V
CIEX
AIEX
pH0
+
-
V
VVVV
Abs Abs Abs Abs
Surface
netcharge
Abs Abs Abs Abs
Fig2.9. Schematic view of the effects of pH on protein elutionpatterns. The middle diagram shows the surface net charge of
three proteins (blue, green, and red). The four chromatogramson top describe the behavior of these proteins in cationexchange chromatography (CIEX) with salt gradient elutionrun at varying pH values as indicated by the vertical lines. Thebottom chromatograms show the behavior in anion exchangechromatography (AIEX).
IEX ligand
Shell of ions (counter ions) forming layers on thesurface of the matrix, and unbound ions in the buffer
Bound protein
Unbound protein

8/22/2019 Purificação de Proteínas - Estratégias, handbook
http://slidepdf.com/reader/full/purificacao-de-proteinas-estrategias-handbook 26/167
24 28-9833-31 AA
Proteins bind as they are loaded onto a column at low ionic strength (Fig 2.10). The conditions
are then altered so that bound substances are desorbed differentially. Elution is usually
performed by increasing salt concentration or changing pH in a gradient, or stepwise (Fig. 2.11).
The most common salt is NaCl, but other salts can also be used to modulate separation, for
example, K+, Ca2+, Mg2+, CH3COO−, SO
42-, I-, Br -. The buffer used may also impact separation. Ions
that bind to the protein may change its behavior in IEX.
A strong ion exchange medium has the same charge density on its surface over a broad pH
range, whereas the charge density of a weak ion exchanger changes with pH. The selectivityand the capacity of a weak ion exchanger are different at different pH values.
First try strong ion exchangers, and if other selectivity is desired try a weak ion exchanger.
Start by testing binding of small amounts of sample at different pH.
Use a buffer concentration that is sufcient to maintain buffering capacity and constant
pH, typically 20 to 50 mM.
For efcient binding, the column should be thoroughly equilibrated with the binding
buffer, and the sample should have the same pH and ionic strength.
Avoid EDTA in AIEX because it may bind to the medium and give disturbances in the pH.
Avoid using buffer substances with a charge that is opposite the charge of the ion
exchange medium to be used. See Appendix 1 for suitable buffers for AIEX and CIEX.
Column volumes (CV)
A280 4 CV
equilibration re-equilibrationgradientelution
sampleapplication
unbound molecules are eluted
before the gradient begins
wash
high-salt wash
tightly bound molecules areeluted in a high-salt wash
10-20 CV5 CV
10–20 CV
0
50
100%B
Fig2.10. Typical IEX purication with gradient elution.
Column volumes (CV)
10-20 CV5 CV
2–4 CV
2–4 CV
unboundmolecules
elute
tightly boundmolecules
elute
elution of unwantedmaterial
elutionof targetmolecule
4 CV
high-salt wash
0
50
100%B
equilibration re-equilibrationsample
application
A280
Fig2.11. Typical IEX purication with step elution.

8/22/2019 Purificação de Proteínas - Estratégias, handbook
http://slidepdf.com/reader/full/purificacao-de-proteinas-estrategias-handbook 27/167
28-9833-31 AA 25
IEX can be used in any part of a multistep purication procedure: as a rst step, in which high
binding capacity and high ow rates allow capturing of both target protein and bulk impurities
from a large-volume sample, as an intermediate purication step, or as a nal step for high-
resolution purication to remove the remaining impurities. Typically IEX is used to bind the target
molecule, but it can also be used to bind impurities, letting the target protein pass the column.
IEX can be repeated at different pH values to separate several proteins that have distinctly
different charge properties. Alternatively, a purication step using CIEX can be followed by a
second purication step using AIEX at the same pH.Mixed-mode ion exchangers, Capto™ adhere and Capto MMC, have been developed to offer
novel selectivities. The charged ligands are complemented with additional functional groups that
introduce additional cooperative interactions (combinations of hydrogen bonds, hydrophobic
and van der Waals interactions). Capto adhere can be used for the removal of aggregated
monoclonal antibodies to obtain pure monomers.
Hydroxyapatite chromatography (HAC) can also be considered a mixed-mode ion exchange
method. Crystals of hydroxyapatite Ca3(PO
4)3OH can be used as chromatography medium.
Proteins are believed to bind cooperatively to both calcium and phosphate ions on the
hydroxyapatite. The hydroxyapatite has a negative charge at neutral pH, and proteins that bind
AIEX media tend to also bind to hydroxyapatite. HAC is a less common purication method,
partly because of its unpredictable separation mechanism and low binding capacity.
For further information please refer to Ion Exchange Chromatography and Chromatofocusing
Handbook: Principles and Methods from GE Healthcare (see also the "Related literature" section
at the end of this handbook).
Hydrophobic interaction chromatography (HIC)HIC separates proteins with differences in hydrophobicity. The method is well-suited for the capture
or intermediate steps in a purication protocol. Separation is based on the reversible interactionbetween a protein and the hydrophobic surface of a chromatography medium (Fig 2.12). This
interaction is enhanced by high-ionic-strength buffer, which makes HIC an excellent purication
step after precipitation with ammonium sulfate or elution in high salt during IEX. There is no
universally accepted theory on the mechanisms involved in HIC. For a brief discussion of the
mechanisms, see Hydrophobic Interaction Chromatography and Reversed Phase Handbook:
Principles and Methods from GE Healthcare (see also the "Related literature" section at the end of
this handbook).
Fig2.12.Schematic depicting HIC.
Hydrophobic ligand
High-salt buffer
Hydrophobic proteins
Less hydrophobic protein
8/22/2019 Purificação de Proteínas - Estratégias, handbook
http://slidepdf.com/reader/full/purificacao-de-proteinas-estrategias-handbook 28/167
26 28-9833-31 AA
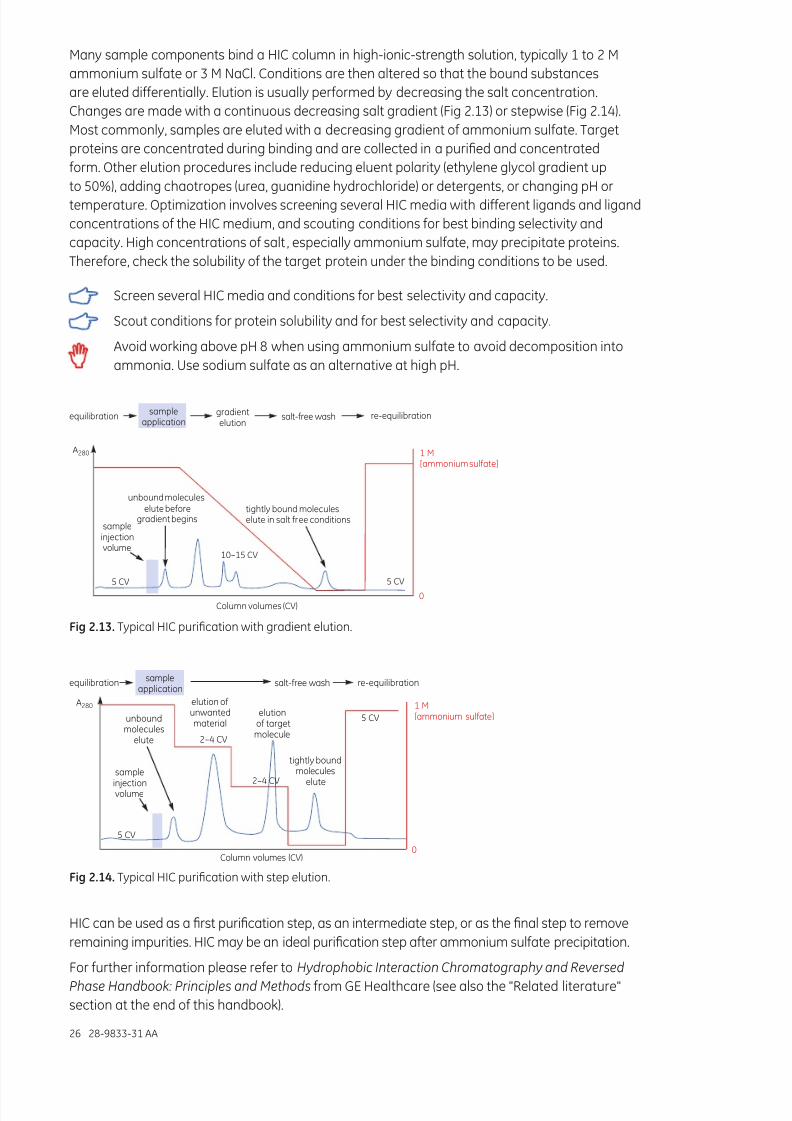
Many sample components bind a HIC column in high-ionic-strength solution, typically 1 to 2 M
ammonium sulfate or 3 M NaCl. Conditions are then altered so that the bound substances
are eluted differentially. Elution is usually performed by decreasing the salt concentration.
Changes are made with a continuous decreasing salt gradient (Fig 2.13) or stepwise (Fig 2.14).
Most commonly, samples are eluted with a decreasing gradient of ammonium sulfate. Target
proteins are concentrated during binding and are collected in a puried and concentrated
form. Other elution procedures include reducing eluent polarity (ethylene glycol gradient up
to 50%), adding chaotropes (urea, guanidine hydrochloride) or detergents, or changing pH ortemperature. Optimization involves screening several HIC media with different ligands and ligand
concentrations of the HIC medium, and scouting conditions for best binding selectivity and
capacity. High concentrations of salt , especially ammonium sulfate, may precipitate proteins.
Therefore, check the solubility of the target protein under the binding conditions to be used.
Screen several HIC media and conditions for best selectivity and capacity.
Scout conditions for protein solubility and for best selectivity and capacity.
Avoid working above pH 8 when using ammonium sulfate to avoid decomposition into
ammonia. Use sodium sulfate as an alternative at high pH.
Column volumes (CV)
5 CV
0
5 CV
10–15 CV
unbound moleculeselute before
gradient begins
equilibration re-equilibrationgradientelution
sampleapplication
salt-free wash
tightly bound moleculeselute in salt free conditions
A280
[ammonium sulfate]1 M
sampleinjectionvolume
Fig2.13.Typical HIC purication with gradient elution.
Column volumes (CV)
5 CV
2–4 CV
equilibration re-equilibration
sampleinjectionvolume
unboundmolecules
elute
tightly boundmolecules
elute
elution of unwantedmaterial
elutionof targetmolecule
5 CV
salt-free wash
2–4 CV
A280
[ammonium sulfate]1 M
0
sampleapplication
Fig2.14.Typical HIC purication with step elution.
HIC can be used as a rst purication step, as an intermediate step, or as the nal step to remove
remaining impurities. HIC may be an ideal purication step after ammonium sulfate precipitation.
For further information please refer to Hydrophobic Interaction Chromatography and Reversed
Phase Handbook: Principles and Methods from GE Healthcare (see also the "Related literature"
section at the end of this handbook).

8/22/2019 Purificação de Proteínas - Estratégias, handbook
http://slidepdf.com/reader/full/purificacao-de-proteinas-estrategias-handbook 29/167
28-9833-31 AA 27
Chromatofocusing (CF)Chromatofocusing separates proteins according to differences in their isoelectric point (pI).
It is a powerful method and can resolve very small differences in pI (down to 0.02 pH units) and
thus separate very similar proteins. The capacity of the method is, however, low, and it should
ideally be used for partially pure samples. A pH gradient is generated on the column as buffer
and chromatography medium interact. The medium is a weak anion exchanger, and the buffer
is composed of a large number of buffering substances as in Polybuffer™. Proteins with different
pI values migrate at different rates down the column as the pH gradient develops, continuallybinding and dissociating while being focused into narrow bands and nally eluted. The protein
with the highest pI elutes rst, and the protein with the lowest pI elutes last. The upper limit of
the gradient is dened by the pH of the start buffer, and the lower limit of the gradient is dened
by the pH of the elution buffer (Fig 2.15). Polybuffers perform best over pH intervals of 3 pH units
or less, and the narrowest pH intervals are likely to give the highest resolution.
A chromatofocusing medium is equilibrated with start buffer (standard buffer with low ionic
strength) at a pH slightly above the highest pH required. An elution buffer (Polybuffer adjusted
to the lowest pH required) is passed through the column and begins to titrate the amines on
the medium and the proteins. As the buffer ows through the column, the pH is lowered, anda moving, descending pH gradient is generated. After a pre-gradient volume of elution buffer
has passed, sample (in start buffer) is applied to the column. The proteins in the sample are
titrated (pH adjusted) as soon as they are introduced into the column. Proteins in the sample
that are at a pH above their pI are negatively charged and bind near the top of the column. Any
proteins that are at a pH below their pI begin to migrate down the column with the buffer ow
and will not bind until they reach a zone where the pH is above their pI. As the pH continues to
decrease inside the column, any protein that drops below its pI becomes positively charged, is
repelled by the positively charged amine groups of the medium, and begins to migrate down
the column with the elution buffer, traveling faster than the speed at which the pH gradient
moves down the column. The process continues until the proteins have been eluted from thecolumn at a pH near their pI. The protein with the highest pI is eluted rst and the protein with
the lowest pI is eluted last.
Sample: Partially puried hemoglobins
Column: Mono P™, 0.5 cm × 20 cm
Start buffer: 0.025 M triethanolamine-methanesulfonic acid,
pH 8.1
Flow rate: 1 ml/min (305 cm/h)
Elution buffer: Polybuffer 96-methanesulfonic acid, diluted in distilled water 1:16, pH 6.65
6.5
0
E S
A
F
10 20
7.0
7.5
8.0100
50
%
fullscale
30
pHA (mAU)280
Time (min)
Fig2.15.Example of chromatofocusing purication. Green line represents pH in eluted fraction. The peaksE, S, A, and F represent subgroups of hemoglobins that are very well separated even though the pI betweenthe A and F subgroup differs by only 0.05 pH unit.

8/22/2019 Purificação de Proteínas - Estratégias, handbook
http://slidepdf.com/reader/full/purificacao-de-proteinas-estrategias-handbook 30/167
28 28-9833-31 AA
Use chromatofocusing for high-resolution, analytical separations and in preparative
purication if IEX or other methods do not give a satisfactory purication.
Avoid using chromatofocusing for proteins that easily precipitate at their isoelectric
point. Such proteins are likely to precipitate on the column if they reach a concentration
that is too high.
For further information please refer to Ion Exchange Chromatography and Chromatofocusing
Handbook: Principles and Methods from GE Healthcare (see also the "Related literature" section
at the end of this handbook).
Reversed phase chromatography (RPC)RPC separates proteins and peptides on the basis of hydrophobicity (Fig 2.16). RPC is a high-
resolution method, requiring the use of organic solvents.
Fig2.16.Schematic depicting RPC.
The method is widely used for purity check analyses when activity and tertiary structure are not
a focus. Because many proteins are denatured by organic solvents, the method is not generally
recommended for preparative protein purication—the recovery of activity and native tertiary
structure often is compromised. Proteins tend to denature and bind strongly to the RPC medium,
and can be very difcult to elute. However, in the polishing phase, when the majority of protein
impurities have been removed, RPC is excellent, particularly for small target proteins that areless commonly denatured by organic solvents.
Sample components bind as they are loaded onto the chromatography column. Conditions are
then altered so that the bound substances are eluted differentially. Due to the nature of the
reversed phase matrices, binding is usually very strong. Binding may be modulated by the use
of organic solvents and other additives (ion pairing agents). Elution is usually performed by an
increase in organic solvent concentration. Acetonitrile, methanol, ethanol, and propanol are
Hydrophobic ligand
Eluent containing organic solvent
Hydrophobic proteins
Hydrophilic protein
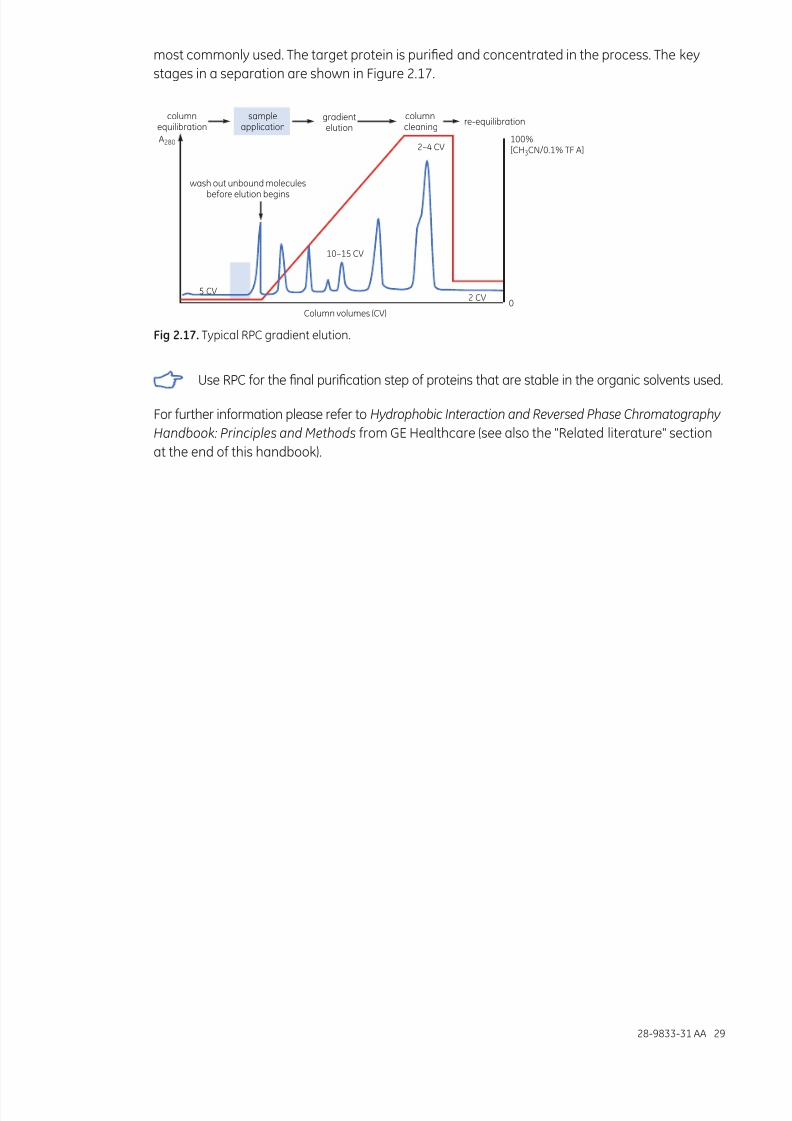
8/22/2019 Purificação de Proteínas - Estratégias, handbook
http://slidepdf.com/reader/full/purificacao-de-proteinas-estrategias-handbook 31/167
28-9833-31 AA 29
most commonly used. The target protein is puried and concentrated in the process. The key
stages in a separation are shown in Figure 2.17.
Column volumes (CV)
10–15 CV
2–4 CV
2 CV5 CV
wash out unbound moleculesbefore elution begins
sampleapplication
re-equilibrationcolumn
equilibrationgradientelution
columncleaning
[CH3CN/0.1% TF A]100%
0
A280
Fig2.17.Typical RPC gradient elution.
Use RPC for the nal purication step of proteins that are stable in the organic solvents used.
For further information please refer to Hydrophobic Interaction and Reversed Phase Chromatography
Handbook: Principles and Methods from GE Healthcare (see also the "Related literature" section
at the end of this handbook).

8/22/2019 Purificação de Proteínas - Estratégias, handbook
http://slidepdf.com/reader/full/purificacao-de-proteinas-estrategias-handbook 32/167
30 28-9833-31 AA

8/22/2019 Purificação de Proteínas - Estratégias, handbook
http://slidepdf.com/reader/full/purificacao-de-proteinas-estrategias-handbook 33/167
28-9833-31 AA 31
Chapter 3Desalting, buffer exchange, and proteinconcentration
In this chapter, we will focus on two key aspects of protein purication: desalting and similarapplications using GF, and protein concentration by ultraltration. Other methods will be
addressed briey.
GF for desalting, removal of low-molecular-weight substances, andbuffer exchangeDuring purication work, there is often a need to change the composition of samples or of
preparations of puried protein before the end application. Examples include:
• Before IEX to remove salt, for example, for the purpose of decreasing the ionic strength of a
sample to allow binding to the column, or after IEX to remove the salt used for elution• Before any purication step to remove a low-molecular-weight substance that interferes
with the purication, or to change pH or exchange one buffer component for another
• After AC to remove a low-molecular-weight component used for elution, which may be
important if the substance interferes with stability or activity of the target protein or with
subsequent purication
• After low-pH elution in a purication step, to restore pH
• After purication to make a nal adjustment of conditions of the puried protein
• After labeling or other chemical modication of a protein, to stop the reaction or to remove
excess reagents
• To remove inhibitors from enzymes
Desalting at laboratory scale is a well-proven, simple, and very fast method that, in a single step, will
rapidly remove low-molecular-weight contaminants and transfer the sample into the desired buffer.
GE Healthcare offers a range of prepacked chromatography columns and 96-well lter plates
that can be used manually, together with a chromatography system, or in high-throughput
applications (Table 3.1 and Fig 3.1). The majority of these products contain Sephadex G-25, a GF
medium that allows effective removal of low-molecular-weight substances from proteins with
Mr> 5000. PD MiniTrap™ G-10 and PD MidiTrap™ G-10 columns contain Sephadex G-10. These
prepacked, single-use gravity columns allow desalting/buffer exchange of smaller proteinswith M
r> 700.
Use desalting/buffer exchange when needed: before purication, between purication
steps, and/or after purication. These are very fast methods compared with dialysis,
but remember that each extra step can reduce yield and that desalting often dilutes the
sample (centrifugation protocols for desalting do not dilute samples).
Use Sephadex G-25 products to remove salts and other low-molecular-weight
compounds from proteins with Mr> 5000 and Sephadex G-10 products for proteins and
peptides with Mr> 700.
Puried fractions may have a concentration of target protein that is too low or be in
a volume that is too large. In such cases, Vivaspin™ sample concentrators (see next
section) can be used for concentrating the sample before buffer exchange.

8/22/2019 Purificação de Proteínas - Estratégias, handbook
http://slidepdf.com/reader/full/purificacao-de-proteinas-estrategias-handbook 34/167
32 28-9833-31 AA
Desalting provides several advantages over dialysis. Dialysis is generally a slow method that
requires large volumes of buffer and carries the risk that material and target protein activity will
be lost during handling. When desalting, sample volumes of up to 30% of the total volume of the
desalting column can be processed. The high speed and capacity of the separation allows even
relatively large sample volumes to be processed rapidly and efciently in the laboratory. Sample
concentration does not inuence the separation as long as the concentration of proteins does
not exceed approximately 70 mg/ml when using normal aqueous buffers, and provided that the
target protein is stable and soluble at the concentration used. Use 100 mM ammonium acetateor 100 mM ammonium hydrogen carbonate if volatile buffers are required.
Consider whether the conditions of the sample can be adjusted simply by additions or
dilution of the sample. For AC or IEX, it may be sufcient to adjust the pH of the sample
and, if necessary, the ionic strength. Before HIC, ammonium sulfate is normally added
and the pH adjusted.
There are a number of different formats available for desalting; see Fig 3.1 and Table 3.1.
A) B) C)
D) E) F)
Fig3.1.Different formats for desalting. (A) PD SpinTrap™ G-25 single or parallel use (70 to 130 μl sample)by centrifugation. (B) PD-10 for single or parallel use (1 to 2.5 ml sample) by gravity or centrifugation.(C) PD MiniTrap (left) and PD MidiTrap (right) for single or parallel use by gravity or centrifugation.(D) PD MultiTrap™ G-25 96-well plates for parallel use (70 to 130 μl sample), either by centrifugationmanually or by a robotic system. (E) HiTrap Desalting for single samples (0.1 to 1.5 ml) using a syringe,pump, or chromatography system. (F) HiPrep Desalting for single samples (up to 15 ml) using a pump orchromatography system.

8/22/2019 Purificação de Proteínas - Estratégias, handbook
http://slidepdf.com/reader/full/purificacao-de-proteinas-estrategias-handbook 35/167
28-9833-31 AA 33
Table3.1.Selection table for desalting/buffer exchange columns
Columnsand96-wellplates
Chromatographymedium
Loadedvolume(ml)
Elutedvolume(ml)
Dilutionactor
Operation
PD SpinTrap G-25 Sephadex G-25Medium
0.07–0.13 0.07–0.13* No dilution Centrifuge
PD MultiTrap G-25 Sephadex G-25Medium
0.07–0.13 0.07–0.13* No dilution Centrifuge
PD MiniTrap G-25 Sephadex G-25Medium
0.2–0.5 0.1–0.5 No dilution Centrifuge
0.1-0.5 1.0 2-10 Gravity ow
PD MidiTrap G-25 Sephadex G-25Medium
0.75-1.0 0.5–1.0 No dilution Centrifuge
0.5-1.0 1.5 1.5-3 Gravity ow
PD-10 Desalting columns Sephadex G-25Medium
1.75-2.5 1.0–2.5 No dilution Centrifuge
1.0-2.5 3.5 1.5-3.5 Gravity ow
PD MiniTrap G-10 Sephadex G-10Medium
0.1-0.3 0.5 1.7-5 Gravity ow
PD MidiTrap G-10 Sephadex G-10
Medium
0.4-1.0 1.2 1.2-3 Gravity ow
HiTrap Desalting Sephadex G-25Superne
0.25 1.0 4 (approx) Syringe/pump/system
0.5 1.5 3 (approx) Syringe/pump/system
1.0 2.0 2 (approx) Syringe/pump/system
1.5 (max.) 2.0 1.3 (approx) Syringe/pump/system
2× HiTrap Desalting Sephadex G-25Superne
3.0 (max.) 4.0–5.0 1.3–1.7 Syringe/pump/system
3× HiTrap Desalting Sephadex G-25Superne
4.5 (max.) 6.0–7.0 1.3–1.7 Syringe/pump/system
HiPrep 26/10 Sephadex G-25
Fine
10 10–15 1.0–1.5 Pump/system
15 (max.) 15–20 1.0–1.3 Pump/system
2× HiPrep 26/10 Sephadex G-25Fine
30 (max.) 30–40 1.0–1.3 Pump/system
3× HiPrep 26/10 Sephadex G-25Fine
45 (max.) 45–55 1.0–1.2 Pump/system
4× HiPrep 26/10 Sephadex G-25Fine
60 (max.) 60–70 1.0–1.2 Pump/system
Contains Sephadex G-25 MediumContains Sephadex G-10 MediumContains Sephadex G-25 SuperneContains Sephadex G-25 Fine
* Applied volume = eluted volume; For sample volumes less than 100 μl it is recommended to apply a stacker volume of 30 μlequilibration buffer after the sample has fully absorbed
Method
The desalting column or plate is thoroughly equilibrated with the solution (buffer) into which
the sample is to be transferred, and the sample is applied. See Table 3.1 for maximum sample
volume for different columns and plates. The same solution is applied to elute the desalted
sample. In centrifugation protocols for desalting, the sample is applied and collection is
performed directly by centrifugation. No addition of solution (buffer) is required to elute the
sample. This method gives essentially no sample dilution. Figures 3.2 and 3.3 show typical
examples of laboratory-scale desalting using HiTrap and HiPrep Desalting columns, respectively.
Notice the efcient salt removal and the very short processing time. Detailed protocols can
be found in the Recombinant Protein Purication Handbook. Principles and Methods from GE
Healthcare (see also the "Related literature" section at the end of this handbook).

8/22/2019 Purificação de Proteínas - Estratégias, handbook
http://slidepdf.com/reader/full/purificacao-de-proteinas-estrategias-handbook 36/167
34 28-9833-31 AA
Generalconsiderations
Buer: A salt concentration of at least 25 mM is recommended to prevent possible ionic
interactions with the chromatography medium. At salt concentrations above 1.0 M, hydrophobic
substances may be delayed or they may bind to the matrix. Volatile buffers can be used,
for example, 100 mM ammonium acetate or 100 mM ammonium hydrogen carbonate (see
Appendix 1). Protein solubility often depends on pH and/or ionic strength (salt concentration),
and the exchange of buffer may sometimes therefore result in precipitation of the protein. Also,
protein activity can be lost if the change of pH takes it outside of the range where the protein isactive.
Sample:The concentration of the sample does not inuence the separation as long as the
viscosity does not differ more than a factor of 1.5 from that of the buffer used. This corresponds
to a maximum concentration of 70 mg/ml for proteins or 5 mg/ml for high-molecular-weight
polymers such as dextran, in normal aqueous buffers at room temperature. The sample should
be fully solubilized. Centrifuge or lter (0.45 μm lter) immediately before loading to remove
particulate material if necessary.
Column: HiTrap DesaltingSample: 2 mg/ml BSA in 50 mM sodium phosphate, 500 mM NaCl, pH 7.0Sample volume: 1.4 mlBuffer: 50 mM sodium phosphate, 150 mM NaCl, pH 7.0Flow rate: 10 ml/min
0.8
0.6
0.4
0.2
0.0
10 20 30 40 50 Time (s)
Conductivity(mS/cm)
50
40
30
20
0
BSA
NaCl
A 280
Fig3.2.Typical desalting using HiTrap Desalting monitored by UV absorption and conductivity.
Column: HiPrep 26/10 DesaltingSample: 2 mg/ml BSA, 0.07 mg/ml N-Hydroxysuccinimide (NHS) in 50 mM sodium phosphate,
0.15 M NaCl, pH 7.0. Filtered through a 0.45 μm lterSample volume: 13 mlBuffer: 50 mM sodium phosphate, 0.15 M NaCl, pH 7.0Flow rate: 31 ml/min (350 cm/h)
0.0 1.0 2.0 Time (min)
BSA
NHS
A280
Fig3.3. Removal of N-Hydroxysuccinimide from BSA.

8/22/2019 Purificação de Proteínas - Estratégias, handbook
http://slidepdf.com/reader/full/purificacao-de-proteinas-estrategias-handbook 37/167
28-9833-31 AA 35
Scalingupdesalting
For desalting of sample volumes larger than 1.5 ml, or to increase the resolution between high- and
low-molecular-weight components, up to three 5 ml HiTrap Desalting columns can easily be
connected in series. Alternatively, scaling up to HiPrep 26/10 Desalting allows up to a 15 ml sample
volume. Further scale-up can be accomplished by connecting up to four HiPrep 26/10 Desalting
columns for desalting of up to a 60 ml sample in one run (Fig 3.4). Even larger sample volumes
can be handled by repeating runs or by packing Sephadex G-25 medium in a single large column.
Fig3.4.A 60 ml sample volume can be desalted on four HiPrep 26/10 Desalting columns connected in series.
AutomatedrestorationopHaterlow-pHelution
Protein A Sepharose High Performance and Protein G Sepharose High Performance, available
in HiTrap columns, are commonly used for purifying antibodies at research scale. Binding is
performed at neutral pH and elution at low pH. The elution at low pH, however, may cause
conformational changes, and ultimately aggregation of the target antibody. Immediate buffer
exchange will minimize such risks. Figure 3.5 shows unattended purication of a monoclonal
antibody on HiTrap Protein G HP 1 ml. The eluted material was directly transferred to twoHiTrap Desalting 5 ml columns connected together for optimal column volume. The transfer
was automatically performed by switching of a valve in the system to change the ow path.
This procedure reduced the time that the eluted protein stayed at low pH to a minimum, greatly
reducing the risk of denaturation.
AfnitypurifcationColumn: HiTrap Protein G HP 1 mlSample: 3 ml monoclonal mouse IgG
1in cell
culture supernatant. Volume adjusted to20 ml in binding buffer prior to loading.
Binding buffer: 20 mM sodium phosphate, pH 7.0
Elution buffer: 100 mM glycine HCl, pH 2.7Flow rate: 1 ml/min
BuerexchangeColumn: HiTrap Desalting 2 × 5 mlSample: Eluted pool from HiTrap Protein G HP 1 mlBuffer: 20 mM sodium phosphate,
150 mM NaCl, pH 7.0Flow rate: 3 ml/min
0
100
200
300
400
500
600
700
A280 (mAU)
0 10 20 30 40 50 60 70 Time (min)
8
7
6
5
4
3
pH
V a l v e - s w i t c h
V a l v e - s w i t c h
Flowthrough material Target protein
Fig3.5Unattended afnity purication and buffer exchange of mouse IgG1
monoclonal antibody onÄKTAprime™ plus chromatography system.

8/22/2019 Purificação de Proteínas - Estratégias, handbook
http://slidepdf.com/reader/full/purificacao-de-proteinas-estrategias-handbook 38/167
36 28-9833-31 AA
Group-separationolargersubstances
Removal of contaminants with Mr>5000 cannot be accomplished using Sephadex G-25. Instead,
GF media with higher-molecular-weight separation ranges can be used. Chromatofocusinginvolves the use of Polybuffer. For most applications it is not necessary to remove Polybufferbecause the amount that is eluted with any sample is small. Polybuffers do not interfere withenzyme assays or amino acid analysis, but they may interfere with certain protein assayssuch as Lowry. Polybuffers can be removed from proteins by GF on Superdex™ 75 (Fig 3.6) or
Sephacryl™ S-100 HR columns.
Column: Superdex 75 10/300 GLSample: Myoglobin (M
r17 500) + Polybuffer 9–6
Buffer: Phosphate buffered salineFlow rate: 0.7 ml/min
0
500
1000
1500
2000
2500
A280 (mAU)
0.0
5.0
10.0
15.0
mS/cm
myoglobin
Polybuffer
ConductivityA , proteinA , protein
215
254
0 5 10 15 20 25 Volume (ml)
Fig3.6.Separation of Polybuffer from protein using GF. Notice that Polybuffer can be detected byabsorbance measured at 215 nm.
Other methods for desalting and buffer exchangeChromatography
Unwanted low-molecular-weight impurities are often removed as a side effect of the purication
of a protein. It may thus be advantageous to take this possibility into account when selecting
purication steps and the order in which to perform them. For example, the sample application
can be performed under one set of conditions, and the column can be washed and eluted using
another set of conditions. Obviously, different methods may bring different opportunities and
limitations to what conditions can be used.
Dialysis
Dialysis is a commonly used method for desalting and buffer exchange of proteins despite the
slow speed and large volumes of buffers often required. The sample is placed in a compartment
of a semipermeable membrane (Mrcutoff 3000 to 10 000) that is placed in a container with
a large volume of buffer having the desired end conditions. Dialysis is typically performed
overnight, especially for large samples.
We recommend desalting by Sephadex G-25 columns or plates as a rst alternative for
desalting, removal of low-molecular-weight substances, or buffer exchange because of
the short time required; this reduces the risk of protein aggregation and degradation.
Dialyzing small samples can be difcult and inefcient when the sample must be transferredinto and out of dialysis bags and centrifuge tubes. The disposable tubes in Mini Dialysis Kit from
GE Healthcare offer a simple solution to the handling problems of small-volume (0.25 to 2 ml)
dialysis. The dialysis tubes in the kit each have a cap that incorporates a small disk of dialysis
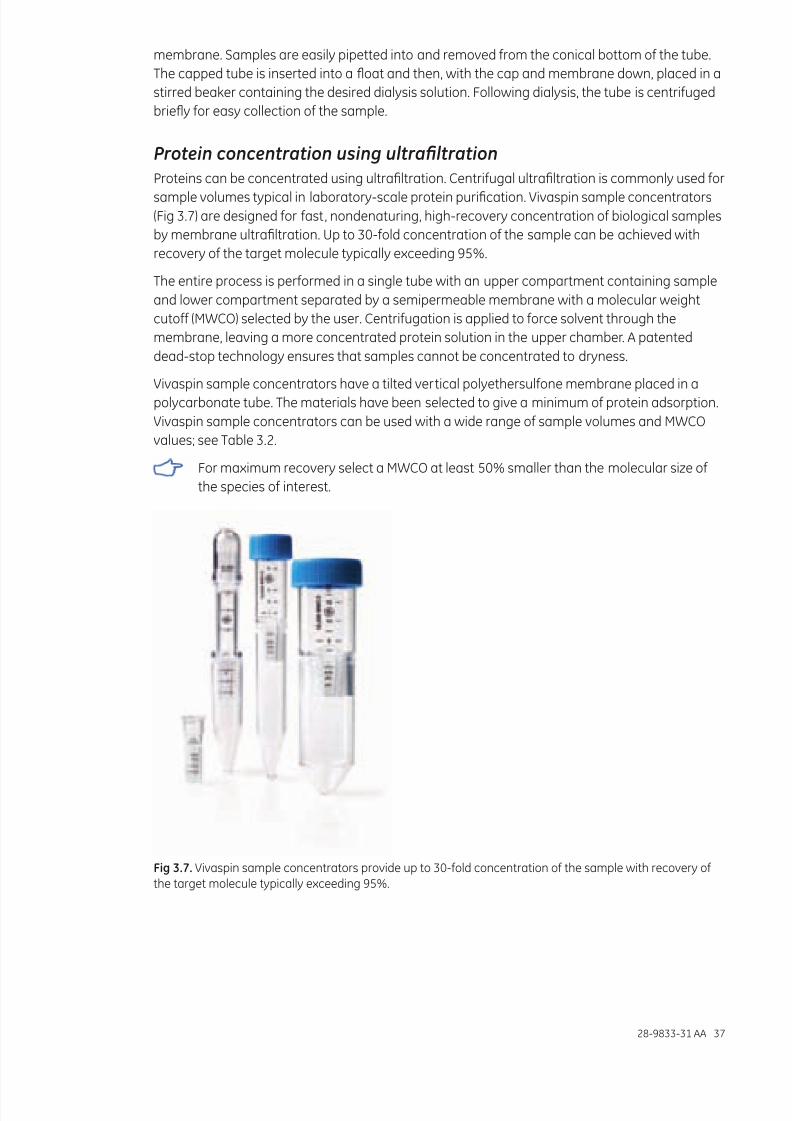
8/22/2019 Purificação de Proteínas - Estratégias, handbook
http://slidepdf.com/reader/full/purificacao-de-proteinas-estrategias-handbook 39/167
28-9833-31 AA 37
membrane. Samples are easily pipetted into and removed from the conical bottom of the tube.
The capped tube is inserted into a oat and then, with the cap and membrane down, placed in a
stirred beaker containing the desired dialysis solution. Following dialysis, the tube is centrifuged
briey for easy collection of the sample.
Protein concentration using ultraltrationProteins can be concentrated using ultraltration. Centrifugal ultraltration is commonly used for
sample volumes typical in laboratory-scale protein purication. Vivaspin sample concentrators
(Fig 3.7) are designed for fast, nondenaturing, high-recovery concentration of biological samples
by membrane ultraltration. Up to 30-fold concentration of the sample can be achieved with
recovery of the target molecule typically exceeding 95%.
The entire process is performed in a single tube with an upper compartment containing sample
and lower compartment separated by a semipermeable membrane with a molecular weight
cutoff (MWCO) selected by the user. Centrifugation is applied to force solvent through the
membrane, leaving a more concentrated protein solution in the upper chamber. A patented
dead-stop technology ensures that samples cannot be concentrated to dryness.
Vivaspin sample concentrators have a tilted vertical polyethersulfone membrane placed in a
polycarbonate tube. The materials have been selected to give a minimum of protein adsorption.
Vivaspin sample concentrators can be used with a wide range of sample volumes and MWCO
values; see Table 3.2.
For maximum recovery select a MWCO at least 50% smaller than the molecular size of
the species of interest.
Fig3.7.Vivaspin sample concentrators provide up to 30-fold concentration of the sample with recovery of the target molecule typically exceeding 95%.

8/22/2019 Purificação de Proteínas - Estratégias, handbook
http://slidepdf.com/reader/full/purificacao-de-proteinas-estrategias-handbook 40/167
38 28-9833-31 AA
Table3.2.Vivaspin columns and sample volume ranges. All Vivaspin columns are available with MWCO 3000,5000, 10 000, 30 000, 50 000, and 100 000.
Product Volumerange
Vivaspin 500 100-500 μl
Vivaspin 2 400 μl to 2 ml
Vivaspin 6 2-6 μl
Vivaspin 20 5-20 ml
Other methods for protein concentrationLyophilization
Lyophilization (freeze drying) of a protein is a way to obtain a dry powder of the protein. Even
though not all proteins are stable enough to survive lyophilization, this is a common method for
preserving and shipping proteins. Many proteins can be stored for months or years in dried form.
Lyophilization is performed by freezing the protein solution and then using lyophilization
equipment, applying a vacuum to cause sublimation (evaporation) of the solvent. Beforefreeze drying, the protein is usually transferred, for example, by desalting, to a suitable volatile
buffer (see Appendix 1), and stabilizers are often added. The stabilizers are typically sugars,
for example, trehalose or sucrose, or polyalcohols. Freezing should be performed quickly,
for example, by submersion in liquid nitrogen or a mixture of dry ice and ethanol, to avoid
denaturation.
Chromatographicconcentration
In protein purication the focus of the rst (capture) step, besides purication, is to increase
the concentration of target protein (or decrease the sample volume). Any adsorptive
chromatography method, for example, AC, IEX, HIC, or RPC, can be used to increase the
concentration of a protein. The concentration that can be obtained in an eluted preparation is
limited by the binding capacity of the column used and may be reduced by zone broadening
during elution. IEX may be especially interesting because of the typically high binding capacities.
A drawback with the use of chromatography for concentrating proteins is obviously that the
preparation will contain the substance used for elution. If required, the contaminant can be
removed by desalting. Adsorption of proteins on columns can give concentrations of more than
100 mg/ml, which risks causing the protein to precipitate.
Precipitation
Precipitation using trichloroacetic acid (TCA) is an efcient procedure for concentrating proteins
when there is no need to maintain protein activity. Precipitation using neutral salts, for example,
ammonium sulfate, can often be accomplished without loss of activity. This method is relatively
common for purication and enrichment of a target protein from extracts (see Chapter 6).
Protein crystallization can also be used for protein concentration, but is less common because it
is often difcult to nd conditions that allow crystal formation.

8/22/2019 Purificação de Proteínas - Estratégias, handbook
http://slidepdf.com/reader/full/purificacao-de-proteinas-estrategias-handbook 41/167
28-9833-31 AA 39
Chapter 4Purication strategies
Afnity-tagged proteins and antibodies can often be puried by a single-step protocol using
AC to achieve the desired level of purity. However, the purity obtained after a single step is
sometimes not sufcient. An additional purication step may be required, in some instances
even two or more additional steps.
Untagged proteins usually require a multi-step purication protocol. These proteins may come
from natural sources or have been overexpressed without a tag because the presence of a tag
would interfere with the use of the protein.
The focus of this chapter is to describe a generic strategy for protein purication that can
be used for multi-step purication of untagged proteins as well as single-step purication of
afnity-tagged protein. The process of planning the purication; describing the purication
requirements, collecting information about the target protein and source material, and setting
objectives will be the focus of the following chapter.
Three-stage purication strategy (CIPP)
The need to obtain a protein with sufcient purity and quantity in an efcient and economical
way applies to any purication, from preparation of an enriched protein extract for biochemical
characterization to large-scale production of a therapeutic recombinant protein. The purication
strategy Capture, Intermediate Purication, and Polishing (CIPP) (Fig 4.1) has been developed to
simplify planning and execution of protein purication. The strategy gives guidelines for how to
combine purication methods in the best way to reach the set goals.
Step
y t i r u
P
Capture
Intermediatepurification
Polishing
Preparation,extraction,clarification
Achieve finalhigh-level purity
Remove bulkimpurities
Isolate, concentrate,and stabilize
Fig4.1. The three-stage purication strategy.
Sample preparation is the starting point of the purication strategy (see Chapter 6). The purpose
of sample preparation is to obtain a claried extract of the source material. The extract should be
prepared under or adjusted to conditions that are compatible with the rst chromatography step.
In the capture stage the objectives are to isolate, concentrate, and stabilize the target product.The product should be concentrated and transferred to an environment that will conserve
potency/activity. At best, signicant removal of critical contaminants can also be achieved.

8/22/2019 Purificação de Proteínas - Estratégias, handbook
http://slidepdf.com/reader/full/purificacao-de-proteinas-estrategias-handbook 42/167
40 28-9833-31 AA
During the intermediate purication stage, the key objective is to remove most of the bulk impurities,
such as other proteins and nucleic acids, endotoxins, and viruses. If the capture step is efcient,
the intermediate purication stage is often omitted in favor of one or more polishing steps.
In the polishing stage, most impurities have already been removed. Now only trace amounts
of impurities remain and possibly proteins closely related to the target protein. In the polishing
stage, remaining impurities are removed and the target protein may be transferred to conditions
suitable for use or storage. The objective is to achieve nal purity.
Apply a systematic approach to development of a purication strategy.
Assign a specic objective to each step within the purication process.
The three-stage purication strategy does not mean that all protocols must have three
purication steps. The number of steps to be included will depend on the purity requirements
and intended use of the protein. Increasing the number of purication steps will often decrease
the overall protein recovery (Fig 4.2). More steps mean longer purication time, which can be
detrimental to activity. For most laboratory-scale work a two- or three-step purication protocol
will be sufcient. Difcult purications may require several additional steps.
95%/step
75%/step
90%/step
85%/step
80%/step
100
80
60
40
20
0
101 2 3 4 5
Number of steps
6 7 8 9
Yield (%)
Fig4.2.Total yield versus number of purication steps.
Limit the number of steps in a purication procedure.
Perormanceparameters
There are four important performance parameters to consider when planning each puricationstep: resolution, capacity, speed, and recovery. Optimization of any one of these four parameters
can be achieved only at the expense of the others, and each purication step will be a compromise
(Fig. 4.3). The importance of each parameter will vary depending on whether a purication step is
used for capture, intermediate purication, or polishing. Purication methods should be selected
and optimized to meet the objectives for each purication step.
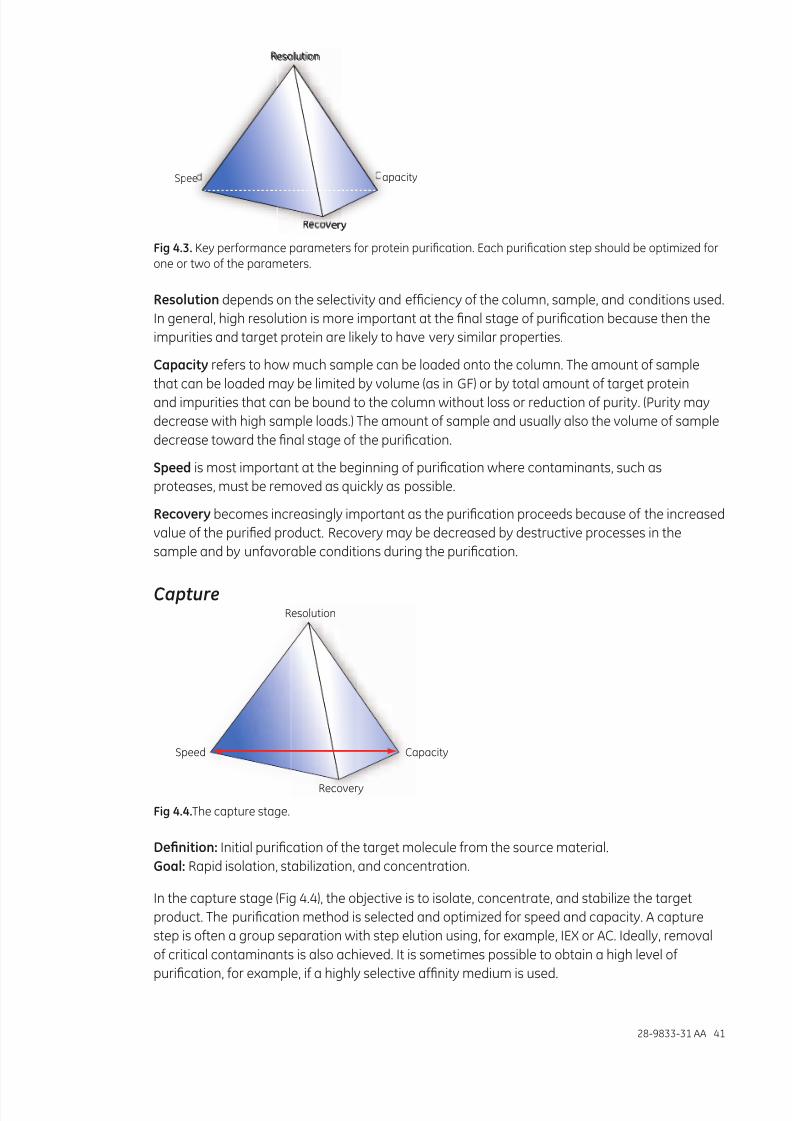
8/22/2019 Purificação de Proteínas - Estratégias, handbook
http://slidepdf.com/reader/full/purificacao-de-proteinas-estrategias-handbook 43/167
28-9833-31 AA 41
Resolution
Capacity
Recovery
Speed
Resolution
Recovery
ee
R
ap
y
esolutionl
er
Fig4.3. Key performance parameters for protein purication. Each purication step should be optimized forone or two of the parameters.
Resolution depends on the selectivity and efciency of the column, sample, and conditions used.
In general, high resolution is more important at the nal stage of purication because then the
impurities and target protein are likely to have very similar properties.
Capacity refers to how much sample can be loaded onto the column. The amount of sample
that can be loaded may be limited by volume (as in GF) or by total amount of target protein
and impurities that can be bound to the column without loss or reduction of purity. (Purity may
decrease with high sample loads.) The amount of sample and usually also the volume of sample
decrease toward the nal stage of the purication.
Speedis most important at the beginning of purication where contaminants, such as
proteases, must be removed as quickly as possible.
Recovery becomes increasingly important as the purication proceeds because of the increased
value of the puried product. Recovery may be decreased by destructive processes in the
sample and by unfavorable conditions during the purication.
CaptureResolution
Capacity
Recovery
Speed
Fig4.4.The capture stage.
Defnition: Initial purication of the target molecule from the source material.
Goal:Rapid isolation, stabilization, and concentration.
In the capture stage (Fig 4.4), the objective is to isolate, concentrate, and stabilize the target
product. The purication method is selected and optimized for speed and capacity. A capture
step is often a group separation with step elution using, for example, IEX or AC. Ideally, removalof critical contaminants is also achieved. It is sometimes possible to obtain a high level of
purication, for example, if a highly selective afnity medium is used.
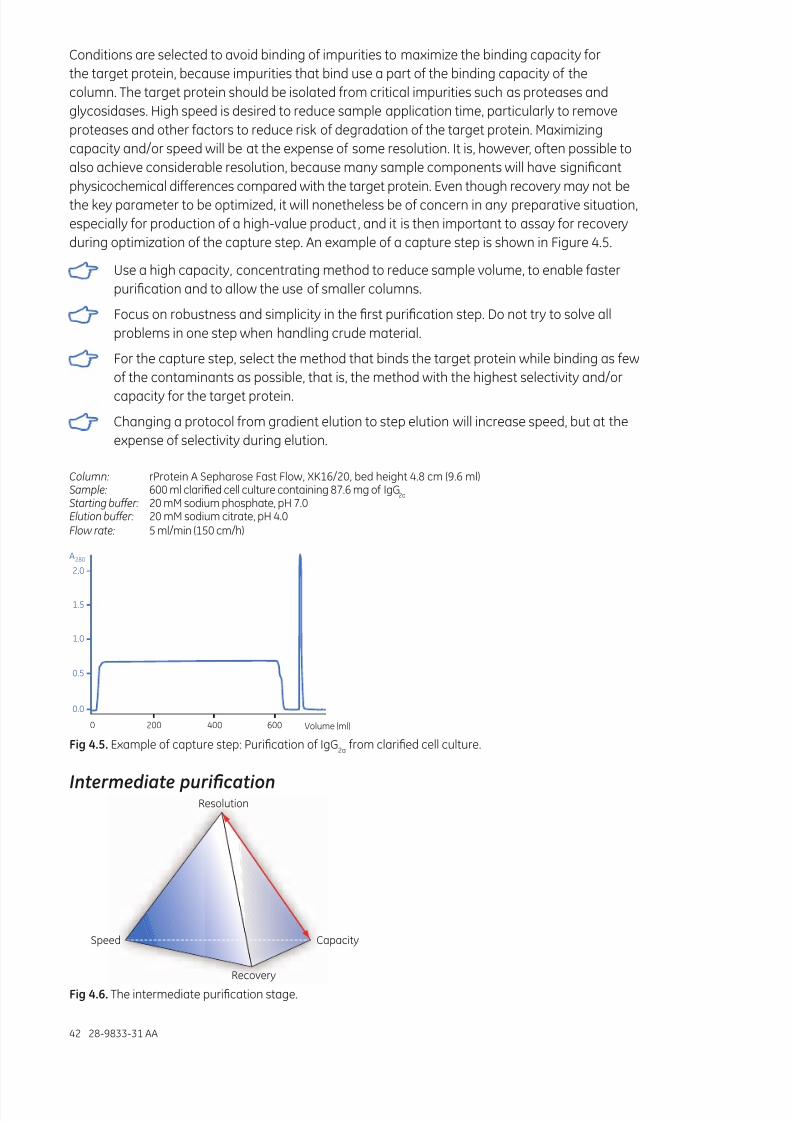
8/22/2019 Purificação de Proteínas - Estratégias, handbook
http://slidepdf.com/reader/full/purificacao-de-proteinas-estrategias-handbook 44/167
42 28-9833-31 AA
Conditions are selected to avoid binding of impurities to maximize the binding capacity for
the target protein, because impurities that bind use a part of the binding capacity of the
column. The target protein should be isolated from critical impurities such as proteases and
glycosidases. High speed is desired to reduce sample application time, particularly to remove
proteases and other factors to reduce risk of degradation of the target protein. Maximizing
capacity and/or speed will be at the expense of some resolution. It is, however, often possible to
also achieve considerable resolution, because many sample components will have signicant
physicochemical differences compared with the target protein. Even though recovery may not bethe key parameter to be optimized, it will nonetheless be of concern in any preparative situation,
especially for production of a high-value product, and it is then important to assay for recovery
during optimization of the capture step. An example of a capture step is shown in Figure 4.5.
Use a high capacity, concentrating method to reduce sample volume, to enable faster
purication and to allow the use of smaller columns.
Focus on robustness and simplicity in the rst purication step. Do not try to solve all
problems in one step when handling crude material.
For the capture step, select the method that binds the target protein while binding as few
of the contaminants as possible, that is, the method with the highest selectivity and/orcapacity for the target protein.
Changing a protocol from gradient elution to step elution will increase speed, but at the
expense of selectivity during elution.
Column: rProtein A Sepharose Fast Flow, XK16/20, bed height 4.8 cm (9.6 ml)Sample: 600 ml claried cell culture containing 87.6 mg of IgG
2a
Starting buffer: 20 mM sodium phosphate, pH 7.0Elution buffer: 20 mM sodium citrate, pH 4.0Flow rate: 5 ml/min (150 cm/h)
2.0
1.5
1.0
0.5
0.0
0 200 400 600 Volume (ml)
A280
Fig4.5.Example of capture step: Purication of IgG2a
from claried cell culture.
Intermediate puricationResolution
Capacity
Recovery
Speed
Fig4.6.The intermediate purication stage.

8/22/2019 Purificação de Proteínas - Estratégias, handbook
http://slidepdf.com/reader/full/purificacao-de-proteinas-estrategias-handbook 45/167
28-9833-31 AA 43
Defnition:Further removal of bulk contaminants.
Goal:Purication and concentration.
The intermediate stage is commonly omitted from the purication protocol, because the capture
step is efcient enough by itself (single-step purication) or can be complemented by one
or more polishing step(s) to obtain the required purity. In the intermediate purication stage
(Fig 4.6), the focus is to separate the target protein from most of the bulk impurities such as
other proteins, nucleic acids, endotoxins, and viruses. The ability to chromatographically resolvesimilar components is of increased importance. The requirements for resolution will depend on
the properties of the sample produced from the capture step and the purity requirements for
the nal product. If the capture step has been efcient, it is often not necessary to include an
intermediate purication step. Instead, a high-resolution polishing step may be applied.
The purication method must give a high-resolution separation. Elution by a continuous
gradient will often be required.
In the intermediate purication stage, the capacity will still be important to maintain recovery,
because there may still be signicant amounts of impurities. Speed is often less critical in
intermediate purication, because the impurities causing proteolysis or other destructive effects
preferably have been removed, and sample volume has been reduced in the capture step. The
optimal balance between capacity and resolution must be dened for each case. As in the
capture stage, selectivity will be important, not only to achieve high binding capacity for the
target protein. However, in contrast to most capture steps, selectivity during elution is important
and is usually achieved by applying a continuous gradient or a multi-step elution procedure. An
example of intermediate purication steps is shown in Figure 4.7.
Column: XK 16/20 Butyl Sepharose 4 Fast FlowSample: 5 ml of partially puried Annexin V expressed in E. coliBuffer A: 20 mM Sodium phosphate, pH 7.0, 1 M (NH
4)2SO
4
Buffer B: 20 mM Sodium phosphate, pH 7.0Flow rate: 100 cm/h Gradient: 0 to 50% B, 20 column volumes
Time (min)0
Annexin V
60
A280
Fig4.7.Example of an intermediate purication step: Purication of recombinant Annexin V by HIC.

8/22/2019 Purificação de Proteínas - Estratégias, handbook
http://slidepdf.com/reader/full/purificacao-de-proteinas-estrategias-handbook 46/167
44 28-9833-31 AA
PolishingResolution
Capacity
Recovery
Speed
Fig4.8. The polishing stage.
Defnition:Final removal of trace contaminants and adjustment of pH, salts, or additives for
use or storage.
Goal:End product of required high-level purity.
In the polishing stage (Fig 4.8), the focus is put on high resolution to achieve nal purity. Most
contaminants and impurities have already been removed. The impurities remaining can be trace
impurities of proteins or other unwanted substances (e. g., endotoxins, nucleic acids, or viruses),
and closely related proteins such as microheterogeneous structural variants. A polishing step
can also be used to remove fragments or aggregates of the target protein.
The method chosen must discriminate between the target protein and any remaining impurities
to be removed. To achieve enough resolution it may be necessary to sacrice sample load (overload
may decrease purity) and recovery by narrow peak fractionation. High resolution usually
requires selection of a high-efciency chromatography medium with small, uniform bead sizes.
Recovery of the nal product is also a high priority, and a method must be selected that ensuresthe highest possible recovery. Product losses at this stage are more costly than in earlier stages.
Ideally, the product should be recovered in buffer conditions ready for the next procedure.
High-resolution GF is often used for polishing. In GF, the size of the column determines the
volume of sample that can be applied. It is thus most efcient to apply this method at the end of
the purication protocol, when the sample volume has been decreased by the earlier purication
steps. GF has the additional advantage that fragments and aggregates of the target protein
can also often be removed (Fig 4.9), and the protein is transferred into any desired buffer. To
remove impurities of similar size as the target protein, an alternative high-resolution method is
recommended, for example IEX (Fig 4.10).

8/22/2019 Purificação de Proteínas - Estratégias, handbook
http://slidepdf.com/reader/full/purificacao-de-proteinas-estrategias-handbook 47/167
28-9833-31 AA 45
Column: XK 16/60 packed with Superdex 75 prep gradeSample: 1.0 ml of partially puried ZZ-brain IGF
Buffer: 300 mM ammonium acetate, pH 6.0
Flow rate: 0.5 ml/min (15 cm/h)
0 1 2 3 4
10
5
monomeric
ZZ-Brain IGF
IIIII
I
I
Time (h)Fraction
VO
Vt
1 3 5
A (mAU)280
Fig4.9.Example of polishing step: removal of dimers and multimers by GF.
Column: Mono S™ 5/50 GL
Sample: 14.5 ml of partially puried and desalted transposase TniA
Binding buffer: 20 mM MES pH 6.5, 1 mM EDTA, 2 mM MgCl2, 1 mM DTT
Elution buffer: 20 mM MES pH 6.5, 1 mM EDTA, 2 mM MgCl2, 1 mM DTT, 1 M NaCl
Flow rate: 1 ml/minGradient: 0%–100% elution buffer, 20 CV
1200
400
600
800
200
0
1000
0 10 20 30 40 Volume (ml)
A (mAU)280
Fig4.10.Example of polishing: removal of trace contaminants by high-resolution CIEX. Purication of thetransposase TniA.
Selection and combination of purication methods
The optimum selection and combination of purication methods is crucial for an efcient
purication process. The key chromatography methods available for protein purication were
presented in Chapter 2 (see also the relevant method handbooks listed in "Related literature" at
the end of this handbook). Table 4.1. shows the basic protein properties utilized in each method.
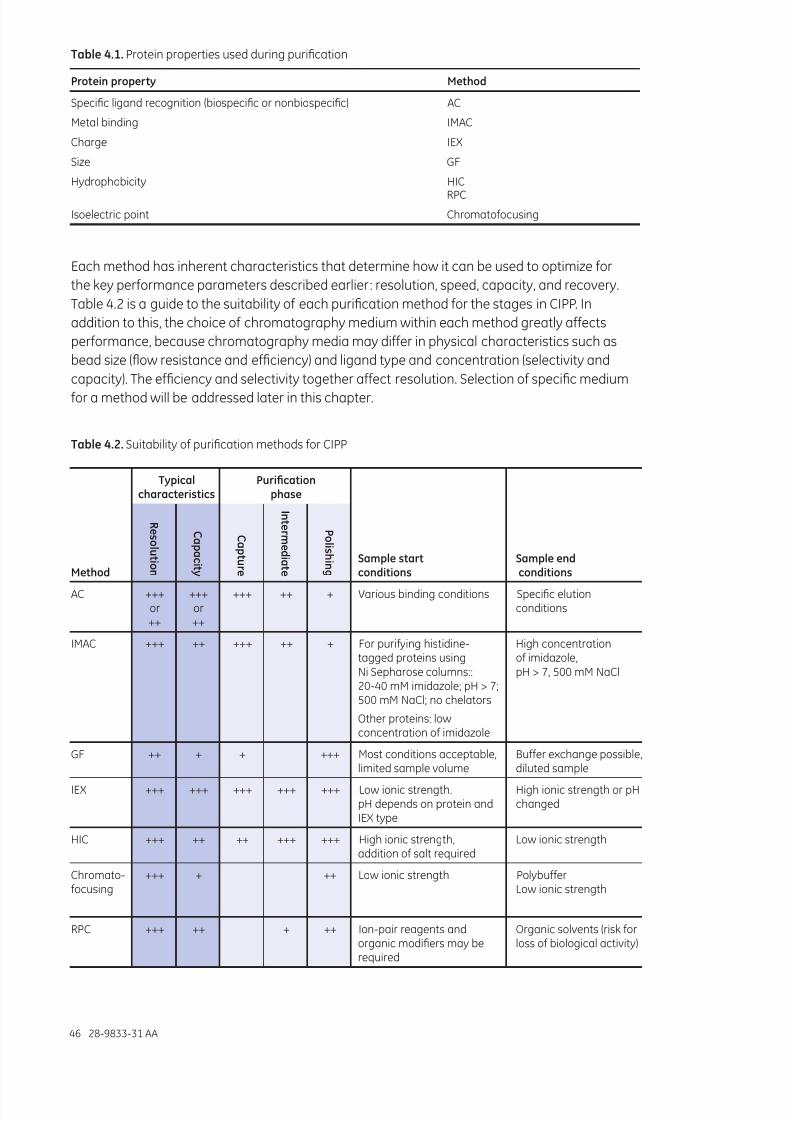
8/22/2019 Purificação de Proteínas - Estratégias, handbook
http://slidepdf.com/reader/full/purificacao-de-proteinas-estrategias-handbook 48/167
46 28-9833-31 AA
Table4.1. Protein properties used during purication
Proteinproperty Method
Specic ligand recognition (biospecic or nonbiospecic) AC
Metal binding IMAC
Charge IEX
Size GF
Hydrophobicity HICRPC
Isoelectric point Chromatofocusing
Each method has inherent characteristics that determine how it can be used to optimize for
the key performance parameters described earlier: resolution, speed, capacity, and recovery.
Table 4.2 is a guide to the suitability of each purication method for the stages in CIPP. In
addition to this, the choice of chromatography medium within each method greatly affects
performance, because chromatography media may differ in physical characteristics such as
bead size (ow resistance and efciency) and ligand type and concentration (selectivity and
capacity). The efciency and selectivity together affect resolution. Selection of specic mediumfor a method will be addressed later in this chapter.
Table4.2.Suitability of purication methods for CIPP
Method
Typicalcharacteristics
Purifcationphase
Samplestartconditions Sampleendconditions
R e s o l u
t i o n
C a p a
c i t y
C a p t u r e
I n t e r m e d
i a t e
P o l i s h i n g
AC +++or++
+++or++
+++ ++ + Various binding conditions Specic elutionconditions
IMAC +++ ++ +++ ++ + For purifying histidine-tagged proteins usingNi Sepharose columns::20-40 mM imidazole; pH > 7;500 mM NaCl; no chelators
Other proteins: lowconcentration of imidazole
High concentrationof imidazole,pH > 7, 500 mM NaCl
GF ++ + + +++ Most conditions acceptable,limited sample volume
Buffer exchange possible,diluted sample
IEX +++ +++ +++ +++ +++ Low ionic strength.pH depends on protein andIEX type
High ionic strength or pHchanged
HIC +++ ++ ++ +++ +++ High ionic strength,addition of salt required
Low ionic strength
Chromato-focusing
+++ + ++ Low ionic strength PolybufferLow ionic strength
RPC +++ ++ + ++ Ion-pair reagents and
organic modiers may berequired
Organic solvents (risk for
loss of biological activity)

8/22/2019 Purificação de Proteínas - Estratégias, handbook
http://slidepdf.com/reader/full/purificacao-de-proteinas-estrategias-handbook 49/167
28-9833-31 AA 47
AC is a desirable and the most common capture step when the target protein is afnity tagged.
AC can often combine speed, capacity, resolution, and recovery in a single purication step,
although it is more common that it is followed by at least one polishing step.
IMAC is an excellent capture step for histidine-tagged proteins and is used with or without a
subsequent polishing step.
GF is seldom used as a capture step because of limitation in sample volume, but is possibly the
most common polishing step.IEX is a common method for any purication stage. IEX columns are suitable for the capture
stage because they have high binding capacity, allow high ow rates, and are resistant to harsh
cleaning conditions that may be needed after purication of crude samples. IEX is frequently
used as a polishing step.
HIC can be an excellent capture step, especially after ammonium sulfate precipitation. The salt
concentration and the total sample volume will be signicantly reduced after elution from the
HIC column. HIC can be used at any stage.
Chromatofocusing is a high-resolution method with moderate binding capacity and is therefore
rarely used as a capture step. The method can be used for the polishing stage.
RPC is very rarely used as a capture step because the method will usually bind too many of the
sample components in an extract. If the target protein is sufciently stable, RPC can be efcient
for polishing.
Choose logical combinations of purication methods based on the main benets of the
method and the conditions of the sample at the beginning or end of each step.
Combine methods that apply different separation mechanisms.
Minimize sample handling between purication steps by combining methods to avoid the
need for sample conditioning before the next step. The product should be eluted from therst column in a buffer suitable for the starting conditions required for the next method.
Figure 4.11 shows common combinations of purication methods. These are separated vertically
based on the capture step (AC, IEX, or HIC). From left to right in the gure:
AC: Single-step purication of afnity-tagged proteins using AC may give sufcient purity for
some applications.
AC-GF: Complementing an AC step with polishing by GF is very common, and can often be used
for generic setups when regularly purifying multiple proteins.
AC-IEX-GF: For high-purity requirements in afnity-tagged protein purication, AC-IEX-GF is a
powerful and convenient combination.
Untagged proteins can usually be sufciently puried by combining purication methods that
separate on the basis of different physicochemical characteristics of the proteins (orthogonal
methods).
IEX-HIC-GF: The combination IEX-HIC-GF is a very often used three-step purication because
the high-salt conditions after the rst step can simply be adjusted with additional salt for HIC
purication and followed by GF for polishing and salt removal.
HIC-IEX-GF: If ammonium sulfate precipitation has been performed, the combination HIC-IEX-GFis suitable because HIC requires high-salt conditions for binding and gives elution in a relatively
low salt concentration in a signicantly smaller volume. Dilution or desalting can then be used to
remove remaining salt, so that the sample can be bound to an IEX column.

8/22/2019 Purificação de Proteínas - Estratégias, handbook
http://slidepdf.com/reader/full/purificacao-de-proteinas-estrategias-handbook 50/167
48 28-9833-31 AA
The combinations given here will be efcient for the vast majority of protein purications if
selected and optimized properly. Other combinations not given here or combinations that
include more than three steps may be necessary in some instances. IEX is a method that offers
different selectivity by using either cation (CIEX) or anion (AIEX) exchangers. A purication
protocol can thus be designed to include a combination of CIEX and AIEX. The order of the
IEX columns may be important , and one should consider using the rst column for binding
of impurities only (the target protein does not bind) and binding the target protein on the
second IEX column. This eliminates the need for desalting or other adjustments between thesepurication steps.
Capture
Polishing
IEX
HIC
GF
HIC
GF
IEXHIC
GF
HIC
GF
IEX
Intermediate
GF GF
AC
IEX
ACAC
(NH4)2SO4 precipitation
Fig4.11. Examples of logical combinations of chromatography steps.
If the protein does not have an afnity tag and if little is known about it , use IEX-HIC-GF.
This combination of methods can be regarded as a standard protocol.
GF can be used after any of the concentrating methods, for example, IEX, HIC, AC,because it can be used under most buffer conditions. GF is a nonbinding method with
limited volume capacity.
HIC is a good capture step after ammonium sulfate precipitation. The salt concentration
and the total sample volume will be signicantly reduced after elution from a HIC
column. Dilution or rapid desalting will prepare it for the next IEX or AC step.
Consider the use of both AIEX and CIEX chromatography to give different selectivities
within the same purication strategy. Also consider the order of the methods, because
this will often make a difference in purication.
Consider RPC for a polishing step provided that the target protein can withstand thepurication conditions and is not irreversibly bound or denatured.
Keep in mind the interplay between “required purity” and “required yield.” In general,
every added purication step (except for desalting) will increase purity but decrease total
recovery and yield.

8/22/2019 Purificação de Proteínas - Estratégias, handbook
http://slidepdf.com/reader/full/purificacao-de-proteinas-estrategias-handbook 51/167
28-9833-31 AA 49
Chromatography mediaIn addition to the different selectivities available through the various purication methods, the
purication efciency depends strongly on the selection of different chromatography media
available for each method. The efciency, ow resistance, selectivity, and capacity differ
between media. The particle size of the medium strongly affects efciency and ow resistance.
A medium with large beads give columns with low efciency (the peaks are broad) and low
backpressure, whereas small beads give high efciency and high backpressure.
Early in the purication process (e.g., the capture stage) high speed is often required because
the sample volume is large and the sample quickly needs to be stabilized. There is less focus
on the resolution. Chromatography media with large particles should be selected that give low
backpressure at high ow rates. In the polishing stage focus is put on high purity, which can be
obtained with chromatography media with high efciency, that is, small beads. These media give
higher backpressure that may require lower ow rates and columns that resist high pressure. These
limitations are acceptable because the sample volume and amounts in this stage are smaller.
Figure 4.12 shows the general principle of choosing chromatography media with larger bead
sizes for early purication, and smaller sizes for later steps when demands on purity increase.Inserted chromatograms show the separation results of applying a small, complex sample to
columns with IEX media with different bead sizes. The importance of bead size is greatest in
large-scale purication and slightly less in laboratory-scale purication. In laboratory scale, it is
common that intermediate sized beads (e.g., Sepharose High Performance, 34 μm) are used in
the capture stage as well.
Step
y t i r u
P
90 µm
34 µm
30 µm15 µm
10 µm
Q Sepharose FF16 × 50 mm
Q Sepharose HP16 × 50 mm
SOURCE™ Q16 × 50 mm
RESOURCE™ Q 1 ml
Mono Q™ 5/50 GL
Fig4.12.Principle of selection of chromatography bead size.

8/22/2019 Purificação de Proteínas - Estratégias, handbook
http://slidepdf.com/reader/full/purificacao-de-proteinas-estrategias-handbook 52/167
50 28-9833-31 AA
Table4.3.Summary of chromatography media for CIPP
C a p t u r e
I n t e r m e d i a t e
p u r i f c a t i o n
P o l i s h i n g
Basematrix Method
Beadsize(µm)
Flow/velocity(cm/h) Availability
Sepharose XL IEX 90 100-500 Prepacked or bulk media
Sepharose Fast Flow IEX, HIC, AC, IMAC 90 100-300 Prepacked or bulk media
MabSelect AC 85 100-500 Prepacked or bulk media
MabSelect SuRe AC 85 100-500 Prepacked or bulk media
MabSelect Xtra AC 75 100-300 Prepacked or bulk media
Capto IEX, HIC, AC 75 < 600 Prepacked or bulk media
SOURCE 30 IEX, HIC, RPC 30 < 2000 Bulk media
Sepharose High Performance IEX, HIC, AC, IMAC 34 < 150 Prepacked or bulk media
SOURCE 15 IEX, HIC, RPC 15 150-1800 Prepacked or bulk media
Superdex GF 13 < 75 Prepacked
Superdex pg GF 34 < 75 Prepacked or bulk media
MonoBeads™ IEX 10 150-600 Prepacked
Micropurication MiniBeads™ IEX 3 < 700 Prepacked
common userarely usednot recommended
For a purication scheme that is not intended for scale-up (i.e., only milligram quantities
of product are needed), use high-performance media such as Sepharose High Performance
(IEX, HIC) or MonoBeads (IEX), or SOURCE (IEX, HIC). All these media are available in
prepacked columns.
For microscale purication, use MonoBeads (IEX) or MiniBeads (IEX) and Superdex (GF),
and other media as appropriate.
If the starting material is relatively pure, a single-step purication at high resolution,
for example, using MonoBeads (IEX) or Superdex (GF), may be sufcient to achieve the
required purity at laboratory scale.
Use the convenient selection kits HiTrap IEX Selection Kit, HiTrap Capto IEX Selection Kit,
HiTrap HIC Selection Kit, and RESOURCE HIC Test Kits for media screening and simple
method optimization.
If a biospecic ligand is available, consider using AC in the capture stage. If the medium
is to be used routinely, ensure that any bound impurity from the crude sample can be
removed by column regeneration procedures that do not damage the afnity ligand.

8/22/2019 Purificação de Proteínas - Estratégias, handbook
http://slidepdf.com/reader/full/purificacao-de-proteinas-estrategias-handbook 53/167
28-9833-31 AA 51
Chapter 5Planning
The scope of a protein purication plan will vary depending on the target protein. Purication
of afnity-tagged recombinant proteins does not require extensive planning. High purity is
often obtained in a single AC purication step by following the instructions, and planning of the purication work can be kept to a minimum. Purication of difcult afnity-tagged proteins
or proteins without a tag may be more challenging. A more thorough plan is then required for
successful purication. This chapter lists a number of considerations that may or may not be
relevant, depending on the situation. It is a good rule not to spend too much time on planning
before starting the experiments, because new information will inevitably appear that cannot
be foreseen or planned for. Consider the following guidelines:
• Defneobjectives
for purity, activity, and quantity required of the nal product to avoid over-
or under-developing a method.
• Describepropertiesothetargetproteinandcriticalimpurities
to simplify method selection and optimization.
• Developanalyticalassays
for fast detection of protein activity/recovery and critical contaminants.
• Minimizesamplehandlingateverystage
to avoid lengthy procedures that risk losing activity/reducing recovery.
• Minimizeuseoadditives
because additives may need to be removed in an extra purication step or
may interfere with activity assays.
• Removedamagingimpuritiesearly
for example, proteases.
• Usedierentmethodsateachstep
to take advantage of sample characteristics that can be used for separation(size, charge, hydrophobicity, ligand specicity).
• Minimizethenumberosteps
because extra steps reduce yield and increase time; combine steps logically.
KEEPITSIMPLE!

8/22/2019 Purificação de Proteínas - Estratégias, handbook
http://slidepdf.com/reader/full/purificacao-de-proteinas-estrategias-handbook 54/167
52 28-9833-31 AA
Defne objectives
Goal:To set minimum objectives for the purication.
Start the planning process by considering how the puried protein will be used. Understanding
its use will help in setting the objectives. Estimating how much protein is needed at a given
time will determine the amount of protein to be prepared, and when. Other important questions
to be answered could be: What purity is required? Are there any impurities that may interfere
with the usage? Is protein activity required? Are tags acceptable? How can the puried proteinbe stored? Is shipping required?
Dene purity requirements according to the nal use of the product.
Identify key impurities.
Identify the nature of prevalent remaining impurities as soon as possible.
The key objectives in most purications are purity, activity, quantity, and recovery. Examples of
other requirements are listed in Table 5.1.
Table5.1. Examples of parameters for purication objectives
Objectives Examples
Correct protein identity Identied by, for example, MS
Amount
Concentration
Purity and activity Polypeptide purity
Specic activity
Level of specic impurities
Level of contaminants
Protein homogeneity Polypeptide sequence homogeneity
Size homogeneity (monomeric, dimeric, aggregates, etc.)
Protein complex composition/intactness (which subunits must be present)
Cofactors
Coenzymes
Post-translational modications
Lifetime of preparation Stable activity
Storage stability Stable size homogeneity (no aggregation)
Protein in suitable form What conditions (pH, ionic strength, additives, etc.)
Protein freeze dried
Purity
The statement that a protein is > 95% pure (i.e., target protein constitutes 95% of total protein) is
far from a guarantee that the purity is sufcient for an intended application. The same is true for
the common statement that “the protein was homogeneous by Coomassie™-stained SDS-PAGE.”
Purity of 95% may in some cases be acceptable if the remaining 5% consists of harmless impurities.
However, even minor impurities that may be biologically active could cause signicant problemsin both research and therapeutic applications. It is therefore important to differentiate between
impurities that must be removed completely and those that can be reduced to acceptable levels.
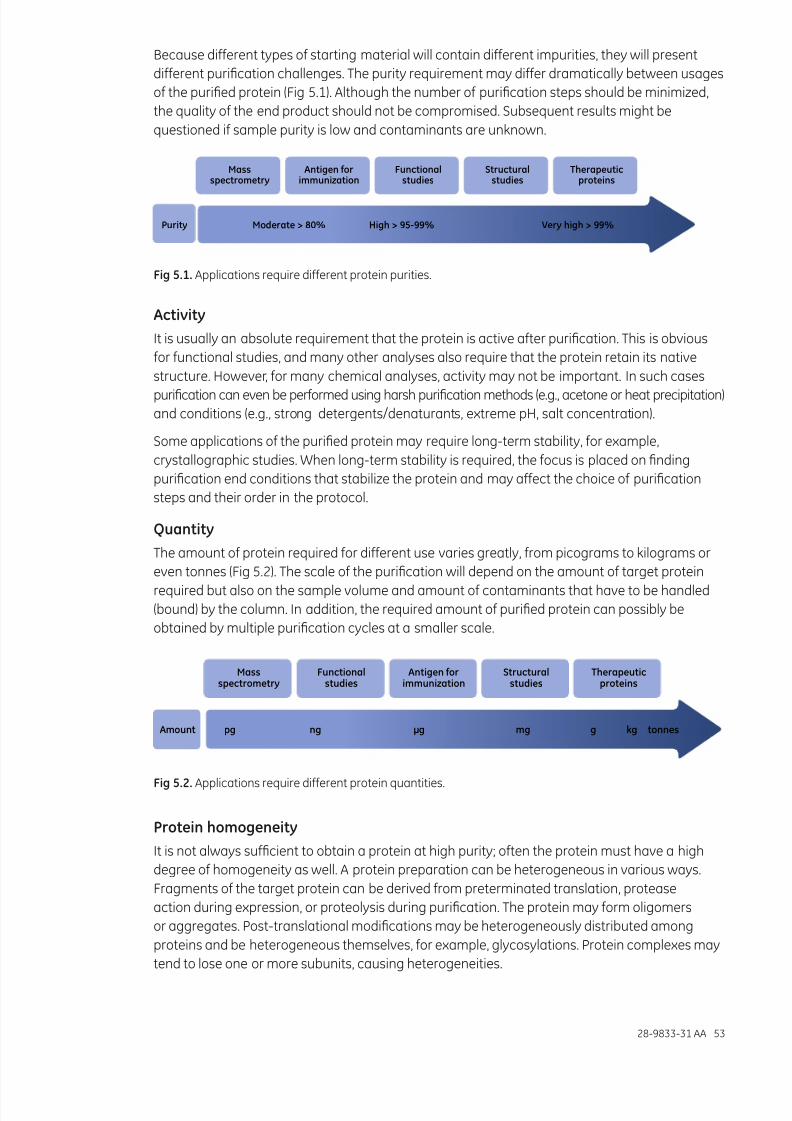
8/22/2019 Purificação de Proteínas - Estratégias, handbook
http://slidepdf.com/reader/full/purificacao-de-proteinas-estrategias-handbook 55/167
28-9833-31 AA 53
Because different types of starting material will contain different impurities, they will present
different purication challenges. The purity requirement may differ dramatically between usages
of the puried protein (Fig 5.1). Although the number of purication steps should be minimized,
the quality of the end product should not be compromised. Subsequent results might be
questioned if sample purity is low and contaminants are unknown.
Massspectrometry
Purity Moderate > 80% High > 95-99% Very high > 99%
Antigen forimmunization
Functionalstudies
Structuralstudies
Therapeuticproteins
Fig5.1. Applications require different protein purities.
Activity
It is usually an absolute requirement that the protein is active after purication. This is obvious
for functional studies, and many other analyses also require that the protein retain its native
structure. However, for many chemical analyses, activity may not be important. In such casespurication can even be performed using harsh purication methods (e.g., acetone or heat precipitation)
and conditions (e.g., strong detergents/denaturants, extreme pH, salt concentration).
Some applications of the puried protein may require long-term stability, for example,
crystallographic studies. When long-term stability is required, the focus is placed on nding
purication end conditions that stabilize the protein and may affect the choice of purication
steps and their order in the protocol.
Quantity
The amount of protein required for different use varies greatly, from picograms to kilograms or
even tonnes (Fig 5.2). The scale of the purication will depend on the amount of target protein
required but also on the sample volume and amount of contaminants that have to be handled
(bound) by the column. In addition, the required amount of puried protein can possibly be
obtained by multiple purication cycles at a smaller scale.
Massspectrometry
pgAmount ng µg mg g kg
Functionalstudies
Antigen forimmunization
Structuralstudies
Therapeuticproteins
tonnes
Fig5.2.Applications require different protein quantities.
Proteinhomogeneity
It is not always sufcient to obtain a protein at high purity; often the protein must have a high
degree of homogeneity as well. A protein preparation can be heterogeneous in various ways.
Fragments of the target protein can be derived from preterminated translation, protease
action during expression, or proteolysis during purication. The protein may form oligomers
or aggregates. Post-translational modications may be heterogeneously distributed among
proteins and be heterogeneous themselves, for example, glycosylations. Protein complexes maytend to lose one or more subunits, causing heterogeneities.

8/22/2019 Purificação de Proteínas - Estratégias, handbook
http://slidepdf.com/reader/full/purificacao-de-proteinas-estrategias-handbook 56/167
54 28-9833-31 AA
Describe properties of the target protein and critical impuritiesThe properties of the target protein will affect the purication methods to be applied and set
limits for what purication objectives can be fullled. The critical impurities to be removed
depend on the type of starting material used (for example, expression system).
Describethetargetprotein
Goal: To determine the properties of the target protein, to allow selection of purication
methods and conditions, as well as analytical methods.
Information concerning the target protein will help to guide the choice of separation methods
and experimental conditions that can be used for purication. Key properties include:
Molecular weight
The molecular weight of the protein polypeptide can easily be calculated from the amino acid
composition in the case of a cloned protein. This information is useful if SDS-PAGE is used for
the initial expression level estimate (in case the expression is high enough to give an extra
protein band upon induction). Note that the apparent molecular weight obtained from SDS-PAGE
(which is an indirect, calibration-dependent method) can sometimes deviate considerably
from the calculated one. The molecular weight is also important when selecting a GF medium.
Normally GF is performed under native conditions that keep oligomeric proteins and protein
complexes intact. It is therefore useful to know whether the target protein is composed of one
or several identical or nonidentical polypeptides. Similar considerations can be made for large
oligosaccharide parts of glycoproteins. If the amino acid sequence of the target protein is not
known, a combination of GF and specic detection such as activity assay or immunoassays
can be used to estimate the molecular weight.
Isoelectric point, pI
The isoelectric point of the protein can be theoretically estimated from the amino acid
composition or be experimentally determined by isoelectric focusing, provided that the proteincan be obtained pure enough or be specically detected in the gel. Knowledge of the pI value
can be used for several purposes: Proteins tend to have lowest solubility at pH values close
to the pI. The pI value gives a hint about suitable IEX media for purication and also about
what binding conditions (especially pH but sometimes also ionic strength) should work (see
Chapter 2). Theoretical charge versus pH curves can be calculated using the amino acid
composition to further guide the selection of conditions.
Solubility
Protein solubility is a key parameter in protein purication. Low solubility may depend on
association of the protein in active form, or inactivation and unfolding causing aggregationdue to exposure of hydrophobic parts of the polypeptide that are hidden in the interior of the
active protein. For many (active) proteins, the solubility is lowest at pH values close to the pI of
the protein. The presence of salt, for example, NaCl, often affects solubility. Changes of pH and
ionic strength during different purication steps should be considered to avoid aggregation
and precipitation of the protein.
Stability
The stability of a protein in terms of protein activity, aggregation, and subunit composition and
of chemical and physical characteristics is usually important during purication, storage, and
use. It is thus important that the stability window for the protein is determined. The stability of
a protein varies depending on conditions (pH, ionic strength, and presence of additives). During
purication, conditions can change due to differences in the start and end conditions of the
purication step. A short time for purication, storage, or use reduces problems with instability.
See Chapter 6 for tips and hints regarding protein stabilization.

8/22/2019 Purificação de Proteínas - Estratégias, handbook
http://slidepdf.com/reader/full/purificacao-de-proteinas-estrategias-handbook 57/167
28-9833-31 AA 55
Describethestartingmaterial
Goal: To determine the properties of the starting material, clarify sample preparationrequirements, and identify harmful impurities.
The type of expression system that is used will greatly affect the purication steps, suchas the cell disruption procedure (if required), clarication of the sample, and requirementson conditions and stabilizing additives. The starting material will contain a large numberof substances that will have to be removed during purication. It is useful to identify thecomponents in the sample that may be most damaging to the target protein, for example,proteases. These should be removed or inhibited as soon as possible.
The protein may be located internally in the cytoplasm, in organelles, in cell walls, or in theperiplasm of bacteria; it may also be secreted out of the cell. High overexpression of proteins inbacteria frequently yields inclusion bodies, which are large aggregates composed mainly of thetarget protein, often in inactive form. The location of the target protein in the host affects theextraction procedure.
The source material may contain substances that interfere with purication, for example, nucleicacids, lipids, and particulate matter. These substances should if possible be eliminated before
applying the sample on a chromatography column. The presence of proteases in the startingmaterial may require addition of inhibitors or fast removal of the proteases. The pI and M
r
distribution can be investigated by 2-D electrophoresis. Table 5.2 lists a number of factors to be
considered. More information about protein sources will be provided in Chapter 6.
Table5.2. Properties of the starting material that may affect purication
Keyactors Impactonpurifcationmethod
Critical impurities May require a specic purication method.
Fouling components Clarication method.
pI distribution/titration curve Effect on selection of medium and conditions for IEX.
Mr distribution Selection of GF medium (in rare cases when it is used as rst purication step).Ionic strength If the ionic strength is too high, the sample may have to be desalted or diluted
before IEX.
pH Selection of IEX chromatography medium.
pH adjustment may be needed.
Volume Selection of chromatography method.
GF limits sample volume that can be applied in each run.
Protein concentration Scale/column size or division of samples for repetition of the purication step.
Proteases Early removal, high speed, low temperature, addition of inhibitors.
Substances that may affect
separation
Any chromatography method.
Develop analytical assaysGoal:To monitor the progress during development of the purication protocol and the quality of the nal product after purication.
The importance of a reliable assay for the target protein cannot be overemphasized. Identifywhat analysis methods are required based on the objectives of the purication. The keyparameters to be assessed are:
• Target protein concentration
• Purity• Total protein concentration
• Concentration of critical impurities
Analysis and characterization in the protein purication context will be further addressed in Chapter 8.

8/22/2019 Purificação de Proteínas - Estratégias, handbook
http://slidepdf.com/reader/full/purificacao-de-proteinas-estrategias-handbook 58/167
56 28-9833-31 AA
Create a purication table
Goal:To evaluate the outcome of each of the purication steps of the purication protocol.
A purication table allows a summary of the results of the purication. For example, if there
is an extensive loss of target protein in a purication step, the step may have to be further
optimized or even exchanged for another one. If the purication factor decreases in a step, this
is probably due to extensive loss of activity or amount of target protein. This outcome may be
a reason for removing this purication step. On the other hand, the purication step may berequired to remove a specic impurity, and the loss of target protein may have to be accepted.
Table 5.3 is an example of a purication table. Data in columns one (Volume), two (Protein
concentration), and four (Total activity) are measured experimentally and are used for
calculating the other data in the table:
1. Total Protein concentration can be determined using standard methods (e.g., absorbance at
280 nm, Bradford or Lowry assays).
2. Amount of total protein can be calculated from columns one and two.
3. Total activity is determined experimentally (= U/ml obtained for the small sample taken toassay × the Volume). Alternatively, the Total amount of target protein is determined.
4. The purity measured as Specic activity is calculated by dividing Total activity by Amount of
total protein. Alternatively, purity is calculated as Total amount of target protein divided by
Amount of total protein, for example, estimated by SDS-PAGE.
5. Recovery is calculated by rst setting the Total activity of the homogenate (or any starting
material) to 100% and then calculating the percentage of activity remaining compared with
the starting material for each step.
6. Purication factor is calculated using the Specic activity column to calculate how many
times the specic activity increased after each purication step as compared withthe specic activity in the starting material.
Table5.3. Example of protein purication table
PurifcationstepVolume
(ml)
Proteinconc.
(mg/ml)
Amounttotal
protein(mg)
Totalactivity
(U)
Specifcactivity(U/mg)
Recovery(%)
Purifcationactor
Homogenate 220 1.7 373 107 0.29 100
AC 30 0.14 4.2 93 22 87 76
Concentration 2.2 1.8 4.0 84 21 79 72
GF 8 0.38 3.0 76 25 71 86

8/22/2019 Purificação de Proteínas - Estratégias, handbook
http://slidepdf.com/reader/full/purificacao-de-proteinas-estrategias-handbook 59/167
28-9833-31 AA 57
Chapter 6Sample preparation
Chromatographic purication requires, with few exceptions, that the sample contain the
target protein in solution and that there are no particles that can clog the column. The sample
preparation needed depends on the source. Some source materials are essentially clear liquidsthat can be directly applied, possibly after clarication, to the rst chromatography column,
for example, samples such as serum, plasma, or cell supernatants. In other cases the source
material is a cell paste or a tissue, and several sample preparation steps are required to obtain
a sample suitable for chromatography, with the target protein properly extracted.
The steps required for sample preparation depend on the source material and the
characteristics of the target protein and its location (Fig 6.1).
The purpose of sample preparation is to:
• Release the target protein from the source material and get it into solution
• Remove any particles from the sample
• Stabilize the target protein
• Adjust conditions of the sample to t the rst chromatographic purication step
• Eliminate impurities that can interfere with subsequent purication
Inner membrane
Peptidoglycan
Outer membrane
Lipopolysaccharide
70 Å
70 Å
70 Å
210 Å
Cytoplasm~2000 proteins
~100 proteins
Periplasm
~10 proteinsCulture medium
Fig6.1. Schematic cross-section of the cell wall and typical number of protein species in E. coli. (Data fromreference 1.)
The most common steps in sample preparation from cultured cells are cell harvest, cell disruption,
and clarication, but additional steps may be required depending on the location of the target
protein (Fig 6.2). Preparation of secreted proteins obviously does not need cell disruption. Proteins
expressed as insoluble aggregates (inclusion bodies) will usually be prepared by isolation and
solubilization of the inclusion bodies followed by refolding of the target protein. Membrane
protein samples are usually obtained by preparation of the biological membrane and solubilization
of the membrane proteins using detergents. Preparation of water-soluble proteins from animals
or plants begins with homogenization of the tissue material. The homogenate can then be
handled essentially as cultured cells, that is, using cell disruption, clarication, etc. The methodfor cell disruption depends on the strength of the cell wall, and varies between cell types.
Fractional precipitation can be used as a sample preparation step to remove bulk impurities.

8/22/2019 Purificação de Proteínas - Estratégias, handbook
http://slidepdf.com/reader/full/purificacao-de-proteinas-estrategias-handbook 60/167
58 28-9833-31 AA
Cell wall disruption
Recovery of clarified sample
l l
Harvest of inclusion bodies
Insoluble incytoplasm
Periplasmicspace
Soluble incytoplasm
Membrane
Cell debris removal
Recovery of clarified sample
Culturemedium
Recovery of supernatant
Membranepreparation
Extracellularexpression
Cell removalCell removal
Solubilization Solubilization
ClarificationRefolding
Intracellularexpression
Cell lysis
Purification
Fig6.2.Overview of sample preparation from bacteria.
Sample preparation requires tradeoffs between efcient extraction and risk of protein denaturation.
Performing the sample preparation quickly, in the cold, under suitable conditions, and by using
stabilizing additives will reduce the risk of target protein denaturation.
Source materialsPurication of proteins from natural sources is still relatively common, but the vast majority
are overexpressed, recombinant proteins. There are many host systems for protein over-
expression, including bacteria, yeast, plants, lamentous fungi, insect or mammalian cells
grown in culture, and transgenic animals or plants. In addition to these, cell-free systems are
also available. Each host system has its own advantages and disadvantages. The choice of
host affects post-translational modication and expression levels, but also the way in which
the protein can be puried. Table 6.1 summarizes features of several expression systems.
Table6.1Features of expression systemsProcessing Bacteria Yeast Insectcells Mammaliancells
Inclusion bodies +/- (+)/- – –
Secretion +/– +1 + +
Glycosylation – +2 + +
Proteolytic cleavage +/– +/– – –
Other post-translational modications – +3 + +
+ = Yes– = No
1
Constructs are often prepared to allow secretion of the protein. This eliminates the need for cell lysis , which requires morepowerful methods for yeast than for E. coli.
2 Yeast give more extensive glycosylation than insect cells and mammalian cells; this is a drawback of heterologousexpression in yeast.
3 Yeast lack some functions of post-translational modications that exist in higher eukaryotes.

8/22/2019 Purificação de Proteínas - Estratégias, handbook
http://slidepdf.com/reader/full/purificacao-de-proteinas-estrategias-handbook 61/167
28-9833-31 AA 59
The expression of recombinant proteins is highly variable and is affected by the nature of the
target protein, the host cell, and culture conditions. Recombinant protein yields in E. coli can
range from 0 to 10 g/l of culture. Table 6.2 can be used to approximate culture volumes based
on an average yield of 2.5 g/l.
Table6.2. Typical recombinant protein yields in E. coli
Protein 12.5mg 50mg 1g 10g 50gCulture volume 5 ml 20 ml 400 ml 4 l 20 l
Volume of lysate 0.5 ml 1 ml 20 ml 200 ml 1000 ml
Cell harvesting and extractionCell harvesting and extraction procedures should be selected according to the source of the
protein, such as bacterial, plant, or mammalian, intracellular or extracellular. Harvesting, in which
the cells are separated from the cell culture medium, generally involves either centrifugation or
ltration. Refer to standard protocols for the appropriate methodology based on the source of
the target protein.
Selection of extraction method depends on the equipment available and scale of operation
as well as on the type of sample. Examples of common extraction processes for recombinant
proteins are shown in Table 6.3. In many situations a combination of these methods gives
optimal results. The results obtained from cell lysis depend on several factors, including sample
volume, cell concentration, time, temperature, energy input (speed of agitation, pressure, etc.),
and physical properties of the cell lysis apparatus.
Use procedures that are as gentle as possible because too vigorous cell or tissue
disruption may denature the target protein or lead to release of proteolytic enzymes
and general acidication.
Extraction should be performed quickly, and in the cold, for example, at 4°C or on ice,
in the presence of a suitable buffer to maintain pH and ionic strength and to stabilize
the sample.
Add protease inhibitors before cell disruption. Fractional precipitation may reduce the
presence of proteases.
The release of nucleic acids may cause viscosity problems. Add nucleases to break
down the nucleic acids; see Table 6.5.

8/22/2019 Purificação de Proteínas - Estratégias, handbook
http://slidepdf.com/reader/full/purificacao-de-proteinas-estrategias-handbook 62/167
60 28-9833-31 AA
Table6.3. Homogenization and cell disruption methods
Extractionprocess Typicalconditions Proteinsource Comment
Gentle
Cell lysis (osmotic shock) Two volumes waterto one volume packed,prewashed cells.
Erythrocytes, E. coli(periplasmic proteins).
Reduced protease release,but lower product yield.
Enzymatic digestion Lysozyme 0.2 mg/ml. Good for Gram-positivebacteria. For Gram-negative bacteria (e.g.,E. coli), combine withchemical and osmotic-shock lysis.
Laboratory scale only,often combined withmechanical disruption.
Chemical lysis Detergents. Eukaryotes, E. coli.
Hand homogenization Follow equipmentinstructions.
Liver tissue, etc.
Mincing (grinding) Follow equipmentinstructions.
Muscle, etc.
Moderate
Blade homogenizer Follow equipmentinstructions.
Muscle tissue, mostanimal tissue, plant tissue.
Grinding with abrasive,e.g., glass beads
Add glass beads toprewashed cells, vortex,centrifuge, repeat upto ve times, poolingsupernatants.
Bacteria, plant tissue. Physical method.Chemical conditionsare less important forcell lysis but may beimportant for subsequentremoval of cell debris andpurication steps.
Freeze/thaw Freeze cells, thaw (repeat
several times), resuspendpellet by pipetting orgentle vortexing in room-temperature lysis buffer.Incubate, centrifuge,retain supernatant.
Several cycles.
Vigorous
Ultrasonication orbead milling
Follow equipmentinstructions.
Cell suspensions:intracellular proteins incytoplasm, periplasm,inclusion bodies.
Small scale; release of nucleic acids may causeviscosity problems;if so, add DNase.Inclusion bodies must beresolubilized.
Manton-Gaulinhomogenizer
Follow equipmentinstructions.
Cell suspensions. Large scale.
French press Follow equipmentinstructions.
Bacteria, plant cells. Laboratory scale.
Clarication
Samples for chromatographic purication should in general be clear and free from particulate
matter. There is one exception from this, the specially designed HisTrap FF crude column, whichaccepts unclaried extracts (see Chapter 7).

8/22/2019 Purificação de Proteínas - Estratégias, handbook
http://slidepdf.com/reader/full/purificacao-de-proteinas-estrategias-handbook 63/167
28-9833-31 AA 61
Simple steps taken to clarify a sample before beginning purication will avoid clogging the column,
may reduce the need for stringent column washing procedures, and can extend the life of the
column. Centrifugation and ltration are standard laboratory methods for sample clarication.
A claried sample that is not used immediately may within minutes start to precipitate.
Although the target protein may co-precipitate, this is often not the case, and a reclarication
of the sample before application on the chromatography column can often save it.
It is highly recommended to clarify the sample using centrifugation and/or ltration
immediately prior to chromatographic purication.
Centriugation
Centrifugation is the most common clarication method for extracts in laboratory scale.
Centrifugation removes most particulate matter and cell debris, but depending on source and
extraction procedure, there may be various amounts of particles that cannot be sedimented or
that oat on top. Centrifugation should preferably be performed in the cold.
For cell lysates, centrifuge at 40 000 to 50 000 × g for 30 min (may be reduced to 10 to
15 min if a short handling time is required).
For small sample volumes, centrifuge at the highest available g-force, such as 15 000 × gfor 15 min in a benchtop centrifuge.
Use the cooling function of the centrifuge and precool the rotor by storing it in the cold room or
by starting to cool the centrifuge well in advance with the rotor in place. If the sample is still not
clear after centrifugation, use a 5 μm lter as a rst step and one of the lters listed in Table 6.4
as a second step.
Filtration
Filtration removes particulate matter. Small samples can sometimes be claried by passage
through a lter tted to a syringe, thus avoiding a more time-consuming centrifugation run.Larger syringe lters can often be used conveniently for relatively large volumes, up to 50 to
100 ml. It is good practice to also lter samples already claried by centrifugation prior to
application on the chromatography column. Membrane lters that give the least amount of
nonspecic binding of proteins are composed of cellulose acetate, polyether sulfone (PES), or
polyvinylidene uoride (PVDF). A rst ltration through a lter with large pores, for example, a
pore size of 5 μm, may remove the bulk of the particles, thus avoiding clogging the nal lter.
This nal lter should be selected in relation to the bead size of the chromatography medium
as shown in Table 6.4. Filters become saturated, that is, they have a certain capacity. It may be
necessary to check the sample volume capacity when setting up a protocol.
Some proteins may bind nonspecically to lter surfaces. If extensive loss of proteinupon ltration is suspected, check the recovery of the target protein in a test ltration.
For protocol development, consider checking sample capacity of the lter.
Table6.4.Selecting lter pore sizes
Nominalporesizeoflter Particlesizeochromatographymedium
1 μm 90 μm and greater
0.45 μm 30 or 34 μm
0.22 μm 3, 10, 15 μm, or when extra-clean samples or sterile ltration is required

8/22/2019 Purificação de Proteínas - Estratégias, handbook
http://slidepdf.com/reader/full/purificacao-de-proteinas-estrategias-handbook 64/167
62 28-9833-31 AA
Protein stability—selection of conditionsThe biological activity and structural integrity of the puried target protein are often of interest
and need to be retained throughout the entire purication procedure. Sample preparation
is a critical step to achieve this goal. Cell disruption releases proteases and other modifying
enzymes, and may expose the target protein to harsh physical and chemical conditions. It is
thus important to transfer the target protein to a friendlier environment as quickly as possible.
Proteins generally have unique tertiary structures, kept together by van der Waals’ forces, ionicand hydrophobic interactions, and hydrogen bonding. Any conditions capable of destabilizing
these forces may cause denaturation and/or precipitation. By contrast, peptides tolerate a
much wider range of conditions than proteins. This basic difference in native structures is also
reected in that proteins are not easily renatured, while peptides often renature spontaneously.
It is important to check the stability limits of the sample and to work within these limits during
sample preparation and purication.
Perform stability tests as early as possible.
The list below may be used as a basis for stability testing:
• Test pH stability in steps of one pH unit between pH 2 and pH 9.
• Test salt stability with 0 to 2 M NaCl and 0 to 2 M (NH4)2SO
4in steps of 0.5 M.
• Test the stability toward acetonitrile and methanol in 10% steps between 0% and 50%.
• Test the temperature stability in 10°C steps from 4°C to 40°C.
• Test the stability and occurrence of proteolytic activity by leaving an aliquot of the sample at
room temperature overnight.
Centrifuge each sample and measure activity and UV absorbance at 280 nm in the
supernatant.
There are many possible symptoms of protein instability, for example:
• Loss of enzyme activity or ligand binding
• Loss of target protein (precipitation or binding to surfaces)
• Conformational changes; loss of secondary structure (cf. circular dichroism spectroscopy)
• Presence of aggregates or oligomers
• Loss of subunits from protein complexes
The target protein can also be affected by chemical modications, for example:
• Deamidation• Racemization
• Hydrolysis
• Beta-elimination
• Disulde exchange
• Oxidation
Conditions for sample preparation and different purication steps should be selected so
that the target protein is stabilized and the conditions are compatible with the subsequent
purication method.

8/22/2019 Purificação de Proteínas - Estratégias, handbook
http://slidepdf.com/reader/full/purificacao-de-proteinas-estrategias-handbook 65/167
28-9833-31 AA 63
Use only additives that are proven to be essential for stabilization of the product or to
improve extraction. If possible, select additives that are easily removed.
The conditions for sample preparation and subsequent purication may have to be changed in
later purication steps or for storage of the puried protein. An additive required during sample
preparation can often be omitted during the following purication steps because it is not
needed anymore or it interferes with the purication method.
Buerandsalt
The selection of buffer (see Appendix 1) and salts depends on several factors. The pH should be
selected so that it matches the pH optimum of the target protein. The solubility of a protein is
often lowest at its pI. To obtain good solubility of the target protein, select a pH that is not near
the pI. The buffer substance should have a pKa
value as close as possible to the selected pH,
to give maximum buffer capacity. A typical concentration of buffer substance is 20 to 100 mM.
The pKa
of some buffer substances are highly dependent on temperature. For example, Tris
buffer is notable with a dpKa/dt of 0.028, which means that a solution prepared at 25°C to pH
7.4 will change to pH 8.0 if cooled to 4°C. Good buffers (2) were developed to give a minimum
of side effects seen for traditional buffers. For example, phosphate may inhibit enzymes, andborate may react with mono- or oligosaccharides. Buffers may interact with metals ions, for
example, phosphate precipitates with some divalent metal ions. However, phosphate buffer
can be used for IMAC because the metal ions present are immobilized on the chromatography
medium, thus are not available for precipitation. Good buffers are usually compatible with
metal ions. Some buffers may interfere with protein determination assays. If a broad pH range
using the same buffering system is desired, multiple buffer substances with different pKa
values can be mixed. Some selections can allow essentially constant ionic strength over the
pH range (3). The activity and solubility of proteins vary with ionic strength. The optimum ionic
strength should be tested early together with the pH optimum mentioned earlier.
TemperatureSample preparation is often performed at low temperature for best stability, and samples are
often kept on ice before application on the chromatography column, independent of whether
chromatography is performed at room temperature or in the cold room.
Application of large chilled samples on a room-temperature column could lead
to problems with air bubbles, which may give disturbances in the in-line detection
after the column.
Stabilizingadditives
There are a number of substances that can be added to the solutions used for proteinpurication in order to stabilize the target protein (Table 6.5).
Always consider whether the added substance may affect the chromatographic
separation. In such cases it may be possible to avoid the additive or to remove it prior to
the sensitive purication step.
Often the additive is required during sample preparation but can be omitted in the remainder of
the purication protocol.

8/22/2019 Purificação de Proteínas - Estratégias, handbook
http://slidepdf.com/reader/full/purificacao-de-proteinas-estrategias-handbook 66/167
64 28-9833-31 AA
Chelating agents
Traces of metal ions may catalyze oxidation of free cysteines in proteins or interact with specic
groups on the protein surface. Addition of ethylenediaminetetraacetic acid (EDTA) protects
against oxidation by forming chelate complexes with divalent metal ions. The related ethylene
glycol tetraacetic acid (EGTA) forms complexes specically with Ca2+. Chelate formation does not
occur at low pH.
The presence of chelating agents may interfere with separation in IMAC and AIEX.Chelating agents should not be used for proteins that require divalent metal ions for
their activity.
Table6.5.Stabilizing additives
Substance Concentration Purpose
EDTA 10 mM Reduce oxidation damage, chelate metal ions.
Sucrose or glucose 25 mM Stabilize lysosomal membranes, reduceprotease release.
Detergents Typically 0.01%–1% Reduce loss due to association with cellcomponents or self-aggregation. Extractionand purication of integral membrane proteins.Solubilization of poorly soluble proteins.
Glycerol 5%–10% For stabilization, up to 50% can be used if required.
Sucrose 10% For stabilization.
Nucleases(DNase and RNase)
1–20 μg/ml each (or Benzonase™according to the manufacturer’srecommendations)
Degradation of nucleic acids, reduce viscosityof sample solution.
Glycerol or other polyols
Glycerol (5% to 50%) is very frequently used to stabilize proteins in solution. It is believed to
enhance the structure and compactness of the protein and reduce interactions of hydrophobic
patches of the protein, thus reducing the risk of aggregation. Other polyols (mannitol, sucrose,
lactose, and propylene glycol) can be used at typically 10% (4).
Proteases inhibitors
Proteases from the source organism are the key threats to most proteins to be puried.
Working quickly at low temperature reduces their action. Proteases should be removed as
quickly as possible by an efcient capture step. In addition to these precautions, proteaseinhibitors (Table 6.6) are usually added during the extraction because this is the most
dangerous step regarding proteolysis. Sometimes protease inhibitors should also be added
during protein purication, for example, in chromatography eluents, or to samples collected
after chromatography. In some cases a specic protease can be inactivated by selecting
a pH where it is inactive (but where the target protein is active). Protease inhibitor cocktails
are available from different manufacturers. Optionally, EDTA may be added to inhibit
metalloproteases. Keep in mind that nucleases used for removal of nucleic acids during sample
preparation requires Mg2+ ions, and will thus be inhibited by EDTA.
Use protease inhibitors and remove proteases as quickly as possible by an efcient
capture step.

8/22/2019 Purificação de Proteínas - Estratégias, handbook
http://slidepdf.com/reader/full/purificacao-de-proteinas-estrategias-handbook 67/167
28-9833-31 AA 65
Table6.6.Protease inhibitors1
Inhibitor Concentration Target Comments
Phenylmethylsulfonyluoride (PMSF)2
0.5–1 mM Inhibits serine proteases andsome cysteine proteases
PMSF is an irreversible inhibitorthat inactivates serine andsome cysteine proteases.PMSF is rapidly inactivated inaqueous solutions. Prepare just
prior to use. Less effective inthe presence of thiol reagents.PMSF is very toxic.
AEBSF (aminoethylbenzylsulfonyl uoride)
up to 4 mM Inhibits serine proteases More soluble and lesstoxic than PMSF. Inducesmodications that canpotentially alter the pI of aprotein, cf., 2D-PAGE and massspectrometry analysis.
4-Aminophenyl-methylsulfonyluoride (APMSF)
0.4–4 mM Inhibits serine proteases
Benzamidine-HCl 0.2 mM Inhibits serine proteases
Pepstatin 1 μM Inhibits aspartic proteases
Leupeptin 10–100 μM Inhibits cysteine and serineproteases
Chymostatin 10–100 μM Inhibits chymotrypsin,papain, cysteine proteases
Antipain-HCl 1–100 μM Inhibits papain, cysteine andserine proteases
EDTA 2–10 mM Inhibits metal-dependentproteases, zinc, and iron
Inhibit nucleases by bindingMg2+ added to break downnucleic acids in viscoussamples.
EGTA 2–10 mM Inhibits metal-dependentproteases, e.g., calcium
Does not bind Mg2+, thus doesnot inhibit nucleases.
1 Protease inhibitors are available in premade mixes from several suppliers.2 PMSF is a hazardous chemical. Half-life time in aqueous solution is 35 min. PMSF is usually stored as a 10 mM or 100 mM
stock solution (1.74 or 17.4 mg/ml) in isopropanol at –20°C.
Details taken from references 1 and 5, and other sources.
Detergents and chaotropic agentsDetergents are used in membrane protein purication, but can also be applied to decrease
aggregation or adsorption for water-soluble proteins. During extraction, the target protein may
be bound to lters or container surfaces, cell debris, to other proteins, or to itself via hydrophobic
regions on its surface. This may cause signicant reduction in recovery or cause aggregation
of the target protein. The hydrophobic interactions can be reduced by the addition of mild
detergents that interact with hydrophobic regions on the target protein and other sample
components. Moderately hydrophobic substances such as ethylene glycol can also decrease
hydrophobic interactions.
Nucleases
Release of nucleic acids upon cell disruption may lead to very high sample viscosity. The nucleic
acids may also cause aggregation of cell debris. Nucleic acid impurities may hinder effective
chromatographic purication by binding to the target protein or the chromatography medium.

8/22/2019 Purificação de Proteínas - Estratégias, handbook
http://slidepdf.com/reader/full/purificacao-de-proteinas-estrategias-handbook 68/167
66 28-9833-31 AA
Nucleic acids can be broken down by addition of nucleases. Viscosity problems due to nucleic
acids are less problematic if multiple mechanical cell disruption cycles are run, although addition
of nucleases may still be useful. Benzonase is an engineered nuclease that breaks down
both RNA and DNA. The nuclease becomes much more efcient and can be used at a lower
concentration if added before cell disruption.
Reducing agents
The redox potential is generally lower inside cells than in the surrounding medium or insolutions used for protein purication, because atmospheric oxygen is dissolved in solutions.
Intracellular proteins may have free cysteine residues (free thiols) that are sensitive to these
oxidizing environments. The cysteine residues in proteins may be problematic because they
are susceptible to oxidation; disuldes, sulnic acid (-SOOH), or sulfonic acid (-SO2OH) may be
formed. The oxidation may be caused by the presence of oxygen and traces of divalent metal
ions. Reducing agents can be added to keep free cysteine residues on proteins reduced or to
reduce disulde bonds. Oxidation can be hindered by addition of EDTA and reducing agents.
The protein should not be stored in the presence of β-mercaptoethanol for too long a
time, because the oxidized form of β-mercaptoethanol can react with a reduced cysteine
to form a disulde (5). β-mercaptoethanol can thus be used for purication, but forstorage any of the other reducing agents are preferable because their oxidized forms are
stable and will not react with free cysteines.
Reducing agents generally do not react with other functional groups on proteins. The DTT and
DTE isomers behave similarly in protein solutions.
Table6.7Reducing agents
Reducingagent Concentration Stocksolution Comments
1,4 dithiothreitol (DTT)(Cleland’s reagent)or alternatively 1,4dithioerythritol (DTE)
1–10 mM 1 M in water, store at-20°C (1 year).
Only effective above pH 7.Susceptible to air oxidation.Oxidized form gives increasein absorbance at 280 nm.
β-mercaptoethanol(BME)
5–20 mM or 0.05% 1 M in water, store indark at 4°C (1 year).
Susceptible to air oxidation,volatile, unstable in aqueoussolution above pH 5, higherpH further decrease stability.Sensitive to presence of metalions. Stabilize by adding EDTA.
Tris (2-carboxyethyl)phosphine (TCEP)
(purchase as TCEP-HCl)
5–50 mM 0.5 M in water adjustedto suitable pH. Store at
-20°C. TCEP dissolved inwater is acidic. TCEP isless stable in phosphatebuffers.
Stable to air oxidation. Moreefcient than DTT below pH
8. Does not affect metal ionsduring IMAC. Readily soluble,max. 1.1 M, stable in aqueoussolution, stable in acidic andbasic solution. Odorless, thiol-free, pH range 1.5–9. TCEPcan reduce DTT.
Removal of specic impuritiesIn laboratory-scale purication, a practical approach is to purify the protein to a certain level and
perform SDS-PAGE after storage to check for protease degradation. Information on the degree of
purity and quantity of aggregates can also be obtained by analytical GF using Superdex 200
columns. For many applications, a high purity as judged by SDS-PAGE is sufcient, but occasionally,
specic impurities negatively affect a purication step or the use of the puried protein, and the
impurity will have to be removed.

8/22/2019 Purificação de Proteínas - Estratégias, handbook
http://slidepdf.com/reader/full/purificacao-de-proteinas-estrategias-handbook 69/167
28-9833-31 AA 67
Lipoproteins
Lipoproteins and lipids can rapidly clog chromatography columns and should be removed prior
to purication. Precipitation agents such as dextran sulfate and polyvinylpyrrolidone, described
under "Fractional precipitation," are recommended to remove high levels of lipoproteins from
samples such as ascites uid.
Low-molecular-weightcontaminants
Some low-molecular-weight substances may interfere with purication. Phenol red is a low-molecular-weight pH indicator frequently used in cell cultures at laboratory scale. Although it
does not directly interfere with purication, phenol red may bind to certain purication media; for
example, it may bind to AIEX media at pH > 7. Use a desalting column to simultaneously remove
phenol red and transfer the sample to the correct buffer conditions for further purication, as
described in Chapter 3.
Remove interfering low-molecular-weight substances by desalting.
Fractional precipitationFractional precipitation is occasionally used at laboratory scale and in small-scale
commercial production to remove gross impurities. The success of this potentially powerful
procedure depends completely on the properties of the target protein in comparison with the
contaminating proteins.
Increased salt concentration can enhance hydrophobic interaction between proteins.
Differences in hydrophobicity result in a selective precipitation. Fractional precipitation can be
applied in three different ways, as shown in Figure 6.3.
Clarification
Bulk proteins andparticulate matter precipitated
Extraction, Clarification,
ConcentrationTarget protein precipitatedwith proteins of similar solubility
Extraction, ClarificationBulk proteins andparticulate matter precipitated
Supernatant
Redissolve pellet*
Redissolve
pellet*
Purification
ConcentrationTarget proteinprecipitatedwith proteinsof similar solubility
Remember: if precipitating agent isincompatible with next purificationstep, use Sephadex G-25 for desaltingand buffer exchange, e.g., HiTrap DesaltingPD-10,
,or HiPrep 26/10 Desalting column
(refer to Chapter 11)
*Remember: not all proteins are easy to redissolve, yield may be reduced
Fig6.3.Three ways to use precipitation.
Precipitation methods are affected by temperature, pH, and sample concentration. These
parameters must be controlled to ensure reproducible results. Examples of precipitation agents
are reviewed in Table 6.8. The most common precipitation method using ammonium sulfate is
described in more detail.
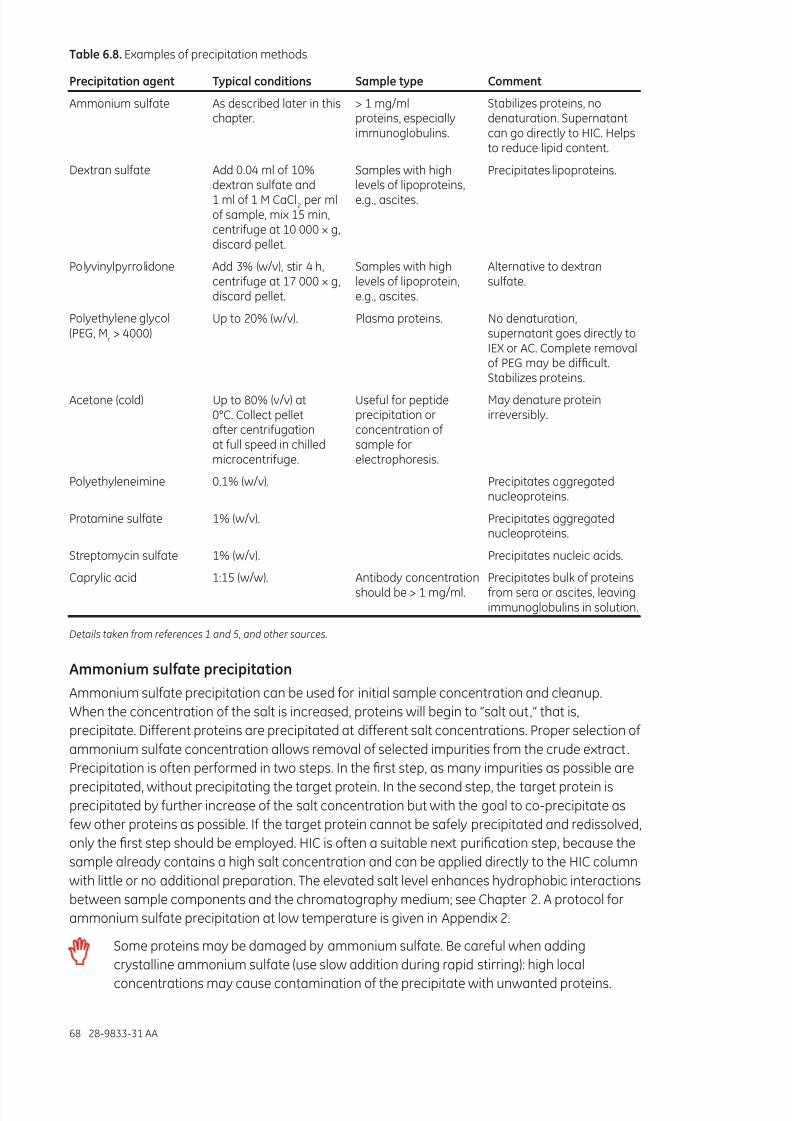
8/22/2019 Purificação de Proteínas - Estratégias, handbook
http://slidepdf.com/reader/full/purificacao-de-proteinas-estrategias-handbook 70/167
68 28-9833-31 AA
Table6.8. Examples of precipitation methods
Precipitationagent Typicalconditions Sampletype Comment
Ammonium sulfate As described later in thischapter.
> 1 mg/mlproteins, especiallyimmunoglobulins.
Stabilizes proteins, nodenaturation. Supernatantcan go directly to HIC. Helpsto reduce lipid content.
Dextran sulfate Add 0.04 ml of 10%
dextran sulfate and1 ml of 1 M CaCl2
per mlof sample, mix 15 min,centrifuge at 10 000 × g,discard pellet.
Samples with high
levels of lipoproteins,e.g., ascites.
Precipitates lipoproteins.
Polyvinylpyrrolidone Add 3% (w/v), stir 4 h,centrifuge at 17 000 × g,discard pellet.
Samples with highlevels of lipoprotein,e.g., ascites.
Alternative to dextransulfate.
Polyethylene glycol(PEG, M
r> 4000)
Up to 20% (w/v). Plasma proteins. No denaturation,supernatant goes directly toIEX or AC. Complete removalof PEG may be difcult.
Stabilizes proteins.
Acetone (cold) Up to 80% (v/v) at0°C. Collect pelletafter centrifugationat full speed in chilledmicrocentrifuge.
Useful for peptideprecipitation orconcentration of sample forelectrophoresis.
May denature proteinirreversibly.
Polyethyleneimine 0.1% (w/v). Precipitates aggregatednucleoproteins.
Protamine sulfate 1% (w/v). Precipitates aggregatednucleoproteins.
Streptomycin sulfate 1% (w/v). Precipitates nucleic acids.
Caprylic acid 1:15 (w/w). Antibody concentrationshould be > 1 mg/ml.
Precipitates bulk of proteinsfrom sera or ascites, leavingimmunoglobulins in solution.
Details taken from references 1 and 5, and other sources.
Ammoniumsulateprecipitation
Ammonium sulfate precipitation can be used for initial sample concentration and cleanup.
When the concentration of the salt is increased, proteins will begin to “salt out,” that is,
precipitate. Different proteins are precipitated at different salt concentrations. Proper selection of
ammonium sulfate concentration allows removal of selected impurities from the crude extract .Precipitation is often performed in two steps. In the rst step, as many impurities as possible are
precipitated, without precipitating the target protein. In the second step, the target protein is
precipitated by further increase of the salt concentration but with the goal to co-precipitate as
few other proteins as possible. If the target protein cannot be safely precipitated and redissolved,
only the rst step should be employed. HIC is often a suitable next purication step, because the
sample already contains a high salt concentration and can be applied directly to the HIC column
with little or no additional preparation. The elevated salt level enhances hydrophobic interactions
between sample components and the chromatography medium; see Chapter 2. A protocol for
ammonium sulfate precipitation at low temperature is given in Appendix 2.
Some proteins may be damaged by ammonium sulfate. Be careful when addingcrystalline ammonium sulfate (use slow addition during rapid stirring): high local
concentrations may cause contamination of the precipitate with unwanted proteins.

8/22/2019 Purificação de Proteínas - Estratégias, handbook
http://slidepdf.com/reader/full/purificacao-de-proteinas-estrategias-handbook 71/167
28-9833-31 AA 69
It may be practical to use HIC as a second step after an initial ammonium sulfate
precipitation.
Many proteins are stabilized in high ammonium sulfate concentrations. Keeping the
pellet overnight may be a suitable pause in the purication work.
For routine, more reproducible purication, precipitation with ammonium sulfate
should be avoided in favor of chromatography.
Precipitation is rarely effective for protein concentrations below 1 mg/ml.
ThermalorpHprecipitation
In rare cases, thermal precipitation of contaminants can be performed. Most proteins become
inactive and precipitate upon heating, but there are exceptions. A small number of proteins from
an organism may be extremely thermostable, as well as the bulk of proteins from thermophilic
organisms. Purication of these proteins can be efciently performed by incubation at 95°C.
Most proteins in the extract will be precipitated and can be removed by centrifugation, while the
target protein stays active in solution. The method is powerful when proteins from thermophiles
have been expressed in E. coli. Similarly, fractional precipitation by pH adjustment can
sometimes be used, often at pH extremes.
Extraction of membrane proteinsA membrane protein can be puried in the presence of detergent by applying essentially
any of the existing protein purication methods available for soluble proteins. A successful
solubilization protocol extracts the membrane protein at a high yield and results in stable
protein-detergent complexes (or protein-lipid-detergent complexes) where the protein retains its
active conformation.
Solubilization is crucial during the preparation of membrane proteins. During the solubilization
stage, membrane proteins are extracted from their natural environment, the lipid membrane,to an aqueous environment by the use of detergents. An efcient solubilization dissociates most
lipid-protein and protein-protein interactions, thereby allowing the separation of proteins. It is
important to have detergents present throughout the entire purication procedure.
Detergents act by disintegrating the lipid bilayer with concomitant formation of detergent
complexes with lipids and proteins. The hydrophobic surface areas of the membrane proteins
become buried in the hydrophobic interior of the detergent micellar structures, while hydrophilic
protein parts are in contact with the aqueous environment.
Some membrane proteins require interaction with native lipids from the lipid bilayer or added
exogenous lipids to remain in their active conformation. In such cases, it is essential that thesolubilization protocol enables the formation of a stable protein-lipid-detergent complex and
that it does not remove the required native lipid(s) associated with the target protein. Harsh
solubilization and purication procedures may lead to the removal of such essential lipids, and
hence inactivation of the protein.
All buffers and solutions used for membrane protein preparations (for solubilization,
purication, storage, etc.) should have a detergent concentration above the critical
micelle concentration (CMC).
Some examples of detergents recommended for solubilization of membrane proteins are listed
in Table 6.9.For a more detailed description of how to purify membrane proteins, refer to Purifying
Challenging Proteins. Principles and Methods from GE Healthcare (see also the "Related literature"
section at the end of this handbook).

8/22/2019 Purificação de Proteínas - Estratégias, handbook
http://slidepdf.com/reader/full/purificacao-de-proteinas-estrategias-handbook 72/167
70 28-9833-31 AA
Table6.9.Some recommended detergents suitable for solubilization of membrane proteins
Detergent Class* Fw CMC†(mM)
Brij™35 N 1200 0.07
C12
E8
(Octaethylene glycol monododecyl ether)‡ N 539 0.11
CHAPS (3-[(3-Cholamidopropyl)dimethylammonio]-1-propanesulfonate) Z 615 8
CYMAL-5 (Cyclohexyl-1-pentyl-β-D-maltoside) N 495 3.5‡
CYMAL-7 (Cyclohexyl-n-heptyl-β-D-maltoside) N 522 0.19
DM (n-Decyl-β-D-maltoside) N 483 1.8
Digitonin N 1229 < 0.5
DDM (n-Dodecyl-β-D-maltoside) N 511 0.17
FOS12 Z 352 0.12
HECAMEG (6-O-(N-Heptylcarbamoyl)methyl-α-D-glucoside) N 335 19.5
LDAO (Lauryldimethylamine oxide) Z 229 1
Nonidet™ P40 N 615 0.25
NG (n-Nonyl-β-D-glucoside) N 306 6.5
OG (n-Octyl-β-D-glucoside) N 292 18
Tween™ 20 N 1228 0.06
Triton™ X-100 N 647 0.23
* Classes: N, nonionic detergent, Z, zwitterionic detergent (both positive and negative charges)† CMC, critical micellar concentration; values depend on conditions (here at 20°C–25°C and 50 mM Na+ )‡ In water
Extraction of inclusion body proteins
Expression conditions that yield insoluble protein are avoided in many laboratories becausethe protein, in addition to being insoluble, is usually in a non-native to and thus requires
solubilization and refolding into its native structure. Protein refolding usually requires extensive
optimization. If refolding is possible, there are several advantages to working with inclusion
bodies: High expression levels are possible because production of target polypeptides can be
faster and reach higher concentrations. Inclusion bodies often contain well above 50% target
protein. The preparation of inclusion bodies can therefore give target protein of high purity. The
polypeptides inside the inclusion bodies are well protected against proteolytic action. Inclusion
bodies can be easily recovered by centrifugation. Inclusion bodies can be observed by light
microscopy (Fig 6.4). Expression as inclusion bodies allows the preparation of large amounts of
proteins that would otherwise be toxic to the host cells.
Fig6.4. Light-microscopic image of E. coli with inclusion bodies.

8/22/2019 Purificação de Proteínas - Estratégias, handbook
http://slidepdf.com/reader/full/purificacao-de-proteinas-estrategias-handbook 73/167
28-9833-31 AA 71
Isolationoinclusionbodies
Inclusion body isolation starts with cell harvest by centrifugation. The cells are usually disrupted
by mechanical lysis, for example, sonication. The inclusion bodies can then be washed in
1% Triton (or other detergent) and/or moderate concentrations of urea, multiple times using
centrifugation (10 000 × g, 15 min at 4°C). Washing conditions may have to be optimized for
each target protein. Target protein purities of more than 90% can often be obtained. The
inclusion body preparation can be stored frozen.
Solubilizationanddenaturation
Protein refolding begins with complete solubilization of the washed inclusion bodies using
denaturants such as guanidine hydrochloride and urea. It is recommended to include a
reducing agent to reduce any S-S-bonds, because they may have formed erroneously between
the denatured protein molecules. The protein may or may not be puried under denaturing
conditions before refolding. Refolding is initiated by reduction or removal of the denaturant .
Screening of multiple refolding conditions will usually be necessary. The screening work requires
a reliable assay for concentration of native protein to allow monitoring of refolding success.
Matrix-assisted refolding will briey be addressed in Chapter 9.
Include a reducing agent during solubilization to break any S-S-bonds.
References1. J-C. Janson and L. Rydén, Protein Purication, Principles, High Resolution Methods and
Applications, 2nd ed. Wiley VCH (1998).
2. Good, N. E. et al. Hydrogen ion buffers for biological research. Biochemistry 5: 467-477 (1966).
3. Ellis, K. J. and Morrison, J. F. Buffers of constant ionic strength for studying pH-dependent
processes. Methods Enzymol.87: 405-426 (1982).
4. Vagenende, V. et al. Mechanisms of protein stabilization and prevention of protein
aggregation by glycerol. Biochemistry 48: 11084-11096 (2009).
5. R.K. Scopes, Protein Purication, Principles and Practice, 3rd ed. Springer (1994).

8/22/2019 Purificação de Proteínas - Estratégias, handbook
http://slidepdf.com/reader/full/purificacao-de-proteinas-estrategias-handbook 74/167
72 28-9833-31 AA

8/22/2019 Purificação de Proteínas - Estratégias, handbook
http://slidepdf.com/reader/full/purificacao-de-proteinas-estrategias-handbook 75/167
28-9833-31 AA 73
Chapter 7Purication formats
There are numerous ways to set up a protein purication experiment. The combination of
hardware, chemicals, and the mode of operation is referred to as the purication format.
The principal purication formats will be described in this chapter. They are based onchromatography in closed columns (operated by a chromatography system, a stand-alone
pump, or sometimes a syringe); in open columns (e.g., gravity ow columns, spin columns,
multiwell lter plates); or using batch adsorption (e.g., magnetic beads). Many other formats
and hybrids have been described in the literature. The selection of purication format is
governed by what the application demands (e.g., sample volume, purity, amount of puried
protein required, presence of toxic components, number of samples to be processed) and what
equipment and experience are available in the laboratory.
An afnity-tagged protein can often be sufciently puried on a single column using a
syringe, gravity ow, centrifugation, or vacuum, but very high purity usually requires multiple
purication steps with high-resolution columns for the polishing purication steps. The higher
pressure and narrow peaks generated by these columns require that the runs are handled
by a chromatography system. An automated chromatography system provides a constant
ow at intermediate or high pressure and allows automatic collection of narrow peaks.
Several manual purication formats allow parallel purication of multiple proteins. Automated
purication of multiple samples can be performed sequentially, and there are solutions also for
automated multistep purications.
Manual purication formats
Several column formats and methods are available for manual purication (Tables 7.1 and 7.2).A syringe or a stand-alone pump (for larger sample volumes) can be used for HiTrap columns
(Fig 7.1). Gravity ow can be used on GraviTrap™ columns (“drop columns”). Centrifugation can
be used for SpinTrap, GraviTrap, and MultiTrap formats. The MultiTrap 96-well lter plates can
also be used with vacuum (except for PD MultiTrap G-25). Mag Sepharose magnetic beads are
primarily used with magnetic apparatuses. Several of the above-mentioned formats can be
used for desalting as described in Chapter 3.
A) B) C)
Fig7.1.Using HiTrap columns with a syringe. (A) Prepare buffers and sample. Remove the column’s top capand twist off the end. (B) Equilibrate the column, load the sample, and begin collecting fractions.(C) Wash and elute, continuing to collect fractions. This procedure is particularly suitable for puricationof tagged proteins, because a single step is expected to give a high degree of purication.

8/22/2019 Purificação de Proteínas - Estratégias, handbook
http://slidepdf.com/reader/full/purificacao-de-proteinas-estrategias-handbook 76/167
74 28-9833-31 AA
Table7.1.Manual purication applications
Applications Flow
Column/plate/beadMaximumsamplevolume1
P r e p a r a t i v
e p u r i f c a t i o n
P a r a l l e l p u r i f c a t i o n
M i n i p r e p s
S c r e e n i n g
M u l t i - p a r a
l l e l s c r e e n i n g
S y r i n g e
G r a v i t y
C
e n t r i u g a t i o n
V a c u u m
M a g n e t
Ä K T A d e s i g n c h r
o m a t o g r a p h y
HiTrap Unlimited2 × × × ×
GraviTrap 35 ml × × × × ×
SpinTrap 600 μl × × × × ×
MicroSpin 150 μl × × × × ×
MultiTrap 600 μl × × × × × × ×
Mag Sepharose beads Unlimited3 × × × × × ×
1 Several applications of the same sample can be performed as long as the capacity of the column, plate, or beads is notexceeded. Larger sample volumes can thus be handled using the same format
2 The sample volume is limited by binding capacity of the medium used and amount of binding protein in the sample3 The sample volume limit depends on the amount of beads used in batch adsorption, the binding capacity of the
chromatography medium present, and the amount of binding protein in the sample
Table7.2.Options for manual, afnity-based purications (for HiTrap columns see Table 2.2 in Chapter 2)
Applications Products
Purifcationoimmunoglobulins
IgG, fragments, and subclasses Protein A HP SpinTrapProtein A HP MultiTrap
Protein A Mag SepharoseProtein A Mag Sepharose Xtra
IgG, fragments, and subclasses including human IgG3,
the strong afnity for monoclonal mouse IgG1
and ratIgG. Immunoprecipitation and antibody purication.
Ab SpinTrapProtein G HP SpinTrapProtein G HP MultiTrapProtein G Mag SepharoseProtein G Mag Sepharose Xtra
Purifcationorecombinantproteins
Histidine-tagged proteins His GraviTrapHis SpinTrapHis MultiTrap HPHis MultiTrap FFHis Mag Sepharose Ni
GST-tagged proteins GST GraviTrapGST SpinTrapGST MultiTrap FFGST MultiTrap 4B
Group-specifcpurifcation
Biotinylated substances Streptavidin HP SpinTrapStreptavidin HP MultiTrap
Phosphorylated proteins and peptides Phos SpinTrap Fe (IMAC medium charged with Fe3+)TiO
2Mag Sepharose
Other
Immunoprecipitation Protein A Mag Sepharose, Protein G Mag SepharoseImmunoprecipitation Starter Pack (containing nProtein A
Sepharose Fast Flow, and Protein G Sepharose Fast Flow)Albumin and IgG depletion Albumin and IgG Depletion SpinTrap
Protein immobilization, for various applications(e.g., pull-down experiments, immunoafnitychromatography, immunodepletion)
NHS HP SpinTrapNHS Mag Sepharose

8/22/2019 Purificação de Proteínas - Estratégias, handbook
http://slidepdf.com/reader/full/purificacao-de-proteinas-estrategias-handbook 77/167
28-9833-31 AA 75
Batch adsorption is an alternative to column chromatography; the method is applied (or partly
applied) in several of the manual formats, for example, MultiTrap plates and Mag Sepharose
magnetic beads. Batch adsorption can also be performed using essentially any binding
chromatography technique. The sample and chromatography beads are mixed with careful
agitation during binding. The beads, except for Mag beads, are then transferred to an empty
column for wash and elution. Mag Sepharose magnetic beads are separated from liquids using a
magnetic apparatus. In the MultiTrap plate format, the sample is applied to the wells, which are
prelled with chromatography medium, and the plate is carefully shaken using a shaker duringincubations. However, for several MultiTrap protocols, shaking is not required. Batch adsorption
can often be used with unclaried samples. Generally, batch adsorption should be performed
using longer contact times than when using packed columns. The time required for binding
equilibrium depends on the method used (AC, IMAC, IEX, HIC, etc.) and can be from minutes to
hours. Overnight incubation is sometimes used for convenience.
Prepackedcolumnsandmultiwellflterplates
Fig7.2.HiTrap columns.
HiTrap 1 ml and 5 ml columns are available prepacked with
a large number of different AC, IEX, desalting, and HIC mediafor claried samples (Fig 7.2). For manual purication, HiTrap
columns can be run using a syringe or a stand-alone pump
but preferably using a chromatography system. HiTrap
columns allow purication from micrograms to more than
200 mg of target protein with a single column. Columns can
also be connected in series for scale-up. HisTrap FF crude is a
specially designed column for purication of histidine-tagged
proteins from unclaried lysates.
Fig7.3.SpinTrap columns.
Equi librate Load sample Wash E lute
Fig7.4. Principle of SpinTrappurication.
SpinTrap columns are prelled spin columns (Fig 7.3) designed
for protein minipreps using a microcentrifuge. Figure 7.4
shows the principles of purication using SpinTrap columns.
Purication can be achieved starting from claried or unclaried
samples and in parallel. SpinTrap columns accept 600 μl
samples, but multiple sample applications can be made to
handle a larger sample. Up to 0.75 mg of histidine-tagged
protein can be puried in 10 min per His SpinTrap column.

8/22/2019 Purificação de Proteínas - Estratégias, handbook
http://slidepdf.com/reader/full/purificacao-de-proteinas-estrategias-handbook 78/167
76 28-9833-31 AA
Fig7.5.MicroSpin columns.
MicroSpin columns are available prepacked with a selection
of media for buffer exchange/desalting and removal of
low-molecular-weight components from proteins and
nucleic acids. The columns are driven by centrifugation. (Fig
7.5). MicroSpin columns can accept 15 to 150 μl of sample
depending on application.
Fig7.6.GraviTrap columns
Equilibrate Load sample Wash Elute
Fig7.7.Principle of GraviTrappurication.
GraviTrap columns (Fig 7.6) are prepacked columns driven by
gravity ow or centrifugation. These columns are designed
to allow purication of claried or unclaried samples, with a
binding capacity of up to 20 mg for GST-tagged proteins and
35 mg for histidine-tagged proteins. Large sample volumes
can be handled by repeated application of sample, before
wash and elution. The ability to process unclaried samples
saves time and manual work. The short purication protocolgives reduced loss of sample and minimized degradation and
oxidation. Figure 7.7 shows the principles of purication using
GraviTrap columns. The product packaging converts into a
convenient column stand, enabling 10 samples or more to be
processed in parallel by a single person.
Fig7.8.MultiTrap lter plates.
MultiTrap 96-well lter plates are prelled with chromatography
medium (Fig 7.8). Purication can be performed starting with
claried or unclaried samples, in parallel using a robotic
system or manually, with centrifugation or vacuum. MultiTrap
plates are typically used for screening expression constructs,in solubility studies, for optimizing purication conditions,
or for small-scale preparative purication of multiple target
proteins. Each well accepts up to 600 μl of sample and can
have a binding capacity of up to 1 mg for some applications.
Scale-up can be performed using any of the columns packed
with the same medium.

8/22/2019 Purificação de Proteínas - Estratégias, handbook
http://slidepdf.com/reader/full/purificacao-de-proteinas-estrategias-handbook 79/167
28-9833-31 AA 77
Fig7.9.PreDictor plates.
PreDictor™ 96-well lter plates for high-throughput process
development (Fig 7.9). The plates are prelled with
BioProcess™ chromatography media for IEX and AC.
PreDictor plates support high-throughput process development
(HTPD) by allowing parallel screening of chromatography
conditions for binding, wash, and elution. They can also
be used for determining adsorption isotherms. PreDictor
plates can be operated in either a manual or an automated
workow. Assist software supports the PreDictor workow
from set-up of experimental design to data evaluation.
Data generated using PreDictor plates show good correlation
with data from chromatography columns, making the plates
useful for initial screening of process conditions. PreDictor
plates allow increasing process understanding through
exploring an enlarged experimental space because of the
efcient parallel format. Obtained information can then be
used for further optimization using standard prepackedcolumns such as HiTrap or HiScreen.
Fig7.10.Mag Beads.
MagSepharose beads are magnetic beads designed for
simplied handling in the enrichment of target proteins or
peptides, and small-scale purication/screening of antibodies
or histidine-tagged proteins (Fig 7.10). Antibodies or other
proteins can be immobilized on the Mag Sepharose beads
via the protein A, protein G, or NHS ligands, for capture
of target proteins using immunoprecipitation methods.The TiO2
Mag Sepharose bead has direct afnity for
phosphorylated peptides from digested protein samples.
A magnetic apparatus for handling microcentrifuge tubes is
available (Fig 7.11); alternatively, a PickPen™ can be used to
transfer beads between the tubes. Much larger volumes can
be handled with other magnetic apparatuses.
A) B)
Fig7.11. General magnetic separation steps. (A) Remove the magnetbefore adding liquid. The beads are dispersed into the liquid when themagnet is removed. (B) Insert the magnet before removing liquid. MagSepharose beads are rapidly drawn to the tube wall when exposed toa magnetic eld.

8/22/2019 Purificação de Proteínas - Estratégias, handbook
http://slidepdf.com/reader/full/purificacao-de-proteinas-estrategias-handbook 80/167
78 28-9833-31 AA
Automated purication using chromatography systemsA chromatography system should be used when reproducible results are important and
when manual purication becomes too time-consuming and inefcient. Systems provide
more control than manual purication because of the ability to automatically control the ow
rate and monitor the progress of the purication as well as to make controlled gradients and
fraction collection. Systems can perform simple step-gradient elution as well as high-resolution
separations using accurately controlled linear-gradient elution. Following is a description of the
range of ÄKTA design chromatography systems suited to purication of proteins.
ÄKTAdesignchromatographysystems
ÄKTA design chromatography systems are designed for protein purication ranges from
micrograms to kilograms of target protein. ÄKTAcrossow™ is a system for ultraltration
using membranes for separation. All systems are controlled by UNICORN™ software, with
the exception of ÄKTAprime plus, which is monitored by PrimeView™ software. UNICORN has
the benets of one common control platform and user interface for all scales of operation in
chromatography and ltration. Research-scale ÄKTA design chromatography systems are
briey described on the following pages.
Table7.3.Standard ÄKTA design congurations
Ä K T A m i c r o™
Ä K T A p r i m e p l u s
Ä K T A x p r e s s ™
Ä K T A p u r i f e r ™
Ä K T A a v a n t Wayoworking
Scale
Laboratory scale • • • • •
Process development – – – – •Regulatorydemands
System control and data handling • – • • •
for regulatory requirements
Typeowork
Method development – – – (•) •
Generic methods • • •
Micropreparative and analysis • – – – –
Automation
Buffering preparation – – – (•) •
pH scouting – – – (•) •
Media or column scouting – – – (•) •Multistep purication – (•) • – •
Sotware
UNICORN • – • • •
PrimeView – • – – –
• Recommended
(•) Optional
– Not recommended or not applicable
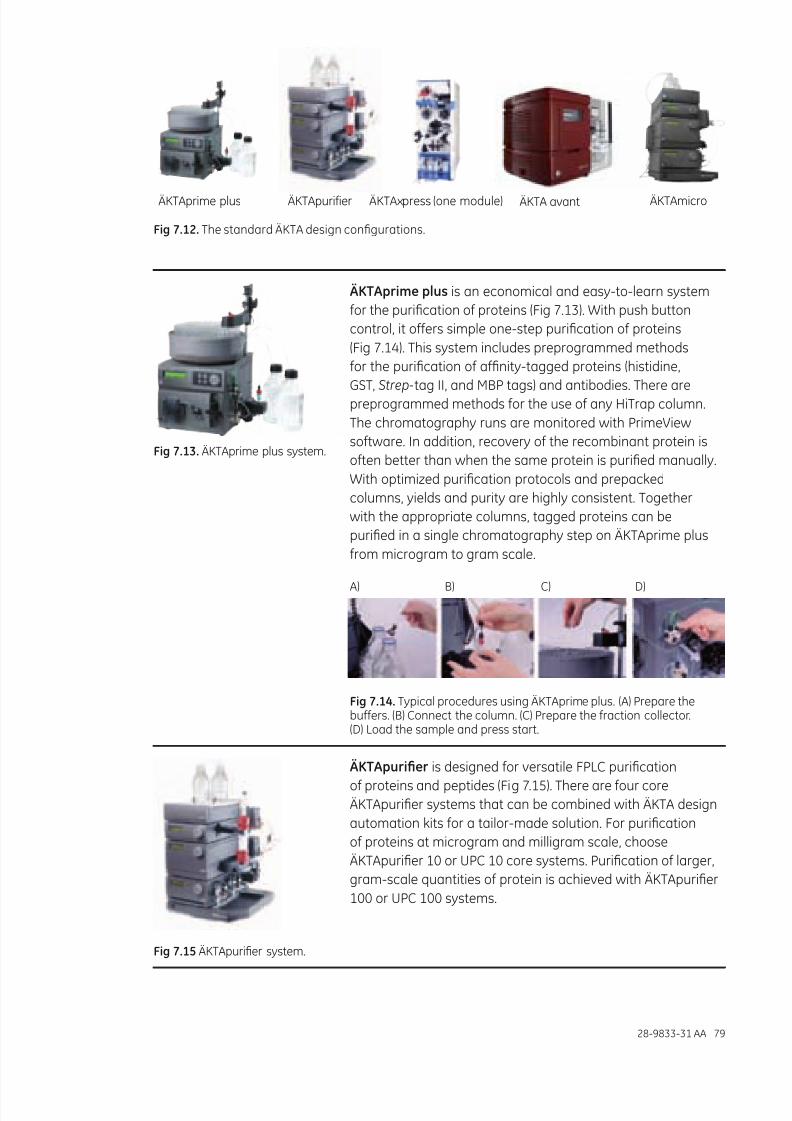
8/22/2019 Purificação de Proteínas - Estratégias, handbook
http://slidepdf.com/reader/full/purificacao-de-proteinas-estrategias-handbook 81/167
28-9833-31 AA 79
ÄKTAprime plus ÄKTAmicroÄKTApurifier ÄKTA avantÄKTAxpress (one module)
Fig7.12.The standard ÄKTA design congurations.
Fig7.13. ÄKTAprime plus system.
ÄKTAprimeplus is an economical and easy-to-learn system
for the purication of proteins (Fig 7.13). With push button
control, it offers simple one-step purication of proteins
(Fig 7.14). This system includes preprogrammed methods
for the purication of afnity-tagged proteins (histidine,
GST, Strep-tag II, and MBP tags) and antibodies. There are
preprogrammed methods for the use of any HiTrap column.
The chromatography runs are monitored with PrimeView
software. In addition, recovery of the recombinant protein is
often better than when the same protein is puried manually.
With optimized purication protocols and prepacked
columns, yields and purity are highly consistent. Together
with the appropriate columns, tagged proteins can be
puried in a single chromatography step on ÄKTAprime plus
from microgram to gram scale.
A) B) C) D)
Fig7.14. Typical procedures using ÄKTAprime plus. (A) Prepare thebuffers. (B) Connect the column. (C) Prepare the fraction collector.(D) Load the sample and press start.
Fig7.15ÄKTApurier system.
ÄKTApurifer is designed for versatile FPLC purication
of proteins and peptides (Fig 7.15). There are four core
ÄKTApurier systems that can be combined with ÄKTA design
automation kits for a tailor-made solution. For purication
of proteins at microgram and milligram scale, choose
ÄKTApurier 10 or UPC 10 core systems. Purication of larger,
gram-scale quantities of protein is achieved with ÄKTApurier
100 or UPC 100 systems.

8/22/2019 Purificação de Proteínas - Estratégias, handbook
http://slidepdf.com/reader/full/purificacao-de-proteinas-estrategias-handbook 82/167
80 28-9833-31 AA
Fig7.16. ÄKTAxpress systems.
ÄKTAxpress is designed for unattended multistep puricationof tagged proteins and antibodies (Fig 7.16). Up to 12ÄKTAxpress systems can be controlled from one computer.The system allows parallel purication of up to 48 differentsamples. Due to its small footprint, two systems can t in acold cabinet.
The purication protocols consist of up to four puricationsteps. A typical four-step protocol begins with AC followedby desalting, IEX, and GF. In addition, automatic on-columnor off-column tag-removal steps can be integrated in thepurication protocols. Extended and automated washingprocedures enable processing of a larger number of sampleswith minimal risk of cross-contamination.
Fig7.17.ÄKTA avant 25 andÄKTA avant 150 systems.
ÄKTAavant represents the new generation of ÄKTA systems(Fig 7.17). It incorporates cutting-edge functionality for
achieving fast and secure protein purication. ÄKTA avantis available in two versions, with 25 and 150 ml/min pumps.ÄKTA avant 25 is designed for screening of media andmethod optimization in laboratory-scale purication.ÄKTA avant 150 is designed for scale-up and robustness testing.
ÄKTA avant together with UNICORN 6 contains severalfeatures to facilitate and automate the protein purication.
A Design of Experiments (DoE) software tool integrated inUNICORN 6 allows the maximum amount of information froma minimum number of experiments during method optimization.
BufferPro is an advanced online buffer preparation functionthat enables buffer mixing without manual interaction.
The built-in fraction collector provides security by cooling thepuried samples and preventing dust from being introduced.
ÄKTA avant has a versatile valve conguration to facilitate thepurication and increase reproducibility: up to eight samplescan be automatically puried; the delta pressure over thecolumn is monitored; ve columns can be connected in parallel;and built-in air sensors prevent air from being introduced.
Fig7.18.ÄKTAmicro system.
ÄKTAmicro is designed for micropreparative liquidchromatography applications and for rapid purity analysis inmethod development and protein characterization (Fig 7.18).
Microscale purications can be performed starting withsamples containing extremely small amounts of targetprotein using microbore to analytical-scale columns.
The highest possible sample recovery and stability areobtained when the complete ow path is manufactured from
inert and biocompatible materials and assembled to giveminimal band broadening. The pump design gives a exibleow range with low pulsation and a broad pressure range,enabling high- as well as low-pressure separations.

8/22/2019 Purificação de Proteínas - Estratégias, handbook
http://slidepdf.com/reader/full/purificacao-de-proteinas-estrategias-handbook 83/167
28-9833-31 AA 81
Columns for ÄKTA design systemsHigh-quality column packing is essential for a good separation. A poorly packed column gives
rise to poor and uneven ow, peak broadening, and loss of resolution. A wide variety of available
columns are described in the next section, covering different principles, matrices, and sizes.
Sometimes there may still be a need for packing your own column. A brief guideline for
column packing is given in Appendix 3. A range of empty columns available for packing the
chromatography media of choice are described later in this chapter. See Table 7.4 for guidelineson how to combine media and columns.
Prepackedcolumns
Prepacked columns from GE Healthcare will ensure reproducible results and excellent performance.
Fig7.19.RESOURCE columns.
RESOURCE columns are prepacked with SOURCE 15 media
for IEX, HIC, and RPC. RESOURCE columns are made of PEEK
(polyetheretherketone), which has high pressure tolerance
and high chemical resistance (Fig 7.19). The RPC media
are packed into steel columns. SOURCE media are basedon a hydrophilic matrix made from monodispersed, rigid,
polystyrene/divinyl benzene. There are SOURCE 15 media for
IEX, HIC, and RPC. The media demonstrate very high chemical
and physical stability. The small particle size allows fast
binding and dissociation to facilitate high resolution, and the
uniformity and stability of the particles ensure high ow rates
at low backpressure.
Fig7.20. Precision columns.Examples: Mini Q PC 3.2/3 (at left);
and Superdex Peptide 3.2/30(at right).
Precision columns are designed for micropurication and
analysis of proteins and peptides (Fig 7.20). The columns areused extensively in peptide sequencing and protein structure/
function studies. They are excellent for the polishing step of
small-scale protein purication procedures and for purity
check analysis. The small volume of the columns decreases
the total area of the prepacked medium, which minimizes
nonspecic adsorption and dilution effects. The column
volumes have been scaled down 10-fold compared with
Tricorn™ columns. Precision columns are available for GF
(3.2 × 300 mm with Superdex Peptide, Superdex 75 and 200,
and Superose™ 6 and 12 media) and IEX (1.6 × 50 mm withMono Q and Mono S media and 3.2 × 30 mm with Mini Q™ and
Mini S™ media). Precision columns require a special Precision
column holder for use on ÄKTA design systems.

8/22/2019 Purificação de Proteínas - Estratégias, handbook
http://slidepdf.com/reader/full/purificacao-de-proteinas-estrategias-handbook 84/167
82 28-9833-31 AA
Fig7.21. HiTrap prepacked columns.
HiTrap columns are convenient and reliable columns (1 or 5 ml)
for fast and easy preparative purications, either alone or
connected in series (Fig 7.21). They are designed for use with
a syringe, peristaltic pump, or chromatography system. There
are HiTrap columns for a broad range of chromatography
media: for AC, IMAC, IEX, desalting, and HIC purication
methods, a range of Sephadex, Sepharose High Performance,Sepharose XL, Sepharose 4B, and Sepharose Fast Flow
columns, as well as Capto, MabSelect, MabSelect Xtra, and
MabSelect SuRe media. The HiTrap column inlet is molded
with 1/16" female threads, and the outlet has 1/16" male threads
for direct coupling to ÄKTA design systems without the need
for extra connectors. HiTrap columns cannot be opened and
repacked. See Table 2.2 for a list of available AC columns.
Fig7.22. HiScreen columns.
HiScreen columns are part of the process development
platform available from GE Healthcare (Fig 7.22). The columnsare prepacked with a range of BioProcess chromatography
media (for AC, IMAC, IEX, and HIC) and designed for parameter
screening and method optimization. HiScreen columns
have small bed volumes (4.7 ml) thus requiring low sample
and buffer volumes. Process uid velocities can be applied,
because the 10 cm bed height gives enough residence time,
and the results can then serve as the basis for linear process
scale-up. If necessary, two columns can easily be connected
in series to give a bed height of 20 cm. The small volume makes
HiScreen columns suitable also for laboratory-scale purication.
Fig7.23. HiPrep prepacked columns.
HiPrep prepacked columns are designed for convenient scale-
up purication (Fig 7.23). HiPrep columns are available for GF,
desalting, AC, IEX, and HIC in four different sizes, 20 ml, 53 ml,
120 ml, and 320 ml. HiPrep columns for GF are prepacked
with Sephacryl High Resolution media, in 120 ml and 320 ml
sizes. The column inlet and outlet is molded with 1/16" female
threads for direct connection to ÄKTA design systems. HiPrep
columns cannot be opened and repacked. See Table 2.2 for a
list of available AC columns.
Fig7.24. HiLoad columns.
HiLoad™ columns are prepacked with high-performance
Superdex media for convenient and reliable GF (Fig 7.24).
HiLoad columns are available in 120 ml and 320 ml formats
prepacked with Superdex 30 prep grade, Superdex 75 prep
grade, and Superdex 200 prep grade to cover a wide range of
separation of proteins of different molecular weights.

8/22/2019 Purificação de Proteínas - Estratégias, handbook
http://slidepdf.com/reader/full/purificacao-de-proteinas-estrategias-handbook 85/167
28-9833-31 AA 83
Fig7.25. Tricorn columns.
Tricorn high-performance columns are designed for high-resolution protein purication at laboratory scale, makingthem an excellent choice for the polishing step in multi-steppurication protocols. Tricorn columns are available with arange of chromatography media for GF (Superose, Superdex),IEX (Mono Q, Mono S, SOURCE 15Q, and SOURCE 15S),chromatofocusing (Mono P), and HIC (SOURCE 15PHE).
The columns are simple to use, with specially designedttings for easy connection to ÄKTA design and other high-performance LC systems. The columns are coated with aprotective plastic lm that protects the column and providespersonal safety in the event of breakage. Tricorn columnsare also available empty for packing with a chromatographymedium of choice (see below).
Emptycolumns
To obtain a column with high-quality packing and that can resist the pressure caused by the
pressure drop across the selected chromatography bed, select the appropriate empty column
based on the guidelines given in Table 7.4. During packing, follow the instructions supplied with
the medium and empty column.
Fig7.26. Tricorn columns.
Tricorn columns are designed for high-performance
chromatography media such as Sepharose High Performance,
Superdex prep grade, and SOURCE (Fig 7.26). When workingwith capture media such as Capto, MabSelect, or Sepharose
Fast Flow, a Tricorn Coarse Filter Kit is recommended to
use for reducing the risk of clogging. Tricorn columns are
available with an inner diameter of 5 mm with lengths of 20,
50, 100, 150, and 200 mm, with an inner diameter of 10 mm
and in lengths of 20, 50, 100, 150, 200, 300, and 600 mm. The
maximum pressure is 100 bar for the 5 mm (i. d.) column and
50 bar for the 10 mm (i. d.) column.
Fig7.27.XK columns.
XK columns are specied to run most chromatography mediaincluding Superdex prep grade and Sepharose High Performance
(Fig 7.27). They are jacketed and available as 16, 26, and 50 mm
(i.d.) columns (XK16, XK26, and XK50) with lengths from 20 to
100 cm. The maximum pressure is 5 bar for XK 16 and XK 26
columns and 3 bar for XK 50 columns. XK columns prepacked
with medium go under the name HiLoad.

8/22/2019 Purificação de Proteínas - Estratégias, handbook
http://slidepdf.com/reader/full/purificacao-de-proteinas-estrategias-handbook 86/167
84 28-9833-31 AA
Fig7.28.HiScale columns.
HiScale™ columns are designed for preparative laboratory-scale purication and for process development usingstandard chromatography media (Fig 7.28). HiScale columnsare available with inner diameters of 16, 26, and 50 mm andlengths of up to 20 or 40 cm. The maximum pressure is 20 bar.The QuickLock mechanism of the adapter shaft facilitates rapidand easy movement of the adapter, simplifying adjustments aswell as disassembly and cleaning. Turning the column end capsenables controlled axial compression of the gel bed, which issuitable during packing of rigid media.
Table7.4Empty column and chromatography media guide
Recommendedcolumn
Loosemedia Tricorn XK HiScale
Gelfltration
Sephadex • • º
Sepharose • • ºSephacryl • • ºSuperdex prep grade • • ºSuperose prep grade • • ºIonexchange
Capto • • •
Sepharose Fast Flow • • •
Sepharose High Performance • •1 •
Sepharose XL • • •
SOURCE • • •
MacroCap™ • • •
Afnity
Sepharose 6B/4B/CL-4B • • –
Sepharose Fast Flow • • –
Sepharose High Performance • •1 –
MabSelect • •1 •
Reversedphase
SOURCE • – –
Hydrophobicinteraction
Sepharose Fast Flow • • •
Sepharose High Performance • •1 •
SOURCE • – –Systems
ÄKTAmicro • – –
ÄKTAprime plus • • –
ÄKTApurier 10 • • –
ÄKTApurier 100 • • •
ÄKTA avant 25 • • •
ÄKTA avant 150 – • •
ÄKTAxpress º2 º2 –
• Recommended combination
º Can technically be used, but not an optimal combination- Not recommended or not applicable1 Not recommended for XK 502 For optimal performance use prepacked columns where purication parameters are predened
For more information visit www.gelifesciences.com/protein-purication or www.gelifesciences.com/bioprocess or www.gelifesciences.com/purication_techsupport

8/22/2019 Purificação de Proteínas - Estratégias, handbook
http://slidepdf.com/reader/full/purificacao-de-proteinas-estrategias-handbook 87/167
28-9833-31 AA 85
Purication from unclaried samplesHiTrap FF crude column has been designed for purication of histidine-tagged proteins from
unclaried samples, thus eliminating the time and manual labor required for sample clarication;
see Figure 7.29. SpinTrap and GraviTrap columns, as well as MultiTrap plates can also be used
with unclaried samples. For GraviTrap, unclaried samples may reduce the ow when run using
gravity, thus potentially increasing the purication time.
Enzymaticandmechanicalcell lysis
Transferthe sampleto tubes Centrifugation
Collect thesupernatant
Filtrationof sample Purification run
Conventional IMAC
HisTrap FF crudeEnzymaticandmechanicalcell lysis Purification run
40 min 40 min
approx.80 min
40 min 40–80 min 40 min
Approx.120–160 min
Fig7.29.HisTrap FF crude columns save time during purication of histidine-tagged proteins compared withconventional IMAC.
Scale-upIn laboratory-scale purication, scale-up can usually be achieved by increasing the column
volume with the same factor as the sample volume is increased. For example, purication of a
histidine-tagged protein on HisTrap 1 ml can easily be scaled up ve times on HisTrap 5 ml or
20 times on a HisPrep FF 16/10 (20 ml) prepacked column; see Figure 7.30. The ve-fold scale-
up step was performed using a column with the same length as the rst column, whereas the
20-times scale-up was performed using a column that was both larger in diameter and longer.
When further increasing the scale of purication, it is important to keep the sample residence
time (time on column) constant. This is often done by keeping the column length constant and
increasing the column cross-sectional area in proportion to sample volume, while keeping the
linear ow (cm/hour) constant. An elution gradient volume should be increased in proportion
to the increase in column volume. For AC, IEX, and HIC, columns are often 10 to 20 cm in length
independent of size. GF columns are rarely longer than 100 cm.
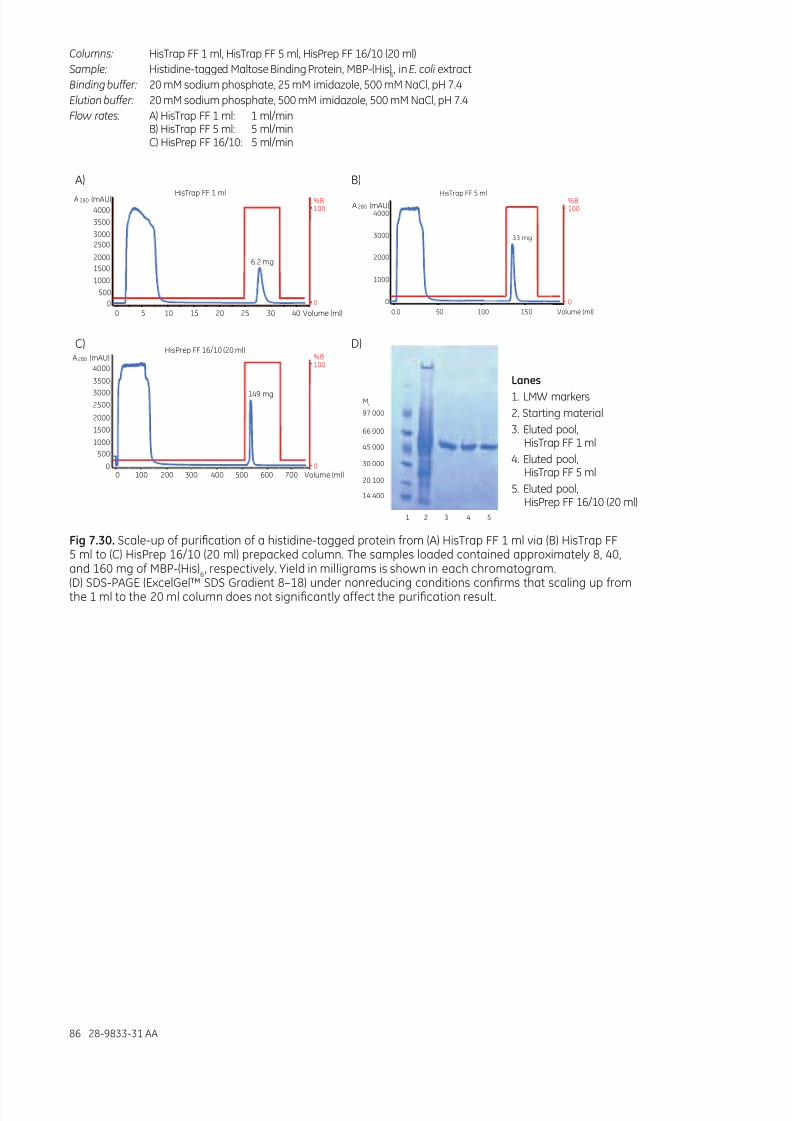
8/22/2019 Purificação de Proteínas - Estratégias, handbook
http://slidepdf.com/reader/full/purificacao-de-proteinas-estrategias-handbook 88/167
86 28-9833-31 AA
Lanes1. LMW markers
2. Starting material
3. Eluted pool,HisTrap FF 1 ml
4. Eluted pool,HisTrap FF 5 ml
5. Eluted pool,HisPrep FF 16/10 (20 ml)
Columns: HisTrap FF 1 ml, HisTrap FF 5 ml, HisPrep FF 16/10 (20 ml)Sample: Histidine-tagged Maltose Binding Protein, MBP-(His)
6, in E. coli extract
Binding buffer: 20 mM sodium phosphate, 25 mM imidazole, 500 mM NaCl, pH 7.4
Elution buffer: 20 mM sodium phosphate, 500 mM imidazole, 500 mM NaCl, pH 7.4
Flow rates: A) HisTrap FF 1 ml: 1 ml/minB) HisTrap FF 5 ml: 5 ml/minC) HisPrep FF 16/10: 5 ml/min
0 5 10 15 20 25 30 40 Volume (ml)
4000
3500
3000
2500
2000
1500
1000
500
0
6.2 mg
HisTrap FF 1 mlA (mAU)280
A (mAU)280
4000
3500
3000
2500
2000
1500
1000
500
00 100 200 300 500400 600 Volume (ml)
149 mg
HisPrep FF 16/10 (20 ml)
700
1 2 3 4 5
Mr
97 000
66 000
45 000
30 000
20 100
14 400
D)C)
B)A)
0.0 50 100 150 Volume (ml)
33 mg
4000
%B100
0
3000
2000
1000
0
HisTrap FF 5 ml
A (mAU)280 %B100
0
%B100
0
Fig7.30. Scale-up of purication of a histidine-tagged protein from (A) HisTrap FF 1 ml via (B) HisTrap FF5 ml to (C) HisPrep 16/10 (20 ml) prepacked column. The samples loaded contained approximately 8, 40,
and 160 mg of MBP-(His)6, respectively. Yield in milligrams is shown in each chromatogram.(D) SDS-PAGE (ExcelGel™ SDS Gradient 8–18) under nonreducing conditions conrms that scaling up fromthe 1 ml to the 20 ml column does not signicantly affect the purication result.

8/22/2019 Purificação de Proteínas - Estratégias, handbook
http://slidepdf.com/reader/full/purificacao-de-proteinas-estrategias-handbook 89/167
28-9833-31 AA 87
Chapter 8Analysis and characterization
Analytical assays are essential to follow the progress of purication. Initially, they are needed for
method development for expression, sample preparation, and the different purication steps,
and later for analysis of the outcome of the different steps in the protein production workow.
Finally, analyses are performed to determine the quality of the nal preparation. Analytical data
for the different purication steps are often compiled into a purication table (see description
in Chapter 5 and Table 5.3), to allow evaluation of the purication protocol. After purication,
characterization of the target protein is possible using a broad range of chemical and physical
analysis methods. This chapter addresses some of the most common and convenient analysis
methods used in protein purication. For further reading, refer to literature on the subject of interest.
Development of a purication protocol is facilitated by analytical information such as the identity
of the protein obtained and the concentration of target protein, total protein, and specic
impurities. The required information and the possibility of obtaining it depends on where one isin the purication workow; see Table 8.1. It is important that the identity of the expressed and
puried protein is established early, preferably directly after expression. If the protein has a tag
for detection or afnity purication, the detection of the tag is a rather strong proof that the
target protein is present. If the tag is placed on the C terminus of the protein, thus requiring full-
length target protein translation to obtain the tag moiety, its presence is indicative of a complete
target protein. It is good practice to secure the protein identity of the nal preparation after
purication to avoid wasting time studying the wrong protein.
During method development, there are several parameters that should be optimized such
as yield, purity, and activity. Measurement of total protein concentration, target protein
concentration, activity, and purity are usually needed for protein purication development andfor the nal quality check of the preparation. Analysis of size homogeneity, that is, determination
of the association state of the target protein, is often important. The absence of aggregates
is a requirement for many applications. Aggregates may have formed during expression, but
can also be a result of protein instability that led to aggregation during purication. Some
purications require the absence or a limited concentration of a specic impurity. In such cases,
an analysis protocol should be established to measure the concentration of the substance.
The quality of the nal protein preparation is usually determined using the same methods as for
the development of the purication protocol. Once the protein is pure, additional chemical and
physical analyses are available that can be used to further characterize the target protein.

8/22/2019 Purificação de Proteínas - Estratégias, handbook
http://slidepdf.com/reader/full/purificacao-de-proteinas-estrategias-handbook 90/167
88 28-9833-31 AA
Table8.1.Protein purication workow and analytical information
Workow
Analyticalinormation
E x p r e s s i o n
S a m p l e p r e p a r
a t i o n
P u r i f c a t i o n
U s e / S t o r a g e
Comments
Proteinidentity Early check during expression and of nal preparation.
Detection of afnity tag is a strong proof of presence of target, but the true identity should be checked because thetag may be on the wrong protein.
Targetproteinconcentration For calculation of yield or recovery.
Totalproteinconcentration
Activity Detection of target protein fractions during purication.Often important that the puried protein is fully native.
Purity
Concentrationospecifcimpurities
For protein method development.
Sizehomogeneity Detect target protein truncations, oligomers, oraggregates.
Otherhomogeneityissues Analysis of post-translational modications, orhetereogeneities thereof.
Analysis of chemical modications.Proteinstability Protein stability may be important both during purication
and during subsequent use of the puried protein.
typical use
less common
Target protein identity and quantitationThe ultimate identity check of the puried protein is digestion (trypsinization) and ESI-MS analysis
followed by matching against a protein sequence database. Other indirect means of checking
the identity of the target protein, for example, immunodetection methods, can also be used.Some of these methods can also be used for quantitation.
Pure target protein, as in the nal preparation, can be quantitated using any of the protein
determination methods given later in this chapter. During development of methods for
expression, sample preparation, or purication, samples to be analyzed have different degrees
of complexity. The analytical methods are differently suited to function with such samples. The
target protein concentration can be measured or estimated by several methods:
• Density of target protein band in SDS-PAGE
• “Color” (absorbance at specic wavelength) or uorescence of target protein, detection tag,
or afnity tag• Immunodetection of target protein or tags; Western blotting, ELISA, immunoafnity chromatography
• AC directed toward the target protein or the tag, followed by a simple quantitation method,
for example, SDS-PAGE, absorbance, or protein determination
8/22/2019 Purificação de Proteínas - Estratégias, handbook
http://slidepdf.com/reader/full/purificacao-de-proteinas-estrategias-handbook 91/167
28-9833-31 AA 89
• Area of peaks in the absorbance at 280 nm in chromatograms
• Functional assays for the target protein (enzyme activity, receptor binding, substrate
transport, etc.)
DensityotargetproteinbandinSDS-PAGE
If the target protein concentration is high enough compared with other components of the sample,
it can often be sufciently quantitated by SDS-PAGE, at least in relative estimates. A pure protein
with known concentration, for example, BSA, can be included in the SDS-PAGE run and used toprepare a calibration curve. Quantitation by SDS-PAGE is often used as a simple estimation of
the (relative) concentration after expression, where the presence of a new protein band of
expected apparent Mrafter induction is a strong indication of successful expression. As previously
mentioned, enrichment of the target protein may be needed to give clear SDS-PAGE results.
Quantitationbychromatographypeakintegration
During purication of afnity-tagged proteins, the chromatogram obtained by the in-line UV
detector can be used for quantitation. A rough estimation of the quantity of target protein can
often be performed simply by integrating the target protein peak, assuming that the target
protein constitutes the major part of the material corresponding to the peak. This is often thecase after AC purication. The amount of target protein is estimated by determining the area
of the eluted absorbance peak detected at 280 nm and using the extinction coefcient for
the target protein. The extinction coefcient can be theoretically calculated from the amino
acid composition of the protein, if known. Such calculations are often made using any trusted
program on the Web but can easily be set up in a spreadsheet. In polishing steps, the major
peak eluted during IEX, HIC, or GF can often be assumed to be relatively pure target protein
and can thus be used for estimation of quantity. Note that peaks higher than approximately
1500 mAU cannot be used, because the UV absorbance detected (an instrument limitation) is
not linear with concentration, and correction for this cannot be made accurately.
Alternatively, the fraction corresponding to the peak can be collected, and the total proteinconcentration can be determined by absorbance measurement or any other total protein
determination method (see below).
Obvious weaknesses of these methods are that if the purity of the eluted peak is low, the quantity is
overestimated, and if the biggest peak in a polishing purication chromatogram is an impurity
rather than the target protein, the estimate is clearly not valid. For overexpressed proteins, the
method generally works well. SDS-PAGE can be used to verify purity of the analyzed peak.
Detectionospecifcabsorbanceoruorescence
The UV/visible spectrum can sometimes be unique for a specic protein, in particular if light-absorbing cofactors (avins, heme groups, other metal ions, etc.) are present. The spectrum
can be used for analyzing whether the protein is intact with respect to cofactors, coenzymes,
or subunits.
In some cases, the protein or a detection or afnity tag on the protein has absorption or
uorescence properties that differ from the bulk of the sample components. Even in complex
samples, these proteins can often be detected and even quantitated with sufcient accuracy
by absorbance or uorescence measurements at specic wavelengths. ÄKTA design
chromatography systems can measure absorbance at multiple wavelengths; the standard
absorbance measurement at 280 nm (giving approximate total protein concentration) can thus
be supplemented with detection at an additional wavelength specic for the target protein.Figure 8.1 gives an example of the detection of green uorescent protein (GFP) in an IEX
purication run. The GFP variant used in this case has an absorbance maximum at 490 nm.

8/22/2019 Purificação de Proteínas - Estratégias, handbook
http://slidepdf.com/reader/full/purificacao-de-proteinas-estrategias-handbook 92/167
90 28-9833-31 AA
0 5 10 15 20 25 Volume (ml)
2000
1500
1000
500
0
A280 (mAU)
l
l
i I
l
Fig8.1. The principle of detection of the target protein by absorbance at a specic wavelength. An E. coliextract with a histidine-tagged GFP was applied on a Capto Q column (5 × 100 mm). The histidine-taggedGFP was specically detected at 490 nm. Blue UV trace, absorbance at 280 nm; red, absorbance at 490 nm;green, conductivity.
Immunodetection
Immunoassays (e.g., Western blot, ELISA, immunoprecipitation, surface plasmon resonance
[SPR]) can be used for quantitation if a suitable standard curve can be produced. In this case,
it is not necessary to purify the tagged protein as long as a puried standard is available and
the specicity of detection is sufcient. Immunoassay methods such as dot blot analysis and
immunoprecipitation are often suitable for screening large numbers of samples when a simple
yes/no answer is required, for example, when testing fractions from a chromatography run.
ELISA
ELISA is a frequently used immunoassay that allows the handling of many samples in parallel.
The specicity depends on the antibodies used. Note that inactive target proteins may also
be recognized. The GST 96-Well Detection Module from GE Healthcare provides a highly
sensitive kit for ELISA for testing claried lysates and intermediate purication fractions forthe presence of GST-tagged proteins (Fig 8.2). Samples are applied directly into the wells of the
plates, and GST-tagged proteins are captured by specic binding to anti-GST antibody that
is immobilized on the walls of each well. After removal of unbound material by washing, the
captured GST-tagged proteins are then detected with HRP/Anti-GST conjugate provided in the
module. Standard curves for quantitation of tagged proteins can be constructed using puried
recombinant GST, which is included as a control.
0.01 0.1 1 10 100 1000 10 000
0.75
1.50
0
Amount GST (ng/well)
A450B)A)
Fig8.2.(A) Screening of bacterial lysates for GST-tagged protein expression using the GST 96-Well DetectionModule. (B) Sensitive detection of recombinant GST using the GST 96-Well Detection Module.
Each tagged protein is captured uniquely. Because of this, a standard curve based on pure
target protein of known concentration will give the best accuracy. Recombinant GST protein
should be included as a standard control in every assay.

8/22/2019 Purificação de Proteínas - Estratégias, handbook
http://slidepdf.com/reader/full/purificacao-de-proteinas-estrategias-handbook 93/167
28-9833-31 AA 91
SuracePlasmonResonance(SPR)
SPR analysis using Biacore™ instruments can be used to measure the concentration of a specic
protein in a mixture. The measurement requires a suitable binding partner, usually an antibody
directed toward the protein to be analyzed. See more about SPR later in this chapter.
AC
AC based on the afnity tag on the target protein can be used for enrichment before simple
quantitation by SDS-PAGE. The specic enrichment of the target protein decreases the samplecomplexity and increases the thickness of its band in SDS-PAGE, so that specic detection may
not be necessary. This method can be used when there is no antibody directed toward the target
protein. The method has the advantage that a set of constructs of a specic target protein or
a set of different target proteins can be generically quantitated or semi-quantitated, provided
that they are tagged with the same afnity tag. The afnity purication can be performed in
parallel using, for example, SpinTrap columns or MultiTrap plates; see Chapter 7. The example
in Figure 8.3 shows quantitation of different truncated variants of a kinase using SDS-PAGE
analysis after afnity enrichment on His MultiTrap HP. Quantitation, or relative quantitation from
the gel, is performed by eye or by densitometric scanning, using BSA standards.
Fig8.3.SDS-PAGE analysis of His MultiTrap HP enriched histidine-tagged truncated variants of kinaseexpressed in a transient insect cell system for 72 h. Lane M: marker; 06 to 31, kinase variants; E, enhancedgreen uorescent protein (untagged, transfection-positive control); C, non-transfected Hi5 cells; B1 to B4, 0.5,0.75, 1.0, and 1.5 μg BSA, respectively.
Total protein concentrationAbsorbance
Measurement of UV absorbance at 280 nm is probably the most common method for determining
protein concentration because it is fast, convenient , and nondestructive. Absorbance
measurement can be made in 1 or 3 ml quartz or single-use plastic (low-UV-absorption type)
cuvettes. For a large number of samples and if only moderate precision is required, a 96-well
format can be used. It should be noted that not all proteins absorb at 280 nm. For these proteins
the absorbance from the peptide bonds of the polypeptide can be used. Measurements can be
made at 205 nm. A drawback with using the lower wavelength is the increased sensitivity to lightscattering effects. For tips and hints on protein determination using absorbance measurements,
see Appendix 4.

8/22/2019 Purificação de Proteínas - Estratégias, handbook
http://slidepdf.com/reader/full/purificacao-de-proteinas-estrategias-handbook 94/167
92 28-9833-31 AA
Proteinconcentrationassays
Various protein determination methods are frequently used to determine the total protein
concentration. These assays are destructive to the sample aliquots analyzed. The protein reacts
with a reagent to generate a chromophore to be detected by absorbance measurement or a
uorescent species for uorescence detection. An overview of common protein determination
methods is given in Table 8.2.
Table8.2.Comparison of common protein determination methods
Compatiblewith
Assaymethod
D e t e r g e n t s
R e d u c i n g a g e n t s
C h e l a t i n g a g e n t s
CommentsUseulrange(µg/ml)
NanoOrange™assay
(uorescent when bound
to protein)
0.01 to 10 No Yes Yes Fluorescence detection (excitation:470 nm, emission: 570 nm).
Samples can be read for up to 6 h.Low protein-to-protein variability.
No interference from nucleic acid.
FluoroProfle™
(uorescent when boundto protein)
0.04 to 600 (Yes) (Yes) Yes Fluorescence detection (excitation:510 nm, emission: 620 nm).
Low protein-to-protein variability.
No interference from nucleic acid.
Stable for 6 h.
No interference from moderateconcentration of detergents orreducing agents.
Bicinchoninicacidassay(BCAassay)(reduction of Cu2+, detectcomplex of Cu+ andbicinchoninic acid)
20 to 2000 Yes No No Absorbance detection at 562 nm.
Low protein-to-protein variability.
Samples must be read within 10 min.
Temperature sensitive.
Pierce™BCAAssay–ReducingAgentCompatible
125 to 2000 Yes Yes Yes Compatible with 5 mM DTE, 35 mMβ-mercaptoethanol, or 10 mM TCEP.
Bradordassay
(detect complexes withCoomassie Brilliant Blue G-250)
1 to 1500 (No) Yes Yes Absorbance detection at 595 nm.
Protein precipitates over time.
High protein-to-protein signalvariability.
Interference from high bufferconcentration.
Stable reagents (2 mo).Pierce660nmassay
(detect dye-metal-proteincomplex)
25 to 2000 Yes Yes Yes Absorbance detection at 660 nm.
Reaches stable end-point.
Moderate protein-to-protein variability.
Lowryassay
(reduction of Cu2+, detectcomplex of Cu+ and Folin-Ciocalteu reagent)
1 to 1500 No No No Multistep procedure.
More accurate than Bradford assay.
Absorbance detection at 750 nm.
Reaches a stable end-point.
Moderate protein-to-protein variability.
Interference from carbohydrates andsome buffers.
Absorbance 0.05 to 2000 Yes Yes Yes Usually absorbance at 280 nm, otherwavelengths possible. Detectioninuenced by nucleic acidsand other UV-absorbing contaminants,and by light scattering from particles inthe sample.

8/22/2019 Purificação de Proteínas - Estratégias, handbook
http://slidepdf.com/reader/full/purificacao-de-proteinas-estrategias-handbook 95/167
28-9833-31 AA 93
Proteindeterminationbyaminoacidanalysis
Amino acid analysis (AAA) is often regarded as the most accurate method for determining protein
concentration. Because of the difculties associated with obtaining reliable AAA, for most laboratories
it is best to purchase the service from a dedicated facility. AAA can give relative amino acid
composition of a pure protein and can be used for purity analysis of recombinant proteins by
comparing the composition of amino acids obtained by analysis with the known composition.
The measured content of some amino acid residues tends to be lower than the true value.
The presence of groups of aliphatic amino acids, for example, Val-Val, Ile-Ile, or Val-Ile, maygive underestimations of the amounts of these amino acids. Note the following information
on amino acid degradation for some specic amino acids: Glutamine and asparagine convert
into glutamic acid and aspartic acid, respectively. Threonine and serine are lost (5%-10%
loss). Tryptophan is not recovered in standard AAA (acidic hydrolysis method). Methionine may
oxidize to methionine sulfoxide, but this can be minimized by addition of β-mercaptoethanol.
Some common buffers and additives may affect analysis; see Table 8.3. Various protectants
can be used to minimize loss of amino acids during hydrolysis.
Table8.3. Examples of compatibility of amino acid analysis with common buffers and additives
Substance Compatible Comments
Acetate Yes
HEPES Yes
Imidazole Yes High concentration with caution
Phosphate buffer (Yes) Not with low-concentration sample
Ammonium hydrogen carbonate (Yes) After freeze-drying
Ammonium acetate (Yes) After freeze-drying
Tris (Yes) Low Glu value
Glycine (Yes) With caution; not Gly
Ethylene glycol (Yes) < 5%
Glycerol (Yes) < 5%
Acetonitrile No
Guanidine hydrochloride No
Dioxane No
Source: Adapted from information kindly supplied by Dr. Anna Törnsten, Amino Acid Analysis Laboratory in the Department of Biochemistry, Uppsala University, Sweden. Valid for amino acid analysis based on IEX analysis after hydrolysis.
Forsampleswithproteinsounknownaminoacidcomposition, the amino acid content
in the sample for AAA can be used to calculate the protein concentration, while accepting apossible slight underestimation because not all amino acids from the protein are recovered, as
mentioned earlier. Calculate the mass (ma) in μg of each recovered amino acid by the formula:
ma=n × M
w,a/1000
where n is the amount of amino acid in nmol, and Mw,a
is the average molecular weight for the
amino acid corrected for loss of a water molecule during peptide formation. The sum of the
masses of the recovered amino acids gives the mass of protein in the sample and can be used
for calculation of the concentration in the sample analyzed.

8/22/2019 Purificação de Proteínas - Estratégias, handbook
http://slidepdf.com/reader/full/purificacao-de-proteinas-estrategias-handbook 96/167
94 28-9833-31 AA
Forsampleswithaproteinoknownaminoacidcomposition, the calculation of proteinconcentration from the amino acid amounts can be made on amino acids that are generallywell recovered in AAA. For each Ala, Asx (Asn+Asp), Gly, Glx (Gln+Glu), Leu, and Lys that are wellrecovered, calculate the protein mass (m
p) in μg according to the formula:
mp= n × M
w,p/(b × 1000)
where n is the amount of amino acid in nmol, Mw,p
is the average molecular weight of the protein,and b is the number of residues for the amino acid in the protein. Calculate the average protein
mass and the variation from the mean. Consider discarding data for amino acids that deviatemore than 5% from the mean. The selection of well-recovered amino acids can be modiedbased on experience with each target protein.
Concentrationdeterminationomembraneproteins
The BCA assay can be recommended for determining the concentration of membrane proteins.Other methods are often not compatible with detergents required to keep membrane proteinsin solution. Modications of the Bradford assay have been used. Absorbance at 280 nm canbe used for sufciently pure samples, but corrections for light scattering from detergentmicelles may be required. AAA (see above) can be used for quantitation of membrane proteins.
Calculation based on amino acids that are well-recovered in AAA is recommended formembrane proteins when possible.
ActivityDuring protein protocol development, it is very useful to have a method for assessment of protein activity. This can be the catalytic activity of an enzyme, ligand binding of a receptor, ortransport activity of a membrane transport protein. By measuring the activity of a sample withknown total protein concentration, a specic activity can be calculated. This is a good measureof purity. By performing such measurement on samples from different purication steps, thepurication factor can be calculated. The data are often used to prepare a purication table; seeChapter 5. Activity data can be used for identication of chromatography fractions containingthe target protein; see Figure 8.4. Some aspects of activity measurements are briey givenbelow. For further reading, refer to literature on the subject .
2.0
1.0
0.0
3.0
2.0
1.0
0.0
A280 A405
0 200 400 600 Volume (ml)
UV absorbance
conductivity
Fig8.4. The use of target protein activity data (A405
) for identication of what fractions are to be collected. Atool in the Unicorn software has been used to include the fraction-wise determined activity gures (A
405nm)
in the chromatogram.
Enzyme assays
Enzyme assays are usually unique to the enzyme in question and may be performed accordingto established literature procedures, but must sometimes be developed de novo. Assay protocolsare often provided together with commercial substrates. It is important to ascertain that nointerfering substances are present in the sample solution. It is sometimes necessary to performa buffer exchange of each sample before analysis to remove interfering substances and obtain
suitable conditions for the assay; see Chapter 3.

8/22/2019 Purificação de Proteínas - Estratégias, handbook
http://slidepdf.com/reader/full/purificacao-de-proteinas-estrategias-handbook 97/167
28-9833-31 AA 95
Suraceplasmonresonance(SPR)
The SPR technology from Biacore is a label-free technology for monitoring molecularinteractions as they happen. SPR can be used for assessing binding activity but is possiblymore common as a characterization method. The SPR phenomenon occurs when polarizedlight, under conditions of total internal reection, strikes an electrically conducting gold layerat the interface between media of different refractive index: the glass of a sensor surface (highrefractive index) and a buffer (low refractive index).
Concentration of active/native protein is determined by monitoring the interaction of a moleculewith a prepared sensor surface in the presence of a target molecule in solution (solution inhibition)or excess analyte (surface competition). Concentrations down to nanomolar range can be determined
for puried molecules or for molecules in complex mixtures such as serum or food samples.
PurityPurity can be dened as the sole presence of the target protein, that is, with no unwanted
substances from the starting material or contaminants that may have been accidentally added
during purication. Target protein homogeneity is dened later in this chapter.
SDS-PAGESDS-PAGE analysis is the dominant protein purication analysis tool, because of its simplicity andgeneric ability to separate and detect proteins. The method is an almost mandatory analyticalprocedure for protein purity control. It is used for monitoring the progress of a purication
procedure (Fig 8.5) and for the identication of fractions containing the target protein.
97 000
66 000
45 000
30 000
20 100
14 100
Mr
Fig8.5. Typical results from SDS-PAGE analysis of samples collected during purication.
SDS-PAGE is based on the molecular sieving of SDS-protein complexes in the sample, migratingthrough a polyacrylamide gel. Samples are prepared by heating the sample in the presence of
SDS to 95°C. Disulde bonds of proteins may or may not be reduced using a reducing agent,for example, dithioerythritol (DTE) or β-mercaptoethanol. Reduction of disulde bonds betweensubunits will allow their separation and thus give a pattern different from a nonreducedsample. For reduced samples, a single band in SDS-PAGE is indicative of a pure, single-subunitprotein. Analysis of a protein complex or an oligomeric protein will give one band for eachsubunit provided that the subunits have different sizes.
It is possible that a single band can correspond to more than one protein, that is, a singlesharp band in SDS-PAGE is not an absolute proof of complete purity. Further proof of purity isrequired, for example, amino acid composition, N-terminal sequence analysis, or MS.
Often both reduced and nonreduced samples are prepared for SDS-PAGE. This allows identicationof disulde bonds within the protein or between proteins. Disulde bonds betweenproteins may cause aggregation. When purifying proteins with more than one subunit, it isrecommended to also analyze size and size heterogeneity using GF. GF is performed under

8/22/2019 Purificação de Proteínas - Estratégias, handbook
http://slidepdf.com/reader/full/purificacao-de-proteinas-estrategias-handbook 98/167
96 28-9833-31 AA
native conditions, which means that intact proteins, protein complexes, or aggregates areseparated according to size. GF may reveal incomplete protein complexes, lacking one or moresubunits. Combining SDS-PAGE and GF can be powerful tools for quality control.
It may be useful to keep in mind that even though SDS-PAGE is a generic method that can beused for purity analysis, there are several potential problems that may occur:
• Too high an ionic strength destroys separation. Reduce by sample dilution or desalting.
• Proteins containing Asp-Pro peptide bonds (DP bonds) can be cleaved if at high temperaturefor too long or under mildly acidic conditions. The cleavage results in additional proteinbands. Note that samples for SDS-PAGE containing Tris buffer will be acidied when heated,due to the large decrease of pK
afor Tris when heated. This will further increase the risk of DP
bond cleavage. If DP bond cleavage is suspected, prepare sample without boiling, but with60 min incubation at room temperature.
• Proteases are not always denatured by SDS. Therefore, keeping a sample with SDS at roomtemperature for a long time before heating may cause protein cleavage. SDS-PAGE samplesshould be heated to 95°C for 5 min, or if denatured by milder procedures, should beanalyzed as soon as possible.
• Membrane proteins often migrate according to a lower apparent molecular weight becauseSDS-membrane protein complexes are more compact than SDS-complexes with water-soluble proteins.
• Some proteins, such as membrane proteins, may precipitate when heated to 95°C. Thiscan be avoided by prolonged incubation at, for example, 60°C for 60 min or at roomtemperature. For membrane proteins it is recommended to try both with and withoutheating before becoming familiar with the samples at hand.
• Keratin from human skin may contaminate samples or sample buffer to give an Mr60 000
band in reduced SDS-PAGE. The problem is usually evident only with sensitive stainingmethods, for example, silver staining. Because of size, keratin does not enter the gel if the
sample is not reduced.• Reoxidation of reduced proteins during SDS-PAGE analysis may give additional bands or
smears. Alkylation by the addition of acetamide after reduction will eliminate this problem.
Westernblotting
Western blotting analysis can be used for establishing the identity of the protein bands in anSDS-polyacrylamide gel and allows detection of fragments of the target protein. The methodcan be used for screening of suitable expression conditions (Fig 8.6) or checking whether extrabands in an SDS-polyacrylamide gel are products of protease action on the target protein.Normalization by including detection of a housekeeping protein can improve quantitation of
the target protein.
Cy5Cy5 Cy3Cy3
ECL Plex™ secondaryantibody CyDye™Conjugated
Primary antibodies
Targets on membrane
ECL Plex
Relative increase of His-GFP
t0 t1 t2 t3 t4
Ruv B(housekeepingprotein)
His-GFP(target protein)
A) B)
Fig8.6. Western blotting using uorescent secondary antibodies. Housekeeping protein can be used fornormalization when analyzing multiple samples during expression screening. (A) Principle of detection.(B) Evaluation of results.

8/22/2019 Purificação de Proteínas - Estratégias, handbook
http://slidepdf.com/reader/full/purificacao-de-proteinas-estrategias-handbook 99/167
28-9833-31 AA 97
Western blotting combines electrophoretic separation with detection using specic antibodies
for the analysis of the target proteins in a mixture. The sample, for example, cell culture lysate,
and tissue homogenate are separated by molecular weight or isoelectric point, using PAGE. The
proteins are transferred (blotted) from the gel to a membrane (nitrocellulose or PVDF) to allow
antibodies to easily reach the proteins.
For radiolabeling, chemiluminescent, and chemiuorescent methods, the signal is captured
using lm or an imaging system. The acquired image is quantitated using image analysis
software. The Enhanced Chemiluminescence (ECL) Western Blotting Detection Systems arecommercial chemiluminescent reagents for Western blotting. They are at least 10-fold more
sensitive than colorimetric assays. ECL, ECL Plus, and ECL Advance™ detection systems require
very little antibody to achieve sufcient sensitivity, so the amount of antibody (primary and
secondary) used in the protocols can be minimized.
The combination of Western blot detection and total protein staining of the SDS-polyacrylamide gel
(Coomassie or silver staining) gives a powerful control of purication results. Immunodetection of
the afnity tag offers a generic detection system when working with multiple target proteins that
have the same afnity tag.
IEFand2-DPAGE
Isoelectric focusing electrophoresis (IEF) is a common method for analysis of isoelectric
point (pI) of proteins, and is the most common rst step in two-dimensional polyacrylamide
electrophoresis (2-D PAGE); see Figure 8.7. IEF allows detection of charge heterogeneities in
addition to impurities. The IEF under native conditions is often limited by the low solubility of
most proteins at their pI, especially at the low ionic conditions that are required for IEF. Because
of this, IEF is usually performed in the presence of urea or thiourea and detergents.
2-D PAGE is usually performed with IEF in the rst dimension and SDS-PAGE in the second
dimension. In addition to traditional post-electrophoresis staining methods, which are the
same as used for 1-D PAGE, there are some new developments in 2-D PAGE: 2-D uorescencedifference gel electrophoresis (2-D DIGE; Fig 8.8) allows accurate comparison between samples.
A protein standard sample and the two samples to be compared are labeled with uorescent
dyes (CyDye DIGE Fluor minimal dyes: Cy™2, Cy3, or Cy5), mixed and analyzed together
in a single run. The labeling allows independent detection of each sample. Quantitation
can be performed by image analysis. 2-D PAGE and 2-D DIGE are extensively used for the
characterization of complex protein mixtures in proteomics applications. The methods can
also be used for analyses during the development of a purication protocol in order to facilitate
optimization and to increase the understanding of the purication process; see Fig 8.9. Host
cell protein impurities can be monitored throughout the expression and purication protocol
development. For a detailed example of this method, see Application note 28-9794-25 fromGE Healthcare.
1st dimension - IEF
2nd dimension - SDS-PAGE
Fig8.7. Example of 2-D PAGE.

8/22/2019 Purificação de Proteínas - Estratégias, handbook
http://slidepdf.com/reader/full/purificacao-de-proteinas-estrategias-handbook 100/167
98 28-9833-31 AA
Standard sampleLabel with Cy2
2-D PAGE
Analyze differences
Sample 1Label with Cy3
Image analysisData quantitation
Image analysisOverlay images
Sample 2Label with Cy5
Cy2 Cy3 Cy5
Mix
Image gel
Fig8.8. Principle of 2-D DIGE. Differently labeled samples are analyzed simultaneously in the sameelectrophoresis gel. DeCyder™ 2-D software allows quantitation of protein spots.
Harvest Flowthrough Eluate
IgGhc
IgGlc
A) B)
Fig8.9.2-D PAGE analysis of material from purication of a monoclonal antibody. Harvest, owthrough, and
eluate fractions from purication steps with MabSelect SuRe were analyzed. Spike proteins added to thesamples before CyDye labeling are used to normalize samples with different spot patterns. (A) Spot maps(2-D gel images) and detailed 3-D view around a selected spot are displayed in the DeCyder 2-D software.The spot patterns of harvest , owthrough, and eluate fractions (50 μg per fraction) are very different butcomplement each other. (B) Eluate fraction (5 μg) from the same sample was analyzed by 1-D SDS-PAGE stainedwith Coomassie for comparison. The heavy (IgG
hc) and light (IgG
lc) chains of the MAb are marked by arrows.
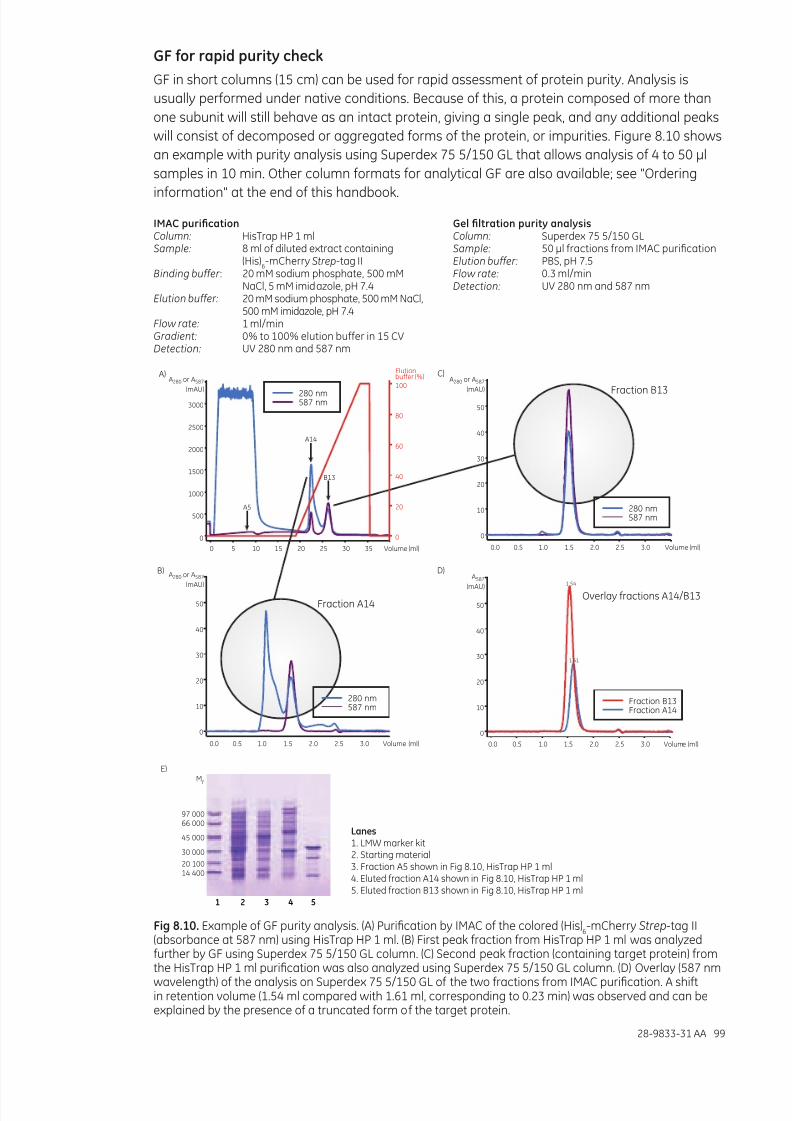
8/22/2019 Purificação de Proteínas - Estratégias, handbook
http://slidepdf.com/reader/full/purificacao-de-proteinas-estrategias-handbook 101/167
28-9833-31 AA 99
GForrapidpuritycheck
GF in short columns (15 cm) can be used for rapid assessment of protein purity. Analysis is
usually performed under native conditions. Because of this, a protein composed of more than
one subunit will still behave as an intact protein, giving a single peak, and any additional peaks
will consist of decomposed or aggregated forms of the protein, or impurities. Figure 8.10 shows
an example with purity analysis using Superdex 75 5/150 GL that allows analysis of 4 to 50 μl
samples in 10 min. Other column formats for analytical GF are also available; see "Ordering
information" at the end of this handbook.
IMACpurifcationColumn: HisTrap HP 1 mlSample: 8 ml of diluted extract containing
(His)6-mCherry Strep-tag II
Binding buffer : 20 mM sodium phosphate, 500 mMNaCl, 5 mM imidazole, pH 7.4
Elution buffer: 20 mM sodium phosphate, 500 mM NaCl,500 mM imidazole, pH 7.4
Flow rate: 1 ml/minGradient: 0% to 100% elution buffer in 15 CVDetection: UV 280 nm and 587 nm
GelfltrationpurityanalysisColumn: Superdex 75 5/150 GLSample: 50 μl fractions from IMAC puricationElution buffer: PBS, pH 7.5Flow rate: 0.3 ml/minDetection: UV 280 nm and 587 nm
0 5 10 15 20 25 30 35 Volume (ml)
3000
2500
2000
1500
1000
500
0
100
80
60
40
20
0
B13
A5
A14
0.0 0.5 1.0 1.5 2.0 2.5 3.0 Volume (ml)
50
40
30
20
10
0
50
40
30
20
10
0
0.0 0.5 1.0 1.5 2.0 2.5 3.0 Volume (ml)
50
40
30
20
10
0
0.0 0.5 1.0 1.5 2.0 2.5 3.0 Volume (ml)
A)
B)
E)
C)
D)
Fraction A14
Fraction B13A280 or A587
(mAU)
A280 or A587
(mAU)
A280 or A587
(mAU)A587
(mAU)
1.61
1.54
280 nm587 nm
280 nm587 nm
280 nm587 nm
Overlay fractions A14/B13
Fraction B13Fraction A14
Elutionbuffer (%)
Mr
97 00066 000
45 000
30 000
20 10014 400
1 2 3 4 5
Lanes
1. LMW marker kit2. Starting material3. Fraction A5 shown in Fig 8.10, HisTrap HP 1 ml4. Eluted fraction A14 shown in Fig 8.10, HisTrap HP 1 ml5. Eluted fraction B13 shown in Fig 8.10, HisTrap HP 1 ml
Fig8.10. Example of GF purity analysis. (A) Purication by IMAC of the colored (His)6-mCherry Strep-tag II
(absorbance at 587 nm) using HisTrap HP 1 ml. (B) First peak fraction from HisTrap HP 1 ml was analyzedfurther by GF using Superdex 75 5/150 GL column. (C) Second peak fraction (containing target protein) fromthe HisTrap HP 1 ml purication was also analyzed using Superdex 75 5/150 GL column. (D) Overlay (587 nmwavelength) of the analysis on Superdex 75 5/150 GL of the two fractions from IMAC purication. A shiftin retention volume (1.54 ml compared with 1.61 ml, corresponding to 0.23 min) was observed and can beexplained by the presence of a truncated form of the target protein.

8/22/2019 Purificação de Proteínas - Estratégias, handbook
http://slidepdf.com/reader/full/purificacao-de-proteinas-estrategias-handbook 102/167
100 28-9833-31 AA
MALDI-MSorpurityassessment
Matrix-Assisted Laser Desorption Ionization-Mass Spectrometry (MALDI-MS) can be used for
purity assessment and for protein identication. When compared with Electro Spray Ionization-
Mass Spectrometry (ESI-MS), the MALDI-MS ionization process is relatively tolerant to salts and
small amounts of certain detergents. However, sensitivity and the quality of the data obtained
are quite dependent on the purity of the sample. Best results are achieved if salts, buffers,
and detergents are kept to a minimum. Table 8.4 gives tolerance levels for different sample
contaminants. In general, any component present at a concentration above that of the matrix(~50 mM) may affect the ionization process. Type of matrix, spotting method, and combinatorial
contaminant effects may inuence the tolerance.
Table8.4. Compatibility of MALDI-MS with different substances
Contaminant Maximumconcentration
Sodium chloride 50 mM
Phosphate 10 mM
Tris base 50 mM
Urea 1 M
Guanidine hydrochloride 1 M
Azide 0.1%
Glycerol 1%
PEG 2000 0.1%
SDS 0.01%
Triton X-100, RTX-100, NP-40 0.1%
Tween 0.1%
CHAPS 0.01%n-Octyl-β-D-glucoside 1%
Zwittergent™ 0.1%
Lauryldimethylamine oxide (LDAO) 1%
Table adapted from Current Protocols in Protein Science, Unit 16.2, supplement 4 CPPS.
Specifcimpurities
Some impurities may have dramatic negative effects on the use of the puried protein and thus
need to be removed during purication; see Table 8.5 for some examples. A specic analysis
method for the impurity will be needed to monitor purication and to obtain nal proof of the
removal of this impurity.
Table8.5.Examples of purity requirements regarding specic impurities
Finalapplication Purityrequirement
Animal experiments Absence of endotoxin (= lipopolysaccharides, LPS); can cause fever in animals
Gene regulation studies Absence of DNA (DNA may interfere with studies)
Enzyme activity after mutations No endogenous, wild-type enzyme present

8/22/2019 Purificação de Proteínas - Estratégias, handbook
http://slidepdf.com/reader/full/purificacao-de-proteinas-estrategias-handbook 103/167
28-9833-31 AA 101
Size homogeneityThe size homogeneity of a puried protein can be important for the nal application. GF offers
size analysis under a broad range of conditions. Typically, GF is run under conditions that favor
native structure and activity of the protein, but denaturing conditions can also be used. GF
analysis under native conditions is an important complement to SDS-PAGE analysis. A number of
prepacked columns for GF analysis are available from GE Healthcare; see "Ordering information"
at the end of this handbook.
Analysisoproteinsassociatedvianoncovalentinteractions
Many proteins tend to associate in solution via noncovalent interactions. GF under native
conditions offers a method for analysis of the size heterogeneity of the protein, often without
disrupting these interactions. Preparations of monoclonal antibodies often contain dimers or
oligomers, or even aggregates. Figure 8.11 shows a typical GF analysis of a monoclonal antibody.
Column: Superdex 200 10/300 GLSample: Monoclonal antibodySample volume: 100 μlElution buffer: 20 mM Tris HCl, pH 7.5, 150 mM NaCl
Flow rate: 0.25 ml/min
0 5 10 15 20 25 30 Volume (ml)
150
100
50
0
A280 (mAU)
Dimer
Monomer
Fig8.11. Separation of the monomer from oligomers of a monoclonal antibody on Superdex 200 10/300 GL.
Analysisoproteinsassociatedviacovalentinteractions
GF analysis can be used to study disulde bonds between proteins or protein subunits.
Figure 8.12 shows a cysteine-containing protein that spontaneously forms dimers via a
disulde bridge. These dimers can be cleaved by adding the reducing agent DTE. GF analysis
using Superdex 75 10/300 GL shows baseline separation between a monomer and a dimer
(Fig 8.12A) and that it is possible to reduce the dimers into monomers by addition of DTE
(Figs 8.12B and 8.12C). Similar studies are often performed using SDS-PAGE, which will
also reveal disulde bonds for proteins that do not fall apart during reduction, thus giving
complementary information to a GF study.

8/22/2019 Purificação de Proteínas - Estratégias, handbook
http://slidepdf.com/reader/full/purificacao-de-proteinas-estrategias-handbook 104/167
102 28-9833-31 AA
LaneS. LMW-SDS Marker Kit (17-0446-01)1. Original dimer/monomer2. Dimer fraction from Fig 8.12A
3. Monomer fraction from Fig 8.12A4. Monomer peak from Fig 8.12B
Column: Superdex 75 10/300 GLSample: RecCys-protSample volume: 200 μlElution buffer: 50 mM Tris HCl, 1 mM EDTA, 150 mM NaCl, pH 7.5Flow rate: 0.5 ml/min
A280 (mAU)
A280 (mAU)
1500
1000
5000
Dimer
Monomer
250
200
150
100
50
0
Monomer
Mr 20 000
S 1 2 3 4
A)
B)
C)
Volume (ml)
Volume (ml)
Fig8.12.(A) Dimer-monomer separation of a recombinant cysteine-containing protein (recCys-protein) onSuperdex 75 10/300 GL. (B) Purication of the monomers after reduction with DTE. (C) A Coomassie stainedSDS-polyacrylamide gel (samples run under nonreducing conditions). The dimer content is high, which alsois reected in (A).
Rapidcheckotruncatedrecombinantprotein
Size heterogeneities can be caused by truncations of the polypeptide. Small truncations may
require MS or SDS-PAGE analysis to be revealed. If the truncation is large, it can be observed
using GF; see Figure 8.13. An afnity-puried recombinant protein with Mr around 17 000 oftencontained co-puried truncated protein with Mraround 10 000. A fraction of the puried protein
was analyzed on Superdex 75 5/150 GL.
Column: Superdex 75 5/150 GLSample: Puried recombinant proteinSample volume: 4 μlBuffer: PBS, pH 7.4Flow rate: 0.3 ml/min
00 2 4 6 8 10 Time (min)
600
500
400
300
200
100
0
A280 (mAU)
Intact protein
Truncated protein
Fig8.13.Rapid screening on Superdex 75 5/150 GL of a protein purication fraction containing truncated protein.

8/22/2019 Purificação de Proteínas - Estratégias, handbook
http://slidepdf.com/reader/full/purificacao-de-proteinas-estrategias-handbook 105/167
28-9833-31 AA 103
Other homogeneity issuesHomogeneity of the target protein in terms of charge, post-translational modication, chemical
modications, and so on, may be a requirement for the nal preparation of the protein. A
large number of chemical and physical analyses can be performed once the protein has been
obtained in a pure form. Some examples are given below.
AnalyticalIEXorphosphorylatedandglycosylatedproteins
One of the key factors for successful protein crystallography is homogeneity; small amountsof contaminants may be far better tolerated than different forms of the same protein. Such
variations may be caused by truncation, different isoforms, or post-translational modications
such as glycosylation, phosphorylation, and so on. If the variants differ in charge, it may be
possible to separate them using IEX. Mono S and Mono Q high-resolution IEX media can be
used for the separation of differentially phosphorylated protein kinase isoforms. To obtain
enough resolution for separation of different phosphorylated forms of protein kinase, sample
loading should be relatively low, and shallow gradients should be used. In the example
shown in Figure 8.14, phosphorylated and nonphosphorylated forms of ZAP-70 kinase were
separated. Two major peaks were eluted: a monophosphorylated kinase comprising 20% of the
total ZAP-70 and a nonphosphorylated protein, eluted slightly later. The presence of a singleextra charge on the protein surface made the phosphorylated kinase elute earlier than the
nonphosphorylated variant. Puried nonphosphorylated ZAP-70 could be crystallized in the
presence of the kinase inhibitor staurosporine. The stabilizing effect of staurosporine on another
receptor tyrosine kinase was analyzed using IEX on a Mono Q column; see Figure 8.15.
Column: Mono S HR 10/10*Sample: 42 ml ZAP-70 kinase mixtureStart buffer: 20 mM NaPO
4, 5 mM DTT,
10 mM NaCl, 1 mM MgCl2, pH 7.2
Elution buffer: Start buffer + 250 mM NaCl, pH 7.2
Flow rate: 2 ml/minGradient: 0-250 mM NaCl over 80 CV
* Replaced with Mono S 10/100 GL
100 200 300 400 500
Nonphosphorylated kinase
Monophosphorylated kinase
A280 (mAU)100
80
60
40
20
0Volume (ml)
Fig8.14.Separation of monophosphorylated and nonphosphorylated ZAP-70 kinase by CIEX with Mono S.

8/22/2019 Purificação de Proteínas - Estratégias, handbook
http://slidepdf.com/reader/full/purificacao-de-proteinas-estrategias-handbook 106/167
104 28-9833-31 AA
Column: Mono Q HR 5/5*Sample: 1.2 mg receptor tyrosine kinase in
5.4 ml start bufferStart buffer: 20 mM Tris-HCl, 5% v/v glycerol,
2 mM DTE, pH 8Elution buffer: Start buffer + 1 M NaClFlow rate: 0.8 ml/minGradient: Linear 2.5% to 40% elution buffer in 37.5 CV
* Replaced with Mono Q 5/50 GL
0
400
300
200
100
With inhibitor
15 20 25 30 35 Volume (ml) 15 20 25 30 35 Volume (ml)
0
A280 (mAU) A280 (mAU)
120
100
80
60
40
20
Without inhibitor
Fig8.15.Analysis of phosphorylation isoforms of a kinase. In the chromatogram with inhibitor (at right),the peaks correspond to 0x, 1x, 2x, and 3x phosphorylated forms (1x being the predominant form). In thisexperiment the kinase was preincubated with inhibitor at 10 μM. Acknowledgments: P. Ramage, B. Mathis, G.Fendrich, and R. Benoit , Novartis Institutes for Biomedical Research, Basel, Switzerland.
Analysisoglycoorms
One of the major bottlenecks during the purication and analysis of glycoproteins is that
the nal product is heterogeneous in the glycan moiety. AIEX is often used to measure the
concentration of carbohydrate-decient transferrin (desialylated or asialo transferrin) to
diagnose the chronic abuse of alcohol. In a healthy individual, tetra-sialo transferrin is the main
isoform. N-glycan chains of transferrin differ in the degree of branching with di-, tri-, and
tetra-antennary structures. Each antenna terminates with a negatively charged sialic acid.
The transferrin variants can be analyzed using a Mono Q column with pH-gradient elution. The
number of peaks observed corresponds to the number of different sialylated forms (Fig 8.16).
Column: Mono Q 5/50 GLStart buffer: 20 mM piperazine, pH 9.0Elution buffer: 20 mM piperazine, pH 4.8Flow rate: 1 ml/min
Gradient: Linear, 0% to 100% elution buffer in 25 CV
A280 (mAU)
Fig8.16. Separation of native apotransferrin (blue) and desialylated apotransferrin (red) by AIEX using a pHgradient from 9.0 to 4.8.

8/22/2019 Purificação de Proteínas - Estratégias, handbook
http://slidepdf.com/reader/full/purificacao-de-proteinas-estrategias-handbook 107/167
28-9833-31 AA 105
Protein-proteininteractionanalysisbyGF
The possibility of size analysis under a broad range of native (and denaturing) conditions makes
GF very suitable for protein-protein interaction analysis. A number of interactions can be studied:
• Formation of protein complexes
• Homo-oligomerization of a protein
• Antibody-antigen interactions
• Fab-fragment interaction with antigens
• Interaction of proteins with receptors
• Interaction of low-molecular-weight ligands with proteins (GF in desalting mode; see Chapter 3)
The principle of analysis is simple. The formation of a complex gives a new peak in the GF
chromatogram corresponding to the size of the complex, and the peaks corresponding to the
monomeric proteins are decreased or lost. Figure 8.17 shows the principle. As a model system,
the interaction of trypsin and soy trypsin inhibitor (STI) was analyzed by a set of GF runs. Trypsin
and STI were rst analyzed separately, and then a 1:1 mixture was analyzed. Only one peak was
eluted from the mixture of trypsin and STI with an elution volume shifted toward the void volume,indicating interaction between trypsin and STI.
Column: Superdex 200 5/150 GLSamples: Trypsin 1 mg/ml (purple)
Soy trypsin inhibitor 1 mg/ml (red)Trypsin 1 mg/ml and Soy trypsin inhibitor 1 mg/ml (blue)
Sample volume: 12.5 μlBuffer: PBS, pH 7.4Flow rate: 0.3 ml/min
0 2 4 1086 Time (min)
200
0
400
600
800
A280 (mAU)
ComplexTrypsin
Soy Trypsin Inhibitor
Fig8.17. Overlayed chromatograms from analysis of complex formation between trypsin and soy trypsin inhibitor.
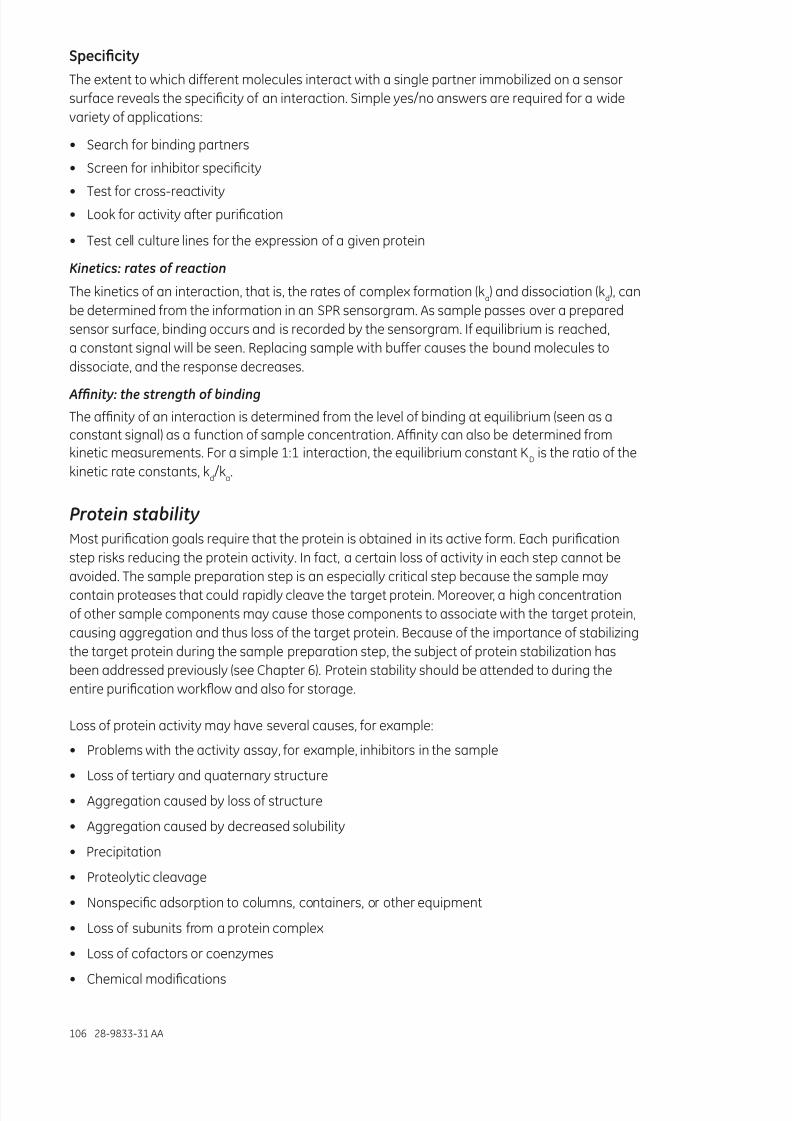
8/22/2019 Purificação de Proteínas - Estratégias, handbook
http://slidepdf.com/reader/full/purificacao-de-proteinas-estrategias-handbook 108/167
106 28-9833-31 AA
Specifcity
The extent to which different molecules interact with a single partner immobilized on a sensor
surface reveals the specicity of an interaction. Simple yes/no answers are required for a wide
variety of applications:
• Search for binding partners
• Screen for inhibitor specicity
• Test for cross-reactivity
• Look for activity after purication
• Test cell culture lines for the expression of a given protein
Kinetics: rates of reaction
The kinetics of an interaction, that is, the rates of complex formation (ka) and dissociation (k
d), can
be determined from the information in an SPR sensorgram. As sample passes over a prepared
sensor surface, binding occurs and is recorded by the sensorgram. If equilibrium is reached,
a constant signal will be seen. Replacing sample with buffer causes the bound molecules to
dissociate, and the response decreases.
Afnity: the strength of binding
The afnity of an interaction is determined from the level of binding at equilibrium (seen as aconstant signal) as a function of sample concentration. Afnity can also be determined fromkinetic measurements. For a simple 1:1 interaction, the equilibrium constant K
Dis the ratio of the
kinetic rate constants, kd/k
a.
Protein stabilityMost purication goals require that the protein is obtained in its active form. Each purication
step risks reducing the protein activity. In fact, a certain loss of activity in each step cannot beavoided. The sample preparation step is an especially critical step because the sample may
contain proteases that could rapidly cleave the target protein. Moreover, a high concentration
of other sample components may cause those components to associate with the target protein,
causing aggregation and thus loss of the target protein. Because of the importance of stabilizing
the target protein during the sample preparation step, the subject of protein stabilization has
been addressed previously (see Chapter 6). Protein stability should be attended to during the
entire purication workow and also for storage.
Loss of protein activity may have several causes, for example:
• Problems with the activity assay, for example, inhibitors in the sample• Loss of tertiary and quaternary structure
• Aggregation caused by loss of structure
• Aggregation caused by decreased solubility
• Precipitation
• Proteolytic cleavage
• Nonspecic adsorption to columns, containers, or other equipment
• Loss of subunits from a protein complex
• Loss of cofactors or coenzymes
• Chemical modications

8/22/2019 Purificação de Proteínas - Estratégias, handbook
http://slidepdf.com/reader/full/purificacao-de-proteinas-estrategias-handbook 109/167
28-9833-31 AA 107
These causes may be due to:
• The presence of harmful impurities, for example, proteases
• Changes in solution conditions during purication
• Desalting or buffer exchange
• Protein concentration
• Protein dilution
• Changes of physical condition, for example, freezing and thawing or increased temperature
Different analytical methods can be used for monitoring protein activity. As mentioned earlier,
it is often useful to perform a thorough study of the target protein stability window. This can
be accomplished stepwise by: 1) changing the conditions of small aliquots of the target protein
by buffer exchange (see Chapter 3), changing temperature, or exposing the protein to the
treatment of interest; 2) incubating (possibly at elevated temperature for accelerated study);
and 3) analyzing the activity.
Other analytical methods mentioned in this chapter should be considered as well. SDS-PAGE,
Western blotting, and MS can be used to detect proteolytic cleavage or other changes in size
or composition. GF is a powerful method for size characterization under native conditions,and can therefore be used for analysis of amount of oligomers or aggregates in a protein
preparation, or presence of subunits in protein complexes. UV/visible spectroscopy should
not be underestimated as a method for detecting loss of cofactor or coenzymes. Differential
scanning calorimetry (see below) is a powerful method for protein stability studies.
Dierentialscanningcalorimetry
Differential Scanning Calorimetry (DSC) is used to study the stability of biological systems
involving peptides, proteins, lipids, and nucleic acids. It can, for example, be used to screen
conditions for optimum protein stability during protein purication or storage. DSC has the
advantage that it does not require any incubation before analysis, which may save a signicantamount of time when optimizing storage stability.
A biomolecule in aqueous solution is in equilibrium between the native (folded) conformation
and its denatured (unfolded) conformation. For a protein to unfold, stabilizing forces need to
be broken. During the experiment, the temperature is gradually increased while measuring
the amount of energy required for the temperature increase; see Figure 8.18. At a high enough
temperature. the protein is denatured. The transition midpoint, Tm
, is the temperature where
50% of the protein is in its native conformation and the other 50% is denatured. The higher the
Tm
, the more stable the molecule.
280300 320 340
280300 320 340
H e a t c a p a c i t y
H e a t c a p a c i t y
Temperature (K) Temperature (K)
Fig8.18.DSC data for the denaturation of 0.25 mg/ml of barnase obtained using the MicroCal™ VP-DSCinstrument. The instrumental baseline recorded with buffer is indicated in blue. The panel at right shows thedata after “buffer” subtraction and illustrates the process of baseline generation prior to integration of the peak.

8/22/2019 Purificação de Proteínas - Estratégias, handbook
http://slidepdf.com/reader/full/purificacao-de-proteinas-estrategias-handbook 110/167
108 28-9833-31 AA
A stability study is performed by transferring aliquots of the protein into different conditions
to be tested. DSC measurements are made to determine Tm
for the different conditions. The
conditions that give the highest Tm
give the best protein stability. Figure 8.19 shows an example
of optimization of pH for an antibody. GF was used to assess the amount of aggregates formed
after different storage times. DSC measurements were made at time = 0 only. GF shows that
2 weeks of storage gave a signicant amount of aggregates at pH values below 5; essentially
no aggregates were formed above pH 5. DSC analysis gave additional information regarding
the stability above pH 5, showing that optimal stability was obtained at pH 5.7. Figure 8.20shows the difference between the DSC diagram for a protein under conditions that stabilized or
destabilized the protein from aggregation. Note the decrease in Tm
and characteristic transition
region for the destabilized sample.
20
40
60
80
100
3.5 4.0 4.5 5.0 5.5 6.5 7.06.0
pH
723.5 4.0 4.5 5.0 5.5 6.5 7.06.0
pH
73
74
75
76
77
78
T m ( º
C )
A m o u n t a g g r e g a t e
s b y G F ( % )
4 weeks stability at 40ºC
2 weeks stability at 40ºC
time = 0
A) B)
Fig8.19.The impact of pH on the stability of an antibody determined by combining GF and DSC. (A) Amountof aggregates vs pH, as measured by GF after different times of incubation. (B) T
mvs pH.
295 315 335 355
H e a t c a p a c i t y
Temperature (K)
Fig8.20.Raw DSC data for the denaturation of an aggregating protein (red). Data for the buffer baseline(blue) and the same protein (black) under different conditions where aggregation is almost completelyeliminated are shown for comparison.

8/22/2019 Purificação de Proteínas - Estratégias, handbook
http://slidepdf.com/reader/full/purificacao-de-proteinas-estrategias-handbook 111/167
28-9833-31 AA 109
Chapter 9Purication examples
The vast majority of proteins puried in laboratory scale are afnity-tagged and can therefore
be puried with relative ease using AC. In most cases, this capture step is followed by a polishing
step to obtain high purity. GF is generally the most powerful method for polishing because it
allows removal of impurities as well as size heterogeneities of the target protein, allows the use
of essentially any buffer conditions, and can usually be accomplished without optimization.
Untagged proteins obtained by overexpression or from a natural source often require several
purication steps. Here, the CIPP strategy (the three-phase strategy) becomes useful. It supports
selection and optimization of the methods for the different purication steps and suggests how
to combine them into a complete protocol; see Chapter 4.
This chapter demonstrates purications from simple single-step protocols to a multi-step
protocol for an untagged protein. The applications were developed using ÄKTA design
chromatography systems.
One-step purication of a GST-tagged protein and on-column tag removal
The Glutathione S-transferase (GST) tag allows AC purication on Glutathione Sepharose
columns. The high selectivity of the interaction allows very high purity in a single step. The GST
tag often increases the solubility of the target protein, but because it is large (Mr26 000), it is
often removed after purication, using a sequence-specic protease, for example, PreScission™
Protease. Tag removal can be performed in batch after purication or by on-column cleavage
during purication with automatic removal of the cleaved-off tag from the target protein.
The high purity that is most often obtained was demonstrated by purication on GSTrap FF 1 ml
with on-column tag removal using thrombin, as shown in the chromatograms in Figure 9.1.
After equilibration, sample application, and washing, the column was lled by syringe with 1 ml
of thrombin solution (20 U/ml in PBS), which was prepared according to the manufacturer’s
protocol. The column was sealed with the supplied connectors and incubated for 16 h at room
temperature. After incubation, the target protein but not the GST tag was washed out using PBS,
and after that the bound GST (tag) was eluted with elution buffer. The cleavage reaction yield
was 100% as judged from the SDS-PAGE analysis (lane 5), as no non-cleaved GST-tagged protein
can be detected in the bound material eluted from the column (lane 6). The amount of the site-
specic protease required and the time for the cleavage reaction depend on the properties andthe amount of the specic GST-tagged protein. For best results, this should be checked for each
individual cleavage. Purity after ve-fold scale-up on GSTrap FF 5 ml without tag removal is
demonstrated in lane 4 of the gel.

8/22/2019 Purificação de Proteínas - Estratégias, handbook
http://slidepdf.com/reader/full/purificacao-de-proteinas-estrategias-handbook 112/167
110 28-9833-31 AA
Column: GSTrap FF 1 mlSample: Cytoplasmic extract from E. coli
expressing GST-tagged proteinSample volume : 10 mlBinding buffer: PBS, pH 7.3Elution buffer: 50 mM Tris-HCl, pH 8.0, with 10 mM
reduced glutathioneFlow rate: 1 ml/minProcedure: 4 CV binding buffer, 10 ml sample,
10 CV binding buffer, and lling the
column with 1 ml thrombin solutionusing a syringe. Incubation 16 h atroom temperature
Procedure: 8 CV binding buffer (elution of cleavedtarget protein)
5 CV elution buffer (elution of free GST andnon-cleaved GST-tagged proteins)5 CV binding buffer
Mr
97 000
66 000
45 000
30 000
20 100
14 400
1 2 3 4 5 6 7 8
Lanes
1. LMW markers, reduced (LMW-SDS Marker Kit)2. Cytoplasmic extract of E. coli expressing GST-tagged protein,
1 g cell paste/10 ml3. GST-tagged protein eluted from GSTrap FF 1 ml
(not shown)
4. GST-tagged protein eluted from GSTrap FF 5 ml (notchromatogramchromatogram shown)
5. GST-free target protein eluted from GSTrap FF 1 ml after16 h thrombin cleavage
6. Free GST eluted from GSTrap FF 1 ml after thrombin cleavage7. Thrombin solution (20 U/ml)8. LMW markers, reduced (LMW-SDS Marker Kit)
0
0.5
1.0
1.5
2.0
2.5
3.0
3.5
A280
5 10 15 Volume (ml)
WashThrombinapplication andincubation16 hat room temp.
A)
C)
B)
0
0.5
1.0
1.5
2.0
2.5
3.0
3.5
A280
TargetproteinwithoutGST tag
FreeGST
2 4 6 8 10 12 Volume (ml)
0
20
40
60
80
100
%Elutionbuffer
Fig9.1. Purication and on-column tag removal of a GST-tagged protein using GSTrap FF columns. (A)Sample application, washing, and start of thrombin incubation. (B) Elution of cleaved target protein (withoutthe GST tag) and free GST. (C) SDS-PAGE with silver staining.
Two-step purication of an MBP-tagged proteinTwo-step purication by combining AC for capture and GF for polishing is probably the most
useful way of achieving high-purity tagged proteins. Most purications can be performed with
no or a minimum of optimization, by simply following the instructions for the different products.
This example shows a simplied purication of a protein involved in a metabolic disease,
medium-chain acyl-CoA dehydrogenase (MCAD). This homotetramer was puried for stability,folding, and kinetic studies. The protein was tagged with maltose binding protein (MBP).
Purication on MBPTrap HP 5 ml (Fig 9.2) eliminated a concentration step used in an earlier
purication procedure that required concentration prior to the nal GF step. The highly
concentrated target protein was eluted from the MBPTrap HP column in a small volume (Fig 9.2A)
and loaded on a HiLoad 16/60 Superdex 200 pg column. Consequently, the earlier concentration
step prior to nal GF could be avoided and signicant time saved.
The purity of the eluted fractions from MBPTrap HP and GF was determined by SDS-PAGE
analysis. Some impurities were detected after the afnity step (Lanes 4-6). This may be due to
the presence of truncated variants having intact N-terminal MBP tag or possibly E. coli proteins
associated with the target protein, but was not further investigated. Note that the sample loadin the SDS-PAGE analysis was large and therefore could reveal this rather small amount of
impurities. GF efciently removed all impurities detectable in the Coomassie stained gel. The nal
yield was approximately 8.4 mg.
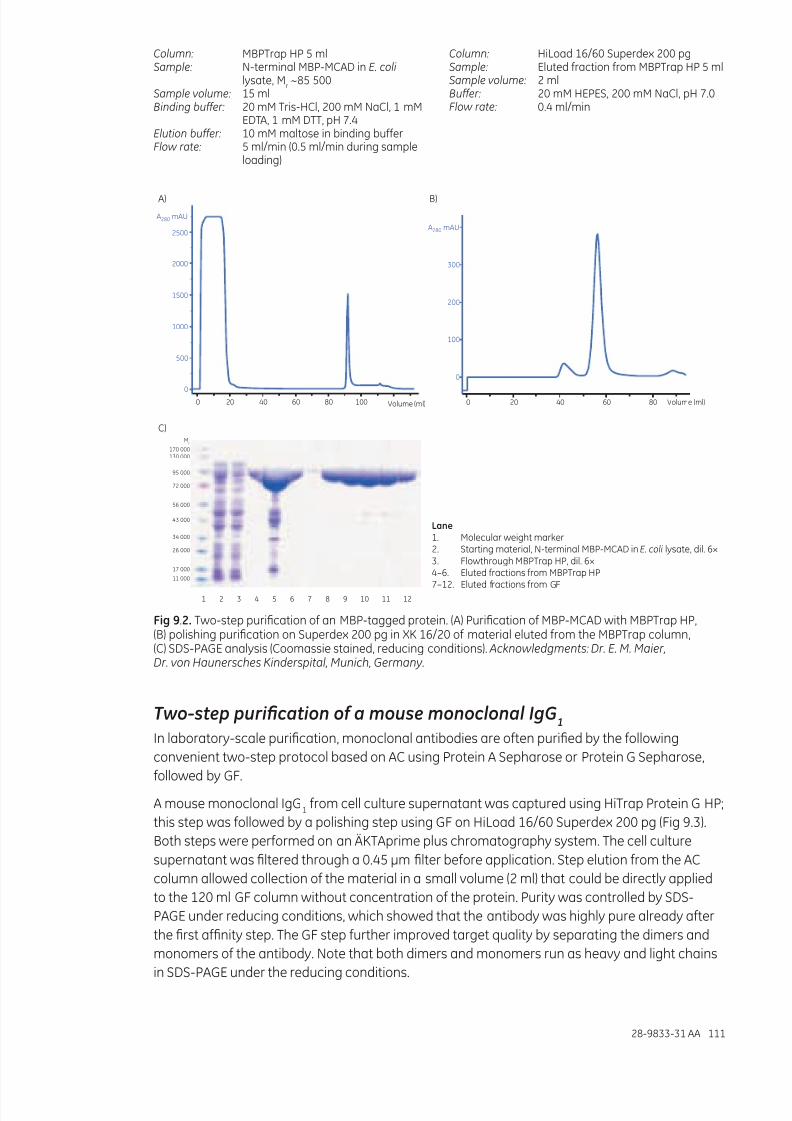
8/22/2019 Purificação de Proteínas - Estratégias, handbook
http://slidepdf.com/reader/full/purificacao-de-proteinas-estrategias-handbook 113/167
28-9833-31 AA 111
Column: MBPTrap HP 5 mlSample: N-terminal MBP-MCAD in E. coli
lysate, Mr~85 500
Sample volume: 15 mlBinding buffer: 20 mM Tris-HCl, 200 mM NaCl, 1 mM
EDTA, 1 mM DTT, pH 7.4Elution buffer: 10 mM maltose in binding bufferFlow rate: 5 ml/min (0.5 ml/min during sample
loading)
Column: HiLoad 16/60 Superdex 200 pgSample: Eluted fraction from MBPTrap HP 5 mlSample volume: 2 mlBuffer: 20 mM HEPES, 200 mM NaCl, pH 7.0Flow rate: 0.4 ml/min
0
500
1000
1500
2000
2500
A280 mAU
A280 mAU
0 20 40 60 80 100 Volume (ml)
0
100
200
300
0 20 40 60 80 Volume (ml)
1 2 3 4 6 8 975 10 11 12
Mr
170 000130 000
95 000
72 000
56 000
43 000
34 000
26 000
17 000
11 000
A)
C)
B)
Lane
1. Molecular weight marker2. Starting material, N-terminal MBP-MCAD in E. coli lysate, dil. 6×
3. Flowthrough MBPTrap HP, dil. 6×4–6. Eluted fractions from MBPTrap HP7–12. Eluted fractions from GF
Fig9.2.Two-step purication of an MBP-tagged protein. (A) Purication of MBP-MCAD with MBPTrap HP,(B) polishing purication on Superdex 200 pg in XK 16/20 of material eluted from the MBPTrap column,(C) SDS-PAGE analysis (Coomassie stained, reducing conditions). Acknowledgments: Dr. E. M. Maier,Dr. von Haunersches Kinderspital, Munich, Germany.
Two-step purication of a mouse monoclonal IgG1
In laboratory-scale purication, monoclonal antibodies are often puried by the following
convenient two-step protocol based on AC using Protein A Sepharose or Protein G Sepharose,followed by GF.
A mouse monoclonal IgG1
from cell culture supernatant was captured using HiTrap Protein G HP;
this step was followed by a polishing step using GF on HiLoad 16/60 Superdex 200 pg (Fig 9.3).
Both steps were performed on an ÄKTAprime plus chromatography system. The cell culture
supernatant was ltered through a 0.45 μm lter before application. Step elution from the AC
column allowed collection of the material in a small volume (2 ml) that could be directly applied
to the 120 ml GF column without concentration of the protein. Purity was controlled by SDS-
PAGE under reducing conditions, which showed that the antibody was highly pure already after
the rst afnity step. The GF step further improved target quality by separating the dimers andmonomers of the antibody. Note that both dimers and monomers run as heavy and light chains
in SDS-PAGE under the reducing conditions.

8/22/2019 Purificação de Proteínas - Estratégias, handbook
http://slidepdf.com/reader/full/purificacao-de-proteinas-estrategias-handbook 114/167
112 28-9833-31 AA
Volume (ml)20 25 30 35
0
200
400
600
800
1000
0
4.0
5.0
6.0
7.0
8.0
%B pH
0 1 0 15 40.0
A280
(mAU)A280
(mAU)
25.0
20.0
15.0
10.0
5.0
0.0
0.0 0.2 0.4 0.6 0.8 1.0 1.2 CV
A280
(mAU)
1.2
1.0
0.8
0.6
0.4
0.44 0.48 0.52 0.56 cv
Dimer/aggregates
Monomers
Mr
97 000
66 000
45 000
30 000
20 10014 400
31 2 54
A) B)
C)
Lane
1. Monoclonal mouse IgG1 (cell culture supernatant)2. Flowthrough (capture step)3. Eluted fractions (capture step)4. Eluted fractions (polishing step)5. Low-molecular-weight markers
Fig9.3.Two-step purication of a mouse IgG1. (A) Capture of mouse monoclonal IgG
1using HiTrap Protein G
HP. The curves shown are absorbance (blue), pH (green), and conductivity (red). (B) Polishing by GF. (C) Purityanalysis by SDS-PAGE, reducing conditions.
Three-step purication of a protein without an afnity tagThis example demonstrates one of the most common purication strategies for untagged proteins:
IEX for capture, HIC for intermediate purication, and GF for the polishing step. The objective
of this purication was to obtain highly puried Deacetoxycephalosporin C synthase (DAOCS),
an oxygen-sensitive enzyme for crystallization and structure determination. A more detailed
description of this work can be found in GE Healthcare Application Note 18-1128-91.
Samplepreparation
Cells were suspended in lysis buffer (50 mM Tris-HCl, 1 mM EDTA, 2 mM DTT, 0.2 M benzamidine-
HCl, 0.2 mM PMSF, pH 7.5), and lysed using ultrasonication. Streptomycin sulfate (1%) and
polyethyleneimine (0.1%) were added to precipitate DNA, and the extract was claried bycentrifugation. The sample was kept on ice at all times to avoid proteolysis and denaturation.
Capture
The isoelectric point was calculated to be 4.8, which led to the selection of AIEX for the capture
step. HiTrap IEX Selection Kit was used to screen for optimal chromatography media for optimal
purity. Q Sepharose XL, well suited for capture, was chosen. Optimization of the capture step
allowed the use of a step elution at high ow rate to speed up the purication (Fig 9.4). This was
particularly advantageous when working with this potentially unstable protein.
Column: HiTrap Protein G HP 1 mlSample: Cell culture supernatant containing
mouse monoclonal IgG1
Sample volume: 10 mlBinding buffer: 20 mM potassium phosphate, pH 7.0Elution buffer (B): 100 mM glycine-HCl, pH 2.7Flow rate: 1 ml/min
Column: HiLoad 16/60 Superdex 200 pgSample: Pooled fractions from the capture stepSample volume: 2 mlBuffer: Phosphate buffered saline (PBS), pH 7.4Flow rate: 1 ml/min

8/22/2019 Purificação de Proteínas - Estratégias, handbook
http://slidepdf.com/reader/full/purificacao-de-proteinas-estrategias-handbook 115/167
28-9833-31 AA 113
Column: HiPrep Q XL 16/10Sample: Claried E. coli extractSample volume: 40 mlBinding buffer: 50 mM Tris-HCl, 1 mM EDTA, pH 7.5; 2 mM DTT, 0.2 M benzamidine-HCl, 0.2 mM PMSFElution buffer: Binding buffer + 1.0 M NaClFlow rate: 10 ml/min (300 cm/h)
0 100 200 300
100
200
300
400
0 0
20
40
60
80
A280
(mAU) A280
(mAU)A280
(mAU)
Volume (ml)
mS/cm
0
1000
2000
3000
0 100 200
0
20
40
60
80
mS/cm
Volume (ml) 0 50 100 150 2000 0
20
40
60
80
1000
2000
3000
mS/cm
Volume (ml)
Fig9.4. Capture using IEX and optimization of purication conditions. The elution position of DAOCS (shaded)was determined by identifying fractions that showed a protein band in SDS-PAGE with the expected apparent M
r.
Intermediatepurifcation
HIC was selected for the intermediate purication step because the method is complementary toIEX and compatible with high-salt samples eluted from IEX columns, thus requiring minimal
sample conditioning. Hydrophobic properties are difcult to predict, and it is always recommended
to screen different media. The RESOURCE HIC Test Kit was used for screening chromatography
media, and SOURCE 15ISO was selected on the basis of the resolution achieved. In this
intermediate step, shown in Figure 9.5, the maximum possible speed for separation was
sacriced in order to achieve higher resolution and to allow signicant reduction of impurities.
Column: SOURCE 15ISO, packed in HR column 16/10Sample: DAOCS pool from HiPrep Q XL 16/10Sample volume: 40 ml
Binding buffer: 1.6 M ammonium sulfate, 10% glycerol, 50 mM Tris-HCl, 1 mM EDTA, 2 mM DTT, 0.2 mMbenzamidine-HCl, 0.2 mM PMSF, pH 7.5Elution buffer (B): 50 mM Tris-HCl, 10% glycerol, 1 mM EDTA, 2 mM DTT, 0.2 mM benzamidine-HCl, 0.2 mM PMSF, pH 7.5Flow rate: 5 ml/min (150 cm/h)Gradient: 0–16% in 4 CV, 16–24% B in 8 CV, 24–35% B in 4 CV, 100% B in 4 CV
0 100 200
0
100
200
300
400
Volume (ml)
A
(mAU)
280
Fig9.5.Intermediate purication using HIC.
Polishing
The main goal of the polishing step was to remove aggregates and minor contaminants and to
transfer the puried sample into a buffer suitable for use in further structural studies.
Superdex 75 prep grade was selected because the molecular weight of DAOCS (Mr34 500) is
within the optimal separation range for this chromatography medium (Fig 9.6).

8/22/2019 Purificação de Proteínas - Estratégias, handbook
http://slidepdf.com/reader/full/purificacao-de-proteinas-estrategias-handbook 116/167
114 28-9833-31 AA
Column: HiLoad 16/60 Superdex 75 pgSample: Concentrated DAOCS pool from SOURCE 15ISOSample volume: 3 mlBuffer: 100 mM Tris-HCl, 1 mM EDTA, 2 mM DTT, 0.2 mM benzamidine-HCl, 0.2 mM PMSF, pH 7.5Flow rate: 1 ml/min (30 cm/h)
0 20 40 60 80 100
0
200
400
600
800
1000
Volume (ml)
A
(mAU)280
Fig9.6.Polishing using GF.
The purity of the target protein after each of the three purication steps was analyzed by SDS-PAGE;
see Figure 9.7. The purity increased with each purication step, and the nal purity (Lane 5) was
very high. The prepared protein was used successfully in X-ray diffraction studies.
1 2 3 4 5 6
Mr
97 000
66 000
45 000
30 000
20 100
14 100
Lane1, 6. LMW Marker Kit2. Cell homogenate3. DAOCS pool from Q Sepharose XL4. DAOCS pool from SOURCE 15ISO5. DAOCS pool from Superdex 75 pg
Fig9.7.Purity analysis of the target protein by SDS-PAGE with silver staining. Separation was performedusing ExcelGel SDS Gradient 8-18.
Unattended multistep purication and tag removalUnattended multistep purication using ÄKTAxpress is based on the principle that the
overexpressed afnity-tagged protein will be the dominant protein after the rst afnity
purication step. The largest peak, containing the target protein, is automatically collected and
reloaded on the next column for the subsequent purication step, and so on with up to four
purication steps. An ÄKTAxpress module can process up to four samples in each cycle, and up
to twelve modules can be connected and handled in parallel using one computer.
A histidine-tagged protein was puried in four steps by the combination of IMAC-Desalting (DS)-
IEX-GF using ÄKTAxpress (Fig 9.8). On-column tag cleavage using a histidine-tagged TEV proteasewas included in the IMAC step. Because of the histidine tag on the protease, it bound to the
column together with uncleaved target protein and the cleaved-off histidine tag. The puried
protein was analyzed by SDS-PAGE (Fig 9.9).

8/22/2019 Purificação de Proteínas - Estratégias, handbook
http://slidepdf.com/reader/full/purificacao-de-proteinas-estrategias-handbook 117/167
28-9833-31 AA 115
Sample: APC234, Mr32 500 (Cleaved product: M
r30 100)
Columns: HisTrap HP, 5 ml; HiPrep 26/10 Desalting; RESOURCE Q, 6 ml; HiLoad 16/60 Superdex 75 pgCleavage conditions: 200 units of AcTEV™ Protease (Invitrogen)/mg protein, 8 h incubation time at room
temperature
BuersIMAC binding buffer: 50 mM Tris-HCl, 500 mM NaCl, 20 mM imidazole, pH 7.5IMAC cleavage buffer: 50 mM Tris-HCl, 500 mM NaCl, 50 mM imidazole, pH 7.5IMAC elution buffer: 50 mM Tris-HCl, 500 mM NaCl, 500 mM imidazole, pH 7.5DS and IEX binding buffer: 50 mM Tris-HCl, pH 8.0IEX elution buffer: 50 mM Tris-HCl, 1 M NaCl, pH 8.0GF buffer: 50 mM Tris-HCl, 150 mM NaCl, pH 7.5
0
500
1000
1500
2000
0 100 200 300 400 Volume (ml)
16 mg
Cleaved protein
FGIMAC DS IEX
Regeneration
A(mAU)
280
Fig9.8.Unattended multistep purication of a histidine-tagged protein on ÄKTAxpress chromatography system.
1 2 3 4 5
97 000
66 000
45 000
30 000
20 100
14 400
Mr
Lane1. Low Molecular Weight marker2. Starting sample3. Flowthrough4. Puried cleaved APC2345. Reference: uncleaved APC234
Fig9.9.SDS-PAGE analysis.

8/22/2019 Purificação de Proteínas - Estratégias, handbook
http://slidepdf.com/reader/full/purificacao-de-proteinas-estrategias-handbook 118/167
116 28-9833-31 AA
MicropuricationMany proteins are present at extremely low amounts in their natural environment and
frequently must be puried from small amounts of tissue from various model organisms. Such
micropurication requires the use of small, high-resolution columns and a chromatography
system that can take full advantage of such columns.
PEP-19 (Purkinje cell protein 4; PCP 4) is a brain protein with Mr6800 that belongs to a family of
proteins involved in calmodulin-dependent signal transduction. PEP-19 has been shown to beexpressed in decreased amounts in an animal model of Parkinson’s disease. In order to allow
further characterization of the protein, biologically active PEP-19 was puried from mouse brain.
Mouse brain tissue was homogenized in 200 μl of 20 mM Tris-HCl, pH 8.0 supplemented with 2 μl
of Nuclease Mix and 2 μl of Protease Inhibitor Mix using a combination of Sample Grinding Kit
and sonication. The sample was claried by centrifugation (14 000 rpm, 4°C, 30 min).
The micropurication was performed using ÄKTAmicro system with the fraction collector Frac-950
and the Microfraction Collection Kit (Fig 9.10). The rst purication step was performed by AIEX
using Mono Q PC 1.6/5. The sample, 150 μl of claried supernatant, was diluted with 350 μl of
distilled water before loading on the column. The eluate was collected in 96-well microplatesin 100 μl fractions. Optimization work showed that the best separation was obtained using a
shallow linear gradient from 0 to 150 mM NaCl in 40 CV, and a low ow rate of 0.1 ml/min. Each
fraction from the Mono Q run was analyzed by tandem MS, which revealed the position of PEP-19
in the chromatogram.
The second and nal purication step consisted of GF on a Superdex Peptide PC 3.2/30 column.
The PEP-19-fraction was concentrated to 10 μl and loaded on the GF column. A peak was
obtained at a retention volume of 1.05 ml as detected by absorbance at 215 nm. There was no
absorbance at 280 nm at the same elution position, which agrees with the fact that PEP-19 does
not have aromatic amino acid residues. Fractions of 40 μl were collected and analyzed by MS.
Fractions were reduced and digested by trypsin before MS analyses. Separation was performed on
nanoRPC using Ettan™ MDLC coupled to a Finnigan™ LTQ™ linear ion trap mass spectrometer
(Thermo Electron Corp.). Samples were rst loaded on a ZORBAX™ 300SB-C18 trap column
(300 μm i.d. × 5 mm, Agilent Technologies) for sample concentration and buffer conditioning.
Separation was performed on a ZORBAX 300SB-C18 RPC column, 75 μm i.d. × 150 mm, using a
90 min gradient of A: 0.1% formic acid and B: 84% acetonitrile and 0.1% formic acid. Five different
tryptic peptides from PEP-19 were obtained with coverage of 77% of the protein sequence.
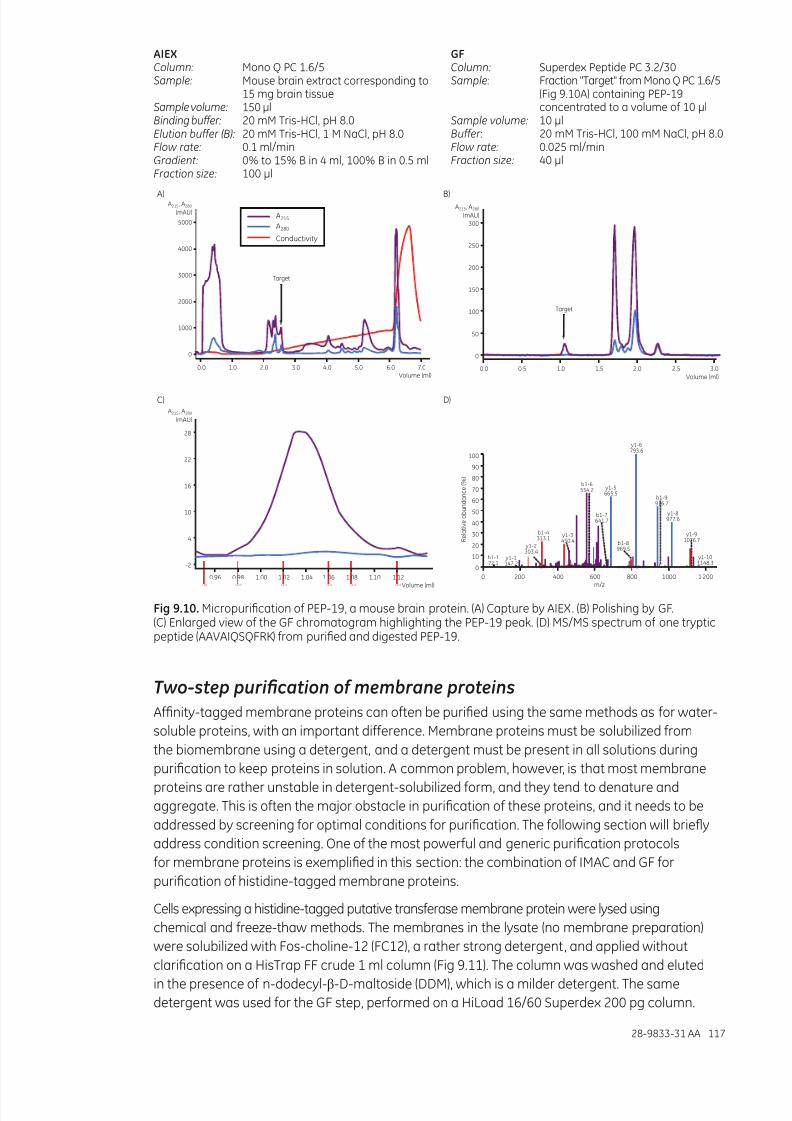
8/22/2019 Purificação de Proteínas - Estratégias, handbook
http://slidepdf.com/reader/full/purificacao-de-proteinas-estrategias-handbook 119/167
28-9833-31 AA 117
AIEXColumn: Mono Q PC 1.6/5Sample: Mouse brain extract corresponding to
15 mg brain tissueSample volume: 150 μlBinding buffer: 20 mM Tris-HCl, pH 8.0Elution buffer (B): 20 mM Tris-HCl, 1 M NaCl, pH 8.0Flow rate: 0.1 ml/minGradient: 0% to 15% B in 4 ml, 100% B in 0.5 mlFraction size: 100 μl
GFColumn: Superdex Peptide PC 3.2/30Sample: Fraction "Target" from Mono Q PC 1.6/5
(Fig 9.10A) containing PEP-19concentrated to a volume of 10 μl
Sample volume: 10 μlBuffer : 20 mM Tris-HCl, 100 mM NaCl, pH 8.0Flow rate: 0.025 ml/minFraction size: 40 μl
300
250
200
150
100
50
0
0.0 1.00.5 1.5 2.0 2.5 3.0
5000
4000
3000
2000
1000
0
A215, A280
(mAU)A215, A280
(mAU)
0.0 2.01.0 3.0 4.0 5.0 6.0 7.0
A215
A280
Conductivity
Volume (ml)Volume (ml)
1 A9 1A11 1A11 1A12 1A131A10
A215, A280
(mAU)
0.96 1.00 1.02 1.04 1 .06 1.08 1.10 1.120.98Volume (ml)
28
22
16
10
4
-2
b1-1
72.1
y1-2303.4
y1-1
147.2
b1-4313.1
y1-3450.4
b1-6554.2 y1-5
665.5
b1-8969.5
y1-6793.6
b1-9916.7
y1-8977.6
y1-91076.7
y1-10
1148.3
b1-7641.7
100
90
80
70
60
50
40
30
20
10
0
0 400200 600 800 1000 1 200m/z
R e l a t i v e a b u n d a n c e ( % )
A) B)
C) D)
Target
Target
Fig9.10.Micropurication of PEP-19, a mouse brain protein. (A) Capture by AIEX. (B) Polishing by GF.(C) Enlarged view of the GF chromatogram highlighting the PEP-19 peak. (D) MS/MS spectrum of one trypticpeptide (AAVAIQSQFRK) from puried and digested PEP-19.
Two-step purication of membrane proteinsAfnity-tagged membrane proteins can often be puried using the same methods as for water-
soluble proteins, with an important difference. Membrane proteins must be solubilized from
the biomembrane using a detergent, and a detergent must be present in all solutions duringpurication to keep proteins in solution. A common problem, however, is that most membrane
proteins are rather unstable in detergent-solubilized form, and they tend to denature and
aggregate. This is often the major obstacle in purication of these proteins, and it needs to be
addressed by screening for optimal conditions for purication. The following section will briey
address condition screening. One of the most powerful and generic purication protocols
for membrane proteins is exemplied in this section: the combination of IMAC and GF for
purication of histidine-tagged membrane proteins.
Cells expressing a histidine-tagged putative transferase membrane protein were lysed using
chemical and freeze-thaw methods. The membranes in the lysate (no membrane preparation)
were solubilized with Fos-choline-12 (FC12), a rather strong detergent, and applied withoutclarication on a HisTrap FF crude 1 ml column (Fig 9.11). The column was washed and eluted
in the presence of n-dodecyl-β-D-maltoside (DDM), which is a milder detergent. The same
detergent was used for the GF step, performed on a HiLoad 16/60 Superdex 200 pg column.
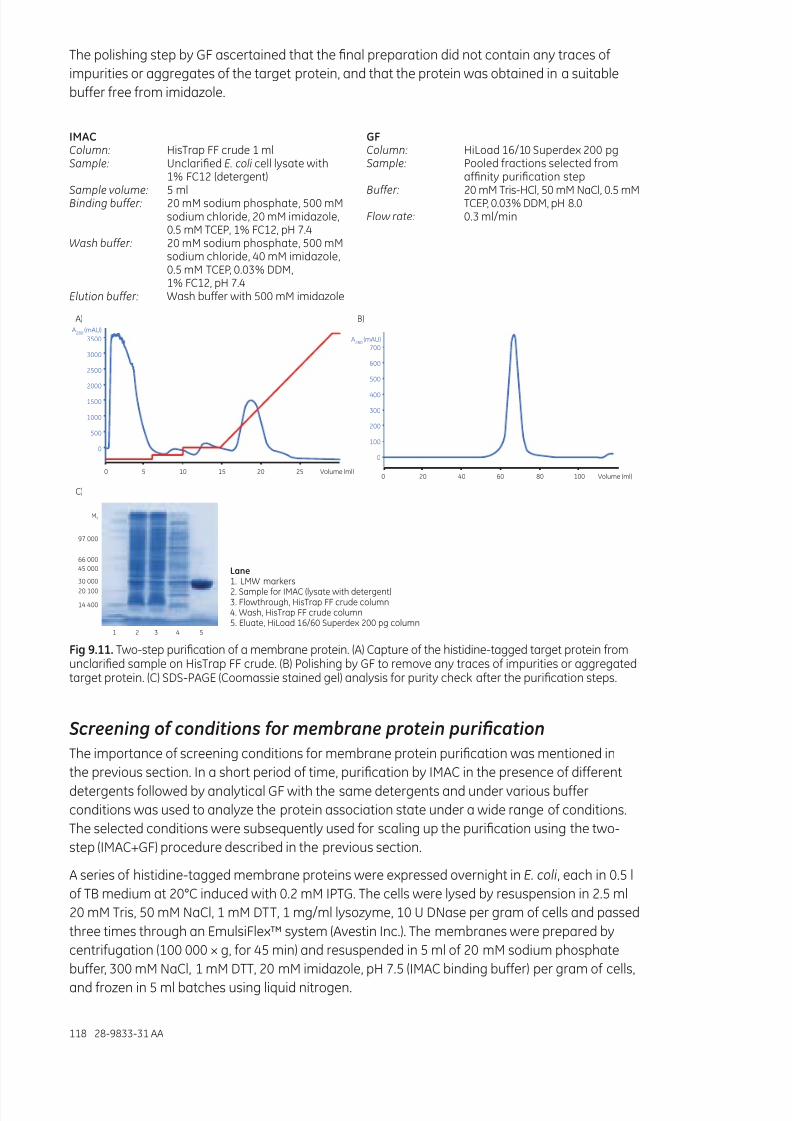
8/22/2019 Purificação de Proteínas - Estratégias, handbook
http://slidepdf.com/reader/full/purificacao-de-proteinas-estrategias-handbook 120/167
118 28-9833-31 AA
The polishing step by GF ascertained that the nal preparation did not contain any traces of
impurities or aggregates of the target protein, and that the protein was obtained in a suitable
buffer free from imidazole.
IMACColumn: HisTrap FF crude 1 mlSample: Unclaried E. coli cell lysate with
1% FC12 (detergent)
Sample volume: 5 ml Binding buffer: 20 mM sodium phosphate, 500 mM
sodium chloride, 20 mM imidazole,0.5 mM TCEP, 1% FC12, pH 7.4
Wash buffer: 20 mM sodium phosphate, 500 mMsodium chloride, 40 mM imidazole,0.5 mM TCEP, 0.03% DDM,1% FC12, pH 7.4
Elution buffer: Wash buffer with 500 mM imidazole
GFColumn: HiLoad 16/10 Superdex 200 pgSample: Pooled fractions selected from
afnity purication step
Buffer: 20 mM Tris-HCl, 50 mM NaCl, 0.5 mMTCEP, 0.03% DDM, pH 8.0
Flow rate: 0.3 ml/min
3500
3000
2500
2000
1500
1000
500
0
A280 (mAU)
A280
(mAU)
0 5 10 15 20 25 Volume (ml)
700
600
500
400
300
200
100
0
0 20 40 60 80 100 Volume (ml)
Mr
97 000
66 000
45 000
30 000
20 100
14 400
A)
C)
B)
1 2 3 4 5
Lane
1. LMW markers2. Sample for IMAC (lysate with detergent)3. Flowthrough, HisTrap FF crude column4. Wash, HisTrap FF crude column5. Eluate, HiLoad 16/60 Superdex 200 pg column
Fig9.11.Two-step purication of a membrane protein. (A) Capture of the histidine-tagged target protein fromunclaried sample on HisTrap FF crude. (B) Polishing by GF to remove any traces of impurities or aggregatedtarget protein. (C) SDS-PAGE (Coomassie stained gel) analysis for purity check after the purication steps.
Screening of conditions for membrane protein purication
The importance of screening conditions for membrane protein purication was mentioned inthe previous section. In a short period of time, purication by IMAC in the presence of different
detergents followed by analytical GF with the same detergents and under various buffer
conditions was used to analyze the protein association state under a wide range of conditions.
The selected conditions were subsequently used for scaling up the purication using the two-
step (IMAC+GF) procedure described in the previous section.
A series of histidine-tagged membrane proteins were expressed overnight in E. coli, each in 0.5 l
of TB medium at 20°C induced with 0.2 mM IPTG. The cells were lysed by resuspension in 2.5 ml
20 mM Tris, 50 mM NaCl, 1 mM DTT, 1 mg/ml lysozyme, 10 U DNase per gram of cells and passed
three times through an EmulsiFlex™ system (Avestin Inc.). The membranes were prepared by
centrifugation (100 000 × g, for 45 min) and resuspended in 5 ml of 20 mM sodium phosphate
buffer, 300 mM NaCl, 1 mM DTT, 20 mM imidazole, pH 7.5 (IMAC binding buffer) per gram of cells,
and frozen in 5 ml batches using liquid nitrogen.

8/22/2019 Purificação de Proteínas - Estratégias, handbook
http://slidepdf.com/reader/full/purificacao-de-proteinas-estrategias-handbook 121/167
28-9833-31 AA 119
Aliquots of 5 ml membrane suspensions were thawed carefully and were solubilized by addition
of a 10% stock solution of detergent to a nal concentration of 1% detergent. For each target
protein, up to four detergents were tested. The following detergents were used in the examples
given here: Octaethylene glycol monododecyl ether (C12
E8), lauryldimethylamine oxide (LDAO),
n-Dodecyl-β-D-maltoside (DDM), cyclohexyl-n-hexyl-β-D-maltoside (CYMAL-6), n-Octyl-β-D-
glucoside (OG), n-Decyl-β-D-maltoside (DM), n-Nonyl-β-D-maltoside (NM), and Fos-choline 12 (FC12).
Solubilization occurred over 90 min with mild agitation in a cold room, and samples were
claried by centrifugation (100 000 × g, for 15 min).
IMAC purication was performed by incubation of 5 ml of solubilized material with 130 μl of
Ni Sepharose 6 Fast Flow chromatography medium with end-over-end mixing for 30 min at
4°C. The medium was then sedimented in a 5 mm i.d. column for gravity elution. The column
was washed with 20 column volumes of binding buffer with 40 mM imidazole and eluted with
binding buffer including 150 mM NaCl, 500 mM imidazole, and the same detergent as used for
the solubilization.
Analytical GF was performed using a Superdex 200 5/150 GL column equilibrated with a selection
of buffers: 20 mM Na-acetate (pH 5.2), 20 mM HEPES (pH 7.5), or 20 mM Tris-HCl (pH 8.5) all with
300 mM NaCl, 1 mM DTT, and with the same detergent as used for solubilization and purication.Typical screening results are shown in Figure 9.12.
Volume (ml) Volume (ml)Volume (ml) Volume (ml)
A280
(mAU)
A280
(mAU)
A280
(mAU)
A280
(mAU)
0
100
200
300
400
500
600
700
0 0.5 1.0 1.5 2.0 2.50
20
40
60
80
100
0 0.5 1.0 1.5 2.0 2.5
0
20
40
60
80
100
120
0 0.5 1.0 1.5 2.0 2.5
0
100
200
300
400
0 0.5 1.0 1.5 2.0 2.5
0.03% C12
E8
0.1% LDAO
0.03% DDM
0.1% CYMAL-6
0.1% FC12
0.3% NM
0.1% DM
1% OG
0.1% LDAO, pH 8.5
0.1% LDAO, pH 7.5
0.1% LDAO, pH 5.2
0.03% C12
E8
0.03% DDM
In
Out
HMP05
In
Out
T1
In
Out
HM10In
Out
HM14
A) B) C) D)
Fig9.12. Effects of detergents and buffers on protein stability and size homogeneity as analyzed by GF. Acknowledgment: Dr. Per Moberg, Dept. of Medical Biochemistry and Biophysics, Karolinska Institute,Stockholm Sweden.
HMP05 (Fig 9.12A) shows a tailing peak in C12
E8
and a leading peak in LDAO, while both DDM and
CYMAL-6 gave symmetrical peaks. This may indicate that HMP05 is monomeric in LDAO, possibly
with a fraction of dimers. The earlier elution positions with DDM and CYMAL-6 indicate dimers.
T1 (Fig 9.12B) was completely aggregated in OG, whereas in DM, NM, and FC12 it appearedhomogeneous, possibly monomeric.
HM10 (Fig 9.12C) was aggregated in the presence of C12
E8, whereas the protein was eluted in a
well-dened symmetric peak in DDM.
HM14 (Fig 9.12D) was partially aggregated in LDAO at both pH 7.5 and pH 8.5. Non-aggregated
material gave raise to a number of peaks. The protein was monodisperse at pH 5.2. Notice that
the protein was exposed to the different pH values for the time period of the chromatography
run, about 10 min.
Matrix-assisted refolding of proteins expressed as inclusion bodiesInclusion bodies are insoluble aggregates of denatured or partly denatured protein sometimes
formed in bacterial expression systems. The aggregates may be caused by erroneous folding
due to too high expression levels; also, because the protein comes from another species than

8/22/2019 Purificação de Proteínas - Estratégias, handbook
http://slidepdf.com/reader/full/purificacao-de-proteinas-estrategias-handbook 122/167
120 28-9833-31 AA
used for expression, it may not be fully compatible with the folding machinery of the host cells. The
protein in inclusion bodies is usually inactive. Inclusion body formation may be advantageous
when desiring high expression levels, and it can allow toxic proteins to be overexpressed.
Preparation of active protein from inclusion bodies requires solubilization and refolding. The
general success rate for protein refolding with high yields is often disappointing. In fact, protein
refolding often requires extensive screening of suitable conditions. The examples of refolding
given here aim at describing a tool for efcient screening and scale-up of refolding conditions.
Isolation and solubilization of inclusion bodies were addressed in Chapter 6 with respect tosample preparation. Inclusion body preparation can be performed using multiple centrifugation
steps, and the obtained inclusion bodies can be stored frozen until use. Solubilization is achieved
by adding a strong denaturant such as guanidine hydrochloride or urea. A reducing agent is
often included to remove any erroneously formed S-S-bonds between the denatured protein
molecules. Thorough solubilization is a prerequisite for successful refolding.
Because of the rather good purity of the target protein that can be obtained by the isolation of
the inclusion bodies, purication can sometimes be omitted before refolding, but purication of
the solubilized protein before refolding often improves the success rate.
Refolding is initiated by decreasing the concentration of or completely removing the denaturant.This can be accomplished by dilution, dialysis, or chromatography methods, also known as
matrix-assisted refolding.
In matrix-assisted refolding, the denatured protein is bound to a chromatography medium, and
the concentration of denaturant is reduced to affect refolding while the protein is attached to
the medium.
Reolding
The simplicity of dilution and dialysis is probably the main reason for these methods being the
most popular. In laboratory-scale applications, these methods are inexpensive. Drawbacks arethe long time and large buffer volumes required, and the low nal protein concentrations after
dilution refolding. Matrix-assisted refolding is much faster compared with dilution and dialysis
refolding. A much higher protein concentration can be used, and the nal protein concentration
can be a thousand times higher than after dilution refolding. It seems clear that binding of the
protein on a chromatography medium during refolding reduces protein aggregation, which is
highly detrimental to refolding in solution. Whether the solid support may catalyze the folding
of the protein is a topic of discussion. The high protein concentration used means that buffer
consumption is small. Another advantage with matrix-assisted refolding is that refolding can
be combined with purication in the same step. There are, however, some obvious limitations to
matrix-assisted refolding. It may require an afnity tag, usually a histidine tag, and binding to thematrix must be compatible with the solubilization conditions.
IMAC is the most common method for on-column refolding, with GF in second place (no binding
needed). Several of the other chromatography methods for protein purication have also been
used for refolding, for example, IEX and HIC.
As mentioned earlier, the most important mechanism for matrix-assisted refolding is the
binding of the solubilized protein on the chromatography medium. GF is an exception, where
the matrix seems to reduce aggregation without binding of the protein. Binding hinders
aggregation while allowing folding of the protein. IMAC is an especially useful method because
the histidine tag makes the method generic for all proteins with this tag. The tag is generally
placed at the N- or C-terminus of the protein, which means that the protein can move freely
to allow folding of the polypeptide chain. The afnity between the histidine tag and the
immobilized metal ions is stable under most denaturing conditions. Other binding methods
such as IEX require multipoint attachments that may reduce movement during folding.

8/22/2019 Purificação de Proteínas - Estratégias, handbook
http://slidepdf.com/reader/full/purificacao-de-proteinas-estrategias-handbook 123/167
28-9833-31 AA 121
Figure 9.13 gives an example of on-column refolding using IMAC. The work started with
solubilization of inclusion bodies. The sample was loaded in the presence of denaturant. Some
contaminants passed through the column. Refolding was performed by running a 20 CV
gradient from 6 M urea to 0 M over 60 min. The protein was eluted with an imidazole gradient.
This method thus allows combining refolding with purication.
Sample: Claried homogenate of E. coli expressing a histidine-tagged protein
Column: HisTrap FF (1 ml chelating column charged with Ni2+
)Flow rate: 0.5 ml/min during the refolding gradient; 1.0 ml/min during rest of the methodBinding buffer: 6 M guanidine hydrochloride, 20 mM Tris-HCl, 0.5 M NaCl, 5 mM imidazole,
1 mM β-mercaptoethanol, pH 8.0Wash buffer: 6 M urea, 20 mM Tris-HCl, 0.5 M NaCl, 5 mM imidazole, 1 mM β-mercaptoethanol, pH 8.0Refolding buffer: 20 mM Tris-HCl, 0.5 M NaCl, 5 mM imidazole, 1 mM β-mercaptoethanol, pH 8.0Elution buffer: 20 mM Tris-HCl, 0.5 M NaCl, 500 mM imidazole, 1 mM β-mercaptoethanol. pH 8.0
Refolding gradient6 M to 0 M urea
Elution gradient20 mM to 500 mM imidazole Refolded protein
A280
60
0.0
0.5
1.0
120 Time (min)
Fig9.13.On-column refolding using a urea gradient . Puried refolded protein was further analyzed by GF.A major peak is observed at the native molecular weight and also a minor peak at a higher molecularweight, indicating a successful refolding of the protein.
Screening and scaling up matrix-assisted protein refoldingAs mentioned earlier, successful refolding usually requires screening of refolding conditions.
A powerful workow for refolding divided in two parts was used for screening and scale-up
of refolding of several proteins (Fig 9.14). The rst part involved parallel screening based on
His MultiTrap FF, 96-well lter plates containing IMAC medium, His MultiTrap FF. The best
conditions were selected and used for scale-up on a HisTrap FF 1 ml column.
The development work begins with the inclusion body preparation. In addition to obtaining
inclusion bodies, it is often possible to prepare minor amounts of soluble native target protein.This material is important as reference material when analyzing refolding yields. The screening
starts with solubilization of the target protein, and the solubilized protein may or may not be
puried before application to His MultiTrap. Refolding of the bound protein takes place in the
His MultiTrap plate by application of multiple refolding buffers in the different wells. The protein
is eluted from the plate and analyzed for native protein. Multiple rounds of screening are
possible. Finally, the best refolding conditions are selected and used for scale-up.
A large number of refolding conditions should be tested. The refolding reaction is often slow;
it can take from minutes to hours. This makes it very useful to perform screening in a parallel
format, and if possible, also the analysis.

8/22/2019 Purificação de Proteínas - Estratégias, handbook
http://slidepdf.com/reader/full/purificacao-de-proteinas-estrategias-handbook 124/167
122 28-9833-31 AA
Inclusion body preparation
Analytical technique for monitoring refolding
Solubilization
Purification Purification
Refolding Refolding
Solubilization
Purification
Reference sample
Inclusion bodies
Scale-upScreening
1 2
Supernatant with soluble target protein
Fig9.14.Workow for screening and scale-up of matrix-assisted refolding.
Conditionsandadditives
Key condition parameters for refolding are buffer substance, pH, and salt concentration. In
addition, there are a large number of substances that may be added to the refolding reaction to
support protein refolding. Some of these additives are listed in Table 9.1.
Table9.1. Additives used in refolding
Eects
Additives Proteinstructure Intra-andintermolecularinteractions
Denaturants Urea
Guanidine-HCl
Strong detergent
Destabilized Disrupted
Aggregationsuppressors
Arginine-HCl
Urea (low conc.)
Guanidine-HCl (low conc.)
Neutral Reduced
Mild detergentsPEGs
Proline
Cyclodextrins
Neutral Reduced
Foldingenhancers Sugars
Polyols
Ammonium sulfate
Magnesium chloride
Glycine
Alanine
Stabilized Enhanced
Reducingagents DTTDTE
TCEP
GSH
Reduced S-S bridges

8/22/2019 Purificação de Proteínas - Estratégias, handbook
http://slidepdf.com/reader/full/purificacao-de-proteinas-estrategias-handbook 125/167
28-9833-31 AA 123
The effects of additives on proteins can be divided in two: stabilization or destabilization of protein structure, and reduced or enhanced intra- and intermolecular interactions. In refolding,additives are often grouped into aggregation suppressors and folding enhancers.
The aggregation suppressors reduce interactions, often hydrophobic interactions, but do nothave signicant effects on native protein. Low concentrations of urea or guanidine-HCl can beused in the refolding solution to reduce protein-protein interactions, but if the concentrationsare too high the protein will stay unfolded. Arginine is a common additive that increases
solubility of folding intermediates without destabilizing native proteins. Other aggregationsuppressors, such as nonionic detergents and polyethylene glycols, are believed to interactwith hydrophobic surfaces.
Proteins and their interactions are stabilized by folding enhancers. The mechanisms are notcompletely understood; thermodynamics theory needs to be part of the discussion. Sugars andpolyols are typical folding enhancers. A low concentration of salts can stabilize by nonspecicelectrostatic interactions with the protein. Salts used for salting-out of proteins can, at highconcentrations, stabilize proteins as well.
Generally, additives are required at high concentrations (100 mM to 2 M) due to their weak
interactions with proteins and their sometimes indirect action on proteins in aqueous solution.Finally, reducing agents at critically balanced concentrations are important additives used tohinder erroneous disulde bonds from forming during refolding.
Figure 9.15 shows a strategy for screening in parallel format using His MultiTrap plates.Refolding parameters are screened in several steps, essentially in order of importance. First,pH and buffer substance are screened. The conditions giving the best refolding yield (often twoto three conditions) are selected for the next screening round. Next, NaCl concentrations aretested. Finally, the best conditions from this step are used for setting up a screen of differentadditives. The additives can be aggregation suppressors, folding enhancers, and reducingagents, as discussed earlier. The preferred alternative to the mentioned strategy is to apply a
Design of Experiment (DoE) approach. This allows reduction of the number of experiments thatare needed during screening and takes into consideration the effects of combining factors
(conditions or additives) on the outcome.
pH/buffer substance NaCl concentration Additives
Fig9.15.Strategy for screening conditions and additives for refolding.
His MultiTrap FF contains 50 μl of Ni Sepharose Fast Flow medium per well. The volume of the
wells is large enough to handle at least 500 μl of solution. The runs are performed using a platecentrifuge or a vacuum manifold and can be done manually or using automation.
In the following studies, the fresh plate was rst opened, and storage solution was exchangedfor buffer. In all steps, solutions were removed from the wells by centrifugation for 5 min at500 × g. In the second step, the plate was equilibrated with the solution used for the proteinsolubilization. After equilibration, 50 μg of solubilized protein (100 μl) was applied to each well,the plate was incubated for 2 min, and it was then washed with solubilization solution.
Refolding was accomplished by applying refolding solution and incubating at roomtemperature for 60 min. Each refolding condition was tested in triplicate. A reference samplecontaining native protein was included in triplicate and handled as the solubilized samples
but the solubilization solution was exchanged for a buffer without denaturant. Elution wasperformed by applying a buffer with 500 mM imidazole.
The activity of native protein eluted from each well was analyzed and compared withnondenatured starting material.

8/22/2019 Purificação de Proteínas - Estratégias, handbook
http://slidepdf.com/reader/full/purificacao-de-proteinas-estrategias-handbook 126/167
124 28-9833-31 AA
Below is an example of screening refolding conditions for ferredoxin NADP+ reductase, a
monomeric protein (Fig 9.16). Each diagram shows the yield at multiple conditions from a
screening step. The best conditions in each step were selected and combined with the dif ferent
settings of the new parameters of the next screening step. We can see a gradual general
improvement of the refolding yield from step to step.
A) Buffer + pH B) NaCl C) Arg + Gln D) Additives
Fig 9.16. Screening of multiple refolding conditions for ferredoxin NADP+ reductase using His MultiTrap FF.The screening was done stepwise; for each screening step (A-D), a few best conditions were selected tobe combined with a new parameter in the next screening step. Acknowledgment: Dashivets, T. et al., RapidMatrix-Assisted Refolding of Histidine-Tagged Proteins, Chembiochem. 10(5), 869-876 (2009) (Figure S1 in theSupporting Information). Copyright Wiley-VCH Verlag GmbH & Co. KGaA. Reproduced with permission.
Scale-up of the optimal refolding conditions for another histidine-tagged protein, GLK, was
done using a HisTrap FF column packed with the same chromatography medium as used in
His MultiTrap FF (Fig 9.17). The HisTrap FF column was equilibrated with the denaturing buffer
used for solubilization of the protein to be denatured. The solubilized sample was loaded
on the column, and the column was washed with denaturing buffer. The column was lled
with refolding buffer, and the ow was stopped during a 60-min incubation. The column was
washed with the refolding buffer, and a gradient of imidazole in equilibration buffer was used
to elute the refolded protein.
The described matrix-assisted refolding method supported refolding of proteins with more than
one subunit. Citrate synthase and glukokinase (homodimeric proteins) and β-galactosidase
(homotetrameric protein; four identical subunits with Mrof 116 000) have been refolded with
good yields.
Column: HisTrap FF 1 mlSample: Histidine-tagged GLKDenaturing buffer: 40 mM sodium phosphate, 300 mM NaCl, 6 M Gua-HCl, pH 8.0Equilibration buffer: 40 mM sodium phosphate, 300 mM NaCl, 5 mM imidazole, pH 8.0Refolding buffer: 40 mM sodium phosphate, 200 mM NaCl, 50 mM Arg-HCl, 50 mM Gln, 5 mM TCEP, pH 8.0Refolding pause: 1 hGradient elution: 500 mM imidazole in equilibration bufferFlow rate: 0.5 ml/min
0
A280
(mAU)
1000
900
800
700
600
500
400
300
Volume (ml)5 10 15 20 25 30
R e f o l d i n g
R e f o l d i n g
P a u s e
E l u t i o n
Load Refolding Elution
Fig 9.17. Scale-up of refolding of glucokinase on HisTrap FF 1 ml column under selected conditions.

8/22/2019 Purificação de Proteínas - Estratégias, handbook
http://slidepdf.com/reader/full/purificacao-de-proteinas-estrategias-handbook 127/167
28-9833-31 AA 125
Chapter 10Large-scale purication
Key concerns in large-scale purication differ to some extent from those typical at laboratoryscale. The emphasis in large-scale purication is on the development of robust and cost-effective
protocols with a minimum number of unit operations in order to improve overall processeconomy, all without ever compromising the quality (purity) of the desired product. When goingfrom laboratory scale to production scale, buffer consumption will be an issue, and choiceof chromatography media must be thoroughly considered based on economics, security of supply, and adherence to regulatory requirements.
It is recommended to consider the scale-up perspective already at the research stage during
the development of new protein drugs so as to avoid problems at later stages, for example,
scalability of separation methods, packability of chromatography media, and process economy.
The CIPP strategy described in Chapter 4 is valid also for process development for large-scale
purication. This chapter gives only a brief introduction of process development and large-
scale purication. For further reading, refer to the Handbook of Process Chromatography:
Development, Manufacturing, Validation and Economics by Lars Hagel, Günter Jaschies, and
Gail Sofer, 2nd ed., 2008, Academic Press.
Process development Development of a biopharmaceutical drug requires, from the outset, laboratory-scalepurication to obtain material for research and throughout the discovery and developmentphases. When the rst purication protocol is being developed, future process developmentneeds to be considered by avoiding the use of methods that cannot be efciently scaled
up. Regulatory requirements also change when moving from a purication process for theexplorative discovery environment to a purication process for the highly regulated productionenvironment.
Process development involves choosing and optimizing chromatography methods and noting
how they are optimized with respect not only to basic performance but also to robustness,
simplicity, costs, capacity, and so on. Similarly, the choice of proper chromatography media
should be made in terms of chemical and physical stability, functionality, reproducibility, and
so on. A thorough knowledge of the purication parameter space is needed to ensure a robust
process. It is recommended to explore a wide range of chromatography conditions early, to
increase process understanding and increase the likelihood of developing a robust purication
process. Figure 10.1 shows a conceptual workow for process development involving parallelscreening, allowing a broad range of chromatography conditions to be explored using
PreDictor prelled 96-well lter plates. Alternatively, the initial screening process can be
performed using small columns. After initial screening, media and conditions are selected for
further optimization on HiTrap or HiScreen columns prior to scaling up.

8/22/2019 Purificação de Proteínas - Estratégias, handbook
http://slidepdf.com/reader/full/purificacao-de-proteinas-estrategias-handbook 128/167
126 28-9833-31 AA
PreDictor prefilled 96-well filterplates and Assist softwarefor screening of conditions
ÄKTA avant 25, ÄKTA avant 150,UNICORN 6, HiScreen, and
HiTrap columns for optimization
ReadyToProcess™/AxiChrom™ columns forscale-up and production
Total characterization space Detailed studies to define design space
Scale-up
Area for further optimization
Fig10.1. Conceptual workow for process development.
High-throughput process development Time-to-clinic and time-to-market are key factors for successful biopharmaceutical
development. The number of projects and the amount of R&D spending both increase, but the
number of new products decreases. Efcient development of the manufacturing process is a
crucial component of the overall project plan. However, screening optimal process conditions
can be time-consuming and tedious. In addition, steadily increasing demands from regulatory
authorities for better understanding and control of manufacturing processes put even more
pressure on development work.
The challenge to the process developer in the biopharmaceutical industry is to increase
the project throughput and shorten the development time, and at the same time increase
process knowledge and design a robust process. Employing high-throughput tools for process
development helps address these challenges. High-throughput process development (HTPD)
shortens development time at the same time as it increases the amount of information
available during early process development, by working in parallel. As a result, a large numberof experimental conditions can be evaluated simultaneously. This allows a large experimental
space to be characterized and supports the denition of a well-established process design
space where process parameters that need to be monitored and controlled are understood.
PreDictor 96-well lter plates are prelled with GE Healthcare BioProcess chromatography
media to support high-throughput process development by allowing parallel screening of
chromatography conditions, either in a manual or in an automated workow. Assist software
supports the PreDictor workow from setup of experimental design to data evaluation.
For further information, refer to the handbook High-throughput Process Development with
PreDictor Plates, Code No. 28-9403-58.

8/22/2019 Purificação de Proteínas - Estratégias, handbook
http://slidepdf.com/reader/full/purificacao-de-proteinas-estrategias-handbook 129/167
28-9833-31 AA 127
Practical considerations in scale-upIt is important to dene the parameters during process development to obtain an efcient
process with high productivity and to know how changes inuence the process and the nal
product. Established conditions are used as the basis for scale-up. Scale factors between 10
and 100 per step are recommended. There are a number of chromatography parameters that
have to be maintained to ensure conformity in performance between laboratory scale and nal
production scale:
• Residence time of sample on column (important)
• Maintenance of gradient slope (gradient volume/media volume)
• Sample concentration and composition
• Ratio of sample volume/media volume
Scale-up is obtained by increasing:
• Column diameter
• Volumetric ow rate
• Sample volume proportionally• Gradient volume proportionally
Increasing the bed volume by increasing the column diameter and increasing volumetric ow,
sample load volume, and gradient volume accordingly, will ensure the same performance and
cycle time as in laboratory scale during method development.
In IEX, HIC, and AC, the highest productivity is normally obtained with short (10 to 20 cm) and
wide columns. In some cases, if the ideal column is not available, it might be an advantage to
slightly increase the bed height using a column with a diameter slightly smaller than calculated.

8/22/2019 Purificação de Proteínas - Estratégias, handbook
http://slidepdf.com/reader/full/purificacao-de-proteinas-estrategias-handbook 130/167
128 28-9833-31 AA

8/22/2019 Purificação de Proteínas - Estratégias, handbook
http://slidepdf.com/reader/full/purificacao-de-proteinas-estrategias-handbook 131/167
28-9833-31 AA 129
This chapter introduces some of the key concepts in chromatography and addresses two
considerations that are important in most purication situations—peak broadening and
backpressure.
Chromatographic puricationIn column chromatography purication, the protein of interest may be separated from contaminants
by binding to the stationary phase (the chromatography medium), followed by selective elution
or, alternatively, by binding impurities, allowing the target protein to pass through the column
without being retained. Alternatively, purications may be performed under conditions that
delay sample components (without binding), thereby giving different elution positions. GF is one
example of this latter method.
Binding of protein allows protein fractionation during the elution step. Elution is achieved by changing
the conditions in the eluent, for example, by increasing salt concentration, changing pH, or adding
substances that compete with the target protein for the ligands on the chromatography medium.
There are three possible elution methods:
• Gradient elution: The eluent composition is changed continuously toward conditions
favoring protein dissociation from the chromatography medium. Elution position will differ
between substances depending on their afnity.
• Stepwise elution: The eluent composition is changed stepwise, at one or several occasions.
Several substances may be eluted in each step.• Isocratic elution: The composition of the eluent is selected to give weak or no interactions
between sample components and chromatography medium, and the conditions are kept
unchanged during the entire purication (binding and elution). The target protein passes
through the column slower or faster than impurities.
Gradient elution allows separation of components with a wider range of properties compared
with isocratic elution, and peak tailing is reduced. The steeper the gradient, the closer the proteins
will be eluted. Gradients are in most cases linear, but can in some cases be convex, concave,
or with a custom-programmed shape in order to optimize the resolution within certain parts of
the gradient.
Stepwise elution is a faster alternative to gradient elution; it uses discrete steps instead of a
continuous gradient. The buffer consumption is lower, and simpler equipment, for example,
manual formats, can be used. Therefore, stepwise elution is often preferred for routine and
large-scale purications. Optimization may be required to achieve satisfactory results. Often
optimization of elution conditions is performed by gradient elution, and suitable conditions are
selected and then used for step elution.
Isocratic purication can give peaks with a sharp leading edge and a long tail , especially at
high loads or strong retention. The use of too strong an eluent will lead to early elution and loss
in resolution. The advantage with isocratic elution is simplicity and minimal requirements for
equipment and handling. This approach may be suitable for cases where componentswith very similar properties are separated, because high selectivities can be obtained after
proper optimization.
Chapter 11Chromatography principles and considerations
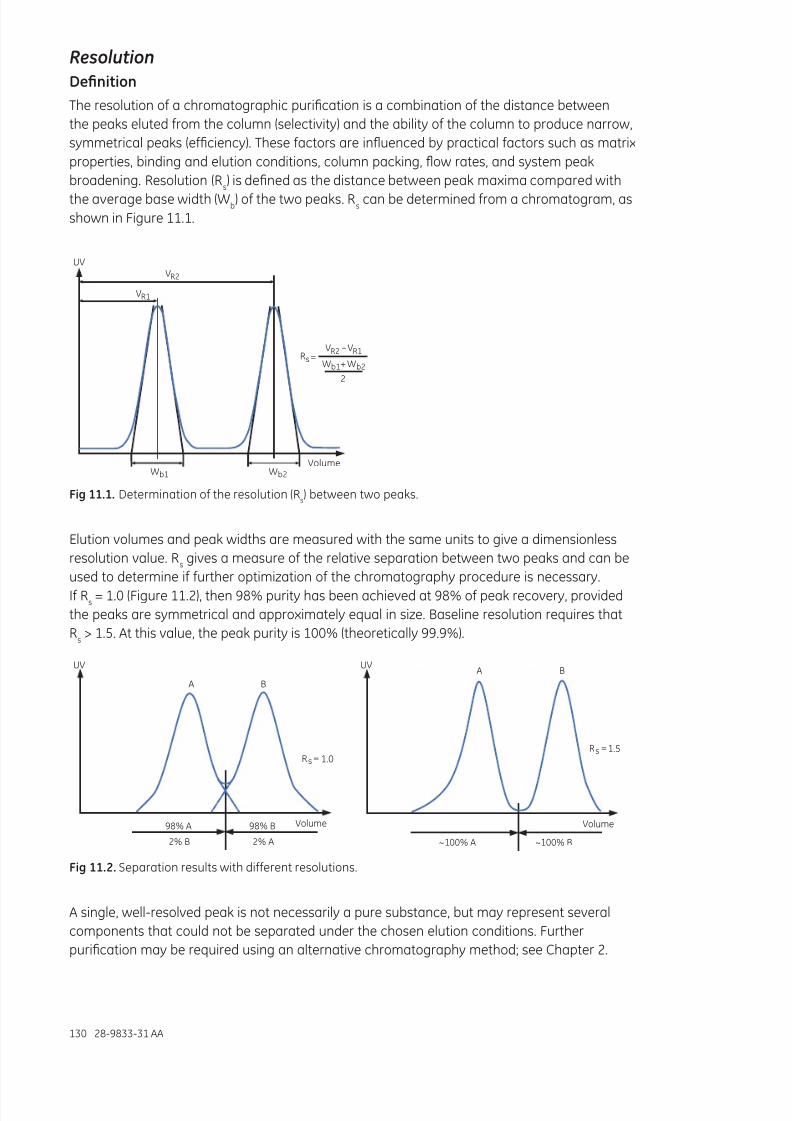
8/22/2019 Purificação de Proteínas - Estratégias, handbook
http://slidepdf.com/reader/full/purificacao-de-proteinas-estrategias-handbook 132/167
130 28-9833-31 AA
ResolutionDefnition
The resolution of a chromatographic purication is a combination of the distance between
the peaks eluted from the column (selectivity) and the ability of the column to produce narrow,
symmetrical peaks (efciency). These factors are inuenced by practical factors such as matrix
properties, binding and elution conditions, column packing, ow rates, and system peak
broadening. Resolution (Rs) is dened as the distance between peak maxima compared with
the average base width (Wb) of the two peaks. R
scan be determined from a chromatogram, as
shown in Figure 11.1.
Volume
UV
b2Wb1W
VR1
VR2
2
=–
Rs+ b2Wb1W
VR1VR2
Fig11.1.Determination of the resolution (Rs) between two peaks.
Elution volumes and peak widths are measured with the same units to give a dimensionless
resolution value. Rs gives a measure of the relative separation between two peaks and can beused to determine if further optimization of the chromatography procedure is necessary.
If Rs
= 1.0 (Figure 11.2), then 98% purity has been achieved at 98% of peak recovery, provided
the peaks are symmetrical and approximately equal in size. Baseline resolution requires that
Rs
> 1.5. At this value, the peak purity is 100% (theoretically 99.9%).
1.5=Rs
Volume
A
~100% A ~100% B
BUV
1.0=Rs
Volume
UV
98% A
2% B
98% B
2% A
A B
Fig11.2. Separation results with different resolutions.
A single, well-resolved peak is not necessarily a pure substance, but may represent several
components that could not be separated under the chosen elution conditions. Further
purication may be required using an alternative chromatography method; see Chapter 2.

8/22/2019 Purificação de Proteínas - Estratégias, handbook
http://slidepdf.com/reader/full/purificacao-de-proteinas-estrategias-handbook 133/167
28-9833-31 AA 131
Efciency
Column efciency (the ability to elute narrow, symmetrical peaks from a packed bed) relates
to the peak broadening that occurs on the column and is frequently stated in terms of the
number of theoretical plates (see Appendix 3 for determination of column efciency). The key
factors for efciency are bead size, column dimensions, packing of the column, and ow rate.
High efciency also requires small peak broadening, in the column and in the chromatography
system; see the section on peak broadening below. Good column packing gives high efciency.
This is especially true for GF columns. Uneven packing, a too tightly or too loosely packed bed,or a bed containing air bubbles will lead to uneven passage of sample (and buffer) through the
column, peak broadening, and hence loss of resolution. Figure 11.3 illustrates the parameters
that contribute to good column efciency. The particle size is a signicant factor for efciency.
The smallest particles will give the most efcient mass transfer, which results in the narrowest
peaks under suitable elution conditions and with a well-packed column.
Narrow, symmetrical peaks
Minimal zone broadening
Longitudinal diffusion kept small
Small bead sizeUniform pore size distribution
Eluent flow evenly distributedUniform packing
Narrow particle size distribution
Buffer flow
Diffusion
Fig11.3.Factors that affect column efciency.
Although efciency can be improved by decreasing the particle size of the matrix, using smallerparticles creates an increase in backpressure so that ow rates need to be decreased, thus
lengthening the run time. Hence it is preferable to match the chromatography medium with the
requirements for the purication (speed, resolution, purity, etc.).

8/22/2019 Purificação de Proteínas - Estratégias, handbook
http://slidepdf.com/reader/full/purificacao-de-proteinas-estrategias-handbook 134/167
132 28-9833-31 AA
The viscosity of large volumes of highly concentrated sample may reduce resolution when
running columns packed with small particles. Samples may need to be diluted, or larger
particles may need to be used.
Selectivity
Selectivity (the degree of separation between peaks) has a great impact on resolution and is a
more important factor than high efciency in determining resolution (Fig 11.4).
high efficiency
low efficiency
Poor selectivity
Volume
UV
Volume
UV Good selectivity
high efficiency
low efficiency
Fig11.4.Schematic view of the effect of selectivity and efciency on resolution.
Selectivity depends on several factors: the nature of the ligand (for AC, IEX, HIC, etc.) and its degree
of substitution and distribution on the matrix (IEX and HIC); and the characteristics of the matrix,
especially the pore structure (GF). The selectivity obviously also depends on the target protein,
the impurities, and conditions used for purication, including mode of elution. Establishing a
balance between these properties leads to a well-resolved, highly selective separation.
Peak broadeningResolution greatly depends on the selectivity and efciency of the chromatography medium.
In addition to this, the column hardware and the chromatography system give a broadening
of the peaks that are eluted. One of the main causes of peak broadening is longitudinal
diffusion (diffusion in the column direction) of the sample. Peak broadening can be minimized
if the distances available for longitudinal diffusion are minimized, for example, by keeping
columns as short as possible while still obtaining enough selectivity. The combination of
chromatography medium and column hardware should be carefully selected; see Table 7.4 in
Chapter 7. The use of prepacked columns is recommended, but column packing by the user is
also possible; see Appendix 3.The design of the chromatography system and the suitable combination of column and system
is important to avoid extensive peak broadening. All components in the ow path of the
chromatography system will contribute to peak broadening to a different degree, for example,
tubing/capillaries, cells for in-line detection, valves, and so on. The length of the tubing
should be as short as possible. The tubing diameter will also greatly affect peak broadening.
Figure 11.5 shows an example of how different tubing diameters in an ÄKTA design system
affect the resolution obtained using a Superdex 200 5/150 GL column, that is, more narrow
tubing allows for better resolution and selectivity. Chromatography systems for high-resolution
chromatography should thus have short and narrow tubing. To obtain the best resolution, it
may be necessary to optimize the ow path and only connect the necessary components, forexample, column valves, and in-line cells for pH or conductivity measurements.

8/22/2019 Purificação de Proteínas - Estratégias, handbook
http://slidepdf.com/reader/full/purificacao-de-proteinas-estrategias-handbook 135/167
28-9833-31 AA 133
80
60
40
20
0
0.0 0.5 1.0 1.5 2.0 2.5 3.0 Volume (ml)
A280 (mAU) A280 (mAU)
A280 (mAU) A280 (mAU)
300
250
200
150
100
50
0
0.0 0.5 1.0 1.5 2.0 2.5 3.0 Volume (ml)
250
200
150
100
50
0
0.0 0.5 1.0 1.5 2.0 2.5 3.0 Volume (ml)
200
150
100
50
0
0.0 0.5 1.0 1.5 2.0 2.5 3.0 Volume (ml)
0.15 mm 0.25 mm
0.50 mm 0.75 mm
Fig11.5. Effect of tubing inner diameter (0.15 to 0.75 mm) on resolution. Column: Superdex 200 5/150 GL(column volume: 3 ml); ow rate: 0.3 ml/min.
Importanceoacleancolumnorresolution
Most biological samples will contain substances, for example, lipids or particles from thesource material, that tend to be bound nonspecically to the chromatography medium. Such
bound material will change the properties so that the resolution is decreased because of broad
and tailing peaks or shifts in retention; see Fig 11.6. A dirty medium may also show decreased
binding capacity and increased pressure. Cleaning usually restores the performance.
62 mg/ml (100%) 48 mg/ml (77%) 59 mg/ml (95%)Protein binding capacity
Performance test
Fresh medium
A) B) C)
After a purification stepusing 30 ml of E. coli
supernatant as sample After cleaning
Fig11.6. Effects of a dirty medium on resolution and binding capacity. Performance of (A) a columnpacked with fresh medium; (B) a column after use in capture purication; and (C) the column in Fig 11.6Bafter cleaning.

8/22/2019 Purificação de Proteínas - Estratégias, handbook
http://slidepdf.com/reader/full/purificacao-de-proteinas-estrategias-handbook 136/167
134 28-9833-31 AA
EectsosamplevolumeonresolutioninGF
The volume of the sample does not affect resolution in purication methods based on binding
of sample components, because binding concentrates the target protein(s) in the upper part
of the column. In GF the sample is not bound, and there is therefore no concentration of the
sample. Because of this, sample volume that is too large will give a decrease in resolution. A
rule of thumb is to keep the sample volume smaller than 0.5% of the volume of an analytical
GF column and 4% of the volume of a preparative GF column. This can be contrasted with
buffer exchange, where a sample volume of up to 30% of the column volume is acceptable, inorder to increase the capacity, because of the group separation between low-M
rsubstances
and macromolecules (e.g., proteins).
0.05
0.10
0.15
0.20
0.25
0.00
0 5 10 15 20 Volume (ml) Volume (ml) Volume (ml)0 5 10 15 20
A280
0.05
0.10
0.15
0.00
A280
0.05
0.10
0.00
A280
A) B) C)
0 5 10 15 20
Fig11.7. Effect of sample volume on resolution in GF on Superdex 200 10/300 GL (Column volume 24 ml).(A) 25 μl sample (0.1% of CV); (B) 250 μl sample (1% of CV); (C) 1000 μl sample (4% of CV).
Handling backpressureWhen the measured pressure in a chromatography system reaches a set maximum pressure,
it is usually programmed to stop the run or decrease the ow rate, to avoid compressing the
bed or breaking the column or parts of the system. An unplanned interruption is obviously
unwanted and can often be avoided by taking proper action before starting the purication.
The pressure measured by the system is caused by resistance of the ow of eluent through
the column and system components and capillaries. The term backpressure is often used.
Increased backpressure can have a number of causes related to the sample, the eluent, the
column, and the ow path of the chromatography system.
Sample
In order to obtain trouble-free purication, it is strongly recommended that the samplesapplied to chromatography columns are thoroughly claried (see Chapter 6). HisTrap FF crude
IMAC columns are exceptions to this rule. These columns accept unclaried cell lysates;see Chapter 7.
Even a well-claried sample, however, will contain some small amounts of particulate matterthat in time will reduce the performance of the column and system, unless cleaning-in-place (CIP) is performed on a regular basis. It should also be noted that a claried sample,for example, an E. coli extract, that is kept for some time or is freeze-thawed, will becomeopalescent because of precipitate formation. If this happens, the sample should be reclariedbefore loading on the column. For this purpose, ltration through a 0.22 μm or a 0.45 μmsyringe lter is often sufcient.
Samples can also give high pressure due to high viscosity, for example, caused by the presence
of nucleic acids or by working in a cold room. Thorough mechanical cell disruption cansometimes avoid this, but it is often useful to add nucleases, for example, Benzonase, to cleavethe nucleic acids. Alternatively, nucleic acids can be precipitated using polycationic substances
such as polyamines, for example, polyethyleneimine.

8/22/2019 Purificação de Proteínas - Estratégias, handbook
http://slidepdf.com/reader/full/purificacao-de-proteinas-estrategias-handbook 137/167
28-9833-31 AA 135
Some chromatography systems allow automatic reduction of the ow rate if the pressure
increases too much during sample loading; see Figure 11.8. The reduction in ow is balanced
to keep the pressure at the maximum allowed pressure until the sample loading has reached
its end. When the pressure is going down during the wash, the ow rate is automatically up-
regulated to the original setting.
2.5
2.0
1.5
1.0
0.5
0
0 1 2 3 4 5 6 7 8 9 Time (min)
Flow rate (ml/min)Flow rate sample pump
Flow rate system pumpPressureUV280
Fig11.8.Pressure-controlled sample loading available in some chromatography systems.
Eluent
In chromatography, the pressure across column and system depends on the ow, the viscosity
of samples and eluents, and the resistance met when passing through the column and system.
The viscosity of the eluent depends on its composition and temperature. Table 11.1 gives some
examples of pure substances in water to give a general view of the effects of concentrations
and temperature on viscosity.
As a rule of thumb: The viscosity of water at 20°C is 1.0 cP but is nearly doubled at 0°C. A typical
buffer for protein purication has just slightly higher viscosity than water and will also be
doubled when cooling to 0°C. Higher viscosity of the eluent will give higher backpressure in
the chromatography system at a given ow rate with a linear relation; see Figure 11.9.
A chromatography column that has a maximum ow rate of 4 ml/min at room temperature
using standard buffer should not be run at a ow rate higher than half of this, that is, 2 ml/min
when working in the cold room. Some additives are used at high concentrations, for example,
glycerol, urea, or guanidine hydrochloride, and can give very high viscosities; see Table 11.1.
The maximum ow rate in the cold room is about half of the maximum ow rate at
room temperature.
6.0
5.0
4.0
3.0
2.0
1.0
0.00 1 2 3 4 5 Viscosity (cP)
Pressure (MPa)
Fig11.9.Effect of viscosity on backpressure in a capillary. Data correspond to solvent passing with a owof 10 ml/min through 1 m tubing with an inner diameter of 0.5 mm.

8/22/2019 Purificação de Proteínas - Estratégias, handbook
http://slidepdf.com/reader/full/purificacao-de-proteinas-estrategias-handbook 138/167
136 28-9833-31 AA
Table11.1. Viscosity of some substances in water
Viscosity(cP)
Composition 0°C 10°C 20°C
Water (Ref. 1) 1.792 1.308 1.005
5% NaCl (0.856 M) (Ref. 2) 1.097
25% NaCl (4.28 M) (Ref. 2) 2.4
10% glycerol (Ref. 3) 2.44 1.74 1.31
50% glycerol (Ref. 2) 14.6 6.00
8 M urea (Ref. 4) 1.7 (at 25°C)
6 M guanidine hydrochloride (Ref. 4) 1.6 (at 25°C)
Column
Full control of column pressure is important when performing purication using stand-alone
pumps or chromatography systems. Pressure that is too high can compress the bed or break
the column. A column has two pressure limits that must not be passed: the column hardware
pressure limit and the maximum pressure over the packed bed. The pressure denoted p1
(precolumn pressure) is the pressure at the top of the column. The pressure at this position is
caused by the backpressure of the chromatography medium and all system components of
the ow path connected to the bottom of the column, downstream; see Figure 11.10. This is
the highest pressure that the column hardware is exposed to and should be kept lower than
the column hardware pressure limit. If this pressure becomes too high, the column may break
or start to leak. The pressure drop over the packed bed is Δp=p1-p
2. The pressure p
2at the
bottom of the column can only be measured in the ÄKTA avant 25 and ÄKTA avant 150. This
pressure drop is caused by the ow resistance of the chromatography medium and should be
kept lower than the maximum pressure over the packed bed. If this pressure becomes too high,
the bed may start to compress, giving a gap, and possibly cause a sudden further increase in
backpressure that may break the column.
p1
A) B)
p2
∆p = p1 – p2
Fig11.10.Column pressures. (A) Pressure p1
is the highest pressure that the column hardware is exposedto; p
2is the pressure at the bottom of the column that is caused by the backpressure from the system
components connected downstream of the column. Δp is the pressure drop across the chromatographybed. (B) Gap caused by too high a pressure drop across the chromatography bed.

8/22/2019 Purificação de Proteínas - Estratégias, handbook
http://slidepdf.com/reader/full/purificacao-de-proteinas-estrategias-handbook 139/167
28-9833-31 AA 137
The pressure drop across a column can be described by the equation below:
Δp=ηLv/(θdp
2)
where Δp is the pressure drop across the column, η the eluent viscosity, L the column length,
v the linear ow rate, dp
the bead diameter, and θ a dimensionless constant. From this equation
we can learn that the pressure drop depends inversely on the square of the particle size
(diameter). Small beads give high backpressure and large beads give low backpressure. As
was mentioned earlier, small beads gives better resolution than large beads. Thus, selectionof chromatography bead size has to be a compromise between resolution and backpressure.
The selection of a medium giving high backpressure will require a chromatography system that
can handle the high pressure (and the resolution). Refer to the discussion of compatibility of
chromatography media and systems in Chapter 7.
Small chromatography beads give higher backpressure than large beads.
Particles from samples or eluents may be accumulated on the top lter of the column or in
the chromatography medium. Proper clarication and immediate use of samples (see above),
as well as ltration of eluents, will reduce the risk of column deterioration. Using an in-line
lter for the eluents is strongly recommended. Particles collected on the column top lter mayfor some columns be removed by exchanging the top lter or performing cleaning-in-place
(CIP) of the column with the ow backward. Take these actions only if recommended in the
product instructions. CIP should be performed regularly and according to the manufacturer’s
instructions.
Chromatographysystem
In purications using columns and chromatography systems that are compatible with
each other, there should be no backpressure problems due to the chromatography system.
Chromatography systems designed for analysis or micropurication contain narrow tubing
in order to give optimum performance with high-resolution columns. Narrow tubing giveshigher backpressure than wider tubing. A system with narrow tubing will therefore contribute
signicantly to the total backpressure during a purication run. When using a column designed
for purications at low pressure with such a chromatography system, there is a risk that the
pressure in the column rises above the maximum limit. In these cases it may be necessary to
adjust the ow path of the chromatography system to reduce the backpressure, thus allowing
the purication to take place.
The pressure reading in most chromatography systems is made in the pumps (just after
the pumps); see Figure 11.11. This pressure reading corresponds to the pressure drop of
the entire ow path of the system including the connected column. This pressure value isan overestimate of the pressure at the top of the column, because the ow path before the
column may provide a signicant contribution to the total pressure. To obtain the pressure
drop across the column, the system backpressure contribution with the same eluent and ow
(and temperature) must be determined for the system without the column. The column can
be exchanged for a short, wide capillary for this measurement. The pressure drop over the
column is obtained by subtracting the pressure reading without the column from the value
with the column connected. In most purications using standard chromatography systems,
the described exact determination is not necessary because the system backpressure is
low and the obtained pressures are much lower than maximum column pressure. Analytical
and microscale chromatography systems containing narrow capillaries give higher system
backpressures, and the column pressure drop calculation may be necessary to allow running
the purication at the recommended ow for the column.

8/22/2019 Purificação de Proteínas - Estratégias, handbook
http://slidepdf.com/reader/full/purificacao-de-proteinas-estrategias-handbook 140/167
138 28-9833-31 AA
In ÄKTA avant chromatography systems, additional pressure sensors have been included in the
column valve to allow pressure measurements just before and after the column, giving the true
p1
and p2
pressure values, allowing the calculation of the pressure drop, Δp=p1-p
2.
Pressure generated before the column
Standard pressure sensor
Pressure sensors in ÄKTA avant
Pressure sensors in ÄKTA avant
The pressure at this positionaffects the column hardware
pressure limit (= precolumn
pressure)
Pressure over the packed bed,∆p = p
1– p
2
Pressure generated after the column
Fig11.11. Principle of pressure readings in chromatography systems.
References1. N.E. Dorsey, Properties of Ordinary Water-Substance, p. 184. Reinhold Pub. Corp., New York (1940).
2. Specic Gravity and Viscosity of Liquids. http://www.csgnetwork.com/sgvisc.html
Accessed September 1, 2010.
3. Viscosity of Aqueous Glycerine Solutions. http://www.dow.com/glycerine/resources/table18.htm
Accessed September 1, 2010.
4. Kawahara, K. and Tanford, C. Viscosity and Density of Aqueous Solutions of Urea and Guanidine
Hydrochloride. J Biol Chem241, 3228-3232 (1966).

8/22/2019 Purificação de Proteínas - Estratégias, handbook
http://slidepdf.com/reader/full/purificacao-de-proteinas-estrategias-handbook 141/167
28-9833-31 AA 139
AppendicesAppendix 1
Biological buffers
Nonvolatilebuersoranionexchangechromatography
Piperazine
bis-Tris propane
Triethhanolamine
Tris
N-Methyldiethanola mine
Propane-1,3-Diamino
Ethanolamine
Piperazine
Propane-1,3-Diamino
Piperidine
N-Methyl piperazine
bis-Tris
4.75
5.33
6.48
6.65; 9.10
7.76
8.07
8.52
8.88
9.50
9.7310.55
11.12
54 6 7 8 9 10 11pH
pKa1
(25°C)
FigA1.1. pH range and pKa
data for various nonvolatile buffers for AIEX.
TableA1.1. Physical data for various nonvolatile buffers for AIEX
pHinterval Substance Conc.(mM) Counterion pKa(25°C)1 d(pK
a)/dT(°C)
4.3–5.3 N-Methylpiperazine 20 Cl - 4.75 -0.015
4.8–5.8 Piperazine 20 Cl- or HCOO - 5.33 -0.015
5.5–6.5 l-Histidine 20 Cl - 6.04
6.0–7.0 bis-Tris 20 Cl - 6.48 -0.017
6.2–7.2; 8.6–9.6 bis-Tris propane 20 Cl - 6.65; 9.10
7.3–8.3 Triethanolamine 20 Cl - or CH
3COO
- 7.76 -0.020
7.6–8.6 Tris 20 Cl - 8.07 -0.028
8.0–9.0 N-Methyldiethanolamine 20 SO4
2 - 8.52 -0.028
8.0–9.0 N-Methyldiethanolamine 50 Cl - or CH
3COO
- 8.52 -0.028
8.4–9.4 Diethanolamine 20 at pH 8.4 Cl - 8.88 -0.025
50 at pH 8.8
8.4–9.4 Propane-1,3-diamino 20 Cl - 8.88 -0.031
9.0–10.0 Ethanolamine 20 Cl - 9.50 -0.029
9.2–10.2 Piperazine 20 Cl - 9.73 -0.026
10.0–11.0 Propane-1,3-diamino 20 Cl - 10.55 -0.026
10.6–11.6 Piperidine 20 Cl - 11.12 -0.031
1 David R. Lide, ed., CRC Handbook of Chemistry and Physics (83rd edition), CRC Press (2002)

8/22/2019 Purificação de Proteínas - Estratégias, handbook
http://slidepdf.com/reader/full/purificacao-de-proteinas-estrategias-handbook 142/167
140 28-9833-31 AA
Nonvolatilebuersorcationexchangechromatography
2.5 3 4 5 6 7 8 9pHpKa
1
(25°C)
3.13
3.86
4.21
4.75
5.766.27
7.20
7.56
8.33
Citric acid
Lactic acid
Butanedioic acid (succinic acid)
Acetic acid
Methyl malonic acidMES
Phosphate
HEPES
Bicine
FigA1.2.pH range and pKa
data for various nonvolatile buffers for CIEX.
TableA1.2.Physical data for various nonvolatile buffers for CIEX
pHinterval Substance Conc.(mM) Counterion pKa(25°C)1 d(pKa)/dT(°C)1.4–2.4 Maleic acid 20 Na+ 1.92
2.6–3.6 Methyl malonic acid 20 Na+ or Li+ 3.07
2.6–3.6 Citric acid 20 Na+ 3.13 -0.0024
3.3–4.3 Lactic acid 50 Na+ 3.86
3.3–4.3 Formic acid 50 Na+ or Li+ 3.75 +0.0002
3.7–4.7; 5.1–6.1 Succinic acid 50 Na+ 4.21; 5.64 -0.0018
4.3–5.3 Acetic acid 50 Na+ or Li+ 4.75 +0.0002
5.2–6.2 Methyl malonic acid 50 Na+ or Li+ 5.76
5.6–6.6 MES 50 Na+ or Li+ 6.27 -0.0110
6.7–7.7 Phosphate 50 Na+ 7.20 -0.0028
7.0–8.0 HEPES 50 Na+ or Li+ 7.56 -0.0140
7.8–8.8 Bicine 50 Na+ 8.33 -0.01801 David R. Lide, ed., CRC Handbook of Chemistry and Physics (83rd edition), CRC Press (2002)
Volatilebuersystems
TableA1.3. Physical data for various volatile buffers
pHrange Buersystem Counterion pKavaluesorbueringions1
3.3–4.3 Formic acid H+ 3.753.3–4.3; 4.8–5.8 Pyridine/formic acid HCOO
- 3.75; 5.25
3.3–4.3; 9.3–10.3 Trimethylamine/formic acid HCOO - 4.75; 9.81
4.3–5.8 Pyridine/acetic acid CH3COO
- 4.75; 5.25
4.3–5.3; 9.3–10.3 Trimethylamine/acetic acid CH3COO
- 4.75; 9.81
3.3–4.3; 8.8–9.8 Ammonia/formic acid HCOO - 3.75; 9.25
4.3–5.3; 8.8–9.8 Ammonia/acetic acid CH3COO
- 4.75; 9.25
5.9–6.9; 9.3–10.3 Trimethylamine/carbonate CO3
2 - 6.35; 9.81
5.9–6.9; 8.8–9.8 Ammonium bicarbonate HCO3
- 6.35; 9.25
5.9–6.9; 8.8–9.8 Ammonium carbonate/ammonia CO32
-
6.35; 9.255.9–6.9; 8.8–9.8 Ammonium carbonate CO
32
- 6.35; 9.25
4.3–5.3: 7.2–8.2 N-Ethylmorpholine/acetate HCOO - 4.75; 7.72
1 David R. Lide, ed., CRC Handbook of Chemistry and Physics (83rd edition), CRC Press (2002)

8/22/2019 Purificação de Proteínas - Estratégias, handbook
http://slidepdf.com/reader/full/purificacao-de-proteinas-estrategias-handbook 143/167
28-9833-31 AA 141
Appendix 2Ammonium sulfate precipitation
In order to maintain protein activity, it is often desirable to perform precipitation at low
temperature. Table A2.1 gives the amounts of solid ammonium sulfate to be added to obtain
a given percentage saturation at 0°C. The amount to be added varies with temperature.
A protocol for ammonium sulfate precipitation at 20°C can be found in Recombinant Protein
Handbook: Principles and Methods (Code No. 18-1142-75).
1. Clarify the extract and keep on ice.
2. Add 1 part ice-cold 1 M Tris-HCl, pH 8.0 to 10 parts sample volume to maintain pH.
3. Add solid ammonium sulfate while stirring. Stir gently for 30 min. (Use Table A2.1 to
calculate how much ammonium sulfate to add to obtain the chosen percent saturation
[such that it will not precipitate the target protein].)
4. Centrifuge for 20 min at 10 000 to 50 000 × g at a maximum of 4°C.5. Collect the supernatant (contains the target protein).
6. Add solid ammonium sulfate while stirring. Stir gently for 30 min. (Calculate how much
ammonium sulfate to be added to obtain the chosen percent saturation [such that it will
precipitate the target protein].)
7. Centrifuge for 20 min at 10 000 to 50 000 g at a maximum of 4°C.
8. Wash the pellet twice by resuspension in an equal volume of ammonium sulfate solution
of the same concentration (i.e., a solution that will not redissolve the precipitated protein
or cause further precipitation).
9. Centrifuge again.10. Collect the pellet and dissolve it in a small volume of chromatography buffer.
Ammonium sulfate precipitation can also be accomplished by adding saturated solutions at,
for example, 20°C. If required, ammonium sulfate may be removed by desalting on a Sephadex
G-25 column, for example, HiTrap Desalting 5 ml (accepts up to 1.5 ml sample) or HiPrep
Desalting 53 ml (accepts up to 15 ml sample). Up to 3 to 4 columns can be connected in series
to increase capacity. Alternatively, HIC is a convenient following purication step because it
requires the presence of ammonium sulfate.
Screening of concentration of ammonium sulfate that begins to precipitate the target
protein should preferably be established by following the above procedure in small scale.
If desired, the protocol could be reduced to a single ammonium sulfate addition step, by
adjusting the percentage saturation to precipitate the target molecule or to precipitate
contaminants.
If the pellet is not solid, increase centrifugation g-value or time, or reduce the presence
of DNA by adding nucleases during the extraction.
The quantity of ammonium sulfate required to reach a given degrees of saturation
varies according to temperature. See Dawson, R.M.C., et al., Data for Biochemical Research
(3rd ed.), p. 537. Oxford Science Publications, Clarendon Press, Oxford (1986).

8/22/2019 Purificação de Proteínas - Estratégias, handbook
http://slidepdf.com/reader/full/purificacao-de-proteinas-estrategias-handbook 144/167
142 28-9833-31 AA
TableA2.1. Amount ammonium sulfate to be added to obtain a certain percentage saturation at 0°C
Initialconcentrationoammoniumsulate(percentagesaturationat0ºC)
Percentagesaturationat0ºC
20 25 30 35 40 45 50 55 60 65 70 75 80 85 90 95 100
Solidammoniumsulate(g)tobeaddedto1Losolution
0 106 134 164 194 226 258 291 326 361 398 436 476 516 559 603 650 697
5 79 108 137 166 197 229 262 296 331 368 405 444 484 526 570 615 662
10 53 81 109 139 169 200 233 266 301 337 374 412 452 493 536 581 627
15 26 54 82 111 141 172 204 237 271 306 343 381 420 460 503 547 592
20 0 27 55 83 113 143 175 207 241 276 312 349 387 427 469 512 557
25 0 27 56 84 115 146 179 211 245 280 317 355 395 436 478 522
30 0 28 56 86 117 148 181 214 249 285 323 362 402 445 488
35 0 28 57 87 118 151 184 218 254 291 239 369 410 453
40 0 29 58 89 120 153 187 222 258 296 335 376 418
45 0 29 59 90 123 156 190 226 263 302 342 383
50 0 30 60 92 125 159 194 230 268 308 348
55 0 30 61 93 127 161 197 235 273 313
60 0 31 62 95 129 164 201 239 279
65 0 31 63 97 134 168 205 244
70 0 32 65 99 134 171 209
75 0 32 66 101 137 174
80 0 33 67 103 139
85 0 34 68 105
90 0 34 70
95 0 35
100 0
Data adopted from Englard, S. and Seifter S. Precipitation techniques. Methods Enzymol. 182, 285–300 (1990)

8/22/2019 Purificação de Proteínas - Estratégias, handbook
http://slidepdf.com/reader/full/purificacao-de-proteinas-estrategias-handbook 145/167
28-9833-31 AA 143
Appendix 3Column packing and preparation
Efcient column packing is essential for a good separation, especially when using gradient
elution. A poorly packed column gives rise to poor and uneven ow, peak broadening, and loss
of resolution. Prepacked columns from GE Healthcare will ensure reproducible results and the
highest performance.
Use small prepacked columns or 96-well lter plates (MultiTrap platform) for
chromatography media screening and method optimization to increase efciency in
method development.
If column packing is required, the following guidelines will apply at all scales of operation:
• When using a binding technique, use short, wide columns (typically 5 to 20 cm bed height)
for rapid purication, even with low linear ow.
• The amount of chromatography medium required will depend on the binding capacityof the medium and the amount of sample. The binding capacity is always signicantly
inuenced by the nature of the sample as well as the medium itself and must be determined
empirically. Estimate the amount of chromatography medium required to bind the sample
of interest and use ve times this amount to pack the column. The required amount can be
reduced if resolution is satisfactory.
• Once separation parameters have been determined, scale up a purication by increasing
the diameter of the column to increase column volume. Avoid increasing the length of the
column as this will alter separation conditions.
Afnity media for protein purication can be packed in either Tricorn, XK, or HiScale columnsavailable from GE Healthcare. A step-by-step demonstration of column packing in Tricorn or
XK columns can be seen in “Column Packing — The Movie”, available in CD format (see
Ordering information).
HiScale columns offer axial compression of the gel beds, making them well-suited for
packing rigid chromatography media. See HiScale packing instructions for more information.
FigA3.1.“Column Packing — The Movie” provides a step-by-step demonstration of column packing.

8/22/2019 Purificação de Proteínas - Estratégias, handbook
http://slidepdf.com/reader/full/purificacao-de-proteinas-estrategias-handbook 146/167
144 28-9833-31 AA
1. Equilibrate all materials to the temperature at which the separation will be performed.
2. Eliminate air by ushing column end pieces with the recommended buffer. Ensure that
no air is trapped under the column net . Close column outlet leaving 1 to 2 cm of buffer
in the column.
3. Gently resuspend the medium.
Avoid using magnetic stirrers because they may damage the matrix.
4. Estimate the amount of slurry (resuspended medium) required on the basis of the
recommendations supplied in the instruction manual.
5. Pour the required volume of slurry into the column. Pouring down a glass rod held
against the wall of the column will minimize the introduction of air bubbles.
6. Fill the column with buffer immediately.
7. Mount the column top piece and connect to a pump.
8. Open the column outlet and set the pump to the desired ow rate (for example,
15 ml/min in an XK 16/20 column).
When the slurry volume is greater than the total volume of the column, connect a second
glass column to act as a reservoir or a packing reservoir (see Ordering information for
details). This ensures that the slurry has a constant diameter during packing, minimizing
turbulence and improving column packing conditions.
If the recommended ow rate cannot be obtained, use the maximum ow rate the pump
can deliver.
Do not exceed the maximum operating pressure of the medium or column.
9. Maintain the packing ow rate for at least 3 column volumes after a constant bed height
has been obtained. Mark the bed height on the column.
Do not exceed 75% of the packing ow rate during any purication.
10. Stop the pump and close the column outlet. Remove the top piece and carefully ll the
rest of the column with buffer to form a convex surface at the top.
11. Insert the adapter into the column at an angle, ensuring that no air is trapped under the net.
12. Slide the adapter slowly down the column (the outlet of the adapter should be open) untilthe mark is reached. Lock the adapter in position.
13. Connect the column to the pump and begin equilibration. Reposition the adapter if
necessary.
The chromatography medium must be thoroughly washed to remove the storage solution,
usually 20% ethanol. Residual ethanol may interfere with subsequent procedures.
Always follow the specic storage instructions supplied with the product.

8/22/2019 Purificação de Proteínas - Estratégias, handbook
http://slidepdf.com/reader/full/purificacao-de-proteinas-estrategias-handbook 147/167
28-9833-31 AA 145
Column selectionTricorn, XK, and HiScale columns are compatible with the high ow rates allowed with modern
chromatography media, and a broad range of column dimensions are available (see Table A3.1).
In most cases the binding capacity of the medium and the amount of sample to be puried will
determine the column size required. Also, Empty Disposable PD-10 Columns are available for
applications using gravity ow. For a complete listing of available columns, refer to
www.gelifesciences.com/protein-purication.
TableA3.1. Column bed volumes and heights1
Columnsize
i.d.(mm) Length(cm) Bedvolume(ml) Bedheight(cm)
Tricorn 5/20 5 2 0.31–0.55 1.6–2.8
Tricorn 5/50 5 5 0.90–1.14 4.6–5.8
Tricorn 10/20 10 2 1.26–2.20 1.6–2.8
Tricorn 10/50 10 5 3.61–4.56 4.6–5.8
Tricorn 10/100 10 10 7.54–8.48 9.6–10.8HiScale 16/20 16 20 0-40 0-20
HiScale 16/40 16 40 16-80 8-40
HiScale 26/20 26 20 0-106 0-20
HiScale 26/40 26 40 69-212 13-40
HiScale 50/20 50 20 0-393 0-20
HiScale 50/40 50 40 297-785 14-40
XK 16/20 16 20 5–31 2.5–15.0
XK 16/40 16 40 45–70 22.5–35
XK 26/20 26 18 5.3–66 1–12.5
XK 26/40 26 40 122–186 23–35
XK 50/20 50 18 0–274 0–14
XK 50/30 50 30 265–559 13.5–28.5
Empty Disposable PD-102 15 7.4 8.3 4.8–5.0
1 All column specications apply when one adapter is used (not applicable for PD-10)
2 For gravity-ow applications. Together with LabMate™ Buffer Reservoir (see Ordering information), up to 25 ml of buffer and/or sample can be applied, which reduces handling time considerably

8/22/2019 Purificação de Proteínas - Estratégias, handbook
http://slidepdf.com/reader/full/purificacao-de-proteinas-estrategias-handbook 148/167
146 28-9833-31 AA
Determination of column efciency—control of packing qualityColumn efciency is expressed as the number of theoretical plates per meter of chromatography
bed (N) or as H (height equivalent to a theoretical plate, HETP), which is the bed length (L) divided
by the plate number. Since column efciency is related to the peak broadening that can occur on
a column, it can be calculated from the expression:
N = 5.54 ×
( )
2VR
wh
VR
= volume eluted from the start of sample application to the peak maximum
wh
= peak width measured as the width of the recorded peak at half of the peak height
H is calculated from the expression:
H =L
N
L = height of packed bed
Measurements of VR
and wh
can be made in distance (mm) or volume (ml) but both
parameters must be expressed in the same unit.
The asymmetry factor, As, is calculated from the expression:
As=b/a
where a = rst half peak width at 10% peak height, and b = second half peak width at 10% peak height.
Column performance should be checked at regular intervals by injecting acetone to determine
column efciency (N) and peak shape (asymmetry factor, As). Because the observed value
for N depends on experimental factors such as ow rate and sample loading, comparisons
must be made under identical conditions. Efciency is measured under isocratic conditions by
injecting a substance that can be detected in the owthrough but that does not interact with
the chromatography medium, for example, acetone or NaCl, depending on the medium, and
measuring the eluted peak as shown in Figure A3.2.
VR
50%
wh
Volume
Absorbance
FigA3.2.Measurement of efciency and asymmetry.

8/22/2019 Purificação de Proteínas - Estratégias, handbook
http://slidepdf.com/reader/full/purificacao-de-proteinas-estrategias-handbook 149/167
28-9833-31 AA 147
Appendix 4Protein determination by absorbancemeasurements
Proteins generally have UV absorbance maxima at 190 nm caused by the peptide bonds and at
280 nm caused by the aromatic amino acids Trp and Tyr. Protein structure (secondary, tertiary,
and quaternary structure) and solution conditions (e.g., pH and ionic strength) may affect the
absorbance spectrum. Coenzymes and cofactors may introduce additional absorbance at
other wavelengths.
The absorbance is proportional to the protein concentration, c:
A = c × E × l
where A = absorbance, E = absorbance coefcient, and l = path length of the cuvette in
cm. E varies greatly for different proteins. Absorbance at 280 nm (A280) is typically used forconcentration determination.
Some proteins, however, lack Trp and Tyr amino acid residues and therefore do not give
absorbance at 280 nm. For these proteins, measurement can be made at 205 nm (absorbance
from peptide bonds). This value is used instead of the maximum at 190 nm because various
technical limitations may be introduced at this low wavelength. In addition to peptide bonds
some amino acid side chains also contribute to absorbance at 205 nm. For a detailed protocol,
refer to Current Protocols in Protein Science, Unit 3.1 (Spectrophotometric Determination of
Protein Concentration), John Wiley and Sons, Inc. (date varies, as it is updated regularly).
Absorbance measurementsAbsorbance should be measured within the linear range of the absorbance photometer. Keeping
the values between 0.2 and 1.0 is recommended, but absorbance values of up to 1.5 to 2 can
sometimes be used (see the manual for the instrument used). If higher values are obtained, dilute
the sample. A quartz cuvette, or a plastic cuvette or multiwell plates made for UV measurement,
should be used. Remember to correct for the pathlength of the cuvette. Fill enough sample to
cover the light path.
1. Prepare the instrument. Warming up may take some time.
2. Measure A280
for the buffer used (blank).
3. Measure A280
for the protein sample. If the value is above the limit for the instrument, dilute
the sample.
4. For correction of light scattering contribution at A280
, also measure A330
for the protein
sample and correct as described on the following page.
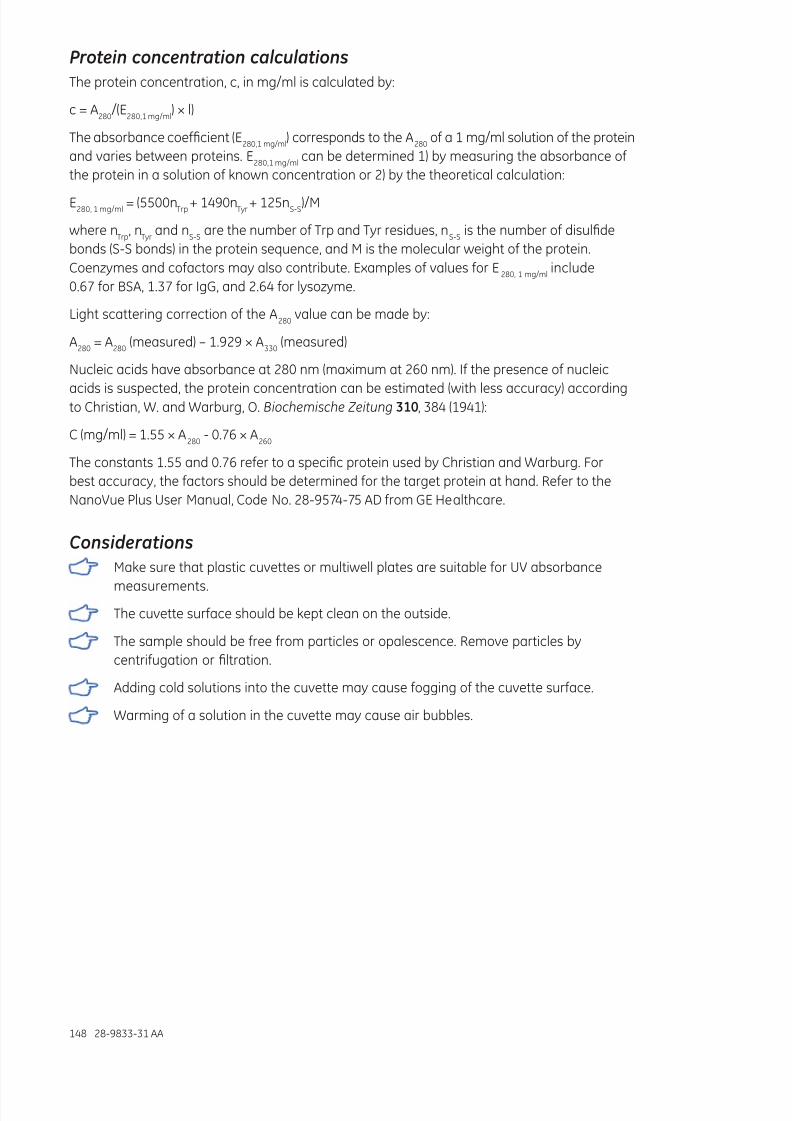
8/22/2019 Purificação de Proteínas - Estratégias, handbook
http://slidepdf.com/reader/full/purificacao-de-proteinas-estrategias-handbook 150/167
148 28-9833-31 AA
Protein concentration calculationsThe protein concentration, c, in mg/ml is calculated by:
c = A280
/(E280,1 mg/ml
) × l)
The absorbance coefcient (E280,1 mg/ml
) corresponds to the A280
of a 1 mg/ml solution of the protein
and varies between proteins. E280,1 mg/ml
can be determined 1) by measuring the absorbance of
the protein in a solution of known concentration or 2) by the theoretical calculation:
E280, 1 mg/ml
= (5500nTrp
+ 1490nTyr
+ 125nS-S
)/M
where nTrp
, nTyr
and nS-S
are the number of Trp and Tyr residues, nS-S
is the number of disulde
bonds (S-S bonds) in the protein sequence, and M is the molecular weight of the protein.
Coenzymes and cofactors may also contribute. Examples of values for E280, 1 mg/ml
include
0.67 for BSA, 1.37 for IgG, and 2.64 for lysozyme.
Light scattering correction of the A280
value can be made by:
A280
= A280
(measured) – 1.929 × A330
(measured)
Nucleic acids have absorbance at 280 nm (maximum at 260 nm). If the presence of nucleicacids is suspected, the protein concentration can be estimated (with less accuracy) according
to Christian, W. and Warburg, O. Biochemische Zeitung 310, 384 (1941):
C (mg/ml) = 1.55 × A280
- 0.76 × A260
The constants 1.55 and 0.76 refer to a specic protein used by Christian and Warburg. For
best accuracy, the factors should be determined for the target protein at hand. Refer to the
NanoVue Plus User Manual, Code No. 28-9574-75 AD from GE Healthcare.
Considerations
Make sure that plastic cuvettes or multiwell plates are suitable for UV absorbancemeasurements.
The cuvette surface should be kept clean on the outside.
The sample should be free from particles or opalescence. Remove particles by
centrifugation or ltration.
Adding cold solutions into the cuvette may cause fogging of the cuvette surface.
Warming of a solution in the cuvette may cause air bubbles.

8/22/2019 Purificação de Proteínas - Estratégias, handbook
http://slidepdf.com/reader/full/purificacao-de-proteinas-estrategias-handbook 151/167
28-9833-31 AA 149
Appendix 5Converting from linear ow (cm/h) tovolumetric ow rates (ml/min) and vice versa
It is convenient when comparing results for columns of different sizes to express ow as linear
ow rate (cm/h). However, ow is usually measured in volumetric ow rate (ml/min). To convert
between linear ow and volumetric ow rate use one of the formulas below:
Fromlinearow(cm/h)tovolumetricowrate(ml/min)
Volumetric flow rate (ml/min) =Linear flow (cm/h)
× column cross sectional area (cm2)60
=Y
x π × d2
60 4
where
Y = linear ow in cm/h
d = column inner diameter in cm
Example:
What is the volumetric ow rate in an XK 16/70 column (i.d. 1.6 cm) when the linear ow is 150 cm/h?
Y = linear ow = 150 cm/h
d = inner diameter of the column = 1.6 cm
Volumetric flow rate =150 × π × 1.6 × 1.6 ml/min
60 × 4
= 5.03 ml/min
Fromvolumetricowrate(ml/min)tolinearow(cm/hour)
Linear flow (cm/h) =Volumetric flow rate (ml/min) × 60
column cross sectional area (cm2)
= Z × 60 ×4
π × d2
where
Z = volumetric ow rate in ml/min
d = column inner diameter in cm
Example:
What is the linear ow in a Tricorn 5/50 column (i.d. 0.5 cm) when the volumetric ow rate is
1 ml/min?
Z = Volumetric ow rate = 1 ml/min
d = column inner diameter = 0.5 cm
Linear flow (cm/h) = 1 × 60 ×4
cm/hπ × 0.5 × 0.5
= 305.6 cm/h
Fromml/mintousingasyringe1 ml/min = approximately 30 drops/min on a HiTrap 1 ml column
5 ml/min = approximately 120 drops/min on a HiTrap 5 ml column

8/22/2019 Purificação de Proteínas - Estratégias, handbook
http://slidepdf.com/reader/full/purificacao-de-proteinas-estrategias-handbook 152/167
150 28-9833-31 AA
Appendix 6Amino acid data
Three-letter Single-letterAmino acid code code Structure
Alanine Ala A
Arginine Arg R
Asparagine Asn N
Aspartic Acid Asp D
Cysteine Cys C
Glutamic Acid Glu E
Glutamine Gln Q
Glycine Gly G
Histidine His H
Isoleucine Ile I
Leucine Leu L
Lysine Lys K
Methionine Met M
Phenylalanine Phe F
Proline Pro P
Serine Ser S
Threonine Thr T
Tryptophan Trp W
Tyrosine Tyr Y
Valine Val V
CH3
HOOC
H2N
HOOC
H2N
HOOC
H2N
HOOC
H2N
HOOC
H2N
HOOC
H2N
HOOC
H2N
HOOC
H2N
HOOC
H2N
HOOC
H2N
HOOC
H2N
HOOC
H2N
HOOC
H2N
HOOC
H2N
HOOC
HOOC
H2N
CH2CH
2CH
2NHC
NH2
NH
CH2CONH
2
CH2COOH
CH2SH
CH2CH
2COOH
CH2CH
2CONH
2
H
CH2
CH(CH3)CH
2CH
3
CH2CH
CH3
CH3
CH2CH
2CH
2CH
2NH
2
CH2CH
2SCH
3
CH2
HOOC
H2N
HOOC
H2N
HOOC
H2N
CH2OH
CHCH3
OH
CH2
CH(CH3)2
HOOC
H2N
OHCH2
NH
NH
N
NH

8/22/2019 Purificação de Proteínas - Estratégias, handbook
http://slidepdf.com/reader/full/purificacao-de-proteinas-estrategias-handbook 153/167
28-9833-31 AA 151
Middle unitresidue (-H
20) Charge at Hydrophobic Uncharged Hydrophilic
Formula Mr
Formula Mr
pH 6.0–7.0 (nonpolar) (polar) (polar)
C3H7NO2 89.1 C3H5NO 71.1 Neutral
C6H
14N
4O
2174.2 C
6H
12N
4O 156.2 Basic (+ve)
C4H
8N
2O
3132.1 C
4H
6N
2O
2114.1 Neutral
C4H
7NO
4133.1 C
4H
5NO
3115.1 Acidic (-ve)
C3H
7NO
2S 121.2 C
3H
5NOS 103.2 Neutral
C5H
9NO
4147.1 C
5H
7NO
3129.1 Acidic (-ve)
C5H
10N
2O
3146.1 C
5H
8N
2O
2128.1 Neutral
C2H
5NO
275.1 C
2H
3NO 57.1 Neutral
C6H
9N
3O
2155.2 C6H
7N
3O 137.2 Basic (+ve)
C6H
13NO
2131.2 C
6H
11NO 113.2 Neutral
C6H
13NO
2131.2 C
6H
11NO 113.2 Neutral
C6H
14N
2O
2146.2 C
6H
12N
2O 128.2 Basic (+ve)
C5H
11NO
2S 149.2 C
5H
9NOS 131.2 Neutral
C9H
11NO
2165.2 C
9H
9NO 147.2 Neutral
C5H
9NO
2115.1 C
5H
7NO 97.1 Neutral
C3H
7NO
3105.1 C
3H
5NO
287.1 Neutral
C4H
9NO
3119.1 C
4H
7NO
2101.1 Neutral
C11
H12
N2O
2204.2 C
11H
10N
2O 186.2 Neutral
C9H
11NO
3181.2 C
9H
9NO
2163.2 Neutral
C5
H11
NO2
117.1 C5
H9
NO 99.1 Neutral

8/22/2019 Purificação de Proteínas - Estratégias, handbook
http://slidepdf.com/reader/full/purificacao-de-proteinas-estrategias-handbook 154/167
152 28-9833-31 AA
Product index*
AfnitychromatographyPurication of immunoglobulins
HiTrap Protein G HP 19, 35, 111-112MAbTrap Kit 19
Protein G HP SpinTrap/MultiTrap 74Protein G Mag Sepharose/Mag Sepharose Xtra 74HiTrap MabSelect, MabSelect SuRe,and MabSelect Xtra 19HiTrap rProtein A FF/HP 19Ab SpinTrap 74Protein A HP SpinTrap/MultiTrap 74Protein A Mag Sepharose/Mag Sepharose Xtra 74HiScreen MabSelect, MabSelect SuRe,and MabSelect Xtra 19rProtein A Sepharose Fast Flow 42HiTrap IgY Purication HP/IgM Purication HP 19
Purication of recombinant proteinsHisTrap FF crude/crude Kit 19, 84, 117-118HisTrap FF and FF 16/10 19, 84-85, 121, 124HisTrap HP 19, 99, 114-115His GraviTrap/SpinTrap 74His MultiTrap HP/MultiTrap FF 74, 91, 123-124His Mag Sepharose Ni 74Ni Sepharose 6 Fast Flow 118-119GSTrap 4B, FF, and HP 19, 110GSTPrep FF 16/10 19GST GraviTrap/SpinTrap 74GST MultiTrap FF/4B 74MBPTrap HP 19, 110-111
StrepTrap HP 19Group-specic puricationHiTrap Blue HP/Chelating HP 19HiTrap IMAC HP/IMAC FF 19Streptavidin HP SpinTrap/MultiTrap 74HiTrap Streptavidin HP 19HiTrap Heparin HP and FF 16/10 19HiTrap Benzamidine FF (high sub) 19TiO
2Mag Sepharose 19,74
Phos SpinTrap Fe 74
Other afnity puricationHiTrap NHS-activated HP 19
Protein G/Protein A Mag Sepharose 74Immunoprecipitation Starter Pack 74Albumin and IgG Depletion SpinTrap 74NHS HP SpinTrap 74NHS Mag Sepharose 74
Ion exchange chromatographyHiTrap IEX Selection Kit 50, 112HiTrap Capto IEX Selection Kit 50HiPrep Q XL 16/10 113Mono Q 5/50 GL 49, 104Mono Q HR 5/5 103-104Mono Q PC 1.6/5 116-117
Mono S 5/50 GL 45Mono S HR 10/10 103-104Q Sepharose FF/HP 49SOURCE Q/RESOURCE Q 49, 114-115
GelfltrationSuperdex 200 5/150 GL 105, 118-119Superdex 200 10/300 GL 101, 134HiLoad 16/60 Superdex 200 pg 110-112, 117-118Superdex 75 5/150 GL 99, 102Superdex 75 10/300 GL 36, 101-102HiLoad 16/60 Superdex 75 pg 113-115Superdex 75 prep grade 45Superdex Peptide PC 3.2/30 116-117
Desalting,buerexchange,andconcentrationHiTrap Desalting 33, 342× and 3× HiTrap Desalting 33HiPrep 26/10 Desalting 33, 114-1152×, 3×, and 4× HiPrep 26/10 33PD-10 Desalting columns 33
PD MiniTrap/MidiTrap G-25 33PD SpinTrap/MultiTrap G-25 33PD MultiTrap G-25 33PD SpinTrap/MultiTrap G-10 33Vivaspin 37-38
HydrophobicinteractionchromatographyHiTrap HIC Selection Kit 50RESOURCE HIC Test Kits 50, 113SOURCE 15ISO 113XK 16/20 Butyl Sepharose 4 Fast Flow 43
Purifcationormats
Manual purication formatsHiTrap 75SpinTrap 75MicroSpin 76GraviTrap 76MultiTrap 76PreDictor 77, 125-127Mag Sepharose 77
Automated purication usingchromatography systemsÄKTA designchromatography systems 74, 78, 89, 109ÄKTAprime plus 35, 79, 84, 111ÄKTApurier 79, 84ÄKTAxpress 80, 84, 114-115ÄKTA avant 80, 84, 126, 136, 138ÄKTA micro 80, 84, 116-117
Columns for ÄKTA design systemsPrepacked columns 81RESOURCE 81Precision 81HiTrap 82HiScreen 82HiPrep 82HiLoad 82
Tricorn 83Empty columns 83Tricorn columns 83, 143-145XK columns 83, 143-145HiScale columns 84, 143-145
* Bold page numbers indicate main entry for product(s).

8/22/2019 Purificação de Proteínas - Estratégias, handbook
http://slidepdf.com/reader/full/purificacao-de-proteinas-estrategias-handbook 155/167
28-9833-31 AA 153
Related literature
Codeno.
Handbooks
Afnity Chromatography: Principles and Methods 18-1022-29
Antibody Purication: Principles and Methods 18-1037-46
Gel Filtration: Principles and Methods 18-1022-18
Hydrophobic Interaction and Reversed Phase Chromatography: Principles and Methods 11-0012-69
Ion Exchange Chromatography and Chromatofocusing: Principles and Methods 11-0004-21
Recombinant Protein Purication Handbook: Principles and Methods 18-1142-75
GST Gene Fusion System 18-1157-58
Purifying Challenging Proteins 28-9095-31
Cell Separation Media: Methodology and applications 18-1115-69
High-throughput Process Development with PreDictor Plates: Principles and Methods 28-9403-58
Isolation of mononuclear cells: Methodology and applications 18-1152-69
Microcarrier Cell Culture: Principles and Methods 18-1140-62
2-D Electrophoresis using immobilized pH gradients: Principles and Methods 80-6429-60
Nucleic Acid Sample Preparation for Downstream Analyses: Principles and Methods 28-9624-00
Electrophoresis in Practice; Westermeier, R., Wiley-VCH Verlag GmbH, Weinheim (2001) 18-1124-59
SelectionguidesSelection guides can be a great help in planning purications, for the novice as wellas the more experienced worker.
Prepacked chromatography columns for ÄKTA design systems 28-9317-78Ni Sepharose and IMAC Sepharose 28-4070-92
Glutathione Sepharose—total solutions for preparation of GST-tagged proteins 28-9168-33
Afnity chromatography columns and media 18-1121-86
Gel ltration columns and media 18-1124-19
Ion exchange columns and media 18-1127-31
Sample preparation for analysis of proteins, peptides, and carbohydrates—desalting,buffer exchange, cleanup, concentration
18-1128-62
Protein and nucleic acid sample prep—get it right from the start 28-9320-93
Note: Interactive selection guides available at www.gelifesciences.com/protein-purication
BrochuresYears of experience in every column 28-9090-94
Pure simplicity for tagged proteins 28-9353-64
CDs
Column Packing CD—The Movie 18-1165-33
Dataflesandapplicationnotes
Refer to www.gelifesciences.com/protein-purication

8/22/2019 Purificação de Proteínas - Estratégias, handbook
http://slidepdf.com/reader/full/purificacao-de-proteinas-estrategias-handbook 156/167
154 28-9833-31 AA
Ordering information
Afnitychromatography
Column Quantity Codeno.
HiTrap NHS-activated HP 5 × 1 ml 17-0716-01
HiTrap NHS-activated HP 1 × 5 ml 17-0717-01
NHS HP SpinTrap 5 ml medium and24 empty spin columns
28-9031-28
NHS Mag Sepharose 1 × 500 μl 28-9440-09
NHS Mag Sepharose 4 × 500 μl 28-9514-80
HiTrap rProtein A FF 2 × 1 ml 17-5079-02
HiTrap rProtein A FF 5 × 1 ml 17-5079-01
HiTrap rProtein A FF 1 × 5 ml 17-5080-01
HiTrap rProtein A FF 5 × 5 ml 17-5080-02
HiTrap Protein A HP 2 × 1 ml 17-0402-03
HiTrap Protein A HP 5 × 1 ml 17-0402-01
HiTrap Protein A HP 1 × 5 ml 17-0403-01
HiTrap Protein A HP 5 × 5 ml 17-0403-03
Protein A HP SpinTrap 16 spin columns 28-9031-32
Protein A HP MultiTrap 4 × 96-well plates 28-9031-33
Protein A Mag Sepharose 1 × 500 μl 28-9440-06
Protein A Mag Sepharose 4 × 500 μl 28-9513-78
Protein A Mag Sepharose Xtra 2 × 1 ml 28-9670-56
Protein A Mag Sepharose Xtra 5 × 1 ml 28-9670-62
HiTrap Protein G HP 2 × 1 ml 17-0404-03
HiTrap Protein G HP 5 × 1 ml 17-0404-01
HiTrap Protein G HP 1 × 5 ml 17-0405-01
HiTrap Protein G HP 5 × 5 ml 17-0405-03
Protein G HP SpinTrap 16 spin columns 28-9031-34
Protein G HP MultiTrap 4 × 96-well plates 28-9031-35
Protein G Mag Sepharose 1 × 500 μl 28-9440-08
Protein G Mag Sepharose 4 × 500 μl 28-9513-79Protein G Mag Sepharose Xtra 2 × 1 ml 28-9670-66
Protein G Mag Sepharose Xtra 5 × 1 ml 28-9670-70
HiTrap MabSelect 5 × 1 ml 28-4082-53
HiTrap MabSelect 1 × 5 ml 28-4082-55
HiTrap MabSelect 5 × 5 ml 28-4082-56
HiTrap MabSelect Xtra 5 × 1 ml 28-4082-58
HiTrap MabSelect Xtra 1 × 5 ml 28-4082-60
HiTrap MabSelect Xtra 5 × 5 ml 28-4082-61
HiTrap MabSelect SuRe 5 × 1 ml 11-0034-93
HiTrap MabSelect SuRe 1 × 5 ml 11-0034-94
HiTrap MabSelect SuRe 5 × 5 ml 11-0034-95
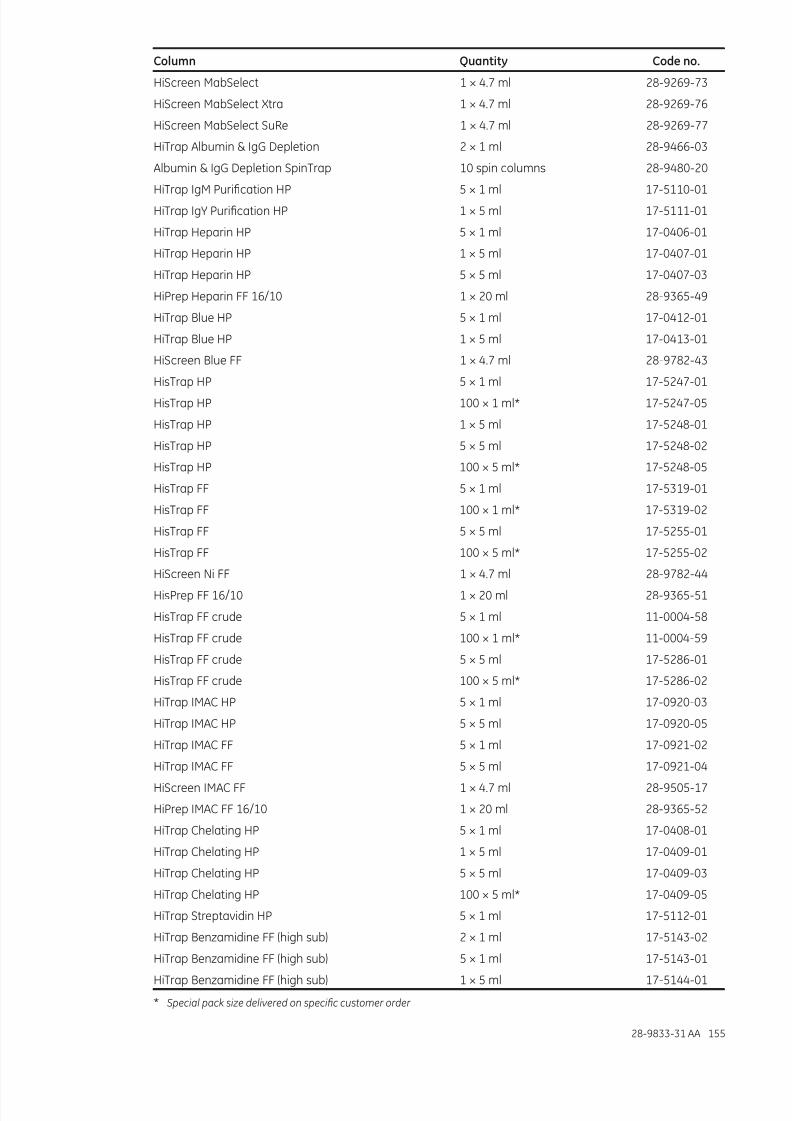
8/22/2019 Purificação de Proteínas - Estratégias, handbook
http://slidepdf.com/reader/full/purificacao-de-proteinas-estrategias-handbook 157/167
28-9833-31 AA 155
Column Quantity Codeno.
HiScreen MabSelect 1 × 4.7 ml 28-9269-73
HiScreen MabSelect Xtra 1 × 4.7 ml 28-9269-76
HiScreen MabSelect SuRe 1 × 4.7 ml 28-9269-77
HiTrap Albumin & IgG Depletion 2 × 1 ml 28-9466-03
Albumin & IgG Depletion SpinTrap 10 spin columns 28-9480-20
HiTrap IgM Purication HP 5 × 1 ml 17-5110-01HiTrap IgY Purication HP 1 × 5 ml 17-5111-01
HiTrap Heparin HP 5 × 1 ml 17-0406-01
HiTrap Heparin HP 1 × 5 ml 17-0407-01
HiTrap Heparin HP 5 × 5 ml 17-0407-03
HiPrep Heparin FF 16/10 1 × 20 ml 28-9365-49
HiTrap Blue HP 5 × 1 ml 17-0412-01
HiTrap Blue HP 1 × 5 ml 17-0413-01
HiScreen Blue FF 1 × 4.7 ml 28-9782-43
HisTrap HP 5 × 1 ml 17-5247-01
HisTrap HP 100 × 1 ml* 17-5247-05
HisTrap HP 1 × 5 ml 17-5248-01
HisTrap HP 5 × 5 ml 17-5248-02
HisTrap HP 100 × 5 ml* 17-5248-05
HisTrap FF 5 × 1 ml 17-5319-01
HisTrap FF 100 × 1 ml* 17-5319-02
HisTrap FF 5 × 5 ml 17-5255-01
HisTrap FF 100 × 5 ml* 17-5255-02
HiScreen Ni FF 1 × 4.7 ml 28-9782-44
HisPrep FF 16/10 1 × 20 ml 28-9365-51
HisTrap FF crude 5 × 1 ml 11-0004-58
HisTrap FF crude 100 × 1 ml* 11-0004-59
HisTrap FF crude 5 × 5 ml 17-5286-01
HisTrap FF crude 100 × 5 ml* 17-5286-02
HiTrap IMAC HP 5 × 1 ml 17-0920-03
HiTrap IMAC HP 5 × 5 ml 17-0920-05
HiTrap IMAC FF 5 × 1 ml 17-0921-02
HiTrap IMAC FF 5 × 5 ml 17-0921-04
HiScreen IMAC FF 1 × 4.7 ml 28-9505-17
HiPrep IMAC FF 16/10 1 × 20 ml 28-9365-52
HiTrap Chelating HP 5 × 1 ml 17-0408-01
HiTrap Chelating HP 1 × 5 ml 17-0409-01
HiTrap Chelating HP 5 × 5 ml 17-0409-03
HiTrap Chelating HP 100 × 5 ml* 17-0409-05
HiTrap Streptavidin HP 5 × 1 ml 17-5112-01
HiTrap Benzamidine FF (high sub) 2 × 1 ml 17-5143-02HiTrap Benzamidine FF (high sub) 5 × 1 ml 17-5143-01
HiTrap Benzamidine FF (high sub) 1 × 5 ml 17-5144-01
* Special pack size delivered on specic customer order

8/22/2019 Purificação de Proteínas - Estratégias, handbook
http://slidepdf.com/reader/full/purificacao-de-proteinas-estrategias-handbook 158/167
156 28-9833-31 AA
Column Quantity Codeno.
GSTrap HP 5 × 1 ml 17-5281-01
GSTrap HP 100 × 1 ml* 17-5281-05
GSTrap HP 1 × 5 ml 17-5282-01
GSTrap HP 5 × 5 ml 17-5282-02
GSTrap HP 100 × 5 ml* 17-5282-05
GSTrap FF 2 × 1 ml 17-5130-02GSTrap FF 5 × 1 ml 17-5130-01
GSTrap FF 100 × 1 ml* 17-5130-05
GSTrap FF 1 × 5 ml 17-5131-01
GSTrap FF 5 × 5 ml 17-5131-02
GSTrap FF 100 × 5 ml* 17-5131-05
GSTrap 4B 5 × 1 ml 28-4017-45
GSTrap 4B 100 × 1 ml* 28-4017-46
GSTrap 4B 1 × 5 ml 28-4017-47
GSTrap 4B 5 × 5 ml 28-4017-48GSTrap 4B 100 × 5 ml* 28-4017-49
GSTPrep FF 16/10 1 × 20 ml 28-9365-50
StrepTrap HP 5 × 1 ml 28-9075-46
StrepTrap HP 1 × 5 ml 28-9075-47
StrepTrap HP 5 × 5 ml 28-9075-48
MBPTrap HP 5 × 1 ml 28-9187-78
MBPTrap HP 1 × 5 ml 28-9187-79
MBPTrap HP 5 × 5 ml 28-9187-80
Ionexchangechromatography
Mini Q PC 3.2/3 1 × 0.24 ml 17-0686-01
Mini Q 4.6/50 PE 1 × 0.8 ml 17-5177-01
Mini S PC 3.2/3 1 × 0.24 ml 17-0687-01
Mini S 4.6/50 PE 1 × 0.8 ml 17-5178-01
Mono Q PC 1.6/5 1 × 0.10 ml 17-0671-01
Mono Q 5/50 GL 1 × 1 ml 17-5166-01
Mono Q 4.6/100 PE 1 × 1.7 ml 17-5179-01
Mono Q 10/100 GL 1 × 8 ml 17-5167-01
Mono Q HR 16/10 1 × 20 ml 17-0506-01
Mono S PC 1.6/5 1 × 0.10 ml 17-0672-01
Mono S 5/50 GL 1 × 1 ml 17-5168-01
Mono S 4.6/100 PE 1 × 1.7 ml 17-5180-01
Mono S 10/100 GL 1 × 8 ml 17-5169-01
Mono S HR 16/10 1 × 20 ml 17-0507-01
Mono P 5/50 GL 1 × 1 ml 17-5170-01
Mono P 5/200 GL 1 × 4 ml 17-5171-01
SOURCE 15Q 4.6/100 PE 1 × 1.7 ml 17-5181-01
SOURCE 15S 4.6/100 PE 1 × 1.7 ml 17-5182-01
* Special pack size delivered on specic customer order

8/22/2019 Purificação de Proteínas - Estratégias, handbook
http://slidepdf.com/reader/full/purificacao-de-proteinas-estrategias-handbook 159/167
28-9833-31 AA 157
Column Quantity Codeno.
RESOURCE Q, 1 ml 1 × 1 ml 17-1177-01
RESOURCE Q, 6 ml 1 × 6 ml 17-1179-01
RESOURCE S, 1 ml 1 × 1 ml 17-1178-01
RESOURCE S, 6 ml 1 × 6 ml 17-1180-01
HiTrap IEX Selection Kit 7 × 1 ml 17-6002-33
HiTrap SP HP 5 × 1 ml 17-1151-01
HiTrap SP HP 5 × 5 ml 17-1152-01
HiScreen SP HP 1 × 4.7 ml 28-9505-15
HiLoad 16/10 SP Sepharose HP 1 × 20 ml 17-1137-01
HiLoad 26/10 SP Sepharose HP 1 × 53 ml 17-1138-01
HiTrap Q HP 5 × 1 ml 17-1153-01
HiTrap Q HP 5 × 5 ml 17-1154-01
HiScreen Q HP 1 × 4.7 ml 28-9505-11
HiLoad 16/10 Q Sepharose HP 1 × 20 ml 17-1064-01
HiLoad 26/10 Q Sepharose HP 1 × 53 ml 17-1066-01
HiTrap DEAE FF 5 × 1 ml 17-5055-01
HiTrap DEAE FF 5 × 5 ml 17-5154-01
HiScreen Capto DEAE 1 × 4.7 ml 28-9269-82
HiPrep DEAE FF 16/10 1 × 20 ml 28-9365-41
HiScreen Q HP 1 × 4.7 ml 28-9505-11
HiLoad 16/10 Q Sepharose HP 1 × 20 ml 17-1064-01
HiLoad 26/10 Q Sepharose HP 1 × 53 ml 17-1066-01
HiTrap CM FF 5 × 1 ml 17-5056-01
HiTrap CM FF 5 × 5 ml 17-5155-01
HiPrep CM FF 16/10 1 × 20 ml 28-9365-42
HiTrap Q FF 5 × 1 ml 17-5053-01
HiTrap Q FF 5 × 5 ml 17-5156-01
HiScreen Q FF 1 × 4.7 ml 28-9505-10
HiPrep Q FF 16/10 1 × 20 ml 28-9365-43
HiTrap SP FF 5 × 1 ml 17-5054-01
HiTrap SP FF 5 × 5 ml 17-5157-01
HiScreen SP FF 1 × 4.7 ml 28-9505-13
HiPrep SP FF 16/10 1 × 20 ml 28-9365-44
HiTrap ANX FF (high sub) 5 × 1 ml 17-5162-01
HiTrap ANX FF (high sub) 5 × 5 ml 17-5163-01
HiTrap Q XL 5 × 1 ml 17-5158-01
HiTrap Q XL 5 × 5 ml 17-5159-01
HiPrep Q XL 16/10 1 × 20 ml 28-9365-38
HiTrap SP XL 5 × 1 ml 17-5160-01
HiTrap SP XL 5 × 5 ml 17-5161-01HiPrep SP XL 16/10 1 × 20 ml 28-9365-40
HiTrap Capto IEX Selection Kit 5 × 1 ml 28-9343-88
HiTrap Capto Q 5 × 1 ml 11-0013-02

8/22/2019 Purificação de Proteínas - Estratégias, handbook
http://slidepdf.com/reader/full/purificacao-de-proteinas-estrategias-handbook 160/167
158 28-9833-31 AA
Column Quantity Codeno.
HiTrap Capto Q 5 × 5 ml 11-0013-03
HiScreen Capto Q 1 × 4.7 ml 28-9269-78
HiTrap Capto S 5 × 1 ml 17-5441-22
HiTrap Capto S 5 × 5 ml 17-5441-23
HiScreen Capto S 1 × 4.7 ml 28-9269-79
HiTrap Capto MMC 5 × 1 ml 11-0032-73
HiTrap Capto MMC 5 × 5 ml 11-0032-75
HiScreen Capto MMC 1 × 4.7 ml 28-9269-80
HiTrap Capto adhere 5 × 1 ml 28-4058-44
HiTrap Capto adhere 5 × 5 ml 28-4058-46
HiScreen Capto adhere 1 × 4.7 ml 28-9269-81
HiTrap Capto DEAE 5 × 1 ml 28-9165-37
HiTrap Capto DEAE 5 × 5 ml 28-9165-40
HiScreen Capto DEAE 1 × 4.7 ml 28-9269-82
Gelfltration
Superdex Peptide PC 3.2/30 1 × 2.4 ml 17-1458-01
Superdex Peptide 10/300 GL 1 × 24 ml 17-5176-01
Superdex 75 PC 3.2/30 1 × 2.4 ml 17-0771-01
Superdex 75 5/150 GL 1 × 3 ml 28-9205-04
Superdex 75 10/300 GL 1 × 24 ml 17-5174-01
Superdex 200 PC 3.2/30 1 × 2.4 ml 17-1089-01
Superdex 200 5/150 GL 1 × 3 ml 28-9065-61
Superdex 200 10/300 GL 1 × 24 ml 17-5175-01
HiLoad 16/60 Superdex 30 pg 1 × 120 ml 17-1139-01
HiLoad 26/60 Superdex 30 pg 1 × 320 ml 17-1140-01
HiLoad 16/60 Superdex 75 pg 1 × 120 ml 17-1068-01
HiLoad 26/60 Superdex 75 pg 1 × 320 ml 17-1070-01
HiLoad 16/60 Superdex 200 pg 1 × 120 ml 17-1069-01
HiLoad 26/60 Superdex 200 pg 1 × 320 ml 17-1071-01
Superose 6 PC 3.2/30 1 × 2.4 ml 17-0673-01
Superose 6 10/300 GL 1 × 24 ml 17-5172-01
Superose 12 PC 3.2/30 1 × 2.4 ml 17-0674-01
Superose 12 10/300 GL 1 × 24 ml 17-5173-01
HiPrep 16/60 Sephacryl S-100 HR 1 × 120 ml 17-1165-01
HiPrep 26/60 Sephacryl S-100 HR 1 × 320 ml 17-1194-01
HiPrep 16/60 Sephacryl S-200 HR 1 × 120 ml 17-1166-01
HiPrep 26/60 Sephacryl S-200 HR 1 × 320 ml 17-1195-01
HiPrep 16/60 Sephacryl S-300 HR 1 × 120 ml 17-1167-01
HiPrep 26/60 Sephacryl S-300 HR 1 × 320 ml 17-1196-01
HiPrep 16/60 Sephacryl S-400 HR 1 × 120 ml 28-9356-04HiPrep 26/60 Sephacryl S-400 HR 1 × 320 ml 28-9356-05
HiPrep 16/60 Sephacryl S-500 HR 1 × 120 ml 28-9356-06
HiPrep 26/60 Sephacryl S-500 HR 1 × 320 ml 28-9356-07

8/22/2019 Purificação de Proteínas - Estratégias, handbook
http://slidepdf.com/reader/full/purificacao-de-proteinas-estrategias-handbook 161/167
28-9833-31 AA 159
Column Quantity Codeno.
HiTrap Desalting 5 × 5 ml 17-1408-01
HiTrap Desalting 100 × 5 ml* 11-0003-29
HiPrep 26/10 Desalting 1 × 53 ml 17-5087-01
HiPrep 26/10 Desalting 4 × 53 ml 17-5087-02
PD-10 Desalting columns 30 17-0851-01
PD SpinTrap G-25 50 28-9180-04
PD MultiTrap G-25 4 × 96-well lter plates 28-9180-06
PD MiniTrap G-25 50 28-9180-07
PD MidiTrap G-25 50 28-9180-08
PD MiniTrap G-10 50 28-9180-10
PD MidiTrap G-10 50 28-9180-11
Vivaspin 500 MWCO 3000 25 28-9322-18
Vivaspin 500 MWCO 5000 25 28-9322-23Vivaspin 500 MWCO 10 000 25 28-9322-25
Vivaspin 500 MWCO 30 000 25 28-9322-35
Vivaspin 500 MWCO 50 000 25 28-9322-36
Vivaspin 500 MWCO 100 000 25 28-9322-37
Vivaspin 2 MWCO 3000 25 28-9322-40
Vivaspin 2 MWCO 5000 25 28-9322-45
Vivaspin 2 MWCO 10 000 25 28-9322-47
Vivaspin 2 MWCO 30 000 25 28-9322-48
Vivaspin 2 MWCO 50 000 25 28-9322-57
Vivaspin 2 MWCO 100 000 25 28-9322-58
Vivaspin 6 MWCO 3000 25 28-9322-93
Vivaspin 6 MWCO 5000 25 28-9322-94
Vivaspin 6 MWCO 10 000 25 28-9322-96
Vivaspin 6 MWCO 30 000 25 28-9323-17
Vivaspin 6 MWCO 50 000 25 28-9323-18
Vivaspin 6 MWCO 100 000 25 28-9323-19
Vivaspin 20 MWCO 3000 12 28-9323-58
Vivaspin 20 MWCO 5000 12 28-9323-59
Vivaspin 20 MWCO 10 000 12 28-9323-60
Vivaspin 20 MWCO 30 000 12 28-9323-61
Vivaspin 20 MWCO 50 000 12 28-9323-62
Vivaspin 20 MWCO 100 000 12 28-9323-63
Reversedphasechromatography
SOURCE 5RPC ST 4.6/150 1 × 2.5 ml 17-5116-01
SOURCE 15RPC ST 4.6/100 1 × 1.7 ml 17-5068-01
RESOURCE RPC, 1 ml 1 × 1 ml 17-1181-01
RESOURCE RPC, 3 ml 1 × 3 ml 17-1182-01
μRPC C2/C18 ST 4.6/100 1 × 1.7 ml 17-5057-01
Desalting,buerexchange,andconcentration
* Special pack size delivered on specic customer order

8/22/2019 Purificação de Proteínas - Estratégias, handbook
http://slidepdf.com/reader/full/purificacao-de-proteinas-estrategias-handbook 162/167
160 28-9833-31 AA
Column Quantity Codeno.
HiTrap HIC Selection Kit 7 × 1 ml 28-4110-07
HiTrap Phenyl FF (low sub) 5 × 1 ml 17-1353-01
HiTrap Phenyl FF (low sub) 5 × 5 ml 17-5194-01
HiScreen Phenyl FF (low sub) 1 × 4.7 ml 28-9269-89
HiPrep Phenyl FF (low sub) 16/10 1 × 20 ml 28-9365-46
HiTrap Phenyl FF (high sub) 5 × 1 ml 17-1355-01
HiTrap Phenyl FF (high sub) 5 × 5 ml 17-5193-01
HiScreen Phenyl FF (high sub) 1 × 4.7 ml 28-9269-88
HiPrep Phenyl FF (high sub) 16/10 1 × 20 ml 28-9365-45
HiTrap Phenyl HP 5 × 1 ml 17-1351-01
HiTrap Phenyl HP 5 × 5 ml 17-5195-01
HiScreen Phenyl HP 1 × 4.7 ml 28-9505-16
HiLoad 16/10 Phenyl Sepharose HP 1 × 20 ml 17-1085-01
HiLoad 26/10 Phenyl Sepharose HP 1 × 53 ml 17-1086-01
HiTrap Butyl HP 5 × 1 ml 28-4110-01
HiTrap Butyl HP 5 × 5 ml 28-4110-05
HiScreen Butyl HP 1 × 4.7 ml 28-9782-42
HiTrap Butyl FF 5 × 1 ml 17-1357-01
HiTrap Butyl FF 5 × 5 ml 17-5197-01
HiScreen Butyl FF 1 × 4.7 ml 28-9269-84
HiPrep Butyl FF 16/10 1 × 20 ml 28-9365-47
HiTrap Butyl-S FF 5 × 1 ml 17-0978-13HiTrap Butyl-S FF 5 × 5 ml 17-0978-14
HiScreen Butyl-S FF 1 × 4.7 ml 28-9269-85
HiTrap Octyl FF 5 × 1 ml 17-1359-01
HiTrap Octyl FF 5 × 5 ml 17-5196-01
HiScreen Octyl FF 1 × 4.7 ml 28-9269-86
HiPrep Octyl FF 16/10 1 × 20 ml 28-9365-48
SOURCE 15PHE 4.6/100 PE 1 × 1.7 ml 17-5186-01
RESOURCE ETH 1 × 1 ml 17-1184-01
RESOURCE ISO 1 × 1 ml 17-1185-01RESOURCE PHE 1 × 1 ml 17-1186-01
RESOURCE HIC Test Kit 3 × 1 ml 17-1187-01
Emptycolumns
Tricorn 5/100 column 1 28-4064-10
Tricorn 5/150 column 1 28-4064-11
Tricorn 5/200 column 1 28-4064-12
Tricorn 10/100 column 1 28-4064-15
Tricorn 10/150 column 1 28-4064-16Tricorn 10/200 column 1 28-4064-17
Tricorn columns are delivered with a column tube, adapter unit, end cap, a lter kit containing adapter and bottom ltersand O-rings, two stop plugs, two ngertight ttings, adapter lock and lter holder, and two M6 connectors for connectionto FPLC System, if required
Hydrophobicinteractionchromatography

8/22/2019 Purificação de Proteínas - Estratégias, handbook
http://slidepdf.com/reader/full/purificacao-de-proteinas-estrategias-handbook 163/167
28-9833-31 AA 161
Column Quantity Codeno.
XK 16/20 column 1 18-8773-01
XK 26/20 column 1 18-1000-72
XK 50/20 column 1 18-1000-71
XK columns are delivered with one AK adapter, TEFZEL tubing (0.8 mm i.d. for XK 16 and XK 26 columns, 1.2 mm i.d. for XK 50 columns, with M6 connectors, thermostatic jacket , support snap-on net rings, dismantling tool (XK 16 and XK 26 only)and instructions
HiScale 16/20 1 28-9644-41
HiScale 16/40 1 28-9644-24
HiScale 26/20 1 28-9645-14
HiScale 26/40 1 28-9645-13
HiScale 50/20 1 28-9644-45
HiScale 50/40 1 28-9644-44
HiScale columns are delivered with two adapters, PEEK tubing (1.0 mm i.d. for HiScale 16 and HiScale 26 columns, 2.0 mm i.d.for HiScale 50 columns), Valco ttings, protective tube, 20 μm support snap-on lter rings, and instructions
HR 16/5 column 1 18-1000-98HR 16/10 column 1 19-7403-01
HR 16/50 column 1 18-1460-01
HR columns are delivered with a column tube, adapter unit, end cap, a lter kit containing adapter and bottom lters andO-rings and M6 male ttings for connection to FPLC System
Empty PD-10 Desalting columns 50 17-0435-01
Complete information on the range of empty columns is available at www.gelifesciences.com/protein-purication
AccessoriesandsparepartsLabMate PD-10 Buffer Reservoir 10 18-3216-03
Packing Connector XK 16 1 18-1153-44
Packing Connector XK 26 1 18-1153-45
Tricorn packing equipment 10/100† 1 18-1153-25
Tricorn packing connector 10-10‡ 1 18-1153-23
1/16” male/Luer female§ 2 18-1112-51
Tubing connector angeless/M6 female§ 2 18-1003-68
Tubing connector angeless/M6 male§ 2 18-1017-98
Union 1/16” female/M6 male 6 18-1112-57
Union M6 female /1/16” male 5 18-3858-01
Union Luerlock female/M6 female 2 18-1027-12
HiTrap/HiPrep, 1/16” male connector for ÄKTA design 8 28-4010-81
Stop plug female, 1/16Ӧ 5 11-0004-64
Fingertight stop plug, 1/16”** 5 11-0003-55
† Tricorn packing equipment 10/100 includes Tricorn packing connector 10-10, Tricorn 10/100 glass tube, bottom unit, and stop plug‡ Connects extra glass column to a Tricorn 10 column to act as a packing reservoir for efcient packing§ One connector included in each HiTrap package¶ Two, ve, or seven female stop plugs included in HiTrap packages, depending on products** One ngertight stop plug is connected to the top of each HiTrap column
For a complete listing refer to www.gelifesciences.com/protein-purication

8/22/2019 Purificação de Proteínas - Estratégias, handbook
http://slidepdf.com/reader/full/purificacao-de-proteinas-estrategias-handbook 164/167
162 28-9833-31 AA

8/22/2019 Purificação de Proteínas - Estratégias, handbook
http://slidepdf.com/reader/full/purificacao-de-proteinas-estrategias-handbook 165/167
28-9833-31 AA 163

8/22/2019 Purificação de Proteínas - Estratégias, handbook
http://slidepdf.com/reader/full/purificacao-de-proteinas-estrategias-handbook 166/167
164 28-9833-31 AA

8/22/2019 Purificação de Proteínas - Estratégias, handbook
http://slidepdf.com/reader/full/purificacao-de-proteinas-estrategias-handbook 167/167
GE, imagination at work, and GE monogram are trademarks o General Electric Company.
ÄKTA, ÄKTAcrossow, ÄKTAmicro, ÄKTAprime, ÄKTApurifer, ÄKTAxpress, A xiChrom,Biacore, BioProcess, Capto, Cy, CyDye, DeCyder, ECL Advance, ECL Plex, Ettan, ExcelGel,FPLC, GraviTrap, GSTPrep, GSTrap, HiLoad, HiPrep, HiScale, HiScreen, HisPrep, HisTrap,HiTrap, LabMate, MabSelect, MabSelect SuRe, MabSelec t Xtra, MAbTrap, MacroCap,MBPTrap, MicroCal, MidiTrap, MiniBeads, Mini Q , Mini S , MiniTrap, MonoBeads,Mono P, Mono Q, Mono S, MultiTrap, Polybuer, PreDictor, PreScission, PrimeView,ReadyToProcess, RESOURCE, Sephacr yl, Sephadex, Sepharose, SOURCE, SpinTrap,StrepTrap, Superdex, Superose, Tricorn, UNICORN, and Vivas pin are trademarks o GE Healthcare companies.
2-D Fluorescence Difference Gel Electrophoresis: 2-D Fluorescence Dierence Gel
Electrophoresis (2-D DIGE) technology is covered by US patent numbers 6,043,025,6,127,134 and 6,426,190 and equivalent patents and patent applicat ions in othercountries and exclusively licensed rom Carnegie Me llon University. CyDye: this productor portions thereo is manuac tured under an exclusive license rom Carnegie MellonUniversity under US patent numbers 5, 569,587, 5,627,027 and equivalent patent s inother countries. The purchase o CyDye DIGE Fluors includes a limited license to use theCyDye DIGE Fluors or internal research and development, but not or any commercialpurposes. A license to use t he CyDye DIGE Fluors or commercial purposes is subjec t toa separate license agreement with GE Healthcare.
ECL Advance contains Lumigen TMA-6 substrate and is sold under exclusive licenserom Lumigen Inc.
ECL Direct/Alkphos Direct labelling reagents are covered by European patent number120376B1 and sold under license rom European Molecular Biology Laboratory.
ECL Direct (RPN3000,3001,3005) is covered by US patent numbers 373017 and 513040and oreign equivalents and is sold under license rom Institut Paste ur.
ECL Plus contains Lumigen PS3 substrate and is s old under exclusive license romLumigen Inc.
GST Gene Fusion Vectors: A license or commercial use o GST Gene Fusion Vectorsunder US patent 5,654,176 and equivalent patents and patent applications in oth ercountries must be obtained rom Millipore Corp (ormerly Chemicon Internat ional Inc).
IMAC Sepharose products and Ni Sepharose products: Purifcation and preparation o usion proteins and afnity peptides comprising at least two adjacent histidine residuesmay require a license under US patent numbers 5,284,933 and 5,310,663, and equivalentpatents and patent applications in other countries (assignee: Homan La Roche, Inc).
IMAC Sepharose products, Ni Sepharose products, and Fe Sepharose products:These products a re covered by US patent number 6 623 655 and equivalent patentsand patent applications in other countries.
MabSelect SuRe Ligand and Cys-rProtein A Ligand: MabSelect SuRe Ligand RestrictedLicense” and ”Cys-rProtein A Ligand Restricted Licens e” are protected by the ollowingpatents and equivalent patents and patent applications in other countries: US 5,151,350,US 5 143 844 US 6 399 750 WO 03/00475 d EP 112338 9 A bl