Production and Characterization of Electrospun · Fico à espera da tua magnífica apresentação...
96
Orientador: Doutor João Paulo Miranda Ribeiro Borges, Professor Auxiliar, Faculdade de Ciências e Tecnologia da Universidade Nova de Lisboa Co-orientadora: Doutora Coro Echeverria Zabala, Investigadora em Pós-Doutoramento, CENIMAT-I3N Departamento de Ciências de Materiais, Faculdade de Ciências e Tecnolo- gia da Universidade Nova de Lisboa Susana Cristina Silva Gil Marques Licenciatura em Ciências de Engenharia de Materiais Production and Characterization of Electrospun Composite Fibers: Confinement of Thermosensitive Microgels Dissertação para obtenção do Grau de Mestre em Engenharia de Materiais Setembro, 2015 Júri: Presidente: Professor João Pedro Botelho Veiga Arguente: Professora Ana Isabel Nobre Martins Aguiar de Oliveira Ricardo Vogal: Professor João Paulo Borges
-
Upload
nguyenkhue -
Category
Documents
-
view
212 -
download
0
Transcript of Production and Characterization of Electrospun · Fico à espera da tua magnífica apresentação...

Orientador: Doutor João Paulo Miranda Ribeiro Borges, Professor Auxiliar, Faculdade de
Ciências e Tecnologia da Universidade Nova de Lisboa
Co-orientadora: Doutora Coro Echeverria Zabala, Investigadora em Pós-Doutoramento,
CENIMAT-I3N Departamento de Ciências de Materiais, Faculdade de Ciências e Tecnolo-
gia da Universidade Nova de Lisboa
Susana Cristina Silva Gil Marques
Licenciatura em Ciências de Engenharia de Materiais
Production and Characterization of Electrospun
Composite Fibers:
Confinement of Thermosensitive Microgels
Dissertação para obtenção do Grau de Mestre em Engenharia de Materiais
Setembro, 2015
Júri:
Presidente: Professor João Pedro Botelho Veiga
Arguente: Professora Ana Isabel Nobre Martins Aguiar de Oliveira Ricardo
Vogal: Professor João Paulo Borges


iii
Production and Characterization of Electrospun Composite Fibers: Confinement of Thermosensitive
Microgels
Copyright © Susana Cristina Silva Gil Marques, 2015.
A Faculdade de Ciências e Tecnologia e a Universidade Nova de Lisboa têm o direito, perpétuo e sem
limites geográficos, de arquivar e publicar esta dissertação através de exemplares impressos reproduzidos
em papel ou de forma digital, ou por qualquer outro meio conhecido ou que venha a ser inventado, e de a
divulgar através de repositórios científicos e de admitir a sua cópia e distribuição com objetivos educacio-
nais ou de investigação, não comerciais, desde que seja dado crédito ao autor e editor.

iv

v
‘You never know what is enough
unless you know what is more than enough’
William Blake

vi

vii
Acknowledgements/Agradecimentos
Antes de mais, expresso um enorme agradecimento ao meu orientador, Doutor João Paulo Borges por todo
o apoio dado no decorrer deste trabalho, pelas sugestões e conhecimentos transmitidos, pelas palavras de
incentivo, como também por me ter confiado esta tarefa. Um enorme agradecimento ao Doutor João Pedro
Veiga pelo apoio incondicional e, pelas palavras que relativizam o maior dos dilemas na vida de qualquer
aluno. Ao Doutor Rodrigo Martins, pelos desafios, oportunidades e incentivos à investigação, ao longo des-
tes cinco anos.
Agradeço à minha co-orientadora, Doutora Coro Echeverria Zabala, não só por toda a ajuda na parte ex-
perimental, mas também pelas correções na componente escrita. À parte de uma excelente co-orientadora
és um exemplo, admiro-te como pessoa e como investigadora. Um enorme agradecimento por todos os
bons momentos passados, pela paciência, compreensão e amizade. Por me teres transmitido a confiança
em mim, que nem eu própria tenho. Se ultrapassei grande parte dos obstáculos foi graças ao teu apoio e
aos teus conhecimentos. Aliás, se não fosse essa mente brilhante esta tese nem existiria, nem conheceria
o meu atual melhor amigo (mais conhecido por PNIPAAm).
À Mestre Paula Soares, que devido a questões meramente burocráticas não consta também como co-
orientadora desta tese, agradeço todo apoio e carinho demonstrado nesta fase final do teu doutoramento.
Obrigada por todo o esforço, presença na fase laboratorial e pelas análises de FTIR, mas também pelas
correções na componente escrita, formatações do documento e apreciações finais. Este tema também é
teu. Fico à espera da tua magnífica apresentação para saber como “brilhar”.
Ao Doutor César Laia, expresso aqui a minha gratificação pelos conhecimentos transmitidos na preparação
das amostras na técnica de DLS, pela disponibilidade e pelas palavras.
Ao Mestre Carlos João, obrigada por me ensinares a ver a escala numa micropipeta, mas mais que tudo
um grande agradecimento pelo apoio e pelas conversas. Não ocupes as sessões de SEM dos outros e,
arrasa na tese de doutoramento (“Já demos, obrigado!!”)
À Doutora Ana Baptista, expresso aqui a minha enorme gratificação por todo o tempo e apoio disponibili-
zados, pela passagem de conhecimentos e pelas palavras sábias (caso contrário ainda odiaria o electros-
pinning).
À Doutora Susete Fernandes, agradeço todas as indicações dadas em laboratório (senão ainda continuaria
a tentar produzir microgéis num reator contaminado), pela paciência e palavras de apoio.
viii
À Rita Pontes, do “isso está um grego” e “essa cara”, agradeço todo apoio nas fases mais complicadas.
Obrigada pelas palavras de compreensão e de orientação durante as minhas crises existenciais, pelos
cafés no “Cantinho da Lua” ou mais, recentemente “Na Cerca” mas sobretudo pela amizade.
À Tété, a única pessoa à face da Terra capaz de evitar que eu seja sistematicamente vítima de bullying,
obrigada pelo apoio e pela capacidade que tens de transmitir calma. Aquela baba de camelo de comer e
chorar por mais, como também os momentos de café sem álcool tiveram sem dúvida alguma um grande
impacto na minha vida académica.
Ao Tiago Rio, o meu padrinho “académico”, por estares sempre presente nos momentos mais dramáticos
da minha vida e, por toda a amizade e apoio. Mas, mais que tudo, obrigada pela paciência de me aturares
mesmo quando já não tenho paciência para mim. Aqui só há frascos (os micro-ondas ainda estão em bom
estado) se quiseres vir ajudar a limpar, estás à vontade.
À Mariana Castanheira (Marilu), por todos os momentos de pânico e alegrias divididas ao longo destes
cinco anos e por nunca desistires de mim. Por nunca questionares a nossa amizade. Mas, também, por
todas as longas e construtivas conversas partilhadas. Só porque a amizade não é espacial nem temporal,
para o ano voltamos a limpar a casa.
Ao André Milho (o “migo do mau feitio”) por teres a proeza de ter um feitio pior do que o meu, mas mais
que tudo pelas conversas, apoio e disponibilidade facultados. Mas, também, por me entenderes quando
pouca gente consegue fazê-lo.
Ao Zé Rui, o meu migo lindo mais conhecido como “O Mágico”, obrigada por me teres apresentado o
software JMP e por me teres ajudado em todo a análise do desenho de experiência. Mas, acima de tudo,
obrigada pelas conversas, pela amizade e por todo o carinho. Vai-te preparando, para o ano és tu.
À Susana Oliveira, a minha “sósia”, amiga obrigada pela companhia nas horas de almoço na praia e nos
turnos noturnos no lab 211. Quero, também, agradecer todo o apoio e amizade estupidamente importantes
nesta fase da nossa vida. Agora está na hora de brilhares e, seguramente, estarei para te aplaudir.
Ao Tomás Correia, do mau feitio mas com jeito para fazer tudo, obrigada por me ensinares a não ter medo
de máquinas, pelo apoio e pelas palavras. Sobretudo agradeço teres escolhido o departamento de materi-
ais para fazer a tese e, assim conhecer o amigo e pessoa que és.
À Filipa Belo “DJ in the house – lab 211”. O que seria de mim, sem a tua boa disposição no laboratório?
Obrigada por seres essa “boa onda”, pela amizade e pelas palavras de apoio. De momento a team, está
um pouco dispersa (estamos todos a jogar à defesa) mas prepara-te, porque não te livras de nós.

ix
À Ana Figueiredo (“A Fofi do coça-coça!!”), por partilhar o entusiasmo e alegria nas fases mais complicadas
do lab 211. Adoro ter a imagem da tua barriga gravada no meu cérebro. Para o ano és tu e, espero que
tomes a decisão que te faz mais feliz.
À turma (David, Ana, Micaela, Fernando, Mariana, Catarina, Paulo) obrigada pelas conversas, desabafos,
risadas e apoio.
À Catarina Bianchi, a mais recente noiva, por todo o apoio, almoços, cafés e desabafos ao longo desta
odisseia. Mais que tudo, um grande obrigada por todos os momentos e amizade. Daqui a uns anos temos
de recordar estes momentos!
À Inês Ropio, obrigada pelas conversas e momentos, mas também por toda a disponibilidade na troca de
turnos de electrospinning e pela ajuda disponibilizada. Agora temos de fazer uma jantarada.
Ao Ricardo Marreiros, por toda a delicadeza no trato e preocupação apresentada mesmo quando me revolto
contra o mundo.
À Diana Paiva e à Tânia, por terem contribuído para o meu bem-estar na fase inicial da tese, pelos desa-
bafos e troca de conhecimentos.
Aos meus meninos por todos os momentos que fizeram esquecer a tese e, por todo o apoio. Sem vocês
não era a mesma pessoa.
Ao Tiago Infante, obrigada por escolheres MCP e apareceres no laboratório nos momentos em que preci-
sava de desabafar ou do ombro amigo para chorar.
À Duda, à Yasmin e ao Bruno quero expressar um enorme agradecimento por mostrarem que a vida não
é só trabalho.
Ao Mário Noras, pela disponibilidade de sempre, pelas palavras e pelas múltiplas tentativas de soldar um
alvo para o setup de electrospinning.
Por último, mas mais importante, quero expressar o meu enorme agradecimento à minha família que sem-
pre me apoiou e compreendeu as crises de mau-humor. Por todo o carinho e consideração dados. Por
acreditarem sempre em mim e, graças a vocês tornei-me na pessoa que sou atualmente.
Sem vocês nada disto teria sido possível, nem teria a mesmo encanto.

x

xi
Abstract
Materials engineering focuses on the assembly of materials´ properties to design new products with the best
performance. By using sub-micrometer size materials in the production of composites, it is possible to obtain
objects with properties that none of their compounds show individually. Once three-dimensional materials
can be easily customized to obtain desired properties, much interest has been paid to nanostructured poly-
mers in order to build biocompatible devices.
Over the past years, the thermosensitive microgels have become more common in the framework of bio-
materials with potential applicability in therapy and/or diagnostics. In addition, high aspect ratio biopolymers
fibers have been produced using the cost-effective method called electrospinning. Taking advantage of both
microgels and electrospun fibers, surfaces with enhanced functionalities can be obtained and, therefore
employed in a wide range of applications.
This dissertation reports on the confinement of stimuli-responsive microgels through the colloidal electro-
spinning process. The process mainly depends on the composition, properties and patterning of the precur-
sor materials within the polymer jet. Microgels as well as the electrospun non-woven mats were investigated
to correlate the starting materials with the final morphology of the composite fibers. PNIPAAm and
PNIPAAm/Chitosan thermosensitive microgels with different compositions were obtained via surfactant free
emulsion polymerization (SFEP) and characterized in terms of chemical structure, morphology, thermal sta-
bility, swelling properties and thermosensitivity. Finally, the colloidal electrospinning method was carried out
from spinning solutions composed of the stable microgel dispersions (up to a concentration of about 35 wt.
% microgels) and a polymer solution of PEO/water/ethanol mixture acting as fiber template solution.
The confinement of microgels was confirmed by Scanning Electron Microscopy (SEM). The electrospinning
process was statistically analysed providing the optimum set of parameters aimed to minimize the fiber
diameter, which give rise to electrospun nanofibers of PNIPAAm microgels/PEO with a mean fiber diameter
of 63 ± 25 nm.
Key-words: PNIPAAm; Chitosan; Composites; Microgels; Colloidal Electrospinning; Fibers.

xii

xiii
Resumo
A engenharia de materiais foca-se no aperfeiçoamento das propriedades dos materiais para a obtenção de
novos produtos com desempenho melhorado. Mediante a utilização de materiais micrométricos para a pro-
dução de compósitos é possível obter objetos com propriedades que nenhum dos seus componentes con-
segue demonstrar individualmente. Muito interesse tem sido dado aos polímeros nanoestruturados para
dispositivos biomédicos, uma vez que os materiais tridimensionais podem ser facilmente adaptados para
obter as propriedades desejadas.
Ao longos dos últimos anos, os microgéis termossensíveis tornaram-se mais comuns no âmbito dos bio-
materiais com aplicabilidade em terapia e/ou diagnósticos. Como também, as fibras biopoliméricas com
elevado fator de forma (ou, coeficiente de esbeltez) têm sido produzidas usando o método de electrofiação.
Tirando proveito tanto dos microgéis como das fibras electrofiadas, é possível obter superfícies com funci-
onalidades aprimoradas e que podem ser empregues em uma ampla gama de aplicações.
A presente dissertação relata o confinamento de microgéis termossensíveis mediante o processo de elec-
trofiação de colóides. O processo depende principalmente da composição, propriedades e padronização
dos materiais percursores no interior do jato polimérico. De forma a correlacionar os materiais de partida e
as membranas fibrilares electrofiadas, tanto os microgéis, como também as fibras compósitas foram inves-
tigadas. Para tal, primeiramente, foram produzidos os microgéis termossensíveis de PNIPAAm e de PNI-
PAAm-Cs através da polimerização por emulsão sem tensioativo. Neste seguimento, os microgéis foram
caracterizados química, estrutural e morfologicamente, tendo-se também procedido à avaliação da estabi-
lidade térmica, propriedades de inchamento e da termossensibilidade. Finalmente, o processo foi realizado
através de soluções de fiação compostas por dispersões estáveis de microgéis (com uma concentração
máxima de 35% de microgéis em solução) e, uma solução de polietileno óxido/água/etanol atuando como
matriz para a produção de fibras. Posteriormente, foi confirmado o confinamento dos microgéis através da
análise de microscopia eletrónica de varrimento.
O processo de electrofiação foi analisado estatisticamente de forma a obter-se o conjunto ótimo de parâ-
metros que visava minimizar o diâmetro das fibras. Deste modo, fibras de microgéis de PNIPAAm dispersos
em fibras de PEO com diâmetro médio de 63 ± 25 nm foram obtidas.
Palavras-chave: Compósitos; Electrofiação Coloidal; Fibras; Microgéis; PNIPAAm; Quitosano.

xiv
xv
Contents
Acknowledgements/Agradecimentos .................................................................................................... vii
Abstract ...................................................................................................................................................... xi
Resumo .................................................................................................................................................... xiii
Contents .................................................................................................................................................... xv
List of Figures ....................................................................................................................................... xviii
List of Tables .......................................................................................................................................... xxii
Abbreviations ........................................................................................................................................ xxiv
Symbols ................................................................................................................................................. xxvi
Objectives .............................................................................................................................................. xxix
1. Introduction .................................................................................................................................. 1
1.1. BRIEF INTRODUCTION: FROM POLYMER PHYSICS TO COLLOIDAL STATE ................................... 1
1.2. THERMOSENSITIVE MICROGELS .............................................................................................. 1
1.3. COLLOIDAL ELECTROSPINNING ............................................................................................... 3
1.4. DESIGN OF EXPERIMENTS AND SURFACE RESPONSE METHODOLOGY ...................................... 6
2. Materials and Methods ................................................................................................................ 7
2.1. MATERIALS ............................................................................................................................ 7
2.2. DEPOLYMERIZATION OF CHITOSAN .......................................................................................... 7
2.3. SYNTHESIS OF COLLOIDAL MICROGELS .................................................................................... 7
2.4. DESIGN OF EXPERIMENTS IN ELECTROSPINNING RESEARCH ..................................................... 8
2.4.1. Design of experiments generation ................................................................................... 8
2.4.2. Preparation of solutions for electrospinning ..................................................................... 9
2.4.3. Colloidal electrospinning experiments ............................................................................. 9
2.5. CHARACTERIZATION ............................................................................................................. 10
3. Results and Discussion ............................................................................................................ 13
xvi
3.1. THERMOSENSITIVE MICROGELS ............................................................................................. 13
3.2. CHEMICAL STRUCTURE OF CROSS-LINKING PNIPAAM AND PNIPAAM-CS MICROGELS ............ 13
3.2.1. Swelling properties of PNIPAM-Cs microgels ................................................................ 15
3.2.2. Analysis of the autocorrelation function (cumulant method) .......................................... 16
3.3. COLLOIDAL ELECTROSPINNING ............................................................................................. 18
3.3.1. Spinning solution and jet forming concentrations ........................................................... 18
3.3.2. Planning and analysis: surface response methodology ................................................. 20
3.4. SURFACE MORPHOLOGY ANALYSIS ........................................................................................ 28
3.4.1. Effect of the concentration of microgels in spinning solution ......................................... 29
3.4.2. Effect of the chitosan in microgels structure on fibers morphology ................................ 30
3.4.3. Effect of the molecular weight of chitosan in electrospun beads structures ................... 31
3.4.4. Effect of the concentration of chitosan on topography of the fibers ............................... 32
4. Conclusions and Future Perspectives ..................................................................................... 35
5. References .................................................................................................................................. 38
6. Supporting Information ............................................................................................................. 45
6.1. RESPONSE SURFACE METHODOLOGY ................................................................................... 45
6.1.1. Planning the design of experiments ............................................................................... 45
6.1.2. Regression analysis ....................................................................................................... 48
6.2. DIMENSIONAL REPRESENTATION OF THE ADAPTED GROUNDED COLLECTOR ............................ 53
6.3. MOLECULAR WEIGHT OF CHITOSAN ....................................................................................... 54
6.4. COLLOIDAL STABILITY SYNTHESIS .......................................................................................... 55
6.5. FITR ANALYSIS .................................................................................................................... 57
6.6. MICROGELS DISPERSIONS MORPHOLOGY ............................................................................. 58
6.7. THERMOGRAVIMETRIC ANALYSIS ........................................................................................... 59
6.8. ANALYSIS OF THE AUTOCORRELATION FUNCTIONS ................................................................. 61
6.9. SEM ANALYSIS OF THE ELECTROSPUN COMPOSITE FIBERS OBTAINED FROM DESIGN OF
EXPERIMENTS 62

xvii

xviii
List of Figures
FIGURE 1.1 - CHEMICAL STRUCTURE OF NIPAAM MONOMER (ADAPTED FROM [14]). ............................................................. 2
FIGURE 1.2 – REPRESENTATIVE VOLUME PHASE TRANSITION TEMPERATURE MECHANISM OF PNIPAAM MICROGELS
TRIGGERED BY THE TEMPERATURE STIMULI IN AQUEOUS MEDIUM............................................................................... 2
FIGURE 2.1 – ADAPTED GROUND COLLECTOR USED IN THE ELECTROSPINNING EXPERIMENTS. ............................................. 10
FIGURE 3.1 - ATR-FTIR SPECTRUM OF DEPOLYMERIZED CHITOSAN (GREEN), SPECTRA OF PNIPAAM MICROGELS (BLUE) AND
REPRESENTATIVE PNIPAAM-CS MICROGELS SPECTRA (WINE). ............................................................................... 14
FIGURE 3.2 - DEPENDENCE OF HYDRODYNAMIC DIAMETER (DH) OF MICROGELS (A); EVOLUTION OF THE RELATIVE SWELLING
(D/DO); (B) WITH TEMPERATURE FOR SAMPLES PNIPAAM (CYAN), PNIPAAM-30%CS (1:50) (ORANGE), PNIPAAM-
30%CS (1:33) (GREEN), PNIPAAM-40%CS (1:50) (MAGENTA), AND PNIPAAM-40%CS (1:33) (WINE). ................... 16
FIGURE 3.3 - DLS CURVES AS A FUNCTION OF TEMPERATURE FOR SAMPLES PNIPAAM-20%CS (1:50) (OLIVE) AND
PNIPAAM-40%CS (1:25) (BLUE) (A), EVALUATION OF THE MEASURED AND CALCULATED (RED) HYDRODYNAMIC
DIAMETERS FOR SAMPLES PNIPAAM-20%CS (1:50) (B), AND PNIPAAM-40%CS (1:50) (C) WITH THE TEMPERATURE
TESTED RANGE..................................................................................................................................................... 17
FIGURE 3.4 - OPTICAL IMAGES OF THE REPRESENTATIVE SAMPLES WITH COMPOSITE COLLOIDS/PEO BEADS USING 0.4 WT.
%PEO (A); SHORT PEO FIBERS AND MICROGELS BEADS USING 1 WT.% PEO (B), AND MICROGEL BEADS CONFINED IN
PEO MEDIUM AND LONG FIBERS USING A CONCENTRATION OF 2% WT. PEO (C)....................................................... 19
FIGURE 3.5 - OPTICAL IMAGES OF THE REPRESENTATIVE SAMPLES WITH COMPOSITE COLLOIDS/PEO USING A CONCENTRATION
OF 2 WT.% PEO WITH 10% (V/V) ETHANOL (A) 15% (V/V) ETHANOL (B), 20% (V/V) ETHANOL (C). ............................. 20
FIGURE 3.6 – RESPONSE SURFACES FOR THE MEAN FIBER DIAMETER IN TERMS OF: (A) APPLIED VOLTAGE AND WORKING
DISTANCE, (B) FLOW RATE AND APPLIED VOLTAGE, (C) WORKING DISTANCE AND SAMPLE CODE, (D) SAMPLE CODE AND
FLOW RATE, (E) FLOW RATE AND SAMPLE CODE AND (F) WORKING DISTANCE AND FLOW RATE................................... 26
FIGURE 3.7 - SEM IMAGES OF COMPOSITE PNIPAAM MICROGELS/PEO ELECTROSPUN NANOFIBERS USING THE OPTIMUM SET
OF PARAMETERS (15 KV, 20 CM AND 0.6 ML/H) FOR A BEAD-ON-A-STRING MORPHOLOGY (A), FOR ULTRAFINE PEO
FIBERS WITH FEW PNIPAAM MICROGELS CONFINED (B), AND FOR PETAL BEADS STRUCTURES (C). ............................ 27
FIGURE 3.8 - FIBER DIAMETER FOR THE ELECTROSPUN PNIPAAM MICROGELS/PEO NON-WOVEN MAT OBTAINED FROM THE
OPTIMUM SET OF PARAMETERS IN THE FRAMEWORK OF THE RSM WITH A MEAN FIBER DIAMETER OF 63 NM................ 27
FIGURE 3.9 - SEM MICROGRAPH OF PNIPAAM-20%CS (1:50) MICROGELS/PEO COMPOSITE FIBER USED IN DOE STUDY
EXPERIMENT #12. ................................................................................................................................................ 28
xix
FIGURE 3.10 - SEM MICROGRAPHS OF COMPOSITE FIBERS (A) PNIPAAM-20%CS (1:50) MICROGELS/PEO USED IN DOE
STUDY EXPERIMENT #25; (B) PNIPAAM-30%CS (1:50) MICROGELS/PEO USED IN DOE STUDY EXPERIMENT #3 AND
(C) PNIPAAM-40%CS (1:50) MICROGELS/PEO USED IN DOE STUDY EXPERIMENT #16........................................... 30
FIGURE 3.11 - SEM MICROGRAPHS OF COMPOSITE FIBERS (A) PNIPAAM-40%CS (1:25) MICROGELS/PEO USED IN DOE
STUDY EXPERIMENT #9; (B) PNIPAAM-40%CS (1:33) MICROGELS/PEO USED IN DOE STUDY EXPERIMENT #15 AND
(C) PNIPAAM-40%CS (1:50) MICROGELS/PEO USED IN DOE STUDY EXPERIMENT #21........................................... 31
FIGURE 3.12 - SEM MICROGRAPHS OF COMPOSITE FIBERS (A) PNIPAAM MICROGELS/PEO USED IN DOE STUDY EXPERIMENT
#1 AND (B) PNIPAAM-40%CS (1:50) MICROGELS/PEO USED IN DOE STUDY EXPERIMENT #24. .............................. 32
FIGURE 3.13 - SEM MICROGRAPH OF THE REPRESENTATIVE COMPOSITE FIBERS WITH DEFECTS (A) PHASE SEPARATION
BETWEEN THE PNIPAAM-40%CS (1:25) MICROGELS AND THE PEO MATRIX OBSERVED IN DOE STUDY EXPERIMENT
#4, (B) WITH BURST-BEADS SHOWED BY PNIPAAM-40%CS (1:33) MICROGELS/PEO FIBERS IN THE DOE STUDY
EXPERIMENT #5, AND (C) RIBBON-LIKE STRUCTURES FOR PNIPAAM-40%CS (1:50) MICROGELS/PEO FIBERS WITH
PRODUCED IN DOE STUDY EXPERIMENT #9. .......................................................................................................... 33
FIGURE 6.1 - OPTICAL IMAGES OF THE REPRESENTATIVE ELECTROSPUN FIBERS OF MICROGELS/PEO USING AN APPLIED
VOLTAGE OF 10 KV (A); 15 KV (B) AND 20 KV (C). .................................................................................................. 46
FIGURE 6.2 - OPTICAL IMAGES OF THE REPRESENTATIVE ELECTROSPUN FIBERS OF MICROGELS/PEO WITH A WORKING
DISTANCE OF 13 CM (A); 20 CM (B) AND 27 CM (C). ................................................................................................. 46
FIGURE 6.3 - OPTICAL IMAGES OF THE REPRESENTATIVE ELECTROSPUN FIBERS OF MICROGELS/PEO USING A FLOW RATE OF
0.1 ML/H (A) AND 0.5 ML/H (B). ............................................................................................................................. 47
FIGURE 6.4 - DIMENSIONAL CHARACTERIZATION IN MILLIMETERS OF THE GROUND COLLECTOR USED IN ELECTROSPINNING
SETUP. ................................................................................................................................................................ 54
FIGURE 6.5 - MACROSCOPIC PHOTOGRAPHS OF THE AS-PREPARED MICROGELS DISPERSIONS: STABLE (A) AND NON-
STABLE/PRECIPITATES (B). ................................................................................................................................... 56
FIGURE 6.6 - INFRARED SPECTRA OF PNIPAAM MICROGELS (BLUE) AND NIPAAM MONOMER (GREEN). .............................. 57
FIGURE 6.7 - INFRARED SPECTRA OF THE REPRESENTATIVE PNIPAAM-40%CS (1:50) MICROGELS (BLUE), PNIPAAM-30%CS
(1:50) MICROGELS (RED) AND PNIPAAM-20%CS (1:50) MICROGELS (GREEN). ....................................................... 58
FIGURE 6.8 - REPRESENTATIVE SEM MICROGRAPHS FOR (A) PNIPAAM MICROGELS, (B) PNIPAAM-20%CS MICROGELS, AND
(C) PNIPAAM-40%CS MICROGELS. ...................................................................................................................... 59
FIGURE 6.9 - THERMAL DEGRADATION FOR THE SAMPLES DEPOLYMERIZED CHITOSAN (GREY), PNIPAAM (RED), PNIPAAM-
20%CS(1:50) (BLUE), PNIPAAM-30%CS(1:50) (GREEN), AND PNIPAAM-40%CS(1:50) (PURPLE) IN TGA CURVES
(A) AND DTG CURVES (B). ................................................................................................................................... 60
FIGURE 6.10 - REPRESENTATIVE AUTOCORRELATION FUNCTION CURVES CORRESPONDING TO PNIPAAM MICROGELS
DISPERSIONS OBTAINED AT 28º, 30º, 33º, 36º AND 38ºC. ........................................................................................ 61

xx
FIGURE 6.11 - SEM MICROGRAPH OF COMPOSITE FIBERS USED IN DOE STUDY EXPERIMENT #1 (A1), #2 (A2), #3 (A3), #4
(A4), #5 (A5), AND #6 (A6). INSET OF FIGURE A6 CORRESPOND TO SEM SCALE. .................................................... 63
FIGURE 6.12 - SEM MICROGRAPH OF COMPOSITE FIBERS USED IN DOE STUDY EXPERIMENT #7 (B1), #8 (B2), #9 (B3), #10
(B4), #11 (B5), AND #12 (B6). INSET OF FIGURE B6 CORRESPOND TO SEM SCALE. ................................................ 63
FIGURE 6.13 - SEM MICROGRAPH OF COMPOSITE FIBERS USED IN DOE STUDY EXPERIMENT #13 (C1), #14 (C2), #15 (AC),
#16 (C4), #17 (C5), AND #19 (C6). INSET OF FIGURE C6 CORRESPOND TO SEM SCALE .......................................... 64
FIGURE 6.14 - SEM MICROGRAPH OF COMPOSITE FIBERS USED IN DOE STUDY EXPERIMENT #20 (D1), #21 (D2), #22 (D3),
#23 (D4), #24 (D5), AND #25 (D6). INSET OF FIGURE D6 CORRESPOND TO SEM SCALE. ......................................... 64
FIGURE 6.15 - SEM MICROGRAPH OF COMPOSITE FIBERS USED IN DOE STUDY EXPERIMENT #25 (E1), #26 (E2), AND #27
(E3). INSET OF FIGURE E3 CORRESPOND TO SEM SCALE. ...................................................................................... 65

xxi

xxii
List of Tables
TABLE 2.1 - AMOUNT OF NIPAAM, CS, MBA, APS AND SBS USED IN THE EMULSIONS REACTION BY SURFACTANT FREE
EMULSION POLYMERIZATION. ................................................................................................................................... 8
TABLE 2.2 - RATIO OF MASS MICROGELS-TO-MASS PEO POLYMER FIBER MATRIX. ................................................................ 9
TABLE 3.1 - STABLE MICROGELS DISPERSIONS AND THEIR LCST IN AQUEOUS MEDIUM. ....................................................... 16
TABLE 3.2 - SUMMARY OF THE RESULTS FROM THE STATISTICAL ANALYSIS OF THE MODEL OF THE MEAN FIBER DIAMETER. .... 21
TABLE 3.3 - TEST ON INDIVIDUAL COEFFICIENTS FOR THE MODEL OF MEAN FIBER DIAMETER. ............................................... 22
TABLE 3.4 - SPINNING SOLUTION CODE, STATISTICAL TERM AND RESPECTIVE CONCENTRATION OF MICROGELS. .................... 23
TABLE 3.5 - DIAMETER AND STANDARD MEAN DEVIATION OF THE ELECTROSPUN COLLOIDAL PARTICLES BY DLS AND SEM
ANALYSIS. ............................................................................................................................................................ 29
TABLE 6.1 - RANDOM MATRIX OF DESIGN OF EXPERIMENTS PROVIDE BY JMP SOFTWARE. ................................................... 47
TABLE 6.2 - CONSTANT VALUES OF THE SOLUTION CONCENTRATION LEVELS. ..................................................................... 50
TABLE 6.3 - INDICATOR PARAMETRIZATION ESTIMATES (TERMS) AND P-VALUES. .................................................................. 51
TABLE 6.4 - MOLECULAR WEIGHT AND VISCOSITY OF THE DEPOLYMERIZED CHITOSAN SAMPLES. .......................................... 55
TABLE 6.5 - STABLE AND NON-STABLE AS-PREPARED MICROGELS DISPERSIONS. ................................................................ 56
TABLE 6.6 - WEIGHT LOSS RELATED TO EACH AS-PREPARED MICROGELS DISPERSIONS. ...................................................... 61
TABLE 6.7 - MEAN FIBER DIAMETER AND MEAN MICROGELS DIAMETER RELATED TO EACH RUN IN DOE ELECTROSPUN
COMPOSITE FIBERS. ............................................................................................................................................. 65

xxiii

xxiv
Abbreviations
APS Ammonium Persulfate
ATR Attenuated Total Reflectance
ACF Autocorrelation Function
Cs Chitosan
ES Electrospinning
DD Deacetylation Degree
DoE Design of Experiments
DTG Derivative Thermogravimetric
DMF Dimethylformamide
FTIR Fourier transform infrared
FIB Focus Ion Bean
LCST Lower Critical Solution Temperature
LSM Least Square Method
MBA N, N-methylene bis-acrylamide
MFD Mean Fiber Diameter
MNPs Magnetic Nanoparticles
MSH Mark-Houwink-Sakurada
OM Optical Microscopy
PCL Polycaprolactone
PEO Poly(ethylene oxide)
PLLA Poly (L-lactic acid)
PNIPAAm Poly (N-isopropylacrylamide)
PS Polystyrene
PVA Polyvinyl alcohol

xxv
PVP Polyvinylpyrrolidone
RSM Response Surface Methodology
RSV Relative Swelling Volume
SBS Sodium Persulfate
SEM Scanning Electron Microscopy
SFEP Surfactant Free Emulsion Polymerization
TGA Thermogravimetric Analysis
UCST Upper Critical Solution Temperature
VPPT Volume Phase Transition Temperature

xxvi
Symbols
V Applied Voltage
Dh Hydrodynamic Diameter
µ Ionic strength
d Working distance
Q Flow Rate
w/w Mass fraction
wt. Mass Total
w/v Mass to volume fraction
Mw Molecular weight
C1 PNIPAAm-40%Cs(1:25) microgels/PEO spinning solution
C2 PNIPAAm-40%Cs(1:33) microgels/PEO spinning solution
C3 PNIPAAm-40%Cs(1:50) microgels/PEO spinning solution
C4 PNIPAAm-30%Cs(1:50) microgels/PEO spinning solution
C5 PNIPAAm-20%Cs(1:50) microgels/PEO spinning solution
C6 PNIPAAm microgels spinning solution
R2 Root mean square
NaOH Sodium Hydroxide
ϕ Viscometer capillary diameter
η Viscosity
v/v Volume fraction

xxvii

xxviii
xxix
Objectives
The main objective of this work is to confine thermosensitive microgels in a fibrous matrix by means of the
electrospinning process to obtain multifunctional nanostructured non-woven mats with high aspect ratio,
which could have potential applications in materials science and biomedical engineering.
The encapsulation of stimuli-responsive PNIPAAm microgels through the electrospinning process gives rise
to composite systems that combine the microgels swelling ability with the interesting features of the ultrafine
surrounding fiber matrix. Additionally, it promotes a structural configuration able to build tailored roughness
surfaces which can be progressively activated and further used to produce fast thermoresponsive devices.
To understand how electrospinning process parameters affect the outcome of the composite colloids/poly-
mer nanofibers production, PNIPAAm and PNIPAAm/chitosan microgels were previously prepared by rang-
ing the concentration and molecular weight of chitosan polymer. By altering the processing parameters and
microgels’ composition, electrospun composite nanofibers were found to be differently patterned by the
thermosensitive microgels.
A major attempt was made to optimize the composite electrospun fiber diameter, ensuring the maximum
aspect ratio. PNIPAAm and PNIPAAm-Cs microgels as well as the composite nanofibers were thoroughly
investigated to get a cause-effect relationship between the properties of microgels and the morphological
features of the nanofibers.

xxx

1
1. Introduction
1.1. Brief Introduction: From Polymer Physics to Colloidal State
Pierre-Gilles de Gennes, in his Nobel lecture in 1991, described the colloidal systems with the expression
“ultra divided matter” [1]. These fascinating materials are related to an intermediate particle size between
solutions of low molecular weight and suspensions [2]. In general, colloidal materials consists of an ensem-
ble of microscopic particles dispersed (1-100 nm) in a continuous phase [3]. Among all colloidal systems
the sub micrometer-sized hydrogel (microgels) particles should be highlighted. Microgels are intra-molecu-
larly cross-linked polymer particles of colloidal size (between 0.1 and 100 µm size) that swell in suitable
solvents [4–6]. Depending on their composition, the solvent-particles interactions can be controlled via ex-
ternal stimuli such as temperature, pH, electric field, magnetic field, ionic strength, chemical or biological
impulses and light [7–9]. The presence of hydrophilic groups results in solvent retention, whereas the swella-
bility is limited by the cross-linking density and solvent quality [9].
Over the past decades, these smart materials have received much attention owing to their environmentally
tunable sizes and potential applications, such as chemical separation, catalysis, sensors, enzyme immobi-
lization and drug delivery systems [10–12].
1.2. Thermosensitive Microgels
Thermosensitive microgels are colloidal particles that can switch their size under a specific range of tem-
perature by interacting with suitable solvents. Since first reported by Pelton and Chibante in 1986 [13], much
attention have been paid to poly(N-isopropylacrylamide) (PNIPAAm) microparticles and its negative thermo-
reversible behavior close to body temperature. This polymer possess a Lower Critical Solution Temperature
(LCST) below which the polymeric chain remains hydrated (“coil” form) and evolves toward a more cohesive
state (recognized as a “globule” form) above this critical temperature [14]. The LCST of linear PNIPAAm
was found to be close to 32ºC in aqueous medium [15].
The thermoresponsive behavior showed by PNIPAM polymer can be understood based on its chemical
structure and particularly on its alkyl hydrophobic groups [16]. As shown in Figure 1.1, NIPAAm monomer

2
has acrylamide (hydrophilic) and isopropyl (hydrophobic) groups. Below the LCST, water forms intermolec-
ular hydrogen bonds with the acrylamide groups. However, as the temperature increases, above LCST,
these hydrogen bonds become weaker [12].
Figure 1.1 - Chemical structure of NIPAAm monomer (adapted from [14]).
This “coil-to-globule” transition is also reflected in the behaviour of cross-linked PNIPAAm microgels. At
room temperature, the hydrophilicity of PNIPAAm microgels leads to a highly swollen state. When heated
above the critical temperature, the responsivity appears as a volume collapse arising from the expulsion of
the solvent (water). This critical temperature is thus referred to as the Volume Phase Transition Tempera-
ture (VPTT), which may or may not be same as the LCST [17]. That balance could be affected by the nature
of the substituent groups, molecular weight, co-solvents, surfactants and salts [18, 19]. The swelling/de-
swelling mechanism is driven by the free energy competition related to polymer-solvent systems upon heat-
ing. The nitrogen and oxygen rich domains of PNIPAAm are hydrophilic (which mainly contribute for the
enthalpy term) above and below the LCST. Nevertheless, at high temperatures the interactions between the
domains of isopropyl groups within the backbone of PNIPAAm are energetically more favourable (high con-
tribution of the entropy term) compared to the solvent-isopropyl interactions that leads to the phase separa-
tion between the microgels dispersions and the surrounding medium (Figure 1.2) [20, 21].
Figure 1.2 – Representative volume phase transition temperature mechanism of PNIPAAm microgels triggered
by the temperature stimuli in aqueous medium.
3
PNIPAAm microgels can be produced by surfactant-free emulsion polymerization (SFEP) in which a radical
polymerization of the NIPAAm monomer takes place in the presence of a water soluble cross-linker [11].
This radical polymerization is started by a thermal initiator, with a decomposition temperature well above
the LCST of NIPAAm. Due to the hydrophobic character of the growing PNIPAAm chains, they collapse into
aggregates up to a critical size (known as precipitation stage) that exceeds the solubility limit of the solvent
(water). At this point the so-called precursor particles tend to form colloidal stable particles. Finally, the
reaction ends up by decreasing the temperature or by inhibition with oxygen.
PNIPAAm microgel surfaces have been conjugated with specific polymers to promote desirable biodegra-
dability [22] and affinity to encapsulate magnetic nanoparticles [11]. For such purpose, in the present work
the chosen polymer was chitosan (Cs). This abundant biopolymer, which derives from the partial deacety-
lation of chitin (major component of the exoskeleton of crustaceans), has numerous attractive properties
namely, biocompatibility, biodegradability, easy assimilation/excretion and nontoxicity [22–24]. Besides, an-
other remarkable characteristic is the pH sensitive behavior demonstrated by this polysaccharide due to the
presence of free amines groups along the chitosan backbone [24].
This dissertation reports on the preparation of PNIPAAm and PNIPAAm/Cs thermosensitive microgels as
precursor systems by means of SFEP in the presence of MBA cross-linking agent, varying the molecular
weight and concentration of Cs polymer. In a forward stage we will focus on the confinement of these mi-
crogels within PEO fibers through the most popular technique to customize ultrafine polymeric fibers, known
as electrospinning.
1.3. Colloidal Electrospinning
Electrospinning is an inexpensive and effective process to yield functional fibers with potential applications
in materials and biomedical engineering, as it has been already proved for a variety of polymers [25]. This
process becomes recognized by the simplicity in producing fibers with remarkable aspect ratio, tunable inter-
fiber porosity and flexibility [26]. It involves the application of an electrostatic force to generate a polymeric
jet towards a collector electrode. In spite of a simplistic setup, the theory behind this technique is not as
simple since the process occurs in three stages, namely: initiation of the jet, elongation and fiber formation
[25, 26]. This can be evidenced by the summarized achievements around the prevention of electrospray
and beaded fibers, which is supposed to occur with spinning solutions of low-molecular weight polymers or
low surface tension [27, 28]. In addition, the properties of solution also can compromise the formation of
Taylor cone and even the start of the process itself [25, 29].
Colloidal electrospinning is similar to the traditional process with the exception of the homogenous solution
that is replaced with a colloidal system consisting in two or more immiscible phases [30]. The presence of

4
particles in spinning solution enables the production of continuous fibers by employing low-molecular weight
polymers or even from dilute polymer solutions [29]. Furthermore, it allows the formation of core-shell fibers
from a single-nozzle offering a much simpler setup than coaxial electrospinning for which two or more nee-
dle-tips are needed [30, 31].
Fiber formation from colloids usually requires the presence of small amounts of a fiber template to promote
additional viscosity. However, if the concentration of particles is sufficiently high, the process can occur
without a polymer fiber matrix as shown by Piperno et al [30]. Since there are enough particles to encom-
pass, the congregation of colloids is routed to a single fiber formation.
One of the benefits of colloidal electrospinning is to modulate the localization of particles to near or on the
surface of the fibers designing a desired topography. The morphology presented by colloids/polymer fiber
composites can be differentiated as either core-shell [31], bead-on-a-string [32], spindle-like [33], or a dis-
persion of the separated phase within the polymer fiber matrix [34]. These morphological characteristics
should be understood based on the evolution of the structures from the precursor colloids to final electrospun
composite fibers. Reliable bead-on-a-string morphologies have a standard distribution along the fiber sur-
face, which only can be achieved by using monodispersed colloids [35]. The spindle-like structure is con-
sidered as particular form of beads, where the notable protrusions are a result of clusters. Aqueous spinning
polymer solutions present more complexity since the colloids distribution along the fiber could be affected
by the water-to-polymer ratio as a result of their behavior in aqueous medium [30, 36]. In case of the hydro-
philic colloids is expected that the particles will be completely entrapped into fiber matrix due to their affinity
to the continuous phase [37].
It is important to notice that beyond the size of particles, the concentration of cross-linked colloids disper-
sions play an important role on structural features. Somehow, multi-levels of stretching and breakup of the
dispersed phases could occur in the entire electrospinning process. Angeles et al. demonstrated that the
non-dispersed particles can breakup in the Taylor cone itself, whereas the smaller ones could break down-
stream in the jet [35]. Besides, Hu et al. reported the elongation of the entrapped particles as a consequence
of high electrostatic forces, and found that increasing the PS particle contents results in the decrease of
average distance between adjacent spheres within PVA fibers [33].
Another attractive characteristic is the formation of hollow fibers by removing the core with a simple step
such as calcination or solvent extraction. Employing this type of approach in spinning solutions with high
feed of particles, fibers with a corn-type structure were produced [30]. Alternatively, a post-crosslinker treat-
ment can be performed in order to obtain non-soluble shells or stable fibers [30, 38].
Core-shell fibers produced by colloidal electrospinning was observed to be an advantage for the develop-
ment of drug reservoirs. In these systems the drug can be gradually released into the body across the thin
walls of the fibers [36]. Hence, most of the studies have been focused on the encapsulation of drugs and
5
biological agents either in a mixture of drug emulsified in a polymer solution [33, 39], or as an emulsion core
spinning with a polymer solution acting as the shell of the fiber [31]. Numerous authors have demonstrated
the effective encapsulation of immiscible drugs inside electrospun fibers and provided further sustained
release of the drug [39–46].
The fascinating reproduction of core-shell structures using the single-nozzle electrospinning has spread to
several studies based on the idea of adding insoluble polymeric particles in spinning solutions [30, 35]. In
this sense, the confinement of stimulus-sensitive microgels in fibers by means of colloidal electrospinning
could be an interesting approach towards the production of multifunctional fibers with fast thermoresponsive
behavior and super-hydrophobic tunable surfaces. That may be used in drug delivery systems, bio-sensing,
chemical separation, catalysis and optics [32, 47].
Few studies reported the confinement of cross-linked PNIPAAm microgels inside nanofibers. For instance,
Nieves et al. produced composite electrospun fibers of PNIPAAm microgels (up to 40% of microgels per-
centage mass) using PVP (which is a hydrogel itself) as fiber template with a mean fiber diameter of 0.9 µm
[47]. Tunable surfaces of electrospun non-woven mats with PNIPAAm microgels/PLLA fibers in which the
production of fibers with a mean fiber diameter of 284 nm connected to bead sizes of 3.4 µm with a spindle-
like structure was reported by Gu et al. [32]. It is noteworthy that in these studies, the dried microgels were
dispersed in organic solvents such as DMF, chloroform and dichloromethane.
At this point we have already described the versatility of the electrospinning technique, the particularity of
colloidal electrospinning and the morphologies that are acquired depending on the spinning colloidal disper-
sion. However, there are important processing parameters that highly affect the morphology and topography
of the electrospun fibers, namely, polymer concentration, flow rate, applied voltage, working distance and
environmental conditions [25, 26]. In literature the effect of the processing parameters were widely studied
for solution electrospinning, which can be similarly described for the systems involving the use of colloids
and fiber polymers matrix. For instance, the reduction of the polymer concentration leads to a decrease on
fiber diameter, whereas increasing the flow rate has the opposite effect [26]. Higher voltages were found to
have a critical influence on the surface roughness of electrospinning non-woven mats [48], while low working
distances are required to obtain interconnected melted fibers [49]. Additionally, environmental high relative
humidity can be used in order to produce circular pores on the fibers [48].
Over the last years, several attempts were made to target desired feature of fibers and ensure the production
of multifunctional surfaces. From an experimental point of view, it is impossible to optimize the process
without spending much time and sources. To overcome this issue and taking account the number of pro-
cessing parameters, statistical tools are needed.

6
1.4. Design of Experiments and Surface Response Methodology
Design of experiments (DoE) is a useful approach for exploring the significant parameter effects and opti-
mum conditions in electrospinning process. As mentioned, the optimization of the process by performing all
possible combinations of factor experiments by single factor experiments, called one-variable-at-a-time,
could be expansive and sluggish. Consequently, several variables and interactions between factors should
be explored by a multifactorial DoE [50].
Amongst all statistical analysis, Response surface methodology (RSM) excels by the outstanding multivar-
iable approach. RSM consists of a collection of mathematical and statistical techniques that are based on
the fit of empirical models to the experimental data. It is widely used to maximize or minimize the measured
response, which has the advantage of taking into account the main variables and their combined effects to
generate numerical approximations. The empirical model implies the use of low-order polynomials instead
of local approximations to the real input/output relationship [50, 51]. Another useful assessment of the model
is that the main parameters and interaction between parameters can be selected from the many less im-
portant ones, and therefore the optimum set of parameters is predicted in accordance with the goal re-
sponse.
As a part of our study, we will produce and characterize the electrospun nanocomposites incorporating
stimuli-responsive microgels by means of colloidal electrospinning. It deals with the optimization of the pro-
cessing parameters for electrospun nanofibers of PEO through RSM, and the incorporation of the microgels
into fibers to examine changes in the morphology.
Few studies reported the optimization of solution electrospinning process using RSM approach. In the work
by Sukigara et al. the RSM was used to model the mean fiber diameter of electrospun regenerated Bombyx
mori silk. They showed that the effect of applied voltage on the fiber diameter, can be compromised by the
concentration of the spinning solution [52]. Mohammadian et al. performed a similar work to find the relation
between the flow rate and the uniformity of PVA fibers [53]. This type of approximation is widely used to
describe the relationship between a target value response and its predictors. It can be considered as prac-
tical and simple data interpretation, since the experimental data can be represented throughout a response
surface or contour plot that is indirectly used to access the optimum set points of parameters predicted by
the equation model [50].

7
2. Materials and Methods
2.1. Materials
N-Isopropylacrylamide (NIPAAm, Aldrich Chemistry, 97%) was used as monomer and N, N-methylene bis-
acrylamide (MBA, Sigma-Aldrich, 99%) as cross-linker, ammonium persulfate was chosen as initiator (APS,
Sigma-Aldrich, 99%) and sodium persulfate (SBS, Acrös Organics) as catalyst. All the reagents were used
as received without any further purification. High molecular weight chitosan (Cs, 470 kDa) was purchased
from Cognis and glacial acetic acid was acquired from Panreac.
2.2. Depolymerization of chitosan
The depolymerization of chitosan was performed using oxidative fragmentation accomplished with the de-
polymerization agent sodium nitrite at room temperature to obtain low molecular weight chitosan samples.
Briefly, chitosan 1% (w/v) was dissolved in 2% (v/v) acetic acid solution. When chitosan was completely
dissolved, the adequate amount of 0.2 M sodium nitrite (EKA) solution was added dropwise for 1 h under
mechanical stirring (at 750-1000 rpm). The reaction mixture was neutralized with 4.0 M NaOH (Merck) so-
lution to precipitate the chitosan (which occurs at approximately pH = 8). The resulting suspension was
recovered by centrifugation (at 10000 rpm for 20 minutes), washed several times with distilled water and
dried by lyophilisation (VaCO2, Zirbus Technology).
2.3. Synthesis of colloidal microgels
PNIPAAm and PNIPAAm-Cs cross-linked microgels were prepared by means of surfactant-free emulsion
polymerization (SFEP) method [11]. All polymerizations were conducted in a 250 mL three-necked round
flask equipped with a reflux condenser, a thermometer and a nitrogen inlet/outlet. The weight percentage of
cross-linker, initiator and catalyst was 10%, 10% and 5%, respectively. NIPAAm and MBA water solutions
were mechanically stirred (at 400-500 rpm for 5 minutes) and purged with nitrogen for 30 minutes. The
reaction was initiated by heating the reactor at 70ºC (well above the LCST of PNIPAAm), immediately fol-
lowed by the addition of APS solution. After 1 h the water soluble catalyst SBS was added. The reaction
proceeded for four more hours at constant temperature (70 ºC), under nitrogen atmosphere. The obtained

8
microgel dispersions were dialyzed against distilled water using a dialysis Spectra/Por molecular porous
membrane. Table 2.1 contains in details the recipes followed for the prepared microgel synthesis.
For the preparation of PNIPAAm-Cs microgels, 1 wt.% of depolymerized chitosan was previously dissolved
in 50 mL of acetic acid solution for 24 h. Firstly, the chitosan solution was added to the reactor before
following the polymerization process methodology mentioned above.
Table 2.1 - Amount of NIPAAm, CS, MBA, APS and SBS used in the emulsions reaction by surfactant free
emulsion polymerization.
Sample Code NIPAAm (g) Cs (g) MBA (g) APS (g) SBS (g)
PNIPAAm 2.5 -- 0.25 0.25 0.125
PNIPAAm-20%Cs (1:25)
1
0.2
0.1
0.1
0.05
PNIPAAm-20%Cs (1:33)
PNIPAAm-20%Cs (1:50)
PNIPAAm-30%Cs (1:25)
0.3 PNIPAAm-30%Cs (1:33)
PNIPAAm-30%Cs (1:50)
PNIPAAm-40%Cs (1:25)
0.4 PNIPAAm-40%Cs (1:33)
PNIPAAm-40%Cs (1:50)
2.4. Design of experiments in electrospinning research
2.4.1. Design of experiments generation
A custom design has been performed using JMP 8.0 (S.A.S. Institute Inc., Cary, NC, USA) to determine the
main factors and interaction effects and to investigate the changes of the responses by varying each factor
in order to predict the fiber diameter performance for concentration solution, applied voltage, flow rate and

9
working distance combinations. The acquired D-optimal design with 27 runs is shown in supplementary
information (section 6.1.1).
2.4.2. Preparation of solutions for electrospinning
For the fiber template the biocompatible polymer PEO (Sigma Aldrich, Mw = 5.000.000) dissolved in water
and ethanol (Scharlau, analytic grade) was used. Solution preparation began by dissolving 2 wt.% of PEO
into mixed solvent water/ethanol at the volumetric ratio of 80:20, respectively. These mixtures were mag-
netically stirred for 4 h to ensure the complete homogenization of the spinning fiber template solution. After
that, the spinning colloidal solutions were prepared by adding the microgels dispersions to the as-prepared
solutions of PEO in a ratio of 1:1 (v/v) under constant stirring for 2 h. Table 2.2 summarizes the ratio obtained
for the mass of microgels in respect to the mass of PEO into the described spinning solutions.
Table 2.2 - Ratio of mass microgels-to-mass PEO polymer fiber matrix.
Sample Code Ratio of Microgels/PEO, (w/w)%
PNIPAAm microgels/PEO 34
PNIPAAm-20%Cs (1:50) microgels/PEO 33
PNIPAAm-30%Cs (1:50) microgels/PEO 16
PNIPAAm-40%Cs (1:25) microgels/PEO 19
PNIPAAm-40%Cs (1:33) microgels/PEO 32
PNIPAAm-40%Cs (1:50) microgels/PEO 18
2.4.3. Colloidal electrospinning experiments
The experimental setup used in electrospinning process includes a regulated high DC voltage power supply
(Glassman High Voltage, EL, USA), a digitally programmable and extremely accurate syringe pump (KD
Scientific, KDS100) and an adapted electrode acting as a ground collector (Figure 2.1).

10
Figure 2.1 – Adapted ground collector used in the electrospinning experiments.
A set of 27 experiments were performed following the generated design of experiments (DoE), as presented
in section 6.1.1 of the supplementary information. The solutions (see Table 2.2) were transferred to a 3 mL
plastic syringe fitted with a 23-gauge blunt tip needle and loaded into a syringe pump programmed to deliver
the polymeric solutions at 0.5, 0.6 or 0.7 mL/h, while the working distance from needle tip to collector was
13, 20 or 27 cm. A voltage of 10, 15 or 20 kV was applied to the needle tip of the syringe to perform the
electrospinning experiments. The process was carried out in a climatic cabin where the temperature was
controlled to be slight above of LCST of each incorporated microgels sample, while the relative humidity
was adjusted between 20-40% for the rapid evaporation of solvents mixture. An aluminum sheet covered
by a blue paper and overlaid by a rectangular ground electrode (covered with aluminum foil) was used to
collect the nanofibers. The schematic illustration and details of dimensional collector´s features are repre-
sented in supplementary information (section 6.2). Electrospinning was run for about 4.5 h and a white non-
woven mat of composite nanofibers was obtained. The resulting non-woven mats were vacuum dried at
room temperature for 24 h to remove any water residues.
2.5. Characterization
The morphological analysis of non-woven mats was achieved by means of optical microscope (OM) and
scanning electron microscope (SEM). For optical microscope images, samples were collected directly onto
glass cover slides during the electrospinning process. Images were take on an OLYMPUS BX51 fitted with
a DP73 CCD Camera Olympus and Olympus Stream Basic 1.9 software to view macroscopic and micro-
scopic features as a guide for spinning solution formulations. All microphotographs of the composite elec-
trospun non-woven mats after colloidal electrospinning were checked with a scanning emission microscopy
equipped with a Carl Zeiss Auriga CrossBeam system (SEM-FIB). A small piece of the non-woven mat was
11
fixed on conductive carbon tape, mounted on the support and then sputtered with a thin layer of gold/palla-
dium (8-10 nm) using a Q300T D Quorum sputter coater. The diameter and distribution of the electrospun
nanofibers were analyzed from SEM images by applying an analysis tool of ImageJ software. At least 50
dried microgels were measured for the minor axis (perpendicular to length fiber) and about 100 fibers were
measured to obtain the average fiber diameter per SEM micrograph.
Dynamic light scattering (DLS) technique was used to determine the hydrodynamic diameter of microgels
and their behavior with temperature in aqueous medium. The equipment used is a Horiba SZ-100 Nanopar-
tica Analyzer light scattering instrument equipped with a 592 nm wavelength He-Ne laser for a fixed angle
of 90º and a Peltier system (25ºC) to control the temperature. All measurements were carried out for diluted
suspensions in a temperature range from 25º to 45ºC within disposable cuvette cells.
For the analysis of the chemical structure Fourier transform infrared (FTIR) transmission spectra were rec-
orded at room temperature on the dried microgels using a FTIR Thermo Nicolet 6700 spectrophotometer.
FTIR spectra were collected using an attenuated total reflectance (ATR) accessory equipped with a single-
bounce diamond crystal with an incident angle of 45º, scanned from 4500 to 500 cm-1, a resolution of 0.4
cm-1 at 20ºC and are a result of 32 scans.
The thermal properties of the synthesized microgel samples were analyzed using the Thermogravimetric
analysis technique (TGA), in a Thermogravimetric Analyzer NETZSCH STA 449F3. The tests were per-
formed for previously freeze-dried microgel samples. Thermograms were recorded from 20º to 700ºC with
a heating rate of 10ºC/min, under a nitrogen gas flow of 30 mL/min.
The viscosity measurements of diluted solution of chitosan were carried out using a Schott-Gerate AVS400
viscometer with a ϕ capillary of 0.53 0.01 mm (Ubbelohde capillary) in 0.2 M acetic acid/ 0.1 M sodium
acetate buffer solution at 30 ºC. The individual polymer solutions were prepared by dissolving the chitosan
into buffer solution under magnetically stirring for 24 h. The temperature of 30 ± 1 ºC was achieved in a
water bath fitted with a thermoregulatory. The various dilutions required during viscosity measurements
were done under constant stirring for 20 minutes. At least five observations of each dilution measurement
were made. Data analysis were performed to calculate the average molecular weight and the intrinsic vis-
cosity of each depolymerized chitosan sample.
To investigate the electrospinning parameters and its effects on the fiber diameter a number of experiments
were required, as described in the previous section. The planning and analysis of these experiments were
performed within the context of Response Surface Methodology (RSM). All electrospun non-woven mats
were morphologically analyzed by SEM and then the diameters of the fibers were measured, as described
early. Results were presented as mean ± standard deviation. JMP (S.A.S. Institute Inc., Cary, NC, USA)
software was used in data interpretation and graphic image design. The software also conducts appropriate
statistical test of hypothesis (see supplementary information in section 6.1.2) concerning the parameters in

12
the mathematical model that is the response surface approximation. The mathematical approximation model
that fit the data experimental points was determined. This approximation was a first-order polynomial re-
garding the second-order interactions, which can be described by the following equation [50, 54]:
𝑦(𝑥) = 𝛽0 + ∑ 𝛽𝑖𝑥𝑖
𝑘
𝑖=1
+ ∑ ∑ 𝛽𝑗𝑥𝑖
𝑘
𝑖=2
𝑥𝑗
𝑘
𝑗<𝑖
+ 𝜀 Equation 2.1
where 𝛽𝑖𝑗 represents the unknown coefficients of the interaction parameters and ɛ is the error term in the
model. The minimum fiber diameter was predicted at a given set of the experimental factors variables by
using the response surface model.

13
3. Results and Discussion
3.1. Thermosensitive microgels
PNIPAAm and PNIPAM-Cs microgels samples with different Cs concentration (from 20 to 40 wt.%) and
molecular weights (of about 30 KDa (Cs (1:25)), 50 KDa (Cs (1:33)) and 85 kDa (Cs (1:50)) were prepared
via surfactant-free emulsion polymerization (SFEP) in the presence of MBA crosslinking agent. We found
that stable microgel dispersions can be obtained in the following cases: (i) a concentration of 40 wt.% Cs,
independently of its molecular weight, and also for (ii) the highest molecular weight Cs within the range of
Cs concentrations used for the synthesis. But below of 30 wt.% of chitosan, the colloidal stability depends
on the molecular weight. For instance, the attempt to prepare microgels with an amount of 30 wt.% adding
the lowest molecular weight depolymerized chitosan sample results in the formation of precipitates, while
the chitosan samples with 50 and 85 kDa lead to stable polymerizations. Furthermore, the synthesis of
microgels containing 20% of Cs was only achieved for the highest molecular weight Cs (85 KDa). These
results can be explained by the zeta potential changes on the negative PNIPAAm surface by adding the
positive chitosan polymer, as stated in the work by Echeverria et al. [11]. They ascribed the formation of
precipitates based on literature measurements, where the commutation of PNIPAAm surface charge only
occurs with high contents of chitosan [22]. They also conclude that below a certain concentration of chitosan
the surface changes could be near the isoelectric point, which promotes the formation of non-stable micro-
gels dispersions. The cross-check results between the emulsion polymerizations and the outcome stability
of colloids synthesis are expressed in the attached section 6.7. Thereby, PNIPAAm and PNIPAAm-Cs stable
obtained microgels dispersions were analyzed by the following tests: chemical analysis (appendix 6.5), mor-
phological analysis SEM (appendix 6.6), thermal evaluations (appendix 6.7), and determination of the swell-
ing properties as well as thermosensitivity.
3.2. Chemical structure of cross-linking PNIPAAm and PNIPAAm-Cs mi-
crogels
ATR-FTIR measurements were carried out to evaluate the compositions of the synthesized microgels. In
particular, it was used to identify the chemical structure and functional groups of PNIPAAm (annex 6.5) and
PNIPAAm-Cs microgels. From Figure 3.1 the depolymerized chitosan, the representative PNIPAAm-Cs and
the PNIPAAm microgels spectra are shown. Regarding the depolymerized Cs spectra, transmittance bands

14
appearing at 1640 cm-1 (amide I), 1572 cm-1 (amide II) and 1395 cm-1 (amide III) are observed. The band
vibration amide II is assigned to the NH deformation from NH2 group in the glucosamine residues, while
amide III vibration mode corresponds to C-O stretching vibration of primary alcoholic group [44]. These
bands are also presented in the PNIPAAm-Cs microgels spectrum. PNIPAAm-Cs spectrum exhibits char-
acteristic bands at 1634, 1530 and 1380 cm-1, which denote amide I, amide II and methyl group, respectively.
In chitosan spectrum, characteristic band associated to vibrations of carbonyl bonds (C=O) of the amide
group -CONHR (amide I) at 1640 cm-1 indicates the incomplete deacetylation of chitin to its derivate chi-
tosan. In addition, this characteristic band is shifted to 1635 cm-1 in the composite microgels spectra and
became more intense. This effect can be attributed to the overlapping of the bands with the same functional
group presented in PNIPAAm structure. The asymmetric stretching of the glyosidic linkages joining two
monosaccharides is showed by the presence of the characteristic band at 1150 cm-1 associated to chitosan
structure. The relative broad vibrational mode at 1070 cm-1 is assigned to symmetric stretching (C-O) of
ether linkage of chitosan backbone, while the small band at 895 cm-1 is assigned to wagging vibration of the
saccharide structure of chitosan. On the other hand, the bands appearing in chitosan spectrum due to the
stretching vibrations of intra and intermolecular H-bonded (-OH) groups in a range from 4000 to 3500 cm-1
can be overlapped with the bands of stretching vibration of N-H groups in PNIPAAm-Cs microgels. Thus,
FTIR spectral data confirmed that PNIPAAm-Cs microgels were successfully synthesized [22, 55–57].
4500 4000 3500 3000 2500 2000 1500 1000
O-H
Stretching
C-H
Stretching Amide II
N-H Stretching
Amide I
C=O Stretching
N-H
Stretching
Tra
nsm
itta
nce
(a
.u.)
Wavenumber (cm-1)
PNIPAAm
Chitosan
PNIPAAm-Cs
Figure 3.1 - ATR-FTIR spectrum of depolymerized chitosan (green), spectra of PNIPAAm microgels (blue) and
representative PNIPAAm-Cs microgels spectra (wine).

15
3.2.1. Swelling properties of PNIPAM-Cs microgels
We measured the microgel particle hydrodynamic diameter by DLS providing the assessment of their ther-
mosensitivity and swelling behavior with temperature in aqueous medium. Figure 3.2 shows the evolution
of hydrodynamic diameters (Dh) and the swelling ability of microgels as a function of temperature in a range
from 25 to 45 ºC. As observed, all microgel hydrodynamic diameters present similar trend with the increase
of temperature. At room temperature microgels are in a swollen state, however their hydrodynamic diameter
decreases sharply above the critical temperature. At higher temperatures, the collapsed state of microgels
takes place and their diameters remain practically constant. Therefore, this increasing in the hydrodynamic
diameter followed by a sudden decrease in volume indicates the negative thermosensitivity or volume phase
transition temperature of microgels.
DLS curves show that the incorporation of chitosan does not eliminate the thermosensitivity of the PNIPAAm
microgels (Figure 3.2 (a)) although it could affect the swelling capacity (Figure 3.2 (b)). For instance, the
incorporation of 30 wt.% Cs reduces the Dh from 940 to 477 nm in the swollen state. Regarding the effect
of Cs molecular weight, it is observed that as the Mw increases the Dh slightly decreases. The PNIPAAm-Cs
microgels with a concentration of 40 wt.% Cs show the smallest hydrodynamic diameter, which is consistent
with other reports [11]. This behavior have been explained by the higher content of chitosan acting as sur-
factant and preventing the growth of PNIPAAm-Cs microgels [22].
In Figure 3.2 (b) the evolution of the microgel relative swelling volume (RSV) with temperature is depicted.
RSV is defined as the ratio between the swollen microgel with respect to the microgel diameter at 25 ºC (Dh
in the collapsed state) [11]. As observed, the RSV with temperature measured for PNIPAAm-Cs is found to
be disadvantaged compared to PNIPAAm microgels. For a concentration of 30 wt.% Cs, data analysis sup-
ports that the RSV is widely reduced by using the high Mw chitosan. Moreover, the microgels containing a
concentration of 40 wt.% Cs show a dramatic decrease in the swelling ability, giving rise to a less pro-
nounced thermosensitivity (with no remarkable differences when varying chitosan’s Mw). The observed re-
sults were also reported by Echeverria et al. [11]. In the work by Jaiswal et al. it was also stated that in highly
cross-linked PNIPAAm microgels, the chitosan polymer could act as cross-linker, which reduces the mobility
of chains [22].
Once the thermosensitivity of the microgel systems has been confirmed and thoroughly analyzed we fo-
cused in the effect that Cs concentration and molecular weight may have in the LCST or transition temper-
ature. Qualitatively, LCST occurs due to the existence of a delicate balance between the hydrophobic portion
(the chain backbone and isopropyl groups) and the hydrophilic portion (acrylamide groups) [58]. For the
sake of comparison we have collected the LCST temperatures obtained for each microgel colloids sample
and summarized in Table 3.1.

16
Figure 3.2 - Dependence of hydrodynamic diameter (Dh) of microgels (a); evolution of the relative swelling
(D/Do); (b) with temperature for samples PNIPAAm (cyan), PNIPAAm-30%Cs (1:50) (orange), PNIPAAm-30%Cs
(1:33) (green), PNIPAAm-40%Cs (1:50) (magenta), and PNIPAAm-40%Cs (1:33) (wine).
Table 3.1 - Stable microgels dispersions and their LCST in aqueous medium.
Sample Code LCST (ºC)
PNIPAAm 34
PNIPAAm-30%Cs (1:33) 35
PNIPAAm-30%Cs (1:50) 35
PNIPAAm-40%Cs (1:33) 37
PNIPAAm-40%Cs (1:50) 36
As observed the LCST of PNIPAAm-Cs microgels were independent of Mw and the percentage of chitosan,
but could be changed upon shifting the hydrophilic/hydrophobic balance [59]. Since that shift reveals to be
partially irrelevant we could infer that the Cs is physically, and not chemically, linked to PNIPAAm in the
microgels formation, confirming the surfactant role of Cs mentioned before [22].
3.2.2. Analysis of the autocorrelation function (cumulant method)
It is of important to highlight the unexpected behavior in the hydrodynamic diameter of colloidal microgels
of two produced samples, PNIPAAm-40%Cs (1:25) and PNIPAAm-20%Cs (1:50) as observed from Figure

17
3.3 (a). A sharp rise in diameter size of the PNIPAAm-40%Cs (1:25) sample was detected from 37º to 38ºC
which corresponds to 426 and 572 nm, respectively. Similarly, the plot of the sample coded with PNIPAAm-
20%Cs (1:50) shows a decrease diameter from 676 to 346 nm and a significant increase up to 372 nm at
35ºC. These results may be attributed to particle agglomeration, as a consequence of the averaging com-
bination of several size distributions. To confirm this fact a thorough data processing (cumulant method,
explained in annex 6.8) was performed by calculating the minimum hydrodynamic diameters of these sam-
ples, from the autocorrelation functions obtained from DLS experiments. Data analysis of calculated (by
cumulant expansion method) and measured Dh for PNIPAAm-20%Cs (1:50) and PNIPAAm-40%Cs (1:25)
microgels are shown on Figure 3.3 (b) and (c), respectively.
Figure 3.3 - DLS curves as a function of temperature for samples PNIPAAm-20%Cs (1:50) (olive) and PNIPAAm-
40%Cs (1:25) (blue) (a), Evaluation of the measured and calculated (red) hydrodynamic diameters for samples
PNIPAAm-20%Cs (1:50) (b), and PNIPAAm-40%Cs (1:50) (c) with the temperature tested range.
From PNIPAAm-20%Cs (1:50) curves, it is revealed that above 28ºC the reduction of hydrodynamic diam-
eter is started further collapsing at 32ºC (Figure 3.3 (a)). It was found that the minimum Dh calculated was
about one order of magnitude above the measured Dh value in a range from 25º to 34ºC. However, the
major difference can be seen above the LCST with a maximum displacement between values of about 8200

18
nm (at 35ºC), which is well above the minimum Dh calculated at the same temperature. On the other hand,
the PNIPAAm-40%Cs (1:25) curve (Figure 3.3 (c)) shows an ambiguous behavior upon heating. The col-
lapsed state of these microgels confirms that the thermosensitivity still present and remains closer to the
hydrodynamic diameter of microgels with 40 wt.% Cs. Nevertheless, an unexpected increasing on Dh can
be seen above the LCST followed by a decreasing and a further increasing on the Dh measurements at 32º
and 36ºC, respectively. From the calculated Dh points it was observed that above the LCST, there is a higher
contribution of the larger “particles” that give rises to higher diameter sizes. Others authors have discussed
this scattering of points (above the LCST) based on the phase separation between the chitosan and
PNIPAAm at higher temperatures, which results in DLS measures performed on chain residues of chitosan
[11]. Based on the cumulant method it was confirmed that the unexpected behavior observed for PNIPAAm-
20%Cs (1:50) and PNIPAAm-40%Cs (1:25) microgels samples above the LCST was due to the presence
of agglomerates.
3.3. Colloidal Electrospinning
3.3.1. Spinning solution and jet forming concentrations
To confine the colloidal particles using the electrospinning method, several conditions must be considered
in order to initiate the process and produce continuous fibers. The fiber formation is mainly dependent on
the materials in the electrospinning solution and the solutions’ properties [28]. The concentration of spinning
solution plays an important role in the fiber formation during the electrospinning process. At low concentra-
tions, electrospraying occurs instead of fibers production because of the low viscosity and high surface
tension of the solution [29]. If the concentration is too high no Taylor cone can be formed and the process
does not even start. Furthermore, all kinds of intermediate states are possible which includes the optimal
concentration state. It is important to notice that solution concentration and viscosity are related to each
other [25]. In a simple spinning solution the viscosity can be adjusted by using a certain amount of polymer,
also recognized as “fiber template”, which gives better conditions for the electrospinning process [30].
In general, to form fibers via electrospinning the polymers have to entangle with each other. Hydrogels (or
linear polymers of high molecular weight) are able to maintain enough number of entanglements of the
polymer chains, but the morphology and the length chain of microgels seem to be a barrier to perform this
entanglement [25]. In this work, jet formation was not observed when spinning the as-obtained microgel
dispersions. In our case, we proposed the use of a “fiber template”, polyethylene oxide PEO, for the for-
mation of fibers. For such purpose, different concentrations of PEO fiber template, 0.4%, 1% and 2 wt.%,
were prepared and then mixed with the as-obtained microgel dispersions at a ratio of 1:1 (v/v). In order to

19
ensure that the microgels were confined in fibrous matrix, optical micrographs were taken and features of
the research fiber structures performed during the formulations of spinning solution were analyzed.
As concluded from the optical micrographs’ analysis the increase of PEO content lead to fibers formation;
even the highest polymer concentration give rise to a fiber formation with a couple of beads. From Figure
3.4 (a), it is noteworthy that with the incorporation of just 0.4 wt.% PEO big microgel beads were connected
by small PEO fibers, while for 1 wt.% PEO the fiber formation partially takes place (Figure 3.4 (b)). At the
concentration of 2 wt.% PEO medium and long fibers without protruding beads were observed (Figure 3.4
(c)). In these circumstances, the production of non-beads fibers can be reached by reducing the surface
tension with the use of appropriate solvents [60]. A widely accepted solvent system for PEO polymer in
spinning solutions is the water/ethanol mixture. The use of ethanol provides fast solvent evaporation, re-
duces the surface tension and increases the viscosity of the spinning solution [61].
Figure 3.4 - Optical images of the representative samples with composite colloids/PEO beads using 0.4 wt.
%PEO (a); short PEO fibers and microgels beads using 1 wt.% PEO (b), and microgel beads confined in PEO
medium and long fibers using a concentration of 2% wt. PEO (c).
By changing the solvent from distilled water to a water/ethanol mixture, while keeping the PEO concentration
constant (2 wt.%), fibers without beads can be produced. The production of fibers from 10%, 15% and 20%
of ethanol as a mixed solvent are shown in Figure 3.5. For the smallest concentration (ethanol (10 % (v/v))
used, the presented microstructure in Figure 3.5 (a) was identical to that shown in the absence of ethanol.
An increase in the amount of ethanol leads to the production of more fibers and less beads. When the
concentration of ethanol was 20% (v/v), long fibers without noticeable beads were produced as presented
in Figure 3.4 (c).

20
Figure 3.5 - Optical images of the representative samples with composite colloids/PEO using a concentration
of 2 wt.% PEO with 10% (v/v) ethanol (a) 15% (v/v) ethanol (b), 20% (v/v) ethanol (c).
Taking into account the analysis of optical micrographs, 2 wt.% of PEO dissolved in water/ethanol 20/80
(v/v)% solvent mixture was chosen for spinning solution and further mixed with the as-obtained microgel
dispersions.
3.3.2. Planning and analysis: surface response methodology
A novel approach involving the Design of Experiments (DoE) was performed in stimuli-responsive microgels
concerning the electrospinning process. The studied composite material system can be described by a
composition of dispersed PNIPAAm or PNIPAAm-Cs microgels randomly entrapped into a fiber PEO matrix.
The experiments were carried out to obtain the combination of factors that will provide the minimum average
electrospun fibers ensuring the maximum aspect ratio. To achieve this, the fiber diameter also should be
smaller than the confined microgels diameter. The selection discussed in section 6.1 from supplementary
information, represents the parameters’ space that will provide suitable and reliable calculations for the
aimed minimization of the fiber diameter. DoE was used to express the experiments at the setting parame-
ters of solution concentration (C), voltage (V), flow rate (Q), and working distance (d). From JMP software,
a D-optimal design with 27 runs was generated (annex 6.1.1).
Among the 27 settings, the minimum fiber diameter was observed by means of SEM at the parameter set-
tings of [PNIPAAm-30%Cs (1:50) microgels/PEO,10 kV, 20 cm, 0.7 mL/h] as 136 ± 72 nm and the maximum
was at [PNIPAAm microgels/PEO, 10 kV, 20 cm, 0.5 mL/h] as 309 ± 107 nm.
Fit model equation
The evaluation of the experimental data was performed by using multiple regression analysis in the frame-
work of Response Surface Methodology (RSM). The relationship between the response (fiber diameter) and
input experimental data is described by a first-order model for second-order interactions, which has unknown

21
coefficients that need to be estimated. For more information access the supplementary information in section
6.1.2.
In the Table 3.2 statistical reports of the fit model are presented. The R2 value (0.95) indicates that the model
fits the experimental data very well, which is a statistical indication of the variability of the fiber diameter.
However the adjacent R2 is very low when compared to R2, indicating that there might be insignificant terms
in the model which could over-fit the predictive goal response [50]. This discrepancy may be a consequence
of a reduced number of runs (experiments) provided by the chosen minimum D-optimal design, instead of
a standard design in order to speed-up the process.
Table 3.2 - Summary of the results from the statistical analysis of the model of the mean fiber diameter.
Mean (nm) R2 R2 adj p-value
205.5 0.95 0.59 0.2313
The indicator parameterization estimates (terms) provided by JMP software are presented in supplementary
data (section 6.1.2). Since the model can be more efficient without the statistically insignificant estimates,
afterwards an evaluation and elimination of these terms the Table 3.3 was built to show only the significant
effects and the important interactions between parameters. The p-values also associated with coefficient
estimates are measures of the statistical significance, whereas the R2 is a measure of the response being
represented by the variables. It is important to note that in most of the samples the residual (difference
between the experimental data and the predicted fiber diameter) is less than the standard deviation of the
predicted fiber diameters.
Response surfaces for the mean fiber diameter
After the unknown coefficients estimation, the equation model exposes the experimental data for the given
set of parameters through response surfaces (Figure 3.6). In order to do that, it is necessary to make several
observations which are described in supplementary information (section 6.1.2). In the following sections the
response surface plots will be described as a function of input processing variables (applied voltage, solution
concentration, working distance, and flow rate) and the p-values from Table 3.3 will be considered to eval-
uate the statistically significance of the variables and interactions between variables on the mean fiber di-
ameter (MDF).

22
Table 3.3 - Test on individual coefficients for the model of mean fiber diameter.
Term Coefficients p-value*
Constant 33.54 < 0.001
C1 -4.26 0.0237
C2 -6.88 0.0063
d 10.02 0.0021
VC1 -6.36 0.0079
VC2 -3.27 0.0467
VC3 3.44 0.0412
VC4 -3.51 0.0393
QC6 -5.15 0.0142
dC6 -5.45 0.0121
dC1 -5.58 0.0114
dC2 -7.74 0.0048
dV -3.64 0.0359
* The p-values closer to zero are statistically more significant on the mean fiber diameter.
Effect of concentration in the fiber diameter
As described above, the spinning colloid systems (with different concentrations of microgels) were used by
keeping constant the fiber polymer concentration (2 wt.% PEO), thus the concentration of solution parameter
is mainly dictated by the concentration of microgels in spinning solution. In order to simplify the representa-
tion of this parameter, a change of code variable was made. Over the surface response analysis, the solution

23
concentration levels (Cx), the respective sample code, and their contents of microgels in spinning solutions
are expressed as presented in Table 3.4.
It is important to note that these spinning microgels dispersions are heterogeneous systems and, therefore,
during the process a gradient of concentrations could occur. In accordance with this, the concentration of
microgels in the electrospun polymer matrix might be slight different than the theoretically calculated con-
centration for the loaded spinning solution. Additionally, microgels with high Dh in the swollen state and
agglomerates in solution are more likely to settle on into syringe.
As reported in literature, an increase in solution concentration (likewise increases the viscosity) enhances
the entanglement of polymers chains yielding fibers with larger diameters [28]. This leads to an increase in
viscoelastic force, meaning that for the same electrostatic stretching force (same electrical field) higher di-
ameter fibers are produced [26].
Table 3.4 - Spinning solution code, statistical term and respective concentration of microgels.
Spinning solution code Parameter term Ratio of Microgels/PEO (w/w)%
*PNIPAAm-40%Cs (1:25) microgels/PEO C1 19
*PNIPAAm-40%Cs (1:33) microgels/PEO C2 32
PNIPAAm-40%Cs (1:50) microgels /PEO C3 18
PNIPAAm-30%Cs (1:50) microgels/PEO C4 16
**PNIPAAm-20%Cs (1:50) microgels/PEO C5 33
**PNIPAAm microgels/PEO C6 34
* Solution concentration levels with a high content of microgels which can affect the MFD.
** Solution concentration levels with a high content of microgels, but do not affect the MFD.
In this work, the effect of concentration solution is shown in Figure 3.6 C, D, and E. The MFD was found to
be widely affected by C1 and C2 samples (PNIPAAm-40%Cs (1:25) microgels/PEO and PNIPAAm-40%Cs
(1:33) microgels/PEO, respectively). That can be due to the higher concentration of microgels in spinning
solution. Moreover, the effect of the concentration of microgels on the MFD will be discussed for two cases:
(i) for a content of 40 wt.% Cs in microgels with the higher concentration of microgels and, also (ii) for the
highest concentration of microgels among all spinning solutions. In the case of samples with 40 wt.% of
chitosan, it was observed that the PNIPAAm-40%Cs (1:25) microgels/PEO and PNIPAAm-40%Cs (1:33)

24
microgels/PEO affected the MFD. By using spinning solutions with high concentration of microgels is ex-
pected an increment of the solution´s viscosity leading to high fiber diameters. However, this effect is not
observed in the case of the systems containing the highest concentration of microgels, namely C5 and C6
(for PNIPAAm-20%Cs (1:50) microgels/PEO and PNIPAAm microgels/PEO samples, respectively). This
might be a result of a low content of chitosan in C5 microgel dispersions or could be due to the lower loading
of microgels during the spinning process, as stated before. By DLS measurements it was determined that
PNIPAAm microgels had the high Dh in the swollen state and the PNIPAAm-20%Cs (1:50) microgels sample
had agglomerates, which could settle down on the syringe during the electrospinning process because their
high size.
In this regard, the composition of the composite electrospun fibers might also be affected ending up in the
unrealistic predicted response by the fit model equation and depicted in Figure 3.6 (E). The predictive re-
sponse over-fit also might be a result of the use of first-order models, where the interactions (C3)2 are not
considered.
The concentration effect on MFD was more pronounced at long working distances (Figure 3.6 C), as it will
be later discussed in this work. In the case of high diluted solutions long distances provides more time not
only to stretch the jet towards the collector but also to evaporate the solvent, thereby favoring thinner fiber
formation. At higher concentration there are denotative chain entanglements resulting in higher viscoelastic
forces that provide resistance to the applied voltage, resulting in higher MFDs [29].
Effect of applied voltage in fiber diameter
In general, an increase on the applied voltage causes a high stretching of the ejected solution, which results
in the reduction of the fiber diameter. Although, the effect of applied voltage in fiber diameter is controversial
(may increase, decrease or even not change). Interestingly, Reneker and Chun demonstrated that there is
no significant effect of the applied voltage on the PEO electrospun nanofibers diameter [25].
From Figure 3.6 A, B, and E the effect of the applied voltage on the MFD can be highlighted. It was found
that increasing the applied voltage, MFD can increase or decrease depending on the concentration of solu-
tion to some extent (as shown in Figure 3.6 E). The interaction between the concentration and the applied
voltage is not straightforward. The effect of the applied voltage on MFD reveals to be widely compromised
by the C2 and C3 (PNIPAAm-40%Cs (1:33) microgels/PEO and PNIPAAm-40%Cs (1:50) microgels/PEO
samples, respectively). In the case of C2 an increasing in voltage leads to thinner fiber diameters, whereas
using the C3 sample results in larger fiber diameters. In addition, the effect of the applied voltage was highly
enhanced for shorter distances (Figure 3.6 A). Low working distances and high applied voltages are a mean
to produce larger fiber diameters. Looking at the response surfaces, it is evidenced that there is a huge
interaction between voltage and working distance, a slight interaction between applied voltage regarding

25
the effect of few solution concentrations and no interaction between voltage and flow rate which is in agree-
ment with the presence of Vd, VC1, VC2, VC3, and VC4, and absence of VQ, VC5, and VC6 in the model of
MFD (Table 3.3).
Effect of working distance in fiber diameter
A slight increase of distance between the tip and collector favors the decreasing of the straight polymeric
jet, ending up in thinner MDF values. As related in the literature the distance between the needle tip and the
collector can influence the fiber diameter, but the level of significance varies with the polymer concentration
and the working distance [29, 49].
In this work, the drastic effect of working distance in fiber production was confirmed by its p-value. The d
factor seems to be a dominant factor and explains most of the variance around the fiber diameter of the 27
measured MFD.
From Figure 3.6 A, C and F the effect of working distance in fiber diameter can be observed. The increasing
effect of the working distance on MFD was assisted by the applied voltage, resulting in higher MFDs (Figure
3.6 A). The interaction between the applied voltage and solution concentration is depicted in Figure 3.6 E.
As observed, the C1, C2 and C6 (PNIPAAm-40%Cs (1:25) microgels/PEO, PNIPAAm-40%Cs (1:33) micro-
gels/PEO and PNIPAAm microgels/PEO samples, respectively) have a larger effect on the MFD. This is
confirmed by the presence of dC1, dC2 and dC6 terms in the model. In fact C2 and C6 sample contain the
highest concentration of microgels amongst all spinning solutions, which could derive in the increasing of
viscosity. Thus, the electrostatic stretching force becomes weaker resulting in higher MFDs.
3.3.2.4.1. Effect of flow rate in fiber diameter
It is well known that a minimum value for solution flow rate is required in order to obtain a drop of polymer
at the tip of the needle, and therefore the formation of a stable Taylor cone. Reduction of the flow rates was
reported as a strategy to decrease the fiber and bead diameter [25]. The effect of flow rate can be observed
from the Figure 3.6 B, D and F. In this study the flow rate parameter slightly affected the MDF of PNIPAAm
microgels/PEO fibers (QC6), independently of the remaining variables. That was suggested early by the
absence of Q, Qd, QV, QC1, QC2, QC3, QC4, and QC5 terms.

26
Figure 3.6 – Response surfaces for the mean fiber diameter in terms of: (A) applied voltage and working dis-
tance, (B) flow rate and applied voltage, (C) working distance and sample code, (D) sample code and flow rate,
(E) flow rate and sample code and (F) working distance and flow rate.

27
3.3.2.4.2. Optimum window of set parameters
By using the model equation was obtained the optimum set point of parameters represented by the data
values of PNIPAAm microgels/PEO sample, 15 V, 20 cm and 0.6 mL/h for the solution (concentration),
working distance and flow rate, respectively. From these parameters, a single non-woven mat was obtained
with a MFD of 63 ± 25 nm to prove that the prediction model was suitable (Figure 3.7 (a), (b) and (c)). From
Excel software, the histogram of the fiber diameter presented by the electrospun non-woven mat was de-
termined (Figure 3.8). It is important to observe that the minimum fiber diameter ensures a high aspect ratio,
although can compromise the efficiency of confinement.
Figure 3.7 - SEM images of composite PNIPAAm microgels/PEO electrospun nanofibers using the optimum
set of parameters (15 kV, 20 cm and 0.6 mL/h) for a bead-on-a-string morphology (a), for ultrafine PEO fibers
with few PNIPAAm microgels confined (b), and for petal beads structures (c).
Figure 3.8 - Fiber diameter for the electrospun PNIPAAm microgels/PEO non-woven mat obtained from the
optimum set of parameters in the framework of the RSM with a mean fiber diameter of 63 nm.

28
3.4. Surface morphology analysis
The morphology of the microgels, PNIPAAm microgels/PEO fibers and PNIPAAm-Cs microgels/PEO fibers
were checked by means of scanning electron microscopy (SEM) after the colloidal electrospinning using the
27 DoE runs (annex 6.9). From Figure 3.9, it can be observed that the electrospun non-woven mats exhib-
ited sub-micron fiber diameter with microgels entrapped in “beads-on-a-string” structures and high level of
relative porosity. The mean diameter of the electrospun nanofibers via DoE in electrospinning research was
found to be between 136 and 309 nm.
Figure 3.9 - SEM micrograph of PNIPAAm-20%Cs (1:50) microgels/PEO composite fiber used in DoE study
experiment #12.
The size of single microgel particles measured from SEM was in a range of 136 – 387 nm, which was smaller
than observed by DLS (Table 3.5).The differences lies in the sample preparation method for each technique.
In the case of DLS, hydrodynamic diameter of dispersed swollen microgels was measured whereas micro-
gels were dried for their analysis in SEM.
In most of the samples the beads present an ellipsoidal morphology and were randomly distributed along
the nanofibers. These beads represent critical points of agglomeration that encapsulate several microgels
with different sizes, which is supposed to exist in emulsion microgels dispersions (comparative SEM images
in annex 6.6). During the electrospinning process, the microgels would be elongated and deformed under
the electrostatic forces intrinsic to the process as reported by Angeles et. al [35]. Additionally, Wang et al.
explored the same evolution by microfluidics and observed that the largest emulsion particles change their
shape and breakup into smaller droplets due to the highest electrical field at emulsified particle/continuous
phase interface [62].

29
Table 3.5 - Diameter and standard mean deviation of the electrospun colloidal particles by DLS and SEM anal-
ysis.
Sample Code Dh in the swollen state (nm) SEM diameter (nm)
PNIPAAm microgels/PEO 940 ± 97 357 ± 100
PNIPAAm-20%Cs (1:50) microgels/PEO 658 ± 26 252 ± 105
PNIPAAm-30%Cs (1:50) microgels/PEO 507 ± 42 238 ± 70
PNIPAAm-40%Cs (1:25) microgels/PEO 540 ± 11 216 ± 54
PNIPAAm-40%Cs (1:33) microgels/PEO 393 ± 8 197 ± 54
PNIPAAm-40%Cs (1:50) microgels/PEO 404 ±1 188 ± 52
The mean fiber diameter among all electrospun PNIPAAm microgels/PEO samples was found to be be-
tween 186 and 385 nm, whereas the average diameter of PNIPAAm-Cs microgels/PEO fibers was meas-
ured in a range from 136 to 302 nm. From statistical analysis, it was found that the mean fiber diameter of
the PNIPAAm-40%Cs (1:50) microgels/PEO fibers of about 221 nm was negligible when compared with the
average diameter of PNIPAAm-30%Cs (1:50) microgels/PEO of about 196 nm and also with the mean fiber
diameter of 173 nm provided by PNIPAAm-20%Cs (1:50) microgels/PEO electrospun fibers.
3.4.1. Effect of the concentration of microgels in spinning solution
In this work it was observed that the PNIPAAm microgels/PEO and PNIPAAm-20%Cs (1:50) microgels/PEO
electrospun nanofibers had spherical beads, while the other samples had substantially spindle-like beads.
Several works involving the solution electrospinning related this type of beads (spindle-like structures) to an
intermediate state between spherical beads and continuous fibers due to the low solution concentration [25].
Based on the concentration of microgels, it was found that below a concentration of 33% (w/w) microgels
the beads had a spindle-like structure, whereas above this critical concentration few microgels were incor-
porated in spherical beads as shown by PNIPAAm microgels/PEO and PNIPAAm-20%Cs (1:50) micro-
gels/PEO samples. In general, higher contents of microgels in the as-prepared spinning solutions yielded
the decreasing of the size and elongation showed by the beads structures. This can be related to the higher
content of microgels thereby increasing the viscosity of solution, as reported by Ajalloueian et al. within the

30
electrospinning of PLGA/Chitosan colloids work [63]. Therefore, it can be concluded that for aqueous-col-
loids microgels dispersions the increase of the amount of microgels seems to be a good strategy to design
the desirable topography of electrospun composite nanofibers.
The electrospun fiber diameter also increased with the concentration of microgels leading to an increase of
viscosity in the spinning solution, as it has been discussed in the response surfaces section. Nevertheless,
for the PNIPAAm-30%Cs (1:50) microgels/PEO composite fibers the mean fiber diameter was found to be
between 140 and 237 nm, while the PNIPAAm microgels/PEO fiber diameter were measured in a range
from 152 to 309 nm.
3.4.2. Effect of the chitosan in microgels structure on fibers morphology
The amount of microgels in PNIPAAm-Cs microgels/PEO spinning solutions seems to be a condition to build
high levels of agglomeration in beads structures. In this work, in contrast to the results observed by Díaz et
al. [47], it was found that increasing the concentration of microgels does not reveal remarkable levels of
aggregation in beads structures (PNIPAAm-20%Cs (1:50) microgels/PEO fibers). This might be attributed
to the sedimentation of these microgels in the syringe. On the other hand, the variation of the amount of
chitosan (wt.%) in the electrospun microgels does not affect the beads structure or the morphology of the
fibers, as depicted in Figure 3.10.
Figure 3.10 - SEM micrographs of composite fibers (a) PNIPAAm-20%Cs (1:50) microgels/PEO used in DoE
study experiment #25; (b) PNIPAAm-30%Cs (1:50) microgels/PEO used in DoE study experiment #3 and (c)
PNIPAAm-40%Cs (1:50) microgels/PEO used in DoE study experiment #16.

31
3.4.3. Effect of the molecular weight of chitosan in electrospun beads structures
From Figure 3.11 the effect of the molecular weight of chitosan (in the as-prepared PNIPAAm-40%Cs mi-
crogels dispersions) in the electrospun non-woven mats is shown. As observed, the Mw influenced the
stretching of the beads. At low Mw of chitosan, PNIPAAm-40%Cs (1:25) microgels/PEO sample, the beads
presented an elongated form and were randomly distributed on the surface of the fiber (Figure 3.11 (a)). On
the contrary, the use of high Mw of chitosan (PNIPAAm-40%Cs (1:50) microgels/PEO composite electrospun
fibers) leads to protruding beads with a larger volume, containing most of the microgels (Figure 3.11 (c)).
Amongst the performed electrospinning experiments, the mean fiber diameter was found to be about of 210,
209.5 and, 221.4 nm for the samples with PNIPAAm-40%Cs (1:25), PNIPAAm-40%Cs (1:33) and
PNIPAAm-40%Cs (1:50) microgels/PEO, respectively. While the mean diameter of the dried microgels of
about 188, 197 and 216 nm was observed for PNIPAAm-40%Cs (1:25), PNIPAAm-40%Cs (1:33) and
PNIPAAm-40%Cs (1:50) microgels dispersions, respectively.
Figure 3.11 - SEM micrographs of composite fibers (a) PNIPAAm-40%Cs (1:25) microgels/PEO used in DoE
study experiment #9; (b) PNIPAAm-40%Cs (1:33) microgels/PEO used in DoE study experiment #15 and (c)
PNIPAAm-40%Cs (1:50) microgels/PEO used in DoE study experiment #21.

32
3.4.4. Effect of the concentration of chitosan on topography of the fibers
Another important study is the correlation of the chitosan´s concentration and the topography of the resulting
fibers as presented in Figure 3.12. The use of microgels with incorporated chitosan reveals to be a benefit
to produce non-woven mats with higher surface roughness. It is evidenced that the PNIPAAm micro-
gels/PEO electrospun nanofibers appear to be smother than PNIPAAm-Cs/PEO non-woven mats (Figure
3.12 (a) and (b), respectively). The PNIPAAm-Cs microgels/PEO electrospun nanofibers had a similar to-
pography compared to that obtained in the work by Yuan et al. based on electrospun fibers of linear Cs-g-
PNIPAAm/PEO, which included the intermediate state of production fibers with beads structures [64]. Be-
sides, the formation of clusters was more evident in the electrospun fibers containing PNIPAAm-Cs micro-
gels. Thereby, an increasing the amount of chitosan in microgels´ structure provides the formation of larger
agglomerates in beads. This might be related to the change from positive to negative surface charge of the
PNIPAAm-Cs microgels upon adding the chitosan polymer [22], which provides better conditions to create
agglomerates in preferential spots (beads).
Figure 3.12 - SEM micrographs of composite fibers (a) PNIPAAm microgels/PEO used in DoE study experiment
#1 and (b) PNIPAAm-40%Cs (1:50) microgels/PEO used in DoE study experiment #24.
Colloidal electrospinning defects
During the electrospinning experiments other type of morphologies related to defects in traditional electro-
spinning were also observed. Phase separation between the PEO fiber matrix and the cross-linked micro-
gels dispersions was detected. In Figure 3.13 (a), it is perceptible that some microgels were kept in the PEO
phase when solvents evaporation took place during electrospinning process. When the microgels disper-
sions flowed through the needle-tip, the jet was subjected to expanding and bending phenomena, providing
the accumulation of the dispersed phase in the center of the liquid for the elongation effect towards the

33
collector electrode. Nevertheless, some particles were not fully entrapped within the fibers. That can be
attributed to the hydrophobic character of the microgels, which might cause the microgels settle out on the
fiber surface rather than in the core. It is notable that a few of them have formed random agglomerates. The
mean diameter of composite electrospun nanofibers was found to be 196 ± 139 nm, whereas the microgels
had an average diameter of 239 ± 48 nm.
Structures with a type of burst-beads were also detected for some DoE experiments especially with the
increased amount of chitosan (Figure 3.13 (b)). This type of morphology was often noted in case of polymeric
skin, on the jet covering the dispersed particles at first and then collapsing by fast solvent evaporation [55].
Unexpectedly, ribbon-like structures (rectangular section) were also detected in some samples (Figure 3.13
(c)). Other groups have already reported similar fiber morphology even using one-phase electrospinning
technique in the case of skin formation on the jet surface followed by a fast solvent evaporation [27, 30, 31,
65, 66].
Figure 3.13 - SEM micrograph of the representative composite fibers with defects (a) phase separation between
the PNIPAAm-40%Cs (1:25) microgels and the PEO matrix observed in DoE study experiment #4, (b) with
burst-beads showed by PNIPAAm-40%Cs (1:33) microgels/PEO fibers in the DoE study experiment #5, and (c)
ribbon-like structures for PNIPAAm-40%Cs (1:50) microgels/PEO fibers with produced in DoE study experi-
ment #9.

34

35
4. Conclusions and Future Perspectives
This dissertation was focused on the confinement of thermosensitive microgels using the colloidal electro-
spinning process. In order to build nanostructured composites able to encapsulate stimuli-responsive mi-
crogels, PNIPAAm and PNIPAAm-Cs microgels dispersions (950-400 nm) were produced and further mixed
with a solution of PEO polymer. These spinning solutions were loaded for the electrospinning (ES) and using
the design of experiments several non-woven mats were produced. The resulting composite nanofibers had
a mean fiber diameter between 136 and 309 nm with the confinement of microgels with 100-400 nm. In this
way, not only the confinement of the microgels was achieved, but also the relationship between the precur-
sor materials and the fiber diameter was studied. To ensure the minimum mean fiber diameter and to find a
relation between the starting materials and the processing parameters, this work was divided in different
parts: synthesis and characterization of the thermosensitive microgels, statistical analysis by applying the
design of experiments (DoE) within the context of response surface methodology (RSM), and production of
the composite fibers as well as their morphological characterization.
The precursor materials were produced by means of SFEP, varying the concentration (20, 30 and 40 wt.%)
and the molecular weight (30, 50 and 85 kDa) of Cs polymer. From DLS results, it was found that all micro-
gels dispersions were thermosensitive, although the incorporation of Cs affected the swelling capacity. The
PNIPAAm-Cs microgels with a concentration of 40 wt.% Cs showed the smallest Dh and also the poorest
swelling ability. That is in agreement with the literature and has been explained by the higher content of
chitosan which could act acting as surfactant or even as cross-linker agent, preventing the growth of
PNIPAAm-Cs microgels. In addition, the PNIPAAm-20%Cs (1:50) and the PNIPAAm-40%Cs (1:25) micro-
gels revealed the formation of larger agglomerates in colloids emulsions.
Our study on morphology confirmed that microgels were confined in electrospun PEO fibers. Remarkably,
we observed that the solutions with the highest concentration of microgels (PNIPAAm microgels/PEO and
PNIPAAm-20%Cs (1:50) microgels/PEO) originated composite fibers with spherical beads which incorpo-
rated one to few spherical microgels. We consider that these samples due to the high Dh in the swollen state
of PNIPAAm microgels and also the presence of agglomerates in the PNIPAAm-20%Cs (1:50) samples,
could promote the microgels settle on in syringe during the ES process. It was also observed that the low
Mw Cs influenced the stretching of the beads. Thereby using the PNIPAAm-40%Cs (1:25) microgels/PEO
sample, beads with an elongated form and randomly distributed on the surface of the fiber were observed.
Besides, the formation of clusters in the PNIPAAm-Cs microgels/PEO nanofibers with the increasing of Cs
in colloids structure was observed.
The ES experiments were carried out following through the four factor (solution, applied voltage, working
distance and flow rate) design of experiments. By using the RSM aimed to minimize the mean fiber diameter

36
(MFD) the optimum set of processing parameters was found (15 kV, 20 cm, 0.6 mL/h and PNIPAAm micro-
gels/PEO sample), and therefore a singular non-woven electrospun mat was produced with a mean diame-
ter of 63 ± 25 nm. Regarding the RSM the following effects were observed:
PNIPAAm microgels/PEO and PNIPAAm-40%Cs (1:33) microgels/PEO samples were observed to
be significant on the MFD. The categorical parameter of solution concentration is not straightforward
leading to surface responses with levels. Therefore, an increasing in solution concentration might
lead or not to larger diameters. The MFD of the fibers containing PNIPAAm-20%Cs (1:50) microgels
is the only sample for which the MFD was not affected by the other variables. In this case, the control
of fiber diameter in nanometric scales could only be performed on this sample alone;
The working distance was found to be significant in nanoscale fiber diameter. At high working dis-
tances and low applied voltages, the MFD increased dramatically. Among all samples, the effect of
working distance was more pronounced for PNIPAAm-40%Cs (1:33) microgels/PEO fibers in which
an where an increasing on working distance leads to larger fiber diameters;
Rising the applied voltage, MDF was observed to increase at low distances mostly in the case of
PNIPAAm-40%Cs (1:33) microgels/PEO and PNIPAAm microgels/PEO samples;
MFD slightly increased with flow rate, but only for the PNIPAAm microgels/PEO sample. However,
the impact of flow rate was not related to the other variables.
Electrospun fibers generated from microgels dispersions can be tailored in a wide variety of fiber polymer
template (PVA, PVP, PCL and PLLA). The composition and concentration of microgels must be adjusted to
allow for a precise control over the morphological features of the fibers. For non-soluble polymer matrix,
surface tension might be performed to evaluate the PNIPAAm and the PNIPAAm-Cs surfaces´ hydrophobi-
city correlating their behaviour with the surface roughness. Having in mind the potential application of
PNIPAAm-Cs-MNPs in hyperthermia and drug delivery systems, the incorporation of magnetite should be
made during the SFEP. In future attempts of electrospun microgels incorporating inorganic compounds,
morphological assessments should be realized since the drug can affect the fiber topography and drug
distribution. An interesting detail is that a single microgel confined in “bead-on-a-string” can be gradually
active in aqueous medium triggered by temperature. To customize this type of structures, dispersion method
and control of the microgels´ concentration should be performed. By using a UCST-like polymer as fibre
template, negative and positive temperature responsive composite fibers which can have a reverse behav-
iour by increasing the temperature could be obtained. Additionally, the biocompatibility of the electrospun
microgels/PEO fibers should be evaluated by cell culture assay, testing the cell adhesion and growth, pro-
liferation and cytotoxicity. Regarding the field of application and depending on the VPPT of microgels, these
electrospun composite fibers have the potential to be employed in a wide range of devices, from optics to
scaffolds.

37

38
5. References
[1] P.-G. De Gennes, “Nobel Lecture - Soft Matter,” Paris, France, 1991.
[2] J. Bergenholtz and M. Fuchs, “Gel transitions in colloidal suspensions,” J. Physics-Condensed Matter, vol. 11, no. 50, pp. 10171–10182, 1999.
[3] W. Łużny, “Soft Matter Physics and its Creator – Pierre-Gilles De Gennes (1932–2007) in Memoriam,” East. Eur., vol. 16, no. 6, pp. 104–106, 2008.
[4] B. R. Saunders, N. Laajam, E. Daly, S. Teow, X. Hu, and R. Stepto, “Microgels: From responsive polymer colloids to biomaterials,” Adv. Colloid Interface Sci., vol. 147–148, pp. 251–262, 2009.
[5] N. Sanson and J. Rieger, “Synthesis of nanogels/microgels by conventional and controlled radical crosslinking copolymerization,” Polym. Chem., vol. 1, no. 7, p. 965, 2010.
[6] T. Hoare and R. Pelton, “Microgels and Their Synthesis: An Introduction,” in Microgel Suspensions: Fundamentals and Applications, A. Fernández-Nieves, J. Mattsson, D. A. Weitz, and H. M. Wyss, Eds. Weinheim: WILEY-VHC, 2011, pp. 3–32.
[7] M. Wang, J. Qiang, Y. U. Fang, D. Hu, Y. Cui, and X. Fu, “Preparation and Properties of Chitosan-Poly (N- isopropylacrylamide) Semi-IPN Hydrogels,” Polym. Sci., vol. 38, pp. 474–481, 1999.
[8] M. Seeber, B. Zdyrko, R. Burtovvy, T. Andrukh, C. Tsai, and J. R. Owens, “Surface grafting of thermoresponsive microgel nanoparticles,” Soft Matter, vol. 7, pp. 9962–9971, 2011.
[9] M. Hamidi, A. Azadi, and P. Rafiei, “Hydrogel nanoparticles in drug delivery,” Adv. Drug Deliv. Rev., vol. 60, no. 15, pp. 1638–1649, Dec. 2008.
[10] E. M. Ahmed, “Hydrogel: Preparation, characterization, and applications,” J. Adv. Res., pp. 1–17, Jul. 2013.
[11] C. Echeverria, P. Soares, A. Robalo, C. M. M. Novo, J. P. Borges, I. Ferreira, and L. Pereira, “One-pot synthesis of dual-stimuli responsive hybrid PNIPAAm-chitosan microgels,” Mater. Des., vol. 86, pp. 745–751, 2015.
[12] M. A. Ward and T. K. Georgiou, “Thermoresponsive Polymers for Biomedical Applications,” Polymers (Basel)., vol. 3, no. 4, pp. 1215–1242, Aug. 2011.
[13] R. Acciaro, T. Gilányi, and I. Varga, “Preparation of monodisperse poly(N-isopropylacrylamide) microgel particles with homogenous cross-link density distribution,” Langmuir, vol. 27, no. 12, pp. 7917–7925, 2011.

39
[14] E. Gil and S. Hudson, “Smart thermoresponsive coatings and surfaces for tissue engineering: switching cell-material boundaries,” Prog. Polym. Sci., vol. 29, no. 12, pp. 1173–1222, Dec. 2004.
[15] M. Constantin, M. Cristea, P. Ascenzi, and G. Fundueanu, “Lower critical solution temperature versus volume phase transition temperature in thermoresponsive drug delivery systems,” Express Polym. Lett., vol. 5, no. 10, pp. 839–848, Jul. 2011.
[16] Y. Qiu and K. Park, “Environment-sensitive hydrogels for drug delivery,” Adv. Drug Deliv. Rev., vol. 53, no. 3, pp. 321–339, Dec. 2001.
[17] B. R. Saunders, “On the Structure of Poly(N-isopropylacrylamide) Microgel Particles,” Langmuir, vol. 20, no. 7, pp. 3925–3932, 2004.
[18] R. R. Kokardekar, V. K. Shah, and H. R. Mody, “PNIPAM Poly (N-isopropylacrylamide): A Thermoresponsive ‘Smart’ Polymer in Novel Drug Delivery System,” Med. Updat., vol. 7, no. 2, pp. 60–63, 2012.
[19] E. Daly and B. R. Saunders, “Temperature–dependent electrophoretic mobility and hydrodynamic radius measurements of poly(N-isopropylacrylamide) microgel particles: structural insights,” Phys. Chem. Chem. Phys., vol. 2, no. 14, pp. 3187–3193, 2000.
[20] R. Pelton, “Poly (N-isopropylacrylamide) (PNIPAM ) is never hydrophobic,” J. Colloid Interface Sci., vol. 348, no. 2, pp. 673–674, 2010.
[21] J. Wu and Z. Hu, “Microgel Dispersions: Colloidal Forces and Phase Behaviour,” Dekker Encycl. Nanosci. Nanotechonology, pp. 1967–1976, 2004.
[22] M. K. Jaiswal, R. Banerjee, P. Pradhan, and D. Bahadur, “Thermal behavior of magnetically modalized poly(N-isopropylacrylamide)-chitosan based nanohydrogel,” Colloids Surfaces B Biointerfaces, vol. 81, pp. 185–194, Nov. 2010.
[23] Y. Wang, J. Wang, L. Ge, Q. Liu, L. Jiang, J. Zhu, J. Zhou, and F. Xiong, “Synthesis, properties and self-assembly of intelligent core-shell nanoparticles based on chitosan with different molecular weight and N-isopropylacrylamide,” J. Appl. Polym. Sci., vol. 127, no. 5, pp. 3749–3759, 2013.
[24] M. Dash, F. Chiellini, R. M. Ottenbrite, and E. Chiellini, “Chitosan - A versatile semi-synthetic polymer in biomedical applications,” Prog. Polym. Sci., vol. 36, no. 8, pp. 981–1014, 2011.
[25] N. Bhardwaj and S. C. Kundu, “Electrospinning: A fascinating fiber fabrication technique,” Biotechnol. Adv., vol. 28, no. 3, pp. 325–347, 2010.
[26] S. Agarwal, A. Greiner, and J. H. Wendorff, “Functional materials by electrospinning of polymers,” Prog. Polym. Sci., vol. 38, no. 6, pp. 963–991, 2013.
[27] Y. E. Choonara, C. Dott, V. M. K. Ndesendo, L. C. du Toit, V. Pillay, L. Tomar, P. Kumar, and C. Tyagi, “A Review of the Effect of Processing Variables on the Fabrication of Electrospun Nanofibers for Drug Delivery Applications,” J. Nanomater., pp. 1–23, 2013.
[28] F. E. Ahmed, B. S. Lalia, and R. Hashaikeh, “A review on electrospinning for membrane fabrication: Challenges and applications,” Desalination, pp. 1–16, 2014.

40
[29] B. Sun, Y. Z. Long, H. D. Zhang, M. M. Li, J. L. Duvail, X. Y. Jiang, and H. L. Yin, “Advances in three-dimensional nanofibrous macrostructures via electrospinning,” Prog. Polym. Sci., vol. 39, no. 5, pp. 862–890, 2014.
[30] D. Crespy, K. Friedemann, and A. M. Popa, “Colloid-electrospinning: Fabrication of Multicompartment Nanofibers by the Electrospinning of Organic or/and Inorganic Dispersions and Emulsions,” Macromol. Rapid Commun., vol. 33, no. 23, pp. 1978–1995, 2012.
[31] F. Elahi, W. Lu, G. Guoping, and F. Khan, “Core-shell Fibers for Biomedical Applications-A Review,” Bioeng. Biomed. Sci. J., vol. 3, no. 1, pp. 1–14, 2013.
[32] S. Y. Gu, J. B. Li, J. Ren, and Z. M. Wang, “Switchable wettability of thermo-responsive biocompatible nanofibrous films created by electrospinning,” Macromol. Mater. Eng., vol. 295, no. 1, pp. 32–36, 2010.
[33] H. Qi, J. Xu, P. Hu, and A. Wang, “Encapsulation of drug reservoirs in fibers by emulsion electrospinning: Morphology characterization and preliminary release assessment,” Biomacromolecules, vol. 7, no. 8, pp. 2327–2330, 2006.
[34] X. Xu, L. Yang, X. Xu, X. Wang, X. Chen, Q. Liang, J. Zeng, and X. Jing, “Ultrafine medicated fibers electrospun from W/O emulsions,” J. Control. Release, vol. 108, no. 1, pp. 33–42, 2005.
[35] M. Angeles, H.-L. Cheng, and S. S. Velankar, “Emulsion electrospinning: Composite fibers from drop breakup during electrospinning,” Polym. Adv. Technol., vol. 19, pp. 560–568, 2008.
[36] S. Agarwal and A. Greiner, “On the way to clean and safe electrospinning-green electrospinning: Emulsion and suspension electrospinning,” Polym. Adv. Technol., vol. 22, no. 3, pp. 372–378, 2011.
[37] N. E. Zander, “Hierarchically structured electrospun fibers,” Polymers (Basel)., vol. 5, no. 1, pp. 19–44, 2013.
[38] G. Yazgan, A. M. Popa, R. M. Rossi, K. Maniura-Weber, J. Puigmarti-Luis, D. Crespy, and G. Fortunato, “Tunable release of hydrophilic compounds from hydrophobic nanostructured fibers prepared by emulsion electrospinning,” Polymer (Guildf)., vol. 66, pp. 268–276, 2015.
[39] S. Maretschek, A. Greiner, and T. Kissel, “Electrospun biodegradable nanofiber nonwovens for controlled release of proteins,” J. Control. Release, vol. 127, no. 2, pp. 180–187, 2008.
[40] X. Xu, X. Chen, P. Ma, X. Wang, and X. Jing, “The release behavior of doxorubicin hydrochloride from medicated fibers prepared by emulsion-electrospinning,” Eur. J. Pharm. Biopharm., vol. 70, no. 1, pp. 165–170, 2008.
[41] Y. Yang, X. Li, W. Cui, S. Zhou, R. Tan, and C. Wang, “Structural stability and release profiles of proteins from core-shell poly (DL-lactide) ultrafine fibers prepared by emulsion electrospinning,” J. Biomed. Mater. Res. - Part A, vol. 86, no. 2, pp. 374–385, 2008.
[42] A. Camerlo, A.-M. Bühlmann-Popa, C. Vebert-Nardin, R. M. Rossi, and G. Fortunato, “Environmentally controlled emulsion electrospinning for the encapsulation of temperature-sensitive compounds,” J. Mater. Sci., vol. 49, no. 23, pp. 8154–8162, 2014.

41
[43] S. Yan, L. Xiaoqiang, L. Shuiping, M. Xiumei, and S. Ramakrishna, “Controlled release of dual drugs from emulsion electrospun nanofibrous mats,” Colloids Surfaces B Biointerfaces, vol. 73, no. 2, pp. 376–381, 2009.
[44] X. Li, Y. Su, S. Liu, L. Tan, X. Mo, and S. Ramakrishna, “Encapsulation of proteins in poly(l-lactide-co-caprolactone) fibers by emulsion electrospinning,” Colloids Surfaces B Biointerfaces, vol. 75, no. 2, pp. 418–424, 2010.
[45] T. Briggs and T. L. Arinzeh, “Examining the formulation of emulsion electrospinning for improving the release of bioactive proteins from electrospun fibers,” J. Biomed. Mater. Res. - Part A, vol. 102, no. 3, pp. 674–684, 2014.
[46] X. Zhao, Y. Lui, P. Toh, and S. Loo, “Sustained Release of Hydrophilic l-ascorbic acid 2-phosphate Magnesium from Electrospun Polycaprolactone Scaffold - A Study across Blend, Coaxial, and Emulsion Electrospinning Techniques,” Materials (Basel)., vol. 7, no. 11, pp. 7398–7408, 2014.
[47] J. E. Díaz, A. Barrero, M. Marques, A. Fernandez-nieves, and I. G. Loscertales, “Absorption Properties of Microgel-PVP Composite Nanofibers Made by Absorption Properties of Microgel-PVP Composite Nanofibers Made by Electrospinning,” Macromol. Rapid Commun., vol. 31, pp. 183–189.
[48] Z. M. Huang, Y. Z. Zhang, M. Kotaki, and S. Ramakrishna, “A review on polymer nanofibers by electrospinning and their applications in nanocomposites,” Compos. Sci. Technol., vol. 63, no. 15, pp. 2223–2253, 2003.
[49] D. W. Hutmacher and P. D. Dalton, “Melt Electrospinning,” Chem. - An Asian J., vol. 6, no. 1, pp. 44–56, 2011.
[50] M. A. Bezerra, L. a. Escaleira, E. P. Oliveira, R. E. Santelli, and L. S. Villar, “Response surface methodology (RSM) as a tool for optimization in analytical chemistry,” Talanta, vol. 76, no. 5, pp. 965–977, 2008.
[51] O. S. Yördem, M. Papila, and Y. Z. Menceloǧlu, “Effects of electrospinning parameters on
polyacrylonitrile nanofiber diameter: An investigation by response surface methodology,” Mater. Des., vol. 29, no. 1, pp. 34–44, 2008.
[52] S. Sukigara, M. Gandhi, J. Ayutsede, M. Micklus, and F. Ko, “Regeneration of Bombyx mori silk by electrospinning. Part 2. Process optimization and empirical modeling using response surface methodology,” Polymer (Guildf)., vol. 45, no. 11, pp. 3701–3708, 2004.
[53] M. Mohammadian and A. K. Haughi, “Systematic parameter study for ultra-fine fiber fabrication via electrospinning process,” Polymer (Guildf)., vol. 46, no. 16, pp. 6128–6134, 2005.
[54] M. T. Alexander, “Response surface optimization using JMP software.” Baltimore, pp. 1–8, 2014.
[55] B. Sun, Y. Lin, and P. Wu, “Structure analysis of poly(N-isopropylacrylamide) using near-infrared spectroscopy and generalized two-dimensional correlation infrared spectroscopy,” Appl. Spectrosc., vol. 61, no. 7, pp. 765–771, 2007.
[56] A. Khan, M. B. H. Othman, K. A. Razak, and H. M. Akil, “Synthesis and physicochemical investigation of chitosan-PMAA-based dual-responsive hydrogels,” J. Polym. Res., vol. 20, no. 10, pp. 1–8, 2013.

42
[57] S. B. Chen, H. Zhong, L. L. Zhang, Y. F. Wang, Z. P. Cheng, Y. L. Zhu, and C. Yao, “Synthesis and characterization of thermoresponsive and biocompatible core-shell microgels based on N-isopropylacrylamide and carboxymethyl chitosan,” Carbohydr. Polym., vol. 82, no. 3, pp. 747–752, 2010.
[58] T. Still, K. Chen, A. M. Alsayed, K. B. Aptowicz, and a. G. Yodh, “Synthesis of micrometer-size poly(N-isopropylacrylamide) microgel particles with homogeneous crosslinker density and diameter control,” J. Colloid Interface Sci., vol. 405, pp. 96–102, 2013.
[59] A. Gandhi, A. Paul, S. O. Sen, and K. K. Sen, “Studies on thermoresponsive polymers: Phase behaviour, drug delivery and biomedical applications,” Asian J. Pharm. Sci., vol. 10, no. 2, pp. 99–107, 2015.
[60] H. Fong, I. Chun, and D. H. Reneker, “Beaded nanofibers formed during electrospinning,” Polymer (Guildf)., vol. 40, no. 16, pp. 4585–4592, 1999.
[61] C. Henriques, R. Vidinha, D. Botequim, J. P. Borges, and J. a M. C. Silva, “A systematic study of solution and processing parameters on nanofiber morphology using a new electrospinning apparatus.,” J. Nanosci. Nanotechnol., vol. 9, no. 6, pp. 3535–3545, 2009.
[62] C. Wang, L. Wang, and M. Wang, “Evolution of core–shell structure: From emulsions to ultrafine emulsion electrospun fibers,” Mater. Lett., vol. 124, pp. 192–196, 2014.
[63] F. Ajalloueian, H. Tavanai, J. Hilborn, O. Donzel-Gargand, K. Leifer, A. Wickham, and A. Arpanaei, “Emulsion electrospinning as an approach to Fabricate PLGA/chitosan nanofibers for biomedical applications,” Biomed Res. Int., pp. 1–13, 2014.
[64] H. Yuan, B. Li, K. Liang, X. Lou, and Y. Zhang, “Regulating drug release from pH- and temperature-responsive electrospun CTS-g-PNIPAAm/poly(ethylene oxide) hydrogel nanofibers,” Biomed. Mater., vol. 9, no. 5, pp. 1–10, 2014.
[65] J. C. Sy, a. S. Klemm, and V. P. Shastri, “Emulsion as a means of controlling electrospinning of polymers,” Adv. Mater., vol. 21, no. 18, pp. 1814–1819, 2009.
[66] J. Huang and T. You, “Chapter 2,” in Electrospun Nanofibers: From Rational Design, Fabrication to Electrochemical Sensing Applications, INTECH., R. Maguire, Ed. 2013, pp. 35–87.
[67] M. R. Kasaai, “Calculation of Mark-Houwink-Sakurada (MHS) equation viscometric constants for chitosan in any solvent-temperature system using experimental reported viscometric constants data,” Carbohydr. Polym., vol. 68, no. 3, pp. 477–488, 2007.
[68] L. Ali and Z. Farooqui, “Synthesis and Characterization of Poly (N-isopropylacrylamide) Hybrid Microgels with different Cross-linker Contents,” Chem. Soc. Pak., vol. 35, no. 6, pp. 1522–1529, 2013.
[69] N. A. Peppas, Y. Huang, M. Torres-Lugo, J. H. Ward, and J. Zhuang, “Physicochemical Foundations and Structural Design of Hydrogels in Medicine and Biology,” in Hydrogels, Annual Rev., 2000, pp. 9–29.

43
[70] O. Manor, T. T. Chau, G. W. Stevens, D. Y. C. Chan, F. Grieser, and R. R. Dagastine, “Polymeric stabilized emulsions: Steric effects and deformation in soft systems,” Langmuir, vol. 28, no. 10, pp. 4599–4604, 2012.
[71] C. G. T. Neto, J. a. Giacometti, a. E. Job, F. C. Ferreira, J. L. C. Fonseca, and M. R. Pereira, “Thermal Analysis of Chitosan Based Networks,” Carbohydr. Polym., vol. 62, no. 2, pp. 97–103, 2005.
[72] S. Shekhar, M. Mukherjee, and A. K. Sen, “Studies on thermal and swelling properties of Poly (NIPAM-co-2-HEA) based hydrogels,” Adv. Mater. Res., vol. 1, no. 4, pp. 269–284, 2012.

44

45
6. Supporting Information
6.1. Response Surface Methodology
Any design of experiments has few basic elements and underlying concepts that are related to the statistical
field. The response variables represents the outcome that is measured. The more common outcome in
electrospinning process is the mean fiber diameter (MFD). The factors (continuous or categorical) are vari-
ables (or parameters) that are independent and deliberately changed for the expressed purpose of meas-
uring the fiber diameter, and therefore evaluate the main factors on the outcome response. In statistics the
levels are specific conditions at which we wish observe the factor. Using the combination of these levels
related to each factor, design of experiments tables are generated [50]. In the case of a full factorial design
acquired from two factors, both with three levels, the design of experiments has 23 runs. The present statis-
tical analysis reports on Design of Experiments (DoE) as a tool of Response Surface Methodology (RSM).
Based on this multivariable approach, we developed a systematic analysis of the outcome responses that
were used to predict the optimum set of parameters aimed to minimize the goal response – fiber diameter.
6.1.1. Planning the design of experiments
The DoE was applied in the experimental domain of colloidal composite electrospun nanofibers. Electro-
spinning is a process governed by the process parameters (applied voltage, working distance or flow rate),
solution properties (viscosity/concentration, molecular weight, superficial tension or electrical conductivity)
and environmental conditions (temperature or humidity), which improves several constrains. The goal re-
sponse was previously defined as minimum fiber diameter, which drives the maximum aspect ratio for a
fiber diameter smaller than the entrapped microgels. Based on the process restrictions, the values choice
of level for each factor were defined as described into the following sections. For an experimental design,
the expressed levels selection should be equally spaced.
Concentration, C: In this work several samples containing microgels dispersions were previously prepared
which could be differentiated by the amount and molecular weight of chitosan, although not all have been
used for the electrospinning process. In order to obtain a systematic comparison every sample comprising
microgels with a concentration of 40 wt. %Cs were used (PNIPAAm-40%Cs (1:25), PNIPAAm-40%Cs (1:33)
and PNIPAAm-40% Cs (1:50)), as well as the representative PNIPAAm-30%Cs (1:50) and the PNIPAAm-
20%Cs (1:50) as-prepared microgels dispersions.

46
Applied Voltage, V: Electrospinning process only occurs when the applied voltage overcomes the threshold
voltage with the consequent formation of the Taylor cone. If the applied voltage was lower than 10 kV, no
Taylor cone can be formed. It can be obtained at voltages between 10 and 22.5 kV (Figure 6.1). Thus,
applied voltages in DoE study experiments were established for an equal range, regarding the set values of
10 ≤ V ≤ 20 kV.
Figure 6.1 - Optical images of the representative electrospun fibers of microgels/PEO using an applied voltage
of 10 kV (a); 15 kV (b) and 20 kV (c).
Tip-to-collector distance (working distance), d: The choice of working distance range is related to solvent
evaporation and fiber forming. Previously tested distances were performed from 5 to 30 cm (Figure 6.2).
Below 10 cm only occur electrospray, whereas above that distance continuous fibers were produced. Taking
to account this detachment, the levels of working distance were performed at 13 ≤ d ≤ 27 cm.
Figure 6.2 - Optical images of the representative electrospun fibers of microgels/PEO with a working distance
of 13 cm (a); 20 cm (b) and 27 cm (c).
Flow rate, Q: Jet formation only occurs when a certain amount of solution is charged to the needle tip. A
flow rate lower than 0.2 mL/h does not induce the polymeric jet formation, furthering the spray projection
(Figure 6.3). Since the solution contains two immiscible phases and, as consequence the jet instability takes
place with several interruptions, low flow rates are not viable. Otherwise, hours (evens days) will be neces-
sary to produce each one of the experiments. Thus, the chosen levels were 0.5 ≤ Q ≤ 0.7 mL/h.

47
Figure 6.3 - Optical images of the representative electrospun fibers of microgels/PEO using a flow rate of 0.1
mL/h (a) and 0.5 mL/h (b).
The minimum D-optimal design was generated using the two-level continuous factors (Q, V and d) and the
six-level categorical factor solution concentration (C) based on the custom design tool of JMP software. The
acquired experiments settings are random combinations of lower and upper levels of each continuous pa-
rameter for a specific solution (Table 6.1). However, some of the factors were modified during the electro-
spinning experiments and then was added the correct value as expressed in the following table with 27 runs.
Table 6.1 - Random matrix of design of experiments provide by JMP software.
#Run Sample Code V (kV) d (cm) Q (mL/h)
1 PNIPAAm microgels/PEO 10 20 0.5
2 PNIPAAm-30%Cs (1:50) microgels/PEO 15 13 0.6
3 PNIPAAm-30%Cs (1:50) microgels/PEO 10 27 0.5
4 PNIPAAm-40%Cs (1:25) microgels/PEO 15 13 0.7
5 PNIPAAm-40%Cs (1:33) microgels/PEO 15 20 0.7
6 PNIPAAm-30%Cs (1:50) microgels/PEO 10 27 0.7
7 PNIPAAm microgels/PEO 15 13 0.6
8 PNIPAAm-20%Cs (1:50) microgels/PEO 20 27 0.6
9 PNIPAAm-40%Cs (1:25) microgels/PEO 10 27 0.6
10 PNIPAAm-30%Cs (1:50) microgels/PEO 20 20 0.7

48
11 PNIPAAm microgels/PEO 20 13 0.7
12 PNIPAAm-20%Cs (1:50) microgels/PEO 10 13 0.5
13 PNIPAAm-20%Cs (1:50) microgels/PEO 15 27 0.7
14 PNIPAAm microgels/PEO 10 27 0.6
15 PNIPAAm-40%Cs (1:33) microgels /PEO 15 20 0.5
16 PNIPAAm-40%Cs (1:50) microgels/PEO 20 13 0.5
17 PNIPAAm microgels/PEO 20 27 0.5
18 PNIPAAm-40%Cs (1:50) microgels/PEO 15 27 0.7
19 PNIPAAm-20%Cs (1:50) microgels/PEO 20 20 0.6
20 PNIPAAm-40%Cs (1:25) microgels/PEO 15 20 0.5
21 PNIPAAm-40%Cs (1:50) microgels/PEO 15 27 0.5
22 PNIPAAm-30%Cs (1:50) microgels/PEO 20 27 0.5
23 PNIPAAm-40%Cs (1:50) microgels/PEO 10 20 0.7
24 PNIPAAm-40%Cs (1:50) microgels/PEO 15 20 0.6
25 PNIPAAm-20%Cs (1:50) microgels/PEO 20 27 0.7
26 PNIPAAm-20%Cs (1:50) microgels/PEO 10 27 0.5
27 PNIPAAm-30%Cs (1:50) microgels/PEO 10 20 0.7
6.1.2. Regression analysis
After measuring the outcome response related to each experimental point of the chosen design, it was
necessary to fit the mathematical equation in order to describe the fiber diameter for the given levels of
parameters. The use of a mathematical model to describe the main effects, as well as their interaction,
should be acquired from a polynomial equation. In this work a first-order polynomial was used as equation

49
model. In general, first-order polynomials are unable to evaluate the curvature but the addiction of one more
term (second-order interactions within the first-order polynomials) overtakes this problem. Second-order
polynomials are most common, because their efficiency in predicting the optimum set of parameters for the
given experimental data. Higher order is also possible but infrequent [50]. In our study the solution concen-
tration levels (Cx) were provide by categorical levels of the solution concentration parameter which makes
impossible the employing of second-order polynomials. Thereby, the relation between the fiber diameter
algorithm (y) and the input parameters was approximated by the second-order interactions model [50]:
𝒚 (𝒙) = 𝜷𝟎 + 𝜷𝟏𝒙𝟏 + 𝜷𝟐𝒙𝟐 + 𝜷𝟑𝒙𝟑 + +𝜷𝟏𝟐𝒙𝟏𝒙𝟐 + 𝜷𝟏𝟑𝒙𝟏𝒙𝟑
+ 𝜷𝟐𝟑𝒙𝟐𝒙𝟑 + 𝜺
Equation 6.1
where β1, β2, β3, β12, β13, and β32 are unknown statistical coefficients and ɛ is the residual. By that linear
regression analysis of Equation (6.1) the numerical values of β1, β2, β3, β12, β13, and β32, were obtained.
Consequently, the fitted first-order polynomial equation for the natural logarithmic fiber diameter (y) is given
by:
𝑦 = 198.036 + 𝑚𝑎𝑡𝑐ℎ 𝑗 (𝐶1, 𝐶2, 𝐶3, 𝐶4, 𝐶5, 𝑜𝑟 𝐶6) + 56.252𝑥1 − 41. 601𝑥2 + 18.410𝑥3
+ 𝑚𝑎𝑡𝑐ℎ 𝑘 (𝐶1, 𝐶2, 𝐶3, 𝐶4, 𝐶5, 𝑜𝑟 𝐶6) × 𝑥1
+ 𝑚𝑎𝑡𝑐ℎ 𝑤 (𝐶1, 𝐶2, 𝐶3, 𝐶4, 𝐶5, 𝑜𝑟 𝐶6) × 𝑥2
+ 𝑚𝑎𝑡𝑐ℎ 𝑧 (𝐶1, 𝐶2, 𝐶3, 𝐶4, 𝐶5, 𝑜𝑟 𝐶6) × 𝑥3 + 10.392 𝑥1𝑥2 − 38.651𝑥1𝑥3
+ 80.594𝑥2𝑥3
where match j, k, w, and z are constants which the algorithm used for the specific level of the solution
concentration. (Table 6.2), whereas 𝑥1 is the applied voltage (V), 𝑥2 is the flow rate (Q), and 𝑥3 is the
working distance (d) for the parameterization around the central value and described as:

50
Table 6.2 - Constant values of the solution concentration levels.
Sample Code Match j k w z
PNIPAAm-40%Cs (1:25) microgels/PEO C1 22.661 −68.252 89.249 −26.709
PNIPAAm-40%Cs (1:33) microgels/PEO C2 11.464 206.340 −10.900 0
PNIPAAm-40%Cs (1:50) microgels/PEO C3 −9.635 −146.704 6.007 48.122
PNIPAAm-30%Cs (1:50) microgels/PEO C4 12.180 0 28.012 0
PNIPAAm-20%Cs (1:50) microgels/PEO C5 −72.493 −3.423 0 −20.875
PNIPAAm microgels/PEO C6 35.874 11.984 77.991 −42.288
By dismembering the single-model equation, it could be obtained the following equations for each solution
concentration level:
𝑦𝐶1= 198.036 + 22.661 + 56.252𝑥1 − 41. 601𝑥2 + 18.410𝑥3 − 68.252𝑥1 + 89.249𝑥2
− 26.709𝑥3 + 10.392 𝑥1𝑥2 − 38.651𝑥1𝑥3 + 80.594𝑥2𝑥3
𝑦𝐶2= 198.036 + 11.464 + 56.252𝑥1 − 41. 601𝑥2 + 18.410𝑥3 + 206.340𝑥1 − 10.900𝑥2
+ 10.392 𝑥1𝑥2 − 38.651𝑥1𝑥3 + 80.594𝑥2𝑥3
𝑦𝐶3= 198.036 − 9.635 + 56.252𝑥1 − 41. 601𝑥2 + 18.410𝑥3 − 146.704𝑥1 + 6.007𝑥2
+ 48.122𝑥3 + 10.392 𝑥1𝑥2 − 38.651𝑥1𝑥3 + 80.594𝑥2𝑥3
𝑦𝐶4= 198.036 + 12.180 + 56.252𝑥1 − 41. 601𝑥2 + 18.410𝑥3 + 28.012𝑥2 + 10.392 𝑥1𝑥2
− 38.651𝑥1𝑥3 + 80.594𝑥2𝑥3
𝑦𝐶5= 198.036 − 72.493 + 56.252𝑥1 − 41. 601𝑥2 + 18.410𝑥3 − 3.423𝑥1 − 20.875𝑥3
+ 10.392 𝑥1𝑥2 − 38.651𝑥1𝑥3 + 80.594𝑥2𝑥3

51
𝑦𝐶5= 198.036 + 35.874 + 56.252𝑥1 − 41. 601𝑥2 + 18.410𝑥3 + 11.984𝑥1 − 77.991𝑥2
− 42.288𝑥3 + 10.392 𝑥1𝑥2 − 38.651𝑥1𝑥3 + 80.594𝑥2𝑥3
The indicator parameterization estimates (terms) and their p-values were found by the equation model by
means of JMP software and are summarized in Table 6.3.
Table 6.3 - Indicator parametrization estimates (terms) and p-values.
Term Term Standard Error p-value
Constant 5550 165.4579 < 0.0001*
C6 138 105.6093 0.2825
C1 -407 95.52716 0.0237*
C2 -620 90.06387 0.0063*
C3 68 105.6093 0.5655
C4 137 110.3053 0.3025
V -240 131.2895 0.1650
Q 59 142.4035 0.7065
d 1353 135.0958 0.0021*
VC6 -266 95.52716 0.0687
VC1 -496 77.9976 0.0079*
VC2 -233 71.20174 0.0467*
VC3 -290 84.24704 0.0412*
VC4 -353 100.6945 0.0393*
QC6 -434 84.24704 0.0142*
QC1 -22 77.9976 0.7962

52
QC2 -150 77.9976 0.1502
QC3 102 90.06387 0.3397
QC4 293 95.52716 0.0547
dC6 -521 95.52716 0.0121*
dC1 -470 84.24704 0.0114*
dC2 -537 71.20174 0.0048*
dC3 -203 90.06387 0.1095
dC4 -138 95.52716 0.2443
VQ 157 114.8094 0.2649
dV -401 110.3053 0.0359*
Qd -60 114.8094 0.6374
* P-values used to access the significance levels of the processing parameters and interactions.
To measure the usefulness of models coefficients in model equation, it is necessary to test the subset of
variables which contributes significantly in representing the response variation. That can be achieved by
using hypothesis-testing procedure with the hypothesis of:
𝑯𝟎 : 𝜷𝟏 = 𝜷𝟐 = ⋯ = 𝜷𝒌 = 𝟎 Equation 6.2
𝑯𝟏: 𝜷𝒋 ≠ 𝟎 𝒇𝒐𝒓 𝒂𝒕 𝒍𝒆𝒂𝒕 𝒐𝒏𝒆 𝒋 Equation 6.3
where H0 is the null hypothesis and H1 is the alternative hypothesis. When the p-values very low (almost
zero) the null hypothesis is rejected suggesting that are only significant terms in the model equation. This
approach is also used to test the significance of each parameter and the interaction between parameters
[53].
In order to estimate the β parameters sequential of transformations need to be made. At first, the model
equation presented by the Equation (6.1) may now be written in matrix notation as:

53
𝒚 = 𝑿𝜷 + 𝜺 Equation 6.4
where y is the vector of observations, X is the matrix of levels of the parameters, β is the vector constituted
by the parameters of the model, and ɛ is the vector of random errors. Afterwards, the least squares method
(LSM), which minimizes the sum of squares of errors, is employed to find the estimators of the coefficients,
��:
�� = (𝑿𝑿´)−𝟏𝑿´𝒚 Equation 6.5
The LSM is based on a regression technique used to fit a mathematical model to a set of experimental data
creating the lowest residual possible. In other words, it is assumed the minor difference between an ob-
served value and the fitted value provided by the used model. In addition in the LSM, it is assumed that the
errors present a random distribution profile with a zero mean and a common unknown variance and that
these errors are independent of each other. Thereby, the fitted model will be written as:
�� = 𝑿�� Equation 6.6
Finally, response surfaces or contour plots are observed to ensure the visualization of the relation between
the response and variables by exposing the interaction between variables that allows the assessment of the
parameters´ influence on the target response [50].
6.2. Dimensional representation of the adapted grounded collector
In order to obtain detachable non-woven mats, a slight modification in the layout of the collector electrode
was made. Therefore, a basic aluminum sheet was covered by a blue paper and overlaid by a rectangular
ground electrode (covered with aluminum foil) was used to collect the nanofibers as presented in Figure 6.4
(the dimensional measures are given in mm).

54
Figure 6.4 - Dimensional characterization in millimeters of the ground collector used in electrospinning setup.
6.3. Molecular weight of chitosan
The viscosimetry analysis was performed to estimate the molecular weight of the depolymerized chitosan
samples obtained in this work. The intrinsic viscosity of a polymer solution is related to the polymer molecular
weight according to Mark-Houwink-Sakurada (MHS) equation:
[𝜼] = 𝒌��𝒘𝜶
Equation 6.7
where [𝜂] is the intrinsic viscosity, ��w the viscosity average molecular weight, k and 𝛼 are constants for a
given solute-solvent system. These constants have been estimated from the knowledge of deacetylation
degree (DD), pH of the solvent and ionic strength (µ). It was also necessary to consider the best fit curve of
the model to calculate the constants, which are given by the following equation:
𝜶 = 𝟎, 𝟔𝟐𝟎𝟐 +𝟎, 𝟔𝟗𝟗𝒙
𝟎, 𝟒𝟖𝟎𝟔 + 𝒙
Equation 6.8
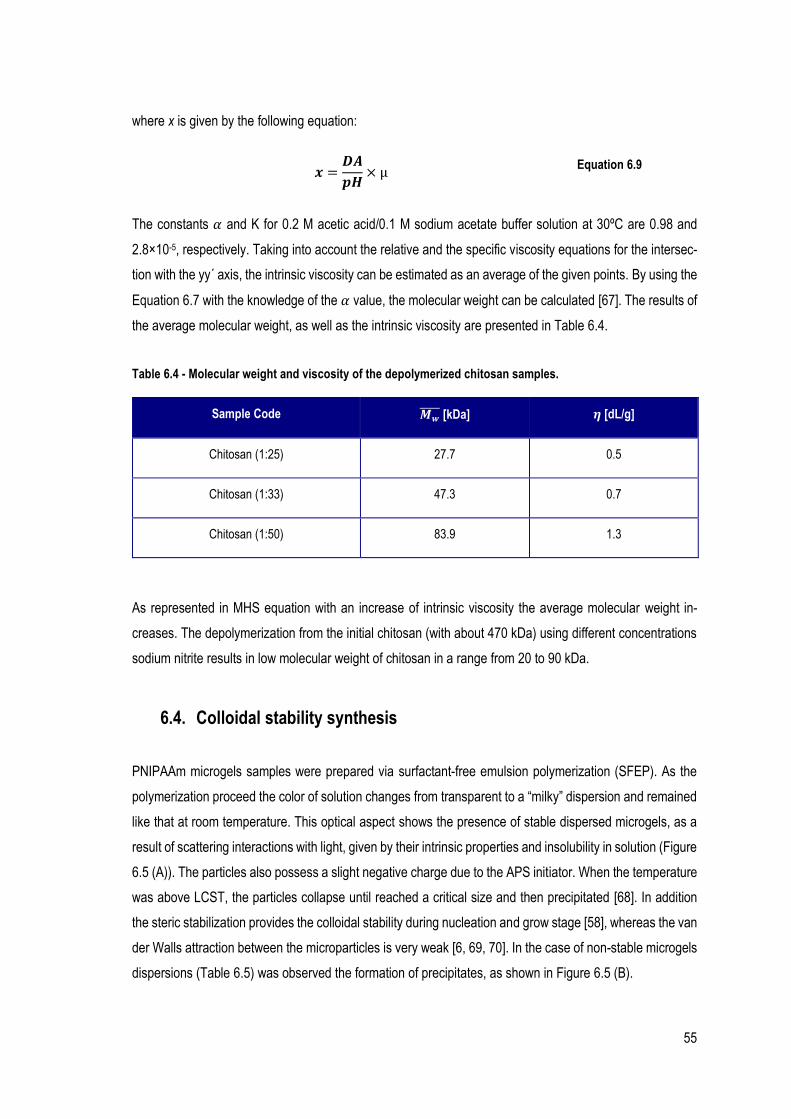
55
where x is given by the following equation:
𝒙 =𝑫𝑨
𝒑𝑯× µ
Equation 6.9
The constants 𝛼 and K for 0.2 M acetic acid/0.1 M sodium acetate buffer solution at 30ºC are 0.98 and
2.8×10⁻⁵, respectively. Taking into account the relative and the specific viscosity equations for the intersec-
tion with the yy´ axis, the intrinsic viscosity can be estimated as an average of the given points. By using the
Equation 6.7 with the knowledge of the 𝛼 value, the molecular weight can be calculated [67]. The results of
the average molecular weight, as well as the intrinsic viscosity are presented in Table 6.4.
Table 6.4 - Molecular weight and viscosity of the depolymerized chitosan samples.
Sample Code 𝑴𝒘 [kDa] 𝜼 [dL/g]
Chitosan (1:25) 27.7 0.5
Chitosan (1:33) 47.3 0.7
Chitosan (1:50) 83.9 1.3
As represented in MHS equation with an increase of intrinsic viscosity the average molecular weight in-
creases. The depolymerization from the initial chitosan (with about 470 kDa) using different concentrations
sodium nitrite results in low molecular weight of chitosan in a range from 20 to 90 kDa.
6.4. Colloidal stability synthesis
PNIPAAm microgels samples were prepared via surfactant-free emulsion polymerization (SFEP). As the
polymerization proceed the color of solution changes from transparent to a “milky” dispersion and remained
like that at room temperature. This optical aspect shows the presence of stable dispersed microgels, as a
result of scattering interactions with light, given by their intrinsic properties and insolubility in solution (Figure
6.5 (A)). The particles also possess a slight negative charge due to the APS initiator. When the temperature
was above LCST, the particles collapse until reached a critical size and then precipitated [68]. In addition
the steric stabilization provides the colloidal stability during nucleation and grow stage [58], whereas the van
der Walls attraction between the microparticles is very weak [6, 69, 70]. In the case of non-stable microgels
dispersions (Table 6.5) was observed the formation of precipitates, as shown in Figure 6.5 (B).

56
Figure 6.5 - Macroscopic photographs of the as-prepared microgels dispersions: stable (A) and non-sta-
ble/precipitates (B).
Table 6.5 - Stable and non-stable as-prepared microgels dispersions.
Sample Code Colloidal Stability
PNIPAAm microgels Stable microgels dispersions
PNIPAAm-20%Cs (1:25) microgels Precipitates
PNIPAAm-20%Cs (1:33) microgels Precipitates
PNIPAAm-20%Cs (1:50) microgels Stable microgels dispersions
PNIPAAm-30%Cs (1:25) microgels Precipitates
PNIPAAm-30%Cs (1:33) microgels Stable microgels dispersions
PNIPAAm-30%Cs (1:50) microgels Stable microgels dispersions
PNIPAAm-40%Cs (1:25) microgels Stable microgels dispersions
PNIPAAm-40%Cs (1:33) microgels Stable microgels dispersions
PNIPAAm-40%Cs (1:50) microgels Stable microgels dispersions

57
6.5. FITR analysis
In Figure 6.6, it can be seen the FTIR spectra of NIPAAm monomer and PNIPAAm microspheres are shown.
As seen from the figure, two sharp transmittance bands appears at 1656 cm-1 (amide I) and 1618 cm-1
(amide II) due to stretching of the C=O links and of the N-H links in amide groups, respectively. The bands
at 2970 cm-1 and 2877 cm-1 are characteristic vibrations of C-H asymmetric and C-H symmetric stretching,
respectively. Typical NIPAAm and PNIPAAm spectra also include characteristic bands at 1460 (-CH2 bend-
ing vibration) and 1380 cm-1 (-CH3 bending vibration in isopropyl group). The band appearing at 1360 cm-1
is associated with C-N stretching vibration mode. In addition, the C=C stretching vibration band at 1550 cm-
1 for PNIPAAm microgels disappears. Besides, a less intense band at 3280 cm-1 (N-H stretching vibration)
is observed in the for the PNIPAAm spectrum. According to these results, it can be confirmed that the
polymerization has been successfully accomplished [68].
4500 4000 3500 3000 2500 2000 1500 1000
Amide I
C=O Stretching
C-H
Stretching
Amide II
N-H Stretching
N-H
Stretching
Tra
nsm
itta
nce
(a
.u.)
Wavenumber (cm-1)
PNIPAAm
NIPAAm
Figure 6.6 - Infrared spectra of PNIPAAm microgels (blue) and NIPAAm monomer (green).
From Figure 6.7, it can be observed the FTIR spectra of samples containing different concentrations of
chitosan (while the Mw of Cs was maintained constant). The curves reveal slight differences in the intensity
of carbonyl groups at 1640 cm-1, as the content of chitosan decreases. Furthermore, the characteristic peak
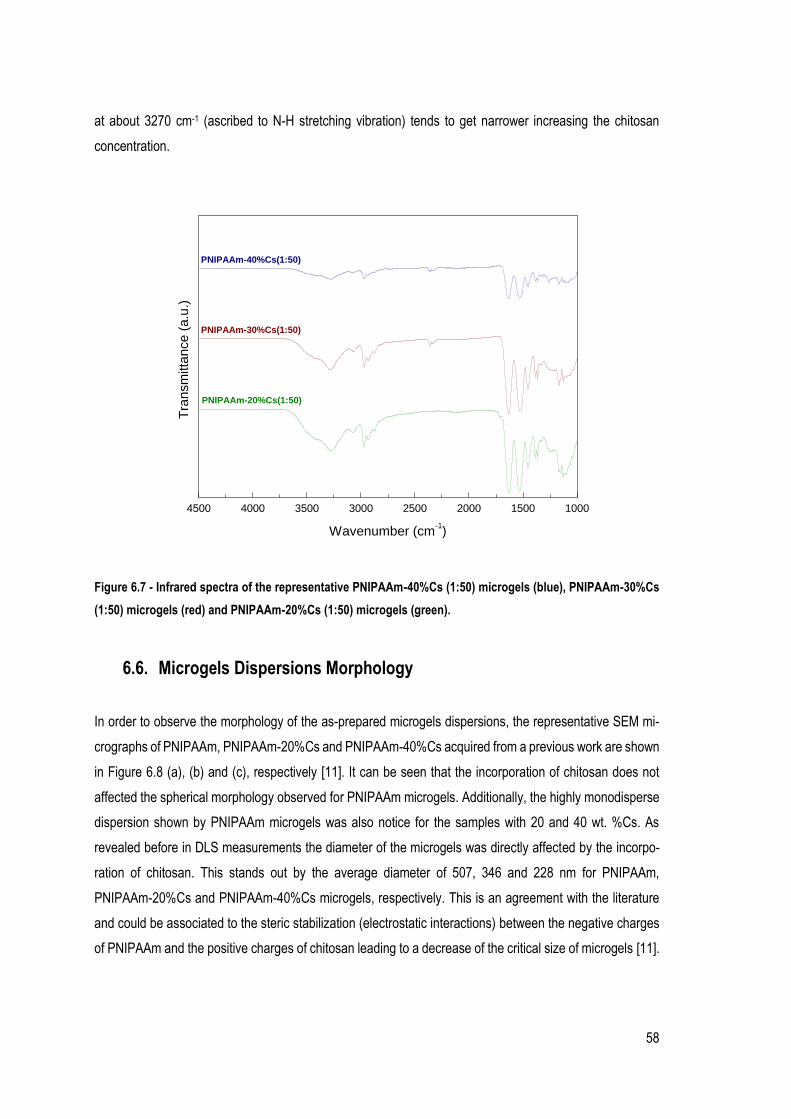
58
at about 3270 cm-1 (ascribed to N-H stretching vibration) tends to get narrower increasing the chitosan
concentration.
4500 4000 3500 3000 2500 2000 1500 1000
PNIPAAm-20%Cs(1:50)
PNIPAAm-30%Cs(1:50)
Tra
nsm
itta
nce
(a
.u.)
Wavenumber (cm-1)
PNIPAAm-40%Cs(1:50)
Figure 6.7 - Infrared spectra of the representative PNIPAAm-40%Cs (1:50) microgels (blue), PNIPAAm-30%Cs
(1:50) microgels (red) and PNIPAAm-20%Cs (1:50) microgels (green).
6.6. Microgels Dispersions Morphology
In order to observe the morphology of the as-prepared microgels dispersions, the representative SEM mi-
crographs of PNIPAAm, PNIPAAm-20%Cs and PNIPAAm-40%Cs acquired from a previous work are shown
in Figure 6.8 (a), (b) and (c), respectively [11]. It can be seen that the incorporation of chitosan does not
affected the spherical morphology observed for PNIPAAm microgels. Additionally, the highly monodisperse
dispersion shown by PNIPAAm microgels was also notice for the samples with 20 and 40 wt. %Cs. As
revealed before in DLS measurements the diameter of the microgels was directly affected by the incorpo-
ration of chitosan. This stands out by the average diameter of 507, 346 and 228 nm for PNIPAAm,
PNIPAAm-20%Cs and PNIPAAm-40%Cs microgels, respectively. This is an agreement with the literature
and could be associated to the steric stabilization (electrostatic interactions) between the negative charges
of PNIPAAm and the positive charges of chitosan leading to a decrease of the critical size of microgels [11].
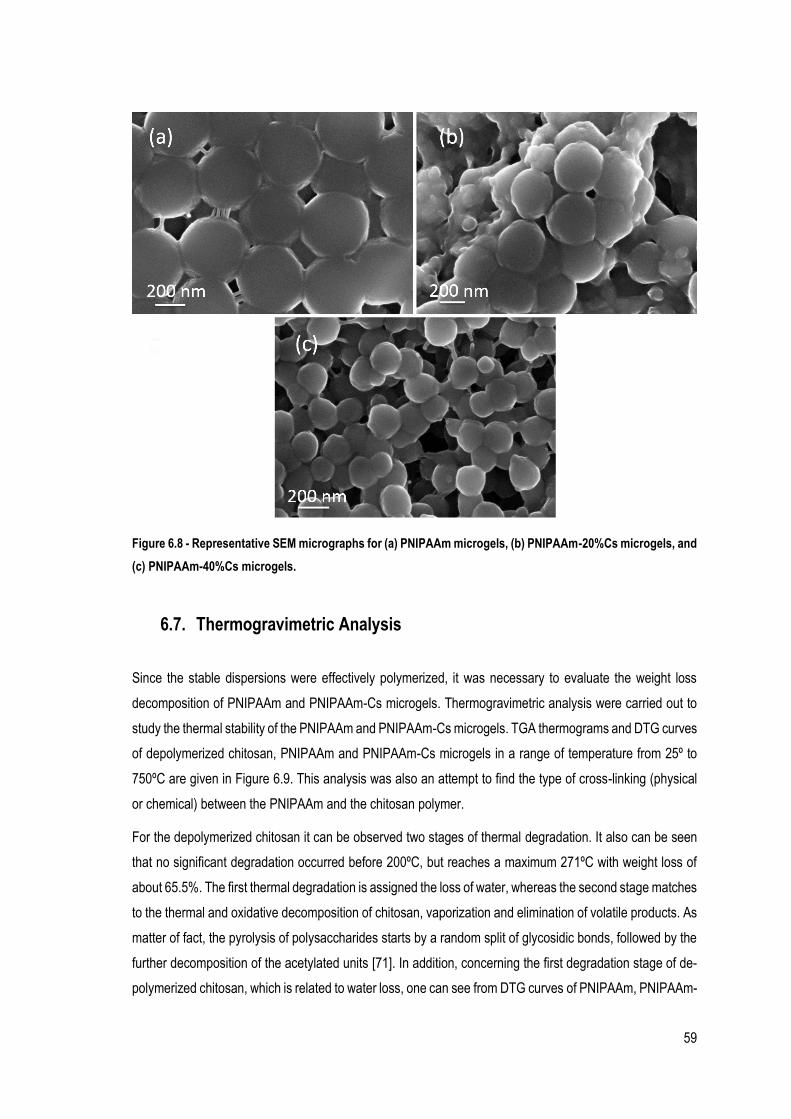
59
Figure 6.8 - Representative SEM micrographs for (a) PNIPAAm microgels, (b) PNIPAAm-20%Cs microgels, and
(c) PNIPAAm-40%Cs microgels.
6.7. Thermogravimetric Analysis
Since the stable dispersions were effectively polymerized, it was necessary to evaluate the weight loss
decomposition of PNIPAAm and PNIPAAm-Cs microgels. Thermogravimetric analysis were carried out to
study the thermal stability of the PNIPAAm and PNIPAAm-Cs microgels. TGA thermograms and DTG curves
of depolymerized chitosan, PNIPAAm and PNIPAAm-Cs microgels in a range of temperature from 25º to
750ºC are given in Figure 6.9. This analysis was also an attempt to find the type of cross-linking (physical
or chemical) between the PNIPAAm and the chitosan polymer.
For the depolymerized chitosan it can be observed two stages of thermal degradation. It also can be seen
that no significant degradation occurred before 200ºC, but reaches a maximum 271ºC with weight loss of
about 65.5%. The first thermal degradation is assigned the loss of water, whereas the second stage matches
to the thermal and oxidative decomposition of chitosan, vaporization and elimination of volatile products. As
matter of fact, the pyrolysis of polysaccharides starts by a random split of glycosidic bonds, followed by the
further decomposition of the acetylated units [71]. In addition, concerning the first degradation stage of de-
polymerized chitosan, which is related to water loss, one can see from DTG curves of PNIPAAm, PNIPAAm-
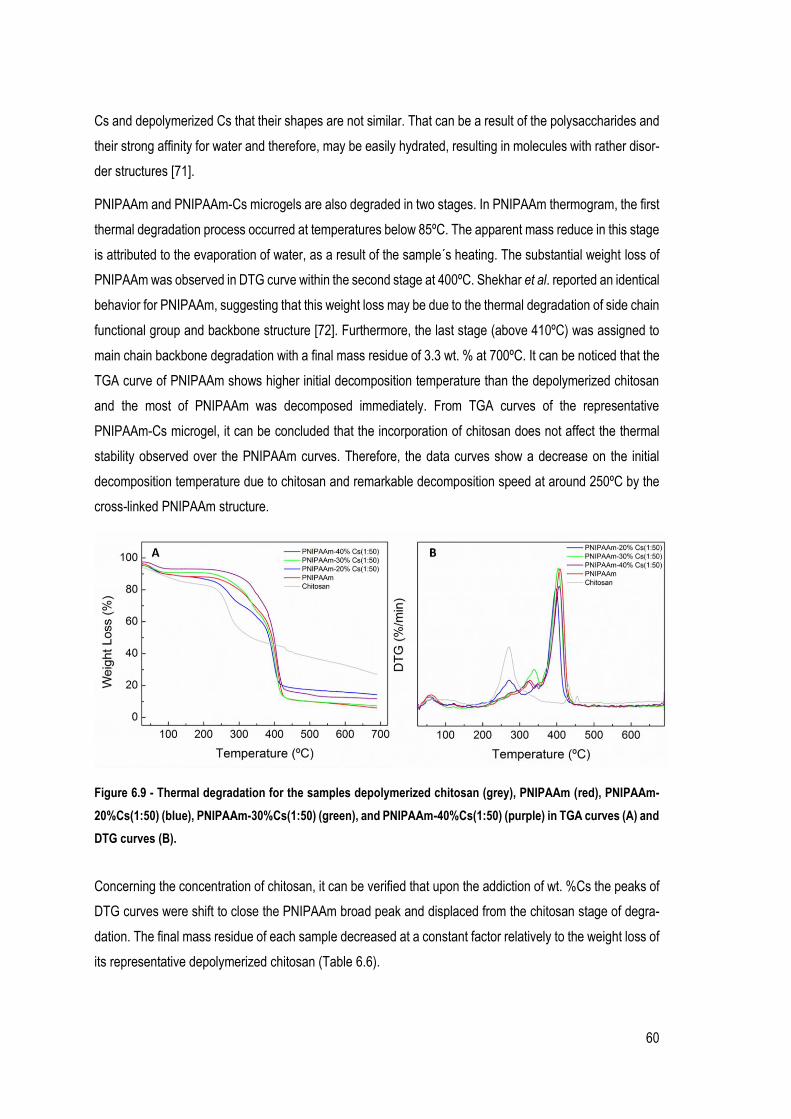
60
Cs and depolymerized Cs that their shapes are not similar. That can be a result of the polysaccharides and
their strong affinity for water and therefore, may be easily hydrated, resulting in molecules with rather disor-
der structures [71].
PNIPAAm and PNIPAAm-Cs microgels are also degraded in two stages. In PNIPAAm thermogram, the first
thermal degradation process occurred at temperatures below 85ºC. The apparent mass reduce in this stage
is attributed to the evaporation of water, as a result of the sample´s heating. The substantial weight loss of
PNIPAAm was observed in DTG curve within the second stage at 400ºC. Shekhar et al. reported an identical
behavior for PNIPAAm, suggesting that this weight loss may be due to the thermal degradation of side chain
functional group and backbone structure [72]. Furthermore, the last stage (above 410ºC) was assigned to
main chain backbone degradation with a final mass residue of 3.3 wt. % at 700ºC. It can be noticed that the
TGA curve of PNIPAAm shows higher initial decomposition temperature than the depolymerized chitosan
and the most of PNIPAAm was decomposed immediately. From TGA curves of the representative
PNIPAAm-Cs microgel, it can be concluded that the incorporation of chitosan does not affect the thermal
stability observed over the PNIPAAm curves. Therefore, the data curves show a decrease on the initial
decomposition temperature due to chitosan and remarkable decomposition speed at around 250ºC by the
cross-linked PNIPAAm structure.
Figure 6.9 - Thermal degradation for the samples depolymerized chitosan (grey), PNIPAAm (red), PNIPAAm-
20%Cs(1:50) (blue), PNIPAAm-30%Cs(1:50) (green), and PNIPAAm-40%Cs(1:50) (purple) in TGA curves (A) and
DTG curves (B).
Concerning the concentration of chitosan, it can be verified that upon the addiction of wt. %Cs the peaks of
DTG curves were shift to close the PNIPAAm broad peak and displaced from the chitosan stage of degra-
dation. The final mass residue of each sample decreased at a constant factor relatively to the weight loss of
its representative depolymerized chitosan (Table 6.6).

61
Table 6.6 - Weight loss related to each as-prepared microgels dispersions.
Sample Code Weight loss (%)
Depolymerized chitosan 26.9
PNIPAAm 5.9
PNIPAAm-20%Cs (1:50) 14.2
PNIPAAm-30%Cs (1:33) 18.7
PNIPAAm-30%Cs (1:50) 7.2
PNIPAAm-40%Cs (1:33) 18.7
PNIPAAm-40%Cs (1:50) 11.7
6.8. Analysis of the autocorrelation functions
The analysis of the autocorrelation functions (ACF) by the cumulant expansion method, it is a data pro-
cessing tool useful to gain information of the hydrodynamic diameter measured by means of DLS technique,
and to understand the scattering of points observed at temperatures above LCST. The autocorrelation func-
tions for PNIPAAm microgels at different temperatures, typically, show a single-exponential relaxation (Fig-
ure 6.10).
Figure 6.10 - Representative autocorrelation function curves corresponding to PNIPAAm microgels disper-
sions obtained at 28º, 30º, 33º, 36º and 38ºC.

62
Taking into account these curves we analyzed them following the method of cumulant expansion. This tech-
nique is based on the expansion in the Taylor series of the expression that relates the autocorrelation curve
with the experimental curve acquired by DLS measurements, given by:
𝐶(𝜏) = 1 + 𝛽 exp(−Γ𝜏) Equation 6.10
where C is the autocorrelation, 𝜏 is the delay ime (µsec), β is a pre-exponential factor and Γ is the decay
time, giving the average values of ⟨Γ⟩. In a first order expansion: ⟨Γ⟩ = Γ and Γ = Dq2, being D the diffusion
coefficient and q the scattering vector that can be determined by:
𝑞 =4𝜋𝑛
𝜆sin (
𝜃
2)
Equation 6.11
where n is the refractive index, λ is the wavelength (532 nm) and θ is the scattering angle (90ºC). Thereby,
the hydrodynamic diameter can be calculated using the Strokes-Einstein equation given by:
𝐷ℎ =𝑘𝐵𝑇
3𝜋𝜂(𝑇)𝐷
Equation 6.12
where 𝑘𝐵 is the Boltzmann constant for a given temperature (T), and 𝜂 is the fluid viscosity. This type of
approach is valid for optimal conditions, i.e, when AFC has only relaxation mode. Since the ACF of
PNIPAAm microgels fit perfectly in this case as depicted in Figure 6.10, it was possible to perform the
cumulant hydrodynamic diameter and, therefore to compare to the measured hydrodynamic diameters
within the range of temperature where significant differences were observed [11].
6.9. SEM analysis of the electrospun composite fibers obtained from de-
sign of experiments
After being electrospun, the fibers were taken to SEM analysis in order to measure the mean fiber diameter
and to build the design of experiments diagram. The micrographs related to DoE are exposed by groups of
images, namely: A1-A6 (Figure 6.11), B1-B6 (Figure 6.12), C1-C6 (Figure 6.13), D1-D6 (Figure 6.14), and
E1-E3 (Figure 6.15).

63
Figure 6.11 - SEM micrograph of composite fibers used in DoE study experiment #1 (A1), #2 (A2), #3 (A3), #4
(A4), #5 (A5), and #6 (A6). Inset of figure A6 correspond to SEM scale.
Figure 6.12 - SEM micrograph of composite fibers used in DoE study experiment #7 (B1), #8 (B2), #9 (B3), #10
(B4), #11 (B5), and #12 (B6). Inset of figure B6 correspond to SEM scale.

64
Figure 6.13 - SEM micrograph of composite fibers used in DoE study experiment #13 (C1), #14 (C2), #15 (AC),
#16 (C4), #17 (C5), and #19 (C6). Inset of figure C6 correspond to SEM scale
Figure 6.14 - SEM micrograph of composite fibers used in DoE study experiment #20 (D1), #21 (D2), #22 (D3),
#23 (D4), #24 (D5), and #25 (D6). Inset of figure D6 correspond to SEM scale.
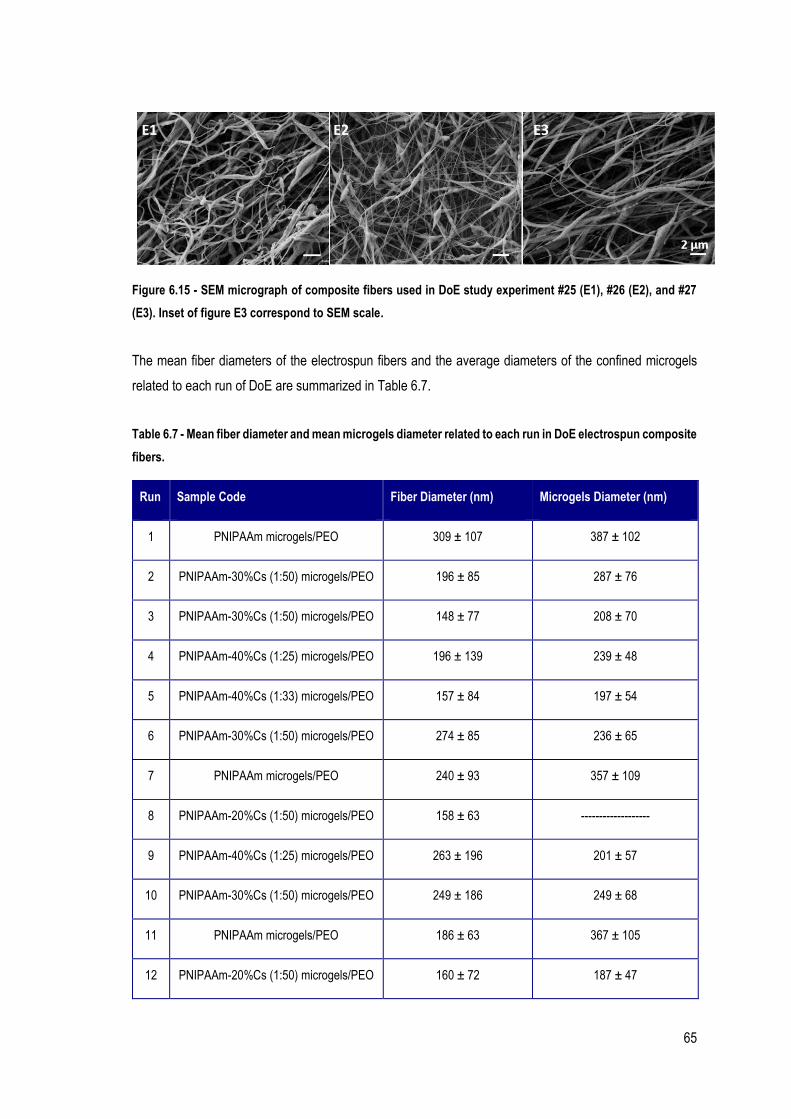
65
Figure 6.15 - SEM micrograph of composite fibers used in DoE study experiment #25 (E1), #26 (E2), and #27
(E3). Inset of figure E3 correspond to SEM scale.
The mean fiber diameters of the electrospun fibers and the average diameters of the confined microgels
related to each run of DoE are summarized in Table 6.7.
Table 6.7 - Mean fiber diameter and mean microgels diameter related to each run in DoE electrospun composite
fibers.
Run Sample Code Fiber Diameter (nm) Microgels Diameter (nm)
1 PNIPAAm microgels/PEO 309 ± 107 387 ± 102
2 PNIPAAm-30%Cs (1:50) microgels/PEO 196 ± 85 287 ± 76
3 PNIPAAm-30%Cs (1:50) microgels/PEO 148 ± 77 208 ± 70
4 PNIPAAm-40%Cs (1:25) microgels/PEO 196 ± 139 239 ± 48
5 PNIPAAm-40%Cs (1:33) microgels/PEO 157 ± 84 197 ± 54
6 PNIPAAm-30%Cs (1:50) microgels/PEO 274 ± 85 236 ± 65
7 PNIPAAm microgels/PEO 240 ± 93 357 ± 109
8 PNIPAAm-20%Cs (1:50) microgels/PEO 158 ± 63 -------------------
9 PNIPAAm-40%Cs (1:25) microgels/PEO 263 ± 196 201 ± 57
10 PNIPAAm-30%Cs (1:50) microgels/PEO 249 ± 186 249 ± 68
11 PNIPAAm microgels/PEO 186 ± 63 367 ± 105
12 PNIPAAm-20%Cs (1:50) microgels/PEO 160 ± 72 187 ± 47

66
13 PNIPAAm-20%Cs (1:50) microgels/PEO 152 ± 93 210 ± 107
14 PNIPAAm microgels/PEO 176 ± 129 410 ± 62
15 PNIPAAm-40%Cs (1:33) microgels/PEO 262 ± 74 -------------------
16 PNIPAAm-40%Cs (1:50) microgels/PEO 180 ± 74 -------------------
17 PNIPAAm microgels/PEO 266 ± 104 275 ± 87
18 PNIPAAm-40%Cs (1:50) microgels/PEO 302 ± 191 178 ± 48
19 PNIPAAm-20%Cs (1:50) microgels/PEO 182 ± 85 -------------------
20 PNIPAAm-40%Cs (1:25) microgels/PEO 173 ± 146 209 ± 56
21 PNIPAAm-40%Cs (1:50) microgels/PEO 212 ± 130 196 ± 53
22 PNIPAAm-30%Cs (1:50) microgels/PEO 181 ± 117 209 ± 72
23 PNIPAAm-40%Cs (1:50) microgels/PEO 237 ± 120 136 ± 57
24 PNIPAAm-40%Cs (1:50) microgels/PEO 176 ± 91 240 ± 51
25 PNIPAAm-20%Cs (1:50) microgels/PEO 220 ± 159 237 ± 53
26 PNIPAAm-20%Cs (1:50) microgels/PEO 167 ± 100 372 ± 88
27 PNIPAAm-30%Cs (1:50) microgels/PEO 136 ± 72 -------------------