PRESSˆO ARTERIAL - Repositório Aberto da Universidade do ... · ponto de corte de PA que Ø...
58
PRESSˆO ARTERIAL: IMPLICA˙ˆO DO NMERO DE MEDI˙ES NA ESTIMATIVA DA PREVAL˚NCIA DE HIPERTENSˆO Daniela Figueiredo Porto 2007
Transcript of PRESSˆO ARTERIAL - Repositório Aberto da Universidade do ... · ponto de corte de PA que Ø...

PRESSÃO ARTERIAL:
IMPLICAÇÃO DO NÚMERO DE MEDIÇÕES NA
ESTIMATIVA DA PREVALÊNCIA DE HIPERTENSÃO
Daniela Figueiredo
Porto 2007
Pressão Arterial: Implicação do número de medições
2
PRESSÃO ARTERIAL: IMPLICAÇÃO DO NÚMERO DE MEDIÇÕES NA ESTIMATIVA
DA PREVALÊNCIA DE HIPERTENSÃO
Daniela Figueiredo
Porto 2007
Dissertação da candidatura ao grau de Mestre em Epidemiologia apresentada à
Faculdade de Medicina da Universidade do Porto
Porto 2007

Pressão Arterial: Implicação do número de medições
3
Esta investigação realizou-se no Serviço de Higiene e Epidemiologia da Faculdade de
Medicina da Universidade do Porto,
sob orientação da Professora Doutora Ana Azevedo Cardoso de Oliveira.
Investigação financiada pela Fundação para a Ciência e a Tecnologia
(POCTI/SAU-ESP/61492/2004).

Pressão Arterial: Implicação do número de medições
4
Agradecimentos
À Professora Doutora Ana Azevedo Cardoso de Oliveira pelo seu ânimo, empenho
e esforço ininterruptos na realização deste projecto e pelo conhecimento e competências
que tão bem soube transmitir relativamente à abordagem, metodologia e interpretação
epidemiológica da medicina.
Ao Professor Doutor Henrique Barros pelo seu talento na comunicação e agudeza
no ensino da epidemiologia, pelo seu estímulo e pela supervisão do trabalho científico.
Aos colegas do Serviço de Epidemiologia pelo agradável acolhimento. Agradeço
particularmente àqueles que têm participado nos projectos de investigação EPIPorto e
EPIcardis II, sem os quais não teria sido possível realizar este projecto.

Pressão Arterial: Implicação do número de medições
5
Índice
1. Introdução 6
2. Objectivos 11
3. Métodos 13
4. Resultados e Discussão 17
4.1. Avaliação e quantificação do impacto causado pela
utilização de diferentes critérios para a definição de hipertensão
arterial na estimativa da sua prevalência. 18
4.1.1. Artigo (Resultados e Discussão) 19
4.2. Comparação da associação das diferentes estimativas
de prevalência de hipertensão arterial com o índice de massa
corporal e a hipertrofia ventricular esquerda 39
4.2.1. Resultados 40
4.2.2. Discussão 44
5. Conclusão 46
6. Resumo 48
7. Bibliografia 51

Pressão Arterial: Implicação do número de medições
6
1. INTRODUÇÃO

Pressão Arterial: Implicação do número de medições
7
As doenças cardiovasculares são a principal causa de morte, quer nos países
desenvolvidos, quer nos países em desenvolvimento. Estima-se que 17.5 milhões de
pessoas tenham morrido de doença cardiovascular em 2005, representando 30% de
todas as causas de morte [1]. A Organização Mundial de Saúde (OMS) prevê que em
2015 aproximadamente 20 milhões de pessoas possam morrer de doença cardiovascular
[1]. Os principais factores de risco directamente modificáveis para a doença
cardiovascular são uma dieta deficiente, o sedentarismo e o tabagismo. Os dois
primeiros condicionam um aumento da pressão arterial, aumento da glicemia,
dislipidemia, aumento de peso e obesidade.
A hipertensão arterial (HTA) foi identificada como o principal factor de risco para
morte e o terceiro mais importante determinante de morbilidade, medido como anos de
vida ajustados para a incapacidade [2]. Quer a pressão arterial sistólica, quer a pressão
arterial diastólica contribuem, de forma contínua e independente, para o risco de
acidente vascular cerebral e de doença coronária [3] e para a mortalidade de origem
vascular [4].
Patricia Kearney [5], numa análise de vários estudos de prevalência de HTA em
diferentes regiões do mundo estima que, em 2025, 1,56 biliões de pessoas, cerca de
29% da população mundial, sofrerá de HTA. Nestes estudos, a grande maioria das
estimativas de prevalência de HTA baseia-se em medições de pressão arterial (PA) em
apenas uma ocasião [6-11]. Nos raros estudos em que as estimativas de prevalência de
HTA se baseiam em medições feitas em duas ocasiões diferentes, esta é
sistematicamente inferior [6].
O diagnóstico de HTA baseia-se na medição rigorosa da PA. As linhas de
orientação internacionais, quer europeias [3], quer americanas [12], recomendam que o
diagnóstico de HTA se baseie na média de pelo menos duas medições de PA
correctamente realizadas, em pelo menos duas ocasiões diferentes. Se a PA está
ligeiramente elevada, várias medições devem ser realizadas posteriormente, visto que,
frequentemente, estes valores regridem para valores normais.
Vários factores contribuem para que uma única medição da PA possa sobrestimar
a prevalência de HTA. As principais razões são a variabilidade intra-individual, a
regressão para a média e o efeito da �bata branca�.
A variabilidade intra-individual pode ser causada por variabilidade inerente à
medição, nomeadamente por problemas que envolvem o observador e o equipamento

Pressão Arterial: Implicação do número de medições
8
utilizado, ou pela variabilidade biológica da própria PA [13]. A variabilidade biológica
pode dever-se ao acaso ou a variações sistemáticas. O observador deve considerar
sempre que a variabilidade da PA pode ocorrer com a fase do ciclo respiratório, o
exercício, as refeições, o consumo de tabaco, café ou álcool, a dor, a temperatura
ambiente, a distensão vesical, as variações circadianas, entre outros [14].
Independentemente de qual o método de medição, a PA é uma variável hemodinâmica
influenciada por vários factores, entre eles as circunstâncias da própria medição.
A medição da PA durante 24 horas em ambulatório demonstra frequentemente
valores inferiores aos que são registados em avaliações clínicas isoladas [15-17]. Valores
de PA inferiores são frequentemente registados numa segunda observação, quer em
ambiente clínico, quer em estudos epidemiológicos [18-21]. A regressão para a média é
um fenómeno estatístico que consiste na observação de valores mais próximos da média
da população quando se reavaliam os indivíduos que se encontravam nos extremos da
distribuição dos valores obtidos na primeira observação. No caso da variável contínua
pressão arterial esse seria um problema particularmente importante se se reavaliassem,
como tem sido reportado nalguns estudos [19,22], apenas os indivíduos com PA elevada
na primeira observação. Se se reavaliarem todos os indivíduos, o fenómeno da
regressão para a média não determinará alteração na média da PA mas apenas uma
redução da dispersão dos valores individuais. Quando, como é habitual, se trabalha com
a variável dicotómica HTA, calculando por exemplo a sua prevalência, uma vez que o
ponto de corte de PA que é utilizado para definir HTA está geralmente acima da média, a
regressão para a média determinará por si só uma redução da proporção de indivíduos
acima desse ponto de corte, logo uma redução da prevalência de HTA.
O efeito da �bata branca� corresponde a um aumento dos valores de PA quando
avaliados em ambiente clínico comparativamente às avaliações em ambientes não
clínicos, como a medição em ambulatório ou pelo próprio doente [14,21]. A medição da
PA provoca uma reacção de alerta, que pode ser mais ou menos transitória, mas a
maioria dos indivíduos têm valores de PA mais elevados quando medidos em ambiente
clínico do que fora desse ambiente [14,21]. Como resultado deste efeito podem ser
observados valores que correspondem a HTA quando medidos por profissionais de saúde,
valores estes que posteriormente normalizam. Este fenómeno parece ser mais
prevalente em indivíduos do sexo feminino e nos idosos [23-25].

Pressão Arterial: Implicação do número de medições
9
Sendo assim, uma baixa acuidade na estimativa de prevalência de HTA de uma
determinada população pode ocorrer ao classificar um indivíduo como hipertenso ou não
hipertenso com base apenas numa medição de PA. Calculando a média de mais do que
uma medição aumentamos a precisão da estimativa por diminuirmos a variabilidade.
Pelo menos duas medições devem ser feitas em cada visita, mas repetidas as vezes
necessárias até se obter uma diferença inferior a 5 mmHg [26]. No entanto, sendo que
medições de PA em diferentes ocasiões tendem a diferir mais do que várias medições na
mesma ocasião, o grande ganho em precisão ocorre usando os resultados de PA de
diferentes visitas [27,28].
Apesar do descrito, a maioria dos estudos epidemiológicos baseia a estimativa de
prevalência da HTA em uma ou mais medições de PA numa única ocasião, por
dificuldades técnicas na implementação de outras medidas, contrariando as
recomendações existentes.
A prevalência de obesidade atingiu proporções epidémicas nos países
industrializados, em que cerca de uma em cada três pessoas é obesa [29]. Vários
estudos populacionais, transversais e prospectivos, assim como estudos clínicos, têm
evidenciado uma associação directa entre o excesso de peso/obesidade e a HTA [30-34].
Segundo Lusignan [35], a prevalência de HTA naqueles que são moderadamente obesos
é duas a três vezes maior do que no resto da população.
Os factores hemodinâmicos determinantes para a relação entre o excesso de
peso/obesidade e a HTA são a expansão do volume intravascular e o aumento do débito
cardíaco com uma relativa deficiente diminuição da resistência vascular sistémica [36].
Nos indivíduos com excesso de peso e obesos a HTA emerge como um factor
determinante no aumento da mortalidade de causa cardiovascular. O excesso de peso
aumenta significativamente a ocorrência de factores de risco de doença cardiovascular,
especialmente HTA, e está por si só com ela relacionado, pelo que deve ser considerado
um factor de risco major para a doença cardiovascular [37,38].
A história natural da HTA, quando não tratada ou insuficientemente tratada,
determina doença cardiovascular prematura e consequentemente mais elevada
mortalidade. A HTA aumenta duas vezes o risco de doença coronária e três vezes o de
insuficiência cardíaca [39]. Estas consequências reflectem a resposta directa induzida ao

Pressão Arterial: Implicação do número de medições
10
nível do ventrículo esquerdo com hipertrofia e rigidez [40] e ao nível da circulação
coronária, com aterosclerose, alteração do relaxamento coronário relativo e consequente
isquemia [41]. A hipertrofia ventricular esquerda (HVE) corresponde a uma adaptação
crónica do ventrículo esquerdo ao aumento da pós carga [42]. Estudos prospectivos
demonstraram que a HVE é um factor preditivo independente de morte súbita, doença
coronária, doença cerebrovascular e insuficiência cardíaca [43-47].
A HVE pode ser detectada por uma variedade de métodos diagnósticos com
diferente sensibilidade e especificidade, como o electrocardiograma (ECG) [48],
ecocardiograma transtorácico (ETT) [49] e ressonância magnética (RMN) [50]. O ECG é
a mais simples mas com uma baixa sensibilidade, sobretudo quando comparada com o
ETT e RMN [51,52]. O ECG identifica HVE em cerca de 5 a 10% dos indivíduos com HTA
e o ETT em cerca de 30% dos adultos hipertensos e 90% dos indivíduos com HTA grave
[53].
Apesar da crescente evidência de que os factores hemodinâmicos são os que
desencadeiam os estímulos biológicos para o desenvolvimento da HVE, outros factores
podem influenciar este aumento da massa ventricular esquerda (MVE), como o genótipo,
o sexo, o tamanho corporal [42], a idade [54] e o peso [53].
Uma vez que está consistentemente estabelecida a forte associação entre o
excesso de peso/obesidade e HTA e entre a HTA e HVE, podemos utilizar estes
pressupostos para avaliar diferentes critérios de diagnóstico de HTA. A hipótese é que a
melhor definição de HTA será a que maximiza a força da associação com aquelas
variáveis.

Pressão Arterial: Implicação do número de medições
11
2. OBJECTIVOS

Pressão Arterial: Implicação do número de medições
12
• Avaliar e quantificar o impacto causado pela utilização de diferentes critérios para
a definição de HTA, tendo em conta o número de observações em que se baseiam,
na estimativa de prevalência de HTA.
• Comparar a associação entre HTA definida pelos diferentes critérios e duas
variáveis reconhecidamente associadas à HTA: o índice de massa corporal por ser
determinante de HTA e a hipertrofia ventricular esquerda por ser consequência de
HTA.

Pressão Arterial: Implicação do número de medições
13
3. MÉTODOS

Pressão Arterial: Implicação do número de medições
14
Desenho do estudo
O estudo foi desenvolvido numa coorte representativa da população adulta da
cidade do Porto, denominada EPIPorto [55].
Parte dos detalhes metodológicos, nomeadamente aqueles que se referem ao
primeiro objectivo, são descritos no artigo que se segue, pelo que não serão aqui
exaustivamente repetidos.
Através da marcação de dígitos telefónicos obtidos a partir de uma tabela de
números aleatórios, foram seleccionados domicílios da cidade do Porto e por
randomização simples foi eleito um indivíduo maior do que 18 anos em cada residência.
Os sujeitos que se recusaram a participar não foram substituídos dentro do mesmo
domicílio. A proporção de participação foi de 70% [56].
Os participantes foram convidados a visitar o Serviço de Higiene e Epidemiologia
da Faculdade de Medicina da Universidade do Porto, para uma entrevista que incluía um
questionário incidindo sobre dados demográficos, sociais, comportamentais e clínicos.
Todos os participantes realizaram uma avaliação antropométrica, uma medição da PA,
colheita de sangue em jejum, uma espirometria e um ECG de 12 derivações em repouso.
Os entrevistadores seguiam instruções rigorosas e participaram em sessões de
treino especiais sobre o protocolo de medição de PA estandardizado usando um
esfigmomanómetro de mercúrio. A 1ª medição da PA realizou-se de manhã após 12
horas de jejum nocturnas. Os participantes foram instruídos para tomar a sua medicação
com fármacos antihipertensores e para não beberem álcool, chá ou café, para não
fumarem e para não realizarem exercício físico nos 30 minutos que precederam a
entrevista. Após 10 minutos de descanso realizaram-se duas medições de PA, separadas
por, pelo menos, 5 minutos. A média foi registada e quando a diferença era maior ou
igual a 5 mmHg, realizava-se uma terceira medição, registando-se a média dos dois
valores mais próximos. A pressão arterial sistólica identificou-se pelos sons de Korotkoff,
no ponto em que o primeiro de dois ou mais sons eram ouvidos (fase 1) e a pressão
arterial diastólica no ponto imediatamente antes do desaparecimento dos sons (fase 5).
Os parâmetros antropométricos foram medidos com os participantes em roupa interior e
sem calçado. O peso foi medido até às décimas de quilograma (kg) usando uma balança
digital e a altura em centímetros medida de pé, com um estadiómetro de parede.
Pressão Arterial: Implicação do número de medições
15
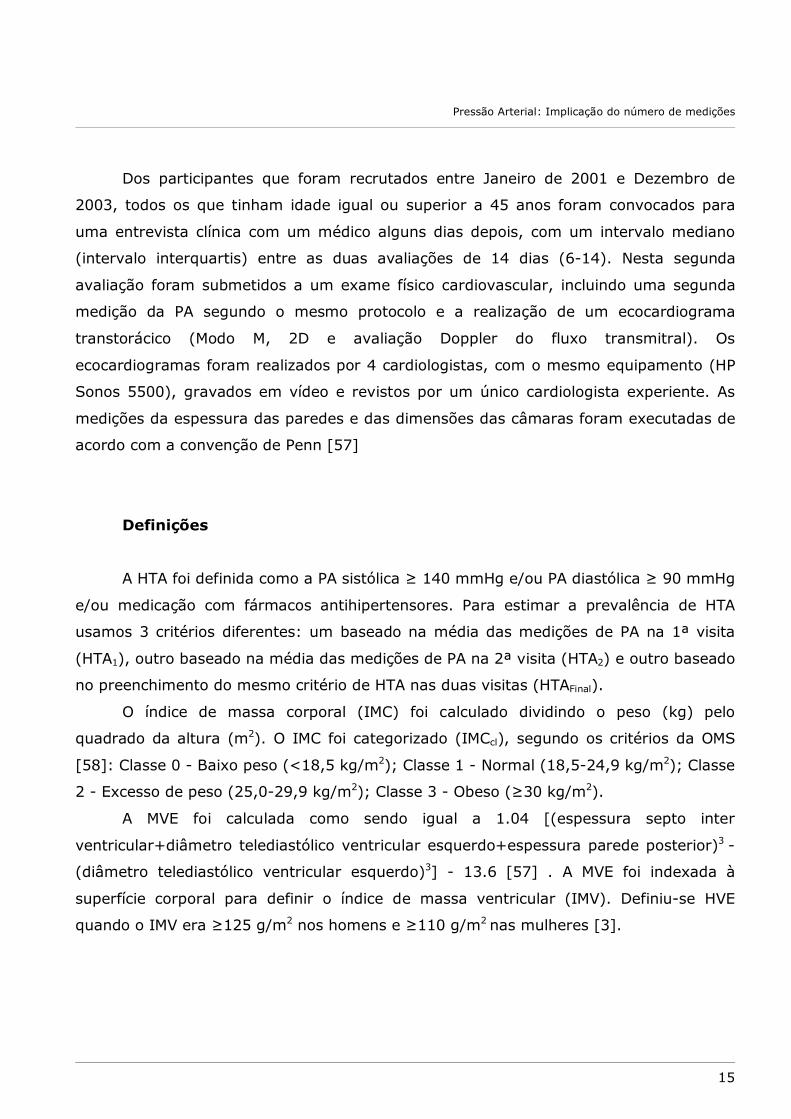
Dos participantes que foram recrutados entre Janeiro de 2001 e Dezembro de
2003, todos os que tinham idade igual ou superior a 45 anos foram convocados para
uma entrevista clínica com um médico alguns dias depois, com um intervalo mediano
(intervalo interquartis) entre as duas avaliações de 14 dias (6-14). Nesta segunda
avaliação foram submetidos a um exame físico cardiovascular, incluindo uma segunda
medição da PA segundo o mesmo protocolo e a realização de um ecocardiograma
transtorácico (Modo M, 2D e avaliação Doppler do fluxo transmitral). Os
ecocardiogramas foram realizados por 4 cardiologistas, com o mesmo equipamento (HP
Sonos 5500), gravados em vídeo e revistos por um único cardiologista experiente. As
medições da espessura das paredes e das dimensões das câmaras foram executadas de
acordo com a convenção de Penn [57]
Definições
A HTA foi definida como a PA sistólica ≥ 140 mmHg e/ou PA diastólica ≥ 90 mmHg
e/ou medicação com fármacos antihipertensores. Para estimar a prevalência de HTA
usamos 3 critérios diferentes: um baseado na média das medições de PA na 1ª visita
(HTA1), outro baseado na média das medições de PA na 2ª visita (HTA2) e outro baseado
no preenchimento do mesmo critério de HTA nas duas visitas (HTAFinal).
O índice de massa corporal (IMC) foi calculado dividindo o peso (kg) pelo
quadrado da altura (m2). O IMC foi categorizado (IMCcl), segundo os critérios da OMS
[58]: Classe 0 - Baixo peso (<18,5 kg/m2); Classe 1 - Normal (18,5-24,9 kg/m2); Classe
2 - Excesso de peso (25,0-29,9 kg/m2); Classe 3 - Obeso (≥30 kg/m2).
A MVE foi calculada como sendo igual a 1.04 [(espessura septo inter
ventricular+diâmetro telediastólico ventricular esquerdo+espessura parede posterior)3 -
(diâmetro telediastólico ventricular esquerdo)3] - 13.6 [57] . A MVE foi indexada à
superfície corporal para definir o índice de massa ventricular (IMV). Definiu-se HVE
quando o IMV era ≥125 g/m2 nos homens e ≥110 g/m2 nas mulheres [3].

Pressão Arterial: Implicação do número de medições
16
Análise estatística
Os dados são descritos como média (desvio padrão) para variáveis com
distribuição normal, mediana (intervalo interquartis) para as variáveis contínuas com
distribuição não normal e proporção para variáveis categóricas. As proporções em
amostras independentes foram comparadas com o teste do qui-quadrado. As proporções
de amostras emparelhadas foram comparadas com o teste de McNemar.
Para estimar a magnitude da associação entre o IMC e a HTA (HTA1, HTA2 e
HTAFinal) e entre a HTA (HTA1, HTA2 e HTAFinal) e a HVE foram calculados odds ratios (OR)
e intervalos de confiança a 95% (IC 95%) por regressão logística não condicional,
tomando como variável dependente a HTA e a HVE respectivamente. O IMC foi analisado
como variável contínua e por classes (tomando como classe de referência a classe 1
[IMC 18,5-24,9]) e a HVE foi estudada como variável dicotómica. Foi também avaliada a
associação entre a HTA e a HVE excluindo os indivíduos sob medicação com fármacos
antihipertensores, uma vez que podia haver regressão da HVE com o tratamento eficaz
da HTA [53], o que poderia justificar uma modificação do efeito da HTA na HVE. Os
possíveis confundidores das associações em questão foram identificados pelos
conhecimentos prévios sobre determinantes do IMC e da HVE. Destes, considerámos as
variáveis que também estão associadas à HTA, não sendo passos intermédios na cadeia
causal entre IMC e HTA ou entre HTA e HVE. Assim, as associações em estudo foram
analisadas tendo em conta o efeito confundidor do sexo e escolaridade para o IMC, e
idade e IMC para a HVE.
Comparámos a prevalência de HVE em três grupos definidos: não hipertensos em
ambas as visitas (sem HTA), hipertensos apenas na primeira visita (HTA não
confirmada) e hipertensos em ambas as visitas (HTA confirmada), estratificando por
classes de IMC.
Os dados foram analisados utilizando o Statistical Package for Social Sciences
version 14.0 (SPSS Inc, Chicago, ILL).

Pressão Arterial: Implicação do número de medições
17
4. RESULTADOS E DISCUSSÃO
Pressão Arterial: Implicação do número de medições
18
4.1. AVALIAR E QUANTIFICAR O IMPACTO CAUSADO PELA UTILIZAÇÃO
DE DIFERENTES CRITÉRIOS PARA A DEFINIÇÃO DE HTA, TENDO EM CONTA O
NÚMERO DE OBSERVAÇÕES EM QUE SE BASEIAM, NA ESTIMATIVA DE
PREVALÊNCIA DE HTA.
Os métodos, resultados e respectiva discussão da abordagem deste objectivo
estão descritos no artigo que se segue, submetido para publicação.

Pressão Arterial: Implicação do número de medições
19
4.1.1. ARTIGO
Pressão Arterial: Implicação do número de medições
20
Number of visits for blood pressure measurement influences the
estimate of arterial hypertension prevalence
Daniela Figueiredo MDa,b, Ana Azevedo MD, PhDa, Marta Pereira BSca, Henrique Barros
MD, PhDa aDepartment of Hygiene and Epidemiology, University of Porto Medical School, Porto,
Portugal bServiço de Anestesiologia, Hospital Geral Santo António, Porto, Portugal
Running head: Number of visits for BP measurement
Key-words: Hypertension, blood pressure, prevalence, awareness, treatment, control
Corresponding author:
Daniela Figueiredo
Serviço de Anestesiologia, Hospital Geral Santo António,
Largo Professor Abel Salazar, 4099-001 Porto, Portugal
Telephone number: +351222077549
Fax number: +351222077550

Pressão Arterial: Implicação do número de medições
21
Abstract
Diagnosis of arterial hypertension should be based on multiple blood pressure (BP)
measurements, taken on at least two separate occasions. We aimed to assess the
impact of considering two criteria for arterial hypertension definition, based on BP
measurements in one or two evaluations on separate occasions, on the estimate of
arterial hypertension prevalence and on the level of awareness, treatment and control of
arterial hypertension.
We used data from a cross-sectional study of 739 participants, aged ≥ 45 years,
randomly selected from a non-institutionalised Portuguese population, from January
2001 to December 2003. Main outcome measures were prevalence of arterial
hypertension (systolic BP ≥140 mmHg and/or diastolic BP ≥90 mmHg or current
antihypertensive drug therapy) after one evaluation or based on fulfilling the same
criteria in two different evaluations, separated by a median of 14 days. We assessed the
influence of using these two criteria on awareness, treatment and control.
Estimated arterial hypertension prevalence (95% confidence interval) was 63.4% (59.8-
66.9) based on BP measurement in the first evaluation, and it was 56.3% (52.7-60.0),
p(McNemar)<0.001, if using BP measurements obtained in two evaluations. Levels of
awareness, treatment and control changed from 60.2% to 64.4%, 53.1% to 59.8% and
24.9% to 22.0%, respectively.
In many individuals labelled as hypertensive on a single evaluation, hypertension was
not confirmed on reassessment, leading to an overestimation of 14.6% of the true value
of prevalence.This study adds to previously published research a quantitative
assessment of the magnitude of the expected error.

Pressão Arterial: Implicação do número de medições
22
Introduction
Blood pressure (BP) is characterized by large variation within and between days
[1,2,3]. Both the JNC VII recommendations [4] and ESH/ESC guidelines [1] recommend
that the diagnosis of arterial hypertension should be based on the mean of two or more
properly measured BP readings on each of two or more visits. However, implementation
of this recommendation is very difficult in large epidemiological studies, and the
definition of hypertension relies on only one or two readings at a single screening visit in
most population surveys. This can lead to an overestimation of the prevalence of arterial
hypertension and consequently to underestimate awareness and treatment [3,5-7].
Many factors can influence this overestimation. There is within-person variability
in BP, which is caused by both analytic measurement error and individual biological
variability [3]. The within-person variability is higher in men and decreases with age [3] .
Increasing the number of measurements on different occasions improves the precision of
the estimate [2]. Self measurements of BP, as ambulatory measurements, have been
shown to give substantially lower values than hospital clinic evaluations [8-10]. Also,
average BP in the second clinic visit is lower than in the initial visit [5,7]. This decline in
BP is known to occur mainly as a regression to the mean phenomenon and to the
familiarization of subjects with the study or with the clinic setting, the so-called �white-
coat� effect, which is defined as a transient rise in BP that is recorded by conventional
measurements and that dissipates when the patient has left the office environment [11].
As a result of the �white-coat� effect a patient may have an elevated BP in the clinic but
a normal pressure outside the physician�s office: so-called white-coat hypertension [12].
The �white-coat� effect is greater in the elderly and in female patients with treated
hypertension [13-15].
Hypertension is highly prevalent in Portugal [16]. Portugal has a high incidence of
stroke compared with other western European countries [17] and the incidence of
transient ischemic attacks in Northern Portugal ranks among the highest reported in
community-based studies [18]. To plan and monitor hypertension control at a population
scale it is essential to know fundamental parameters, such as its prevalence, awareness
and control. The accuracy of blood pressure measurements is essential to treatment
decisions and to value the success of community control of arterial hypertension.
Pressão Arterial: Implicação do número de medições
23
We aimed to assess the impact of using two criteria for arterial hypertension
definition, based on BP measurements in one or two evaluations on separate occasions,
in an office environment, on the estimate of arterial hypertension prevalence.
Additionally, we assessed the influence of using these two different criteria on estimates
of awareness, treatment and control of arterial hypertension.
Methods
Study sample
As part of a cross-sectional health survey, a representative sample of the non-
institutionalised adult population of Porto, Portugal was selected by random digit dialling.
With simple random sampling we selected one eligible subject within each household,
among all permanent residents aged ≥ 18 years old. Refusals were not substituted and
the proportion of participation was 70%. Characteristics of non-participants have been
compared with those of the study participants [19]. Participants where higher in men
(74.7%) than in women (66.3%), p<0.001. Education level and occupation didn�t differ
between groups. Drinkers were significantly more common among participants. Female
participants were younger and more likely to be smokers or former smokers. A detailed
description of the study has been published [20]. Within this sample, 739 consecutive
participants aged ≥ 45 years, recruited from January 2001 to December 2003, were
included in a specific research project, aiming to measure the prevalence of heart failure
in this population [21]. Subjects were evaluated twice, first with a general interview and
then in a specific medical examination, with a median interval (interquartile range)
between the two evaluations of 14 days (6-35). Blood pressure was measured on both
occasions.
The investigation conforms to the principles in the Declaration of Helsinki. The
local ethics committee approved the study and participants provided written informed
consent.
BP measurement
Participants were invited to visit our department for an interview and clinical
examination. Trained interviewers collected data using a structured questionnaire and

Pressão Arterial: Implicação do número de medições
24
measured BP on the first occasion in the morning after a 12-hour overnight fast.
Interviewers were given detailed instructions on administration of the questionnaire and
participated in special training sessions on the use of a standardized BP measurement
protocol using a mercury sphygmomanometer. Participants were instructed to take their
medication and not to take alcohol, tea/coffee, smoke or have exercise within the 30
minutes preceding the measurement. Two measurements of blood pressure separated
by at least 5 minutes were taken with a mercury sphygmomanometer after 10-minute
rest, with no tight clothes, on the right upper arm and at the heart level. The mean was
considered and when the difference was larger than 5mmHg for systolic or diastolic BP a
third measurement was taken and the mean of the 2 closest values was registered.
Korotkoff sounds were used to identify systolic BP, the point at which the first of 2 or
more sounds is heard (phase 1) and diastolic BP, the point before the disappearance of
sounds (phase 5). A few days after the first interview a second assessment made by a
physician took place in the afternoon (second evaluation), with a structured clinical
interview, cardiovascular physical examination and echocardiographic examination. BP
was measured according to the same protocol.
Definitions
Arterial hypertension was defined as systolic BP ≥140 mmHg and/or diastolic BP
≥90 mmHg and/or current antihypertensive drug therapy. We used different criteria to
estimate the prevalence of arterial hypertension prevalence: One based on the mean of
BP measurements in the first evaluation (HTN1), another based on the mean of BP
measurements in the second evaluation (HTN2) and an estimate based on fulfilling the
same criteria of arterial hypertension on both evaluations (HTNfinal). Treatment of arterial
hypertension, defined as current use of antihypertensive drug therapy, was determined
by review of all medication taken. Awareness of arterial hypertension was defined as
answering �yes� to the question: �Have you ever been told by a doctor that you have
high BP?�. Control was defined as the proportion with systolic BP <140 mmHg and
diastolic BP < 90 mmHg among subjects under antihypertensive drug therapy. When we
defined arterial hypertension using the criteria based on two evaluations, we defined
control as systolic BP <140 mmHg and diastolic BP < 90 mmHg in both evaluations.

Pressão Arterial: Implicação do número de medições
25
Statistical analysis
We compared the estimated prevalence of arterial hypertension based on BP
measurements in the first evaluation (HTN1) and in the second evaluation (HTN2) with
another estimate based on fulfilling the same criteria on both evaluations (HTNfinal). We
made the same comparison excluding participants who were under antihypertensive
drug therapy. Additionally, we assessed the influence of using these different criteria on
estimates of awareness, treatment and control of hypertension among treated
individuals. We estimated the distribution of individuals by JNC-VII categories [4] and
assessed in which strata subjects were more likely to cross categories between the two
evaluations.
Data are described as mean (standard deviation) for normally distributed
quantitative variables, median (interquartile range) for non-normally distributed
quantitative variables and proportions for categorical variables. Proportions in
independent samples were compared using the chi-Square test. Paired proportions were
compared using the McNemar test.
All recorded data were analyzed using the Statistical Package for Social Sciences
version 14.0 (SPSS Inc, Chicago, ILL).
Results
The sample characteristics are presented in Table 1. The sample included 296 men
and 443 women, with mean (standard deviation) age 63 (11) and 61 (10) years,
respectively. Two hundred and forty seven individuals were under antihypertensive drug
treatment.
The prevalence of arterial hypertension (HTN1) was 63.4% (95%CI: 59.8-66.9)
when using BP measurements from the first evaluation and 60.2% (56.6-63.8) when
using BP measurements from the second evaluation (HTN2). If we used both evaluations
(HTNfinal) the estimated arterial hypertension prevalence was 56.3% (52.7-60.0),
p(McNemar)<0.001 between HTN1 and HTNfinal, and between HTN2 and HTNfinal (figure 1).
The relative overestimation in the first visit corresponds to 14.6% of the true value of
arterial hypertension prevalence (taken as HTNfinal).

Pressão Arterial: Implicação do número de medições
26
When we excluded subjects under antihypertensive drug treatment and estimated
arterial hypertension prevalence only based on BP measurements, the prevalence was
44.9% (40.4-49.4) in the first evaluation and 40.0% (35.9-44.7) in the second
evaluation. If we used both evaluations, the estimated arterial hypertension prevalence
was 34.2% (29.9-38.6), p(McNemar)<0.001 between HTN1 and HTNfinal and between
HTN2 and HTNfinal.
The figure 2 presents the distribution by JNC-VII categories of BP, according to
the first evaluation and to the second evaluation, excluding subjects under
antihypertensive drug therapy. In the first visit, distribution is significantly more likely to
be in stage 1 and stage 2 categories than in the second visit (p<0.001 comparing JNC
VII categories between the first visit and the second visit).
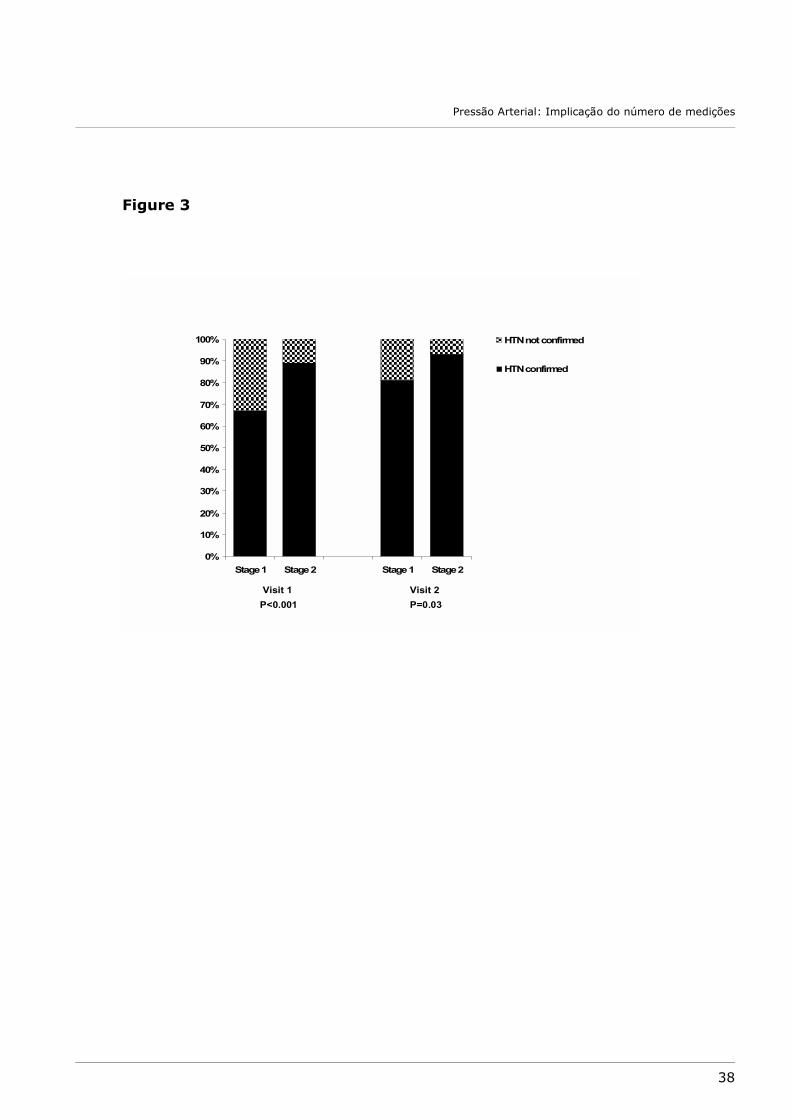
Among subjects with stage 1 and stage 2 arterial hypertension in the first
evaluation, respectively 32.8% and 11.2% did not fulfil criteria for arterial hypertension
diagnosis upon reassessment (p<0.001 comparing hypertension categories between
HTN1 and HTNFinal). In the second evaluation these proportions were 19.3% and 6.6%,
respectively (p=0.03 comparing hypertension categories between HTN2 and HTNFinal)
(figure 3).
The Table 2 displays the estimated proportions of the levels of awareness,
treatment and control according to criteria based on one or two evaluations. Considering
data from two evaluations increased the proportion of awareness and treatment,
whereas the proportion of control decreased.
Discussion
The estimated arterial hypertension prevalence was significantly different when
based on BP measurements in the first evaluation (HTN1) or in the second evaluation
(HTN2) than based on fulfilling the same criteria of arterial hypertension on both
evaluations (HTNfinal). The relative overestimation in the first visit corresponds to 14.6%
of the true value of arterial hypertension prevalence (taken as HTNfinal). What this study
adds to previous published studies is a quantitative assessment of the magnitude of
overestimation.

Pressão Arterial: Implicação do número de medições
27
Several studies have been conducted worldwide to estimate the prevalence of
arterial hypertension in adult populations [22]. In almost all studies the BP
measurements methods included a number of different measurements in just one
evaluation, despite the universal consensus on the limitations of such option. The
National Health and Nutrition Examination Survey (NHANES)III [23], the Canadian Heart
Health Survey (CHHS) [24], The Cohort Study Incidence and Arterial Hypertension in the
Working Population Antillo-Guyanaise (INHAPAG) [25] and Arterial Hypertension in
Poland Plus Lipid Disorders and Diabetes (NATPOL PLUS) [26] are exceptions.
When comparing the prevalence of arterial hypertension between studies from
North America (Canada, USA) in which two visits were used and Europe (UK, Finland,
Spain, Germany, Sweden, Italy) in which one visit was used [27] the average prevalence
of hypertension in Europe (44.2%) was much higher than in North America (27.6%).
The authors of the publication ignored the difference in arterial hypertension definition
criteria, which might have caused overestimation of hypertension prevalence in Europe
[28].
This study reinforces previous reports on the very high prevalence of arterial
hypertension, when compared to others studies [16, 22]. We remind, however, that our
sample included only participants aged ≥ 45 years. Therefore, the results cannot be
directly compared with estimates from the general population.
In our study, as in others [5,7], the average BP in the second clinic evaluation was
lower than in the first evaluation. This decline mainly reflects the statistical phenomenon
of regression to the mean and the contribute of familiarization of subjects with the clinic
setting (the so-called �white coat� effect). It is unlikely that in our study this decrease is
explained by changes in lifestyles by participating in the study, due to the short interval
between visits. Bovet et al. [7] , in a study conducted in Dar es Salaam, Tanzania,
showed that the BP decrease was large between the first and the second visit but it was
small between additional visits and concluded that the prevalence of high BP based on
repeated readings at a second visit will estimate fairly well the true prevalence in the
population. Zdrojewski et al, in a Polish urban population aged 30�92 years, showed that
in almost half of persons with elevated blood pressure during the first visit, no consistent
occurrence of elevated blood pressure was detected during subsequent regular visits
[29]. Based on these observations, some authors relied on just the second visit to
calculate arterial hypertension prevalence [30-32] to minimize overestimation of this

Pressão Arterial: Implicação do número de medições
28
prevalence. We found that the estimate of arterial hypertension prevalence is even lower
if we use data from BP measurements in two different evaluations than if we use data
from BP measurement in only the second evaluation.
Approximately two thirds of subjects who were considered hypertensive in one
evaluation but did not confirm upon reassessment, were included in stage 1 JNC VII
category. As expected, the majority of individuals that were misclassified as
hypertensive were in less severe stages.
The levels of awareness and treatment increased when the estimate arterial
hypertension prevalence is defined based in two BP evaluations criteria, resulting from
the decrease in the proportions denominator. The level of control did not increase as in
other studies [6,25], due to different criteria to determine control arterial hypertension.
In a French working population, Lang et al [6] analyzed to what extent the results of BP
control at the population level is improved if the diagnosis of hypertension is defined on
the basis of two visits. Compared with results based in one visit, the estimation of
prevalence was 40% lower and the proportion of aware hypertension individuals was
45% higher. We found similar results with a smaller relative difference, mainly due to
the higher prevalence of hypertension in our sample. This can be explained by the older
mean age in our study sample and by the �healthy worker effect� in Lang�s study. On the
other hand, Lang et al found that the proportion of controlled subjects, when the
hypertension diagnosis was based on 2 separate visits, was about 60% higher. The fact
is that, similarly to other studies [24], Lang et al only invited for a second assessment
untreated subjects with BP ≥140 mmHg and/or diastolic BP ≥90 mmHg, and defined as
controlled those individuals with systolic BP <140 mmHg and diastolic BP < 90 mmHg
only in the first visit. When we estimated arterial hypertension prevalence based in two
BP evaluations, we defined hypertension control as systolic BP <140 mmHg and diastolic
BP < 90 mmHg in both evaluations. The results suggest that caution must be used in
attributing differences in estimates of prevalence and control of arterial hypertension to
regional variation. The various definitions of control among studies and some confusion
regarding the criteria used to determine an individual with arterial hypertension under
control made comparisons difficult [5].
Klungel et al [3] assessed the influence of correction for within-person variability
on the prevalence, awareness, treatment and control of arterial hypertension. After
correction for within person variability, the prevalence of hypertension decreased,

Pressão Arterial: Implicação do número de medições
29
whereas the prevalence of awareness of hypertension and treatment of hypertension
increased.
Intrasubject and interobserver variation could explain part of the observed
difference. BP usually follows a reproducible circadian pattern, characterized by low
levels during sleep and a rapid increase during the early-morning period [12] but this
has a limited reproducibility in the whole population as well as across different age and
sex subgroups [33,34]. Otherwise no significantly differences have been describe
between the BP measurements in the morning and in the afternoon, however we cannot
exclude that part of the observed difference is simply explained by the fact that the first
visit occurred in the morning and the second in the afternoon.
Since we aimed to assess the effect of the number of measurements in the
estimate of arterial hypertension prevalence and not the prevalence of arterial
hypertension itself, representativeness is not essential. However, given that the effect of
such conditions on the precision of estimates is not homogenous in the population there
could be selection bias due to non-participation.
Our results have major implications regarding study design and the interpretation
of the estimates of prevalence, awareness, treatment and control of arterial
hypertension. Disregarding the �white coat effect�, regression to the mean and within
person variability of blood pressure, and relying on few BP measurements, leads to
wrong conclusions about the level of awareness, treatment and control of arterial
hypertension in the population. Currently, newer methods for the measurement of blood
pressure, such as ambulatory monitoring and home blood pressure measurements using
recording devices are available. Potentially, these methods could more easily provide a
precise assessment of a person�s average BP, as well as more valid prevalence estimates.
From a clinical and an epidemiological perspective, substantial intra-individual variability
of BP makes important multiple BP readings over several visits. To minimize the
difficulties of a strategy based on two separate visits, repeated BP measurements could
be obtained in random sub-samples of population under study and appropriate
adjustments performed accordingly [3].
Additionally, for correct interpretation of the surveys results, authors need to
provide clearer statements of the definitions employed, as different criteria for arterial
hypertension definition give different estimate of arterial hypertension prevalence.

Pressão Arterial: Implicação do número de medições
30
The prevalence of arterial hypertension based on a single evaluation was
overestimated by 14.6%, compared with estimates based on two evaluations. This fact
strongly corroborates the recommendation that the measurements of arterial BP should
be made at least in two office evaluations both for clinical purposes and in epidemiologic
studies.
Acknowledgements
This study was funded by a grant from Fundação para a Ciência e a Tecnologia
(POCTI/SAU-ESP/61492/2004).

Pressão Arterial: Implicação do número de medições
31
References:
1. 2007 Guidelines for the management of arterial hypertension. European Society of
Hypertension and European Society of Cardiology Guidelines, J Hypertens
2007;25:1105-1187
2. Armitage P, Fox W, Rose GA, Tinker CM. The variability of measurements of casual
blood pressure. II. Survey experience, Clin Sci 1966;30:335�337.
3. Klungel OH, Boer A., Paes AHP, Nagelkerke N, Seidell JC, Bakker A. Influence of
Correction for Within-Person Variability in Blood Pressure on the Prevalence,
Awareness, Treatment, and Control of Hypertension, AJH 2000; 13:88-91
4. The JNC 7 Report, JAMA 2003;289:2560-2572
5. Birkett NJ. The effect of alternative criteria for hypertension on estimates of
prevalence and control, J Hypertens 1997;15:237�244.
6. Lang T, Gaudemaris R, Chatellier G, Hamici L, Diène E. Prevalence and therapeutic
control of hypertension, Hypertension 2001;38:449-454
7. Bovet P, Gervasoni JP, Ross AG, Mkaba M, Mtasiwa DM, Lengeler C et al.
Assessing the prevalence of hypertension in populations: Are we doing it right?, J
Hypertens 2003; 21:509�517
8. Waeber B. Scherrer U, Petrillo A. Are some hypertensive patients over treated? A
prospective study of ambulatory blood pressure recording, Lancet 1987; ii:732-4
9. O�Brien E, O�Malley K. Overdiagnosing hypertension, Br Med J 1988;297:1211�
1212
10.Pearce KA, Grimm RH, Rao S, Svendsen K, Liebson PR, Neaton JD et al.
Population-derived comparisons of ambulatory and office blood pressures:
implications for the determination of usual blood pressure and the concept of
white coat hypertension, Arch Intern Med 1992;152:750 �756.
11.Pickering TG, Gerin W, Schwartz AR. What is the white-coat effect and how should
it be measured? Blood Press Monit 2002; 7:293�300.
12.O�Brien E, AsmarR, Beilin L, Imai Y, Mallion JM, Mancia G et al. European Society
of Hypertension recommendations for conventional, ambulatory and home blood
pressure measurement, J Hypertens 2003;2:821�848.
13.Amado P, Vasconcelos N, Santos I, Almeida L, Nazare J, Carmona J. Arterial
hypertension difficult to control in the elderly patient. The significance of the
"white coat effect�, Rev Port Cardiol 1999;18:897-906.
Pressão Arterial: Implicação do número de medições
32
14.Myers MG, Reeves RA. White coat effect in treated hypertensive patients: sex
differences, J Hum Hypertens 1995;9:729-33.
15.Lindbaek M, Sandvik E, Liodden K, Mjell J, Ravnsborg-Gjertsen K. Predictors for
the white coat effect in general practice patients with suspected and treated
hypertension, Br J Gen Pract.2003;53:790-3.
16.Macedo ME, Lima MJ, Silva AO, Alcantara P, Ramalhinho V, Carmona J. Prevalence,
awareness, treatment and control of hypertension in Portugal: the PAP study, J
Hypertens 2005; 23:1661-6
17.Correia M. Silva M, Matos I, Magalhães R, Lopes JC, Ferro JM et al. Prospective
Community-Based Study of Stroke in Northern Portugal: Incidence and Case
Fatality in Rural and Urban Population, Stroke 2004;35;2048-2053
18.Correia M. Silva M, Magalhães R, Guimarães L, Silva C. Transient Ischemic Attacks
in Rural and Urban Northern Portugal, Stroke 2006;37;50-55
19.Ramos E, Lopes C, Barros H. Investigating the Effect of Nonparticipation Using a
Population-Based Case-Control Study on Myocardial Infarction, Ann Epidemiol
2004; 14:437-441
20.Santos AC, Barros H. Prevalence and determinants of obesity in an urban sample
of Portuguese adults, Public Health 2003;117:430-37
21.Azevedo A, Bettencourt P, Dias P Abreu-Lima C, Hense HW, Barros H. Population
based study on the prevalence of the stages of heart failure, Heart 2006;
92:1161-1163
22.Kearnet PM, Whelton M, Reynolds K, Whelton PK, He J. Worldwide prevalence of
hypertension: a systematic review, J Hypertens 2004;11-19
23.Burt VL, Whelton P, Roccella EJ, Brown C, Cutler JA, Higgins M et al. Prevalence of
hypertension in the US adult population: results from the third National Health
and Nutrition Examination Survey, 1988�1991, Hypertension 1995;25: 305�313.
24.Joffres MR, Ghadirian P, Fodor JG, Petrasovits A, Chockalingam A, Hamet P.
Awareness, treatment and control of hypertension in Canada, Am J Hyperten
1997;10:1097-1102
25.Inamo J, Malfatti S, Lang T, Atallah A, Inamo A, Larabi L et al. Hypertension
artérielle aux Antilles: différence liées au sexe, Arch Mal C�ur Vaiss
2005 ;98:845-849

Pressão Arterial: Implicação do número de medições
33
26.T Zdrojewski, Szpakowski P, Bandosz P, Pajak A, Wiecek A, Krupa-Wojciechowska
B et al. Arterial hypertension in Poland in 2002, J Hum Hypertens 2004;18:557�
562
27.Wolf-Maier K, Cooper RS, Gampaoci S, Hense HW, Joffers M, Banegas JR et al.
Hypertension prevalence and blood pressure levels in 6 European countries,
Canada, and the United States, JAMA 2003; 289:2363�2369.
28.T. Zdrojewski, Wyrzykowski B, Szcze ch R,, Wierucki L, Naruszewicz M Narkiewicz
K et al. Epidemiology and prevention of arterial hypertension in Poland, Blood
Pressure 2005;14(Suppl 2):10�16
29.Zdrojewski T. The prevalence of hypertension assessed on the basis of one instead
of three visits, can be largely overestimated, Arter Hypertens 2002;4(Abstr Suppl):
S26
30.Stergiou GS, Thomopoulou GC, Skeva II, Mountokalakis TD. Prevalence,
awareness, treatment, and control of hypertension in Greece: the Didima study,
Am J Hyperten 1999;12:959-965
31.Sarafidis PA, Lasaridis A, Gousopoulos S, Zebekakis P, Nokolaidis P, Tziolas I et al.
Hypertension in Northern Greece factory employees, J Hum Hypertens 2004;18,
623�629
32.Efstratopolous A, Voyaki S, Basltas AA, Vratsistas FA, Kirlas D-E, Kontoyannis J et
al. Prevalence, awareness, treatment and control of hypertension in Hellas,
Greece, Am J Hyperten 2006;19:53-60
33.Cuspidia C, Meanic S, Valerioc C, Salac C, Fusib V, Masaidic M et al.
Reproducibility of dipping/nondipping pattern in untreated essential hypertensive
patients: impact of sex and age, Blood Pressure Monitoring 2007, Vol 12 No 2
34.Cuspidi C, Meani S, Salerno M, Valerio C, Fusi V, Severgnini B et al.
Reproducibility of nocturnal blood pressure fall in early phases of untreated
essential hypertension: a prospective observational study. J Hum Hypertens.
35.2004 Jul;18(7):503-9.

Pressão Arterial: Implicação do número de medições
34
Tables
Table 1. Characteristics of the 739 study sample participants
Table 2. Comparison of the estimates of arterial hypertension prevalence, awareness, treatment and control according to the different visits
HTN1 HTN2 HTNFinal P* P**
Hypertension 64.4% 60.2% 56.3% <0.001 <0.001
Awareness 60.2% 60.7% 64.4% 0.02 0.02
Treatment 53.1% 55.5% 59.8% 0.05 0.02
Control 24.9% 37.4% 22.0% 0.03 <0.001
*Comparing HTN1 and HTNfinal using McNemar test. **Comparing HTN2 and HTNfinal using McNemar test.
Women, n (%) 443 (59.9%)
Age (years), mean (standard deviation) 62 (11)
Education (years), median (interquartile range) 4 (4 -11)
Body mass index (Kg/m2), mean (standard deviation) 28.0 (4.4)
Participants under antihypertensive drug treatment 247 (33%)

Pressão Arterial: Implicação do número de medições
35
Figures
Figure 1: Arterial hypertension prevalence according to the use of measurements from
different visits (error bars are 95% confidence intervals).
Figure 2: Comparison of blood pressure categories, according to JNC VII, in the first visit
and in the second visit, excluding subjects under antihypertensive drug therapy.
Figure 3: Proportion of subjects with confirmed arterial hypertension according to JNC
VII hypertension categories in each individual visit.

Pressão Arterial: Implicação do número de medições
36
Figure 1
HypertensionPrevalence(95% CI)
p<0.001 p<0.001
HTN1 HTN2 HTNFinal
0,50
0,55
0,60
0,65
0,70
p<0.001p<0.001
p<0.001

Pressão Arterial: Implicação do número de medições
37
Figure 2
JNC Categories
0%
5%
10%
15%
20%
25%
30%
35%
40%
45%
Normal Prehypertension Stage 1 Stage 2
Visit 1
Visit 2
P<0.001
Pressão Arterial: Implicação do número de medições
38
Figure 3
0%
10%
20%
30%
40%
50%
60%
70%
80%
90%
100%
Stage 1 Stage 2 Stage 1 Stage 2
HTN not confirmed
HTN confirmed
Visit 1P<0.001
Visit 2P=0.03

Pressão Arterial: Implicação do número de medições
39
4.2. COMPARAR A ASSOCIAÇÃO ENTRE HTA DEFINIDA PELOS
DIFERENTES CRITÉRIOS E DUAS VARIÁVEIS RECONHECIDAMENTE
ASSOCIADAS À HTA: O ÍNDICE DE MASSA CORPORAL POR SER
DETERMINANTE DE HTA E A HIPERTROFIA VENTRICULAR ESQUERDA POR SER
CONSEQUÊNCIA DE HTA.

Pressão Arterial: Implicação do número de medições
40
4.2.1 RESULTADOS
As estimativas da prevalência da HTA, de acordo com os diferentes critérios
definidos (HTA1, HTA2 e HTAFinal), são apresentadas na Tabela 1.
Tabela 1. Comparação das estimativas de prevalência de HTA de acordo com as diferentes definições.
HTA1 HTA2 HTAFinal P* P**
64.4% 60.2% 56.3% <0.001 <0.001
*Comparação de HTA1 e HTAFinal (teste de McNemar). **Comparação de HTA2 e HTAFinal (teste de McNemar).
A distribuição por classes de IMC (IMCcl) e a prevalência de HVE é apresentada na
Tabela 2.
Tabela 2. Distribuição por classes de índice de massa corporal (IMCcl) e prevalência de hipertrofia ventricular esquerda (HVE) no total da amostra e nos indivíduos hipertensos, segundo as
diferentes estimativas de prevalência (HTA1, HTA2 e HTAFinal).
Total (n) HTA1(n) HTA2(n) HTAFinal(n)
IMCcl
<25 kg/m2 24,2%(178) 18,1%(84) 19,8%(88) 17,2%(71)
25-29,9 kg/m2 49,1%(361) 49,6%(230) 48,8%(213) 49,8%(205)
≥30 kg/m2 26,7%(196) 32,3%(150) 32,2%(143) 33,0%(136)
HVE 25,9% (187) 34,6%(157) 35,0%(152) 36,7%(148)
Quer a prevalência de excesso de peso/obesidade, quer de HVE, são semelhantes
entre as diferentes estimativas de prevalência de HTA (HTA1, HTA2 e HTAFinal).

Pressão Arterial: Implicação do número de medições
41
Os resultados da análise bruta das variáveis associadas a HTA são apresentados
na Tabela 3. Havia uma associação directa e estatisticamente significativa entre a HTA e
o sexo masculino, a idade, o IMC e a HVE, e inversa com a escolaridade.
Tabela 3. Odds ratios brutos (intervalo de confiança a 95%) que estimam a força da associação de variáveis socio-demográficas, índice de massa corporal (IMC e IMCcl) e hipertrofia ventricular esquerda (HVE) com a hipertensão arterial, segundo as diferentes definições (HTA1,
HTA2 e HTAFinal).
HTA1 HTA2 HTAFinal
Sexo masculino 1,40 (1,02-1,91) 1,29 (0,95-1,75) 1,33 (0,95-1,79)
Idade (anos) 1,07 (1,06-1,09) 1,08 (1,06-1,10) 1,09 (1,06-1,09)
Escolaridade (anos) 0,92 (0,89-0,95) 0,92 (0,89-0,95) 0,92 (0,89-0,95)
IMC (kg/m2) 1,17 (1,07-1,16) 1,08 (1,05-1,12) 1,10 (1,06-1,14)
IMCcl
<25 kg/m2 1 1 1
25-29,9 kg/m2 1,98 (1,38-2,86) 1,47 (1,03-2,11) 2,01 (1,39-2,89)
25-29,9 kg/m2 3,57 (2,29-5,51) 2,76 (1,79-4,25) 3,42 (2,23-5,24)
HVE 4,11 (2,68-6,29) 3,91 (2,65-5,86) 4,15 (2,81-6,14)
Uma vez que o IMC estava significativamente associado ao sexo e à escolaridade,
a associação entre as diferentes estimativas de HTA com IMC foi avaliada ajustando para
estes confundidores. Os resultados desta análise multivariada estão apresentados na
Tabela 4, consistindo em dois modelos, um em que o IMC é analisado como variável
contínua e outro por classes, tomando sempre a HTA como variável dependente. A
associação do IMC com as diferentes estimativas de HTA manteve-se estatisticamente
significativa e independente do sexo e da escolaridade.

Pressão Arterial: Implicação do número de medições
42
Tabela 4. Odds ratios (intervalo de confiança a 95%) que estimam a força da associação entre índice de massa corporal (IMC e IMCcl) e hipertensão arterial, segundo as diferentes definições
(HTA1, HTA2 e HTAFinal).
HTA1 HTA2 HTAFinal
IMC (kg/m2) 1,11 (1,07-1,16) 1,08 (1,04-1,12) 1,10 (1,06-1,14)
Sexo masculino 1,85 (1,32-2,58) 1,62 (1,18-2,25) 1,72 (1,25-2,37)
Escolaridade (anos) 0,92 (0,89-0,96) 0,92 (0,89-0,95) 0,93(0,90-0,96)
IMCcl
<25 kg/m2 1 1 1
25-29,9 kg/m2 1,88 (1,29-2,74) 1,36 (0,94-1,97) 1,89 (1,30-2,75)
25-29,9 kg/m2 3,40 (2,14-5,40) 2,51 (1,60-3,93) 3,21 (2,06-5,01)
Sexo masculino 1,79 (1,28-2,51) 1,61 (1,17-2,23) 1,68 (1,21-2,31)
Escolaridade (anos) 0,92 (0,89-0,96) 0,92 (0,89-0,95) 0,92 (0,90-0,98)
Uma vez que a idade e o IMC estavam significativamente associados à presença
de HVE, para avaliar se a associação entre HTA e HVE era independente destes
confundidores, construiu-se um modelo de regressão logística multivariada, tomando a
HVE como variável dependente. Como se pode observar na Tabela 5, existe uma
associação significativa entre as diferentes estimativas de HTA e a HVE, independente da
idade e IMC.
Tabela 5. Odds ratios (intervalo de confiança a 95%) que estimam a força da associação entre a hipertensão arterial, segundo as diferentes definições (HTA1, HTA2 e HTAFinal) e a hipertrofia
ventricular esquerda (HVE), ajustados para o índice de massa corporal medido em kg/m2 (IMC) e para a idade em anos.
HVE HVE HVE
HTA1 2,64 (1,68-4,15) HTA2 2,49 (1,62-3,84) HTAFinal 2,71 (1,79-4,11)
IMC 1,06 (1,01-1,20) IMC 1,06 (1,02-1,10) IMC 1,06 (1,01-1,10)
Idade 1,06 (1,04-1,07)
Idade 1,06 (1,04-1,07)
Idade 1,06 (1,04-1,07)
Pressão Arterial: Implicação do número de medições
43
Quando se excluíram os indivíduos medicados com fármacos antihipertensores, a
associação entre HTA e HVE manteve-se semelhante, pelo que se conclui que não havia
modificação do efeito por este tratamento.
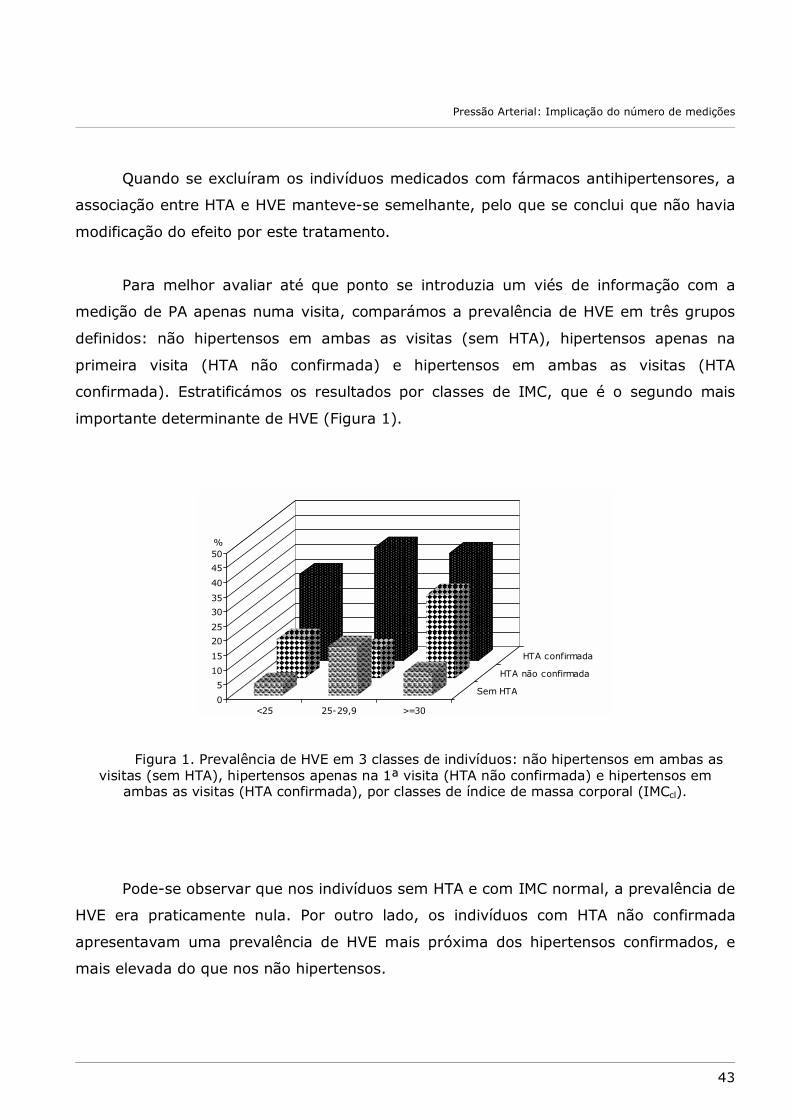
Para melhor avaliar até que ponto se introduzia um viés de informação com a
medição de PA apenas numa visita, comparámos a prevalência de HVE em três grupos
definidos: não hipertensos em ambas as visitas (sem HTA), hipertensos apenas na
primeira visita (HTA não confirmada) e hipertensos em ambas as visitas (HTA
confirmada). Estratificámos os resultados por classes de IMC, que é o segundo mais
importante determinante de HVE (Figura 1).
0
5
10
15
20
25
30
35
40
45
50
<25 25-29,9 >=30
Sem HTA
HTA não confirmada
HTA confirmada
%
Figura 1. Prevalência de HVE em 3 classes de indivíduos: não hipertensos em ambas as visitas (sem HTA), hipertensos apenas na 1ª visita (HTA não confirmada) e hipertensos em
ambas as visitas (HTA confirmada), por classes de índice de massa corporal (IMCcl).
Pode-se observar que nos indivíduos sem HTA e com IMC normal, a prevalência de
HVE era praticamente nula. Por outro lado, os indivíduos com HTA não confirmada
apresentavam uma prevalência de HVE mais próxima dos hipertensos confirmados, e
mais elevada do que nos não hipertensos.

Pressão Arterial: Implicação do número de medições
44
4.2.2. DISCUSSÃO
A forte associação entre o IMC e a HTA e entre a HTA e a HVE não foi
significativamente diferente em função da definição de HTA utilizada. Isto significa que,
apesar da diferença na estimativa da prevalência de HTA ser significativa, em função dos
diferentes critérios testados, esta não se reflecte na associação com o IMC e com HVE.
No presente estudo a prevalência de excesso de peso foi de 46,7% e a prevalência
de obesidade de 26,7%. O aumento de peso condiciona alterações fisiológicas que estão
associadas ao aparecimento de várias doenças crónicas, incluindo a HTA [30,31,33]. Na
nossa amostra os resultados evidenciam uma elevada associação entre o IMC e a HTA,
independente do sexo e da escolaridade, sendo esta uma associação directa e contínua.
Quer para as mulheres, quer para os homens, a obesidade determina um aumento da
prevalência de HTA, independentemente da forma como ela é definida, isto é,
independentemente das estimativas de prevalência de HTA (HTA1, HTA2 e HTAFinal). Para
a HTAFinal (definida como PA sistólica ≥ 140 mmHg e/ou PA diastólica ≥ 90 mmHg e/ou
medicação com fármacos antihipertensores em duas visitas diferentes) o OR para
excesso de peso era de 1,89 e para a obesidade 3,21.
A prevalência de HVE no total da amostra foi de 25,9%, aumentando para 37,4%
entre os indivíduos hipertensos (HTAFinal). Excluindo os indivíduos com excesso de peso,
obesos e hipertensos a prevalência de HVE foi 4,4% (3 indivíduos) (Figura 1) e por isso,
como demonstrado, a HVE está fortemente associada e é fortemente explicada pela HTA
e pelo excesso de peso/obesidade.
Tal como em vários estudos prévios, em que o impacto da HTA na HVE tem sido
claramente demonstrado [53,59] os resultados demonstram uma elevada associação
entre a HTA e a HVE, independente da idade e do IMC. Quando excluímos os indivíduos
medicados esta associação manteve-se. Este facto poderá ser surpreendente visto que
existem evidências que o tratamento com quase todas as classes de fármacos
antihipertensores origina uma diminuição da HVE, desde que os valores de PA sejam
também controlados para valores normais [53]. No entanto a nossa amostra apresenta
um nível de controlo de HTA baixo, conforme descrito no artigo anterior. Outra possível
explicação para este facto é o do confundimento pela indicação para tratar, isto é, os

Pressão Arterial: Implicação do número de medições
45
indivíduos medicados são também provavelmente os indivíduos com HTA mais grave e
com mais tempo de evolução, pelo que têm mais frequentemente HVE.
De entre as várias estimativas de prevalência de HTA todas demonstraram uma
elevada associação com a HVE. Podemos concluir que, apesar da grande variabilidade da
medição única de PA, esta se associa também com a HVE. A medição numa única visita
parece ter uma elevada capacidade preditiva (> 50%) para o diagnóstico futuro de HTA
[28], sobretudo nos indivíduos a partir dos 45 anos em que aumenta para cerca de 80%
[60]. A MVE está associada mais fortemente à medição de PA nas 24 horas, do que a
medições esporádicas [28,53]. No entanto a hipertensão de �bata branca� também está
associada a aumento da MVE e a HVE [61] e por isso não deve ser considerada uma
condição benigna. Portanto, qualquer medição de PA anormalmente alta, num indivíduo
com mais de 45 anos, deve motivar um cuidadoso �follow-up�, sendo que a HVE é factor
preditivo independente de morte súbita, doença coronária, doença cerebrovascular e
insuficiência cardíaca [43-47].
A combinação entre a obesidade e a HTA está mais consistentemente associada a
HVE do que os mesmos estímulos sozinhos [59,62]. Na nossa amostra o impacto do
excesso de peso/obesidade e da HTA na HVE está ilustrado na Figura 1 onde se observa
uma prevalência máxima de HVE entre os indivíduos com excesso de peso/obesidade e
com HTA confirmada.

Pressão Arterial: Implicação do número de medições
46
5. CONCLUSÃO
Pressão Arterial: Implicação do número de medições
47
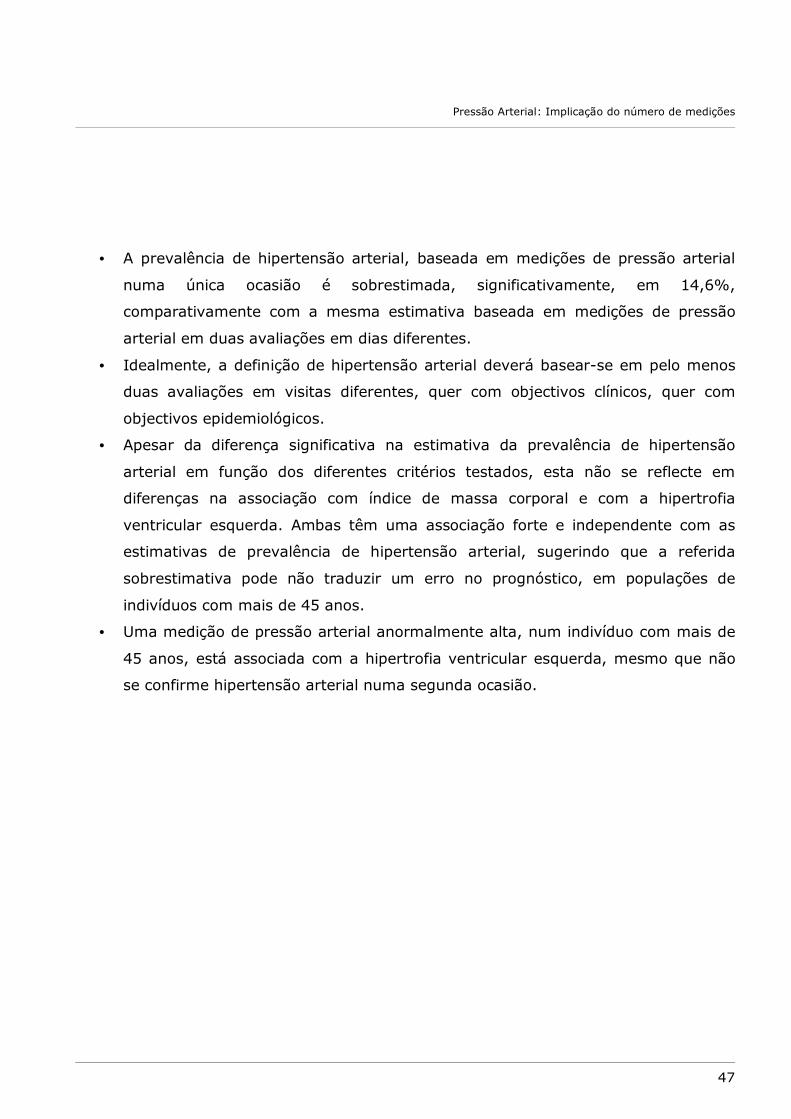
• A prevalência de hipertensão arterial, baseada em medições de pressão arterial
numa única ocasião é sobrestimada, significativamente, em 14,6%,
comparativamente com a mesma estimativa baseada em medições de pressão
arterial em duas avaliações em dias diferentes.
• Idealmente, a definição de hipertensão arterial deverá basear-se em pelo menos
duas avaliações em visitas diferentes, quer com objectivos clínicos, quer com
objectivos epidemiológicos.
• Apesar da diferença significativa na estimativa da prevalência de hipertensão
arterial em função dos diferentes critérios testados, esta não se reflecte em
diferenças na associação com índice de massa corporal e com a hipertrofia
ventricular esquerda. Ambas têm uma associação forte e independente com as
estimativas de prevalência de hipertensão arterial, sugerindo que a referida
sobrestimativa pode não traduzir um erro no prognóstico, em populações de
indivíduos com mais de 45 anos.
• Uma medição de pressão arterial anormalmente alta, num indivíduo com mais de
45 anos, está associada com a hipertrofia ventricular esquerda, mesmo que não
se confirme hipertensão arterial numa segunda ocasião.

Pressão Arterial: Implicação do número de medições
48
6. RESUMO
Pressão Arterial: Implicação do número de medições
49
O diagnóstico de hipertensão arterial deve basear-se em múltiplas medições de
pressão arterial (PA), recolhidas em, pelo menos, duas visitas diferentes. Pretendemos
avaliar e quantificar o impacto causado pela utilização de diferentes critérios para a
definição de hipertensão arterial, tendo em conta o número de observações em que se
baseiam, na estimativa de prevalência de hipertensão arterial e comparar a associação
entre hipertensão arterial, definida pelos diferentes critérios, e duas variáveis
reconhecidamente associadas à hipertensão arterial: o índice de massa corporal e a
hipertrofia ventricular esquerda.
Os dados da amostra foram recolhidos num estudo transversal com 739
participantes, com idade ≥ 45 anos, seleccionados de forma aleatória de uma população
Portuguesa, não institucionalizada, de Janeiro de 2001 a Dezembro de 2003. As
principais medidas a estudar eram a prevalência de hipertensão arterial (PA sistólica
≥140 mmHg e/ou PA diastólica ≥90 mmHg ou medicação com fármacos
antihipertensores) baseada nas medições de PA numa primeira avaliação, baseada nas
medições de PA numa segunda avaliação e cumprindo os mesmos critérios nas duas
avaliações, separadas por um período mediano de 14 dias. Estudámos a associação
desses três critérios diferentes com o índice de massa corporal e com a hipertrofia
ventricular esquerda.
A estimativa de prevalência de hipertensão arterial era 63.4% (95%CI:59.8-66.9)
usando as medições de PA da primeira avaliação (HTA1) e era 60.2% (95%CI:56.6-63.8)
usando as medições de PA da segunda avaliação (HTA2). Usando o mesmo critério nas
duas avaliações a estimativa de prevalência de hipertensão arterial (HTAFinal) era 56.3%
(95%CI: 52.7-60.0), p(McNemar)<0.001, entre HTA1 e HTAFinal e entre HTA2 e HTAFinal.
Ambas as estimativas tinham uma associação forte e independente com o índice de
massa corporal (Odds Ratio=2,71 para o índice de massa corporal ≥ 30 kg/m2 com
HTAFinal) e com a hipertrofia ventricular esquerda (Odds ratio=3,21 para a HTAFinal com a
hipertrofia ventricular esquerda).
Em muitos indivíduos considerados hipertensos numa avaliação única, a
hipertensão não se confirmou na segunda avaliação sobrestimando a prevalência de
hipertensão arterial, significativamente, em 14,6%. No entanto, uma medição de
pressão arterial anormalmente alta, num indivíduo com mais de 45 anos, está associada
com a hipertrofia ventricular esquerda.

Pressão Arterial: Implicação do número de medições
50
The diagnosis of arterial hypertension should be based on multiple blood pressure
(BP) measurements, taken on at least two separate occasions. We aimed to assess the
impact of considering different criteria for arterial hypertension definition, based on the
numbers of visits for BP measurements, on the estimate of arterial hypertension
prevalence and to compare these estimates with two variables definitely related with
arterial hypertension, body mass index and left ventricular hypertrophy.
We used data from a cross-sectional study of 739 participants, aged ≥ 45 years,
randomly selected from a non-institutionalised Portuguese population, from January
2001 to December 2003. Main outcome measures were prevalence of arterial
hypertension (systolic BP ≥140 mmHg and/or diastolic BP ≥90 mmHg or current
antihypertensive drug therapy) based in BP measurements in one evaluation, based in
BP measurements in a second evaluation or based on fulfilling the same criteria in the
two different evaluations, separated by a median of 14 days. We assessed the
association between hypertension according to these three criteria with the body mass
index and left ventricular hypertrophy.
Estimated arterial hypertension prevalence was 63.4% (95%CI:59.8-66.9) using
BP measurements from the first evaluation (HTN1) and it was 60.2% (95%CI:56.6-63.8)
using BP measurements from the second evaluation (HTN2). If we use both evaluations
criteria the estimate arterial hypertension prevalence (HTNFinal) was 56.3% (95%CI:
52.7-60.0), p(McNemar)<0.001, between HTN1 and HTNFinal and between HTN2 and
HTNFinal. All the tree different estimates of arterial hypertension prevalence have a similar
strong and independent association with body mass index (Odds Ratio=2,71 for body
mass index ≥ 30 Kg/m2 with HTNFinal) and with left ventricular hypertrophy (Odds
ratio=3,21 for HTNFinal with left ventricular hypertrophy).
In many individuals labelled as hypertensive on a single evaluation, hypertension
was not confirmed on reassessment, leading to a significant overestimation of 14.6% of
the true value of prevalence. That is why the measurement of BP should be made at
least in two office evaluations both for clinical purposes and in epidemiologic studies. On
the other hand, an abnormal high BP measurement, in an individual older than 45 years
old, is associated with HVE.

Pressão Arterial: Implicação do número de medições
51
7. BIBLIOGRAFIA
Pressão Arterial: Implicação do número de medições
52
1. WHO World Health report. Prevention of cardiovascular disease : Guidelines for
assessment and management of total cardiovascular risk. World Health
Organization 2007
2. Ezzati M, Lopez AD, Rodgers A, Hoom SV, Murray CF and the Comparative risk
Assessment Colloborating Group. Selected major risk factors and global and
regional burden of disease. Lancet 2002;360:1347-1360
3. 2007 Guidelines for the management of arterial hypertension. European Society of
Hypertension and European Society of Cardiology Guidelines. J Hypertens
2007;25:1105-1187
4. Lewington S, Clarke R, Qizilbash N, Peto R, Collins R. Prospective Studies
Collaboration. Age-specific relevance of usual blood pressure to vascular mortality:
a meta-analysis of individual data for one million adults in 61 prospective studies.
Lancet 2002;360:1903�1913.
5. Kearney PM, Whelton M, Reynolds K, Muntner P, Whelton PK, He J. Global burden
of hypertension: analysis of worldwide data. Lancet 2005;365:217-23
6. Kearney PM, Whelton M, Reynolds K, Whelton PK, He J. Worldwide prevalence of
hypertension. A systematic review. J Hypertens 2004;22:11-9
7. Primatesta P, Brooks M, Poulter NR. Improved hypertension management and
control: results from the Health Survey for England 1998. Hypertension
2001;38:827-832.
8. Kastarinen MJ, Salomaa VV, Vartiainen EA, et al. Trends in blood pressure levels
and control of hypertension in Finland from 1982 to 1997. J Hypertens
1998;16:1379-8137

Pressão Arterial: Implicação do número de medições
53
9. Giampaoli S, Palmieri L, Dima F, et al. Socioeconomic aspects and cardiovascular
risk factors: experience at the Cardiovascular Epidemiologic Observatory. Ital
Heart J 2001;2(3 Suppl):294-302.
10.Banegas JR, Rodríguez-Artalejo F, de la Cruz Troca JJ, et al. Blood pressure in
Spain: distribution, awareness, control, and benefits of a reduction in average
pressure. Hypertension 1998;32:998-1002.
11.Stegmayr B, Harmsen P, Rajakangas A, et al. Stroke around the Baltic Sea:
incidence, case fatality and population risk factors in Denmark, Finland, Sweden
and Lithuania. Cerebrovasc Dis 1996;6:80-88.
12.The Seventh Report of the Joint National Comitee on Prevention, Detection,
Evaluation, and Treatment of High Blood Pressure: The JNC 7 Report. JAMA
2003;289:2560-2572
13.Pickering TG, Hall JE, Appel LJ, et al. Recommendations for blood pressure
measurement in humans and experimental animals. Part 1: blood pressure
measurement in humans: a statement for professionals from the Subcommittee of
Professional and Public Education of the American Heart Association Council on
High Blood Pressure Research. Hypertension 2005;45:142�161.
14.O�Brien E, Asmar R, Beilin L et al. European Society of Hypertension
recommendations for conventional, ambulatory and home blood pressure
measurement. J Hypertens 2003; 21:821�848.
15.Waeber B. Scherrer U, Petrillo A. Are some hypertensive patients over treated? A
prospective study of ambulatory blood pressure recording. Lancet 1987; ii:732-4
16.O�Brien E, O�Malley K. Overdiagnosing hypertension. Br Med J 1988;297:1211�
1212
Pressão Arterial: Implicação do número de medições
54
17.Pearce KA, Grimm RH, Rao S et al. Population-derived comparisons of ambulatory
and office blood pressures: implications for the determination of usual blood
pressure and the concept of white coat hypertension. Arch Intern Med
1992;152:750 �756.
18.Birkett NJ. The effect of alternative criteria for hypertension on estimates of
prevalence and control, J Hypertens 1997;15:237�244.
19.Lang T, Gaudemaris R, Chatellier G, Hamici L, Diène E. Prevalence and therapeutic
control of hypertension. Hypertension 2001;38:449-454
20.Bovet P, Gervasoni JP, Ross AG et al. Assessing the prevalence of hypertension in
populations: Are we doing it right? J Hypertens 2003;21:509�517
21.Pickering TG, Gerin W, Schwartz AR. What is the white-coat effect and how should
it be measured? Blood Press Monit 2002;7:293�300.
22.Inamo J, Malfatti S, Lang T et al. Hypertension artérielle aux Antilles: différence
liées au sexe. Arch Mal C�ur Vaiss 2005;98:845-849
23.Amado P, Vasconcelos N, Santos I, Almeida L, Nazare J, Carmona J. Arterial
hypertension difficult to control in the elderly patient. The significance of the
"white coat effect�. Rev Port Cardiol 1999;18:897-906.
24.Myers MG, Reeves RA. White coat effect in treated hypertensive patients: sex
differences. J Hum Hypertens 1995;9:729-33.
25.Lindbaek M, Sandvik E, Liodden K, Mjell J, Ravnsborg-Gjertsen K. Predictors for
the white coat effect in general practice patients with suspected and treated
hypertension. Br J Gen Pract 2003;53:790-3.
26. Kaplan NM. Kaplan�s Clinical Hypertension, 9th edition. Philadelphia: Lippincott
Williams & Wilkins; 2005
Pressão Arterial: Implicação do número de medições
55
27.Armitage P, Fox W, Rose GA, Tinker CM. The variability of measurements of casual
blood pressure. II. Survey experience. Clin Sci 1966;30:335�337.
28.Reeves, RA. Does this patient have hypertension? JAMA 1995;15:1211-1218
29.Douketis JD, Sharma AM. Obesity and cardiovascular disease: pathogenic
mechanisms and potential benefits of weight reduction. Semin Vasc Med
2005;5(1):25-33.
30.Must A, Spadano J, Coakley EH et al. The disease burden associated with
overweight and obesity. JAMA 1999;282:1523-1529
31.Mokdad AH, Ford ES, Bowman BA et al. Prevalence of obesity, diabetes, and
obesity-related health risk factors, 2001. JAMA 2003;289:76 �79.
32.National Heart, Lung, and Blood Institute, National Institutes of Health. Clinical
Guidelines on the Identification, Evaluation, and Treatment of Overweight and
Obesity in Adults: The Evidence Report. Bethesda, Md: National Institutes of
Health; 1998.
33.Wilson P, D�Agostino RB, Sullivan L, Parise H, Kannel WB. Overweight and obesity
as determinants of cardiovascular risk. Arch Intern Med 2002;162:1867-72
34.Huang Z. Willet WC, Manson JE, Stampfer MJ, Speizer FE, Colditz GA. Body weight,
weight change, and risk of hypertension in women. Ann Intern Med 1998;128:81-
88
35.Lusignan S, Hague N, Van Vlymen J. A study of cardiovascular risk in overweight
and obese people in England. Eur J Gen Pract 2006;12(1):19 29
36.Taler SJ, Driscoll N, Tibor M, et al. Obesity raises blood pressure in normal
subjects via high cardiac output and impaired vasodilation. Am J Hypertens
2004;17:25
Pressão Arterial: Implicação do número de medições
56
37.Thomas F, Bean K, Pannier B, Oppert JM, Guize L, Benetos A. Cardiovascular
Mortality in Overweight Subjects. The Key Role of Associated Risk Factors.
Hypertension 2005;46:654-59
38.Lijing Y, Daviglus M, Liu K et al. Midlife Body Mass Index and Hospitalization and
Mortality in Older Age. JAMA 2006;295:190-198.
39.Kannel WB. Blood pressure as a cardiovascular risk factor. JAMA 1996;275:1571�
1576
40.Kass, D. Ventricular arterial stiffening, integrating the pathophysiology.
Hypertension 2005;46
41.Kostis JB. From hypertension to heart failure: update on the management of
systolic and diastolic dysfunction. Am J Hypertens 2003;16:18S�22S
42.Simone G. Pasanini F, Contaldo F. Link of nonhemodinamic factors to
hemodinamic determinants of left ventricular hypertrophy. Hypertension
2001;38:13-18
43.Levy G, Anderson KM, Savage DD, Kannel WB, Castelli WP. Prognostic implications
of echocardiographically determined left ventricular mass in the Framingham
Heart Study. N Engl J Med 1990; 322:1561�1566.
44.Koren MJ, Devereux RB, Casale PN, Savage DD, Laragh JH. Relation of left
ventricular mass and geometry to morbidity and mortality in uncomplicated
essential hypertension. Ann Intern Med 1991; 114:345�352.
45.Verdecchia P, Angeli F, Gattobigio R, Sardone M, Pede S, Reboldi GP. Regression
of left ventricular hypertrophy and prevention of stroke in hypertensive subjects.
Am J Hypertens 2006 May;19:493-9.

Pressão Arterial: Implicação do número de medições
57
46.Fox ER, Alnabhan N, Penman AD et al. Echocardiographic left ventricular mass
index predicts incident stroke in African Americans: Atherosclerosis Risk in
Communities (ARIC) Study. Stroke 2007;38:2686-91.
47.Conen D, Ridker PM, Buring JE, Glynn RJ. Risk of cardiovascular events among
women with high normal blood pressure or blood pressure progression:
prospective cohort study. Br Med J 2007;335;432-434
48.Fragola PV, Colivicchi F, Fabrizi E, Borzi M, Cannata D. Assessment of left
ventricular hypertrophy in patients with essential hypertension. A rational basis for
the electrocardiogram. Am J Hypertens 1993;6:164 � 169.
49.Coca A, Gabriel R, De la Figuera M et al. The impact of different echocardiographic
diagnostic criteria on the prevalence of left hypertrophy in essential hypertension:
the VITAE study. J Hypertens 1999;17:1471 � 1480.
50.German P, Roul G, Kasler B, Mossard JM, Bareiss P, Sacrez A. Inter-study
variability in left ventricular mass measurement. Comparison between M-mode
echocardiography and MRI. Eur Heart J 1992;13:1016�1019.
51.Cuspidi C, Ambrosioni E, Mancia G, Pessina AC, Trimarco B, Zanchetti A. On behalf
of the APROS investigators. Role of echocardiography and carotid ultrasonography
in stratifying risk in patients with essential hypertension: the Assessment of
Prognostic Risk Observational Survey. J Hypertens 2002; 20:1307�1314.
52.Alfakih K, Walters K, Jones T, et al. New gender-specific partition values for ECG
criteria of left ventricular hypertrophy: recalibration against cardiac MRI.
Hypertension 2004;44:175�179
53.Schmieder RE, Messerli FH. Hypertension and the heart. J Hum Hypertens
2000;14:597�604

Pressão Arterial: Implicação do número de medições
58
54.Zabalgoitia M, Rahaman SNU, Haley WE et al. Comparison in systemic
hypertension of left ventricular mass and geometry with systolic and diastolic
function in patients < 65 to 65 years of age. Am J Cardiol 1998; 82:604�608.
55.Santos AC, Barros H. Prevalence and determinants of obesity in an urban sample
of Portuguese adults, Public Health 2003;117:430-37
56.Ramos E, Lopes C, Barros H. Investigating the Effect of Nonparticipation Using a
Population-Based Case-Control Study on Myocardial Infarction, Ann Epidemiol
2004; 14:437-441
57.Devereux RB, Reicheck N. Echocardiographic determination of left ventricular
mass in man: anatomic validation of the method. Circulation 1977; 55: 613�18.
58.World Health Organization, Obesity: preventing and managing the global epidemic.
Geneva, Switzerland: World Health Organization; 1997
59.Simone G, Devereux RB, Roman MJ, Alderman MH, Laragh JH. Relation of obesity
and gender to left ventricular hypertrophy in normotensive and hypertensive
adults. Hypertension 1994;23;600-606
60.Marshall T. When measurements are misleading: modelling the effects of blood
pressure misclassification in the English population. Br Med J 2004;328;933
61.Muscholl MW, Hense HW, Bröckel U, Döring A, Riegger G, Schunkert H. Changes
in left ventricular structure and function in patients with white coat hypertension:
cross sectional survey.Br Med J 1998;317:565-70
62.Garavaglia GE, Messerli FH, Nunez BD, Schmieder RE, Grossman E. Myocardial
contractility and left ventricular function in obese patients with essential
hypertension. Am J Cardiol 1988;62:594-597.