POROSIDADE DE SOLOS DO SUL DO COMPLEXO BAÇÃO, QUADRILÁTERO FERRÍFERO, MINAS GERAIS, OBTIDA PELAS...
10
Clay Minerals (1995) 30, 89-98 CHARACTERISTICS OF FINE PORES IN SOME HALLOYSITES G. J. CHURCHMAN, T. J. DAVY*, L. A. G. AYLMORE*, R. J. GILKES* AND P. G. SELF CSIRO Division of Soils, Glen Osmond, South Australia and *Soil Science and Plant Nutrition, Faculty oJA griculture, The University of Western Australia, Nedlands, Western Australia (Received 22 July 1993; revised 8 September 1994) ABSTRACT: Isotherms were obtained for nitrogen adsorption and desorption on seven halloysite- rich samples from New Zealand and Western Australia. Calculations from these isotherms indicate that halloysites with mainly small particles (< c. 0.08 I~m in width) had abundant cylindrical pores with narrow size distributions in the 5-15 nm range. They also indicate that halloysites with mainly large particles (> c. 0.1 ~tm in width) had few if any pores in the mesopore range (2-50 nm). Transmission electron microscopy (TEM) shows that cylindrical pores originate from the central holes in tubular particles. The TEM also suggests that slit-shaped pores can originate from the shrinkage of blocks of layers upon dehydration of halloysite. Halloysites include a significant concentration of fine pores (Diamond, 1970; Jackson et al., 1971; Churchman & Payne, 1983; McCrea & Gilkes, 1987; McCrea et al., 1990). Diameters recorded for the largest concentration of pores have depended upon the resolution of the techniques used for the measurement. Diamond (1970), Churchman & Payne (1983), McCrea & Gilkes (1987) and McCrea et al. (1990), all using mercury intrusion porisimetry, found that pores in the < 50 nm range provided most of the pore volume. Jackson et al. (1971), using isotherms for nitrogen and also for water sorption, found a sharp peak at 2.3 nm in the pore-size distribution. The high concentration of very small pores in halloysites contrasts with the situation in kaolinites. These tend to show larger pores without a marked concentration in any particular size range (Aylmore & Quirk, 1967; Diamond, 1970; Sills et al., 1973a; 1974; Aylmore & Sills, 1978). Generally, kaolinites comprise platy particles and pores in clay samples with platy particles are likely to form from the interleaving of the plates and should be similar in size to the thickness of the particles in the samples (Aylmore & Quirk, 1960; I967; Sills et al., 1973a) A review of the literature (Churchman & Carr, 1975) revealed that halloysites can be distinguished from kaolinites most reliably by the presence of interlayer water or by evidence for its prior occurrence in the structure. Halloysite particles often occur as non-platy shapes, and a tubular shape is common. The concentration of fine pores observed for halloysites has often been attributed to the tubular shape of many halloysite particles. The tubes have been considered to provide the characteristic small pores, both directly, from their hollow interiors, and also indirectly, from the voids created when they pack together with other tubes (Churchman & Payne, 1983; McCrea & Gilkes, 1987). Halloysite particles, however, can occur in shapes other than tubes, e.g. spheroidal and blocky shapes (Churchman & Carr, 1975; Churchman & Theng, 1984; Dixon, 1989). Until now, each study of pore-size distribution in halloysite has been carried out on only one sample of the mineral (Diamond, 1970; Jackson et al., 1971), on a single halloysite-containing soil (Churchman & Payne, 1983), or, at most, on a small number of halloysite-containing soils, but all from the same locality (McCrea & Gilkes, 1987; McCrea et al., I990). Particle shapes provided the explanations both for the apparently characteristic pore-size distribu- 1995 The Mineralogical Society
-
Upload
rafael-reloaded -
Category
Documents
-
view
2 -
download
0
description
dvzvcvzcv
Transcript of POROSIDADE DE SOLOS DO SUL DO COMPLEXO BAÇÃO, QUADRILÁTERO FERRÍFERO, MINAS GERAIS, OBTIDA PELAS...
Clay Minerals (1995) 30, 89-98
C H A R A C T E R I S T I C S OF F I N E P O R E S IN S O M E H A L L O Y S I T E S
G. J. C H U R C H M A N , T . J. D A V Y * , L . A. G. A Y L M O R E * , R. J. G I L K E S * AND P. G . S E L F
CSIRO Division o f Soils, Glen Osmond, South Australia and *Soil Science and Plant Nutrition, Faculty oJA griculture, The University o f Western Australia, Nedlands, Western Australia
(Received 22 July 1993; revised 8 September 1994)
ABSTRACT: Isotherms were obtained for nitrogen adsorption and desorption on seven halloysite- rich samples from New Zealand and Western Australia. Calculations from these isotherms indicate that halloysites with mainly small particles (< c. 0.08 I~m in width) had abundant cylindrical pores with narrow size distributions in the 5-15 nm range. They also indicate that halloysites with mainly large particles (> c. 0.1 ~tm in width) had few if any pores in the mesopore range (2-50 nm). Transmission electron microscopy (TEM) shows that cylindrical pores originate from the central holes in tubular particles. The TEM also suggests that slit-shaped pores can originate from the shrinkage of blocks of layers upon dehydration of halloysite.
Halloysites include a significant concentration of fine pores (Diamond, 1970; Jackson et al., 1971; Churchman & Payne, 1983; McCrea & Gilkes, 1987; McCrea et al., 1990). Diameters recorded for the largest concentration of pores have depended upon the resolution of the techniques used for the measurement. Diamond (1970), Churchman & Payne (1983), McCrea & Gilkes (1987) and McCrea et al. (1990), all using mercury intrusion porisimetry, found that pores in the < 50 nm range provided most of the pore volume. Jackson et al. (1971), using isotherms for nitrogen and also for water sorption, found a sharp peak at 2.3 nm in the pore-size distribution.
The high concentration of very small pores in halloysites contrasts with the situation in kaolinites. These tend to show larger pores without a marked concentration in any particular size range (Aylmore & Quirk, 1967; Diamond, 1970; Sills et al., 1973a; 1974; Aylmore & Sills, 1978). Generally, kaolinites comprise platy particles and pores in clay samples with platy particles are likely to form from the interleaving of the plates and should be similar in size to the thickness of the particles in the samples (Aylmore & Quirk, 1960; I967; Sills et al., 1973a)
A review of the literature (Churchman & Carr,
1975) revealed that halloysites can be distinguished from kaolinites most reliably by the presence of interlayer water or by evidence for its prior occurrence in the structure. Halloysite particles often occur as non-platy shapes, and a tubular shape is common. The concentration of fine pores observed for halloysites has often been attributed to the tubular shape of many halloysite particles. The tubes have been considered to provide the characteristic small pores, both directly, from their hollow interiors, and also indirectly, from the voids created when they pack together with other tubes (Churchman & Payne, 1983; McCrea & Gilkes, 1987). Halloysite particles, however, can occur in shapes other than tubes, e.g. spheroidal and blocky shapes (Churchman & Carr, 1975; Churchman & Theng, 1984; Dixon, 1989).
Until now, each study of pore-size distribution in halloysite has been carried out on only one sample of the mineral (Diamond, 1970; Jackson et al., 1971), on a single halloysite-containing soil (Churchman & Payne, 1983), or, at most, on a small number of halloysite-containing soils, but all from the same locality (McCrea & Gilkes, 1987; McCrea et al., I990). Particle shapes provided the explanations both for the apparently characteristic pore-size distribu-
�9 1995 The Mineralogical Society
90 G.J . Churchman et al.
tions of halloysite and also for the differences between pore-size distributions of halloysites and kaolinites. Consequently, we considered it worth- while to examine the relationships between pore-size distributions and particle shapes (and sizes) for halloysites with different shapes.
Gas sorption was used because comparisons of gas sorption measurements with those made using mercury intrusion porisimetry (e.g. Sills et al.,
1973b) indicate that only gas sorption, which measures smaller pore sizes than mercury intrusion porisimetry, would enable determination of the sizes of the dominant fine pores in at least some of the halloysites.
By obtaining information on the shapes of the pores from the gas sorption measurements and also from transmission electron microscopy (TEM), we were able to examine the origins of the fine pores in halloysites.
M A T E R I A L S
Table 1 gives the characteristics of the seven samples used. Four of the samples studied (Dunedin, Te Akatea, Hamilton and Te Puke) were from the same sites as the halloysites studied as clay fraction samples by Churchman & Theng (1984). Two samples (Opotiki fine and Opotiki coarse) were from the Opotiki area of New Zealand. Churchman & Theng (1984) studied the clay fraction of just one sample from the same area. The remaining sample, from Jarrahdale, Western Australia, is sample D9 in Churchman & Gilkes (1989).
Kaolin mineral contents given in Table 1 were determined by different ia l thermal analyses (Whitton & Churchman, 1987) of samples that had previously been dried at 105~ for several hours. Previous work (Churchman & Theng, 1984; Churchman & Gilkes, 1989) had shown virtually all of the kaolin present in these samples, or in samples from the same areas, to be halloysite. Transmission electron microscopy confirmed that halloysite was the predominant kaolin mineral in the samples. Contents of allophane and ferrihydrite were determined from acid oxalate analyses (Blakemore et al., 1987), leading to estimates of allophane by Parfitt & Wilson's (1985) method and ferrihydrite following Parfitt & Childs (1988). Organic matter contents were invariably low. Only the brownish- yellow Hamilton soil sample was not white in
colour. Nevertheless, the organic carbon content of the Hamilton soil IIC horizon, from which this sample was taken, is only 0.1% (New Zealand Soil Bureau, 1968).
M E T H O D S
Approximately 1 g of each sample, except the Hamilton soil sample, was sealed into a sample bulb as an intact block, as taken from the field. Since a mismatch between the isotherms for adsorption and desorption at low relative pressures implied the possible perturbation of blocks of the Hamilton soil sample by the analytical procedure, this sample was examined as a powder formed by light hand-grinding and 0.2 g was used. Each sample was then heated at 105-110~ to degas in a vacuum of better than 10 -4 tort until the pressure remained below 10 -3 torr for 15 min after the vacuum pumps were isolated. Complete adsorption- desorption isotherms to saturation were obtained at 78~ using a liquid nitrogen bath. The apparatus used for all except the Hamilton soil sample is described in Sills et al. (1973a,b). An automated volumetric instrument, Omnisorp 100, was used for the Hamilton soil sample.
The specific surface areas of the heated samples were derived from the low pressure range of the isotherms by the BET method (Brunauer et al., 1938) and differential pore-size distributions for both branches calculated using the Kelvin equation modified to account for physical sorption on exposed surfaces (Aylmore, 1974a). Cumulative specif ic surface a r e a s ( S a d s and Saes) were calculated from pore filling and emptying on the adsorption and desorption branches respectively. The extent of the agreement between the BET area and Sd~s or Saas is indicative of the extent to which the assumption of a predominance of slit-shaped or cylindrical shaped pores respectively is valid (Aylmore, 1974b).
Plots of V vs. n (Lippens & de Boer, 1965; Aylmore, 1974a) were obtained, where the volume adsorbed, V, is plotted against n, a statistical average of the number of layers which would be adsorbed onto a similar but non-porous material at the same relative vapour pressure. The usefulness of V-n plots derives from observations that nitrogen adsorption on different non-porous materials gives essentially the same isotherm when plotted in the 'reduced' form of n(=V/Vm) against P/Po, where Vm is the volume adsorbed in a monolayer and P/Po is
,.t5 ~3
O
e-,
~D
e-,
r,..9 ,...;
,-A
.< [-.,
~ 8
< 8
�9
"d
t~ ~D
O
Characteristics of pores in halloysites
v v v
,~ ~ ,:5 ~ ~ V V
o o o o. o o o. o o o o ~ c5 o
o ~ o "~
~ ~ ~ ~ -~ ~
t ~
o n
~D
�9
cD
�9 ~ O
~ ~.~ 8 ~
91
92 G.J. Churchman et al.
300
Opotikl fine 280 F
250 F 240 F 220 F 200 ~-- 180 160
141)
120
100
80
5O
40
2 0 - __ - - - " " - ~ '
J I
i
n . i - - r
o " o oa
0potiki (2} - -
60
~ 4o
20
Te Puke - -
80 6O 40 2O
Te Akatea
Dunedin
Te Pull l
-- ..Of ~"
0.1 0.2 0.3 0.4 0,5 0.6 0.7 0,8 0.9 1.0 P/Po
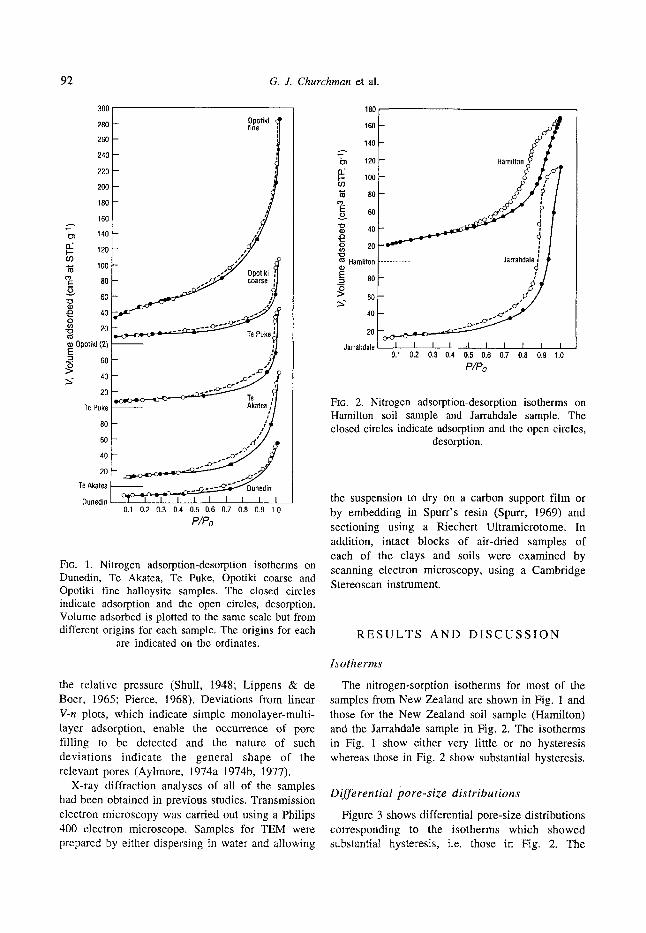
FIG. 1. Nitrogen adsorption-desorption isotherms on Dunedin, Te Akatea, Te Puke, Opotiki coarse and Opotiki fine halloysite samples. The closed circles indicate adsorption and the open circles, desorption. Volume adsorbed is plotted to the same scale but from different origins for each sample. The origins for each
are indicated on the ordinates.
the relative pressure (Shull, 1948; Lippens & de Boer, 1965; Pierce, 1968). Deviations from linear V-n plots, which indicate simple monolayer-multi- layer adsorption, enable the occurrence of pore filling to be detected and the nature of such deviations indicate the general shape of the relevant pores (Aylmore, 1974a 1974b, 1977).
X-ray diffraction analyses of all of the samples had been obtained in previous studies. Transmission electron microscopy was carried out using a Philips 400 electron microscope. Samples for TEM were prepared by either dispersing in water and allowing
180
1 6 0
140
~:n 120 OS I'- 100 r
8O
~ 6o ~ 40 -e ~ 2o
"o t~ Hamilton E 80
4O
2O
Jarrahdale
.......... J a r r a h i ~
I I I I ~L I I I I I 0.1 0.2 0.3 0.4 0:5 0.6 0.7 0.8 0,9 1.0
P/Po
Fio. 2. Nitrogen adsorption-desorption isotherms on Hamilton soil sample and Jarrahdale sample. The closed circles indicate adsorption and the open circles,
desorption.
the suspension to dry on a carbon support film or by embedding in Spurr's resin (Spurr, 1969) and sectioning using a Riechert Ultramicrotome, In addition, intact blocks of air-dried samples of each of the clays and soils were examined by scanning electron microscopy, using a Cambridge Stereoscan instrument.
R E S U L T S A N D D I S C U S S I O N
Isotherms
The nitrogen-sorption isotherms for most of the samples from New Zealand are shown in Fig. 1 and those for the New Zealand soil sample (Hamilton) and the Jarrahdale sample in Fig. 2. The isotherms in Fig. 1 show either very little or no hysteresis whereas those in Fig. 2 show substantial hysteresis.
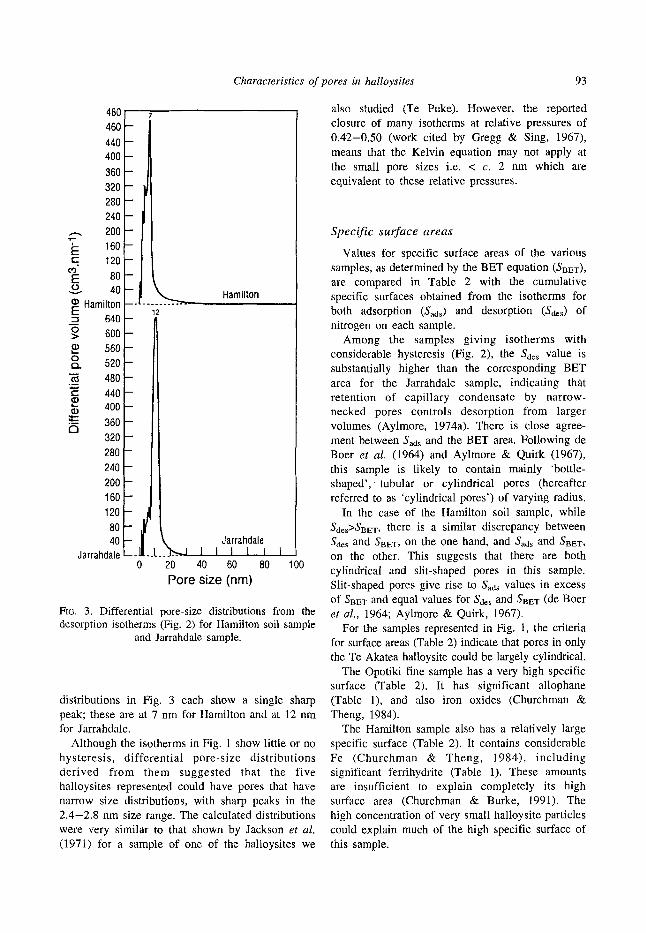
Differential pore-size distributions
Figure 3 shows differential pore-size distributions corresponding to the isotherms which showed substantial hysteresis, i.e. those in Fig. 2. The
Characteristics of pores in halloysites 93
480 460 440 400 360 320 280 240 200
~: 160 r 120
r E 8O
4O m Hamilton
640 o 600
560 52O 48O
~-~ 440 400
360 320 28O 240 2OO 160 120 80 4O
Jarrahdale
I
m
t Jarrahdale \ , _1 ..j__-~. 1 I I 1 I 0 20 40 60 80
Pore size (rim)
Hamilton
100
FIG. 3. Differential pore-size distributions from the desorption isotherms (Fig. 2) for Hamilton soil sample
and Jarrahdale sample.
distributions in Fig. 3 each show a single sharp peak; these are at 7 nm for Hamilton and at 12 nm for Jarrahdale.
Although the isotherms in Fig. 1 show little or no hysteresis, differential pore-size distributions derived from them suggested that the five halloysites represented could have pores that have narrow size distributions, with sharp peaks in the 2.4-2.8 nm size range. The calculated distributions were very similar to that shown by Jackson et al. (1971) for a sample of one of the halloysites we
also studied (Te Puke). However, the reported closure of many isotherms at relative pressures of 0.42-0.50 (work cited by Gregg & Sing, 1967), means that the Kelvin equation may not apply at the small pore sizes i.e. < c. 2 nm which are equivalent to these relative pressures.
Spec i f i c sur face areas
Values for specific surface areas of the various samples, as determined by the BET equation (SBET), are compared in Table 2 with the cumulative specific surfaces obtained from the isotherms for both adsorption (Sad~) and desorption (Sde~) of nitrogen on each sample.
Among the samples giving isotherms with considerable hysteresis (Fig. 2), the Saes value is substantially higher than the corresponding BET area for the Jarrahdale sample, indicating that retention of capillary condensate by narrow- necked pores controls desorption from larger volumes (Aylmore, 1974a). There is close agree- ment between Sads and the BET area. Following de Boer et al. (1964) and Aylrnore & Quirk (1967), this sample is likely to contain mainly 'bottle- shaped', tubular or cylindrical pores (hereafter referred to as 'cylindrical pores') of varying radius.
In the case of the Hamilton soil sample, while Sdes>SBET, there is a similar discrepancy between Sde~ and SBET, on the one hand, and Sads and SBET, on the other. This suggests that there are both cylindrical and slit-shaped pores in this sample. Slit-shaped pores give rise to Sads values in excess of SBET and equal values for So~ and S~ET (de Boer et al., 1964; Aylmore & Quirk, 1967).
For the samples represented in Fig. 1, the criteria for surface areas (Table 2) indicate that pores in only the Te Akatea halloysite could be largely cylindrical.
The Opotiki fine sample has a very high specific surface (Table 2). It has significant allophane (Table 1), and also iron oxides (Churchman & Theng, 1984).
The Hamilton sample also has a relatively large specific surface (Table 2). It contains considerable Fe (Churchman & Theng, 1984), including significant ferrihydrite (Table 1). These amounts are insufficient to explain completely its high surface area (Churchman & Burke, 1991). The high concentration of very small halloysite particles could explain much of the high specific surface of this sample.
94 G. J. Churchman et al.
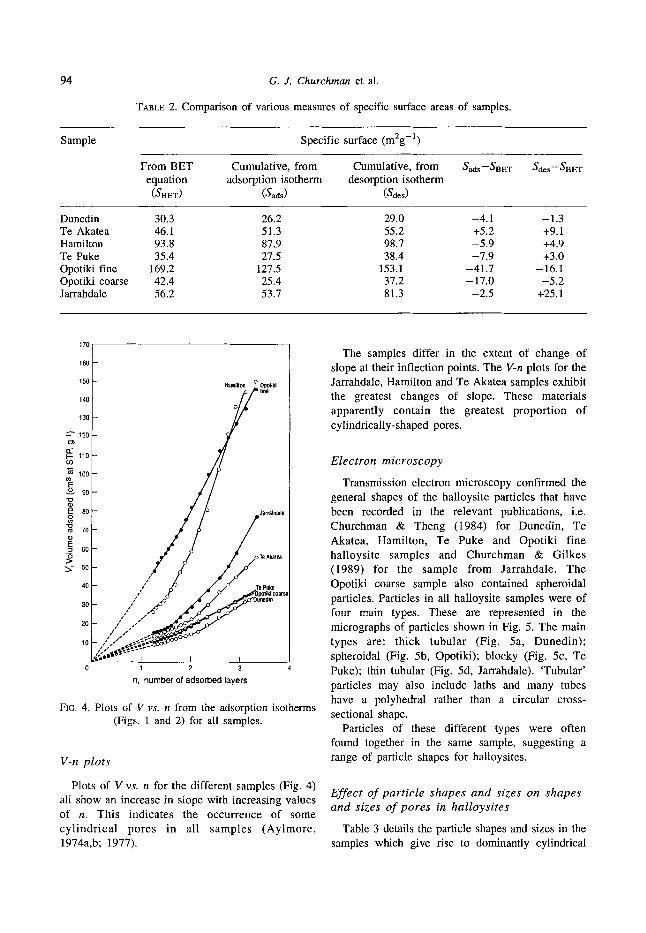
TABLE 2. Comparison of various measures of specific surface areas of samples.
Sample Specific surface (m2g -1)
From BET Cumulative, from Cumulative, from Sads--SBET S d e s - - S B E T equation adsorption isotherm desorption isotherm
( aBET) (aads) (ades)
Dunedin 30.3 26.2 29.0 -4.1 - 1.3 Te Akatea 46.1 51.3 55.2 +5.2 +9.1 Hamilton 93.8 87.9 98.7 -5.9 +4.9 Te Puke 35.4 27.5 38.4 -7.9 +3.0 Opotiki fine 169.2 127.5 153.1 -41.7 -16.1 Opotiki coarse 42.4 25.4 37.2 -17.0 -5 .2 Jarrahdale 56.2 53.7 81.3 -2.5 +25.1
~ro
160
150 . o . . H~mllton Opol~kl
140 0 li~
130
120 b~ n" I-" 110 rj)
'~ 100
0 ~ 80 r- Jarrahdale
"~ 7o
~ go le A~lea
~- 50--
i / / i Te Puke ' ~ / / .Ig~,, . . . .
/ / i f 20 /, 10
1 2 3
n, number of adsorbed layers
Fio, 4. Plots of V vs. n from the adsorption isotherms (Figs. 1 and 2) for all samples.
V-n plots
Plots of V vs. n for the different samples (Fig. 4) all show an increase in slope with increasing values of n. This indicates the occurrence of some cyl indr ical pores in all samples (Aylmore, 1974a,b; 1977).
The samples differ in the extent of change of slope at their inflection points. The V-n plots for the Jarrahdale, Hamilton and Te Akatea samples exhibit the greatest changes of slope. These materials apparently contain the greatest proportion of cylindrically-shaped pores.
Electron microscopy
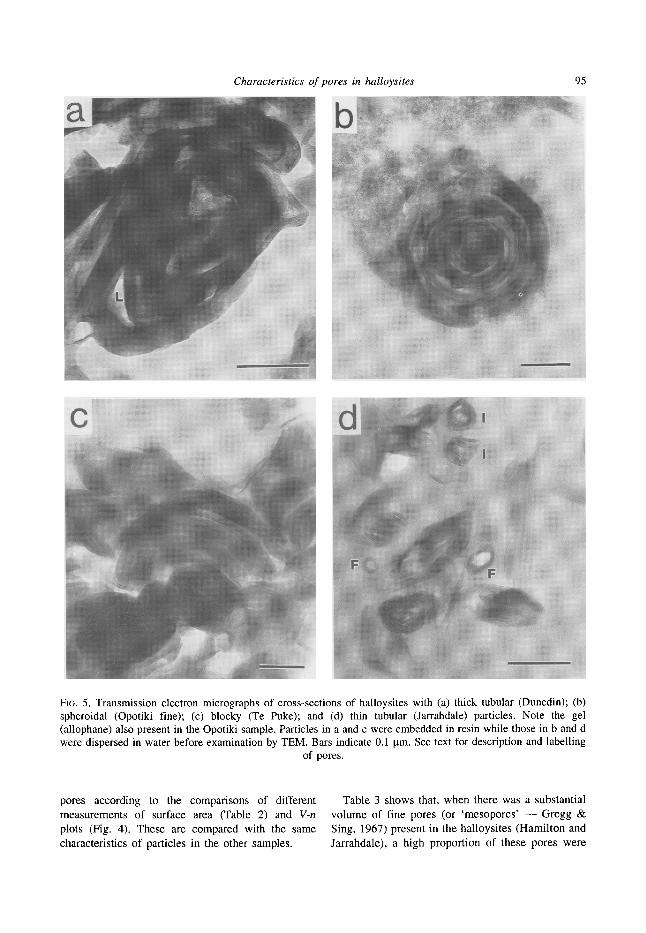
Transmission electron microscopy confirmed the general shapes of the halloysite particles that have been recorded in the relevant publications, i.e. Churchman & Theng (1984) for Dunedin, Te Akatea, Hamilton, Te Puke and Opotiki fine halloysite samples and Churchman & Gilkes (1989) for the sample from Jarrahdale. The Opotiki coarse sample also contained spheroidal particles. Particles in all halloysite samples were of four main types. These are represented in the micrographs of particles shown in Fig. 5. The main types are: thick tubular (Fig. 5a, Dunedin); spheroidal (Fig. 5b, Opotiki); blocky (Fig. 5c, Te Puke); thin tubular (Fig. 5d, Jarrahdale). 'Tubular' particles may also include laths and many tubes have a polyhedral rather than a circular cross- sectional shape.
Particles of these different types were often found together in the same sample, suggesting a range of particle shapes for halloysites.
Effect of particle shapes and sizes on shapes and sizes o f pores in halloysites
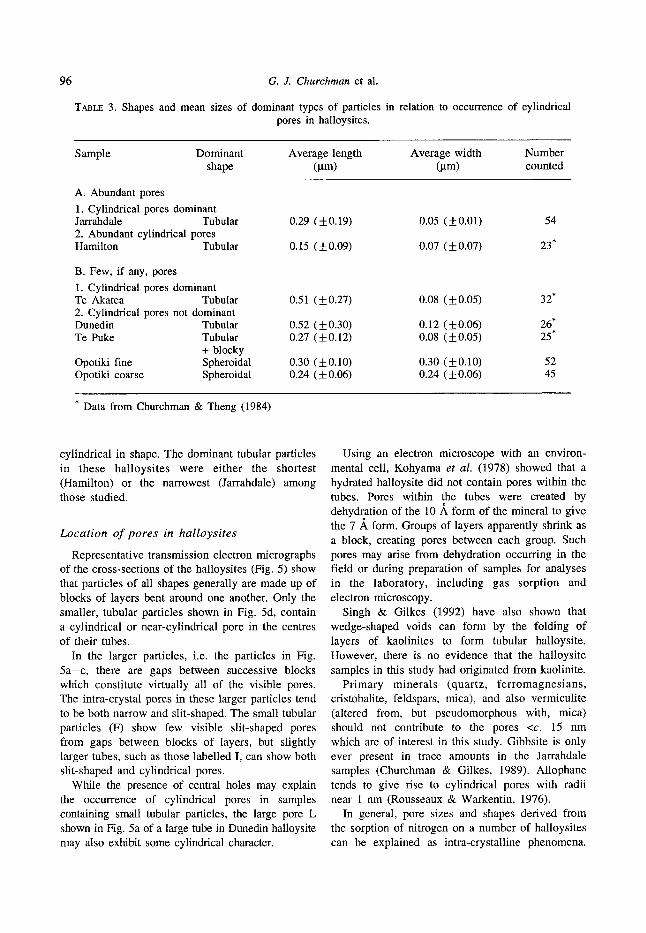
Table 3 details the particle shapes and sizes in the samples which give rise to dominantly cylindrical
Characteristics of pores in halloysites 95
Fla. 5. Transmission electron micrographs of cross-sections of halloysites with (a) thick tubular (Dunedin); (b) spheroidal (Opotiki fine); (c) blocky (Te Puke); and (d) thin tubular (Jarrahdale) particles. Note the gel (allophane) also present in the Opotiki sample. Particles in a and c were embedded in resin while those in b and d were dispersed in water before examination by TEM. Bars indicate 0.1 Ixm. See text for description and labelling
of pores.
pores according to the comparisons of different measurements of surface area (Table 2) and V-n plots (Fig. 4). These are compared with the same characteristics of particles in the other samples.
Table 3 shows that, when there was a substantial volume of fine pores (or 'mesopores' - - Gregg & Sing, 1967) present in the halloysites (Hamilton and Jarrahdale), a high proportion of these pores were
96 G. J. Churchman et al.
T~I~E 3. Shapes and mean sizes of dominant types of particles in relation to occurrence of cylindrical pores in halloysites.
Sample Dominant Average length Average width Number shape (gm) (gm) counted
A. Abundant pores
1. Cylindrical pores dominant Jarrahdale Tubular 2. Abundant cylindrical pores Hamilton Tubular
B. Few, if any, pores
1. Cylindrical pores dominant Te Akatea Tubular 2. Cylindrical pores not dominant Dunedin Tubular Te Puke Tubular
+ blocky Opotiki fine Spheroidal Opotiki coarse Spheroidal
0.29 (-t-0.19) 0.05 (___0.01) 54
0.15 (+0.09) 0.07 (+0.07) 23"
0.51 (+0.27) 0.08 (+0.05) 32"
0.52 (___0.30) 0.12 (-t-0.06) 26* 0.27 (+0.12) 0.08 (+0.05) 25"
0.30 (+0.10) 0.30 (+0.10) 52 0.24 (-t-0.06) 0.24 (-t-0.06) 45
* Data from Churchman & Theng (1984)
cylindrical in shape. The dominant tubular particles in these halloysites were either the shortest (Hamilton) or the narrowest (Jarrahdale) among those studied.
Locat ion o f pores in halloysites
Representative transmission electron micrographs of the cross-sections of the halloysites (Fig. 5) show that particles of all shapes generally are made up of blocks of layers bent around one another. Only the smaller, tubular particles shown in Fig. 5d, contain a cylindrical or near-cylindrical pore in the centres of their tubes.
In the larger particles, i.e. the particles in Fig. 5a -c , there are gaps between successive blocks which constitute virtually all of the visible pores. The intra-crystal pores in these larger particles tend to be both narrow and slit-shaped. The small tubular particles (F) show few visible slit-shaped pores from gaps between blocks of layers, but slightly larger tubes, such as those labelled I, can show both slit-shaped and cylindrical pores.
While the presence of central holes may explain the occurrence of cylindrical pores in samples containing small tubular particles, the large pore L shown in Fig. 5a of a large tube in Dtmedin halloysite may also exhibit some cylindrical character.
Using an electron microscope with an environ- mental cell, Kohyama et al. (1978) showed that a hydrated halloysite did not contain pores within the tubes. Pores within the tubes were created by dehydration of the 10 ,~ form of the mineral to give the 7 A form. Groups of layers apparently shrink as a block, creating pores between each group. Such pores may arise from dehydration occurring in the field or during preparation of samples for analyses in the laboratory, including gas sorption and electron microscopy.
Singh & Gilkes (1992) have also shown that wedge-shaped voids can form by the folding of layers of kaolinites to form tubular halloysite. However, there is no evidence that the halloysite samples in this study had originated from kaolinite.
Primary minerals (quartz, ferromagnesians, cristobalite, feldspars, mica), and also vermiculite (altered from, but pseudomorphous with, mica) should not contribute to the pores <c. 15 nm which are of interest in this study. Gibbsite is only ever present in trace amounts in the Jarrahdale samples (Churchman & Gilkes, 1989). Allophane tends to give rise to cylindrical pores with radii near 1 nm (Rousseaux & Warkentin, 1976).
In general, pore sizes and shapes derived from the sorption of nitrogen on a number of halloysites can be explained as intra-crystalline phenomena.
Characteristics of pores in halloysites 97
Pores result ing from the packing together of different particles have also been suggested as explanations of the characteristic pore-size distribu- tions for halloysites (Churchman & Payne, 1983; McCrea & Gilkes , 1987). Scanning electron micrographs of the samples used in this study suggest that this explanation is unlikely as pores from packing would be neither small enough nor concentrated enough in narrow ranges to provide the types of pore size distributions shown in Fig. 3.
C O N C L U S I O N S
(1) Halloysites with mainly small particles (< c. 0.08 Ixm in width) had many cylindrical pores.
(2) These cylindrical pores showed a narrow distribution of sizes (from c. 5 - 1 5 nm).
(3) Halloysites with mainly large particles (> c. 0.1 I.tm in width) had few, if any, pores in the mesopore size range ( 2 - 5 0 nm).
(4) Cylindrical pores probably derive mainly from the central holes in tubular particles.
(5) Slit-shaped pores in halloysites may arise from the shrinkage on dehydration of blocks of layers.
ACKNOWLEDGMENTS
GJC is grateful to the University of Western Australia for the award of a Gledden Senior Visiting Fellowship which provided financial support for this work and his former employers, New Zealand Soil Bureau, DSIR, for study leave in order to carry it out. We thank Dr Rob Hayes, of the University of South Australia for the determination of the isotherms for the powdered Hamilton halloysite sample, Kay Card, formerly of the Physics and Engineering Laboratories, DSIR, New Zealand for scanning electron microscopy and Adrian Beech, Trevor Cock and Jim Thompson, of CSIRO Division of Soils, for oxalate-extractable cation determinations, TEM plate preparation and differen- tial thermal analyses, respectively. We also thank Dr Chris Pope of the University of Otago, New Zealand for helpful comments on the manuscript.
REFERENCES
AYLMORE L.A.G. (1974a) Gas sorption in clay mineral systems. Clays Clay Miner. 22, 175-183.
AVLMORE L.A.G. (1974b) Hysteresis in gas sorption. J. Colloid Interf Sci. 46, 410-416.
AYLMORE L.A.G. (1977) Microporosity in montmorillo- nite from nitrogen and carbon dioxide sorption. Clays Clay Miner. 25, 148--154.
AYLMORE L.A.G. &QUIRK J.P. (1960) Domain or turbostrat ic structure of clays. Nature, 187, 1046-1048.
AYLMORE L.A.G. & QUIRK J.P. (1967) The micropore size distribution of clay mineral systems. J. Soil Sci. 18, 1-17.
AYLMORE L.A.G. & SILLS I.D. (1978) Pore structure and mechanical strength of soils in relation to their constitution. Pp. 69 -78 in: Modification of Soil Structure (W.W. Emerson, R.D. Bond & A.R. Dexter, editors). John Wiley and Sons, New York.
BLAKEMORE L.C., SEARLE P.L. & DALY B.K. (1987) Methods for chemical analysis of soils. N.Z. Soil Bureau Scientific Report, 80.
BRUNAUER S., EMMETT P.H. & TELLER E. (1938) Adsorption of gases in multimolecular layers. J. Am. Chem. Soc. 60, 309-310.
CHURCHMAN G.J. & BURKE C.M. (1991) Properties of subsoils in relation to various measures of surface area and water content. J. Soil Sci. 42, 463-478.
CHURCHMAN G.J. & CARR R.M. (1975) The definition and nomenclature of halloysites. Clays Clay Miner. 23, 382-388.
CHURCHMAN G.J. & GILKES R.J. (1989) Recognition of intermediates in the possible transformation of halloysite to kaolinite in weathering profiles. Clay Miner. 24, 579-590.
CHURCHMAN G.J. & PAYNE D. (1983) Mercury intrusion porisimetry of some New Zealand soils in relation to clay mineralogy and texture. J. Soil Sci. 34, 437-451.
CHURCHMAN G.J. & THENG B.K.G. (1984) Interactions of halloysites with amides: mineralogical factors affecting complex formation. Clay Miner. 19, 161-175.
DE BOER J.H., VAN DEN HEUVAL A. & LINSEN B.G. (1964) Studies of pore systems in catalysis. IV. The two causes of reversible hysteresis. J. Catalysis, 3, 268-273.
DIAMOND S. (1970) Pore size distribution in clays. Clays Clay Miner. 18, 7-23 .
DIXON J.B. (1989) Kaolin and serpentine group minerals. Pp. 467-525 in: Minerals in Soil Environments (J. B. Dixon & S. B. Weed, editors). Soil Science Society America, Madison, Wisconsin.
GREGG S.J. & SING K.S.W. (1967) Adsorption, Surf. ace Area and Porosity. Academic Press, London.
JACKSON B.L.J., METCALFE A. & WILCOCK R.J. (1971) Adsorption hysteresis on disordered kaolinite. Trans. Farad. Soc. 67, 2137-2144.
KOHYAMA N., FUKUSHIMA K. & FUKAMI A. (1978) Observation of the hydrated form of tubular halloysite by an electron microscope equipped with an environmental cell. Clays Clay Miner. 26, 25-40.
LIPPENS B.C. & DE BOER J.H. (1965) Studies on pore systems in catalysis. V. The t method. J. Catalysis 4, 319-323.
98 G.J . Churchman et al.
MCCREA A.F. & GILKES R.J. (1987) The microstructure of lateritic pallid zone. Pp. 501-506 in: Micro- morphologie des Sols - - Soil Micromorphology. Proc. VIIth Int. Working Meeting on Soil Micro- morphology, Paris, July 1985. Association Francaise pour l'Etude du Sol.
MCCREA A.F., ANANO R.R. &GmKES R.J. (1990) Mineralogical and physical properties of lateritic pallid zone materials developed from granite and dolerite. Geoderma, 47, 33-47.
NEW ZEALAND SOIL BUREAU (1968) Soils of New Zealand, Part 3. N.Z. Soil Bureau Bulletin 26, (3).
PARFI~ R.L. (1990) Allophane in New Zealand - - a review. Aust. J. Soil Res. 28, 343-360.
PARFIXT R.L. & CHmDS C.W. (1988) Estimation of forms of Fe and Al: a review, and analysis of contrasting soils by dissolution and M6ssbauer methods. Aust. J. Soil Res. 26, 121--144.
PARFITr R.L. & WILSON A.D. (1985) Estimation of allophane and halloysite in three sequences of volcanic soils, New Zealand. Catena Supplement 7, 1-8.
PIERCE C. (1968) The universal nitrogen isotherm. J. Phys. Chem. 72, 3673-3676.
ROUSSEAUX J.M. & WARKENT~N B.P. (1976) Surface properties and forces holding water in allophane
soils. Soil ScL Soc. Am. J. 40, 446-451. SHULL C.G. (1948) The determination of pore size
distribution from gas adsorption data. J. Am. Chem. Soc. 70, 1405-1414.
SILLS I.D., AYLMORE L.A.G. & Qumi( J.P. (1973a) An analysis of pore size in illite-kaolinite mixtures. J. Soil Sci. 24, 480-490.
SILLS I.D., AYLMORE L.A.G. & QUIRK J.P. (1973b) A comparison between mercury injection and nitrogen sorption as methods of determining pore size distributions. Soil Sci. Soc. Am. Proc. 37, 535-537.
SILLS I.D., AYLMORE L.A.G. & QUIRK J.P. (1974) Relationship between pore size distributions and physical properties of clay soils. Aust. J. Soil Res. 12, 107-117.
SINGH B. & GILKES R.J. (1992) An electron optical investigation of the alteration of kaolinite to halloysite. Clays Clay Miner. 40, 212-229.
SPURR A.R. (1969) A low-viscosity epoxy resin embedding medium for electron microscopy. J. Ultrastructure Res. 26, 31-43.
WHIR'tON J.S. & CHURCHMAN G.J. (1987) Standard methods for mineral analysis of soil survey samples for characterisation and classification. N.Z. Soil Bureau Scientific Report, 79.