Joana Rute Calça Xavier - core.ac.uk · viáveis com base num universo curado e diversificado de...
214
Joana Rute Calça Xavier junho de 2016 UMinho|2016 Universidade do Minho Escola de Engenharia Joana Rute Calça Xavier Systems Analysis Of Minimal Metabolic Networks In Prokaryotes Systems Analysis Of Minimal Metabolic Networks In Prokaryotes Governo da República Portuguesa This work was funded by FCT, the Portuguese Foundation for Science and Technology, with the grant SFRH/BD/81626/2011
Transcript of Joana Rute Calça Xavier - core.ac.uk · viáveis com base num universo curado e diversificado de...
Joana Rute Calça Xavier
junho de 2016UM
inho
|201
6
Universidade do Minho
Escola de Engenharia
Joan
a R
ute
Cal
ça X
avie
r S
yste
ms
An
aly
sis
Of
Min
ima
l M
eta
bo
lic
Ne
two
rks
In P
roka
ryo
tes
Systems Analysis Of Minimal Metabolic Networks In Prokaryotes
Governo da República Portuguesa
This work was funded by FCT, the Portuguese Foundation for Science and Technology, with the grant SFRH/BD/81626/2011
PhD Thesis in Chemical and Biological Engineering
This work was executed under the supervision of:
Professor Isabel Cristina de Almeida Pereira da Rocha
and
Doctor Kiran Raosaheb Patil
Joana Rute Calça Xavier
junho de 2016
Systems Analysis Of Minimal Metabolic Networks In Prokaryotes
Universidade do Minho
Escola de Engenharia

V
Acknowledgements/Agradecimentos
From the moment of birth every human being wants happiness and freedom and wants to
avoid suffering. In this we are all the same; and the more we care for the happiness of others
the greater our own sense of each other becomes.
—TENZIN GYATSO, THE 14TH DALAI LAMA The Compassionate Life (2001)
It is with tremendous and double joy that I write these words: one great task in
my life seems to be nearly completed, and there is space to express gratitude, a
personal favorite feeling of mine. If I reached here, it is because of several marvelous
beams of light around me that I have the privilege to acknowledge now.
First and foremost to my supervisors, Isabel, and Kiran: you both opened doors
to me that I’ll never forget, and taught me so much. I was lucky to have guidance,
enlightening opinions and ideas that always summed to more than two. Thank you
for adapting at many times to my heavy passion for philosophy and for teaching me
so much science and engineering. Also a special word to Chris Henry: thank you very
much for receiving me so warmly in your lab, I learnt and grew greatly in just 3
months there, also with Ross and Gary – thank you.
To all my colleagues in BISBII, at the University of Minho, so many of us that it
would be hard to fit all here, thank you for all the moments outside of work, the
lunches, cakes and good laughs. A special thank you to Daniel for your collaboration
in our minimal networks; Vilaça and Liu for always being ready to help me with
computers; Maia and Rui for the help with the thesis in this final countdown. For this
same reason but more, José Pedro, your help and friendship in Chicago were
invaluable. Also in Chicago, Neal, Bo and the crew from 57th Blackstone – thank you
for a life changing experience. To the Patil group, thank you guys for the awesome
moments and rich scientific discussions. A special hug for your friendship in many
special moments, Alda, Filipa, Melanie, Martina, Olga and Sergej. Still in Heidelberg,
Kristoffer, thank you for being the incredible human being you are; Bruna, thank you
VI
for being such a light, and together with Fábio: obrigada, for your Awesome music
and words.
To my great friends from Hungarian times, Veronika and Betti, you bring so
much love to my heart. Ana Abreu, Raquel, Rúben e Diogo, for our forever-FEUP-
Barcelona-Porto specialness; ex MIBs, I’m so grateful to share with you our special
engineering: Andreia, Bibi, Célia, Deco, Ivan, Lena, Odila, Priscila, Sara. Obrigada a
todas as mulheres fantásticas companheiras de jornada na Calma & Harmonia.
Patrícia, Filipa e Bruno pela vossa grande amizade e apoio em tantos momentos,
Amália, Sónia, Sara, Vanessa, Nuno, João e Cajó, pois quando se tem um coração
grande, não importa o lugar do resto, estamos sempre lá. Jô, a tua amizade e luz não
tem igual, tornaste isto tudo muito mais fácil; estou grata por ter conhecido uma
pessoa tão boa como tu.
To all the others that I could not name but that were positive parts of my life in
one way or another, and To all the sentient beings and life forms that make me
wonder every day.
Aos meus pais e irmã, Fernando, Sónia e Ana, tanto do que sou é de vós, e a
minha gratidão não tem limites pelo que me deram e me fizeram crescer. O que me
aturaram nas minhas poli-polaridades, obrigada. Esta tese é dedicada a vós.
To Steven, you are an awesome human being, making me grow to be a better
person every day. There are no words that could represent my gratitude for having
met you and for all that you gave me in these four years. This thesis is dedicated also
to you.
I would like to thank FCT, the Portuguese Foundation for Science and
Technology for financing this PhD with the grant SFRH/BD/81626/2011 and the
three institutions that hosted me for my work: CEB – the Centre of Biological
Engineering in Braga, Portugal; EMBL – the European Molecular Biology Laboratory
in Heidelberg, Germany and the Argonne National Laboratory in Chicago, U.S.A.
VII
Abstract
The complexity of living cells is staggering, as a result of billions of years of
evolution through natural selection in constantly changing environments. Systems
biology emerges as the preferred approach to the disentangling of this complexity
by looking at living cells and their responses to environments in a holistic manner.
Complete annotated sequences of genomes are now available for thousands of
species of the simplest unicellular life forms known, the prokaryotes. Together with
other large-scale datasets as proteomes and phenotypic screenings and a careful
analysis of the literature, genome annotations allow for the reconstruction of large
constraint-based models of cellular metabolism.
Here, genome-scale metabolic models (GSMs) of prokaryotes are used together
with other disparate large-scale datasets and literature assessments to study and
predict essential components in minimal metabolic networks. A conceptual
clarification is presented in a review of systems biology perspectives on minimal
and simpler cells. An assessment of the biomass compositions in 71 GSMs of
prokaryotes was then performed, revealing heterogeneity that impacted predictions
of reaction essentiality. The integration of 33 large-scale essentiality assays with
other data and literature revealed universally and conditionally essential cofactors
for prokaryotes. These were used to revise predictions of essential genes and in the
prediction of one biosynthetic pathway in the GSM of M. tuberculosis.
Additionally, a large-scale assessment of essentiality of different metabolic
subsystems was performed with 15 comparable GSMs. The results were validated
with 36 large-scale experimental assays of gene essentiality. The ancestry of
metabolic genes and subsystems was estimated by blasting representative genomes
of all the phyla in the prokaryotic tree of life. Ancestry was correlated with
essentiality in general but not with non-essentiality.
Finally, a method was devised to generate minimal viable metabolic networks
based on a curated and diverse universe of prokaryotic metabolic reactions.
Different growth media were tested and shown to generate different networks
regarding size, cofactor requirements and maximum biomass production. The

VIII
results of this work are expected to contribute for fundamental investigations of
core and ancestral prokaryotic metabolism and the design of modularized and
controllable chassis cells.
IX
Resumo
A complexidade das células vivas é surpreendente, como resultado de milhares
de milhões de anos de evolução através de seleção natural em ambientes em
constante mudança. A Biologia de sistemas surge como a abordagem preferencial
para analisar esta complexidade por examinar as células e as suas respostas ao meio
de uma forma holística. Estão hoje disponíveis sequências completas e anotadas de
genomas para milhares de espécies das formas de vida unicelulares mais simples
conhecidas, os procariotas. Juntamente com outros conjuntos de dados de larga
escala como proteomas e triagens fenotípicas e uma análise cuidadosa da literatura,
os genomas anotados permitem a reconstrução de grandes modelos do metabolismo
celular baseados em restrições.
Neste trabalho utilizam-se modelos metabólicos à escala genómica (GSMs) de
procariotas em conjunto com outros grandes conjuntos de dados díspares e
avaliações da literatura para estudar e prever componentes essenciais em redes
metabólicas mínimas. Um esclarecimento conceptual é apresentado numa revisão de
perspectivas da biologia de sistemas sobre células mínimas e mais simples.
Segue-se uma avaliação das composições de biomassa em 71 GSMs de
procariotas, revelando a heterogeneidade que afecta as previsões de essencialidade
de reações. Com a integração de 33 ensaios em grande escala de essencialidade com
outros dados e literatura, revelam-se cofactores essenciais universais e condicionais
em procariotas. Estes foram utilizados na revisão de previsões de genes essenciais e
na previsão de uma via biossintética no GSM de M. tuberculosis.
Adicionalmente, foi realizada uma avaliação em larga escala de essencialidade
de diferentes subsistemas metabólicos com 15 GSMs comparáveis. Os resultados
foram validados com 36 ensaios experimentais de essencialidade em larga escala. A
ancestralidade de genes metabólicos e subsistemas foi estimada por blast a genomas
representativos de todos os filos na árvore da vida procariota. A ancestralidade
revelou-se correlacionada com a essencialidade em geral, mas não com a não-
essencialidade.

X
Finalmente, concebeu-se um método para gerar redes metabólicas mínimas
viáveis com base num universo curado e diversificado de reações metabólicas
procariotas. Diferentes meios de crescimento foram testados, mostrando-se a
geração de diferentes redes em relação ao tamanho, os requisitos de cofactores e a
produção de biomassa máxima. Espera-se que os resultados deste trabalho
contribuam para investigações fundamentais dos metabolismos essencial e ancestral
de procariotas e para o desenho de células chassis modulares e controláveis.
XI
Table of Contents
Acknowledgements/Agradecimentos ...........................................................................v
Abstract ................................................................................................................................. vii
Resumo ................................................................................................................................... ix
Table of Contents ................................................................................................................ xi
List of Figures ...................................................................................................................... xv
List of Tables .................................................................................................................... xvii
CHAPTER 1 General Introduction ................................................................................ 19
1.1 Context and Motivation ............................................................................................................................. 21
1.1.1 A Short History of Systems Biology .................................................................................... 21
1.1.2 Genome-scale Metabolic Models and Flux Balance Analysis ................................... 22
1.1.3 Comparative Systems Biology and the Inference of Minimal Metabolism ......... 24
1.2 Research Aims................................................................................................................................................ 25
1.3 Outline of the Thesis ................................................................................................................................... 25
1.4 Scientific Output ........................................................................................................................................... 27
1.4.1 Peer-reviewed Publications .................................................................................................. 27
1.4.2 Conference Presentations ...................................................................................................... 27
1.4.3 Invited Talks ................................................................................................................................ 28
References ............................................................................................................................................................... 28
CHAPTER 2 Systems Biology Perspectives on Minimal and Simpler Cells .... 33
2.1 Introduction ................................................................................................................................................... 35
2.1.1 A Systems Biology Perspective on Minimal Cells ......................................................... 38
2.1.2 Minimal or Simpler Cells? ....................................................................................................... 38
2.2 Towards the Smallest Number of Components .............................................................................. 39
2.2.1 Minimal Genome ........................................................................................................................ 40
2.2.2 Other Minimal Sets of Components .................................................................................... 42
2.2.3 Minimal Environmental Conditions for Life ................................................................... 46
2.3 LUCA and the First Cells ............................................................................................................................ 49
2.4 Chassis Cells .................................................................................................................................................... 53
2.5 Systems’ Approaches for Understanding and Creating Minimal Cells ................................ 58
2.5.1 Top-Down Approach ................................................................................................................ 59
2.5.2 Comparative Approach ............................................................................................................ 66
2.5.3 Bottom-Up Approach ............................................................................................................... 68
2.5.4 Middle-Out Approach ............................................................................................................... 69
2.5.5 Models and Simulations of Minimal and Simpler Cells .............................................. 71
2.6 Towards the Lowest Complexity ........................................................................................................... 74
XII
2.6.1 Interactomes and Network Biology ................................................................................... 74
2.6.2 Genome Size and Cellular Complexity ............................................................................... 75
2.7 Sub-cellular Architecture ......................................................................................................................... 80
2.8 Conclusions and Future Perspectives .................................................................................................. 80
References ............................................................................................................................................................... 84
CHAPTER 3 Essential Cofactors in Prokaryotes Revealed by Genome-scale Models and Large Data Integration ............................................................................... 101
3.1 Introduction ................................................................................................................................................. 103
3.2 Results............................................................................................................................................................. 104
3.2.1 The Universe of Biomass Constituents in Prokaryotic GSMs Is Large and Heterogeneous ........................................................................................................................................... 104
3.2.2 Qualitative Biomass Composition Drastically Impacts Essentiality Predictions .......................................................................................................................................................................... 106
3.2.3 Newly Predicted Essential Genes Have Essential Orthologs in Multiple Species And Are Related With Cofactor Metabolism .................................................................................. 108
3.2.4 Integration of Multiple Data Sources Reveals Universally Essential Cofactors .......................................................................................................................................................................... 109
3.2.5 New Pathways and Improved Gene Essentiality Predictions for Mycobacterium tuberculosis .................................................................................................................................................. 112
3.3 Discussion and Conclusions .................................................................................................................. 115
3.4 Supplementary Discussion .................................................................................................................... 118
3.4.1 Sensitivity to Errors and Incompleteness in Databases .......................................... 118
3.4.2 Universally Essential Cofactors ......................................................................................... 119
3.4.2.1 NAD(H) and NADP(H) ................................................................................................... 119
3.4.2.2 S-adenosyl-methionine (SAM) .................................................................................. 119
3.4.2.3 FAD and FMN .................................................................................................................... 120
3.4.2.4 Pyridoxal-5-phosphate (P5P) .................................................................................... 120
3.4.2.5 Coenzyme A (CoA) .......................................................................................................... 121
3.4.2.6 C1 Carriers ......................................................................................................................... 121
3.4.2.7 Thiamin diphosphate .................................................................................................... 122
3.4.3 Conditionally Essential Cofactors ..................................................................................... 122
3.4.3.1 Acyl-carrier protein (ACP) .......................................................................................... 122
3.4.3.2 Quinones ............................................................................................................................. 123
3.4.3.3 Biotin .................................................................................................................................... 123
3.4.3.4 Hemes .................................................................................................................................. 124
3.4.3.5 Cobalamins ........................................................................................................................ 124
3.4.3.6 Lipoic Acid ......................................................................................................................... 125
3.4.3.7 UDP-Glc-Nac ...................................................................................................................... 125
3.4.3.8 Polyamines ........................................................................................................................ 125
3.4.4 Other Details on Modeling Biomass Compositions .................................................... 125
XIII
3.5 Methods ......................................................................................................................................................... 127
3.5.1 Collection and Comparison of Detailed BOFs in GSMs ............................................. 127
3.5.2 Cluster Analysis ........................................................................................................................ 127
3.5.3 BOF Swap .................................................................................................................................... 128
3.5.4 Simulations of Reaction/Gene Deletion Phenotypes ................................................ 128
3.5.5 Mapping In Silico Essential Genes with Large-Scale Experimental Essential Datasets ......................................................................................................................................................... 129
3.5.6 Data Extraction and Integration ........................................................................................ 129
3.5.7 Modification of iNJ661v......................................................................................................... 129
References ............................................................................................................................................................ 129
CHAPTER 4 Essential and Ancestral Metabolic Functions in Prokaryotes 139
4.1 Introduction ................................................................................................................................................ 141
4.1.1 Cellular Complexity and Genome-Scale Essentiality ................................................. 141
4.1.2 Genome-Scale Metabolic Models and the Core and Ancestral Metabolism ..... 142
4.2 Methods ......................................................................................................................................................... 143
4.2.1 Genome-Scale Metabolic Models Used in Essentiality Predictions ..................... 143
4.2.2 Parsing Genome-Scale Metabolic Models ...................................................................... 145
4.2.3 Single Knockout of Metabolic Reactions ........................................................................ 145
4.2.4 Standardizing the Nomenclature of Essential Metabolic Reactions ................... 145
4.2.5 Experimental Data and Subsystem Mapping ................................................................ 145
4.2.6 Analysis of Genetic Conservation ...................................................................................... 147
4.2.7 Numerical and Statistical Analysis of Essentiality and Conservation ................ 147
4.3 Results ............................................................................................................................................................ 148
4.3.1 Patterns of Essentiality Are Validated by Phylogenies ............................................ 148
4.3.2 Cofactor Metabolism, Cell Wall and Lipids: Most Essential Subsystems in Metabolic Networks ................................................................................................................................. 151
4.3.3 Experimental Data Corroborates and Elaborates on the Patterns of Essentiality Given by GSMs ............................................................................................................................................ 156
4.3.4 tRNA Charging, Transport, Oxidative Phosphorylation and Cofactor Metabolism: The Core Conserved Metabolism ............................................................................. 159
4.3.5 Common Essential Genes Are Rarer and Prone to Be Highly Conserved, Contrarily to Common Non-Essential Genes ................................................................................. 164
4.4 Discussion ..................................................................................................................................................... 167
References ............................................................................................................................................................ 171
CHAPTER 5 Generating Minimal Metabolic Networks with a Curated Universe of Prokaryotic Reactions ................................................................................ 179
5.1 Introduction ................................................................................................................................................ 181
5.2 Methods ......................................................................................................................................................... 182
5.2.1 Construction of a Universe of Diverse Prokaryotic Metabolic Reactions ......... 182
5.2.2 Growth Media ............................................................................................................................ 183
XIV
5.2.3 Universal Biomass ................................................................................................................... 186
5.2.4 Curation of the Reaction Universe and Generation of Feasible Minimal Metabolic Networks ................................................................................................................................. 189
5.2.5 Model Analysis .......................................................................................................................... 190
5.3 Results and Discussion ............................................................................................................................ 191
5.3.1 Universe of Prokaryotic Metabolic Reactions .............................................................. 191
5.3.2 Network Sizes ............................................................................................................................ 192
5.3.3 Metabolic Subsystems in the Minimal Networks ....................................................... 193
5.3.4 Growth Rates ............................................................................................................................. 195
5.3.5 Cofactor Requirements ......................................................................................................... 196
5.4 Conclusions ................................................................................................................................................... 199
References ............................................................................................................................................................ 200
CHAPTER 6 Conclusions and Perspectives on Future Research ..................... 205
6.1 General Conclusions ................................................................................................................................. 207
6.2 Perspectives on Future Research ....................................................................................................... 210
6.3 Supplementary Material ........................................................................................................................ 211
References ............................................................................................................................................................ 211
XV
List of Figures
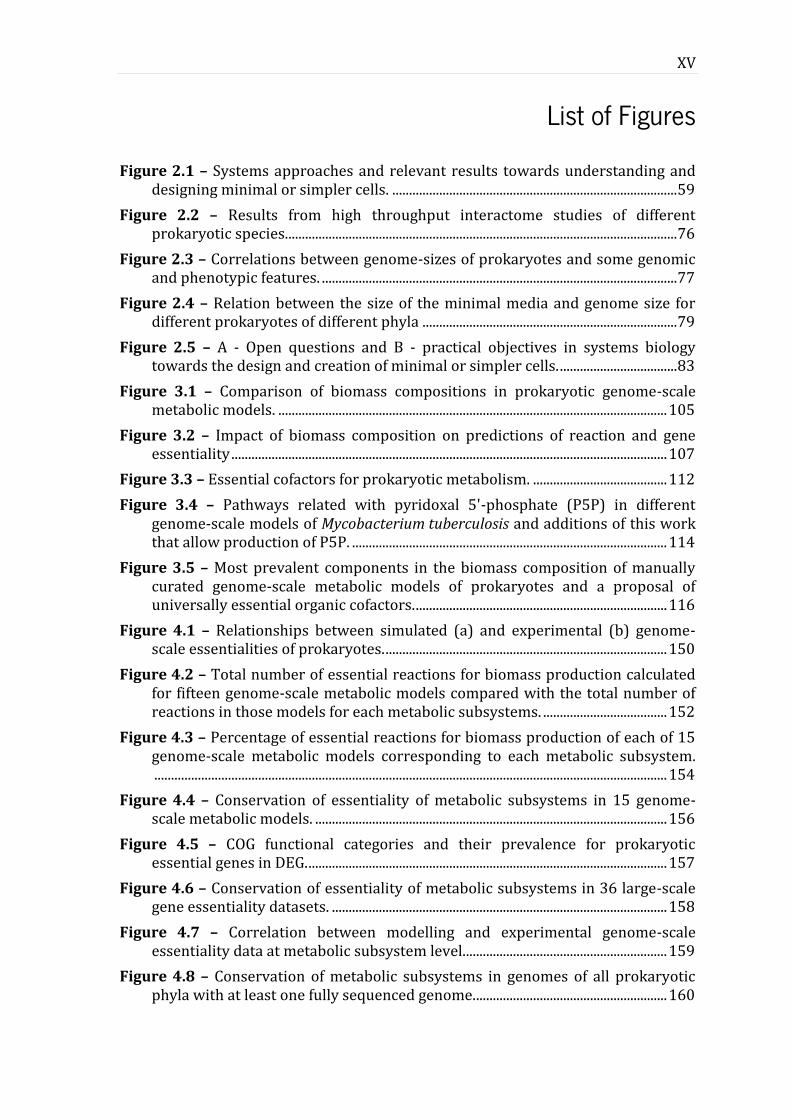
Figure 2.1 – Systems approaches and relevant results towards understanding and designing minimal or simpler cells. ..................................................................................... 59
Figure 2.2 – Results from high throughput interactome studies of different prokaryotic species. .................................................................................................................... 76
Figure 2.3 – Correlations between genome-sizes of prokaryotes and some genomic and phenotypic features. .......................................................................................................... 77
Figure 2.4 – Relation between the size of the minimal media and genome size for different prokaryotes of different phyla ............................................................................ 79
Figure 2.5 – A - Open questions and B - practical objectives in systems biology towards the design and creation of minimal or simpler cells. ................................... 83
Figure 3.1 – Comparison of biomass compositions in prokaryotic genome-scale metabolic models. .................................................................................................................... 105
Figure 3.2 – Impact of biomass composition on predictions of reaction and gene essentiality .................................................................................................................................. 107
Figure 3.3 – Essential cofactors for prokaryotic metabolism. ........................................ 112
Figure 3.4 – Pathways related with pyridoxal 5'-phosphate (P5P) in different genome-scale models of Mycobacterium tuberculosis and additions of this work that allow production of P5P. .............................................................................................. 114
Figure 3.5 – Most prevalent components in the biomass composition of manually curated genome-scale metabolic models of prokaryotes and a proposal of universally essential organic cofactors. ........................................................................... 116
Figure 4.1 – Relationships between simulated (a) and experimental (b) genome-scale essentialities of prokaryotes. .................................................................................... 150
Figure 4.2 – Total number of essential reactions for biomass production calculated for fifteen genome-scale metabolic models compared with the total number of reactions in those models for each metabolic subsystems. ..................................... 152
Figure 4.3 – Percentage of essential reactions for biomass production of each of 15 genome-scale metabolic models corresponding to each metabolic subsystem. ......................................................................................................................................................... 154
Figure 4.4 – Conservation of essentiality of metabolic subsystems in 15 genome-scale metabolic models. ......................................................................................................... 156
Figure 4.5 – COG functional categories and their prevalence for prokaryotic essential genes in DEG. ........................................................................................................... 157
Figure 4.6 – Conservation of essentiality of metabolic subsystems in 36 large-scale gene essentiality datasets. .................................................................................................... 158
Figure 4.7 – Correlation between modelling and experimental genome-scale essentiality data at metabolic subsystem level............................................................. 159
Figure 4.8 – Conservation of metabolic subsystems in genomes of all prokaryotic phyla with at least one fully sequenced genome.......................................................... 160
XVI
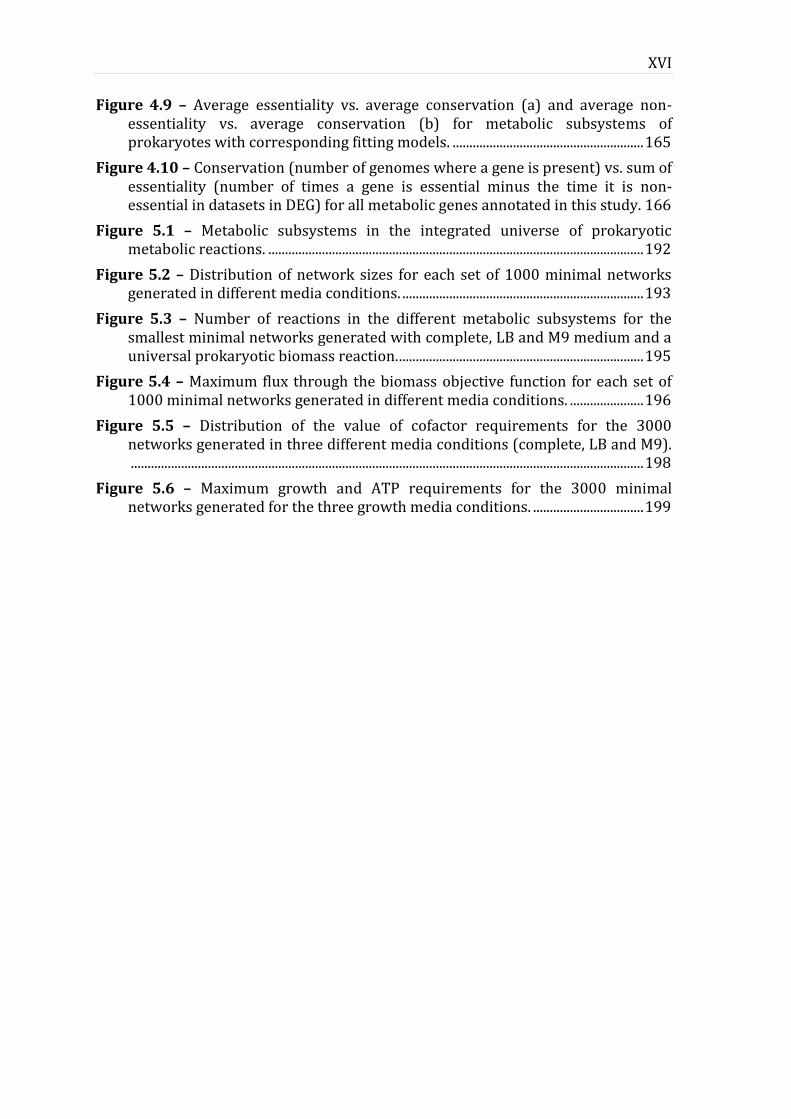
Figure 4.9 – Average essentiality vs. average conservation (a) and average non-essentiality vs. average conservation (b) for metabolic subsystems of prokaryotes with corresponding fitting models. ......................................................... 165
Figure 4.10 – Conservation (number of genomes where a gene is present) vs. sum of essentiality (number of times a gene is essential minus the time it is non-essential in datasets in DEG) for all metabolic genes annotated in this study. 166
Figure 5.1 – Metabolic subsystems in the integrated universe of prokaryotic metabolic reactions. ................................................................................................................ 192
Figure 5.2 – Distribution of network sizes for each set of 1000 minimal networks generated in different media conditions. ........................................................................ 193
Figure 5.3 – Number of reactions in the different metabolic subsystems for the smallest minimal networks generated with complete, LB and M9 medium and a universal prokaryotic biomass reaction. ......................................................................... 195
Figure 5.4 – Maximum flux through the biomass objective function for each set of 1000 minimal networks generated in different media conditions. ...................... 196
Figure 5.5 – Distribution of the value of cofactor requirements for the 3000 networks generated in three different media conditions (complete, LB and M9). ......................................................................................................................................................... 198
Figure 5.6 – Maximum growth and ATP requirements for the 3000 minimal networks generated for the three growth media conditions. ................................. 199
XVII
List of Tables
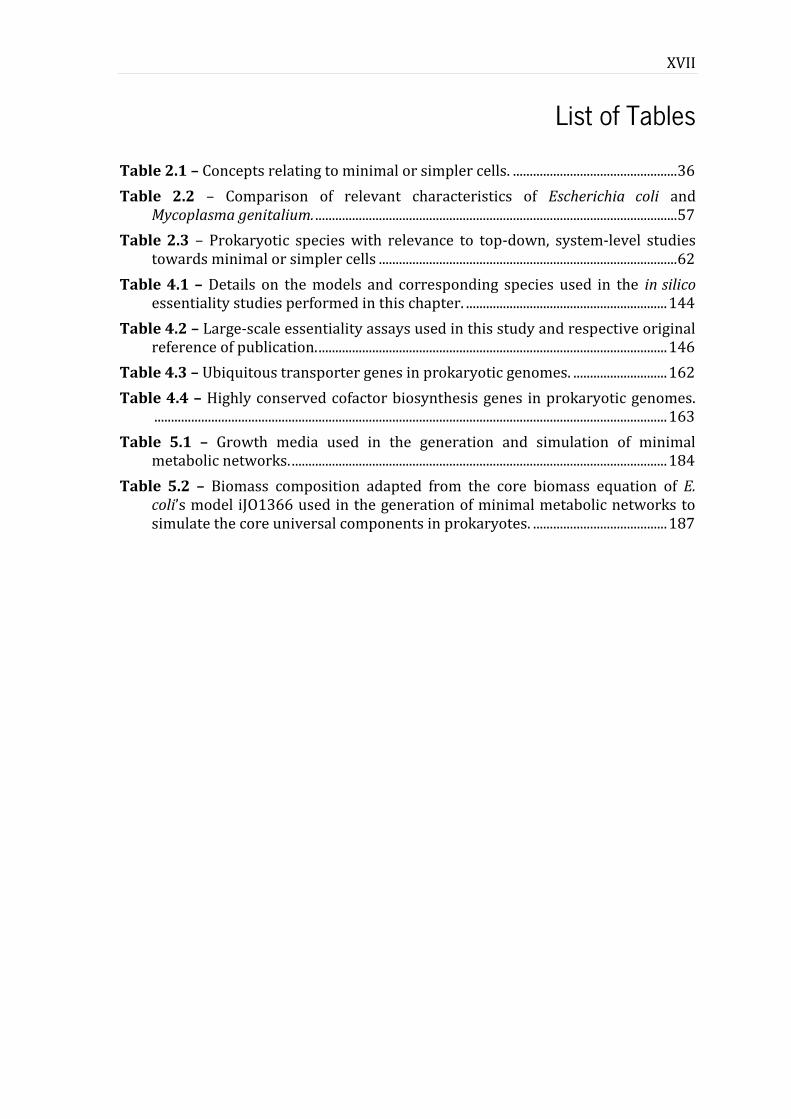
Table 2.1 – Concepts relating to minimal or simpler cells. ................................................. 36
Table 2.2 – Comparison of relevant characteristics of Escherichia coli and Mycoplasma genitalium. ............................................................................................................ 57
Table 2.3 – Prokaryotic species with relevance to top-down, system-level studies towards minimal or simpler cells ......................................................................................... 62
Table 4.1 – Details on the models and corresponding species used in the in silico essentiality studies performed in this chapter. ............................................................ 144
Table 4.2 – Large-scale essentiality assays used in this study and respective original reference of publication. ........................................................................................................ 146
Table 4.3 – Ubiquitous transporter genes in prokaryotic genomes. ............................ 162
Table 4.4 – Highly conserved cofactor biosynthesis genes in prokaryotic genomes. ......................................................................................................................................................... 163
Table 5.1 – Growth media used in the generation and simulation of minimal metabolic networks. ................................................................................................................ 184
Table 5.2 – Biomass composition adapted from the core biomass equation of E. coli’s model iJO1366 used in the generation of minimal metabolic networks to simulate the core universal components in prokaryotes. ........................................ 187

19
CHAPTER 1
General Introduction
The footsteps of Nature are to be trac'd, not only in her ordinary course, but when she seems to
be put to her shifts, to make many doublings and turnings, and to use some kind of art in
endeavoring to avoid our discovery.
—ROBERT HOOKE, Micrographia (1665)
In this chapter, a brief historical view of systems biology is presented to
portray the scientific and technological context where this work develops. Genome
scale metabolic models and the methods used to build and simulate them are
introduced, with an emphasis on flux balance analysis, used thoroughly in this work.
The potential of comparative systems biology leading ultimately to the inference of
minimal metabolic networks is also presented. The research aims guiding the work
reported in this manuscript are enumerated, and the outline of this thesis is
presented with a short description of each chapter. Finally, the scientific output of
this thesis is referenced.

20 | CHAPTER 1 General Introduction
CHAPTER 1 General Introduction | 21
1.1 Context and Motivation
1.1.1 A Short History of Systems Biology
In France, back in 1864, Claude Bernard insists that living creatures are bound
by the same laws as inanimate matter, foretells the development of mathematical
biology and formulates the principle of control of the internal environment,
nowadays well-known as homeostasis (Bernard 1864). Ground-breaking views in
the midst of a 19th century still roamed by vitalist theories, these can be sufficient-
enough reasons to root back to Bernard the origins of systems biology (Noble 2008).
In actuality, one of the insulators around the modern paradigm of systems biology
lies beyond its look at biological systems as a whole (e.g. large sets of components,
cells, organisms, or other levels of biological organization): the application of
mathematics and physical principles to biological questions (Westerhoff et al. 2009).
The seminal Hodgkin-Huxley model, a mathematical model of the neuron’s axon
potential, is a prime example (Hodgkin & Huxley 1952). With accurate
measurements of ionic currents and a set of nonlinear differential equations,
Hodgkin and Huxley approximated the electrical characteristics of excitable cells, for
which they received the Nobel Prize. These characteristics would later be applied in
modeling the electrical functioning of the heart (Noble 1962) in an elegant depiction
of one of the assets of systems biology, one where it resembles physics more than
traditional biology: the prediction of general principles, rather than being purely
descriptive. Around the same time, Peter Mitchell enunciates his quantitative theory
of chemiosmosis, stating that ATP synthesis is coupled with the electron transfer
chain (Mitchell 1961). These quantitative and predictive approaches to biological
entities constitute the ‘systems root’ of systems biology (Westerhoff & Palsson
2004).
In the antithesis to the system root of systems biology emerges the ‘biology
root’, with its traditional, analytic reductionist approaches, cataloguing and
exploring individual biological entities. Westerhoff and Palsson described how the
scaling-up of molecular biology occurred from the discovery of the structure and
information coding of DNA, restriction enzymes, cloning technology and automatic
22 | CHAPTER 1 General Introduction
DNA sequencing to the current stage of fully-sequenced and annotated genomes
(Westerhoff & Palsson 2004). The stage where biology lies today, that of large-data
enabled by the blossoming of experimental biotechnology (Joyce & Palsson 2006), is
where it merges with systems theory in modern systems biology (Kitano 2002). The
history of systems biology is somewhat overlapping with that of bioinformatics, as
Paulien Hogeweg, credited with the coining of the term together with Ben Hesper,
reviewed in her recent historical perspective (Hogeweg 2011). Genome-scale
metabolic models (GSMs) are at the front of modern systems biology and are a
crucial element in this overlap with bioinformatics (Hogeweg 2011, Kitano 2002,
Westerhoff & Palsson 2004). The next section elaborates on this type of model and
its simulation, used thoroughly in Chapters 3, 4 and 5 of this thesis.
1.1.2 Genome-scale Metabolic Models and Flux Balance
Analysis
Genome-scale metabolic models (GSMs) are one of the most advanced and
detailed efforts towards predictive, quantitative biological models available
currently, allowing for the accurate estimation of growth rates under different
conditions (Edwards et al. 2001) and even of the outcome of adaptive evolution of
laboratory strains (Ibarra et al. 2002). While the first model was that of Haemophilus
influenza (Edwards & Palsson 1999), Escherichia coli was exhaustively explored with
different GSMs (Edwards & Palsson 2000, Feist et al. 2007, Orth et al. 2011, Reed et
al. 2003) and several other species have been modeled in the last years with
numerous applications, including antibiotic design and strain optimization (as
reviewed in (Durot et al. 2009, Monk et al. 2014, Oberhardt et al. 2009)).
A GSM can be formally described as a system of linear equations derived from
stoichiometry and a set of inequality constraints, which allows for quantitative
simulations. Manually-curated GSMs are built in a four-step process (Oberhardt et al.
2009). The first involves an initial draft reconstruction built from a genome
annotation to which information from databases is added, including various enzyme
data such as ligand molecules (cofactors, substrates, products, inhibitors and
activators), reaction formulae and metabolic pathways obtained e. g. from KEGG
CHAPTER 1 General Introduction | 23
(Kanehisa et al. 2014), EXPASY (Artimo et al. 2012), BRENDA (Chang et al. 2015)
and Metacyc (Caspi et al. 2014). Secondly, an examination of the primary literature
is performed to improve the initial reconstruction and a conversion to a
mathematical model of all the knowledge achieved is performed. Thirdly, a
validation of the model is attempted at through the comparison of its predictions to
phenotypic information. Finally, the model is submitted to continued wet/dry lab
cycles to improve its accuracy and test hypotheses.
Flux Balance Analysis (FBA) is one of the methodologies used to predict
phenotypes with GSMs. Through stoichiometric and the reversibility constraints, it
employs a linear programming (LP) strategy to generate a flux distribution that is
optimized towards a particular objective or phenotypic goal, which is usually the
production of biomass or cellular growth (Feist & Palsson 2010). FBA was
introduced on the basis of the Darwinian principle that states organisms
optimization during evolution (Ruppin et al. 2010, Varma & Palsson 1993).
In the last few years, FBA has been the most successful and widely used
technique at a system level in metabolic engineering. E. coli, as the preferred model
organism, was engineered to overproduce with high yields the amino acids
threonine (Lee et al. 2007) and valine (Park et al. 2007), lactic acid (Fong et al. 2005)
and succinic acid (Lee et al. 2005).
On its birth, FBA counted only with stoichiometric constraints; since then,
other constraints were added to the standard method, as regulatory (Gustin et al.
1998) and thermodynamic (Beard et al. 2002). Also, a dynamic approach to FBA was
developed, yielding temporal profiles of fluxes (Mahadevan et al. 2002). The
applications that FBA developments have in the analysis of GSMs are vast, but
several improvements still need to be done, not only to the simulation technologies,
but also to the models themselves. The development of the several omics datasets
makes promising statements, as with the integration of expression data that was
already used to improve predictions of metabolic fluxes (Åkesson et al. 2004, Faria
et al. 2014, Machado & Herrgård 2014). Other challenges are to be met in data
integration, especially the extraction of biological meaning from these large datasets
(Joyce & Palsson 2006, Saha et al. 2014).
24 | CHAPTER 1 General Introduction
1.1.3 Comparative Systems Biology and the Inference of
Minimal Metabolism
The use of metabolic or protein networks in comparative biology can provide
unique insights into the relationship and evolution of species. Metabolic phenotypes
can be regarded as the result of several evolutionary processes, but these
phenotypes do not emerge directly from the evolution of genomes. Non-orthologous
gene displacement causes completely different genotypes to result on the same
phenotype (Koonin 2003), and therefore comparing genomes is not the same as
comparing the functionality of the cells that contain them. Comparative functional
analysis can help to overcome this limitation and even identify some mistaken
phylogenetic inferences that exist to date (Kuchaiev et al. 2010, Yamada & Bork
2009).
While genetic sequences provide insights on close phylogenetic relationships
(suitable for more recent proteins) and protein sequences are used to make
inferences about evolutionary trajectories of older proteins, the comparison of
metabolic pathways can give us insight about even more ancient features, possibly
existing since before the last universal common ancestor (LUCA). Metabolic network
comparisons have been used and validated to make phylogenetic inferences
(Kuchaiev et al. 2010, Ma & Zeng 2004, Oh et al. 2006), but not yet using GSMs. The
comparative methodology using these models can, hypothetically, not only produce
these scientific outputs, but also have applications in expediting model construction
and improvement and strain optimization.
Ultimately, comparing metabolic networks at large-scale will lead to the
identification of core functions common to all or most the networks analyzed that
are hypothetical essential features of cells. These are assumed to be characteristics
of LUCA, of theoretical minimal cells and of chassis cells for diverse applications.
This motivation is further contextualized and explained in Chapter 2 of this thesis.
The detailed research aims following this motivation are presented below.
CHAPTER 1 General Introduction | 25
1.2 Research Aims
In the general context of the current status of systems biology and of the
potential of the comparison of genome-scale metabolism stated above, the main goal
of this thesis was to infer viable minimal metabolic networks for cellular growth. In
order to achieve this goal, the state of the art in minimal cells was reviewed
extensively. Genome-scale metabolic models were collected, studied and chosen for
further comparative work, with a special focus on comparability, validation and
phylogenetic reach. A particular effort was put on understanding the impact of the
biomass compositions used in GSMs in the prediction of essential metabolic
functions. The GSMs chosen were then used in simulations of single knockouts with
the aim of predicting essential reactions for prokaryotic metabolism. These
predictions were compared to experimental data and large-scale sequence
alignments to infer on the ancestry of specific metabolic functions. Finally, the
universe of metabolic reactions obtained and a curated core biomass composition
were used with the aim of predicting and generating viable minimal metabolic
networks in different growth conditions.
1.3 Outline of the Thesis
This thesis has been structured addressing the above-stated goals in six
chapters:
In Chapter 1, the current chapter, this thesis was contextualized in the
modern state of the field of systems biology, together with the
motivation and aims of this work, its structure and scientific outputs.
In Chapter 2, an extensive review of the broad and ambiguous field of
minimal cells was conducted, with a special focus on systems biology
conceptualizations and approaches. Partially overlapping concepts as
minimal cell, minimal genomes, LUCA and chassis cells were clarified.
Traditional reductionist, top-down approaches were contrasted with
26 | CHAPTER 1 General Introduction
bottom-up and integrative approaches to minimal cells. The different
goals of the minimization of cellular components and the simplification
of biological complexity were contrasted.
A large-scale integration of disparate experimental data, literature and
71 GSMs was performed regarding biomass composition in Chapter 3,
leading to the identification of universally and conditionally essential
organic cofactors for prokaryotic metabolism. The effect of the absence
of these core components in the biomass composition was studied,
leading to the prediction of new essential genes and one experimentally
validated biosynthetic route in two pathogens, Klebsiella pneumoniae
and Mycobacterium tuberculosis, respectively.
In Chapter 4, 15 highly curated and comparable GSMs were simulated
in rich media conditions to predict highly essential metabolic functions
for prokaryotic metabolism. The results were integrated at the level of
metabolic subsystems and validated with experimental data. Ancestral
metabolic subsystems were estimated from 79 manually selected
genomes covering all the prokaryotic phyla in the tree of life with
quality genome sequences. The subsystems of tRNA charging,
Transport, and Cofactor and Prosthetic Group metabolism were
identified as ancestral and highly essential.
All the previous chapters are integrated in the work conducted in
Chapter 5. A Universe of metabolic reactions was re-annotated and
curated to serve as a pool to generate minimal viable and diverse
metabolic networks. A curated core biomass reaction and three
different growth media were used, including one theoretical rich
medium and two common laboratory media. The networks obtained
were compared and analyzed regarding content and capabilities.
Finally, in Chapter 6 the main conclusions of this thesis are
recapitulated. Some perspectives on future research based on
unanswered or new questions identified throughout this work are also
presented.
CHAPTER 1 General Introduction | 27
Supplementary Files are provided in
http://darwin.di.uminho.pt/jcxavier/ and within the CD containing the
digital version of this document
1.4 Scientific Output
The scientific output produced from the results obtained in this thesis is
presented below.
1.4.1 Peer-reviewed Publications
Xavier JC, Machado D, Patil KR, Rocha I. Prediction of Minimal Metabolic Networks
With Diverse Manually Curated Data (in preparation).
Xavier JC, Patil KR, Rocha I. Essential And Ancestral Metabolic Functions In
Prokaryotes (in preparation).
Xavier JC, Patil KR, Rocha I. Integration of Biomass Formulations of Genome-scale
Metabolic Models with Experimental Data Reveals Universally Essential
Cofactors in Prokaryotes (submitted).
Xavier JC, Patil KR, Rocha I. Systems Biology Perspectives on Minimal and Simpler
Cells. Microbiology and Molecular Biology Reviews 2014, 78:487–509.
1.4.2 Conference Presentations
Xavier JC, Patil KR, Rocha I. Universally Essential Cofactors in Prokaryotes. Oral
presentation delivered at the IV Constraint-Based Reconstruction and Analysis
(COBRA) Conference, 2015. Heidelberg, Germany.
Xavier JC, Patil KR, Rocha I. Integration of biomass functions of genome-scale
metabolic models with experimental data reveals universally essential
cofactors in prokaryotes. Poster presentation delivered at the Metabolic
Pathways Analysis Conference, Biochemical Society, 2015. Braga, Portugal.
Xavier JC, Patil KR, Rocha I. Standardization and comparison of the biomass
objective functions of manually curated genome-scale metabolic models. Poster
presentation delivered at the III Constraint-Based Reconstruction and Analysis
(COBRA) Conference, 2014. Virginia, U.S.A.
28 | CHAPTER 1 General Introduction
Xavier JC, Patil KR, Rocha I. Systematic comparison of essential reactions in manually
curated genome scale metabolic models. Poster presentation delivered at the III
Copenhagen Biosciences Conferences, Cell Factories and Biosustainability, Novo
Nordisk Foundation, 2013. Hillerød, Denmark.
Xavier JC, Patil KR, Rocha I. Analysis of minimal metabolic networks through whole-
cell in silico modelling of prokaryotes. Poster presentation delivered at the XI
Jornadas de Bioinformatica, 2012. Barcelona, Spain.
1.4.3 Invited Talks
Xavier, JC. “From Bioengineering to Systems Biology and back: an insider’s
perspective”. 5th Symposium on Bioengineering, 2013. Porto, Portugal.
References
Åkesson M, Förster J, Nielsen J. 2004. Integration of gene expression data into
genome-scale metabolic models. Metab. Eng. 6(4):285–93
Artimo P, Jonnalagedda M, Arnold K, Baratin D, Csardi G, et al. 2012. ExPASy: SIB
bioinformatics resource portal. Nucleic Acids Res. 40(W1):597–603
Beard DA, Liang S, Qian H. 2002. Energy balance for analysis of complex metabolic
networks. Biophys. J. 83(1):79–86
Bernard C. 1864. Introduction à L’étude de La Médecine Expérimentale
Caspi R, Altman T, Billington R, Dreher K, Foerster H, et al. 2014. The MetaCyc
database of metabolic pathways and enzymes and the BioCyc collection of
Pathway/Genome Databases. Nucleic Acids Res. 42(Database issue):D459–71
Chang A, Schomburg I, Placzek S, Jeske L, Ulbrich M, et al. 2015. BRENDA in 2015:
exciting developments in its 25th year of existence. Nucleic Acids Res.
43(D1):D439–46
Durot M, Bourguignon P-Y, Schachter V. 2009. Genome-scale models of bacterial
metabolism: reconstruction and applications. FEMS Microbiol. Rev. 33(1):164–
90
Edwards JS, Ibarra RU, Palsson BØ. 2001. In silico predictions of Escherichia coli
metabolic capabilities are consistent with experimental data. Nat. Biotechnol.
19(2):125–30
Edwards JS, Palsson BØ. 1999. Systems properties of the Haemophilus influenzae Rd
CHAPTER 1 General Introduction | 29
metabolic genotype. J. Biol. Chem. 274(25):17410–16
Edwards JS, Palsson BØ. 2000. The Escherichia coli MG1655 in silico metabolic
genotype: its definition, characteristics, and capabilities. Proc. Natl. Acad. Sci. U.
S. A. 97(10):5528–33
Faria JP, Overbeek R, Xia F, Rocha M, Rocha I, Henry CS. 2014. Genome-scale
bacterial transcriptional regulatory networks: reconstruction and integrated
analysis with metabolic models. Brief. Bioinform. 15(4):592–611
Feist AM, Henry CS, Reed JL, Krummenacker M, Joyce AR, et al. 2007. A genome-scale
metabolic reconstruction for Escherichia coli K-12 MG1655 that accounts for
1260 ORFs and thermodynamic information. Mol. Syst. Biol. 3(121):121
Feist AM, Palsson BØ. 2010. The biomass objective function. Curr. Opin. Microbiol.
13(3):344–49
Fong SS, Burgard AP, Herring CD, Knight EM, Blattner FR, et al. 2005. In silico design
and adaptive evolution of Escherichia coli for production of lactic acid.
Biotechnol. Bioeng. 91(5):643–48
Gustin MC, Albertyn J, Alexander M, Davenport K. 1998. MAP kinase pathways in the
yeast Saccharomyces cerevisiae. Microbiol. Mol. Biol. Rev. 62(4):1264–1300
Hodgkin AL, Huxley AF. 1952. A quantitative description of membrane current and
its application to conduction and excitation in nerve. J. Physiol. 117(4):500–544
Hogeweg P. 2011. The roots of bioinformatics in theoretical biology. PLoS Comput.
Biol. 7(3):1–5
Ibarra RU, Edwards JS, Palsson BØ. 2002. Escherichia coli K-12 undergoes adaptive
evolution to achieve in silico predicted optimal growth. Nature 420:20–23
Joyce AR, Palsson BØ. 2006. The model organism as a system: integrating “omics”
data sets. Nat. Rev. Mol. Cell Biol. 7(3):198–210
Kanehisa M, Goto S, Sato Y, Kawashima M, Furumichi M, Tanabe M. 2014. Data,
information, knowledge and principle: back to metabolism in KEGG. Nucleic
Acids Res. 42(Database issue):D199–205
Kitano H. 2002. Systems biology: a brief overview. Science 295(5560):1662–64
Koonin E V. 2003. Comparative genomics, minimal gene-sets and the last universal
common ancestor. Nat. Rev. Microbiol. 1(2):127–36
Kuchaiev O, Milenkovic T, Memisevic V, Hayes W, Przulj N. 2010. Topological
network alignment uncovers biological function and phylogeny. J. R. Soc.
Interface. 7(50):1341–54
Lee KH, Park JH, Kim TY, Kim HU, Lee SY. 2007. Systems metabolic engineering of
30 | CHAPTER 1 General Introduction
Escherichia coli for L-threonine production. Mol. Syst. Biol. 3:149
Lee S, Lee D, Kim T, Kim B. 2005. Metabolic engineering of Escherichia coli for
enhanced production of succinic acid, based on genome comparison and in
silico gene knockout simulation. Appl. Enviromental Microbiol. 71(12):7880–87
Ma H-W, Zeng A-P. 2004. Phylogenetic comparison of metabolic capacities of
organisms at genome level. Mol. Phylogenet. Evol. 31(1):204–13
Machado D, Herrgård M. 2014. Systematic evaluation of methods for integration of
transcriptomic data into constraint-based models of metabolism. PLoS Comput.
Biol. 10(4):e1003580
Mahadevan R, Edwards JS, Doyle FJ. 2002. Dynamic flux balance analysis of diauxic
growth in Escherichia coli. Biophys. J. 83(3):1331–40
Mitchell P. 1961. Coupling of Phosphorylation to Electron and Hydrogen Transfer by
a Chemi-Osmotic type of Mechanism. Nature 191(4784):144–48
Monk J, Nogales J, Palsson BØ. 2014. Optimizing genome-scale network
reconstructions. Nat. Biotechnol. 32(5):447–52
Noble D. 1962. A modification of the Hodgkin-Huxley equations applicable to
Purkinje fibre action and pacemaker potentials. J. Physiol. 160(2):317–52
Noble D. 2008. Claude Bernard, the first systems biologist, and the future of
physiology. Exp. Physiol. 93(1):16–26
Oberhardt MA, Palsson BØ, Papin JA. 2009. Applications of genome-scale metabolic
reconstructions. Mol. Syst. Biol. 5:
Oh SJ, Joung J-G, Chang J-H, Zhang B-T. 2006. Construction of phylogenetic trees by
kernel-based comparative analysis of metabolic networks. BMC Bioinformatics.
7:284
Orth JD, Conrad TM, Na J, Lerman J a, Nam H, et al. 2011. A comprehensive genome-
scale reconstruction of Escherichia coli metabolism—2011. Mol. Syst. Biol.
7(535):1–9
Park JH, Lee KH, Kim TY, Lee SY. 2007. Metabolic engineering of Escherichia coli for
the production of L-valine based on transcriptome analysis and in silico gene
knockout simulation. Proc. Natl. Acad. Sci. U. S. A. 104(19):7797–7802
Reed JL, Vo TD, Schilling CH, Palsson BØ. 2003. An expanded genome-scale model of
Escherichia coli K-12 (iJR904 GSM/GPR). Genome Biol. 4(9):R54
Ruppin E, Papin J a, de Figueiredo LF, Schuster S. 2010. Metabolic reconstruction,
constraint-based analysis and game theory to probe genome-scale metabolic
networks. Curr. Opin. Biotechnol. 21(4):502–10
CHAPTER 1 General Introduction | 31
Saha R, Chowdhury A, Maranas CD. 2014. Recent advances in the reconstruction of
metabolic models and integration of omics data. Curr. Opin. Biotechnol. 29:39–
45
Varma A, Palsson BØ. 1993. Metabolic capabilities of Escherichia coli II. Optimal
Growth Patterns. J. Theor. Biol. 165(4):503–22
Westerhoff H V, Palsson BØ. 2004. The evolution of molecular biology into systems
biology. Nat. Biotechnol. 22(10):1249–52
Westerhoff H V, Winder C, Messiha H, Simeonidis E, Adamczyk M, et al. 2009.
Systems biology: the elements and principles of life. FEBS Lett. 583(24):3882–
90
Yamada T, Bork P. 2009. Evolution of biomolecular networks: lessons from
metabolic and protein interactions. Nat. Rev. Mol. Cell Biol. 10(11):791–803

33
CHAPTER 2
Systems Biology Perspectives on Minimal and
Simpler Cells
The true causes of natural effects and of the phenomena we observe are often so far from the
principles on which we can rely and the experiments we can make that one is obliged to be
content with probable reasons to explain them.
—ÉMILIE DU CHÂTELET, Institutions De Physique (1740)
The concept of minimal cell has fascinated scientists for a long time, from both
fundamental and applied points of view. This broad concept encompasses extreme
reductions of genomes, the last universal common ancestor (LUCA), the creation of
semi-artificial cells and the design of protocells and chassis cells. In this chapter,
with a focus on systems biology, these different areas of research are reviewed and
common and complementary aspects of each are identified. The classical top-down
and bottom-up approaches towards minimal cells are discussed together with the
so-called middle-out approach, with its innovative mathematical and computational
modeling contributions. The also-classical genomics view that emphasizes minimal
genomes, or rather minimal gene sets, is contrasted with the recent fundamentally
expanding views of the minimal gene set as a backbone of a more complex system -
the progress being made in understanding the system-wide properties at the level of
transcriptome, proteome and metabolome. Network modeling approaches are
enabling integration of these different omics datasets towards understanding the
complex molecular pathways connecting genotype to phenotype. The key concepts
central to the mapping and modeling of this complexity are reviewed, which are at
the heart of research on minimal cells. Finally, the distinction between minimizing
the number of cellular components and minimizing cellular complexity is discussed,
towards an improved understanding and utilization of minimal and simpler cells.
34 | CHAPTER 2 Systems Biology Perspectives on Minimal and Simpler Cells
The contents of this chapter were published in the following peer-reviewed article:
Xavier JC, Patil KR, Rocha I. 2014. Systems Biology Perspectives on Minimal and
Simpler Cells. Microbiol. Mol. Biol. Rev. 78:487–509.
CHAPTER 2 Systems Biology Perspectives on Minimal and Simpler Cells | 35
2.1 Introduction
As recognized in the beginning of the current era of molecular systems biology,
a cell could be as simple as we could define life in its simplest form (Szostak et al.
2001). Indeed, all known life forms have the cell as their basic unit. On the other
hand, the cell is the most complex structure known to man in the micrometer size
range (Fehér et al. 2007). Despite several achievements in identifying and
characterizing the molecular constituents of life, we are far from understanding how
these constituents interact with each other, giving rise to a robust and self-
replicating system. Also, there is not a widely accepted theory of how the first cells
arose on Earth or a complete synthesis from scratch of simpler living cells achieved
in the laboratory. Therefore, at present, the minimal cell can only be defined at a
semi-abstract level as a living cell with the minimal and sufficient number of
components (Henry et al. 2010) having three main features: i) some form of
metabolism to provide molecular building blocks and energy necessary for
synthesizing the cellular components; ii) genetic replication from a template or an
equivalent information processing and transfer machinery; and iii) a boundary
(membrane) that separates a cell from its environment. To this definition it could be
added the necessity of coordination between boundary fission and the full
segregation of the previously generated twin genetic templates. Another
fundamental characteristic that could be added to the essential features of a minimal
cell is the ability to evolve, which is a universal characteristic among all known living
cells (Umenhoffer et al. 2010).
From a physicochemical perspective, the minimal cell portrays the transition
from non-living to living matter, which can refer to the transition that occurred
during the origin of life that preceded the evolution of species on Earth, as well as
the transition that is expected to be attained in the laboratory with the creation of an
artificial living cell (Rasmussen et al. 2004). The result of the former transition,
usually called the last universal common ancestor (LUCA), universal common
ancestor, last common ancestor or cenancestor, roots the currently accepted tree of
life from which all life forms are supposed to have evolved (Doolittle 1999, Theobald
2010a). The hypothetical laboratory transition forms the basis of the concept of
36 | CHAPTER 2 Systems Biology Perspectives on Minimal and Simpler Cells
artificial cells: minimal cells fully created in the laboratory from known parts. It is
often difficult to separate the concept of artificial cell from that of semi-artificial cell
that is, to some degree, built from biogenic parts. The pioneering work by J. Craig
Venter’s team is perhaps the best example of a semi-artificial cell, having reported
the first functional cell with its genetic material being an artificial, in vitro
synthesized chromosome (Gibson et al. 2010).
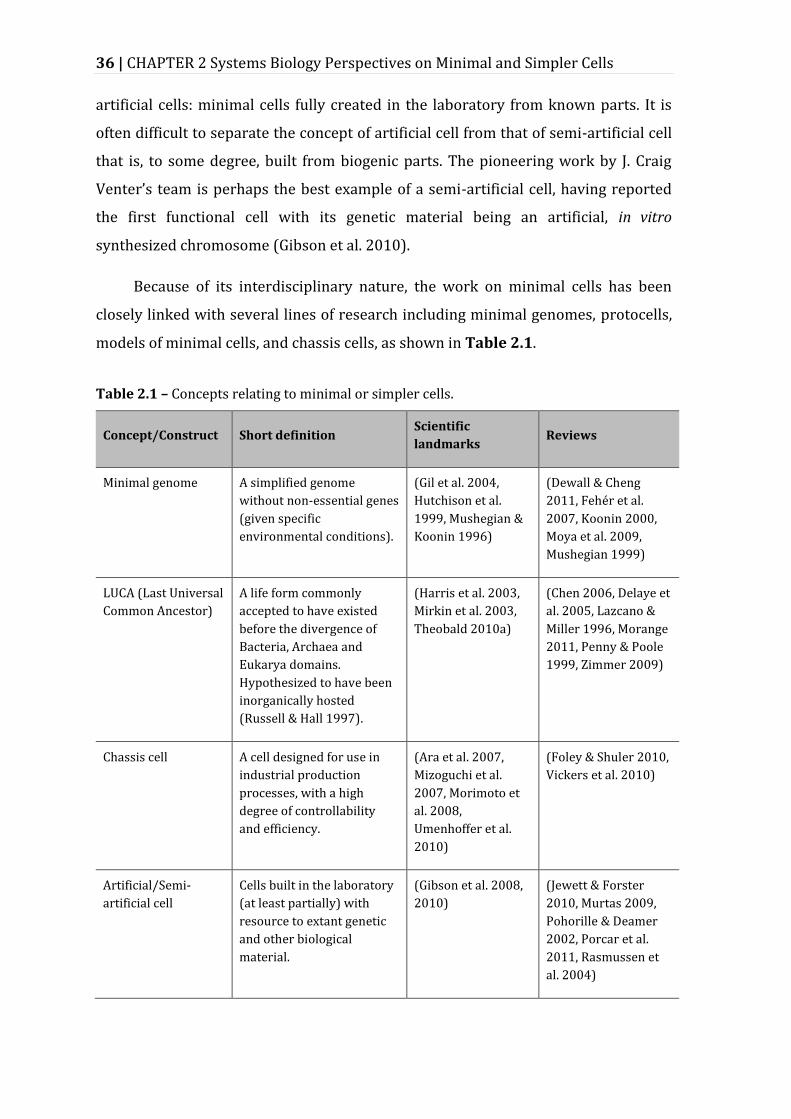
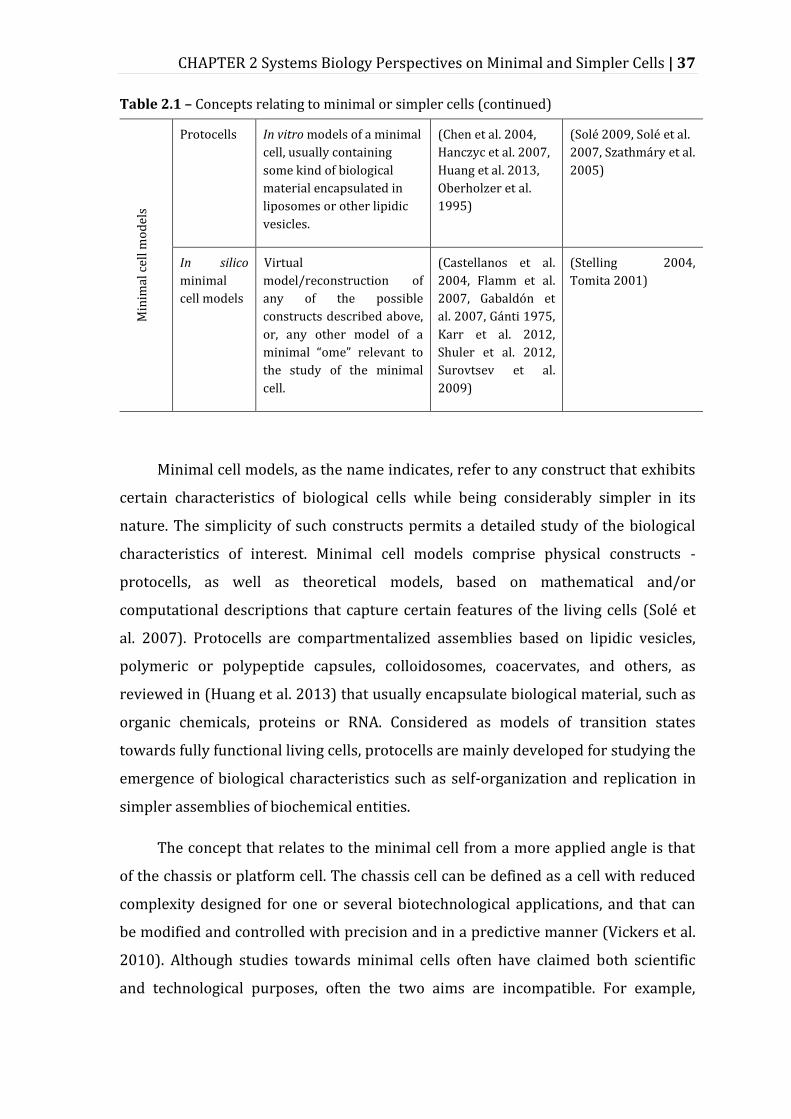
Because of its interdisciplinary nature, the work on minimal cells has been
closely linked with several lines of research including minimal genomes, protocells,
models of minimal cells, and chassis cells, as shown in Table 2.1.
Table 2.1 – Concepts relating to minimal or simpler cells.
Concept/Construct Short definition Scientific
landmarks Reviews
Minimal genome A simplified genome
without non-essential genes
(given specific
environmental conditions).
(Gil et al. 2004,
Hutchison et al.
1999, Mushegian &
Koonin 1996)
(Dewall & Cheng
2011, Fehér et al.
2007, Koonin 2000,
Moya et al. 2009,
Mushegian 1999)
LUCA (Last Universal
Common Ancestor)
A life form commonly
accepted to have existed
before the divergence of
Bacteria, Archaea and
Eukarya domains.
Hypothesized to have been
inorganically hosted
(Russell & Hall 1997).
(Harris et al. 2003,
Mirkin et al. 2003,
Theobald 2010a)
(Chen 2006, Delaye et
al. 2005, Lazcano &
Miller 1996, Morange
2011, Penny & Poole
1999, Zimmer 2009)
Chassis cell A cell designed for use in
industrial production
processes, with a high
degree of controllability
and efficiency.
(Ara et al. 2007,
Mizoguchi et al.
2007, Morimoto et
al. 2008,
Umenhoffer et al.
2010)
(Foley & Shuler 2010,
Vickers et al. 2010)
Artificial/Semi-
artificial cell
Cells built in the laboratory
(at least partially) with
resource to extant genetic
and other biological
material.
(Gibson et al. 2008,
2010)
(Jewett & Forster
2010, Murtas 2009,
Pohorille & Deamer
2002, Porcar et al.
2011, Rasmussen et
al. 2004)
CHAPTER 2 Systems Biology Perspectives on Minimal and Simpler Cells | 37
Table 2.1 – Concepts relating to minimal or simpler cells (continued)
Min
imal
cel
l mo
del
s Protocells In vitro models of a minimal
cell, usually containing
some kind of biological
material encapsulated in
liposomes or other lipidic
vesicles.
(Chen et al. 2004,
Hanczyc et al. 2007,
Huang et al. 2013,
Oberholzer et al.
1995)
(Solé 2009, Solé et al.
2007, Szathmáry et al.
2005)
In silico
minimal
cell models
Virtual
model/reconstruction of
any of the possible
constructs described above,
or, any other model of a
minimal “ome” relevant to
the study of the minimal
cell.
(Castellanos et al.
2004, Flamm et al.
2007, Gabaldón et
al. 2007, Gánti 1975,
Karr et al. 2012,
Shuler et al. 2012,
Surovtsev et al.
2009)
(Stelling 2004,
Tomita 2001)
Minimal cell models, as the name indicates, refer to any construct that exhibits
certain characteristics of biological cells while being considerably simpler in its
nature. The simplicity of such constructs permits a detailed study of the biological
characteristics of interest. Minimal cell models comprise physical constructs -
protocells, as well as theoretical models, based on mathematical and/or
computational descriptions that capture certain features of the living cells (Solé et
al. 2007). Protocells are compartmentalized assemblies based on lipidic vesicles,
polymeric or polypeptide capsules, colloidosomes, coacervates, and others, as
reviewed in (Huang et al. 2013) that usually encapsulate biological material, such as
organic chemicals, proteins or RNA. Considered as models of transition states
towards fully functional living cells, protocells are mainly developed for studying the
emergence of biological characteristics such as self-organization and replication in
simpler assemblies of biochemical entities.
The concept that relates to the minimal cell from a more applied angle is that
of the chassis or platform cell. The chassis cell can be defined as a cell with reduced
complexity designed for one or several biotechnological applications, and that can
be modified and controlled with precision and in a predictive manner (Vickers et al.
2010). Although studies towards minimal cells often have claimed both scientific
and technological purposes, often the two aims are incompatible. For example,
38 | CHAPTER 2 Systems Biology Perspectives on Minimal and Simpler Cells
bacterial cells that have evolved the smallest genomes in nature show slower and
less efficient metabolism with low division rates, features that are opposite to those
desired in a chassis cell (Foley & Shuler 2010, Vickers et al. 2010). Thus, the chassis
cell will need to achieve a trade-off between the simplicity or minimality needed for
predictive manipulations and the complexity needed for robustness and efficiency.
In this review, the various concepts and approaches related to the research on
minimal cells are further discussed from a systems biology perspective. The plural
terms ‘minimal cells’ and ‘simpler cells’ are preferred, as many configurations of
each seem to be possible, given the high functional redundancy observed in
biological networks.
2.1.1 A Systems Biology Perspective on Minimal Cells
Besides being the focus of fundamental and applied research for a long time,
minimal genomes have been quasi-synonymous of minimal cells since the
sequencing of Mycoplasma genitalium, in 1995 (Fraser et al. 1995). M. genitalium is
so far considered as the microbe with the smallest autonomously replicating
genome (~580 kb) that can be grown in laboratory cultures (Fraser et al. 1995).
Recently, the focus of the minimal cell research has been expanding beyond the
genome, as high-throughput technologies are enabling system-wide quantification of
other bio-molecules. These mainly include proteomics, lipidomics, metabolomics
and fluxomics. The exponential growth of different omic datasets and computational
models has been helping biologists to integrate those data and to predict the
behaviour of whole cells. The study of life, and consequently, of minimal cells is thus
facing a new paradigm, with systems biology starting to be accepted as an approach
that puts biology closer to the other natural sciences, by establishing laws and
making quantitative predictions (Westerhoff et al. 2009).
2.1.2 Minimal or Simpler Cells?
When discussing minimal cells there is frequently an association of two
different concepts. The first relates minimal cells with the smallest number of
components, implying cells with a small number of genes and expressed proteins.
CHAPTER 2 Systems Biology Perspectives on Minimal and Simpler Cells | 39
The second concept centers on the smallest complexity and connotes so-called
simpler cells, cells with a behavior easier to predict and easier to manipulate. While
the minimality in terms of the number of components is relatively straightforward
to measure with genome sequencing and other high-throughput technologies, the
quantification of complexity is yet to be tackled. For example, the number and
dynamics of the interactions between different bio-molecules can be regarded as
indicators of a cell’s complexity (Bonchev 2004). However, the technologies for
mapping bio-molecular interactions in a system-wide manner are yet to mature
(Bouveret & Brun 2012).
As the relationship between the number of components in a system and the
system’s complexity is often non-linear, the minimal cell may not necessarily be the
simplest cell. Therefore here the literature is reviewed concerning both concepts.
First, systems with a smaller number of components are reviewed – from the
minimal genome to the minimal proteomes and minimal nutritional requirements.
Next, the special cases of LUCA and chassis cells are analyzed. Following, different
systems level approaches towards minimal and simpler cell-constructs are explored,
namely Top-Down, Bottom-Up and the Middle-out/Integrative approach. The last
section discusses the importance of considering complexity in a holistic approach to
minimal cells and the contribution of systems biology to attaining this goal.
2.2 Towards the Smallest Number of
Components
Finding the smallest number of components required to constitute a living cell
is the classical approach to understand and create minimal cells. One of the
fundamental distinctions to be made here from the systems biology perspective is
between a minimal set of components and a minimal “ome”. This distinction was
introduced early in 1996, with the first comparative approach between two full
genomes (Mushegian & Koonin 1996). A (minimal) genome, proteome or another
ome, is the full, functional set of components within a (minimal) living cell – either
sequenced, enumerated or even not fully accessible yet as the case of the
40 | CHAPTER 2 Systems Biology Perspectives on Minimal and Simpler Cells
metabolome (van der Werf et al. 2007). On the other end of the spectrum, a
(minimal) set is theoretical, derived from comparative or analytical studies, and has
not been proved to be functional in a living cell.
2.2.1 Minimal Genome
As the genome was the first available “ome” in cell-level systems biology,
searching for the smallest functional genome represents most of the state of the art
in minimal cells. One comprehensive definition of minimal genome was given by
Koonin: “the smallest possible group of genes sufficient to sustain a functional
cellular life form under the most favourable conditions imaginable, that is the
presence of a full complement of essential nutrients and the absence of
environmental stress” (Koonin 2000). The phrase “most favourable conditions”
should be emphasized, which in practice indicates that one minimal cell may have
extremely complex nutritional requirements. The smallest prokaryotic genomes
sequenced to date belong to species not considered autonomously alive that, while
missing essential genes, became entirely dependent on much more complex hosts –
insects (McCutcheon et al. 2009a). “Candidatus Carsonella ruddii” has an impressive
160-kb genome (Nakabachi et al. 2006) and “Candidatus Hodgkinia cicadicola” an
even smaller one with 144 kb, which leaves scientists at the edge of considering
them organelles, as in the case of mitochondria and chloroplasts (Tamames et al.
2007). The genome of “Candidatus Carsonella ruddii” lacks genes involved in cell
envelope biogenesis and metabolism of nucleotides and lipids (Nakabachi et al.
2006) and also in DNA replication, transcription and translation, essential for any
bacterial cell to live autonomously (Tamames et al. 2007). However, achieving a
minimal genome implies that the microorganism containing it should be accessible
to current isolation and cultivation techniques without the aid of another living host,
as emphasized by Mushegian when defining a minimal genome as the “smallest
number of genetic elements sufficient to build a modern-type free-living cellular
organism” (Mushegian 1999). As mentioned above, the natural smallest genome
capable of autonomous growth or laboratory cultivation in pure culture and also in a
defined medium (Yus et al. 2009) is the one of M. genitalium with 580 kb (Fraser et
al. 1995).
CHAPTER 2 Systems Biology Perspectives on Minimal and Simpler Cells | 41
The first theoretical minimal gene-set was proposed by Mushegian and Koonin,
based on a system-wide comparison of Haemophilus influenzae and M. genitalium
genomes, consisting of 256 genes (Mushegian & Koonin 1996). Later one integrative
study utilized a larger dataset, including results from both experimental and
computational approaches to the minimal genome and predicting a set of 206 genes
for a theoretical minimal gene set (Gil et al. 2004). This minimal gene set included
genes for DNA replication, repair, restriction and modification; a basic transcription
machinery; aminoacyl-tRNA synthesis, tRNA maturation and modification;
ribosomal proteins, ribosome function, maturation and modification; translation
factors; RNA degradation; protein processing, folding and secretion; cellular
division; transport; and energetic and intermediary metabolism (glycolysis, proton
motive force generation, pentose phosphate pathway, lipid metabolism, biosynthesis
of nucleotides and cofactors). The authors did not include rRNA or tRNA genes, and
they recognized that the basic substrate transport machinery could not be clearly
defined, even though this minimal cell would rely highly on the import of several
substrates, including all the 20 amino acids (for which it had no biosynthetic ability).
Theoretical minimal gene sets will need to be tested in vivo to qualify as minimal
genomes. The technology to synthesize full genomes has been developed only very
recently and it has not yet been applied towards this goal (Gibson et al. 2010).
Determining a minimal gene-set is frequently associated with predicting which
genes are essential for a species. M. genitalium was the first to be analysed in a large
scale essentiality assay, with between 265 to 350 genes being identified as essential
(Hutchison et al. 1999). Proof of gene dispensability, however, requires isolation and
characterization of pure clonal populations, which was not done in this study. This
gap was later filled by the same team, which identified 382 essential genes; the
difference in the number of essential genes might have occurred not only due to
mutant complementation in the previous approach, but also due to different media
conditions (Glass et al. 2006). Several other prokaryotes were targets of genome-
wide essentiality studies, either for antibiotic design or antimicrobial control,
providing important datasets for benchmarking results. These include Acinetobacter
baylyi (de Berardinis et al. 2008), Caulobacter crescentus (Christen et al. 2011)
Francisella novicida (Gallagher et al. 2007), Haemophilus influenzae (de Berardinis et
42 | CHAPTER 2 Systems Biology Perspectives on Minimal and Simpler Cells
al. 2008) Helicobacter pylori (Salama et al. 2004) Salmonella enterica serovar
Typhimurium (Langridge et al. 2009) Staphylococcus aureus (Chaudhuri et al. 2009,
Forsyth et al. 2002) Neisseria meningitidis (Mendum et al. 2011) and Vibrio cholerae
(Cameron et al. 2008). Both DEG (Zhang & Lin 2009) and OGEE (Chen et al. 2012)
databases centralize much of these data.
Essential gene sets obtained by determining all viable single-knock-outs of a
species are always a subset of a possible minimal genome, due to synergistic effects.
In other words, these sets exclude genes that are not essential when deleted
individually, but which cause cell death when deleted simultaneously, also termed
synthetic lethals. Higher-structure chromosomal effects will also not be evident
when deleting genes individually, as reviewed in (Fehér et al. 2007). Also, essential
gene sets usually lack essential non-coding sequences that would be part of a
minimal genome, as essential promoter regions, tRNAs, small non-coding RNAs and
other non-coding sequences with unknown but essential function. A recent genome-
scale essentiality study identified and described 130 essential non-coding elements
of Caulobacter crescentus, including 90 intergenic segments of unknown function
(Christen et al. 2011).
It is now commonly accepted in the scientific community that multiple minimal
genomes can exist. Currently known prokaryotic genomes are complex and highly
adapted, exhibiting functionally equivalent components with different evolutionary
origins, named non-orthologous displacements (NODs). In order to reduce the
number of potential combinations, one rational direction is to identify a minimal
genome for a number of functional niches, or to determine which is the minimal
gene set for a thermophilic autotroph, a mesophilic heterotroph, among others
(Koonin 2000).
2.2.2 Other Minimal Sets of Components
The cell-level evaluation of components other than the genome includes
functional inferences from the genome at the protein level, directly generating
theoretical minimal proteomes by assuming a general translation from the genome.
Recently, this functional inference has allowed other omic approaches that analyse
CHAPTER 2 Systems Biology Perspectives on Minimal and Simpler Cells | 43
whole sets of specific genetic sequences. One example is the comparison of the
complete sets of tRNA isoacceptors (tRNomics) and tRNA/rRNA modification
enzymes (modomics) in all sequenced Mollicutes, a class of bacteria that lacks cell
wall and includes the genera Mycoplasma (de Crécy-Lagard et al. 2007). In this
study, it was shown that the organisms have developed different strategies to
minimize the RNA component of the translation apparatus. Even given a good
representation of the RNA modification enzymes in the genomes of these bacteria
(up to 6% in M. genitalium), only 9 enzymes were identified as more resistant to loss
in Mollicutes (de Crécy-Lagard et al. 2007). This finding indicates that even in
extremely reduced genomes, for the most basic processes of the cell, as translation
and codification, different strategies can be adopted.
Recently, the whole methylomes of M. genitalium and Mycoplasma pneumoniae
were analysed at a single-base resolution, suggesting a potential role for
methylation in regulating the cell cycle and gene expression in these reduced
bacteria (Lluch-Senar et al. 2013). On another study, the whole transcriptome of
Prochlorococcus MED4 - the smallest known photosynthetic organism considering
both genome and cell size – was analysed with a focus on the effects of the light cycle
(Zinser et al. 2009). It was found that 90% of the annotated genes of this species
were expressed in some condition, and 80% showed cyclic expression together with
the light-dark cycle, including genes involved in the cell cycle, photosynthesis and
phosphorus metabolism. While the measurements of the proteome and the
metabolome are not available for Prochlorococcus, transcriptomics allowed per se
the identification of specific metabolic transitions and possible regulatory proteins
for these minimal photosynthetic bacteria (Zinser et al. 2009).
Minimal protein sets have recently begun to be inferred by integrating
experimental data. This meant a step in moving from the functional inference from
minimal genomes toward a real assessment of minimal proteomes. Pioneer works
included the comparison of 17 prokaryotic genomes integrating a database of
experimentally determined unique peptides to define a core proteome (Callister et
al. 2008). The authors predicted 144 orthologs for the core genome, from which
~74% were actually expressed in all species. More than half of this core proteome
was related with protein synthesis, but strikingly, 10 proteins had not been
44 | CHAPTER 2 Systems Biology Perspectives on Minimal and Simpler Cells
functionally characterized. This study also identified differences in the proteomes
associated with the different lifestyles of the bacteria analysed, concluding that the
phenomenon of phenotypic plasticity has an impact on the minimal proteome, which
could not be accessed simply by comparing genomes (Callister et al. 2008). In
another work, the proteomes of Acholeplasma laidlawii and Mycoplasma
gallisepticum were analysed by 2D electrophoresis, matrix-assisted laser
desorption/ionization (MALDI) and liquid chromatography/mass spectrometry (LC-
MS) (Fisunov et al. 2011) and compared to the proteome of Mycoplasma mobile
obtained in another study (Jaffe et al. 2004). Clusters of Orthologous Genes (COGs)
were used to compare both genomes and proteomes of the three Mollicutes species
(Fisunov et al. 2011). 212 COGs were identified as part of the core proteome,
including DNA replication, DNA repair, transcription and translation and molecular
chaperones. Some metabolic pathways were also represented in this core proteome,
including glycolysis, the non-oxidative part of the pentose-phosphate pathway,
glycerophospholipid biosynthesis, and the synthesis of nucleoside triphosphates
(Fisunov et al. 2011). One surprising finding was the low conservation of proteins
related to cell division, as only two proteins were conserved in the core: FtsH and a
Smc-like protein. Strikingly, M mobile does not even contain FtsK or FtsZ in its
genome, which indicates that the essential process of cell division has greater
plasticity than other cellular systems (Fisunov et al. 2011). Building up on results of
another study of the interactome of M. pneumoniae (Kühner et al. 2009), the authors
concluded also that most COGs in the Mollicutes core proteome - 140 - are expected
to associate in protein complexes, and 54 COGs are predicted to participate in more
than one complex (Fisunov et al. 2011). Due to secondary functions of such
complexes as the maintenance of overall cellular stability (and particularly genome
stability) which could explain the maintenance of incomplete metabolic pathways in
reduced genomes, the authors propose that the concept of minimal genome would
be treated not as a set of essential functions but as a set of essential structures
(Fisunov et al. 2011).
Another system that can be analysed at the cell-level is the metabolic network
of an organism. Given that the whole metabolome is still not accessible due to
technological limitations, studies in this area are mainly computational. A minimal
CHAPTER 2 Systems Biology Perspectives on Minimal and Simpler Cells | 45
metabolic network of 50 enzymatic reactions was derived from the theoretically-
inferred minimal gene set of Gil et al. (Gil et al. 2004); it was shown that the encoded
metabolism was consistent and the network’s topological parameters were similar
to others of natural metabolic networks (Gabaldón et al. 2007). Another work
performed data-mining on the KEGG Pathways database, in an effort towards
obtaining a minimal anabolic network and the correspondent minimal metabolome
for a reductive chemoautotroph (Srinivasan & Morowitz 2009). The resulting
metabolic network comprised 287 metabolites, more than half being intermediates
in the biosynthesis of monomers.
Recently, a series of three papers reported a variety of analyses for M.
pneumoniae, a genome-reduced bacterium. These include the determination of the
proteome (Kühner et al. 2009), the transcriptome (Güell et al. 2009) and a metabolic
network that allowed the identification of a minimal medium that supported growth
of M. pneumoniae as well as of M. genitalium (Yus et al. 2009). This series was a
pioneering step forward in the integration of omes other than the genome in the
minimal cell panorama and also in using the power of a holistic, system-perspective
in the study of one single species.
The work on minimal omes other than the genome facilitates the analysis of
the impact of different environmental conditions in the minimal sets, mainly
through transcriptomics and expression proteomics (Callister et al. 2008). Also,
proteomics permits the insight into the spatial organization of minimal cells, by
analysing which protein complexes are assembled and which structural functions
these could have (Fisunov et al. 2011, Kühner et al. 2009). On the negative side,
environmental-dependent cell-level analyses are more prone to errors than genome
sequencing. The technology for expressional proteomics is still under development
and proteins with extreme physical and chemical properties, as low mass and high
hydrophobicity, including membrane-proteins, can be under-represented in these
assays (Chandramouli & Qian 2009). Moreover, some proteins might be dispensable
under optimal growth conditions and expressed only in specific stress conditions.
This will decrease the size of core transcriptome and proteome if the experimental
setup does not include sufficient diversity.
46 | CHAPTER 2 Systems Biology Perspectives on Minimal and Simpler Cells
2.2.3 Minimal Environmental Conditions for Life
Evolution enabled many alternative ecological niches and nutritional pathways
for prokaryotes, and there is no experimental or even conceptual support to the
existence of just one form of a minimal prokaryotic cell from a metabolic point of
view, as recognized by Szathmáry (Szathmáry 2005), Koonin (Koonin 2000) and Gil
et al (Gil et al. 2004). Many minimal metabolic networks adapted to different
habitats could sustain the universal genetic machinery – the translation and
transcription apparatus that are usually more conserved and similar among distant
prokaryotes. Depending on environmental conditions like temperature, pH and
salinity, and especially on the nutrients available in a specific niche, organisms could
differ substantially and still have a reduced number of genes. Here, an important
minimal set, almost absent in the scientific literature, comes to scene as a major
player in the study and design of minimal cells - the minimal, defined media able to
sustain such cells. The minimal medium is not a biological component per se, but it is
an emergent biological property that directly reflects the degree of dependency of
the cell on the environment.
Currently there are no comprehensive comparative studies about the different
minimal nutritional requirements of different prokaryotic organisms. However,
there is a variety of old studies that seem to have been relatively forgotten. A good
example is the extensive work started in the 50s by MacLeod and co-authors about
minimal nutritional requirements of marine bacteria (Macleod et al. 1954, Wong et
al. 1969). The authors explore and present several combinatorial possibilities for the
composition of defined media, mentioning special needs for amino acids as sole
carbon sources or as supplements in addition to non-amino acid sources of carbon
and energy, and also identifying special needs for ions, vitamins and other growth
factors (Macleod et al. 1954). Bryant and Robinson reviewed work on nutritional
requirements of ruminal bacteria and corroborated in their study the conclusions
that volatile fatty-acids are essential for the growth of several of these organisms, as
well as ammonium, which is required regardless of the amount of amino acids and
peptides present in the media (Bryant & Robinson 1962).
CHAPTER 2 Systems Biology Perspectives on Minimal and Simpler Cells | 47
The study of mutations leading to specific auxotrophies in bacteria started also
several decades ago, way before the DNA structure was discovered (Roepke et al.
1944). Fundamental for the identification of the different steps of metabolic
pathways, the classical study of auxotrophies is also central for the study of minimal
or simpler cells by identifying possible pathways for viability after gene inactivation.
Old studies on nutritional requirements also include the interesting finding
that minimal nutritional requirements increase with extreme temperatures for
strains of Lactobacillus arabinosus (Borek & Waelsch 1951), Escherichia coli (WARE
1951) and several strains of thermophilic Bacilli (Campbell & Williams 1953). This
implies that genome reductions starting from those species will have to take into
account the conditions the cells will face in artificial cultures.
Extensive nutritional requirements were predicted for the earlier theoretical
minimal gene sets, including all amino acids, nucleotides, fatty acids and complex
coenzymes (Mushegian & Koonin 1996). The size of a minimal medium is therefore
not a limiting factor when designing and deriving theoretical minimal cells, as long
as it does not require other living cells (it remains an axenic culture). However, it
certainly becomes a limitation for industrially-relevant chassis cells, which shall be
efficient and profitable (see section Chassis Cells). Both organisms most used in
minimal cell studies for biotechnological applications - E. coli and Bacillus subtilis -
are facultative anaerobes, highly versatile organisms with relatively simple nutrient
requirements (Clements et al. 2002). Indeed, E. coli has probably the simplest
growth requirements known so far: a medium composed of as little as seven
substances corresponding to eight components - Disodium Phosphate,
Monopotassium Phosphate, Sodium Chloride, Ammonium Chloride, Magnesium
Sulphate, Calcium Chloride and one carbon source - can sustain growth (Joyce et al.
2006). However, it should not be put aside that some trace metals are also
considered essential, although not added to the medium, as they are present in
sufficient amounts in water: copper (Rensing et al. 2000), nickel and cobalt (Bleriot
et al. 2011) molybdenum (McLuskey et al. 2003), iron (Semsey et al. 2006),
manganese (Jakubovics & Jenkinson 2001) and zinc (Lee et al. 2005). All these
components together make probably the simplest growth requirements known so
far for prokaryotes. An extensive review about nutritional requirements of
48 | CHAPTER 2 Systems Biology Perspectives on Minimal and Simpler Cells
microorganisms used in fermentation processes covers interesting points, as why
each of the principal elements is needed for cell’s physiology, the major
requirements (carbon, nitrogen, sulphur, trace elements, vitamins and other growth
factors) and also physicochemical constraints to growth, such as pH, ionic strength
and the effect of concentrations on growth rates (Kampen 1997).
Defining minimal media for minimal cells requires also a definition of a
minimal threshold of growth rates. Achieving a clear exponential phase might not be
a necessity for the fundamental pursuit of a minimal/simpler cell, while for
biotechnological applications minimalism will have to cope, in a more complex
trade-off, with a minimum yield in biomass and a minimum specific growth rate.
It is estimated that only approximately 1% of bacteria on Earth can be readily
cultivated in vitro (Vartoukian et al. 2010). With this lack of technological
capabilities regarding cultivation of prokaryotic cells, there is a great possibility that
simpler organisms with more complex requirements might go unnoticed. Organisms
that cannot be maintained in a Bacteriology Culture Collection, not even in the
richest media known, are commonly named Candidatus (Murray & Stackebrandt
1995). This is a useful term that is not completely implemented within the scientific
community. There are no reports of the cultivation of Buchnera aphidicola without
insect cells (Douglas et al. 2010, Gosalbes et al. 2008), however as this genus was
discovered before the implementation of this nomenclature and there is sufficient
biochemical information available about it, it is not named as Candidatus (Gil et al.
2002). While in many cases unknown nutritional requirements are the reason for
the impossibility of cultivating an organism in vitro, Candidatus species may also
require their host’s cells due to unknown physical constrains.
Until recently, M. genitalium was hard to grow in defined media and efforts
were made with genome-scale metabolic modelling to calculate the best
composition of such medium (Suthers et al. 2009a, Yus et al. 2009). Those system-
level approaches are certainly a promising direction in the field of estimating
prokaryotic minimal nutritional requirements.
CHAPTER 2 Systems Biology Perspectives on Minimal and Simpler Cells | 49
2.3 LUCA and the First Cells
Since the first proposal of the common ancestry theory, described by Charles
Darwin in his seminal book On the Origin of the Species by Means of Natural Selection
or the Preservation of Favoured Races in the Struggle for Life (Darwin 1859), much
has been debated and speculated about the origin of life, and the nature of a possible
cell or set of cells that had preceded the evolution of the three main lineages of the
life forms known today - Archaea, Bacteria and Eukarya. The strongest support for
this theory comes from the shared biological features of the three domains,
including double-stranded DNA to encode genetic information, transcription to RNA,
translation to proteins that are the universal operators of cellular functions, lipidic
membranes and primary metabolism, among others. Other evidence include the
high homologies of biological structures with different functions, indicating
divergent evolution from a common ancestor; the congruence of morphological and
molecular phylogenies; the agreement between phylogeny, the paleontological
record and biogeography; and the hierarchical classification of morphological
characteristics (Theobald 2010a).
A recent theoretical work (Koonin & Martin 2005) goes through the subject of
LUCA’s appearance, making a vital connection between the theory of an
inorganically hosted origin of cells (Russell & Hall 1997) and the origin of genomes.
The hypothesis of the inorganically hosted LUCA was first posed in 1997 by Russel
and Hall, with the premise that it was based on “what life does rather than what life
is” (Russell & Hall 1997). It was a detailed, complex description of 17 stages of
geochemical transformation in a submarine hydrothermal spring where iron
monosulfide bubbles were the hatcheries for the first cells. In a later publication,
Russel and Hall, together with Mellersh, developed significantly the geochemical
details of the theory, specifically on the implications of temperature and energetics
in the primitive origin of cells (Russell et al. 2003). In the same year, more
biochemistry was incorporated in the theory, including a comparison of the amino
acid sequences of the enzymes of glycolytic pathways in eukaryotes and prokaryotes
and a simplification of the visual model of the origin of life in hydrothermal vents
(Martin & Russell 2003). Claiming that the first free-living cells were eubacterial and
50 | CHAPTER 2 Systems Biology Perspectives on Minimal and Simpler Cells
archaebacterial chemoautotrophs that emerged more than 3.8 billion years ago from
inorganic compartments (Martin & Russell 2003), this is probably the most accepted
theory so far for the origin of life (Koonin & Martin 2005, Martin et al. 2008). The
geochemical conditions of early Earth and those of other planets in the solar system
where life might have originated are discussed comprehensively elsewhere (Nisbet
& Sleep 2001).
It has been proposed that the universal ancestor should have been a fully DNA
and protein-based organism with extensive processing of RNA transcripts, have had
an extensive set of proteins for DNA, RNA and protein synthesis, DNA repair,
recombination, control systems for regulation of genes and cell division, chaperone
proteins, and probably lacked operons (Penny & Poole 1999). There is however still
uncertainty in the literature on the question of LUCA’s genetic machinery having
been based majorly on RNA or DNA, and if it had DNA, how it was replicated
(Becerra et al. 1997, Poole & Logan 2005). By comparing sequences of proteins
involved in DNA replication, it has been proposed that LUCA had a genetic system
that contained both RNA and DNA, but the latter was, at the time, produced by
reverse transcription (Leipe et al. 1999).
Recently, the first formal tests of the LUCA hypothesis were performed by
Theobald, with a statistical evidence corroborating the monophyly of all known life
(Theobald 2010a). In his study, the author ignored the commonly assumed sequence
similarity as a proof of common ancestry, as sequence similarity can be a result of
convergent evolution due to selection, structural constraints on sequence identity,
mutation bias, chance, or artefact manufacture (Theobald 2010a). Although this was
the first formal attempt towards establishing the LUCA theory with a statistical
basis, others claim that the tests performed were not sufficient to reject the
alternative hypothesis of separate origins of life (Yonezawa & Hasegawa 2010).
Theobald replied with improvements of the models used for the formal test, and
emphasizing that his work did not provide an absolute proof for the theory of LUCA,
but mentioning several strong arguments in favour of it, as the low sequence
requirements for a specific fold and the enormity of the sequence space (Theobald
2010b). Although the alternative hypothesis of separate origins cannot be absolutely
ruled out (111, 112), a single common ancestry is currently the best-supported
CHAPTER 2 Systems Biology Perspectives on Minimal and Simpler Cells | 51
theory for the origin of life. Several extended perspectives and reviews have been
published focusing on the issue (Table 2.1), while the focus here is on systems
approaches concerning LUCA.
A prominent systems biology initiative concerning LUCA is the LUCApedia, a
recently-launched online database that integrates different datasets related with
LUCA and its predecessors (Goldman et al. 2013). With this database, users working
on the LUCA hypothesis have a tool to benchmark their results to other studies
predicting the characteristics of LUCA, searching by protein name or id in datasets of
COGs, protein domain folds, protein structures, cofactor usage, etc. (Goldman et al.
2013). Comparative studies make up the vast majority of the system-level
approaches to LUCA, including a focus on genome sequences (Kyrpides et al. 1999,
Mat et al. 2008), protein domains (Kim & Caetano-Anollés 2011, Wang et al. 2007,
Yang et al. 2005) and proteome hydrophobicity (Mannige et al. 2012). A
comprehensive review concerning comparative genomics and its role in defining
LUCA’s theoretical gene sets suggests 500-600 genes as an estimate of the genome
size of LUCA (Koonin 2003). The comparison of the protein folds of all three
domains of life found approximately 50 folds that are present in all three domains
(Yang et al. 2005), and one study that used the COGs database obtained 80 COGs
present in all organisms studied, across the three domains of life, 50 of which show
the same phylogenetic pattern as rRNA (which the authors called three-domain
genes) (Harris et al. 2003). From the 50 three-domain genes, 37 were associated
with the ribosome in modern cells (Harris et al. 2003). Another interesting study
looked at a large set of diverse predicted proteomes to infer on the evolution of
hydrophobicity (Mannige et al. 2012). Using the percentage of most hydrophobic
residues in proteins, an universal “oil escape” was observed, indicating that LUCA
was more hydrophobic than modern cells (Mannige et al. 2012).
One of the major problems when comparing whole genomes or proteomes in
order to infer about LUCA’s composition arises due to the relatively unknown
extents of horizontal gene transfer (HGT) and gene loss (Koonin 2003), which
generate phylogenetic trees not compatible with the rRNA phylogenetic tree
topology. Mirkin et al. analysed the extent of HGT using the COG database to
construct trees for all the COGs, finding an approximately equal likelihood for HGT
52 | CHAPTER 2 Systems Biology Perspectives on Minimal and Simpler Cells
and gene loss events in the evolution of prokaryotic genomes (Mirkin et al. 2003).
Although the authors state their intent was not to reconstruct the functional aspects
of LUCA but rather to make a preliminary attempt at constructing evolutionary
scenarios using comparative-genomics data, they support the plausibility of a set of
~572 genes to be sufficient to sustain a functioning LUCA (Mirkin et al. 2003). Even
though this and other studies have approached HGT events and gene losses within
the LUCA context (Mirkin et al. 2003, Pál et al. 2005), it is still relatively hard to
estimate the extent of the bias they cause in comparative approaches. There might
have been genes present in LUCA that were lost before all the major lineages
diverged, so when genomes are compared nowadays, those ancestral genes do not
appear in the common pool. Also, some genes may not have been present in LUCA
but, after originating, spread fast by HGT, being present nowadays in all
microorganisms known (Koonin 2003). The presence of de novo synthetic pathways
in some, but not all prokaryotes, may therefore leave some uncertainty about which
were the metabolic routes taken by the universal ancestor.
The transition from organic chemical compounds to cells is still an extremely
delicate subject in Biology (Morange 2011). The vast amount of data that modern
experimentalists face in a rapidly evolving technological scenario might be the
causing agent for a seemingly increasing distance between experimental approaches
and the theoretical work taking into account the geochemical context of early life.
This gap can be diminished with approaches becoming more holistic. The search for
LUCA’s minimal omes using evolutionary perspectives will undoubtedly contribute
to and benefit from the generic quest for the minimal cell, as the examples
mentioned above illustrate. The theory of the inorganically hosted origin of life
(Koonin & Martin 2005, Martin & Russell 2003) can shed light on the design of
membrane-free minimal cell systems. Similarly, the current discussion on the basis
of LUCA’s genetic machinery (Poole & Logan 2005) opens a possibility for minimal
cell design based solely on RNA genomes. Also, LUCA’s studies directly benefit from
those of minimal cells: while minimal gene-sets are theoretical and do not explicitly
incorporate evolution, comparative genomics is based on orthology and should
approximate the resulting minimal gene sets with those of ancestral life forms
(Koonin 2003).
CHAPTER 2 Systems Biology Perspectives on Minimal and Simpler Cells | 53
2.4 Chassis Cells
Probably the most proclaimed reason for the recent interest in minimal cells
and the related minimal datasets (e.g. the minimal genome and minimal metabolic
networks) has been the potential for biotechnological applications. When referring
to a minimal cell that is intentionally simplified for use in industry, the terms
platform cell or factory cell (Foley & Shuler 2010) or the term chassis cell (Vickers et
al. 2010) are preferred. This conceptual construct is of extreme importance for
biotechnology industries as it implies more specialized and more comprehensible
cells for bio-based production of industrial chemicals and pharmaceuticals.
Microbial cells have shown to be extremely profitable in many applications,
thanks to the catalytic power of enzymes and also the large panoply of products they
can synthesize. Nevertheless, these cell factories still remain, to a large extent, black
boxes that often surprise engineers. In industrial bioprocesses, as opposed to
scientific discovery, no surprises are desired and total control over a specially
designed and fully comprehensible chassis-cell is the ultimate goal. This fact has led
some to argue that a minimal cell would be directly interesting for industry, due to
its supposed simplicity; however, this is highly debatable as shown in Box 2.1,
where the predicted requisites of a chassis cell are enumerated, based on two
recent, comprehensive reviews (Foley & Shuler 2010, Vickers et al. 2010).
54 | CHAPTER 2 Systems Biology Perspectives on Minimal and Simpler Cells
Box 2.1 – Requirements for an industrially relevant chassis cell
Overall simplicity
Minimal number of carbon sinks and other non-optimal flux paths
Predictable metabolic and regulatory networks (more control over growth and
production)
Simplified translation code
Reduced genetic drift and limited evolvability
Robust mechanisms for genome replication, cytokinesis and coordination in
between
Robust cell membrane and cell wall that confers resistance to shear stress in
bioreactors
Efficient transcription, translation and regulation for optimization of cellular fluxes
to desired goals
Availability of predictive mathematical models that save expensive trial resources.
Process-specific modules for implementation of different industrial solutions
(particular for each process).
Other stress tolerance mechanisms, as
o Product tolerance
o High-substrate tolerance
o Tolerance to low O2
One of the facts that can be controversial when comparing industrially driven
to scientifically driven minimal cells is the necessity to evolve – some have argued
that, ideally, no mutation would occur on a chassis cell (Umenhoffer et al. 2010). A
recent study has proposed that evolvability is inevitable and can actually increase
without any pressure for adaptation in a population model, given that it is the result
of the exploration of the genetic space (Lehman & Stanley 2013). Evolution seems to
be an inextricable process from DNA replication and it can also be seen as necessary
to improve organisms through evolutionary engineering, which major achievements
have been reviewed elsewhere (Johannes & Zhao 2006, Lee et al. 2012). In
populations of chassis cells that maintain evolvability, optimized pathways and
enzymes and better growth rates could be selected for in desired media, either
complex or defined.
CHAPTER 2 Systems Biology Perspectives on Minimal and Simpler Cells | 55
A chassis cell needs to work on a combination of factors that bounce between
simplicity and complexity – precise control often requires simplicity, but energetic
and nutritional efficiencies and productivity mean complex pathways within
relatively large networks. Model organisms like E. coli and B. subtilis, which are well
studied and display robust growth, have been preferred as objects of genome-
reducing approaches for chassis cells (Ara et al. 2007, Mizoguchi et al. 2007, Pósfai
et al. 2006, Umenhoffer et al. 2010). When speaking about an industrial
biotechnology process, even the complexity of an eukaryote can be accepted as the
minimum simplicity, e.g. if the synthesis of eukaryotic proteins is desired (Giga-
Hama et al. 2007).
Several large projects of genome reduction of industrially relevant prokaryotes
have achieved satisfactory results so far. B. subtilis MGIM, based on a ~1Mbp
deletion from B. subtilis 168, showed little reduction in growth and comparable
enzyme productivity (Ara et al. 2007). B. subtilis MBG874 was achieved after a
depletion of 874 kb (20% of the original genome size), showing a reorganization of
the gene expression network and productivities of extracellular cellulase and
protease 1.7 and 2.5-fold higher than those of wild-type cells, respectively
(Morimoto et al. 2008). E. coli MGF-01 was obtained after successive deletions of
genomic fragments from E. coli K12 (a total deletion of about 1 Mbp or 22% of the
genome) and showed improved growth and higher threonine productivity when
compared to the wild-type strain (Mizoguchi et al. 2007, 2008). E. coli MDS42,
obtained after a 14.3% reduction of the genome of E. coli K12, showed genome
stabilization and high electroporation efficiency (Pósfai et al. 2006), reduced
evolvability (Umenhoffer et al. 2010) and later an 83% increase in L-threonine
production after metabolic engineering, comparing with an E. coli MG1655 strain
engineered with the same modifications (Lee et al. 2009).
Interesting modifications and bottlenecks to be tackled in biotechnological
production have been identified using genome-scale network reconstructions
(GENREs) (Oberhardt et al. 2009) and future designs of chassis cells might emerge
from these. Accurate sub-models of E. coli MG1655 have been derived for aerobic,
carbon-limited growth on a chemically defined medium with glucose, glycerol and
acetate as carbon sources (Taymaz-Nikerel et al. 2010). These models were created
56 | CHAPTER 2 Systems Biology Perspectives on Minimal and Simpler Cells
from subsets of reactions from the first E. coli GENRE (Reed et al. 2003) with the
biomass composition as a function of the growth rate (Taymaz-Nikerel et al. 2010).
Several other metabolic models have been developed and their applications
reviewed elsewhere (Oberhardt et al. 2009). However, when it comes to modelling
the dynamics of chassis cells in synthetic biology, the focus has been more on
modelling individual modules than whole chassis systems (Andrianantoandro et al.
2006).
It seems evident that for chassis-cell design, an integrative and pragmatic
approach is required (Box 2.1) along with the best understanding possible of the
model organisms to use. Between the widely used E. coli and the minimal organism
M. genitalium there are considerable differences that should be taken into account in
time-constrained industrial projects. Even though E. coli has ten times more protein
coding genes than M. genitalium¸ a search for the species names returns 276 times
more abstracts on Medline for the former. The Species Knowledge Index (SKI) is a
measure of the amount of scientific literature available for an organism, defined as
the number of abstracts on Medline referring to the species, normalized by the
number of genes in the genome (Janssen et al. 2005). The SKI index at the moment is
31 times larger for E. coli than for M. genitalium (Table 2.2). Although a larger
amount of scientific literature does not necessarily imply more knowledge, it is
certainly a good indication that more science exists for E. coli than for M. genitalium,
which will provide a more solid basis for future interventions in the former species.
However, it is not only the knowledge about the species that places E. coli as a more
promising starting point for the development of chassis cells. E. coli’s versatility and
network redundancy are interesting for industrial processes that often require back-
up and alternative metabolic routes in cases of enzyme saturation or the ability to
change between substrates. The two bacteria also differ strikingly in their doubling
time (Table 2.2), which is often a determinant factor in industrial processes. E. coli’s
fast doubling time has been shown to be related to post-transcriptional control of
protein abundances and post-translational control of flux rates (Valgepea et al.
2013). Studies with Mycoplasma smegmatis concluded that the organization of
regulatory operons involved in regulation of DNA replication and macromolecular
synthesis in mycobacteria is very different from the majority of other bacteria,
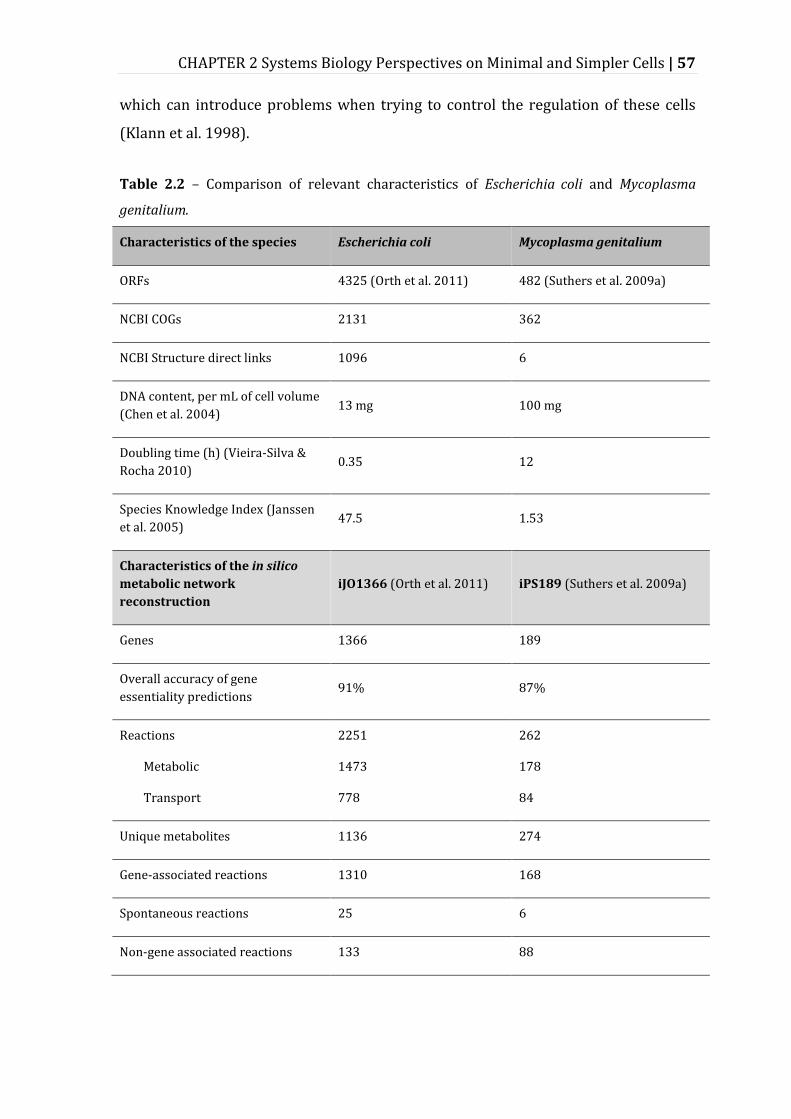
CHAPTER 2 Systems Biology Perspectives on Minimal and Simpler Cells | 57
which can introduce problems when trying to control the regulation of these cells
(Klann et al. 1998).
Table 2.2 – Comparison of relevant characteristics of Escherichia coli and Mycoplasma
genitalium.
Characteristics of the species Escherichia coli Mycoplasma genitalium
ORFs 4325 (Orth et al. 2011) 482 (Suthers et al. 2009a)
NCBI COGs 2131 362
NCBI Structure direct links 1096 6
DNA content, per mL of cell volume
(Chen et al. 2004) 13 mg 100 mg
Doubling time (h) (Vieira-Silva &
Rocha 2010) 0.35 12
Species Knowledge Index (Janssen
et al. 2005) 47.5 1.53
Characteristics of the in silico
metabolic network
reconstruction
iJO1366 (Orth et al. 2011) iPS189 (Suthers et al. 2009a)
Genes 1366 189
Overall accuracy of gene
essentiality predictions 91% 87%
Reactions
Metabolic
Transport
2251
1473
778
262
178
84
Unique metabolites 1136 274
Gene-associated reactions 1310 168
Spontaneous reactions 25 6
Non-gene associated reactions 133 88
58 | CHAPTER 2 Systems Biology Perspectives on Minimal and Simpler Cells
2.5 Systems’ Approaches for Understanding
and Creating Minimal Cells
The relevant systems biology approaches towards the construction or
definition of minimal cells can be divided into four broad categories. The first two
are the traditional approaches of any systems science or technology, namely Top-
down (analytic, deconstruction of systems) and Bottom-up (synthetic, construction
of systems), referred in many reviews of the field (Foley & Shuler 2010, Henry et al.
2010, Jewett & Forster 2010, Luisi 2002, Luisi et al. 2006, Moya et al. 2009,
Rasmussen et al. 2004, Stano 2011, Szathmáry 2005). Both of these classical
approaches have comprised mainly physical or experimental studies, in vivo in the
case of top-down or in vitro in the case of bottom-up. Here the Middle-out approach
is introduced, which includes large-scale data integration, modelling and
simulations, relevant to the study of minimal or simpler cells. Following Denis
Noble’s definition, the Middle-out approach considered here is the one that “starts at
any level [...] at which there are sufficient data and reaches (up, down and across)
towards other levels and components)” (Noble 2002). The fourth category is
occupied by system-level comparative studies, the first to be used at a system-level
towards minimal cells (Mushegian & Koonin 1996) – and probably still the most
used approach today in systems biology of minimal cells (Gupta et al. 2008, Koonin
2003).
Almost a decade ago Eörs Szathmáry highlighted the importance of bridging
the gap between both the bottom-up and top-down approaches, but also between
experimental and theoretical studies (Szathmáry 2005). In an attempt to organize
the sparse and diverse knowledge in the long pursuit of minimal life, the diversity of
relevant studies is reviewed, as depicted in Figure 2.1. The classification
“experimental” vs “theoretical/computational” is considered to be independent of
the 4 major categories presented above. In the following sections, there is also an
attempt to associate each approach with the technologies associated and the
disciplines it has majorly served, such as the association of the top-down approach
with molecular biology, and bottom-up with biophysics and biochemistry. This is a
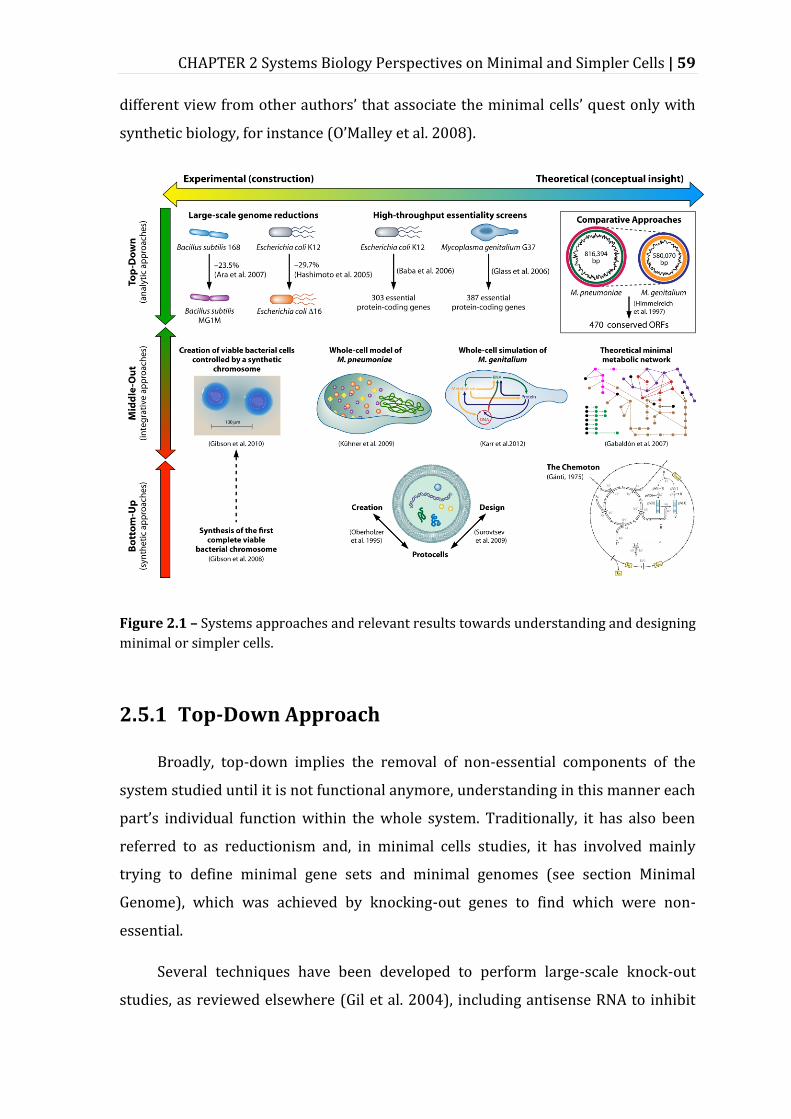
CHAPTER 2 Systems Biology Perspectives on Minimal and Simpler Cells | 59
different view from other authors’ that associate the minimal cells’ quest only with
synthetic biology, for instance (O’Malley et al. 2008).
Figure 2.1 – Systems approaches and relevant results towards understanding and designing
minimal or simpler cells.
2.5.1 Top-Down Approach
Broadly, top-down implies the removal of non-essential components of the
system studied until it is not functional anymore, understanding in this manner each
part’s individual function within the whole system. Traditionally, it has also been
referred to as reductionism and, in minimal cells studies, it has involved mainly
trying to define minimal gene sets and minimal genomes (see section Minimal
Genome), which was achieved by knocking-out genes to find which were non-
essential.
Several techniques have been developed to perform large-scale knock-out
studies, as reviewed elsewhere (Gil et al. 2004), including antisense RNA to inhibit
60 | CHAPTER 2 Systems Biology Perspectives on Minimal and Simpler Cells
gene expression, systematic inactivation of individual genes and massive transposon
mutagenesis strategies (the most widely used approach). The recent technological
capacity to study synthetic lethality at a genome-scale in E. coli, taking advantage of
conjugation of deletion or hypomorphic strains to create double mutants (Butland et
al. 2008), promises important datasets for the design of reduced strains. As
conjugation occurs in other bacteria, it is expected that it will be applied to other
organisms (Butland et al. 2008). Metabolic modelling has already been performed to
predict synthetic lethals for E. coli at a genome-scale, not only for pairs of genes, but
also triplets, some quadruples and higher-order lethal combinations (Suthers et al.
2009b).
Simultaneous deletions of large parts of the chromosome were done mainly for
model bacteria that are at the same time industrially relevant (see section Chassis
Cells). Reductions up to 29.7% of the genome of E. coli (Hashimoto et al. 2005) were
achieved using the red recombination system of phage lambda (Murphy 1998).
Another more recent large-scale deletion technique merged Tn5 transposon
mutagenesis with the Cre/loxP excision system and phage P1 transduction (Yu et al.
2002). This method has the advantage of not requiring the construction of genetic
vectors or performing complex PCR experiments for each deletion, but so far it only
reached a reduction of 7% of the genome of E. coli MG1655.
The reduction of genomes occurs naturally in specific habitats, where bacteria
adapt drastically to a specific niche, losing several unnecessary genes usually related
to the biosynthesis of amino acids and other essential metabolites they can uptake
from the stable niche. The natural top-down reduction of the genome of B. aphidicola
has been raising interest, as this bacterium kept the biosynthetic ability for most
amino acids that are provided to the insect host (van Ham et al. 2003). An innovative
study analysed the dynamics of natural genome reduction in Salmonella enterica, by
an experimental evolution procedure of serial passages (Nilsson et al. 2005). The
authors obtained deletions of up to 200 kb (approximately 4% of the WT genome),
and impressively, two of the large deletions isolated included several genes that
were previously identified as being individually essential for growth (Knuth et al.
2004). These results reinforce the need to perform single-deletion studies in
CHAPTER 2 Systems Biology Perspectives on Minimal and Simpler Cells | 61
different experimental conditions and ultimately, to conduct large-scale
simultaneous deletions when studying genome reduction.
Being based on existing natural genomes, top-down approaches can be limiting
for drawing universal conclusions about minimalism and simplicity. It has been
recognized that, as each study starts with a specific organism, it arrives at a specific
minimal gene set (Huynen 2000). Finally, it seems that simplifying existing genomes
will always lead to a complex cell with complex means of transcribing and
translating its genetic code, and there is a general discussion about if that is indeed
the simplest living system possible (Szathmáry 2005).
Table 2.3 enumerates the most relevant species used within the top-down or
analytic approach to obtain or understand minimized cells.
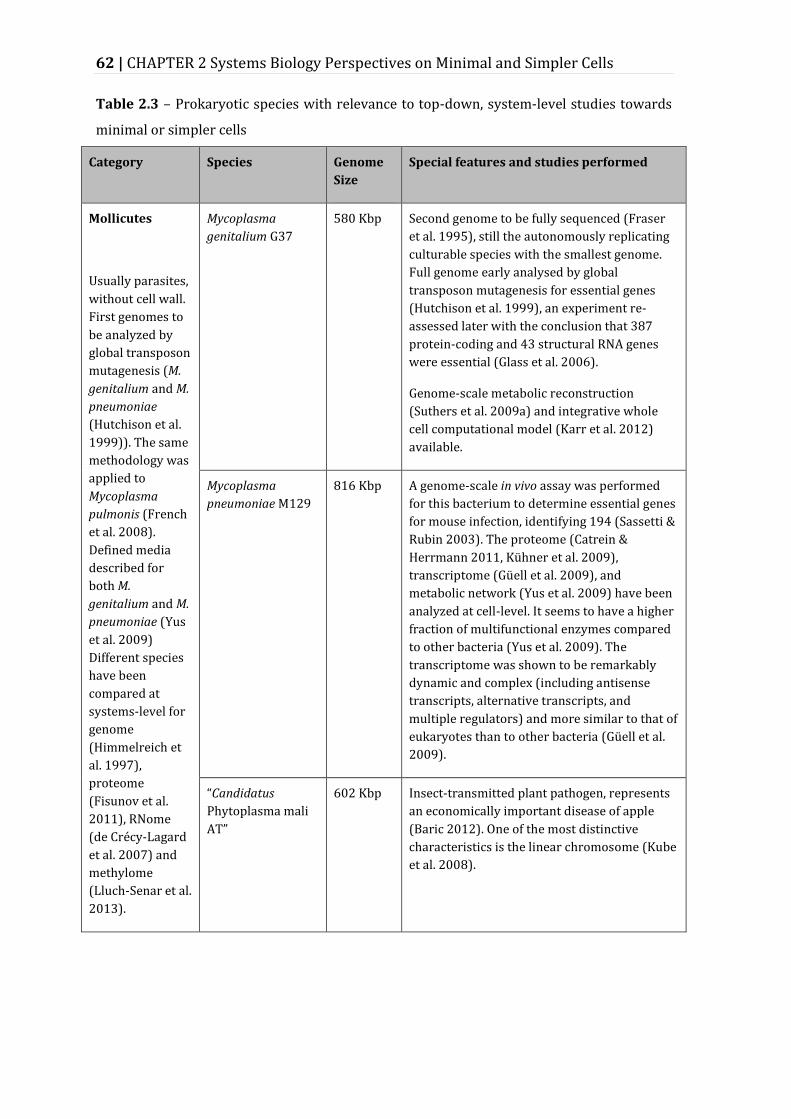
62 | CHAPTER 2 Systems Biology Perspectives on Minimal and Simpler Cells
Table 2.3 – Prokaryotic species with relevance to top-down, system-level studies towards
minimal or simpler cells
Category Species Genome
Size
Special features and studies performed
Mollicutes
Usually parasites,
without cell wall.
First genomes to
be analyzed by
global transposon
mutagenesis (M.
genitalium and M.
pneumoniae
(Hutchison et al.
1999)). The same
methodology was
applied to
Mycoplasma
pulmonis (French
et al. 2008).
Defined media
described for
both M.
genitalium and M.
pneumoniae (Yus
et al. 2009)
Different species
have been
compared at
systems-level for
genome
(Himmelreich et
al. 1997),
proteome
(Fisunov et al.
2011), RNome
(de Crécy-Lagard
et al. 2007) and
methylome
(Lluch-Senar et al.
2013).
Mycoplasma
genitalium G37
580 Kbp Second genome to be fully sequenced (Fraser
et al. 1995), still the autonomously replicating
culturable species with the smallest genome.
Full genome early analysed by global
transposon mutagenesis for essential genes
(Hutchison et al. 1999), an experiment re-
assessed later with the conclusion that 387
protein-coding and 43 structural RNA genes
were essential (Glass et al. 2006).
Genome-scale metabolic reconstruction
(Suthers et al. 2009a) and integrative whole
cell computational model (Karr et al. 2012)
available.
Mycoplasma
pneumoniae M129
816 Kbp A genome-scale in vivo assay was performed
for this bacterium to determine essential genes
for mouse infection, identifying 194 (Sassetti &
Rubin 2003). The proteome (Catrein &
Herrmann 2011, Kühner et al. 2009),
transcriptome (Güell et al. 2009), and
metabolic network (Yus et al. 2009) have been
analyzed at cell-level. It seems to have a higher
fraction of multifunctional enzymes compared
to other bacteria (Yus et al. 2009). The
transcriptome was shown to be remarkably
dynamic and complex (including antisense
transcripts, alternative transcripts, and
multiple regulators) and more similar to that of
eukaryotes than to other bacteria (Güell et al.
2009).
“Candidatus
Phytoplasma mali
AT”
602 Kbp Insect-transmitted plant pathogen, represents
an economically important disease of apple
(Baric 2012). One of the most distinctive
characteristics is the linear chromosome (Kube
et al. 2008).
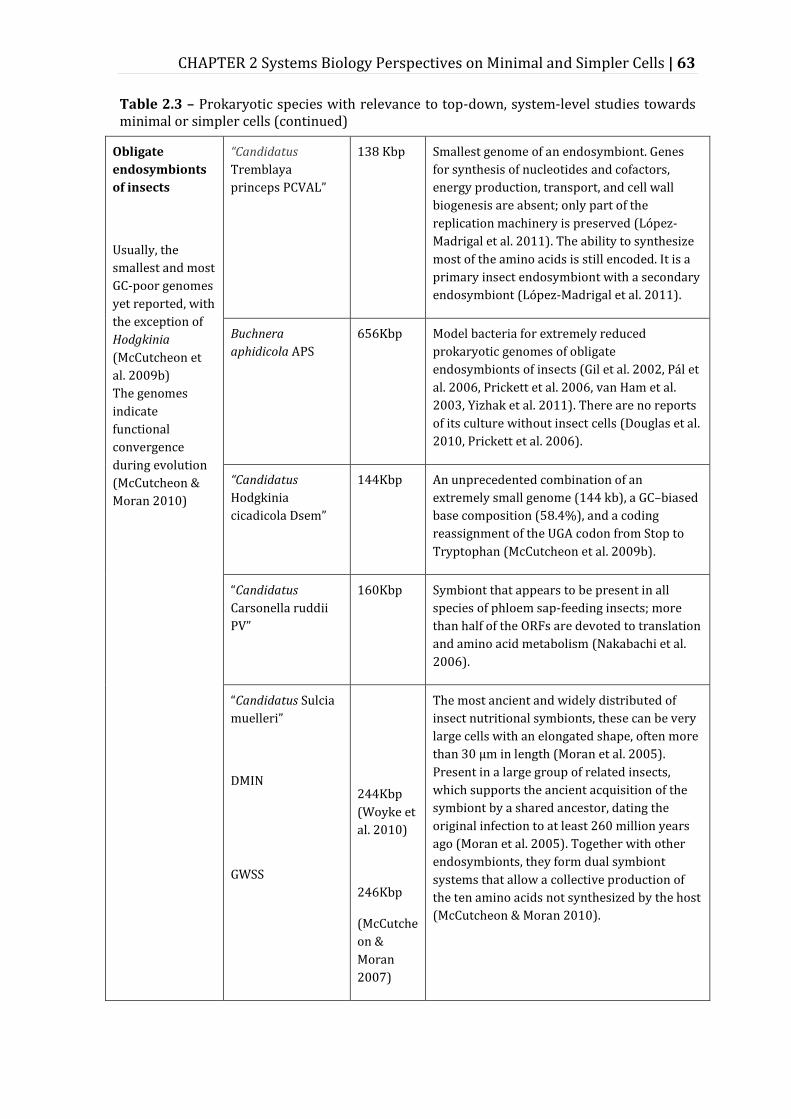
CHAPTER 2 Systems Biology Perspectives on Minimal and Simpler Cells | 63
Table 2.3 – Prokaryotic species with relevance to top-down, system-level studies towards minimal or simpler cells (continued)
Obligate
endosymbionts
of insects
Usually, the
smallest and most
GC-poor genomes
yet reported, with
the exception of
Hodgkinia
(McCutcheon et
al. 2009b)
The genomes
indicate
functional
convergence
during evolution
(McCutcheon &
Moran 2010)
“Candidatus
Tremblaya
princeps PCVAL”
138 Kbp Smallest genome of an endosymbiont. Genes
for synthesis of nucleotides and cofactors,
energy production, transport, and cell wall
biogenesis are absent; only part of the
replication machinery is preserved (López-
Madrigal et al. 2011). The ability to synthesize
most of the amino acids is still encoded. It is a
primary insect endosymbiont with a secondary
endosymbiont (López-Madrigal et al. 2011).
Buchnera
aphidicola APS
656Kbp Model bacteria for extremely reduced
prokaryotic genomes of obligate
endosymbionts of insects (Gil et al. 2002, Pál et
al. 2006, Prickett et al. 2006, van Ham et al.
2003, Yizhak et al. 2011). There are no reports
of its culture without insect cells (Douglas et al.
2010, Prickett et al. 2006).
“Candidatus
Hodgkinia
cicadicola Dsem”
144Kbp An unprecedented combination of an
extremely small genome (144 kb), a GC–biased
base composition (58.4%), and a coding
reassignment of the UGA codon from Stop to
Tryptophan (McCutcheon et al. 2009b).
“Candidatus
Carsonella ruddii
PV”
160Kbp Symbiont that appears to be present in all
species of phloem sap-feeding insects; more
than half of the ORFs are devoted to translation
and amino acid metabolism (Nakabachi et al.
2006).
“Candidatus Sulcia
muelleri”
DMIN
GWSS
244Kbp
(Woyke et
al. 2010)
246Kbp
(McCutche
on &
Moran
2007)
The most ancient and widely distributed of
insect nutritional symbionts, these can be very
large cells with an elongated shape, often more
than 30 µm in length (Moran et al. 2005).
Present in a large group of related insects,
which supports the ancient acquisition of the
symbiont by a shared ancestor, dating the
original infection to at least 260 million years
ago (Moran et al. 2005). Together with other
endosymbionts, they form dual symbiont
systems that allow a collective production of
the ten amino acids not synthesized by the host
(McCutcheon & Moran 2010).
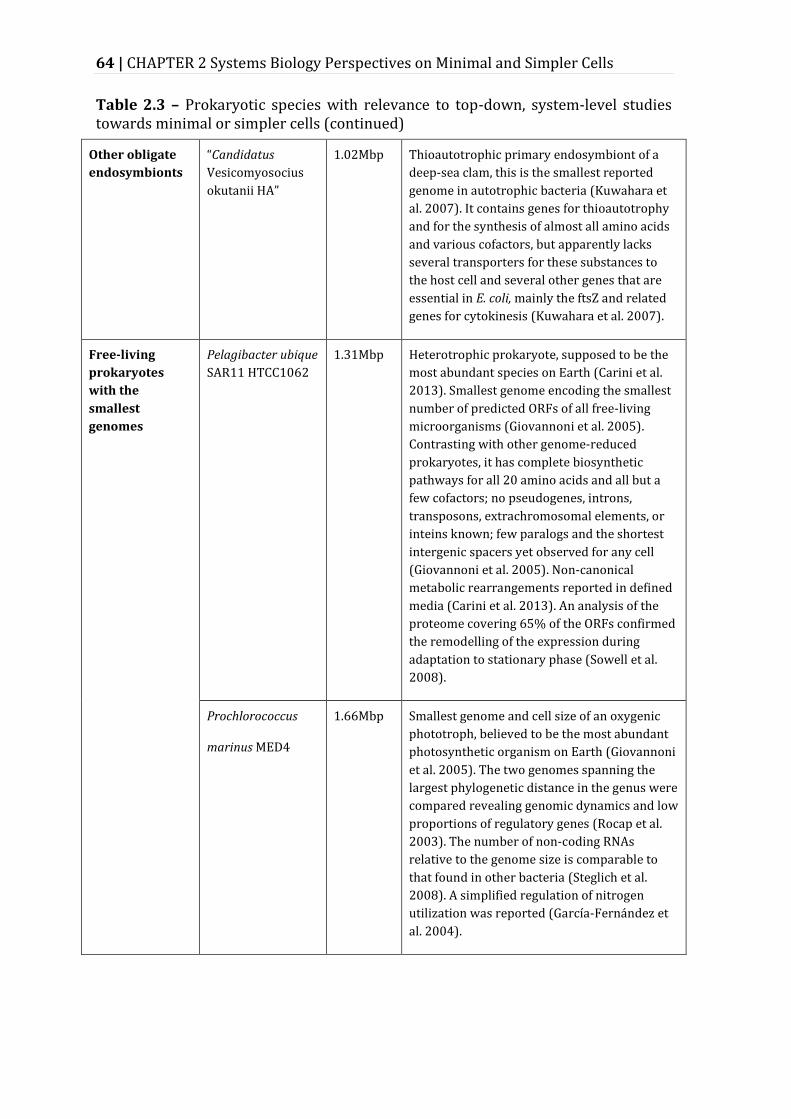
64 | CHAPTER 2 Systems Biology Perspectives on Minimal and Simpler Cells
Table 2.3 – Prokaryotic species with relevance to top-down, system-level studies towards minimal or simpler cells (continued)
Other obligate
endosymbionts
“Candidatus
Vesicomyosocius
okutanii HA”
1.02Mbp Thioautotrophic primary endosymbiont of a
deep-sea clam, this is the smallest reported
genome in autotrophic bacteria (Kuwahara et
al. 2007). It contains genes for thioautotrophy
and for the synthesis of almost all amino acids
and various cofactors, but apparently lacks
several transporters for these substances to
the host cell and several other genes that are
essential in E. coli, mainly the ftsZ and related
genes for cytokinesis (Kuwahara et al. 2007).
Free-living
prokaryotes
with the
smallest
genomes
Pelagibacter ubique
SAR11 HTCC1062
1.31Mbp Heterotrophic prokaryote, supposed to be the
most abundant species on Earth (Carini et al.
2013). Smallest genome encoding the smallest
number of predicted ORFs of all free-living
microorganisms (Giovannoni et al. 2005).
Contrasting with other genome-reduced
prokaryotes, it has complete biosynthetic
pathways for all 20 amino acids and all but a
few cofactors; no pseudogenes, introns,
transposons, extrachromosomal elements, or
inteins known; few paralogs and the shortest
intergenic spacers yet observed for any cell
(Giovannoni et al. 2005). Non-canonical
metabolic rearrangements reported in defined
media (Carini et al. 2013). An analysis of the
proteome covering 65% of the ORFs confirmed
the remodelling of the expression during
adaptation to stationary phase (Sowell et al.
2008).
Prochlorococcus
marinus MED4
1.66Mbp Smallest genome and cell size of an oxygenic
phototroph, believed to be the most abundant
photosynthetic organism on Earth (Giovannoni
et al. 2005). The two genomes spanning the
largest phylogenetic distance in the genus were
compared revealing genomic dynamics and low
proportions of regulatory genes (Rocap et al.
2003). The number of non-coding RNAs
relative to the genome size is comparable to
that found in other bacteria (Steglich et al.
2008). A simplified regulation of nitrogen
utilization was reported (García-Fernández et
al. 2004).
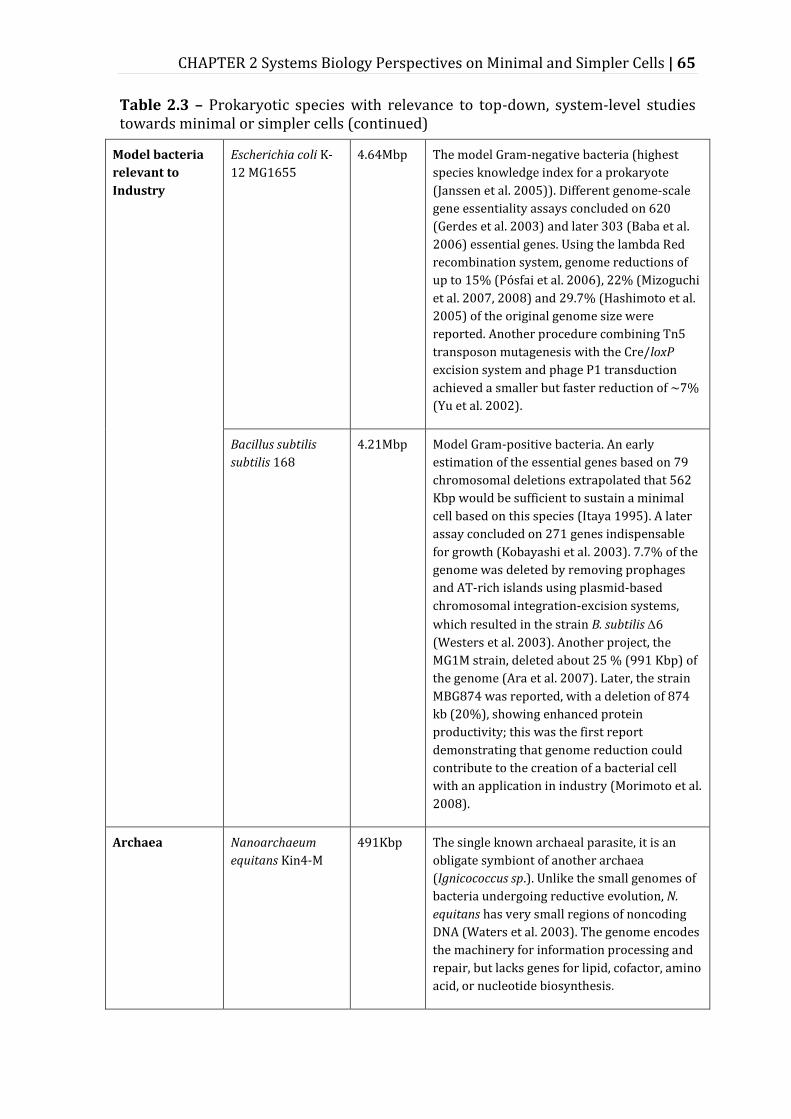
CHAPTER 2 Systems Biology Perspectives on Minimal and Simpler Cells | 65
Table 2.3 – Prokaryotic species with relevance to top-down, system-level studies towards minimal or simpler cells (continued)
Model bacteria
relevant to
Industry
Escherichia coli K-
12 MG1655
4.64Mbp The model Gram-negative bacteria (highest
species knowledge index for a prokaryote
(Janssen et al. 2005)). Different genome-scale
gene essentiality assays concluded on 620
(Gerdes et al. 2003) and later 303 (Baba et al.
2006) essential genes. Using the lambda Red
recombination system, genome reductions of
up to 15% (Pósfai et al. 2006), 22% (Mizoguchi
et al. 2007, 2008) and 29.7% (Hashimoto et al.
2005) of the original genome size were
reported. Another procedure combining Tn5
transposon mutagenesis with the Cre/loxP
excision system and phage P1 transduction
achieved a smaller but faster reduction of ~7%
(Yu et al. 2002).
Bacillus subtilis
subtilis 168
4.21Mbp Model Gram-positive bacteria. An early
estimation of the essential genes based on 79
chromosomal deletions extrapolated that 562
Kbp would be sufficient to sustain a minimal
cell based on this species (Itaya 1995). A later
assay concluded on 271 genes indispensable
for growth (Kobayashi et al. 2003). 7.7% of the
genome was deleted by removing prophages
and AT-rich islands using plasmid-based
chromosomal integration-excision systems,
which resulted in the strain B. subtilis 6
(Westers et al. 2003). Another project, the
MG1M strain, deleted about 25 % (991 Kbp) of
the genome (Ara et al. 2007). Later, the strain
MBG874 was reported, with a deletion of 874
kb (20%), showing enhanced protein
productivity; this was the first report
demonstrating that genome reduction could
contribute to the creation of a bacterial cell
with an application in industry (Morimoto et al.
2008).
Archaea Nanoarchaeum
equitans Kin4-M
491Kbp The single known archaeal parasite, it is an
obligate symbiont of another archaea
(Ignicococcus sp.). Unlike the small genomes of
bacteria undergoing reductive evolution, N.
equitans has very small regions of noncoding
DNA (Waters et al. 2003). The genome encodes
the machinery for information processing and
repair, but lacks genes for lipid, cofactor, amino
acid, or nucleotide biosynthesis.
66 | CHAPTER 2 Systems Biology Perspectives on Minimal and Simpler Cells
2.5.2 Comparative Approach
Comparative approaches applied to the minimal cell have been mainly those of
comparative genomics, involving whole genomes and inferred proteomes. Usually,
conserved genes have a higher probability of not only being essential (and therefore
part of a possible minimal genome) but also ancient (possibly part of LUCA’s
genome). The best-known of these genes is the 16S rRNA, traditionally used for
phylogeny. Comparative studies serve in this manner mainly Evolutionary Biology
and the quest for LUCA’s constitution (Delaye et al. 2005).
The referred early comparison of the genomes of M. genitalium and
Haemophilus influenzae was the first system-level comparative approach towards a
minimal genome (Mushegian & Koonin 1996). Although only 240 genes were
conserved between both genomes, 22 cases of NODs were identified. Depending on
the conceptual or practical cellular construct being pursued, choosing the simplest,
most ancient or most economic protein when facing a NOD will be crucial in the
search for a minimal cell. An analysis of possible functional redundancy and
presence of parasite-specific genes in this study resulted in a final set of 256 as the
hypothetical gene number capable of sustaining a cell (Mushegian & Koonin 1996).
A new wave of comparative studies integrates proteogenomics to validate
genetic conservation, using high-throughput tandem mass spectrometry to verify
the expression of predicted conserved coding regions (Ansong et al. 2008). Firstly
used by Gupta et al. to compare the expression of orthologous genes across three
Shewanella species (Gupta et al. 2008), not much later comparative proteogenomics
was used in the referred quest for the core proteome of a minimal cell (Fisunov et al.
2011) (see Section Other Minimal Sets of Components).
Computational comparative proteomic approaches can be performed
outpacing sequence comparison. One example includes the annotations of curated
domain structures, which has been done in a referred phylogenomic study with 420
free-living organisms trying to define the proteomic content of LUCA (Kim &
Caetano-Anollés 2011). Others have compared protein folds across Bacteria and
Archaea, indicating a possible set of top 30 most conserved folds (Wolf et al. 1999).
CHAPTER 2 Systems Biology Perspectives on Minimal and Simpler Cells | 67
When jumping from comparing genomes to comparing proteomes,
transcriptomes or fluxomes, experimental conditions are an additional but
indispensable layer of information. The results in these cases are influenced by the
media and conditions provided to the cells, which must be kept constant to allow for
comparative studies to be performed. The comparison of several omic datasets is
highly promising, although it can be a challenging task, as many of the studies
available in the literature were not done under the same experimental conditions.
Even the same complex media can have small variations that will impair
comparisons (Pavankumar et al. 2012) so ultimately defined media should be
preferred for comparative analysis. This will require the generation of new,
controlled, experimental data for future comparative studies.
Not only omic-level comparisons (arriving at a minimal set) can be relevant for
the study of a minimal cell, but also the organelle-level can be targeted for relevant
comparisons. The comparison of the sequences of modern ribosomes identified the
most conserved regions from the three domains of life, which were then mapped
onto determined structures of 30S and 50S subunits of ribosomes (Mears et al.
2002).
In silico system-level comparative studies include the comparison of biological
networks using graph-theory based algorithms to perform topology-based-only
comparison of biological networks (protein-protein or metabolic) at a global scale
(Kuchaiev et al. 2010).
Arriving at minimal theoretical sets through comparative and top-down
approaches is not sufficient to achieve minimal cells. After the 1000th prokaryotic
genome was made available, the striking discovery that not one single protein-
coding gene is conserved across all prokaryotic genomes shocked biologists
(Lagesen et al. 2010). Moreover, if Archaea are excluded, only two protein-coding
genes – a translation-elongation factor and a ribosomal protein – plus the two rRNA
genes are conserved across all Bacteria (Lagesen et al. 2010). These facts imply that
systematic comparative approaches will gain from focusing on functional differences
at other levels than the genome. Ultimately, by recognizing that the comparative and
top-down approaches are insufficient to reduce complexity to the level of a full
68 | CHAPTER 2 Systems Biology Perspectives on Minimal and Simpler Cells
comprehension of the cell, one would build or synthesize that minimal cell from its
parts. That is what the bottom-up approach intends to achieve.
2.5.3 Bottom-Up Approach
The bottom-up – synthetic – approach is the one aimed at assembling a
minimal or simpler cell in the laboratory, i.e., constructing minimal cells from non-
living material (Rasmussen et al. 2004). Bottom-up studies have concerned mainly
physical and chemical properties and the dynamics of the building blocks of life.
Focus has been placed on inserting genetic material (RNA or DNA) or enzymes
inside lipidic vesicles, creating what is often named as protocells (see section 2.1).
Properties such as stability, permeability and self-reproduction, together with the
dynamics of eventual biochemical reactions can be studied in these constructs (for a
detailed compilation of the work of biophysics in this area, see (Luisi et al. 2006,
Stano 2011)). More complex biological properties can also be analysed in protocells.
For example, in a pioneer study it was shown that Darwinian competition emerges
in populations of vesicles with encapsulated genetic material (Chen et al. 2004). The
competition arose simply due to the physical principle of osmotic-driven vesicle
growth. Others studied enzymatic RNA replication (Oberholzer et al. 1995) and the
movement of vesicles resembling bacterial chemotaxis (Hanczyc et al. 2007) based
on different protocells assembled in those studies.
Solé et al. (Solé et al. 2007) make a distinction between the major
achievements in bottom up studies that would lead to building completely artificial
cells, and those of reconstruction studies (Luisi et al. 2006) which use components
from biological origin to produce what is here named as semi-artificial cells.
One innovative bottom-up project involves the idea of creating a minimal cell
based on purified proteins. The authors intend to identify the necessary genes for a
minimal cell, and after preparation of the purified biochemical molecules, to
encapsulate those within membranes, possibly rendering an artificial cell (Forster &
Church 2006, Jewett & Forster 2010). Another system of the kind is Cytomin, a cell
free translation system that has revealed promising results in protein synthesis and
energy efficiency (Jewett & Swartz 2004, Jewett et al. 2008).
CHAPTER 2 Systems Biology Perspectives on Minimal and Simpler Cells | 69
Probably the major landmark that should also be included in the bottom-up
approaches is the synthesis of the first artificial bacterial chromosome (Gibson et al.
2008). Although it is not the creation of a cell per se, it established the technology for
the creation of the code for an entire cell. Nevertheless, although the creation and
assembly of fully-artificial cells is one of the ultimate goals of bioengineering and
would help understanding biosystems deeper, it seems part of science fiction, for
now.
It might appear that bottom-up starts from a privileged position to the study of
LUCA and prebiotic chemistry compared with the top-down approach, as the
creation of artificial cells in the laboratory and the creation of ancestor cells in
nature both constitute transitions from non-living to living entities (Rasmussen et al.
2004). However, the connection between both areas of research should be handled
with care (Rasmussen et al. 2004, Szostak et al. 2001). While fully tracking the
history of life until its origins could, in principle, allow the replication of the process
in the laboratory, the opposite cannot be assumed. Any artificial cell to be created in
the laboratory based on modern genes, modern proteins and modern membranes
can be far from resembling what LUCA was. It has been argued that the origin of
genetic and enzymatic machineries must have happened within some inorganic
scaffold, with LUCA not being free-living at first (Koonin & Martin 2005), while
common bottom-up studies use vesicles to build protocells (see section LUCA and
the first cells). In this manner, classical bottom-up work, regarding the current state
of the art, might not be directly associable to LUCA’s study, as discussed elsewhere
(Luisi et al. 2006, Stano 2011). Moreover, stating that a protocell would be a good
model of a chassis cell would require protocells to be experimentally validated for
chassis cell design. Within the state of the art, protocells are still, unfortunately, a
meagre model of such constructs.
2.5.4 Middle-Out Approach
Kohl and Noble attribute the term middle-out originally to Sydney Brenner
(Kohl & Noble 2009), who coined it during a discussion in a Novartis Foundation
Symposium on “Complexity in Biological Information Processing” (Brenner et al.
70 | CHAPTER 2 Systems Biology Perspectives on Minimal and Simpler Cells
2001). For the purposes of this review, given that the focus is on prokaryotic
systems, Noble’s definition (Noble 2002) was adapted to “the approach which starts
at any level (gene, RNA, protein, metabolic or regulatory pathways) at which there
are sufficient data and reaches (up, down and across) towards other levels and
components”. The middle-out approach is often difficult to distinguish from the
classical approaches. In this review those studies that integrate different layers of
information in a final holistic model or construct mentioned in Table 2.1 are
classified as middle-out.
Gil et al. did a large-scale work of integration of several minimal gene sets and
generated probably the most comprehensive and accepted theoretical minimal
protein-coding gene set for prokaryotic life (Gil et al. 2004) (See section Minimal
Genome for the composition of this minimal gene set). The study integrated the
orthologous genes resulting from the comparison of five endosymbionts’ genomes
(Gil et al. 2003) with functional equivalents without sequence similarity. After, the
results were integrated with several datasets: a list of B. subtilis essential genes
(Kobayashi et al. 2003); proposed essential genes for E. coli from different sources
(Gerdes et al. 2003, Kang et al. 2004, Kato & Hashimoto 2007); the proposal of a
computationally-derived minimal gene set by Mushegian and Koonin (Mushegian &
Koonin 1996); the results of global transposon mutagenesis for mycoplasmas
(Hutchison et al. 1999); a list of essential genes identified in S. aureus (Forsyth et al.
2002, Ji et al. 2001) and the reduced genome of the plant pathogen Phytoplasma
asteris (Oshima et al. 2004). To identify corresponding orthologous genes and
protein functions and reconstruct the metabolic pathways, the authors used a
comprehensive variety of online databases and resources (Gil et al. 2004). The final
functional classification of the gene set was done with the categories used in the
sequencing work on Aquifex aeolicus, one of the earliest diverging bacteria known
(Deckert et al. 1998), and the resulting minimal metabolic network was analysed for
detecting gaps in essential pathways. The proposed minimal gene set reflects a
rational integration that is described in detail in (Gil et al. 2004).
Another example of an integrative approach resulting in an original construct
is the whole-cell tomogram of M. pneumoniae, which includes individual
heteromultimeric protein complexes represented to scale within one bacterial cell,
CHAPTER 2 Systems Biology Perspectives on Minimal and Simpler Cells | 71
obtained using electron tomographies of 26 entire cells (Kühner et al. 2009). A
combination of pattern recognition and classification algorithms allowed the
positioning of identified protein complexes in a whole-cell illustration of the spatial
organization of the proteome of this reduced bacteria (Kühner et al. 2009) (Figure
2.1).
A major achievement that so far represents the climax of integrative
experimental projects towards the creation of artificial cells came two years after
the creation of the first synthetic artificial genome (Gibson et al. 2008). The Venter
Institute announced the successful transplantation of an artificial chromosome -
Mycoplasma mycoides JCVI-syn1.0 genome - to another recipient cell, a Mycoplasma
capricolum, creating new cells controlled by the synthetic chromosome (Gibson et al.
2010). This represented a stretching of the boundaries of biotechnology, opening
doors to new work with semi-artificial bacterial cells.
2.5.5 Models and Simulations of Minimal and Simpler Cells
Because minimal or simpler cells are still conceptual constructs, theoretical
representations and mathematical models are crucial for the advancement of the
field. Theories (like the one of the hydrothermal origin of life, mentioned in section
‘LUCA and the first cells’ (Russell & Hall 1997, Russell et al. 2003)) and models (e.g.
physical, experimental protocells or virtual, in silico simulation models) are the
minimal or simpler cell-related constructs closer to being holistically understood,
among those represented in Table 2.1, given the complexity of prokaryotic cells.
Theoretical or virtual protocell systems include a vast array of representations
of self-replicable systems, some explored mathematically. A pioneering protocell
model is the so-called chemoton, by Tibor Gánti (Gánti 1975). The chemoton
consists of three functionally dependent autocatalytic subsystems: the metabolic
network, the template polymerization and the membrane subsystem enclosing the
previous. All three subsystems are precisely coupled by stoichiometry, which
ensures the correct functioning. The chemoton is considered as an elegant platform
to support different protocell models (Szathmáry & Griesemer 2008). Physical
72 | CHAPTER 2 Systems Biology Perspectives on Minimal and Simpler Cells
protocells as minimal cell models and theoretical models of protocells have been
reviewed comprehensively elsewhere (Solé et al. 2007).
On the other hand, the field of modelling whole cells is still very scattered, and
a variety of different modelling approaches have been used so far. In general, a
whole-cell simulation requires modelling different biological networks at an
appropriate scale. The existing models can be broadly categorized in three classes:
interaction models or network representations; constraint-based models (e.g.
stoichiometric models) and mechanistic models (e.g. kinetic models) although these
are still far from being holistic (for a review see (Stelling 2004)). Among these, the
constraint-based models have played a major role in the contemporary attempts of
modelling minimal life, mainly because of the simplicity or abstraction they allow.
Genome-scale network reconstructions (GENREs), which have been increasingly
used in metabolic modelling, are one example with several practical applications
discussed elsewhere (Oberhardt et al. 2009). GENREs require the integration of
experimental data in a middle-out manner (Durot et al. 2009, Oberhardt et al. 2009).
The minimal requirement for reconstructing a GENRE is the annotated genome
sequence of the organism of interest. The resulting basic framework can be further
refined and expanded with the incorporation of experimental data at the cell-level
(mainly transcriptomics and proteomics) and manual curation based on the
literature available. These models allow assessing the biosynthetic capabilities of a
species in a systematic manner. Furthermore, they also enable the simulation of
intra-cellular metabolic fluxes, as well as the effects of genetic modifications, such as
gene knockouts (Orth et al. 2010, Price et al. 2004). So far, a large number of
prokaryotic manually-curated GENREs have been published (Oberhardt et al. 2009).
These models are promising for studies of prokaryotic simplification and even for
comparative studies that will allow the definition of common and different
metabolic features. A couple of studies with GENREs have been done relating to
minimal or simpler cells. Pál et al. used one E. coli’s GENRE to analyse the reductive
evolution from the network of E. coli toward the small networks of B. aphidicola and
Wigglesworthia glossinidia, achieving a remarkable accuracy of 80% (Pál et al.
2006). GENREs have also been used to predict gene essentiality in different
CHAPTER 2 Systems Biology Perspectives on Minimal and Simpler Cells | 73
organisms, and theoretical compositions of minimal media (Gianchandani et al.
2010).
Other work in modelling minimal cells has been done regarding mechanistic
cell-level models, focusing on different features such as cell geometry and division
(Surovtsev et al. 2009), macromolecular interactions (Flamm et al. 2007) and also
metabolism (Castellanos et al. 2004), with the last study interested in modelling a
minimal cell from the knowledge of E. coli ‘s metabolic kinetics (Browning & Shuler
2001). Another comprehensive ongoing whole-cell simulation project is running in
Japan, based on M. genitalium and including 127 genes – the E-CELL model (Tomita
2001). More recently, Shuler et al. developed probably the most comprehensive and
abstract minimal cell model to date (Shuler et al. 2012), based on the minimal gene
set derived by Gil et al. (Gil et al. 2004). The authors added genes for 3 rRNA
products, 20 tRNA species and transport systems for amino acid and inorganic ions
that were missing in the source gene set. This minimal cell model has 241 genes in
total, represented in a 233-kb chromosome, coding for all the functions supposedly
required for a chemoheterotrophic bacteria to grow and divide (Shuler et al. 2012).
The model formulation consists of a differential algebraic equation system, which
includes the DNA replication process, as well as cytokinesis and the coupling
between cell physiology and cell growth. It is also able to output several parameters
as partition factors, chromosome replication and cell division parameters (Shuler et
al. 2012).
Recently published, the whole-cell model of M. genitalium was an important
advance, not only for the modelling field, but also for the biological study of
prokaryotes, allowing for accurate phenotypic predictions (Karr et al. 2012). This
model integrates 28 essential cellular processes that were represented in different
submodels; these fall into five main categories – DNA, RNA, Protein, Metabolism, and
Other (cytokinesis and host interaction) including over 1,900 quantitative
parameters. Each of the 28 submodels was simulated with an appropriate
mathematical representation – for instance, metabolism was modelled using a
constraint-based approach, while RNA and protein degradation used mechanistic
Poisson processes (Karr et al. 2012). This integrative strategy makes the assumption
that the submodels are approximately independent on short timescales, so that at
74 | CHAPTER 2 Systems Biology Perspectives on Minimal and Simpler Cells
each time step the submodels depend on the values of variables determined by the
other submodels at the previous time step (Karr et al. 2012). This formulation of
independent and decoupled modules allowed the most complete simulation of M.
genitalium so far, not only providing insights on the simulated cellular functions, but
also directing experimental assays that identified kinetic parameters and details on
the biological function of metabolic genes.
2.6 Towards the Lowest Complexity
Both for fundamental science and for the design of better platform cells with
applications in industrial biotechnology, one of the major concerns is the complexity
of the cells used, rather than the number of components those cells have, and how
precisely these cells can be understood and engineered in a predictive manner.
Therefore, at this point it can be argued that, for the study of the minimal cell, the
focus shall become minimizing complexity and not the number of components.
Complexity is often related with the number of interactions patent in the
interactome – all the interactions linking biological molecules in a cell (Kiemer &
Cesareni 2007). Once the interactome is known, and the complexity of the system is
understood, this complexity can be reduced by a rational deletion of some elements
– single genes or even whole metabolic or regulatory modules that are not essential
and that represent a considerable increase of complexity of the system. One example
is the work by Trinh et al., where by knocking out only 8 genes the authors reduced
the functional space of the E. coli’s central metabolic network from 15000 pathway
possibilities to only six growth-supporting pathways (Trinh et al. 2008).
2.6.1 Interactomes and Network Biology
Network biology explores the connectivity of molecular elements in biological
networks, which can change dramatically for different proteins (Bolser et al. 2003,
Ravasz et al. 2002, Rives & Galitski 2003). It has been suggested that the complexity
of the network of protein-protein interactions in a cell can be reduced to and
represented by a small number of highly connected hubs or protein units of
CHAPTER 2 Systems Biology Perspectives on Minimal and Simpler Cells | 75
structure and function (Rives & Galitski 2003). Network biology also specializes in
applying graph theory to biological systems and revealing universal features of
cellular networks (Barabási & Oltvai 2004). One of the major discovered features
was that biological networks follow a hierarchical organization (Ravasz et al. 2002),
in a modular manner, a feature that, from a holistic perspective, can facilitate
interventions and predictions in the network. Recently, the hierarchical organization
of biological networks has been highlighted as vital for the reduction of complexity
of bacterial cells for biotechnological applications, but under another nomenclature
(Mampel et al. 2013). The authors emphasize the need to introduce in biology the
concept of orthogonalization, a classical notion in engineering and mathematics that
represents the ability of subsystems of a higher system to function independently
(Mampel et al. 2013).
The analysis of different prokaryotic networks has suggested that more
environmental variability is related to more network modularity and therefore more
orthogonalization (Parter et al. 2007). It was demonstrated that E. coli’s metabolic
modules are functionally uniform, with each metabolic class assignable to one
specific structural module, while B. aphidicola’s reduced network modules show a
larger mixture of different functions (Parter et al. 2007). Another interesting
conclusion on biological complexity was that the transition to the largest and more
complex metabolic networks was dependant on the presence of oxygen (Jason
Raymond and Daniel Segre 2006).
2.6.2 Genome Size and Cellular Complexity
The results of high-throughput interactome studies permit a first glance at the
relationship between the genome size (in terms of number of ORFs) and the number
of interactions identified (Bouveret & Brun 2012), showing that no correlation exists
between the two variables (Figure 2.2). The total of interactions exhibits a disperse
distribution, but when normalized by the number of baits tested in each study, the
ratio between interactions identified and number of baits situates between 2 to 8
fold, with the exception of Campylobacter jejuni in which the interactome size is 18
times larger than the number of baits tested (Figure 2.2). This indicates that the
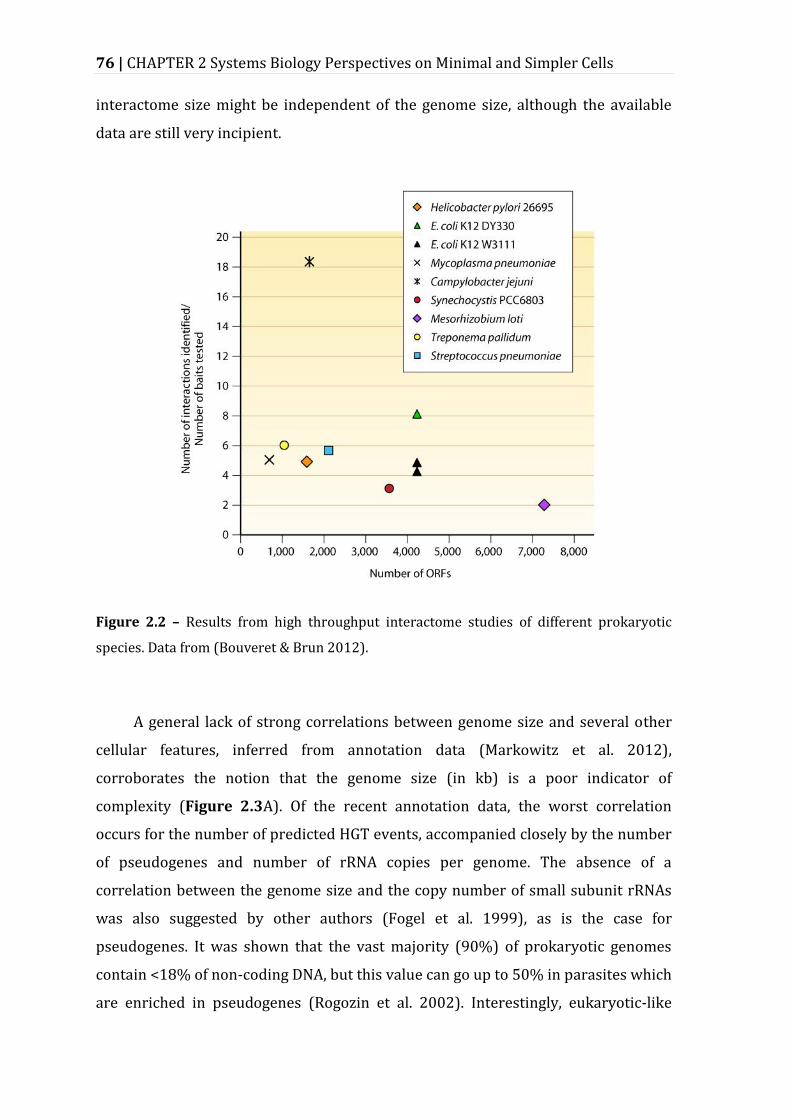
76 | CHAPTER 2 Systems Biology Perspectives on Minimal and Simpler Cells
interactome size might be independent of the genome size, although the available
data are still very incipient.
Figure 2.2 – Results from high throughput interactome studies of different prokaryotic
species. Data from (Bouveret & Brun 2012).
A general lack of strong correlations between genome size and several other
cellular features, inferred from annotation data (Markowitz et al. 2012),
corroborates the notion that the genome size (in kb) is a poor indicator of
complexity (Figure 2.3A). Of the recent annotation data, the worst correlation
occurs for the number of predicted HGT events, accompanied closely by the number
of pseudogenes and number of rRNA copies per genome. The absence of a
correlation between the genome size and the copy number of small subunit rRNAs
was also suggested by other authors (Fogel et al. 1999), as is the case for
pseudogenes. It was shown that the vast majority (90%) of prokaryotic genomes
contain <18% of non-coding DNA, but this value can go up to 50% in parasites which
are enriched in pseudogenes (Rogozin et al. 2002). Interestingly, eukaryotic-like
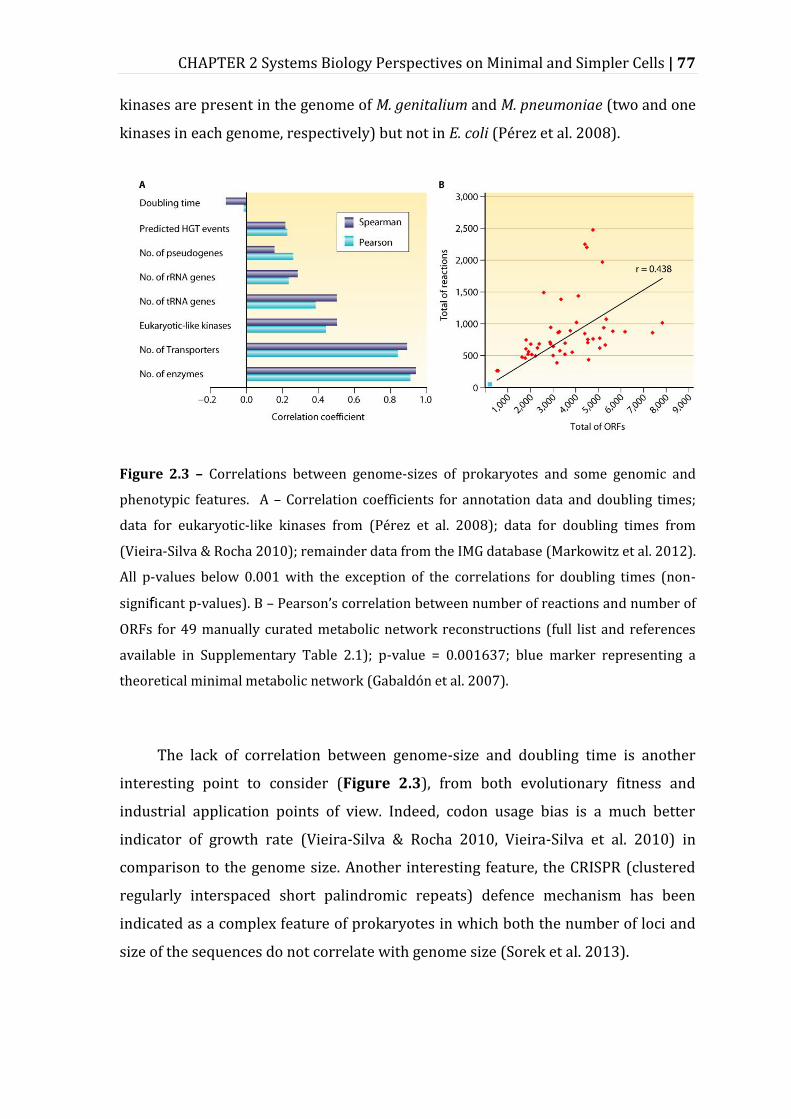
CHAPTER 2 Systems Biology Perspectives on Minimal and Simpler Cells | 77
kinases are present in the genome of M. genitalium and M. pneumoniae (two and one
kinases in each genome, respectively) but not in E. coli (Pérez et al. 2008).
Figure 2.3 – Correlations between genome-sizes of prokaryotes and some genomic and
phenotypic features. A – Correlation coefficients for annotation data and doubling times;
data for eukaryotic-like kinases from (Pérez et al. 2008); data for doubling times from
(Vieira-Silva & Rocha 2010); remainder data from the IMG database (Markowitz et al. 2012).
All p-values below 0.001 with the exception of the correlations for doubling times (non-
significant p-values). B – Pearson’s correlation between number of reactions and number of
ORFs for 49 manually curated metabolic network reconstructions (full list and references
available in Supplementary Table 2.1); p-value = 0.001637; blue marker representing a
theoretical minimal metabolic network (Gabaldón et al. 2007).
The lack of correlation between genome-size and doubling time is another
interesting point to consider (Figure 2.3), from both evolutionary fitness and
industrial application points of view. Indeed, codon usage bias is a much better
indicator of growth rate (Vieira-Silva & Rocha 2010, Vieira-Silva et al. 2010) in
comparison to the genome size. Another interesting feature, the CRISPR (clustered
regularly interspaced short palindromic repeats) defence mechanism has been
indicated as a complex feature of prokaryotes in which both the number of loci and
size of the sequences do not correlate with genome size (Sorek et al. 2013).
78 | CHAPTER 2 Systems Biology Perspectives on Minimal and Simpler Cells
The best correlations with genome size occur for metabolism-related features
such as the number of predicted enzymes and the transporters assigned by the
transporter classification system (TCs) (Figure 2.3). The correlation is weaker when
considering manually curated GENREs only (Figure 2.3B; Supplementary Table 2.1).
Manually curated GENREs are available for a significantly smaller number of species
than those with sequenced genomes; however, the previous include a rigorous
process of validation and a supervised procedure of gap filling of the network.
Overall, it seems plausible to say that genome size reflects fairly well the metabolic
capability of an organism. Metabolic networks are among the most studied and
manipulated of all prokaryotic features (Durot et al. 2009, Oberhardt et al. 2009,
Orth et al. 2011) and it has been suggested that the complexity of metabolism lies
mostly in the regulation imposed on the metabolic network (Gerosa & Sauer 2011),
which can occur at a large scale with the intervention of a single ubiquitous
transcription factor (Brand & Curtis 2002), making it difficult to infer biological
complexity based on the metabolic network size alone.
Complexity of transcriptional regulatory networks, e.g. through transcription
factor-gene interactions, can be seen as another metric of overall cellular
complexity. Although the number of transcription factors seems to increase with
genome size, the number of regulatory sites per intergenic region is independent of
it (Molina & van Nimwegen 2008). On another side, M. pneumoniae’s genome¸
despite having only 0.81 Mb, contains frequent antisense transcripts, alternative
transcripts and multiple regulators per gene that make these bacteria’s regulation
and transcriptome highly dynamic and somehow similar to eukaryotes (Güell et al.
2009). M. genitalium lacks two-component regulatory systems with histidine kinase
sensors and response regulator domains that are widespread in E. coli and H.
influenzae (Fraser et al. 1995) which lead to the anticipation that its regulatory
circuits would be less responsive to environmental signals (Koonin et al. 1996) and
therefore less controllable in industrial scenarios.
The minimal nutritional requirements of a species summarize its biosynthetic
capabilities and hence can be used as a metric of its metabolic complexity. Based on
nutritional information for 15 species (Supplementary Table 2.2), there seems to be
a non-linear relationship between the number of media components and genome
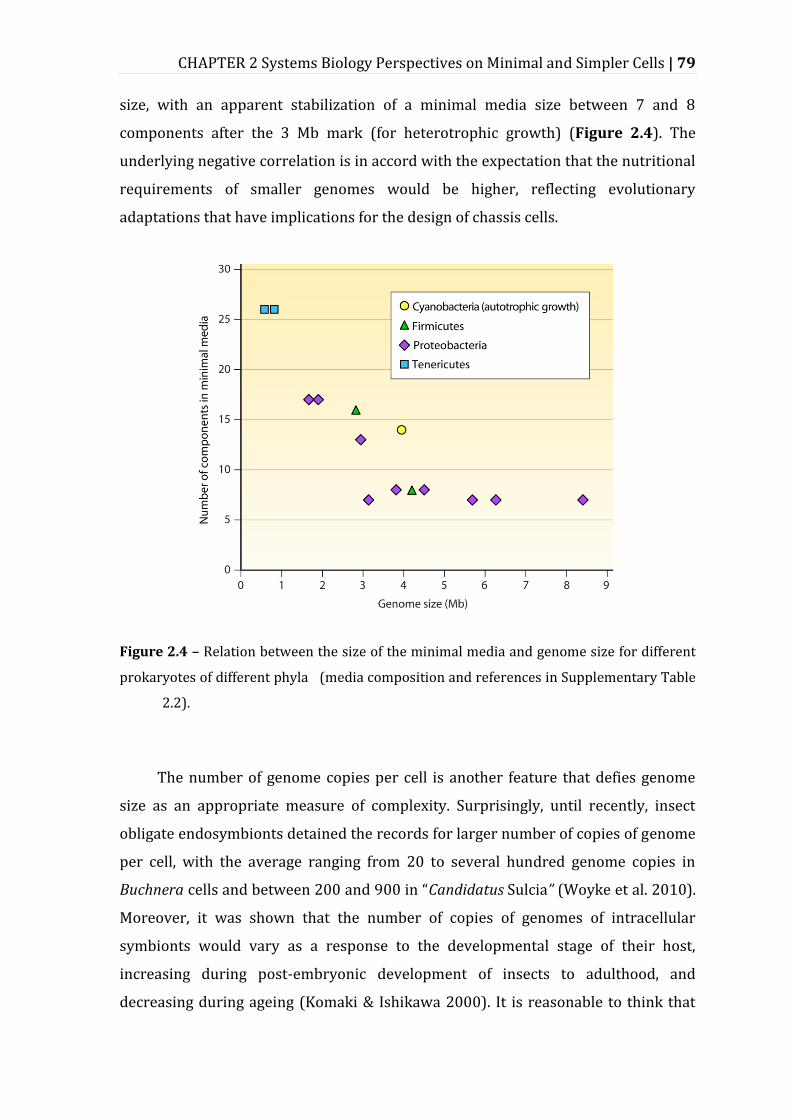
CHAPTER 2 Systems Biology Perspectives on Minimal and Simpler Cells | 79
size, with an apparent stabilization of a minimal media size between 7 and 8
components after the 3 Mb mark (for heterotrophic growth) (Figure 2.4). The
underlying negative correlation is in accord with the expectation that the nutritional
requirements of smaller genomes would be higher, reflecting evolutionary
adaptations that have implications for the design of chassis cells.
Figure 2.4 – Relation between the size of the minimal media and genome size for different
prokaryotes of different phyla (media composition and references in Supplementary Table
2.2).
The number of genome copies per cell is another feature that defies genome
size as an appropriate measure of complexity. Surprisingly, until recently, insect
obligate endosymbionts detained the records for larger number of copies of genome
per cell, with the average ranging from 20 to several hundred genome copies in
Buchnera cells and between 200 and 900 in “Candidatus Sulcia” (Woyke et al. 2010).
Moreover, it was shown that the number of copies of genomes of intracellular
symbionts would vary as a response to the developmental stage of their host,
increasing during post-embryonic development of insects to adulthood, and
decreasing during ageing (Komaki & Ishikawa 2000). It is reasonable to think that
80 | CHAPTER 2 Systems Biology Perspectives on Minimal and Simpler Cells
endosymbiosis transforms these prokaryotes into cell factories more active in
providing the host the “agreed nutrients” by an increase in genome copy number,
which can be exploited for more profitable biotechnological applications of minimal
cells.
2.7 Sub-cellular Architecture
Highly organized sub-cellular architecture has increasingly become an object
of attention and brings a whole new perspective to the biology of prokaryotes (Gitai
2005, Minton & Rivas 2011), which have been until recently regarded as simple
membrane-bounded cells with an uniform cytoplasm and one circular genome. It
has been shown that even enzymes thought to have only specific chemical roles can
have well-defined structural roles in a prokaryotic cytoplasm. The CTP synthase of
Caulobacter crescentus forms filaments that help define the characteristic curvature
of these bacteria, and these filaments are formed in E. coli as well (Ingerson-Mahar
et al. 2010). M. pneumoniae also displays highly ordered structural features (Güell et
al. 2009, Kühner et al. 2009) including a complex terminal structure that directs
human respiratory tract colonization and is considered an organelle per se, with the
function of promoting attachment (Popham et al. 1997). Although this bacterium is
among the simplest prokaryotes with an extremely reduced genome, and without
cell wall, its subcellular architecture shows that smaller genomes can translate into
complex cellular structures.
2.8 Conclusions and Future Perspectives
The genome, as the first ome made accessible by the technological advances, has
received most of the attention so far in the field of minimal or simpler cells. The
efforts towards minimal genomes mainly include large-scale identification of non-
essential genes, relatively few experimental genome reductions and an outstanding
example of the construction of a bacterial cell harbouring a synthetic genome. On
another line of research, comparative approaches have identified the core,
CHAPTER 2 Systems Biology Perspectives on Minimal and Simpler Cells | 81
conserved gene sets that were thought at first to constitute the minimal genome.
With the sequencing of more and more genomes, nowadays this core is practically
reduced to zero as no protein-coding gene is universal across the prokaryotic
domain (Lagesen et al. 2010). This outstanding discovery has reshaped the way the
field of minimal cells is viewed from a systems biology perspective. The genome is
not seen any more as the static core-identity of the cell, but more as a backbone or a
database of tools pertaining to a complex and dynamic system. Technologies
complementary to genomics are thus entering the main stage, such as
transcriptomics, proteomics and metabolomics, as well as computational tools for
simulating the dynamic behaviour of the cell. The minimal cell can be seen
nowadays as a broad concept that does not apply to one genome composition only.
It seems that a panoply of different small genomes could exist, being regulated
differently, expressed in different proteomes, and being strongly dependent on the
available media and environment.
In parallel to the omics-oriented research, the study of the last universal
common ancestor has been integrated with the geochemical context of the early
earth, which is crucial to the re-constitution and understanding of the genetic and
metabolic capabilities of this minimal cell. Furthermore, the design of chassis cells is
becoming more and more targeted on specific needs like product and culture
conditions, expanding on the previous notion that a general minimal cell with a
reduced genome would fit industrial needs. Overall, it has become clear that both
fundamental and applied goals of the research on minimal cells can only be achieved
through a system-level analysis encompassing bottom-up, top-down and middle-out
approaches.
The need for taking a holistic approach in the design of minimal cells is
underlined with the necessity of complementing experimental approaches with
mathematical modelling. Mathematical models can aid in the interpretation and
integration of large omics datasets, hypothesis generation, uncovering general
principles underlying the operation of complex cellular machinery, and eventually in
designing the network modules for the minimal cells. One of the foremost tasks will
be to devise metrics for assessing the minimality and simplicity of a biological
system – features that may not necessarily go hand in hand. Although minimality can
82 | CHAPTER 2 Systems Biology Perspectives on Minimal and Simpler Cells
be defined in a relatively straightforward manner, e.g. in terms of genome size, to
date there are no explicit metrics of complexity available. Several recent studies
providing insight into the cellular interactome (Bolser et al. 2003, Bouveret & Brun
2012, Rives & Galitski 2003) indicate that the topological and functional features of
these networks may be used for devising suitable complexity metrics.
A cell factory viewpoint of minimal and simpler cells can provide useful insights
into the relationship between simplicity and complexity. A cell factory to be used in
biotechnological applications will be required to strike a balance between various
contrasting features (Figure 2.5A). For example, while the minimality implies a
smaller genome size, it undesirably increases the requirements for nutritional
supply. Similarly, minimal complexity and optimal local control may require a
certain degree of orthogonalization between the functions of different components
or functional modules, while some crosstalk between these will be essential to
achieve globally optimal control and a high metabolic efficiency. Indeed, cellular
metabolic networks are featured by both orthogonalization (e.g. distinct biochemical
pathways) and crosstalk (e.g. through the use of universal redox and energy co-
factors). Furthermore, metabolic efficiency and rates often counter each other
(Bachmann et al. 2013), prompting another balance for the system as a whole. These
different trade-off considerations clearly suggest that ‘minimal’ cells for an
industrial purpose will have to be tailored to a particular need - the complexity of
the desired phenotype and the economy of the overall process dictating the
balancing point. It will be interesting to extend these engineering viewpoints to
evolutionary considerations for LUCA. For example, the theoretical/experimental
LUCA models could be refined so as to strike a balance between the number of
components and the level of complexity that would likely represent optimal fitness
under the postulated environmental conditions.
Research from diverse fields, ranging from fundamental biology to LUCA to
chassis cells, is providing a clearer picture of the workflow that will most likely lead
to the reconstruction of simple and minimal cells for basic research as well as for
industrial applications. This will imply an iterative process building upon top-down
studies generating omics datasets, bottom-up, mechanistic studies generating
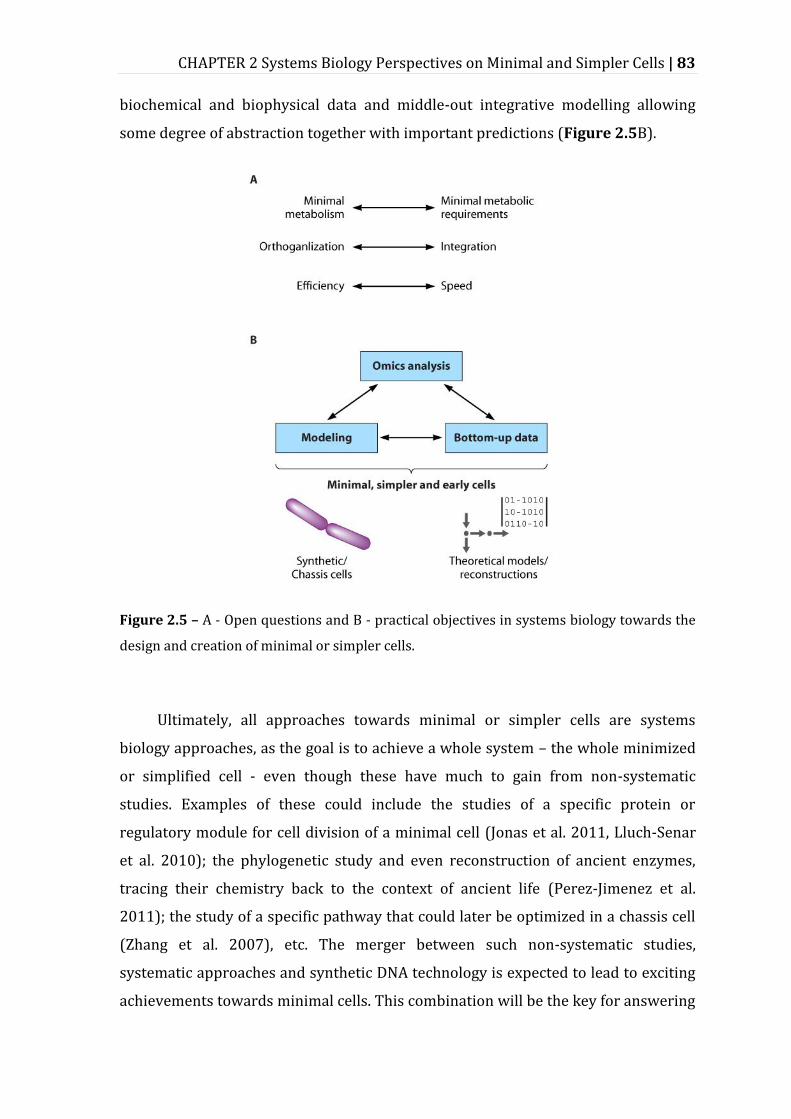
CHAPTER 2 Systems Biology Perspectives on Minimal and Simpler Cells | 83
biochemical and biophysical data and middle-out integrative modelling allowing
some degree of abstraction together with important predictions (Figure 2.5B).
Figure 2.5 – A - Open questions and B - practical objectives in systems biology towards the
design and creation of minimal or simpler cells.
Ultimately, all approaches towards minimal or simpler cells are systems
biology approaches, as the goal is to achieve a whole system – the whole minimized
or simplified cell - even though these have much to gain from non-systematic
studies. Examples of these could include the studies of a specific protein or
regulatory module for cell division of a minimal cell (Jonas et al. 2011, Lluch-Senar
et al. 2010); the phylogenetic study and even reconstruction of ancient enzymes,
tracing their chemistry back to the context of ancient life (Perez-Jimenez et al.
2011); the study of a specific pathway that could later be optimized in a chassis cell
(Zhang et al. 2007), etc. The merger between such non-systematic studies,
systematic approaches and synthetic DNA technology is expected to lead to exciting
achievements towards minimal cells. This combination will be the key for answering
84 | CHAPTER 2 Systems Biology Perspectives on Minimal and Simpler Cells
the long sought questions on the origin and nature of life, and for improving our
ability to rationally design minimal or simpler cells.
References
Andrianantoandro E, Basu S, Karig DK, Weiss R. 2006. Synthetic biology: new
engineering rules for an emerging discipline. Mol. Syst. Biol. 2:2006.0028
Ansong C, Purvine SO, Adkins JN, Lipton MS, Smith RD. 2008. Proteogenomics: needs
and roles to be filled by proteomics in genome annotation. Brief. Funct. Genomic.
Proteomic. 7(1):50–62
Ara K, Ozaki K, Nakamura K, Yamane K, Sekiguchi J, Ogasawara N. 2007. Bacillus
minimum genome factory: effective utilization of microbial genome
information. Biotechnol. Appl. Biochem. 46(Pt 3):169–78
Baba T, Ara T, Hasegawa M. 2006. Construction of Escherichia coli K-12 in-frame,
single-gene knockout mutants: the Keio collection. Mol. Syst. Biol. 2:
Bachmann H, Fischlechner M, Rabbers I, Barfa N, Branco Dos Santos F, et al. 2013.
Availability of public goods shapes the evolution of competing metabolic
strategies. Proc. Natl. Acad. Sci. U. S. A. 110(35):14302–7
Barabási A-L, Oltvai ZN. 2004. Network biology: understanding the cell’s functional
organization. Nat. Rev. Genet. 5(2):101–13
Baric S. 2012. Quantitative Real-Time PCR Analysis of “Candidatus Phytoplasma
mali” Without External Standard Curves. Erwerbs-Obstbau. 54(3):147–53
Becerra A, Islas S, Leguina JI, Silva E, Lazcano A. 1997. Polyphyletic gene losses can
bias backtrack characterizations of the cenancestor. J. Mol. Evol. 45(2):115–17
Bleriot C, Effantin G, Lagarde F, Mandrand-Berthelot M-A, Rodrigue A. 2011. RcnB Is
a Periplasmic Protein Essential for Maintaining Intracellular Ni and Co
Concentrations in Escherichia coli. J. Bacteriol. 193(15):3785–93
Bolser D, Dafas P, Harrington R, Park J, Schroeder M. 2003. Visualisation and graph-
theoretic analysis of a large-scale protein structural interactome. BMC
Bioinformatics. 4(1):45
Bonchev D. 2004. Complexity analysis of yeast proteome network. Chem. Biodivers.
1(2):312–26
Borek E, Waelsch H. 1951. The effect of temperature on the nutritional requirement
of microorganisms. J. Biol. Chem. 190(1):191–96
CHAPTER 2 Systems Biology Perspectives on Minimal and Simpler Cells | 85
Bouveret E, Brun C. 2012. Bacterial interactomes: from interactions to networks.
Methods Mol. Biol. 804:15–33
Brand MD, Curtis RK. 2002. Simplifying metabolic complexity. Biochem. Soc. Trans.
30(2):25–30
Brenner S, Noble D, Sejnowski T, Fields R, Laughlin S, et al. 2001. Understanding
complex systems: top-down, bottom-up or middle-out? In Novartis Foundation
Symposium: Complexity in Biological Information Processing, Vol. 239, eds. GR
Bock, JA Goode, pp. 150–59. Chichester, UK: John Wiley & Sons, Ltd
Browning ST, Shuler ML. 2001. Towards the development of a minimal cell model by
generalization of a model of Escherichia coli: use of dimensionless rate
parameters. Biotechnol. Bioeng. 76(3):187–92
Bryant MP, Robinson IM. 1962. Some nutritional characteristics of predominant
culturable ruminal bacteria. J. Bacteriol. 84(4):605–14
Butland G, Babu M, Díaz-Mejía JJ, Bohdana F, Phanse S, et al. 2008. eSGA: E. coli
synthetic genetic array analysis. Nat. Methods. 5(9):789–95
Callister SJ, McCue LA, Turse JE, Monroe ME, Auberry KJ, et al. 2008. Comparative
bacterial proteomics: analysis of the core genome concept. PLoS One.
3(2):e1542
Cameron DE, Urbach JM, Mekalanos JJ. 2008. A defined transposon mutant library
and its use in identifying motility genes in Vibrio cholerae. Proc. Natl. Acad. Sci.
U. S. A. 105(25):8736–41
Campbell LL, Williams OB. 1953. The effect of temperature on the nutritional
requirements of facultative and obligate thermophilic bacteria. J. Bacteriol.
65(2):141–45
Carini P, Steindler L, Beszteri S, Giovannoni SJ. 2013. Nutrient requirements for
growth of the extreme oligotroph “Candidatus Pelagibacter ubique” HTCC1062
on a defined medium. ISME J. 7(3):592–602
Castellanos M, Wilson DB, Shuler ML. 2004. A modular minimal cell model: Purine
and pyrimidine transport and metabolism. Proc. Natl. Acad. Sci. U. S. A.
101(17):6681–86
Catrein I, Herrmann R. 2011. The proteome of Mycoplasma pneumoniae, a
supposedly “simple” cell. Proteomics. 11(18):3614–32
Chandramouli K, Qian P-Y. 2009. Proteomics: challenges, techniques and
possibilities to overcome biological sample complexity. Hum. Genomics
Proteomics. 2009:
Chaudhuri RR, Allen AG, Owen PJ, Shalom G, Stone K, et al. 2009. Comprehensive
86 | CHAPTER 2 Systems Biology Perspectives on Minimal and Simpler Cells
identification of essential Staphylococcus aureus genes using Transposon-
Mediated Differential Hybridisation (TMDH). BMC Genomics. 10:291
Chen IA. 2006. The Emergence of Cells During the Origin of Life. Science 314:1558–
59
Chen IA, Roberts RW, Szostak JW. 2004. The emergence of competition between
model protocells. Science 305(5689):1474–76
Chen W-H, Minguez P, Lercher MJ, Bork P. 2012. OGEE: an online gene essentiality
database. Nucleic Acids Res. 40(Database issue):D901–6
Christen B, Abeliuk E, Collier JM, Kalogeraki VS, Passarelli B, et al. 2011. The
essential genome of a bacterium. Mol. Syst. Biol. 7:528
Clements LD, Miller BS, Streips UN. 2002. Comparative growth analysis of the
facultative anaerobes Bacillus subtilis, Bacillus licheniformis, and Escherichia
coli. Syst. Appl. Microbiol. 25(2):284–86
Darwin C. 1859. On the Origin of Species by Means of Natural Selection, or the
Preservation of Favoured Races in the Struggle for Life., Vol. 138. John Murray
de Berardinis V, Vallenet D, Castelli V, Besnard M, Pinet A, et al. 2008. A complete
collection of single-gene deletion mutants of Acinetobacter baylyi ADP1. Mol.
Syst. Biol. 4:174
de Crécy-Lagard V, Marck C, Brochier-Armanet C, Grosjean H. 2007. Comparative
RNomics and modomics in Mollicutes: prediction of gene function and
evolutionary implications. IUBMB Life. 59(10):634–58
Deckert G, Warren P V, Gaasterland T, Young WG, Lenox AL, et al. 1998. The
complete genome of the hyperthermophilic bacterium Aquifex aeolicus. Nature
392(6674):353–58
Delaye L, Becerra A, Lazcano A. 2005. The last common ancestor: what’s in a name?
Orig. Life Evol. Biosph. 35(6):537–54
Dewall MT, Cheng DW. 2011. The minimal genome: a metabolic and environmental
comparison. Brief. Funct. Genomics. 10(5):312–15
Doolittle WF. 1999. Phylogenetic classification and the universal tree. Science
284(5423):2124–29
Douglas AE, Bouvaine S, Russell RR. 2010. How the insect immune system interacts
with an obligate symbiotic bacterium. Proc. R. Soc. B. 278(1704):333–38
Durot M, Bourguignon P-Y, Schachter V. 2009. Genome-scale models of bacterial
metabolism: reconstruction and applications. FEMS Microbiol. Rev. 33(1):164–
90
CHAPTER 2 Systems Biology Perspectives on Minimal and Simpler Cells | 87
Fehér T, Papp B, Pal C, Pósfai G. 2007. Systematic genome reductions: theoretical
and experimental approaches. Chem. Rev. 107(8):3498–3513
Fisunov GY, Alexeev DG, Bazaleev N a, Ladygina VG, Galyamina M a, et al. 2011. Core
proteome of the minimal cell: comparative proteomics of three mollicute
species. PLoS One. 6(7):e21964
Flamm C, Endler L, Müller S, Widder S, Schuster P. 2007. A minimal and self-
consistent in silico cell model based on macromolecular interactions. Philos.
Trans. R. Soc. Lond. B. Biol. Sci. 362(1486):1831–39
Fogel GB, Collins CR, Li J, Brunk CF. 1999. Prokaryotic Genome Size and SSU rDNA
Copy Number: Estimation of Microbial Relative Abundance from a Mixed
Population. Microb. Ecol. 38(2):93–113
Foley PL, Shuler ML. 2010. Considerations for the design and construction of a
synthetic platform cell for biotechnological applications. Biotechnol. Bioeng.
105(1):26–36
Forster AC, Church GM. 2006. Towards synthesis of a minimal cell. Mol. Syst. Biol.
2:45
Forsyth RA, Haselbeck RJ, Ohlsen KL, Yamamoto RT, Xu H, et al. 2002. A genome-
wide strategy for the identification of essential genes in Staphylococcus aureus.
Mol. Microbiol. 43(6):1387–1400
Fraser CM, Gocayne JD, White O, Adams MD, Clayton RA, et al. 1995. The minimal
gene complement of Mycoplasma genitalium. Science 270(9):397–403
French CT, Lao P, Loraine AE, Matthews BT, Yu H, Dybvig K. 2008. Large-scale
transposon mutagenesis of Mycoplasma pulmonis. Mol. Microbiol. 69(1):67–76
Gabaldón T, Peretó J, Montero F, Gil R, Latorre A, Moya A. 2007. Structural analyses
of a hypothetical minimal metabolism. Philos. Trans. R. Soc. Lond. B. Biol. Sci.
362(1486):1751–62
Gallagher LA, Ramage E, Jacobs MA, Kaul R, Brittnacher M, Manoil C. 2007. A
comprehensive transposon mutant library of Francisella novicida, a bioweapon
surrogate. Proc. Natl. Acad. Sci. U. S. A. 104(3):1009–14
Gánti T. 1975. Organization of chemical reactions into dividing and metabolizing
units: the chemotons. Biosystems. 7(1):15–21
García-Fernández JM, de Marsac NT, Diez J. 2004. Streamlined regulation and gene
loss as adaptive mechanisms in Prochlorococcus for optimized nitrogen
utilization in oligotrophic environments. Microbiol. Mol. Biol. Rev. 68(4):630–38
Gerdes SY, Scholle MD, Campbell JW, Balazsi G, Ravasz E, et al. 2003. Experimental
Determination and System Level Analysis of Essential Genes in Escherichia coli
88 | CHAPTER 2 Systems Biology Perspectives on Minimal and Simpler Cells
MG1655. J. Bacteriol. 185(19):5673–84
Gerosa L, Sauer U. 2011. Regulation and control of metabolic fluxes in microbes.
Curr. Opin. Biotechnol. 22(4):566–75
Gianchandani EP, Chavali AK, Papin J a. 2010. The application of flux balance
analysis in systems biology. Wiley Interdiscip. Rev. Syst. Biol. Med. 2(3):372–82
Gibson DG, Benders GA, Andrews-Pfannkoch C, Denisova E a, Baden-Tillson H, et al.
2008. Complete chemical synthesis, assembly, and cloning of a Mycoplasma
genitalium genome. Science 319(5867):1215–20
Gibson DG, Glass JI, Lartigue C, Noskov VN, Chuang R-Y, et al. 2010. Creation of a
bacterial cell controlled by a chemically synthesized genome. Science
329(5987):52–56
Giga-Hama Y, Tohda H, Takegawa K, Kumagai H. 2007. Schizosaccharomyces pombe
minimum genome factory. Biotechnol. Appl. Biochem. 46(Pt 3):147–55
Gil R, Sabater-Muñoz B, Latorre A, Silva FJ, Moya A. 2002. Extreme genome reduction
in Buchnera spp.: toward the minimal genome needed for symbiotic life. Proc.
Natl. Acad. Sci. U. S. A. 99(7):4454–58
Gil R, Silva FJ, Peretó J, Moya A. 2004. Determination of the Core of a Minimal
Bacterial Gene Set. Microbiol. Mol. Biol. Rev. 68(3):518–37
Gil R, Silva FJ, Zientz E, Delmotte F, González-Candelas F, et al. 2003. The genome
sequence of Blochmannia floridanus: comparative analysis of reduced genomes.
Proc. Natl. Acad. Sci. U. S. A. 100(16):9388–93
Giovannoni SJ, Tripp HJ, Givan S, Podar M, Vergin KL, et al. 2005. Genome
streamlining in a cosmopolitan oceanic bacterium. Science 309(5738):1242–45
Gitai Z. 2005. The new bacterial cell biology: moving parts and subcellular
architecture. Cell. 120(5):577–86
Glass JI, Assad-Garcia N, Alperovich N, Yooseph S, Lewis MR, et al. 2006. Essential
genes of a minimal bacterium. Proc. Natl. Acad. Sci. U. S. A. 103(2):425–30
Goldman AD, Bernhard TM, Dolzhenko E, Landweber LF. 2013. LUCApedia: a
database for the study of ancient life. Nucleic Acids Res. 41(Database
issue):D1079–82
Gosalbes MJ, Lamelas A, Moya A, Latorre A. 2008. The striking case of tryptophan
provision in the cedar aphid Cinara cedri. J. Bacteriol. 190(17):6026–29
Güell M, van Noort V, Yus E, Chen W-H, Leigh-Bell J, et al. 2009. Transcriptome
complexity in a genome-reduced bacterium. Science 326(5957):1268–71
Gupta N, Benhamida J, Bhargava V, Goodman D, Kain E, et al. 2008. Comparative
CHAPTER 2 Systems Biology Perspectives on Minimal and Simpler Cells | 89
proteogenomics: combining mass spectrometry and comparative genomics to
analyze multiple genomes. Genome Res. 18(7):1133–42
Hanczyc MM, Toyota T, Ikegami T, Packard N, Sugawara T. 2007. Fatty acid
chemistry at the oil-water interface: self-propelled oil droplets. J. Am. Chem. Soc.
129(30):9386–91
Harris JK, Kelley ST, Spiegelman GB, Pace NR. 2003. The genetic core of the universal
ancestor. Genome Res. 13(3):407–12
Hashimoto M, Ichimura T, Mizoguchi H, Tanaka K, Fujimitsu K, et al. 2005. Cell size
and nucleoid organization of engineered Escherichia coli cells with a reduced
genome. Mol. Microbiol. 55(1):137–49
Henry C, Overbeek R, Stevens RL. 2010. Building the blueprint of life. Biotechnol. J.
5(7):695–704
Himmelreich R, Plagens H, Hilbert H, Reiner B, Herrmann R. 1997. Comparative
analysis of the genomes of the bacteria Mycoplasma pneumoniae and
Mycoplasma genitalium. Nucleic Acids Res. 25(4):701–12
Huang X, Li M, Green DC, Williams DS, Patil AJ, Mann S. 2013. Interfacial assembly of
protein-polymer nano-conjugates into stimulus-responsive biomimetic
protocells. Nat. Commun. 4:2239
Hutchison CA, Peterson SN, Gill SR, Cline RT, White O, et al. 1999. Global transposon
mutagenesis and a minimal Mycoplasma genome. Science. 286(5447):2165–69
Huynen M. 2000. Constructing a minimal genome. Trends Genet. 16(3):116
Ingerson-Mahar M, Briegel A, Werner JN, Jensen GJ, Gitai Z. 2010. The metabolic
enzyme CTP synthase forms cytoskeletal filaments. Nat. Cell Biol. 12(8):739–46
Itaya M. 1995. An estimation of minimal genome size required for life. FEBS Lett.
362(3):257–60
Jaffe JD, Stange-Thomann N, Smith C, DeCaprio D, Fisher S, et al. 2004. The complete
genome and proteome of Mycoplasma mobile. Genome Res. 14(8):1447–61
Jakubovics NS, Jenkinson HF. 2001. Out of the iron age: new insights into the critical
role of manganese homeostasis in bacteria. Microbiology. 147(7):1709–18
Janssen P, Goldovsky L, Kunin V, Darzentas N, Ouzounis CA. 2005. Genome coverage,
literally speaking. The challenge of annotating 200 genomes with 4 million
publications. EMBO Rep. 6(5):397–99
Jason Raymond and Daniel Segre. 2006. The Effect of Oxygen on Biochemical
Networks and the Evolution of Complex Life. Science 311(March):1764–67
Jewett MC, Calhoun KA, Voloshin A, Wuu JJ, Swartz JR. 2008. An integrated cell-free
90 | CHAPTER 2 Systems Biology Perspectives on Minimal and Simpler Cells
metabolic platform for protein production and synthetic biology. Mol. Syst. Biol.
4(1):220
Jewett MC, Forster AC. 2010. Update on designing and building minimal cells. Curr.
Opin. Biotechnol. 21(5):697–703
Jewett MC, Swartz JR. 2004. Mimicking the Escherichia coli cytoplasmic environment
activates long-lived and efficient cell-free protein synthesis. Biotechnol. Bioeng.
86(1):19–26
Ji Y, Zhang B, Van SF, Horn, Warren P, et al. 2001. Identification of critical
staphylococcal genes using conditional phenotypes generated by antisense
RNA. Science 293(5538):2266–69
Johannes TW, Zhao H. 2006. Directed evolution of enzymes and biosynthetic
pathways. Curr. Opin. Microbiol. 9(3):261–67
Jonas K, Chen YE, Laub MT. 2011. Modularity of the bacterial cell cycle enables
independent spatial and temporal control of DNA replication. Curr. Biol.
21(13):1092–1101
Joyce AR, Reed JL, White A, Edwards R, Osterman A, et al. 2006. Experimental and
computational assessment of conditionally essential genes in Escherichia coli. J.
Bacteriol. 188(23):8259–71
Kampen W. 1997. Nutritional Requirements in Fermentation Processes. In
Fermentation and Biochemical Engineering Handbook-Principles, Process Design,
and Equipment, eds. HC Vogel, CC Todaro, pp. 122–60. New Jersey: Noyes
Publications. 2nd ed.
Kang Y, Durfee T, Glasner JD, Qiu Y, Frisch D, et al. 2004. Systematic mutagenesis of
the Escherichia coli genome. J. Bacteriol. 186(15):4921–30
Karr JR, Sanghvi JC, Macklin DN, Gutschow M V., Jacobs JM, et al. 2012. A Whole-Cell
Computational Model Predicts Phenotype from Genotype. Cell. 150(2):389–401
Kato J, Hashimoto M. 2007. Construction of consecutive deletions of the Escherichia
coli chromosome. Mol. Syst. Biol. 3:132
Kiemer L, Cesareni G. 2007. Comparative interactomics: comparing apples and
pears? Trends Biotechnol. 25(10):448–54
Kim KM, Caetano-Anollés G. 2011. The proteomic complexity and rise of the
primordial ancestor of diversified life. BMC Evol. Biol. 11(1):140
Klann AG, Belanger AE, Abanes-De Mello A, Lee JY, Hatfull GF. 1998. Characterization
of the dnaG Locus in Mycobacterium smegmatis Reveals Linkage of DNA
Replication and Cell Division. J. Bacteriol. 180(1):65–72
CHAPTER 2 Systems Biology Perspectives on Minimal and Simpler Cells | 91
Knuth K, Niesalla H, Hueck CJ, Fuchs TM. 2004. Large-scale identification of essential
Salmonella genes by trapping lethal insertions. Mol. Microbiol. 51(6):1729–44
Kobayashi K, Ehrlich SD, Albertini a, Amati G, Andersen KK, et al. 2003. Essential
Bacillus subtilis genes. Proc. Natl. Acad. Sci. U. S. A. 100(8):4678–83
Kohl P, Noble D. 2009. Systems biology and the virtual physiological human. Mol.
Syst. Biol. 5:292
Komaki K, Ishikawa H. 2000. Genomic copy number of intracellular bacterial
symbionts of aphids varies in response to developmental stage and morph of
their host. Insect Biochem. Mol. Biol. 30(3):253–58
Koonin E V. 2000. How many genes can make a cell: The Minimal-Gene-Set Concept.
Annu. Rev. Genomics Hum. Genet. 1:99–116
Koonin E V. 2003. Comparative genomics, minimal gene-sets and the last universal
common ancestor. Nat. Rev. Microbiol. 1(2):127–36
Koonin E V, Martin W. 2005. On the origin of genomes and cells within inorganic
compartments. Trends Genet. 21(12):647–54
Koonin E V, Mushegian A, Rudd KE. 1996. Sequencing and analysis of bacterial
genomes. Curr. Biol. 6(4):404–16
Kube M, Schneider B, Kuhl H, Dandekar T, Heitmann K, et al. 2008. The linear
chromosome of the plant-pathogenic mycoplasma “Candidatus Phytoplasma
mali”. BMC Genomics. 9:306
Kuchaiev O, Milenkovic T, Memisevic V, Hayes W, Przulj N. 2010. Topological
network alignment uncovers biological function and phylogeny. J. R. Soc.
Interface. 7(50):1341–54
Kühner S, van Noort V, Betts MJ, Leo-Macias A, Batisse C, et al. 2009. Proteome
organization in a genome-reduced bacterium. Science 326(5957):1235–40
Kuwahara H, Yoshida T, Takaki Y, Shimamura S, Nishi S, et al. 2007. Reduced genome
of the thioautotrophic intracellular symbiont in a deep-sea clam, Calyptogena
okutanii. Curr. Biol. 17(10):881–86
Kyrpides N, Overbeek R, Ouzounis C. 1999. Universal protein families and the
functional content of the last universal common ancestor. J. Mol. Evol.
49(4):413–23
Lagesen K, Ussery DW, Wassenaar TM. 2010. Genome update: the 1000th genome--a
cautionary tale. Microbiology. 156(Pt 3):603–8
Langridge GC, Phan M-D, Turner DJ, Perkins TT, Parts L, et al. 2009. Simultaneous
assay of every Salmonella Typhi gene using one million transposon mutants.
92 | CHAPTER 2 Systems Biology Perspectives on Minimal and Simpler Cells
Genome Res. 19(12):2308–16
Lazcano a, Miller SL. 1996. The origin and early evolution of life: prebiotic
chemistry, the pre-RNA world, and time. Cell. 85(6):793–98
Lee JH, Sung BH, Kim MS, Blattner FR, Yoon BH, et al. 2009. Metabolic engineering of
a reduced-genome strain of Escherichia coli for L-threonine production. Microb.
Cell Fact. 8(1):2
Lee JW, Na D, Park JM, Lee J, Choi S, Lee SY. 2012. Systems metabolic engineering of
microorganisms for natural and non-natural chemicals. Nat. Chem. Biol.
8(6):536–46
Lee LJ, Barrett JA, Poole RK. 2005. Genome-wide transcriptional response of
chemostat-cultured Escherichia coli to zinc. J. Bacteriol. 187(3):1124–34
Lehman J, Stanley KO. 2013. Evolvability is inevitable: increasing evolvability
without the pressure to adapt. PLoS One. 8(4):e62186
Leipe DD, Aravind L, Koonin E V. 1999. Did DNA replication evolve twice
independently? Nucleic Acids Res. 27(17):3389–3401
Lluch-Senar M, Luong K, Lloréns-Rico V, Delgado J, Fang G, et al. 2013.
Comprehensive methylome characterization of Mycoplasma genitalium and
Mycoplasma pneumoniae at single-base resolution. PLoS Genet. 9(1):e1003191
Lluch-Senar M, Querol E, Piñol J. 2010. Cell division in a minimal bacterium in the
absence of ftsZ. Mol. Microbiol. 78(2):278–89
López-Madrigal S, Latorre A, Porcar M, Moya A, Gil R. 2011. Complete genome
sequence of “Candidatus Tremblaya princeps” strain PCVAL, an intriguing
translational machine below the living-cell status. J. Bacteriol. 193(19):5587–88
Luisi PL. 2002. Toward the engineering of minimal living cells. Anat. Rec.
268(3):208–14
Luisi PL, Ferri F, Stano P. 2006. Approaches to semi-synthetic minimal cells: a
review. Naturwissenschaften. 93(1):1–13
Macleod RA, Onofrey E, Norris ME. 1954. Nutrition and metabolism of marine
bacteria. I. Survey of nutritional requirements. J. Bacteriol. 68(6):680–86
Mampel J, Buescher JM, Meurer G, Eck J. 2013. Coping with complexity in metabolic
engineering. Trends Biotechnol. 31(1):52–60
Mannige R V., Brooks CL, Shakhnovich EI. 2012. A Universal Trend among
Proteomes Indicates an Oily Last Common Ancestor. PLoS Comput. Biol.
8(12):e1002839
Markowitz VM, Chen I-MA, Palaniappan K, Chu K, Szeto E, et al. 2012. IMG: the
CHAPTER 2 Systems Biology Perspectives on Minimal and Simpler Cells | 93
Integrated Microbial Genomes database and comparative analysis system.
Nucleic Acids Res. 40(Database issue):D115–22
Martin W, Baross J, Kelley D, Russell MJ. 2008. Hydrothermal vents and the origin of
life. Nat. Rev. Microbiol. 6(11):805–14
Martin W, Russell MJ. 2003. On the origins of cells: a hypothesis for the evolutionary
transitions from abiotic geochemistry to chemoautotrophic prokaryotes, and
from prokaryotes to nucleated cells. Philos. Trans. R. Soc. Lond. B. Biol. Sci.
358(1429):59–83
Mat W-K, Xue H, Wong JT-F. 2008. The genomics of LUCA. Front. Biosci. 13:5605–13
McCutcheon JP, McDonald BR, Moran NA. 2009a. Convergent evolution of metabolic
roles in bacterial co-symbionts of insects. Proc. Natl. Acad. Sci. U. S. A.
106(36):15394–99
McCutcheon JP, McDonald BR, Moran NA. 2009b. Origin of an alternative genetic
code in the extremely small and GC-rich genome of a bacterial symbiont. PLoS
Genet. 5(7):e1000565
McCutcheon JP, Moran NA. 2007. Parallel genomic evolution and metabolic
interdependence in an ancient symbiosis. Proc. Natl. Acad. Sci. U. S. A.
104(49):19392–97
McCutcheon JP, Moran NA. 2010. Functional convergence in reduced genomes of
bacterial symbionts spanning 200 My of evolution. Genome Biol. Evol. 2:708–18
McLuskey K, Harrison JA, Schuttelkopf AW, Boxer DH, Hunter WN. 2003. Insight into
the role of Escherichia coli MobB in molybdenum cofactor biosynthesis based on
the high resolution crystal structure. J. Biol. Chem. 278(26):23706–13
Mears JA, Cannone JJ, Stagg SM, Gutell RR, Agrawal RK, Harvey SC. 2002. Modeling a
Minimal Ribosome Based on Comparative Sequence Analysis. J. Mol. Biol.
321(2):215–34
Mendum TA, Newcombe J, Mannan A a, Kierzek AM, McFadden J. 2011. Interrogation
of global mutagenesis data with a genome scale model of Neisseria meningitidis
to assess gene fitness in vitro and in sera. Genome Biol. 12(12):R127
Minton AP, Rivas G. 2011. Biochemical Reactions in the Crowded and Confined
Physiological Environment: Physical Chemistry Meets Synthetic Biology. In The
Minimal Cell, eds. PL Luisi, P Stano, pp. 73–89. Dordrecht: Springer Netherlands.
1st ed.
Mirkin BG, Fenner TI, Galperin MY, Koonin E V. 2003. Algorithms for computing
parsimonious evolutionary scenarios for genome evolution, the last universal
common ancestor and dominance of horizontal gene transfer in the evolution of
94 | CHAPTER 2 Systems Biology Perspectives on Minimal and Simpler Cells
prokaryotes. BMC Evol. Biol. 3:2
Mizoguchi H, Mori H, Fujio T. 2007. Escherichia coli minimum genome factory.
Biotechnol. Appl. Biochem. 46(Pt 3):157–67
Mizoguchi H, Sawano Y, Kato J, Mori H. 2008. Superpositioning of deletions
promotes growth of Escherichia coli with a reduced genome. DNA Res.
15(5):277–84
Molina N, van Nimwegen E. 2008. Universal patterns of purifying selection at
noncoding positions in bacteria. Genome Res. 18(1):148–60
Moran NA, Tran P, Gerardo NM. 2005. Symbiosis and insect diversification: an
ancient symbiont of sap-feeding insects from the bacterial phylum
Bacteroidetes. Appl. Environ. Microbiol. 71(12):8802–10
Morange M. 2011. Some considerations on the nature of LUCA, and the nature of life.
Res. Microbiol. 162(1):5–9
Morimoto T, Kadoya R, Endo K, Tohata M, Sawada K, et al. 2008. Enhanced
recombinant protein productivity by genome reduction in Bacillus subtilis. DNA
Res. 15(2):73–81
Moya A, Gil R, Latorre A, Peretó J, Pilar Garcillán-Barcia M, de la Cruz F. 2009.
Toward minimal bacterial cells: evolution vs. design. FEMS Microbiol. Rev.
33(1):225–35
Murphy KC. 1998. Use of Bacteriophage lambda Recombination Functions To
Promote Gene Replacement in Escherichia coli. J. Bacteriol. 180(8):2063–71
Murray RG, Stackebrandt E. 1995. Taxonomic note: implementation of the
provisional status Candidatus for incompletely described procaryotes. Int. J.
Syst. Bacteriol. 45(1):186–87
Murtas G. 2009. Artificial assembly of a minimal cell. Mol. Biosyst. 5(11):1292–97
Mushegian A. 1999. The minimal genome concept. Curr. Opin. Genet. Dev. 9:709–14
Mushegian A, Koonin E V. 1996. A minimal gene set for cellular life derived by
comparison of complete bacterial genomes. Proc. Natl. Acad. Sci. U. S. A.
93(19):10268–73
Nakabachi A, Yamashita A, Toh H, Ishikawa H, Dunbar HE, et al. 2006. The 160-
kilobase genome of the bacterial endosymbiont Carsonella. Science
314(5797):267
Nilsson AI, Koskiniemi S, Eriksson S, Kugelberg E, Hinton JCD, Andersson DI. 2005.
Bacterial genome size reduction by experimental evolution. Proc. Natl. Acad. Sci.
U. S. A. 102(34):12112–16
CHAPTER 2 Systems Biology Perspectives on Minimal and Simpler Cells | 95
Nisbet EG, Sleep NH. 2001. The habitat and nature of early life. Nature
409(6823):1083–91
Noble D. 2002. The rise of computational biology. Nat. Rev. Mol. Cell Biol. 3(6):459–
63
O’Malley M a, Powell A, Davies JF, Calvert J. 2008. Knowledge-making distinctions in
synthetic biology. BioEssays. 30(1):57–65
Oberhardt MA, Palsson BØ, Papin JA. 2009. Applications of genome-scale metabolic
reconstructions. Mol. Syst. Biol. 5:
Oberholzer T, Wick R, Luisi PL, Biebricher CK. 1995. Enzymatic RNA replication in
self-reproducing vesicles: an approach to a minimal cell. Biochem. Biophys. Res.
Commun. 207(1):250–57
Orth JD, Conrad TM, Na J, Lerman J a, Nam H, et al. 2011. A comprehensive genome-
scale reconstruction of Escherichia coli metabolism—2011. Mol. Syst. Biol.
7(535):1–9
Orth JD, Thiele I, Palsson BØ. 2010. What is flux balance analysis? Nat. Biotechnol.
28(3):245–48
Oshima K, Kakizawa S, Nishigawa H, Jung H-Y, Wei W, et al. 2004. Reductive
evolution suggested from the complete genome sequence of a plant-pathogenic
phytoplasma. Nat. Genet. 36(1):27–29
Pál C, Papp B, Lercher MJ. 2005. Adaptive evolution of bacterial metabolic networks
by horizontal gene transfer. Nat. Genet. 37(12):1372–75
Pál C, Papp B, Lercher MJ, Csermely P, Oliver SG, Hurst LD. 2006. Chance and
necessity in the evolution of minimal metabolic networks. Nature
440(7084):667–70
Parter M, Kashtan N, Alon U. 2007. Environmental variability and modularity of
bacterial metabolic networks. BMC Evol. Biol. 7(1):169
Pavankumar AR, Ayyappasamy SP, Sankaran K. 2012. Small RNA fragments in
complex culture media cause alterations in protein profiles of three species of
bacteria. Biotechniques. 52(3):167–72
Penny D, Poole A. 1999. The nature of the last universal common ancestor. Curr.
Opin. Genet. Dev. 9:672–77
Pérez J, Castañeda-García A, Jenke-Kodama H, Müller R, Muñoz-Dorado J. 2008.
Eukaryotic-like protein kinases in the prokaryotes and the myxobacterial
kinome. Proc. Natl. Acad. Sci. U. S. A. 105(41):15950–55
Perez-Jimenez R, Inglés-Prieto A, Zhao Z-M, Sanchez-Romero I, Alegre-Cebollada J, et
96 | CHAPTER 2 Systems Biology Perspectives on Minimal and Simpler Cells
al. 2011. Single-molecule paleoenzymology probes the chemistry of resurrected
enzymes. Nat. Struct. Mol. Biol. 18(5):592–96
Pohorille A, Deamer D. 2002. Artificial cells: prospects for biotechnology. Trends
Biotechnol. 20(3):123–28
Poole AM, Logan DT. 2005. Modern mRNA proofreading and repair: clues that the
last universal common ancestor possessed an RNA genome? Mol. Biol. Evol.
22(6):1444–55
Popham PL, Hahn T-W, Krebes KA, Krause DC. 1997. Loss of HMW1 and HMW3 in
noncytadhering mutants of Mycoplasma pneumoniae occurs post-
translationally. Proc. Natl. Acad. Sci. U. S. A. 94(25):13979–84
Porcar M, Danchin A, de Lorenzo V, Dos Santos V a, Krasnogor N, et al. 2011. The ten
grand challenges of synthetic life. Syst. Synth. Biol. 5(1-2):1–9
Pósfai G, Plunkett G, Fehér T, Frisch D, Keil GM, et al. 2006. Emergent properties of
reduced-genome Escherichia coli. Science 312(5776):1044–46
Price ND, Reed JL, Palsson BØ. 2004. Genome-scale models of microbial cells:
evaluating the consequences of constraints. Nat. Rev. Microbiol. 2(11):886–97
Prickett MD, Page M, Douglas AE, Thomas GH. 2006. BuchneraBASE: a post-genomic
resource for Buchnera sp. APS. Bioinformatics. 22(5):641–42
Rasmussen S, Chen L, Deamer D, Krakauer DC, Packard NH, et al. 2004. Transitions
from Nonliving to Living Matter. Science 303:963–65
Ravasz E, Somera a L, Mongru D a, Oltvai ZN, Barabási a L. 2002. Hierarchical
organization of modularity in metabolic networks. Science 297(5586):1551–55
Reed JL, Vo TD, Schilling CH, Palsson BØ. 2003. An expanded genome-scale model of
Escherichia coli K-12 (iJR904 GSM/GPR). Genome Biol. 4(9):R54
Rensing C, Fan B, Sharma R, Mitra B, Rosen BP. 2000. CopA: An Escherichia coli
Cu(I)-translocating P-type ATPase. Proc. Natl. Acad. Sci. 97(2):652–56
Rives AW, Galitski T. 2003. Modular organization of cellular networks. Proc. Natl.
Acad. Sci. U. S. A. 100(3):1128–33
Rocap G, Larimer FW, Lamerdin J, Malfatti S, Chain P, et al. 2003. Genome divergence
in two Prochlorococcus ecotypes reflects oceanic niche differentiation. Nature
424(6952):1042–47
Roepke RR, Libby RL, Small MH. 1944. Mutation or Variation of Escherichia coli with
Respect to Growth Requirements. J. Bacteriol. 48(4):401–12
Rogozin IB, Makarova KS, Natale D a, Spiridonov AN, Tatusov RL, et al. 2002.
Congruent evolution of different classes of non-coding DNA in prokaryotic
CHAPTER 2 Systems Biology Perspectives on Minimal and Simpler Cells | 97
genomes. Nucleic Acids Res. 30(19):4264–71
Russell MJ, Hall a J. 1997. The emergence of life from iron monosulphide bubbles at
a submarine hydrothermal redox and pH front. J. Geol. Soc. London. 154(3):377–
402
Russell MJ, Hall AJ, Mellersh AR. 2003. On the dissipation of thermal and chemical
energies on the early Earth: The onsets of hydrothermal convection,
chemiosmosis, genetically regulated metabolism and oxygenic photosynthesis.
In Natural and Laboratory-Simulated Thermal Geochemical Processes, ed. R Ikan,
pp. 325–88. Dordrecht: Kluwer Academic Publishers
Salama NR, Shepherd B, Falkow S. 2004. Global transposon mutagenesis and
essential gene analysis of Helicobacter pylori. J. Bacteriol. 186(23):7926–35
Sassetti CM, Rubin EJ. 2003. Genetic requirements for mycobacterial survival during
infection. Proc. Natl. Acad. Sci. U. S. A. 100(22):12989–94
Semsey S, Andersson AMC, Krishna S, Jensen MH, Massé E, Sneppen K. 2006. Genetic
regulation of fluxes: iron homeostasis of Escherichia coli. Nucleic Acids Res.
34(17):4960–67
Shuler ML, Foley P, Atlas J. 2012. Modeling a minimal cell. Methods Mol. Biol.
881:573–610
Solé R V. 2009. Evolution and self-assembly of protocells. Int. J. Biochem. Cell Biol.
41(2):274–84
Solé R V, Munteanu A, Rodriguez-Caso C, Macía J. 2007. Synthetic protocell biology:
from reproduction to computation. Philos. Trans. R. Soc. Lond. B. Biol. Sci.
362(1486):1727–39
Sorek R, Lawrence CM, Wiedenheft B. 2013. CRISPR-mediated Adaptive Immune
Systems in Bacteria and Archaea. Annu. Rev. Biochem. 82:237–66
Sowell SM, Norbeck AD, Lipton MS, Nicora CD, Callister SJ, et al. 2008. Proteomic
analysis of stationary phase in the marine bacterium “Candidatus Pelagibacter
ubique”. Appl. Environ. Microbiol. 74(13):4091–4100
Srinivasan V, Morowitz HJ. 2009. The canonical network of autotrophic intermediary
metabolism: minimal metabolome of a reductive chemoautotroph. Biol. Bull.
216(2):126–30
Stano P. 2011. Minimal cells: Relevance and interplay of physical and biochemical
factors. Biotechnol. J. 6(7):850–59
Steglich C, Futschik ME, Lindell D, Voss B, Chisholm SW, Hess WR. 2008. The
challenge of regulation in a minimal photoautotroph: non-coding RNAs in
Prochlorococcus. PLoS Genet. 4(8):e1000173
98 | CHAPTER 2 Systems Biology Perspectives on Minimal and Simpler Cells
Stelling J. 2004. Mathematical models in microbial systems biology. Curr. Opin.
Microbiol. 7(5):513–18
Surovtsev I V, Zhang Z, Lindahl PA, Morgan JJ. 2009. Mathematical modeling of a
minimal protocell with coordinated growth and division. J. Theor. Biol.
260(3):422–29
Suthers PF, Dasika MS, Kumar VS, Denisov G, Glass JI, Maranas CD. 2009a. A genome-
scale metabolic reconstruction of Mycoplasma genitalium, iPS189. PLoS Comput.
Biol. 5(2):e1000285
Suthers PF, Zomorrodi A, Maranas CD. 2009b. Genome-scale gene/reaction
essentiality and synthetic lethality analysis. Mol. Syst. Biol. 5(301):301
Szathmáry E. 2005. In search of the simplest cell. Nature 433(February):469–70
Szathmáry E, Griesemer J. 2008. Ganti’s Chemoton Model and Life Criteria. In
Protocells: Bridging Nonliving and Living Matter, pp. 407–32. MIT Press
Szathmáry E, Santos M, Fernando C. 2005. Evolutionary Potential and Requirements
for Minimal Protocells. Top. Curr. Chem. 259(August):167–211
Szostak JW, Bartel DP, Luisi PL. 2001. Synthesizing life. Nature 409(6818):387–90
Tamames J, Gil R, Latorre A, Peretó J, Silva FJ, Moya A. 2007. The frontier between
cell and organelle: genome analysis of “Candidatus Carsonella ruddii”. BMC Evol.
Biol. 7:181
Taymaz-Nikerel H, Borujeni AE, Verheijen PJT, Heijnen JJ, van Gulik WM. 2010.
Genome-derived minimal metabolic models for Escherichia coli MG1655 with
estimated in vivo respiratory ATP stoichiometry. Biotechnol. Bioeng.
107(2):369–81
Theobald DL. 2010a. A formal test of the theory of universal common ancestry.
Nature 465(7295):219–22
Theobald DL. 2010b. Theobald reply. Nature 468(7326):E10–E10
Tomita M. 2001. Whole-cell simulation: a grand challenge of the 21st century. Trends
Biotechnol. 19(6):205–10
Trinh CT, Unrean P, Srienc F. 2008. Minimal Escherichia coli cell for the most
efficient production of ethanol from hexoses and pentoses. Appl. Environ.
Microbiol. 74(12):3634–43
Umenhoffer K, Fehér T, Balikó G, Ayaydin F, Pósfai J, et al. 2010. Reduced
evolvability of Escherichia coli MDS42, an IS-less cellular chassis for molecular
and synthetic biology applications. Microb. Cell Fact. 9:38
Valgepea K, Adamberg K, Seiman A, Vilu R. 2013. Escherichia coli achieves faster
CHAPTER 2 Systems Biology Perspectives on Minimal and Simpler Cells | 99
growth by increasing catalytic and translation rates of proteins. Mol. Biosyst.
9(9):2344–58
van der Werf MJ, Overkamp KM, Muilwijk B, Coulier L, Hankemeier T. 2007.
Microbial metabolomics: toward a platform with full metabolome coverage.
Anal. Biochem. 370(1):17–25
van Ham RCHJ, Kamerbeek J, Palacios C, Rausell C, Abascal F, et al. 2003. Reductive
genome evolution in Buchnera aphidicola. Proc. Natl. Acad. Sci. U. S. A.
100(2):581–86
Vartoukian SR, Palmer RM, Wade WG. 2010. Strategies for culture of “unculturable”
bacteria. FEMS Microbiol. Lett. 309(1):1–7
Vickers CE, Blank LM, Krömer JO. 2010. Chassis cells for industrial biochemical
production. Nat. Chem. Biol. 6(December):875–77
Vieira-Silva S, Rocha EPC. 2010. The systemic imprint of growth and its uses in
ecological (meta)genomics. PLoS Genet. 6(1):e1000808
Vieira-Silva S, Touchon M, Rocha EPC. 2010. No evidence for elemental-based
streamlining of prokaryotic genomes. Trends Ecol. Evol. 25(c):319–20
Wang M, Yafremava LS, Caetano-Anollés D, Mittenthal JE, Caetano-Anollés G. 2007.
Reductive evolution of architectural repertoires in proteomes and the birth of
the tripartite world. Genome Res. 17(11):1572–85
Ware GC. 1951. Nutritional requirements of Bacterium coli at 44 degrees. J. Gen.
Microbiol. 5(5):880–84
Waters E, Hohn MJ, Ahel I, Graham DE, Adams MD, et al. 2003. The genome of
Nanoarchaeum equitans: insights into early archaeal evolution and derived
parasitism. Proc. Natl. Acad. Sci. U. S. A. 100(22):12984–88
Westerhoff H V, Winder C, Messiha H, Simeonidis E, Adamczyk M, et al. 2009.
Systems biology: the elements and principles of life. FEBS Lett. 583(24):3882–
90
Westers H, Dorenbos R, van Dijl JM, Kabel J, Flanagan T, et al. 2003. Genome
engineering reveals large dispensable regions in Bacillus subtilis. Mol. Biol. Evol.
20(12):2076–90
Wolf YI, Brenner SE, Bash PA, Koonin E V. 1999. Distribution of Protein Folds in the
Three Superkingdoms of Life. Genome Res. 9(1):17–26
Wong PTS, Thompson J, MacLeod RA. 1969. Nutrition and Metabolism of Marine
Bacteria. XVII. Ion-dependent retention of alpha-aminoisobutyric acid and its
relation to Na+ dependent transport in a marine pseudomonad. J. Biol. Chem.
244(4):1016–25
100 | CHAPTER 2 Systems Biology Perspectives on Minimal and Simpler Cells
Woyke T, Tighe D, Mavromatis K, Clum A, Copeland A, et al. 2010. One bacterial cell,
one complete genome. PLoS One. 5(4):e10314
Yang S, Doolittle RF, Bourne PE. 2005. Phylogeny determined by protein domain
content. Proc. Natl. Acad. Sci. U. S. A. 102(2):373–78
Yizhak K, Tuller T, Papp B, Ruppin E. 2011. Metabolic modeling of endosymbiont
genome reduction on a temporal scale. Mol. Syst. Biol. 7:
Yonezawa T, Hasegawa M. 2010. Was the universal common ancestry proved?
Nature 468(7326):E9; discussion E10
Yu BJ, Sung BH, Koob MD, Lee CH, Lee JH, et al. 2002. Minimization of the Escherichia
coli genome using a Tn5-targeted Cre/loxP excision system. Nat. Biotechnol.
20(10):1018–23
Yus E, Maier T, Michalodimitrakis K, van Noort V, Yamada T, et al. 2009. Impact of
genome reduction on bacterial metabolism and its regulation. Science
326(5957):1263–68
Zhang R, Lin Y. 2009. DEG 5.0, a database of essential genes in both prokaryotes and
eukaryotes. Nucleic Acids Res. 37(Database issue):D455–58
Zhang Y-HP, Evans BR, Mielenz JR, Hopkins RC, Adams MWW. 2007. High-yield
hydrogen production from starch and water by a synthetic enzymatic pathway.
PLoS One. 2(5):e456
Zimmer C. 2009. On the Origin of Life on Earth. Science 323:198–99
Zinser ER, Lindell D, Johnson ZI, Futschik ME, Steglich C, et al. 2009. Choreography of
the transcriptome, photophysiology, and cell cycle of a minimal
photoautotroph, prochlorococcus. PLoS One. 4(4):e5135
101
CHAPTER 3
Essential Cofactors in Prokaryotes Revealed by
Genome-scale Models and Large Data
Integration
It is by avoiding the rapid decay into the inert state of 'equilibrium' that an organism appears
so enigmatic; […]. How does the living organism avoid decay? The obvious answer is: By eating,
drinking, breathing and (in the case of plants) assimilating. The technical term is metabolism.
The Greek word means change or exchange.
—ERWIN SCHRÖDINGER, What is Life? (1944)
The composition of a cell in terms of macromolecular building blocks and
other organic molecules underlies the metabolic needs and capabilities of a species.
Although some core biomass components such as nucleic acids, proteins and lipids
are evident for most species, the essentiality of the pool of other organic molecules,
especially cofactors and prosthetic groups, is yet unclear. Here 71 biomass
compositions from manually curated genome-scale models are integrated with 33
large-scale gene essentiality datasets, enzyme-cofactor association data and a vast
array of literature publications, revealing universally essential cofactors for
prokaryotic metabolism. The results revise predictions of essential genes in
Klebsiella pneumoniae and identify missing biosynthetic pathways in Mycobacterium
tuberculosis. This work provides fundamental insights into the essentiality of
organic cofactors and has implications for minimal cell studies as well as for
modeling genotype-phenotype relations in prokaryotic metabolic networks.
102 | CHAPTER 3 Essential Cofactors in Prokaryotes
The contents of this chapter were prepared and submitted as a research article to a
peer-reviewed journal:
Xavier JC, Patil KR, Rocha I. Integration of Biomass Formulations of Genome-scale
Metabolic Models with Experimental Data Reveals Universally Essential
Cofactors in Prokaryotes (submitted).
CHAPTER 3. Essential Cofactors in Prokaryotes | 103
3.1 Introduction
The biomass composition of a cell reflects the genetic repertoire necessary to
synthesize, salvage, or uptake the necessary constituents for growth and
maintenance. Indeed, it can be used in taxonomical classification (De Ley & Van
Muylem 1963, Hiraishi 1999, Hoiczyk & Hansel 2000, Muto & Osawa 1987, Rosselló-
Mora & Amann 2001, Schleifer & Kandler 1972) and is intimately related with the
species’ growth rates (Bremer & Dennis 1996, Kemp et al. 1993). Consequently,
biomass composition is strongly linked to drug sensitivity, nutritional requirements,
and the biosynthetic potential for industrial applications of a species.
Genome-scale metabolic models (GSMs) have underscored the need to reduce
the knowledge gap in biomass compositions. GSMs have systematized metabolic
knowledge on dozens of microorganisms, with applications in diverse areas, from
industrial biotechnology to medical microbiology (Kim et al. 2012, Monk et al. 2014).
Biomass composition is a critical element of these models, allowing the
representation of cell growth in silico. This is realized through a growth reaction
wherein necessary constituents are combined in stoichiometric amounts producing
new biomass. Maximization of the flux through this reaction, the so-called Biomass
Objective Function (BOF), is the most commonly used method for simulating growth
phenotypes. The utility of metabolic models is tied to the accuracy of the biomass
composition used (Feist & Palsson 2010, Feist et al. 2007, Mendum et al. 2011). Yet,
most GSMs adapt the biomass composition from few well-studied organisms due to
the lack of standardized protocols, both experimental and computational. Here, this
problem is addressed by bringing together evidences for cofactor essentiality
hidden in disparate data sources – manually curated GSMs, biochemical and
bioinformatics databases, literature and genetic screens. These small molecules,
although not consumed in metabolism, are essential for catalysis and need to be
distributed in sufficient amounts among the daughter cells (Zhao & van der Donk
2003). The analysis performed revealed several essential organic cofactors for
archaeal and bacterial metabolism.
104 | CHAPTER 3 Essential Cofactors in Prokaryotes
3.2 Results
3.2.1 The Universe of Biomass Constituents in Prokaryotic
GSMs Is Large and Heterogeneous
First, biomass compositions in published prokaryotic GSMs were extensively
assessed. In total, 71 detailed biomass compositions were gathered, covering 9 phyla
with 5 classes of Proteobacteria and one phylum of Archaea (Supplementary Table
3.1). To enable comparison across different models, diverse nomenclatures and
representation styles were reconciled, ranging from lumped stoichiometry to
reaction-level inclusion (e.g., coenzyme A is represented in isolation in some models
while only in conjunction with lipids in others). This exercise resulted in 551 unique
metabolites (nomenclature as per BiGG database (Schellenberger et al. 2010)) that
are used as biomass constituents, including 20 charged tRNA molecules, 12
inorganic ions and water (Supplementary Tables 3.2, 3.3 and 3.4). Of these, more
than half – 261 – are present in only one BOF. Clustering of these diverse BOFs
revealed large discrepancy between biomass compositions used by models of
species in the same phyla (e.g. four species of cyanobacteria) or even between
different versions of models of the same species (Figure 3.1a). The clustering
appears to be affected by the template biomass composition used in reconstruction.
For example, one of the clearly separated clusters groups the BOFs based on the BOF
of iJR904 (Reed et al. 2003), a 2003 model of E. coli. The detail of biomass
compositions was found not to be correlated with the year of publication, and the
majority of BOFs have a lower number of components than those indicated as core
for E. coli in 2011 (Orth et al. 2011) (Figure 3.1b). Furthermore, none of the BOFs of
the manually curated models included all biomass components deemed universal in
the ModelSEED biomass template(Henry et al. 2010a) (Figure 3.1c). The least
comprehensive BOF excludes 29 components and the most comprehensive excludes
6, amidst which well-known entities such as acyl carrier protein (ACP), AMP and
GDP (Figure 3.1d). Although the overlap between the BOFs and the ModelSEED
template increases considerably when excluding inorganic ions from the analysis,
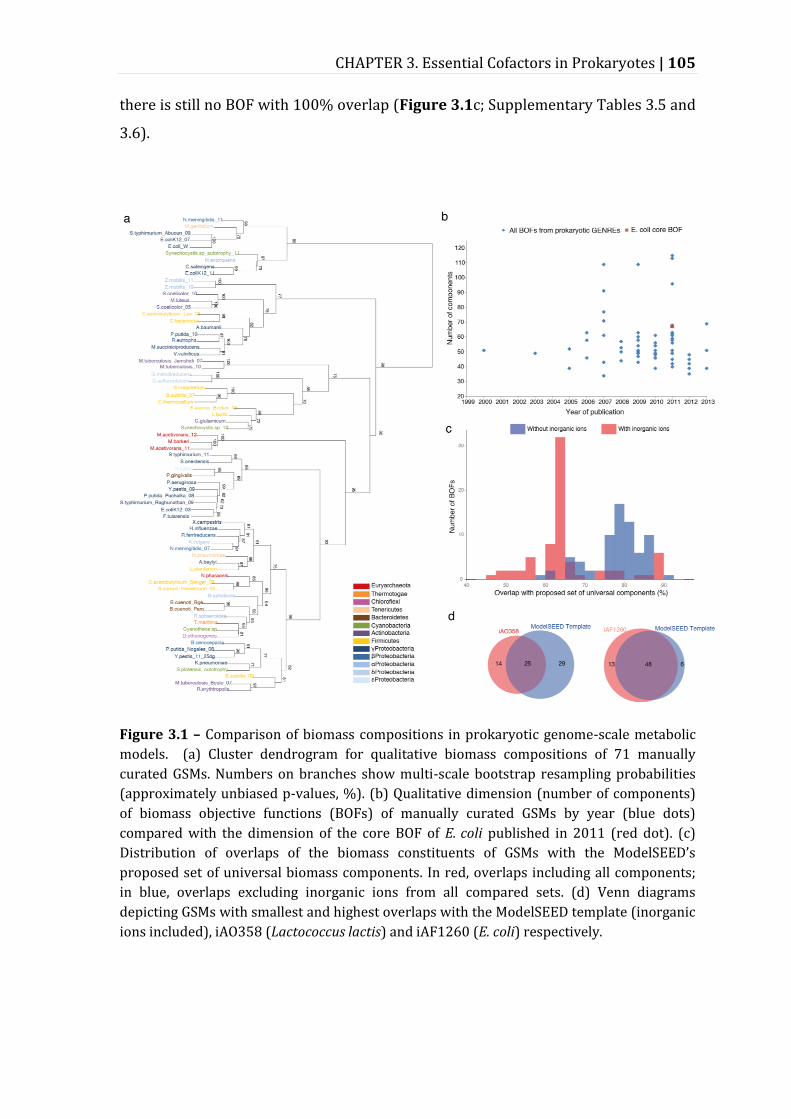
CHAPTER 3. Essential Cofactors in Prokaryotes | 105
there is still no BOF with 100% overlap (Figure 3.1c; Supplementary Tables 3.5 and
3.6).
Figure 3.1 – Comparison of biomass compositions in prokaryotic genome-scale metabolic
models. (a) Cluster dendrogram for qualitative biomass compositions of 71 manually
curated GSMs. Numbers on branches show multi-scale bootstrap resampling probabilities
(approximately unbiased p-values, %). (b) Qualitative dimension (number of components)
of biomass objective functions (BOFs) of manually curated GSMs by year (blue dots)
compared with the dimension of the core BOF of E. coli published in 2011 (red dot). (c)
Distribution of overlaps of the biomass constituents of GSMs with the ModelSEED’s
proposed set of universal biomass components. In red, overlaps including all components;
in blue, overlaps excluding inorganic ions from all compared sets. (d) Venn diagrams
depicting GSMs with smallest and highest overlaps with the ModelSEED template (inorganic
ions included), iAO358 (Lactococcus lactis) and iAF1260 (E. coli) respectively.
106 | CHAPTER 3 Essential Cofactors in Prokaryotes
3.2.2 Qualitative Biomass Composition Drastically Impacts
Essentiality Predictions
To assess the impact of the qualitative composition of BOFs on gene and
reaction essentiality predictions, five GSMs representing phylogenetically diverse
species were selected. Flux Balance Analysis (FBA) (Savinell & Palsson 1992) was
used to predict single reaction essentiality. Then, for each model, the simulations
were repeated after swapping the original BOFs with those from the other four
models (Figure 3.2a; Supplementary Tables 3.7 and 3.8). Even under the rich media
conditions used (all transport fluxes unconstrained), wherein the number of
essential reactions would be the smallest, considerable changes in essentiality
predictions were observed. The impact varied from 2.74% to 32.8% of the reactions
changing status from essential to non-essential or vice-versa (Figure 3.2b) attesting
the fundamental role of biomass composition in the applicability of GSMs.
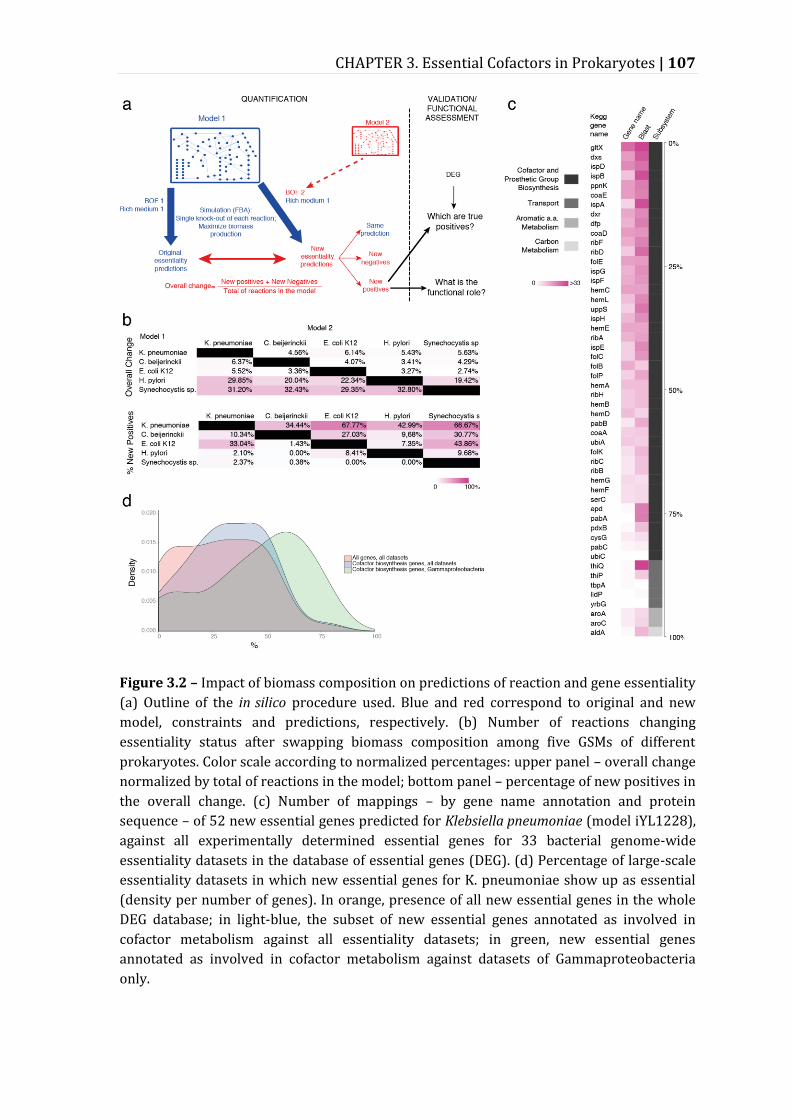
CHAPTER 3. Essential Cofactors in Prokaryotes | 107
Figure 3.2 – Impact of biomass composition on predictions of reaction and gene essentiality
(a) Outline of the in silico procedure used. Blue and red correspond to original and new
model, constraints and predictions, respectively. (b) Number of reactions changing
essentiality status after swapping biomass composition among five GSMs of different
prokaryotes. Color scale according to normalized percentages: upper panel – overall change
normalized by total of reactions in the model; bottom panel – percentage of new positives in
the overall change. (c) Number of mappings – by gene name annotation and protein
sequence – of 52 new essential genes predicted for Klebsiella pneumoniae (model iYL1228),
against all experimentally determined essential genes for 33 bacterial genome-wide
essentiality datasets in the database of essential genes (DEG). (d) Percentage of large-scale
essentiality datasets in which new essential genes for K. pneumoniae show up as essential
(density per number of genes). In orange, presence of all new essential genes in the whole
DEG database; in light-blue, the subset of new essential genes annotated as involved in
cofactor metabolism against all essentiality datasets; in green, new essential genes
annotated as involved in cofactor metabolism against datasets of Gammaproteobacteria
only.
108 | CHAPTER 3 Essential Cofactors in Prokaryotes
To gain further insight into the biomass-dependency of essentiality
predictions, the altered predictions were classified as new dispensable (negatives)
or new essential (positives) reactions, i.e. essential with the original BOF, but not
with the new BOF, or vice-versa. In the case of Synechocystis sp., between 29.4 and
32.8% of essential reactions were different when using an alternative biomass
composition (Figure 3.2b). Most of these new predictions, however, (from 97.6 to
100%) were reactions that became dispensable (new negatives) due to essential
components for photosynthesis being removed with the swap (Figure 3.2b;
Supplementary Table 3.9). Interestingly, in some swaps, new essential reactions
were a larger proportion of the overall change. The extreme case was that of
iYL1228 (Klebsiella pneumoniae) with the BOF of iAF1260 (E. coli), wherein 82
(67.7%) of the predictions were new essentials. The BOF of iAF1260 brings 19 new
components that iYL1228 can produce (Supplementary Table 3.7; Figure 3.2b).
Both species are closely related, belonging to Enterobacteriaceae, a common family
of Gammaproteobacteria that includes known pathogens causing concerns due to
multidrug-resistance (Pitout & Laupland 2008), which indicates that the biomass
compositions of the two species might be similar and hints at possible gaps in the
BOF of iYL1228.
3.2.3 Newly Predicted Essential Genes Have Essential
Orthologs in Multiple Species And Are Related With
Cofactor Metabolism
To investigate the essentiality and the biological role of the predicted new
essential genes of iYL1228, given that there is no large-scale experimental assay of
gene essentiality for K. pneumoniae, these genes were checked for whether they map
to known essential genes in other bacteria. To this end, 33 gene essentiality datasets
were used, covering 24 bacterial species, as available in the Database of Essential
Genes (DEG) (Luo et al. 2014) (Figure 3.2a). The 52 new essential genes from K.
pneumoniae (Supplementary Table 3.10) were mapped to DEG essential genes by
using functional annotation and protein sequence comparison (BLASTP). 38 of the
CHAPTER 3. Essential Cofactors in Prokaryotes | 109
genes mapped to essential genes in at least 5 experimental datasets with both
BLASTP and functional annotation. Similarly, 21 genes mapped, with both of the
searching methods, to 11 or more datasets (1/3rd of the total datasets, spanning 8 or
more different species) where these genes were experimentally determined as
essential (Figure 3.2c, Supplementary Table 3.11).
The vast majority of the new essential genes (44) are annotated to functions
related with biosynthesis of cofactors and prosthetic groups (Figure 3.2c).
Moreover, all of the 21 genes found in at least one third of the datasets belong to this
metabolic subsystem. For the subset of 44 cofactor-associated new essential genes,
the median presence of a gene in DEG datasets is 31.8%; when additionally
narrowing the searched DEG datasets for γ-Proteobacteria only (the class of K.
pneumoniae), the median presence of a gene increases to 50% (Figure 3.2d).
3.2.4 Integration of Multiple Data Sources Reveals
Universally Essential Cofactors
The true-positive rate of cofactor-related essential genes of iYL1228 in γ-
Proteobacteria when using the biomass composition of iAF1260 indicates organic
cofactors as crucial but missing biomass components in prokaryotic GSMs. To close
this gap, the research proceeded to identify universally essential cofactors (or
classes thereof) for prokaryotes that will improve accuracy and comparability of
GSMs. For this, multiple large-scale datasets were integrated (Figure 3.3a). The
compositions of cofactor pools of GSMs (Supplementary Table 3.12) were not used
as evidence due to the lack of biological consistency and standards mentioned
above. Three levels of evidence were used. A: the essentiality of genes involved in
the biosynthesis of the cofactor(s) (Supplementary Tables 3.13 and 3.14). B: the
participation of the cofactor(s) in reactions catalyzed by essential enzymes as per
the enzyme-cofactor association data from BRENDA (Chang et al. 2015)
(Supplementary Tables 3.15, 3.16 and 3.17). C: reviewed evidence, including the
ModelSEED template (Supplementary Table 3.5) and an extensive review of
publications on prokaryotic organic cofactors (Supplementary Tables 3.18 and
110 | CHAPTER 3 Essential Cofactors in Prokaryotes
3.19). Each level of evidence was scored on a scale from 0 to 1 (details in figure
caption). The results indicate 8 universally essential cofactors – nicotinamide
adenine dinucleotide (NAD), nicotinamide adenine dinucleotide phosphate (NADP),
S-adenosyl-methionine (SAM), flavin adenine dinucleotide (FAD), pyridoxal 5-
phosphate (P5P), coenzyme A (COA), thiamin diphosphate (THMPP) and flavin
mononucleotide (FMN) plus one class of cofactors, which were identified as C1
carriers (includes tetrahydrofolates for bacteria and tetrahydromethanopterins for
most Archaea), results summarized in Figure 3.3b. Highly essential cofactors with
less evidence and for which there are some known exceptions were classified as
conditionally essential cofactors, in which case either the phylogenetic branch not
requiring this cofactor (e.g. most archaea do not use ACP) or metabolic modes in
which it is not essential were identified. In the Supplementary Discussion and
Supplementary Table 3.18 this classification is discussed and metadata on functional
role, alternative nomenclature, related compounds, known transport systems and
specificities that illustrate the complexity of the cofactor usage in prokaryotes is
summarized.
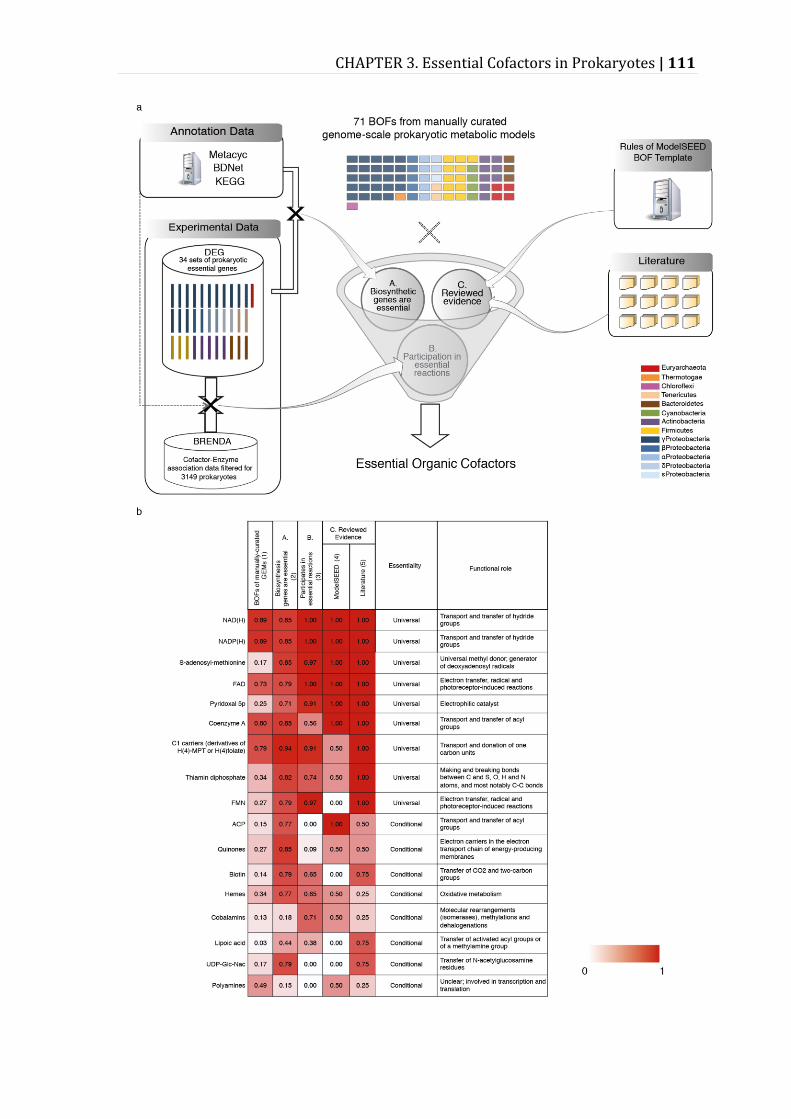
CHAPTER 3. Essential Cofactors in Prokaryotes | 111
112 | CHAPTER 3 Essential Cofactors in Prokaryotes
Figure 3.3 – Essential cofactors for prokaryotic metabolism. (a). Data integration pipeline
used towards the identification of universally and conditionally essential cofactors. Color-
code of BOF and DEG datasets according to phyla. (b) Scores of prevalence of high-ranking
prokaryotic essential cofactors, or classes thereof, in different analyses. Cofactor classes
were defined after data integration as sets of functionally related molecules for which at
least one representative should be chosen for simulations of biomass production. Capital
letters A, B and C refer to the levels of evidence shown in (a). (1) Fraction of manually-
curated GEMs in which the BOF contained the cofactor. (2) Fraction of DEG datasets in
which there was at least one essential biosynthetic gene for the cofactor. (3) Fraction of DEG
datasets in which there was at least one essential gene coding for a reaction in which the
cofactor participates. (4) ModelSEED classification of essentiality: 1 - universal; 0.5 -
conditional; 0 - not in the template. (5) Literature rational score: 1 - no exception found in
the literature; 0.75 - several essentiality cases reported but at least one exception found;
0.25 - several exceptions found. See Supplementary Discussion and Supplementary Tables
3.18 and 3.19 for full descriptions of exceptions.
3.2.5 New Pathways and Improved Gene Essentiality
Predictions for Mycobacterium tuberculosis
To substantiate the proposal of essential cofactors for prokaryotic life, the
genome-scale model of Mycobacterium tuberculosis iNJ661v (Fang et al. 2010) was
chosen, for this is a species for which there exists comprehensive experimental data
for validations of predictions (Sassetti et al. 2003). Furthermore, although several
GSMs have been built and improved for M. tuberculosis (Beste et al. 2007, Fang et al.
2010, Jamshidi & Palsson 2007), none of the BOFs include all of the here-proposed
universally essential cofactors (conditionally essential cofactors were excluded from
this analysis). In iNJ661v, although the BOF was missing NAD, NADP, COA, FAD,
FMN, SAM and P5P, the network was able to produce all of these cofactors with the
exception of P5P. To resolve the latter, the literature was searched for the known
biochemistry regarding P5P in M. tuberculosis. Indeed, experimental evidence was
found not only for a de novo pathway for P5P production that was missing in the
model, but also for the essentiality of P5P for growth, survival and virulence of M.
tuberculosis (Dick et al. 2010). After completing the BOF with all the mentioned
universal cofactors that were missing, the new biosynthetic reaction of P5P was
added to the model together with the two biosynthetic genes associated. This
completed picture of P5P biosynthesis in M. tuberculosis is shown in Figure 3.4. The
experimental study by Dick et al., that validated the P5P de novo pathway, reports
CHAPTER 3. Essential Cofactors in Prokaryotes | 113
that the growth of a mutant in this pathway could be rescued when providing
pyridoxine in the medium (Dick et al. 2010). This indicates that one or all of the
phosphorylations of pyridoxine, pyridoxamine or pyridoxal for which there is no
genetic evidence must occur, and the gene(s) encoding them remain to be
discovered. To test the modified model for its ability to predict gene essentiality,
single gene knockouts were simulated in an in silico medium mimicking
Middlebrook media (used in the experimental assay for validation of the predictions
(Sassetti et al. 2003); Methods). Indeed, the gene essentiality predictions improved
for the cofactor metabolic pathways, with 7 new true positive predictions
(Supplementary Tables 3.20 and 3.21). The corresponding proteins are also
expressed in M. tuberculosis (Schubert et al. 2013), adding more evidence to the
findings of this work.
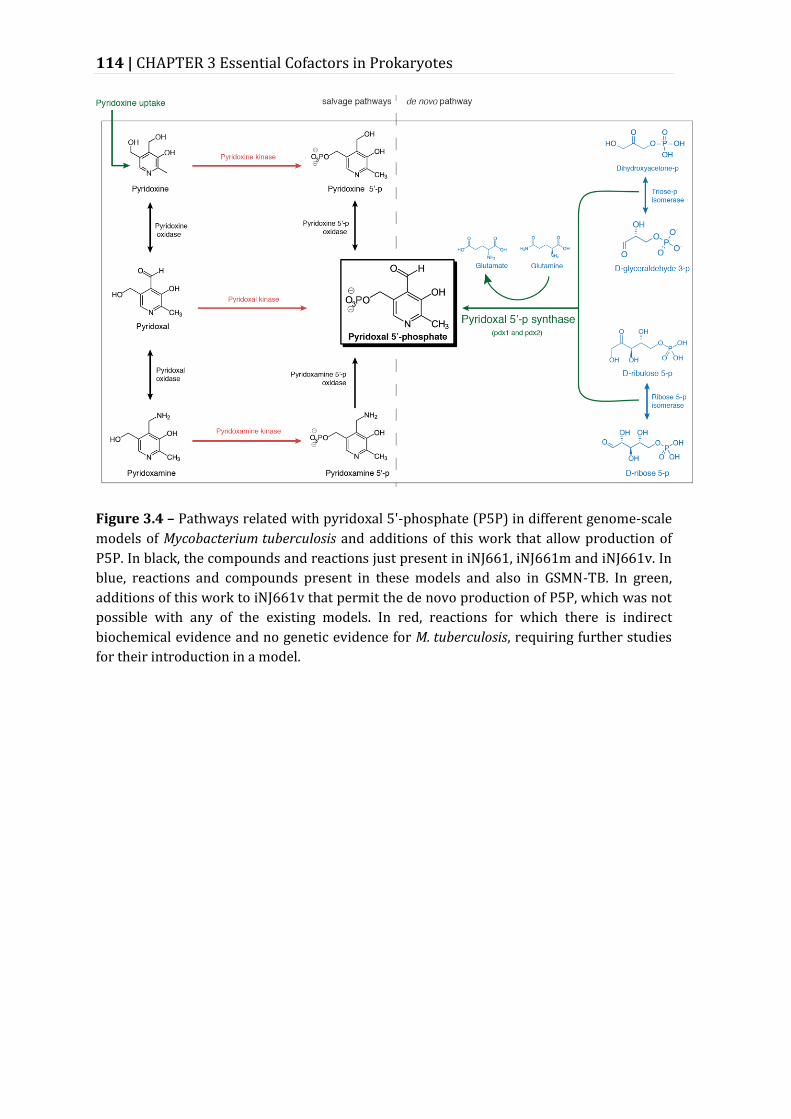
114 | CHAPTER 3 Essential Cofactors in Prokaryotes
Figure 3.4 – Pathways related with pyridoxal 5'-phosphate (P5P) in different genome-scale
models of Mycobacterium tuberculosis and additions of this work that allow production of
P5P. In black, the compounds and reactions just present in iNJ661, iNJ661m and iNJ661v. In
blue, reactions and compounds present in these models and also in GSMN-TB. In green,
additions of this work to iNJ661v that permit the de novo production of P5P, which was not
possible with any of the existing models. In red, reactions for which there is indirect
biochemical evidence and no genetic evidence for M. tuberculosis, requiring further studies
for their introduction in a model.
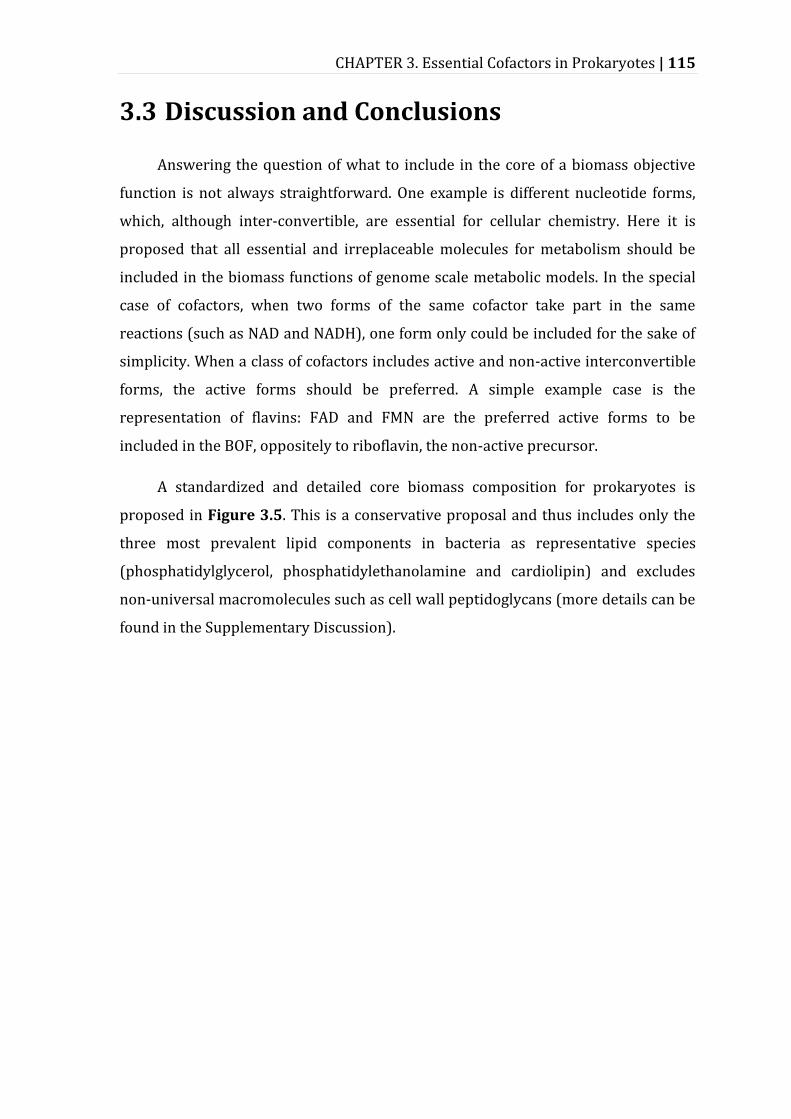
CHAPTER 3. Essential Cofactors in Prokaryotes | 115
3.3 Discussion and Conclusions
Answering the question of what to include in the core of a biomass objective
function is not always straightforward. One example is different nucleotide forms,
which, although inter-convertible, are essential for cellular chemistry. Here it is
proposed that all essential and irreplaceable molecules for metabolism should be
included in the biomass functions of genome scale metabolic models. In the special
case of cofactors, when two forms of the same cofactor take part in the same
reactions (such as NAD and NADH), one form only could be included for the sake of
simplicity. When a class of cofactors includes active and non-active interconvertible
forms, the active forms should be preferred. A simple example case is the
representation of flavins: FAD and FMN are the preferred active forms to be
included in the BOF, oppositely to riboflavin, the non-active precursor.
A standardized and detailed core biomass composition for prokaryotes is
proposed in Figure 3.5. This is a conservative proposal and thus includes only the
three most prevalent lipid components in bacteria as representative species
(phosphatidylglycerol, phosphatidylethanolamine and cardiolipin) and excludes
non-universal macromolecules such as cell wall peptidoglycans (more details can be
found in the Supplementary Discussion).
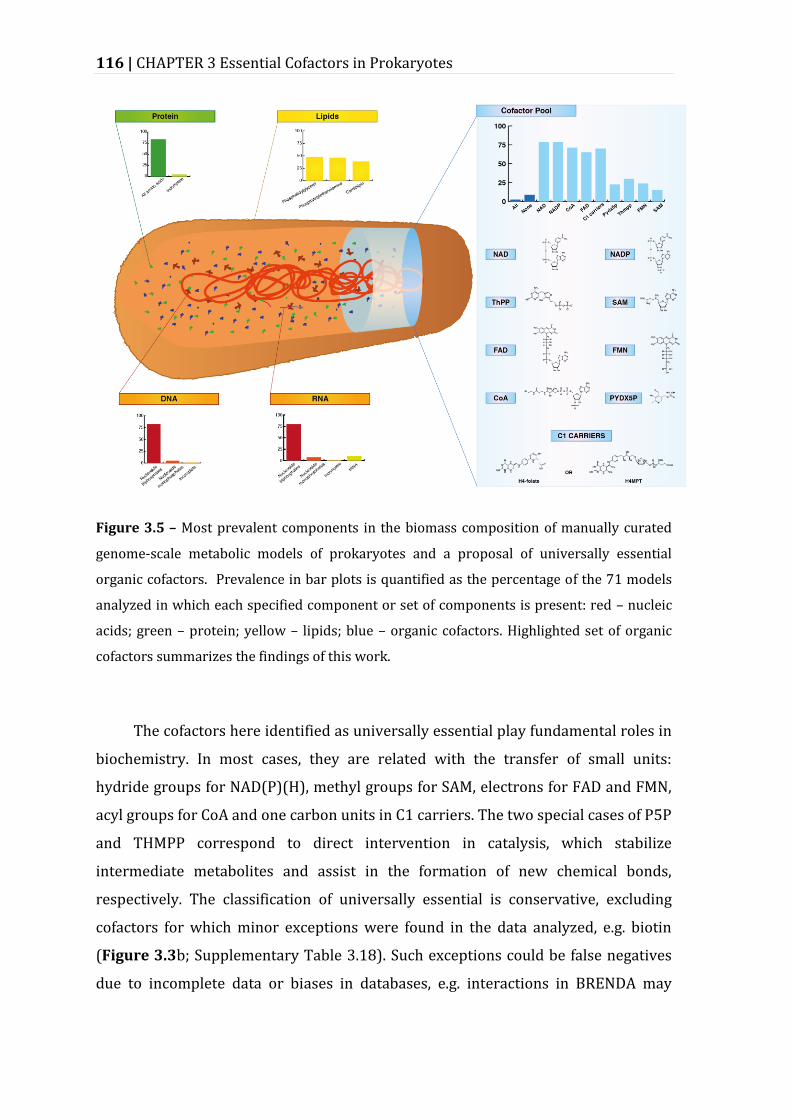
116 | CHAPTER 3 Essential Cofactors in Prokaryotes
Figure 3.5 – Most prevalent components in the biomass composition of manually curated
genome-scale metabolic models of prokaryotes and a proposal of universally essential
organic cofactors. Prevalence in bar plots is quantified as the percentage of the 71 models
analyzed in which each specified component or set of components is present: red – nucleic
acids; green – protein; yellow – lipids; blue – organic cofactors. Highlighted set of organic
cofactors summarizes the findings of this work.
The cofactors here identified as universally essential play fundamental roles in
biochemistry. In most cases, they are related with the transfer of small units:
hydride groups for NAD(P)(H), methyl groups for SAM, electrons for FAD and FMN,
acyl groups for CoA and one carbon units in C1 carriers. The two special cases of P5P
and THMPP correspond to direct intervention in catalysis, which stabilize
intermediate metabolites and assist in the formation of new chemical bonds,
respectively. The classification of universally essential is conservative, excluding
cofactors for which minor exceptions were found in the data analyzed, e.g. biotin
(Figure 3.3b; Supplementary Table 3.18). Such exceptions could be false negatives
due to incomplete data or biases in databases, e.g. interactions in BRENDA may
CHAPTER 3. Essential Cofactors in Prokaryotes | 117
exclude carrier cofactors like CoA, ACP and quinones (more details in the
Supplementary Discussion).
Updating the biomass composition in metabolic models allowed for the
identification of new candidate essential genes for K. pneumoniae, backed by
experimental genetic evidence for orthologues of related species. These could serve
as potential drug targets for K. pneumoniae, a pathogen causing urgent concerns
regarding antibiotic resistance (Kontopidou et al. 2014, Snitkin et al. 2012). The
importance of using a comprehensive biomass composition for M. tuberculosis is also
demonstrated. The modifications done to iNJ661v successfully led to the
identification of a previously validated pathway for vitamin B6 biosynthesis, which
was missing in the current model, and improved gene essentiality predictions.
When a new (essential) component is included in the BOF, it implies that this
component needs to be provided, either through the biosynthetic pathway or via
transport reactions. The construction of more complete and standardized BOFs will
thus have a great impact not only in the predictions of essential genes but also in the
construction of minimal media required for growth. Both applications are of utmost
importance for pathogens, being in fact the most common motivations to construct
GSMs for those organisms.
Overall, this work lays foundations for improving the definition of biomass
composition in the current and future metabolic reconstructions – an important step
towards biochemically more accurate models with higher predictive power.
Moreover, it is the first large-scale systematization of essential metabolic organic
cofactors for prokaryotes, which will be central in several fundamental and applied
studies.
118 | CHAPTER 3 Essential Cofactors in Prokaryotes
3.4 Supplementary Discussion
3.4.1 Sensitivity to Errors and Incompleteness in
Databases
The deduction of essentiality of cofactors in this study is directly related to the
results of several genome-scale assays of gene-essentiality stored in the database of
essential genes (DEG) (Luo et al. 2014). On a first level, although most of the
experiments are performed under rich media conditions, which benefits the
conservative deduction of universal essentiality done here, the heterogeneity of
experimental conditions of the assays should be noted, with one dataset of
Salmonella enterica with conditional essential genes only (determined under
different selective conditions of temperature and nutrients) (Khatiwara et al. 2012).
Secondly, not all the datasets in DEG are exhaustive genome-scale assays of
essentiality, for example with one dataset of Pseudomonas aeruginosa PAO1
consisting of antibiotic resistance genes (Gallagher et al. 2011).
DEG datasets indicate non-essentiality for some cofactors that are classified as
universally essential. Some specific cases are noted below. Generally, even without
the above-mentioned limitations, error-free datasets would not be guaranteed (as
reviewed in (Gil et al. 2004) and (Yang et al. 2014)). Transposon mutant libraries,
used in the majority of datasets in DEG (Luo et al. 2014), can overestimate
essentiality through the misclassification of very slow growth mutants as lethal
phenotypes. Reversely, essential genes might be classified as dispensable if they
tolerate transposon insertions being nevertheless transcribed and translated to
functional proteins. Even if consisting only of true classifications, single gene
knockout mutant libraries are usually not sufficient for the deduction of functional
essentiality. This occurs due to the well-known redundancy that is hard-wired in
bacterial metabolism, where alternative pathways allow many times for the
biosynthesis, salvage and import of several important molecules, including organic
cofactors. These pathways are not always known, especially in the case of less
studied species. Multiple simultaneous gene-knockouts would be required to
CHAPTER 3. Essential Cofactors in Prokaryotes | 119
confirm some cases of essentiality classification. Nevertheless, the approach here is
conservative as it integrates gene essentiality data with different other types of data,
deducing as universally essential only the cofactors with a high confidence level
from the integrated data.
Regarding BRENDA, only full EC numbers were mapped to essential genes.
Also, some cofactors considered here (e.g. ACP and polyamines) are not present in
the cofactor-enzyme association datasets in the database. This decreases the level of
evidence for some cofactors, and therefore the confidence of the deduction here
would probably increase with the addition of this information.
3.4.2 Universally Essential Cofactors
Here some details on the classification of universal essentiality are discussed
for the different cofactors based on the integration of databases described in section
3.2. For further details, refer to Supplementary Tables 3.18 and 3.19.
3.4.2.1 NAD(H) and NADP(H)
The common redox cofactors are accepted as universally essential without
controversy; there are no reports in the literature of the dispensability of these
cofactors. Several transporters exist for precursors. The dataset of essentiality of
Pseudomonas aeruginosa PAO1 in DEG, mentioned already as a set of resistance-
related genes, is the only dataset integrated with BRENDA in the current work
where no essential gene dependent on NAD(H) was found.
3.4.2.2 S-adenosyl-methionine (SAM)
As a universal methyl donor and a key element in the "methylation cycle", SAM
plays a fundamental role in metabolism. It is also a generator of deoxyadenosyl
radicals, a regulator of transcription (McDaniel et al. 2003) and a direct intervenient
in the assembly of the septal ring in cytokinesis. Integration of DEG and BRENDA
always reveals essential genes depending on this cofactor, with the exception of one
dataset of Salmonella, although others for the same species disagree. The integration
of biosynthetic annotation data with essentiality provides moderate evidence for
120 | CHAPTER 3 Essential Cofactors in Prokaryotes
essentiality, probably due to the known existence of several transporters for this
vitamin which surpass the necessity of a biosynthetic route in some species or
environments (Binet et al. 2011, Haferkamp et al. 2013, Tucker et al. 2003).
A study with Escherichia coli claims depletion of SAM to very low levels using a
SAM hydrolase (Posnick & Samson 1999). Others reported temperature-sensitive
mutants of metK (a gene involved in SAM biosynthesis) that were genetically
unstable and required methionine for growth (Satishchandran et al. 1990). A later
study reviewed metK mutants as leaky, resulting in phenotypes as diverse as
overproduction of methionine, methionine auxotrophy or complete inability to grow
on defined media; however, all of these phenotypes included a residual SAM
synthetase activity (Newman et al. 1998).
Contradicting these results, metK is classified as essential by at least 23
prokaryotic datasets of genome-scale essentiality in rich media, in DEG. Moreover,
El-Hajj and colleagues reported in 2013 that the isolation of mutants totally deficient
in SAM synthase became possible only with the isolation and cloning of a SAM
transporter from Rickettsia prowazekii (Tucker et al. 2003) into an E. coli plasmid,
allowing the metK mutant to grow in rich medium with an exogenous SAM supply
(Driskell et al. 2005). El-Hajj and colleagues used this transporter to study SAM
metabolism in further detail (El-Hajj et al. 2013).
3.4.2.3 FAD and FMN
Flavins are accepted as the universal currency for electron transfer, radical and
photoreceptor-induced reactions. Riboflavin is commonly represented in the
biomass objective functions (BOFs) of genome-scale metabolic models (GSMs) even
though it is biologically inactive; there are known transporters for this precursor
(García Angulo et al. 2013, Vogl et al. 2007). All datasets in DEG show at least one
essential enzyme depending on FAD (Supplementary Table 3.16).
3.4.2.4 Pyridoxal-5-phosphate (P5P)
Several reviews indicate P5P as universal and essential (Christen & Mehta
2001, Fitzpatrick et al. 2007, Percudani & Peracchi 2003), even though only 25% of
GSMs include it in the BOF. It binds covalently to its substrates, which can hinder
CHAPTER 3. Essential Cofactors in Prokaryotes | 121
measurements of the free vitamin available in the cell. There are known alternative
pathways to the production of this vitamin, which also hinder inference of
essentiality from single gene knockout studies (Kim et al. 2010).
Further experimentation would be required with Campylobacter jejunii, as the
dataset from DEG used here (Metris et al. 2011) indicates non-essentiality when
crossed with BRENDA, but another study indicates possible essentiality of pdxA,
involved in P5P biosynthesis (Stahl & Stintzi 2011). A recent study reported non-
essentiality of pdxA and a full depletion of P5P production, achieved with that single
deletion (Asakura et al. 2013), although several questions can be posed regarding
the use of those results for the purpose of this work: the use of a rich, undefined
medium which most probably contains the vitamin or other vitamers or the more
than two fold increase in the direct precursor of P5P in an alternative biosynthetic
pathway (pyridoxamine 5 phosphate). Moreover, the residual amounts reported in
the mutants could be sufficient for growth, as an amount of 6.0 ng/mL of pyridoxal
has shown to be the growth-limiting concentration for mutants of E. coli (Scott &
Hockney 1979).
3.4.2.5 Coenzyme A (CoA)
As the universal carrier of acyl groups in cells, reported as used by 4% of all
known enzymes, CoA is commonly accepted as universally essential (Begley et al.
2001). Most species in the datasets used here have essentials genes involved in the
biosynthesis of this cofactor, with the exception of the species of the genus
Mycoplasma. It has been postulated that, along with other pathogens as Rickettsia
and Chlamydia, these species can uptake dephospho-CoA (Spry et al. 2008).
3.4.2.6 C1 Carriers
Tetrahydrofolates in bacteria and some Archaea, and
tetrahydromethanopterins in some other Archaea play the essential role of
transport and donation of one-carbon units in metabolism (De Crécy-Lagard et al.
2012). The data in this study supports the essential biosynthesis of the active forms
of these cofactors for all species analysed in at least one dataset. Regarding essential
enzymes in BRENDA depending on these cofactors, all datasets in DEG show at least
122 | CHAPTER 3 Essential Cofactors in Prokaryotes
one, with the exception of the incomplete datasets referred in section 3.4.1 and the
dataset for the archaea, which depends on methanopterins not included in BRENDA.
3.4.2.7 Thiamin diphosphate
Thiamin diphosphate assists in making and breaking bonds between several
atoms in metabolic reactions, most notably C-C bonds (Frank et al. 2007). As there
are transporter systems identified and assayed, especially for Salmonella (reviewed
in (Begley et al. 1999)) the essentiality of biosynthetic genes alone is inconclusive.
However, in three cases where the integration of DEG with BRENDA does not reveal
essentiality of thiamine, the annotation of essential biosynthetic genes gives
evidence of it: Burkholderia, Campylobacter and Mycoplasma. In the case of S. aureus,
the requirement of this cofactor has been shown experimentally (Gretler et al. 1955,
Mah et al. 1967), as for H. pylori (Nedenskov 1994) and Streptococcus sanguinis
(Carlsson 1972).
3.4.3 Conditionally Essential Cofactors
Cofactors in this section showed a lower average level of evidence for universal
essentiality (see Figure 3.3b in Results section and Supplementary Tables 3.14 and
3.17). Here the role of these cofactors in prokaryotic metabolism that can justify
these results is discussed. The known cases where they are known to be not
essential are mentioned.
3.4.3.1 Acyl-carrier protein (ACP)
ACP shares with CoA the 4-phosphopantetheine moiety, performing the same
function as the latter cofactor as a carrier of acyl groups. It does not have the
characteristics of most other cofactors, which can justify its absence from BRENDA
cofactor association data, but it is considered a cofactor protein, essential for the
synthesis of new membrane in all bacteria. It is currently believed that Archaea
carry out fatty acid synthesis in an ancient ACP-independent manner, and most
species lack ACP and its related enzymes (Lombard et al. 2012). The other species
for which there was no evidence from essential biosynthetic genes related with ACP
were Burkholderia pseudomallei, for which there is experimental evidence of
CHAPTER 3. Essential Cofactors in Prokaryotes | 123
essentiality (Cummings et al. 2014), and for Bacteroides thetaiotaomicron. However,
in a close relative to the later, Bacteroides fragilis, the gene putatively encoding for
ACP is essential and thus further experimentation is required regarding that
organism.
3.4.3.2 Quinones
Quinones are essential for all chemiosmotic (respiratory or photosynthetic)
energy-converting systems, allowing for electron movement across membranes,
with the exception of those of methanogenic organisms (Schoepp-Cothenet et al.
2009). Strict fermentative metabolism does not require quinones, but even though
some bacteria that are obligatorily fermentative have lost their ability to synthesize
quinones (being the best studied Lactobacillus, Streptococcus and Bifidobacterium
(Walther et al. 2013)), some of the species still retain the biosynthetic pathway
(Nowicka & Kruk 2010) and the electron transport chain and respiratory
metabolism can be induced by the presence of both environmental quinones and
heme (Brooijmans et al. 2009, Yamamoto et al. 2005). Interest has been raising by
the fact that cultures of other anaerobes do produce several menaquinones, in
sufficient amounts to provide dietary requirements (e.g. Lactococcus lactis and
Brevibacteirum (Walther et al. 2013)). Given that quinones play other functions in
prokaryotic cells, they can actually be essential in some types of fermentative
metabolism (Kato et al. 2010). The phylogenetic distribution of quinones is
widespread across prokaryotes (Collins & Jones 1981) and the data in this study
indicates essentiality of biosynthetic genes for many of the species in DEG, even
those with a versatile metabolism. More studies are required to analyse the
essentiality of quinones in versatile conditions.
3.4.3.3 Biotin
Biotin plays a crucial role in the transfer of CO2 and two-carbon groups,
although the data in this study fails to provide evidence of essentiality of this
cofactor in several species. It has been reported that Buchnera sp., Borrelia
burgdorferi, Aeropyrum pernix, thermoplasmas and mycoplasmas have neither the
biotin biosynthetic genes nor birA, a bifunctional protein which acts both as a
biotin–protein ligase and as a transcriptional repressor of the biotin operon
124 | CHAPTER 3 Essential Cofactors in Prokaryotes
(Rodionov et al. 2002). For Mycoplasma, it was also reported earlier that some
strains have a biotin requirement, and others do not (Smith 1991). In E. coli and
other species, it was shown that there is a strict requirement for this cofactor
(Finkenwirth et al. 2013).
3.4.3.4 Hemes
Heme situation in metabolism is very similar to that of quinones, in that it is
essential for both the aerobic and anaerobic respiration, and it has also been shown
that its biosynthesis is coupled to it (Möbius et al. 2010). In the absence of
exogenous heme or the ability to produce it, some species can live on fermentative
metabolism. These include lactic acid bacteria and some opportunistic and
endosymbiotic species (Gruss et al. 2012, Lechardeur et al. 2011). Other species
however have been shown to have a strict requirement for heme, including
Porphyromonas gingivalis, Bacteroides fragilis and Haemophilus influenzae either for
the activation of cytochrome oxidases, fumarate reductases and catalases; other
functions have been identified that might explain the essentiality of heme in some
species, as reviewed in (Gruss et al. 2012). For Escherichia coli, it has been shown
that even though mutants not able to produce heme can grow anaerobically, they
cannot do so in the presence of oxygen, as the expression of fermentative enzymes is
limited to anaerobic growth conditions by the activity of redox response regulators
(Rompf et al. 1998).
3.4.3.5 Cobalamins
Adenosylcobalamin, methylcobalamin and adocobalamin are important in
isomerization reactions, methylations and dehalogenations. For E. coli and related
species, they are only strictly essential in specific environments where glycerol,
propanediol and/or ethanolamine are important sources of carbon or nitrogen and
energy (Fowler et al. 2010). Other cases where essentiality was demonstrated are
methanogenic archaea (Martens et al. 2002) and Rhodocyclus purpureus (Pfennig
1978). A comparative genomics study identified the absence of cobalamin
biosynthetic genes and regulatory elements in most obligate pathogenic bacteria
and in Aquifex aeolicus (Rodionov et al. 2003).
CHAPTER 3. Essential Cofactors in Prokaryotes | 125
3.4.3.6 Lipoic Acid
Also called lipoate, it is essential for several key enzyme complexes in oxidative
and one carbon metabolism, including pyruvate dehydrogenase and α-ketoglutarate
dehydrogenase (Spalding & Prigge 2010). It is therefore not strictly essential in
facultative anaerobes, anaerobic organisms and the special case of the
microaerophilic H. pylori (Spalding & Prigge 2010).
3.4.3.7 UDP-Glc-Nac
UDP-n-acetyl-d-glucosamine is a universal donor in the transfer of N-
acetylglucosamine residues, essential for the synthesis of the cell wall in
prokaryotes (Namboori & Graham 2008). Currently it is accepted that only
Mycoplasma does not require this cofactor, as it does not produce cell wall (Du et al.
2000).
3.4.3.8 Polyamines
The role of polyamines in prokaryotic metabolism (the most common in
Bacteria and Archaea being putrescine and spermidine) is ubiquitous, as reviewed in
(Schneider & Wendisch 2011). The analysis done here included them as organic
cofactors mainly due to their classification in GSMs, which have included them
broadly (49%). However, polyamines act more as stabilizers and signaling
molecules and are not usually considered as cofactors (Shah & Swiatlo 2008) (for
this reason, as with ACP, no essential enzymes are matched as depending on them).
It has been reported that polyamines are essential for normal growth (Shah &
Swiatlo 2008), even though their essentiality is not prevalent, with reported
dispensability in E. coli (Hafner et al. 1979), Yersinia pestis (Patel et al. 2006) and
several other species (Bitoni & Mccann 1987).
3.4.4 Other Details on Modeling Biomass Compositions
Biomass objective functions were formulated in different manners in the field
of metabolic modeling: direct biosynthesis from precursor metabolites (Varma &
Palsson 1993a,b); biosynthesis from building blocks (Feist et al. 2007, Varma et al.
126 | CHAPTER 3 Essential Cofactors in Prokaryotes
1993) or biosynthesis from macromolecules (Liao et al. 2011), using lumped
reactions for each (Villadsen et al. 2011). Also, there is no consensus on how each
component should be included in BOFs. For example, Coenzyme A, an important
cofactor in lipid metabolism, is represented in isolation in the solute pool in some
cases, charged with lipids in some, and is even excluded in others. These different
ways of formulating BOFs, together with nomenclature inconsistencies that have
been addressed elsewhere (Bernard et al. 2014, Kumar et al. 2012, Sauls & Buescher
2014), hinder comparative studies involving manually curated GSMs.
There are few exceptions in which the introduction of an essential component
in the BOF might bring additional questions unaddressed in the context of GSMs.
This is the case of the acyl carrier protein (ACP) and potentially other protein-based
components. ACP is included in the ModelSEED universal template for biomass
composition and is considered to be essential in most organisms. However, its
inclusion in the BOF implies the introduction of a biosynthetic pathway in the model,
which might lead to inconsistencies, as no other protein has a dedicated pathway in
GSMs. An alternative would be to include an artificial transport reaction, which
implies adding information to the model that has no correspondence in reality.
Another situation with even higher biological relevance is that of RNA. Some
models already include tRNA and the essential reactions and genes that charge each
individual tRNA molecule with its respective amino acid. There is, however, a
generalized absence of mature rRNA in GSMs, which pool also needs to be
maintained stable, by duplicating with each cell division, involving metabolic
transformations (Deutscher 2009).
The biomass composition of a cell can change with different growth conditions
within the same strain (Blazewicz et al. 2013, Cotner et al. 2006, Pramanik &
Keasling 1998, Vu et al. 2012). Setting a standardized average core biomass
composition is only the starting point for increasingly better, more predictive
genome-scale metabolic models.
CHAPTER 3. Essential Cofactors in Prokaryotes | 127
3.5 Methods
3.5.1 Collection and Comparison of Detailed BOFs in GSMs
Manually-curated GSMs of prokaryotes were searched for in four major online
databases: BiGG (Schellenberger et al. 2010), MetRxn (Bernard et al. 2014),
BioModels (Chelliah et al. 2015), GSMNDB (Systems Biology and Metabolic
Engineering Research Group at the Tianjin University 2014) and in an updated list of
GSMs as per Palsson group website (Systems Biology Research Group at the
University of California San Diego 2014). The biomass composition was, whenever
possible, retrieved directly from the model file; if the model was not available or not
accessible, the composition, along with the metadata, was taken from the publication
(Supplementary Table 3.1). For the cases where several important macromolecules
or the solute pool were represented in lumped reactions, the composition from the
individual lumped reactions was deconstructed. For nomenclature standardization,
an initial list with all the metabolites from BOFs of GSMs built with BiGG
nomenclature was created. Each individual component of all remaining BOFs was
matched against that list, with the help of mappings of ModelSEED (Henry et al.
2010b). The non-matching metabolites were checked manually for matches with
alternative names. Several species-specific tagged metabolites were discarded,
although if they could be matched as generalist lipids (e.g. phosphoethanolamine) or
peptidoglycan the tag would be removed or the id would be substituted by the more
general id. For yet non-matching metabolites, a new entity and id was created in the
list (Supplementary Tables 3.2, 3.3 and 3.4).
The ModelSEED template for universal biomass components was obtained
from the original publication (Henry et al. 2010a).
3.5.2 Cluster Analysis
Hierarchical clustering was performed using ‘pvclust’ R package (Suzuki &
Shimodaira 2006) with binary distance as a dissimilarity metric and Ward 1 method
as the linkage criterion. For accessing uncertainty, approximately unbiased p-values
128 | CHAPTER 3 Essential Cofactors in Prokaryotes
were calculated via multiscale bootstrap resampling. All statistical analyses were
performed using R statistical software version 3.1.
3.5.3 BOF Swap
Five different GSMs were chosen by sampling high and low phylogenetic
dissimilarity pairs in order to assess the impact of BOFs in predictions of essentiality
(Figure 3.2a-b; Supplementary Table 3.1 for corresponding phyla). When adding a
new BOF to a model, the model was verified to contain all new metabolites added,
and if not, those were removed from the BOF (Supplementary Table 3.7). It was also
checked that the wild-type network was viable with all the existing import drains set
for simulation of nutrient import (20 mmol/gDW/h). Often some metabolites were
not added, either for not being represented in the model at all, or for being end-
points of blocked pathways in the network. The same media conditions were used
for simulations before and after all swaps. The swaps likely alter the interpretation
(units) of biomass in the BOF, which however does not affect the Boolean results of
feasibility of biomass production.
3.5.4 Simulations of Reaction/Gene Deletion Phenotypes
Simulations of maximum growth rates for single-deletions of reactions and
genes were performed using Flux Balance Analysis (FBA) (Savinell & Palsson 1992,
Varma & Palsson 1993a). For the study of the impact of BOF swap in essentiality
predictions, the flux through the BOF was calculated and mapped directly for each
reaction deletion in each model. For the validation of results for K. pneumoniae with
experimental data, individual gene knockouts were generated for all model genes
and the flux through the BOF was accessed and mapped to each gene. All modeling
procedures were implemented in C++ and solved using IBM ILOG CPLEX solver.
CHAPTER 3. Essential Cofactors in Prokaryotes | 129
3.5.5 Mapping In Silico Essential Genes with Large-Scale
Experimental Essential Datasets
Searches in DEG (Luo et al. 2014) were performed manually for each of the 52
new essential genes of iYL1228 (see Results section). Matching was done by
searching for the corresponding gene annotation and, independently, with BLASTP
in DEG with an E-value threshold of 10e-6.
3.5.6 Data Extraction and Integration
All enzyme-cofactor association data for prokaryotes was extracted using the
Python SOAP access methods for BRENDA (Chang et al. 2015). Biosynthetic genes
for each cofactor or class of cofactors identified in the cross-integration of DEG and
BRENDA were extracted manually from Metacyc (Caspi et al. 2014). For the mapping
of gene names in DEG with BRENDA and Metacyc, bioDBNet (Mudunuri et al. 2009)
and KEGG (Kanehisa et al. 2014) were used.
3.5.7 Modification of iNJ661v
All changes described in the Results section were performed manually on the
original SBML file for iNJ661v. To simulate Middlebrook media as used in the
genome-scale experimental assay for validation of the predictions (Sassetti et al.
2003), new transporters for biotin and pyridoxine were added). The upper bounds
of all the respective uptakes of the constituents were set to 20 mmol/gDW/h, with
the exception of albumin, zinc, catalase and oleic acid (not modeled).
References
Asakura H, Hashii N, Uema M, Kawasaki N, Sugita-Konishi Y, et al. 2013.
Campylobacter jejuni pdxA affects flagellum-mediated motility to alter host
colonization. PLoS One. 8(8):e70418
Begley TP, Downs DM, Ealick SE, McLafferty FW, Van Loon APGM, et al. 1999.
Thiamin biosynthesis in prokaryotes. Arch. Microbiol. 171:293–300
130 | CHAPTER 3 Essential Cofactors in Prokaryotes
Begley TP, Kinsland C, Strauss E. 2001. The biosynthesis of coenzyme A in bacteria.
Vitam. Horm. 61:157–71
Bernard T, Bridge A, Morgat A, Moretti S, Xenarios I, Pagni M. 2014. Reconciliation of
metabolites and biochemical reactions for metabolic networks. Brief. Bioinform.
15(1):123–35
Beste DJ V, Hooper T, Stewart G, Bonde B, Avignone-Rossa C, et al. 2007. GSMN-TB: a
web-based genome-scale network model of Mycobacterium tuberculosis
metabolism. Genome Biol. 8(5):R89
Binet R, Fernandez RE, Fisher DJ, Maurelli AT. 2011. Identification and
Characterization of the Chlamydia trachomatis L2 S-Adenosylmethionine
Transporter. MBio . 2(3):e00051-11
Bitoni AJ, Mccann PP. 1987. Inhibition of Polyamine Biosynthesis in Microorganisms.
In Inhibition of Polyamine Metabolism: Biological Significance and Basis for New
Therapies, eds. PP McCann, AE Pegg, A Sjoerdsma, pp. 259–75. London:
Academic Press, Inc. 1st ed.
Blazewicz SJ, Barnard RL, Daly RA, Firestone MK. 2013. Evaluating rRNA as an
indicator of microbial activity in environmental communities: limitations and
uses. ISME J. 7(11):2061–68
Bremer H, Dennis PP. 1996. Modulation of chemical composition and other
parameters of the cell by growth rate. Escherichia coli Salmonella Cell. Mol. Biol.
2:1553–69
Brooijmans R, Smit B, Santos F, van Riel J, de Vos WM, Hugenholtz J. 2009. Heme and
menaquinone induced electron transport in lactic acid bacteria. Microb. Cell
Fact. 8:28
Carlsson J. 1972. Nutritional requirements of Streptococcus sanguis. Arch. Oral Biol.
17(9):1327–32
Caspi R, Altman T, Billington R, Dreher K, Foerster H, et al. 2014. The MetaCyc
database of metabolic pathways and enzymes and the BioCyc collection of
Pathway/Genome Databases. Nucleic Acids Res. 42(Database issue):D459–71
Chang A, Schomburg I, Placzek S, Jeske L, Ulbrich M, et al. 2015. BRENDA in 2015:
exciting developments in its 25th year of existence. Nucleic Acids Res.
43(D1):D439–46
Chelliah V, Juty N, Ajmera I, Ali R, Dumousseau M, et al. 2015. BioModels: ten-year
anniversary. Nucleic Acids Res. 43(D1):D542–48
Christen P, Mehta PK. 2001. From cofactor to enzymes. The molecular evolution of
pyridoxal-5’-phosphate-dependent enzymes. Chem. Rec. 1:436–47
CHAPTER 3. Essential Cofactors in Prokaryotes | 131
Collins MD, Jones D. 1981. Distribution of isoprenoid quinone structural types in
bacteria and their taxonomic implication. Microbiol. Rev. 45(2):316–54
Cotner JB, Makino W, Biddanda BA. 2006. Temperature affects stoichiometry and
biochemical composition of Escherichia coli. Microb. Ecol. 52(1):26–33
Cummings JE, Kingry LC, Rholl DA, Schweizer HP, Tonge PJ, Slayden RA. 2014. The
Burkholderia pseudomallei enoyl-acyl carrier protein reductase FabI1 is
essential for in vivo growth and is the target of a novel chemotherapeutic with
efficacy. Antimicrob. Agents Chemother. 58(2):931–35
De Crécy-Lagard V, Phillips G, Grochowski LL, El Yacoubi B, Jenney F, et al. 2012.
Comparative genomics guided discovery of two missing archaeal enzyme
families involved in the biosynthesis of the pterin moiety of
tetrahydromethanopterin and tetrahydrofolate. ACS Chem. Biol. 7(11):1807–16
De Ley J, Van Muylem J. 1963. Some applications of deoxyribonucleic acid base
composition in bacterial taxonomy. Antonie Van Leeuwenhoek. 29(1):344–58
Deutscher MP. 2009. Maturation and degradation of ribosomal RNA in bacteria.
Prog. Mol. Biol. Transl. Sci. 85:369–91
Dick T, Manjunatha U, Kappes B, Gengenbacher M. 2010. Vitamin B6 biosynthesis is
essential for survival and virulence of Mycobacterium tuberculosis. Mol.
Microbiol. 78(4):980–88
Driskell LO, Tucker AM, Winkler HH, Wood DO. 2005. Rickettsial metK-encoded
methionine adenosyltransferase expression in an Escherichia coli metK deletion
strain. J. Bacteriol. 187(16):5719–22
Du W, Brown JR, Sylvester DR, Huang J, Chalker AF, et al. 2000. Two active forms of
UDP-N-acetylglucosamine enolpyruvyl transferase in gram-positive bacteria. J.
Bacteriol. 182(15):4146–52
El-Hajj ZW, Reyes-Lamothe R, Newman EB. 2013. Cell division, one-carbon
metabolism and methionine synthesis in a metK-deficient Escherichia coli
mutant, and a role for MmuM. Microbiol. 159:2036–48
Fang X, Wallqvist A, Reifman J. 2010. Development and analysis of an in vivo-
compatible metabolic network of Mycobacterium tuberculosis. BMC Syst. Biol.
4(1):160
Feist AM, Henry CS, Reed JL, Krummenacker M, Joyce AR, et al. 2007. A genome-scale
metabolic reconstruction for Escherichia coli K-12 MG1655 that accounts for
1260 ORFs and thermodynamic information. Mol. Syst. Biol. 3(121):121
Feist AM, Palsson BØ. 2010. The biomass objective function. Curr. Opin. Microbiol.
13(3):344–49
132 | CHAPTER 3 Essential Cofactors in Prokaryotes
Finkenwirth F, Kirsch F, Eitinger T. 2013. A versatile Escherichia coli strain for
identification of biotin transporters and for biotin quantification. Bioengineered.
5(April):1–4
Fitzpatrick TB, Amrhein N, Kappes B, Macheroux P, Tews I, Raschle T. 2007. Two
independent routes of de novo vitamin B6 biosynthesis: not that different after
all. Biochem. J. 407:1–13
Fowler CC, Brown ED, Li Y. 2010. Using a riboswitch sensor to examine coenzyme
B(12) metabolism and transport in E. coli. Chem. Biol. 17(7):756–65
Frank R a W, Leeper FJ, Luisi BF. 2007. Structure, mechanism and catalytic duality of
thiamine-dependent enzymes. Cell. Mol. Life Sci. 64:892–905
Gallagher LA, Shendure J, Manoil C. 2011. Genome-scale identification of resistance
functions in Pseudomonas aeruginosa using Tn-seq. MBio. 2(1):e00315–10
García Angulo V a., Bonomi HR, Posadas DM, Serer MI, Torres AG, et al. 2013.
Identification and characterization of ribN, a novel family of riboflavin
transporters from rhizobium leguminosarum and other proteobacteria. J.
Bacteriol. 195:4611–19
Gil R, Silva FJ, Peretó J, Moya A. 2004. Determination of the core of a minimal
bacterial gene set. Microbiol. Mol. Biol. Rev. 68(3):518–37
Gretler AC, Mucciolo P, Evans JB, Niven CF. 1955. Vitamin nutrition of the
staphylococci with special reference to their biotin requirements. J. Bacteriol.
70(1):44–49
Gruss A, Borezée-Durant E, Lechardeur D. 2012. Environmental heme utilization by
heme-auxotrophic bacteria. Adv. Microb. Physiol. 61:69–124
Haferkamp I, Penz T, Geier M, Ast M, Mushak T, et al. 2013. The endosymbiont
Amoebophilus asiaticus encodes an s-adenosylmethionine carrier that
compensates for its missing methylation cycle. J. Bacteriol. 195:3183–92
Hafner EW, Tabor CW, Tabor H. 1979. Mutants of Escherichia coli that do not contain
1,4-diaminobutane (putrescine) or spermidine. J. Biol. Chem. 254(24):12419–26
Henry CS, DeJongh M, Best A a, Frybarger PM, Linsay B, Stevens RL. 2010a. High-
throughput generation, optimization and analysis of genome-scale metabolic
models. Nat. Biotechnol. 28(9):977–82
Henry CS, DeJongh M, Best A a, Frybarger PM, Linsay B, Stevens RL. 2010b. High-
throughput generation, optimization and analysis of genome-scale metabolic
models. Nat. Biotechnol. 28:977–82
Hiraishi A. 1999. Isoprenoid quinones as biomarkers of microbial populations in the
environment. J. Biosci. Bioeng. 88(5):449–60
CHAPTER 3. Essential Cofactors in Prokaryotes | 133
Hoiczyk E, Hansel A. 2000. Cyanobacterial Cell Walls: News from an Unusual
Prokaryotic Envelope. J. Bacteriol. 182(5):1191–99
Jamshidi N, Palsson BØ. 2007. Investigating the metabolic capabilities of
Mycobacterium tuberculosis H37Rv using the in silico strain iNJ661 and
proposing alternative drug targets. BMC Syst. Biol. 1:26
Kanehisa M, Goto S, Sato Y, Kawashima M, Furumichi M, Tanabe M. 2014. Data,
information, knowledge and principle: back to metabolism in KEGG. Nucleic
Acids Res. 42(Database issue):D199–205
Kato O, Youn J-W, Stansen KC, Matsui D, Oikawa T, Wendisch VF. 2010. Quinone-
dependent D-lactate dehydrogenase Dld (Cg1027) is essential for growth of
Corynebacterium glutamicum on D-lactate. BMC Microbiol. 10(1):321
Kemp PF, Lee S, LARoche J. 1993. Estimating the Growth Rate of Slowly Growing
Marine Bacteria from RNA Content. Appl. Envir. Microbiol. 59(8):2594–2601
Khatiwara A, Jiang T, Sung S-S, Dawoud T, Kim JN, et al. 2012. Genome scanning for
conditionally essential genes in Salmonella enterica Serotype Typhimurium.
Appl. Environ. Microbiol. 78(9):3098–3107
Kim J, Kershner JP, Novikov Y, Shoemaker RK, Copley SD. 2010. Three serendipitous
pathways in E. coli can bypass a block in pyridoxal-5’-phosphate synthesis. Mol.
Syst. Biol. 6(1):436
Kim TY, Sohn SB, Kim Y Bin, Kim WJ, Lee SY. 2012. Recent advances in
reconstruction and applications of genome-scale metabolic models. Curr. Opin.
Biotechnol. 23(4):617–23
Kontopidou F, Giamarellou H, Katerelos P, Maragos A, Kioumis I, et al. 2014.
Infections caused by carbapenem-resistant Klebsiella pneumoniae among
patients in intensive care units in Greece: a multi-centre study on clinical
outcome and therapeutic options. Clin. Microbiol. Infect. 20(2):O117–23
Kumar A, Suthers PF, Maranas CD. 2012. MetRxn: a knowledgebase of metabolites
and reactions spanning metabolic models and databases. BMC Bioinformatics.
13(1):6
Lechardeur D, Cesselin B, Fernandez A, Lamberet G, Garrigues C, et al. 2011. Using
heme as an energy boost for lactic acid bacteria. Curr. Opin. Biotechnol.
22(2):143–49
Liao YC, Huang TW, Chen FC, Charusanti P, Hong JSJ, et al. 2011. An experimentally
validated genome-scale metabolic reconstruction of Klebsiella pneumoniae MGH
78578, iYL1228. J. Bacteriol. 193(7):1710–17
Lombard J, López-García P, Moreira D. 2012. Phylogenomic investigation of
134 | CHAPTER 3 Essential Cofactors in Prokaryotes
phospholipid synthesis in archaea. Archaea. 2012:
Luo H, Lin Y, Gao F, Zhang C-TT, Zhang R. 2014. DEG 10, an update of the database of
essential genes that includes both protein-coding genes and noncoding genomic
elements. Nucleic Acids Res. 42(November 2013):574–80
Mah RA, Fung DY, Morse SA. 1967. Nutritional requirements of Staphylococcus
aureus S-6. Appl. Microbiol. 15(4):866–70
Martens JH, Barg H, Warren MJ, Jahn D. 2002. Microbial production of vitamin B12.
Appl. Microbiol. Biotechnol. 58(3):275–85
McDaniel BAM, Grundy FJ, Artsimovitch I, Henkin TM. 2003. Transcription
termination control of the S box system: direct measurement of S-
adenosylmethionine by the leader RNA. Proc. Natl. Acad. Sci. U. S. A.
100(6):3083–88
Mendum T a, Newcombe J, Mannan A a, Kierzek AM, McFadden J. 2011. Interrogation
of global mutagenesis data with a genome scale model of Neisseria meningitidis
to assess gene fitness in vitro and in sera. Genome Biol. 12(12):R127
Metris A, Reuter M, Gaskin DJH, Baranyi J, van Vliet AHM. 2011. In vivo and in silico
determination of essential genes of Campylobacter jejuni. BMC Genomics.
12(1):535
Möbius K, Arias-Cartin R, Breckau D, Hännig A-L, Riedmann K, et al. 2010. Heme
biosynthesis is coupled to electron transport chains for energy generation. Proc.
Natl. Acad. Sci. U. S. A. 107(23):10436–41
Monk J, Nogales J, Palsson BØ. 2014. Optimizing genome-scale network
reconstructions. Nat. Biotechnol. 32(5):447–52
Mudunuri U, Che A, Yi M, Stephens RM. 2009. bioDBnet: the biological database
network. Bioinformatics. 25(4):555–56
Muto A, Osawa S. 1987. The guanine and cytosine content of genomic DNA and
bacterial evolution. Proc. Natl. Acad. Sci. 84(1):166–69
Namboori SC, Graham DE. 2008. Acetamido sugar biosynthesis in the euryarchaea. J.
Bacteriol. 190(February):2987–96
Nedenskov P. 1994. Nutritional requirements for growth of Helicobacter pylori. Appl.
Envir. Microbiol. 60(9):3450–53
Newman EB, Budman LI, Chan EC, Greene RC, Lin RT, et al. 1998. Lack of S-
adenosylmethionine results in a cell division defect in Escherichia coli. J.
Bacteriol. 180(14):3614–19
Nowicka B, Kruk J. 2010. Occurrence, biosynthesis and function of isoprenoid
CHAPTER 3. Essential Cofactors in Prokaryotes | 135
quinones. Biochim. Biophys. Acta. 1797(9):1587–1605
Orth JD, Conrad TM, Na J, Lerman J a, Nam H, et al. 2011. A comprehensive genome-
scale reconstruction of Escherichia coli metabolism—2011. Mol. Syst. Biol.
7(535):1–9
Patel CN, Wortham BW, Lines JL, Fetherston JD, Perry RD, Oliveira M a. 2006.
Polyamines are essential for the formation of plague biofilm. J. Bacteriol.
188:2355–63
Percudani R, Peracchi A. 2003. A genomic overview of pyridoxal-phosphate-
dependent enzymes. EMBO Rep. 4(9):850–54
Pfennig N. 1978. Rhodocyclus purpureus gen. nov. and sp. nov., a Ring-Shaped,
Vitamin B12-Requiring Member of the Family Rhodospirillaceae. Int. J. Syst.
Bacteriol. 28(2):283–88
Pitout JDD, Laupland KB. 2008. Extended-spectrum beta-lactamase-producing
Enterobacteriaceae: an emerging public-health concern. Lancet. Infect. Dis.
8(3):159–66
Posnick LM, Samson LD. 1999. Influence of S-Adenosylmethionine Pool Size on
Spontaneous Mutation, Dam Methylation, and Cell Growth of Escherichia coli. J.
Bacteriol. 181(21):6756–62
Pramanik J, Keasling JD. 1998. Effect of Escherichia coli biomass composition on
central metabolic fluxes predicted by a stoichiometric model. Biotechnol.
Bioeng. 60(2):230–38
Reed JL, Vo TD, Schilling CH, Palsson BØ. 2003. An expanded genome-scale model of
Escherichia coli K-12 (iJR904 GSM/GPR). Genome Biol. 4(9):R54
Rodionov DA, Mironov AA, Gelfand MS. 2002. Conservation of the biotin regulon and
the BirA regulatory signal in Eubacteria and Archaea. Genome Res.
12(10):1507–16
Rodionov DA, Vitreschak AG, Mironov AA, Gelfand MS. 2003. Comparative Genomics
of the Vitamin B12 Metabolism and Regulation in Prokaryotes. J. Biol. Chem.
278:41148–59
Rompf A, Schmid R, Jahn D. 1998. Changes in protein synthesis as a consequence of
heme depletion in Escherichia coli. Curr. Microbiol. 37:226–30
Rosselló-Mora R, Amann R. 2001. The species concept for prokaryotes. FEMS
Microbiol. Rev. 25(1):39–67
Sassetti CM, Boyd DH, Rubin EJ. 2003. Genes required for mycobacterial growth
defined by high density mutagenesis. Mol. Microbiol. 48(1):77–84
136 | CHAPTER 3 Essential Cofactors in Prokaryotes
Satishchandran C, Taylor JC, Markham GD. 1990. Novel Escherichia coli K-12 mutants
impaired in S-adenosylmethionine synthesis. J. Bacteriol. 172(8):4489–96
Sauls JT, Buescher JM. 2014. Assimilating genome-scale metabolic reconstructions
with modelBorgifier. Bioinformatics. 30(7):1036–38
Savinell JM, Palsson BØ. 1992. Network analysis of intermediary metabolism using
linear optimization. I. Development of mathematical formalism. J. Theor. Biol.
154(4):421–54
Schellenberger J, Park JO, Conrad TM, Palsson BØ. 2010. BiGG: a Biochemical Genetic
and Genomic knowledgebase of large scale metabolic reconstructions. BMC
Bioinformatics. 11(1):213
Schleifer KH, Kandler O. 1972. Peptidoglycan types of bacterial cell walls and their
taxonomic implications. Bacteriol. Rev. 36(4):407–77
Schneider J, Wendisch VF. 2011. Biotechnological production of polyamines by
bacteria: recent achievements and future perspectives. Appl. Microbiol.
Biotechnol. 91(1):17–30
Schoepp-Cothenet B, Lieutaud C, Baymann F, Verméglio A, Friedrich T, et al. 2009.
Menaquinone as pool quinone in a purple bacterium. Proc. Natl. Acad. Sci. U. S. A.
106(21):8549–54
Schubert OT, Mouritsen J, Ludwig C, Röst HL, Rosenberger G, et al. 2013. The Mtb
proteome library: a resource of assays to quantify the complete proteome of
Mycobacterium tuberculosis. Cell Host Microbe. 13(5):602–12
Scott TA, Hockney RC. 1979. Synthesis of vitamin B6 by a mutant of Escherichia coli
K12 and the action of 4’-deoxypyridoxine. J. Gen. Microbiol. 110(2):285–89
Shah P, Swiatlo E. 2008. A multifaceted role for polyamines in bacterial pathogens.
Mol. Microbiol. 68(1):4–16
Smith PF. 1991. 3 – Dynamics of Reproduction and Growth. In The Biology of
Mycoplasma, Vol. 55, ed. PF Smith, pp. 99–161. London: Academic Press, Inc. 1st
ed.
Snitkin ES, Zelazny AM, Thomas PJ, Stock F, Henderson DK, et al. 2012. Tracking a
Hospital Outbreak of Carbapenem-Resistant Klebsiella pneumoniae with Whole-
Genome Sequencing. Sci. Transl. Med. 4(148):148ra116–48ra116
Spalding MD, Prigge ST. 2010. Lipoic acid metabolism in microbial pathogens.
Microbiol. Mol. Biol. Rev. 74(2):200–228
Spry C, Kirk K, Saliba KJ. 2008. Coenzyme A biosynthesis: an antimicrobial drug
target. FEMS Microbiol. Rev. 32(1):56–106
CHAPTER 3. Essential Cofactors in Prokaryotes | 137
Stahl M, Stintzi A. 2011. Identification of essential genes in C. jejuni genome
highlights hyper-variable plasticity regions. Funct. Integr. Genomics. 11(2):241–
57
Suzuki R, Shimodaira H. 2006. Pvclust: An R package for assessing the uncertainty in
hierarchical clustering. Bioinformatics. 22:1540–42
Systems Biology and Metabolic Engineering Research Group at the Tianjin
University. 2014. GSMNDB: Genome-Scale Metabolic Network DataBase.
http://synbio.tju.edu.cn/GSMNDB/gsmndb.htm
Systems Biology Research Group at the University of California San Diego. 2014.
Supplementary Table 1: Available predictive genome-scale metabolic network
reconstructions. http://sbrg.ucsd.edu/InSilicoOrganisms/OtherOrganisms
Tucker AM, Winkler HH, Driskell LO, Wood DO. 2003. S -Adenosylmethionine
Transport in Rickettsia prowazekii. J. Bacteriol. 185(10):3031–35
Varma A, Boesch BW, Palsson BØ. 1993. Biochemical production capabilities of
Escherichia coli. Biotechnol. Bioeng. 42(1):59–73
Varma A, Palsson BØ. 1993a. Metabolic Capabilities of Escherichia coli: I. Synthesis of
Biosynthetic Precursors and Cofactors. J. Theor. Biol.
Varma A, Palsson BØ. 1993b. Metabolic capabilities of Escherichia coli II. Optimal
Growth Patterns. J. Theor. Biol. 165(4):503–22
Villadsen J, Nielsen J, Lidén G. 2011. Bioreaction Engineering Principles. Boston, MA:
Springer US. Third ed.
Vogl C, Grill S, Schilling O, Stülke J, Mack M, Stolz J. 2007. Characterization of
riboflavin (vitamin B2) transport proteins from Bacillus subtilis and
Corynebacterium glutamicum. J. Bacteriol. 189(20):7367–75
Vu TT, Stolyar SM, Pinchuk GE, Hill EA, Kucek LA, et al. 2012. Genome-scale
modeling of light-driven reductant partitioning and carbon fluxes in
diazotrophic unicellular cyanobacterium Cyanothece sp. ATCC 51142. PLoS
Comput. Biol. 8(4):e1002460
Walther B, Karl JP, Booth SL, Boyaval P. 2013. Menaquinones, bacteria, and the food
supply: the relevance of dairy and fermented food products to vitamin K
requirements. Adv. Nutr. 4(4):463–73
Yamamoto Y, Poyart C, Trieu-Cuot P, Lamberet G, Gruss A, Gaudu P. 2005.
Respiration metabolism of Group B Streptococcus is activated by environmental
haem and quinone and contributes to virulence. Mol. Microbiol. 56(2):525–34
Yang H, Krumholz EW, Brutinel ED, Palani NP, Sadowsky MJ, et al. 2014. Genome-
scale metabolic network validation of Shewanella oneidensis using transposon

138 | CHAPTER 3 Essential Cofactors in Prokaryotes
insertion frequency analysis. PLoS Comput. Biol. 10(9):e1003848
Zhao H, van der Donk WA. 2003. Regeneration of cofactors for use in biocatalysis.
Curr. Opin. Biotechnol. 14(6):583–89
139
CHAPTER 4
Essential and Ancestral Metabolic Functions in
Prokaryotes
A scientist in his laboratory is not only a technician: he is also a child placed before
natural phenomena which impress him like a fairy tale.
—MARIE CURIE, as quoted in Madame Curie: A Biography (1937), by Eve Curie
Labouisse
In this chapter the essential reactions in several different metabolic networks
of prokaryotic cells were analyzed to study the composition of early and minimal
complex cellular systems. The main hypothesis is that essential and highly
conserved metabolic functions are shaping constituents of theoretical minimal
metabolic networks and were also present already in ancestral cells. Results from
large-scale simulations of 15 manually curated genome-scale metabolic networks
were integrated with 36 large-scale gene essentiality assays encompassing a wide
variety of species and phyla of bacteria and archaea. Ancient metabolic genes were
estimated from an analysis of conservation with 79 manually selected
representative genomes from all the branches of the prokaryotic tree of life. The
results indicate the tRNA charging module as an isolated winner in centrality and
ancestry, pointing to an early information processing system supplied by ATP
dependent transport systems in a rich primordial environment. The high
conservation and essentiality of cofactor biosynthesis genes points to an early
depletion that selected for cells that were autonomous for the production of these
crucial catalysts. On a large-scale, highly essential genes tend to be highly conserved
as opposed to non-essential genes which may be highly conserved or not.
140 | CHAPTER 4 Essential and Ancestral Metabolic Functions in Prokaryotes
The information presented in this Chapter is being prepared for submission to a
peer reviewed journal:
Xavier JC, Patil KR, Rocha I. Essential And Ancestral Metabolic Functions In
Prokaryotes (in preparation).
CHAPTER 4 Essential and Ancestral Metabolic Functions in Prokaryotes | 141
4.1 Introduction
4.1.1 Cellular Complexity and Genome-Scale Essentiality
Prokaryotes are the simplest contemporary life forms known, and
nevertheless are characterized by an immense complexity. The debate on the
requirement of such complexity for life and its breadth in the primordial life forms
has been around for years (Kauffman 1995, Rasmussen et al. 2008, Schuster 1996),
and was furthermore expanded and detailed since the advent of systems biology
(Kim & Caetano-Anollés 2011, Oltvai & Barabási 2002, Peretó 2012). The study of
essential genetic alleles has been crucial for detangling this complexity, relating
some proteins with cell viability in specific conditions (Skouloubris et al. 1998) and
others with cell viability in apparently all conditions (Fayet et al. 1989, Wu et al.
1999). Genome-wide essentiality studies based on collections of targeted mutants or
random mutagenesis techniques have been conducted for a number of species,
aiming mainly at antibiotic design or industrially relevant targets (see Chapter 2,
Section 2.2.1 and Table 2.3). These data have been integrated in databases such as
OGEE (Chen et al. 2012) and DEG (Luo et al. 2014) but their functional analysis is
still incipient. Early work based on genome-scale essentiality for four bacterial
species included the interesting finding that essentiality drives gene strand bias
(Rocha & Danchin 2003). Later, a review was published with a critical analysis of
this type of large essentiality datasets, in which the authors also conducted a
preliminary analysis which integrated 6 genome-scale assays corresponding to 4
different species (Gerdes et al. 2006). Functional differences were highlighted, as the
smaller number of essential genes in flavin synthesis in B. subtilis, a species known
to have an active riboflavin salvage capability. The authors of the DEG database have
also recently conducted a couple of integrative analysis on large-scale essentiality
data. The first concluded that there are less essential genes inside than outside
genomic islands, and some of those are related with virulence (Zhang et al. 2015).
The second study (Luo et al. 2015) added to a previous finding based only on E. coli
essentiality data where it was proposed that essential genes are more evolutionarily
conserved than non-essential genes (Jordan et al. 2002). Luo and others used the
142 | CHAPTER 4 Essential and Ancestral Metabolic Functions in Prokaryotes
same type of analysis, based on synonymous and non-synonymous substitution
rates, to corroborate this finding (Luo et al. 2015). The authors also suggest that the
most evolutionarily conserved COG categories of essential genes are: Carbohydrate
transport and metabolism; Coenzyme transport and metabolism; Transcription;
Translation ribosomal structure and biogenesis; Lipid transport and metabolism,
and Replication, recombination and repair.
4.1.2 Genome-Scale Metabolic Models and the Core and
Ancestral Metabolism
Genome-scale metabolic models (GSMs) are curated large repositories of
metabolic data for individual species that expand possibilities of functional analysis
of cellular physiology. More than improving or suggesting new functional
annotations by reconstructing whole pathways (Overbeek et al. 2014), GSMs can be
used for calculations of metabolic fluxes that permit the prediction of, among others,
lethal phenotypes (Edwards & Palsson 2000) (see Chapter 1). Multi-species analysis
of this type of phenotype predictions with different manually curated models has
been scarce (Oberhardt et al. 2009), in part impaired by the poor knowledge basis
for other species than the usual model organisms, but also by the deficient use of
standards in building such models.
Comparative genomics is commonly used to find core essential genes for several
species, and at the same time, given that it is based on the evolutionary key notion of
orthology, to infer the group of genes present in common ancestors of the species
analyzed (Koonin 2003). Assuming evolutionary parsimony, it is expected that genes
present in a set of species have been vertically inherited from a common ancestor.
Horizontal Gene Transfer (HGT) might have played a role even in ancient times
before the divergence of the three main domains (Fournier et al. 2015).
Nevertheless, when a gene is present in all or most species of a phylogenetic tree,
the most parsimonious scenario is that HGT was not the cause of all, or at least the
majority of the conservation. In the case of functional comparisons as in
comparisons of metabolic reactions, the problems with sequence data and HGT are
surpassed.
CHAPTER 4 Essential and Ancestral Metabolic Functions in Prokaryotes | 143
In this study, 36 experimental genome-scale essentiality assays were integrated
with simulations of 15 genome-scale metabolic models and the screening of full
genome sequences of 79 prokaryotic species in order to find core essential and
ancestral functions in prokaryotic biology. It is expected that this knowledge on the
minimal metabolic functions of prokaryotic cells can not only help uncovering the
fundamental complexity of cellular systems but also, by building up on the concept
of orthogonalization of metabolic modules (Mampel et al. 2013), here analyzed in
the form of metabolic subsystems, improve future engineering approaches that use
this type of organisms.
4.2 Methods
4.2.1 Genome-Scale Metabolic Models Used in Essentiality
Predictions
For all essentiality predictions performed in this study, 15 genome-scale
metabolic models were chosen based on curation, validation, and comparability of
the nomenclature of metabolites and reactions. These comprise 7 prokaryotic phyla,
including one archaea. Ten of these include more than 20% of the total number of
the species ORFs. Table 4.1 summarizes the details on these models including
species name, strain, a small illustration, model ID, statistics and references.
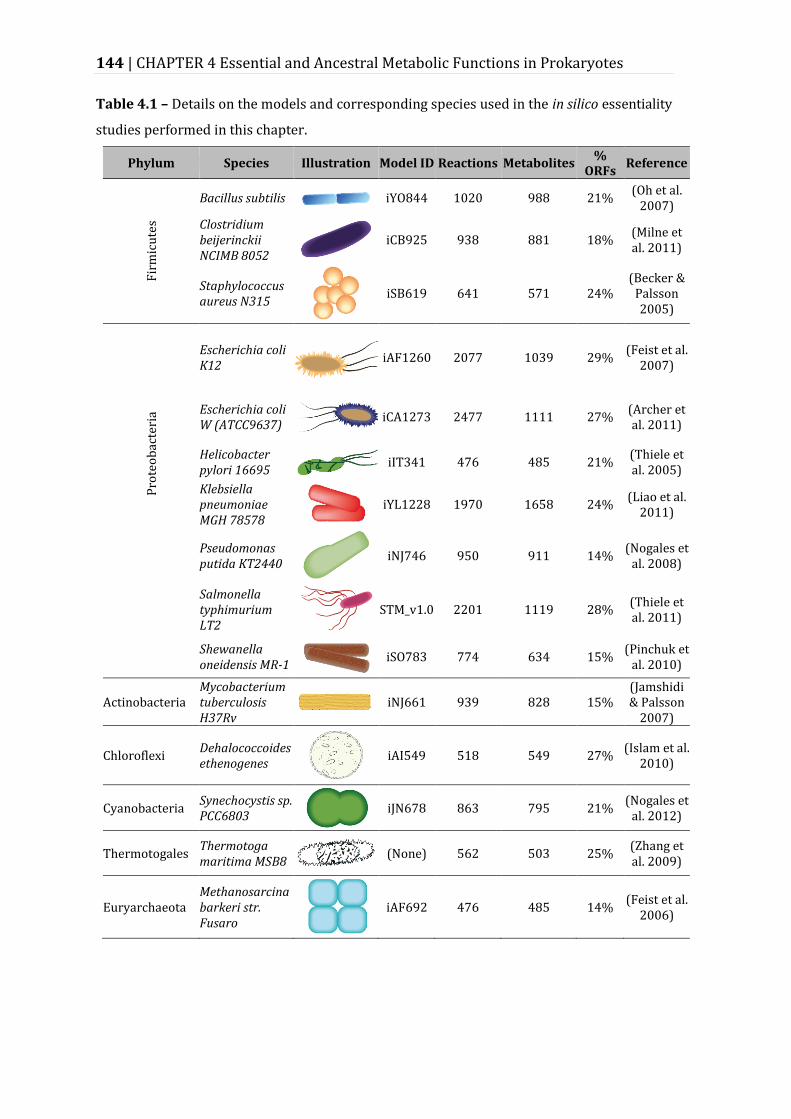
144 | CHAPTER 4 Essential and Ancestral Metabolic Functions in Prokaryotes
Table 4.1 – Details on the models and corresponding species used in the in silico essentiality
studies performed in this chapter.
Phylum Species Illustration Model ID Reactions Metabolites %
ORFs Reference
Fir
mic
ute
s
Bacillus subtilis
iYO844 1020 988 21% (Oh et al.
2007)
Clostridium beijerinckii NCIMB 8052
iCB925 938 881 18% (Milne et al. 2011)
Staphylococcus aureus N315
iSB619 641 571 24% (Becker &
Palsson 2005)
Pro
teo
bac
teri
a
Escherichia coli K12
iAF1260 2077 1039 29% (Feist et al.
2007)
Escherichia coli W (ATCC9637)
iCA1273 2477 1111 27% (Archer et al. 2011)
Helicobacter pylori 16695
iIT341 476 485 21% (Thiele et al. 2005)
Klebsiella pneumoniae MGH 78578
iYL1228 1970 1658 24% (Liao et al.
2011)
Pseudomonas putida KT2440
iNJ746 950 911 14% (Nogales et
al. 2008)
Salmonella typhimurium LT2
STM_v1.0 2201 1119 28% (Thiele et al. 2011)
Shewanella oneidensis MR-1
iSO783 774 634 15%
(Pinchuk et al. 2010)
Actinobacteria Mycobacterium tuberculosis H37Rv
iNJ661 939 828 15% (Jamshidi & Palsson
2007)
Chloroflexi Dehalococcoides ethenogenes
iAI549 518 549 27% (Islam et al.
2010)
Cyanobacteria Synechocystis sp. PCC6803
iJN678 863 795 21% (Nogales et
al. 2012)
Thermotogales Thermotoga maritima MSB8
(None) 562 503 25% (Zhang et al. 2009)
Euryarchaeota Methanosarcina barkeri str. Fusaro
iAF692 476 485 14% (Feist et al.
2006)
CHAPTER 4 Essential and Ancestral Metabolic Functions in Prokaryotes | 145
4.2.2 Parsing Genome-Scale Metabolic Models
All models were collected in SBML format from which they were then
converted to bioopt, a format part of the BioMet Toolbox (Cvijovic et al. 2010). All
the models were then parsed to model an environmental condition corresponding to
rich media: all original exchange reactions in the model were set to a maximum
uptake limit of -20 mmol gDW-1 h-1 to allow for the import of all transported
metabolites (including oxygen, whenever it was possible).
4.2.3 Single Knockout of Metabolic Reactions
Flux Balance Analysis (FBA) was used to predict the essentiality of each
metabolic reaction in all models (see Chapter 1 for details on the simulation
methods). A threshold of 10% of the flux through the biomass reaction compared to
the wild type was set as the limit to define an essential metabolic reaction. All
modeling procedures were implemented in C++ and solved using IBM ILOG CPLEX
solver. The Optflux platform (Rocha et al. 2010) was used occasionally to confirm
and benchmark results.
4.2.4 Standardizing the Nomenclature of Essential
Metabolic Reactions
The comparison of the reactions of the 15 GSMs used required resolving some
nomenclature inconsistencies in the models. This included mostly the
standardization of suffixes used in reaction IDs, including unnecessary or redundant
indications of reversibility, species names allocated to reactions and other
redundant tags. Irrelevant and irregular characters such as dashes were filtered out
of all the nomenclature (see Supplementary Table 4.1).
4.2.5 Experimental Data and Subsystem Mapping
Large-scale experimental data on gene essentiality were collected from two
databases, OGEE (Chen et al. 2012) and DEG (Luo et al. 2014). The content of the
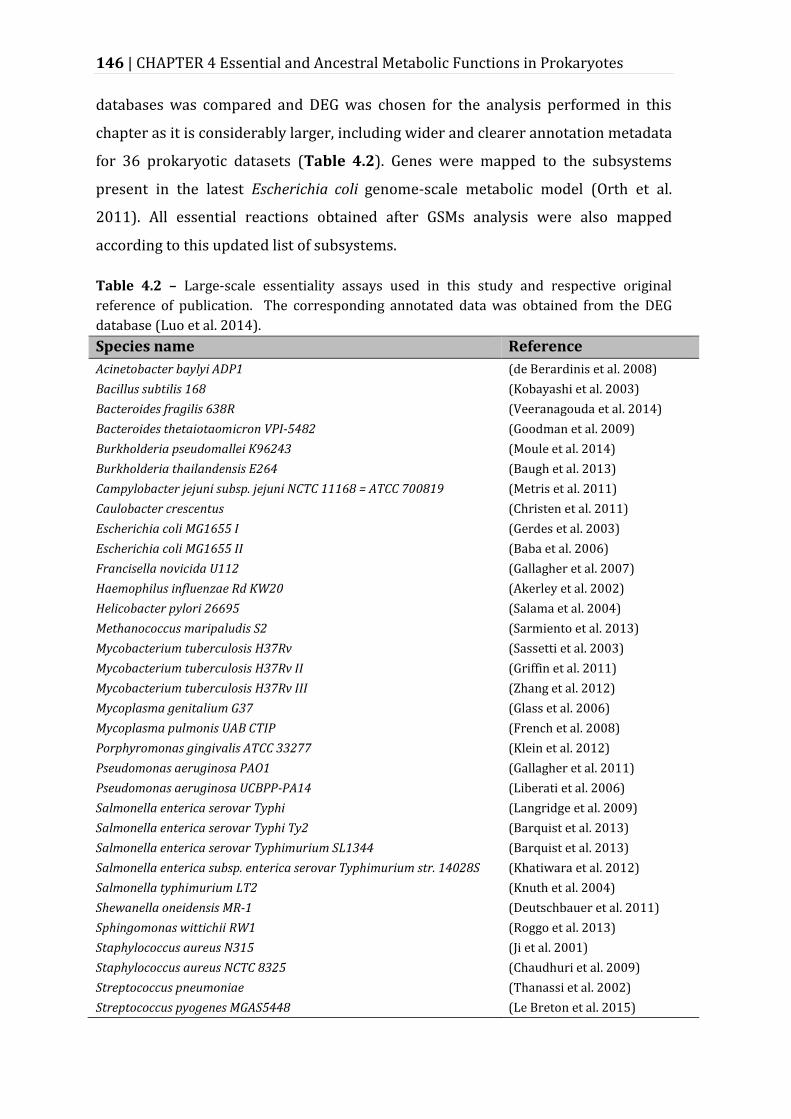
146 | CHAPTER 4 Essential and Ancestral Metabolic Functions in Prokaryotes
databases was compared and DEG was chosen for the analysis performed in this
chapter as it is considerably larger, including wider and clearer annotation metadata
for 36 prokaryotic datasets (Table 4.2). Genes were mapped to the subsystems
present in the latest Escherichia coli genome-scale metabolic model (Orth et al.
2011). All essential reactions obtained after GSMs analysis were also mapped
according to this updated list of subsystems.
Table 4.2 – Large-scale essentiality assays used in this study and respective original
reference of publication. The corresponding annotated data was obtained from the DEG
database (Luo et al. 2014).
Species name Reference
Acinetobacter baylyi ADP1 (de Berardinis et al. 2008)
Bacillus subtilis 168 (Kobayashi et al. 2003)
Bacteroides fragilis 638R (Veeranagouda et al. 2014)
Bacteroides thetaiotaomicron VPI-5482 (Goodman et al. 2009)
Burkholderia pseudomallei K96243 (Moule et al. 2014)
Burkholderia thailandensis E264 (Baugh et al. 2013)
Campylobacter jejuni subsp. jejuni NCTC 11168 = ATCC 700819 (Metris et al. 2011)
Caulobacter crescentus (Christen et al. 2011)
Escherichia coli MG1655 I (Gerdes et al. 2003)
Escherichia coli MG1655 II (Baba et al. 2006)
Francisella novicida U112 (Gallagher et al. 2007)
Haemophilus influenzae Rd KW20 (Akerley et al. 2002)
Helicobacter pylori 26695 (Salama et al. 2004)
Methanococcus maripaludis S2 (Sarmiento et al. 2013)
Mycobacterium tuberculosis H37Rv (Sassetti et al. 2003)
Mycobacterium tuberculosis H37Rv II (Griffin et al. 2011)
Mycobacterium tuberculosis H37Rv III (Zhang et al. 2012)
Mycoplasma genitalium G37 (Glass et al. 2006)
Mycoplasma pulmonis UAB CTIP (French et al. 2008)
Porphyromonas gingivalis ATCC 33277 (Klein et al. 2012)
Pseudomonas aeruginosa PAO1 (Gallagher et al. 2011)
Pseudomonas aeruginosa UCBPP-PA14 (Liberati et al. 2006)
Salmonella enterica serovar Typhi (Langridge et al. 2009)
Salmonella enterica serovar Typhi Ty2 (Barquist et al. 2013)
Salmonella enterica serovar Typhimurium SL1344 (Barquist et al. 2013)
Salmonella enterica subsp. enterica serovar Typhimurium str. 14028S (Khatiwara et al. 2012)
Salmonella typhimurium LT2 (Knuth et al. 2004)
Shewanella oneidensis MR-1 (Deutschbauer et al. 2011)
Sphingomonas wittichii RW1 (Roggo et al. 2013)
Staphylococcus aureus N315 (Ji et al. 2001)
Staphylococcus aureus NCTC 8325 (Chaudhuri et al. 2009)
Streptococcus pneumoniae (Thanassi et al. 2002)
Streptococcus pyogenes MGAS5448 (Le Breton et al. 2015)
CHAPTER 4 Essential and Ancestral Metabolic Functions in Prokaryotes | 147
Table 4.2 – Large-scale essentiality assays used in this study and respective original reference of publication (continued)
Streptococcus pyogenes NZ131 (Le Breton et al. 2015)
Streptococcus sanguinis (Xu et al. 2011)
Vibrio cholerae N16961 (Cameron et al. 2008)
4.2.6 Analysis of Genetic Conservation
To analyze the conservation and infer ancestry of all the metabolic genes
annotated in metabolic subsystems of GSMs, a local protein blast was performed
against representative genomes of all the 35 prokaryotic phyla with at least one fully
sequenced quality genome in the NCBI genome database (accession date: June
2015). For this task, translated genomes were selected and downloaded for all 53
unique species of prokaryotes for which there is a GSM (Supplementary Table 3.1);
to these, 26 representative genomes for phyla not modeled with GSMs were added.
This totaled in 79 translated genomes representing the fully sequenced phyla in the
prokaryotic tree of life (see Supplementary Figure 4.1). The metabolic genes of E.
coli K12 were used as queries. The threshold e-value considered was 1e-4 as used
elsewhere in blasts against single genomes (Rahman et al. 2014, Seringhaus et al.
2006). All the procedures were implemented using the Biopython package (Cock et
al. 2009).
4.2.7 Numerical and Statistical Analysis of Essentiality and
Conservation
For assessing the conservation of essential reactions and essential genes in
each metabolic subsystem, the weighted sum of essentiality was calculated, as the
value of W, for each subsystem m, as:
𝑊𝑚 = ∑ 𝑛𝑖 .𝑖
𝑡
𝑖=1
148 | CHAPTER 4 Essential and Ancestral Metabolic Functions in Prokaryotes
𝒏𝒊 being the number of reactions or genes essential in i models or datasets,
where t is the total of models or datasets, 15 and 36 respectively.
The average experimental essentiality for each metabolic subsystem �̅�𝑚 was
calculated as the average of the number of essential genes in that subsystem 𝐸𝑚 for
all experimental datasets:
�̅�𝑚 = ∑ 𝐸𝑚
𝑡𝑖=1
𝑡
Average non-essentiality was calculated in the same manner. Average
conservation for metabolic subsystems was calculated as the average of the number
of genomes where each gene in that subsystem was conserved.
All statistical analyses and calculations of polynomial regressions were
performed using R statistical software version 3.1. Hierarchical clustering was
performed using the ‘pvclust’ R package (Suzuki & Shimodaira 2006) with binary
distance as the dissimilarity metric and Ward 1 method as the linkage criterion.
Pvclust was also used for assessing uncertainty by calculating approximately
unbiased p-values via multiscale bootstrap resampling.
4.3 Results
4.3.1 Patterns of Essentiality Are Validated by Phylogenies
To analyze the validity of the essentiality results on a large scale the different
models were clustered based on single-reaction essentiality predictions and the
different datasets available on DEG (Luo et al. 2014) were clustered based on the
content of essential genes. Figure 4.1 shows both clusters. Given that both the
simulations and the majority of the experiments were performed in rich media
conditions (see Methods) common essentiality patterns are expected to reflect
similarities among the networks. In the case of the simulated essentiality, strongly
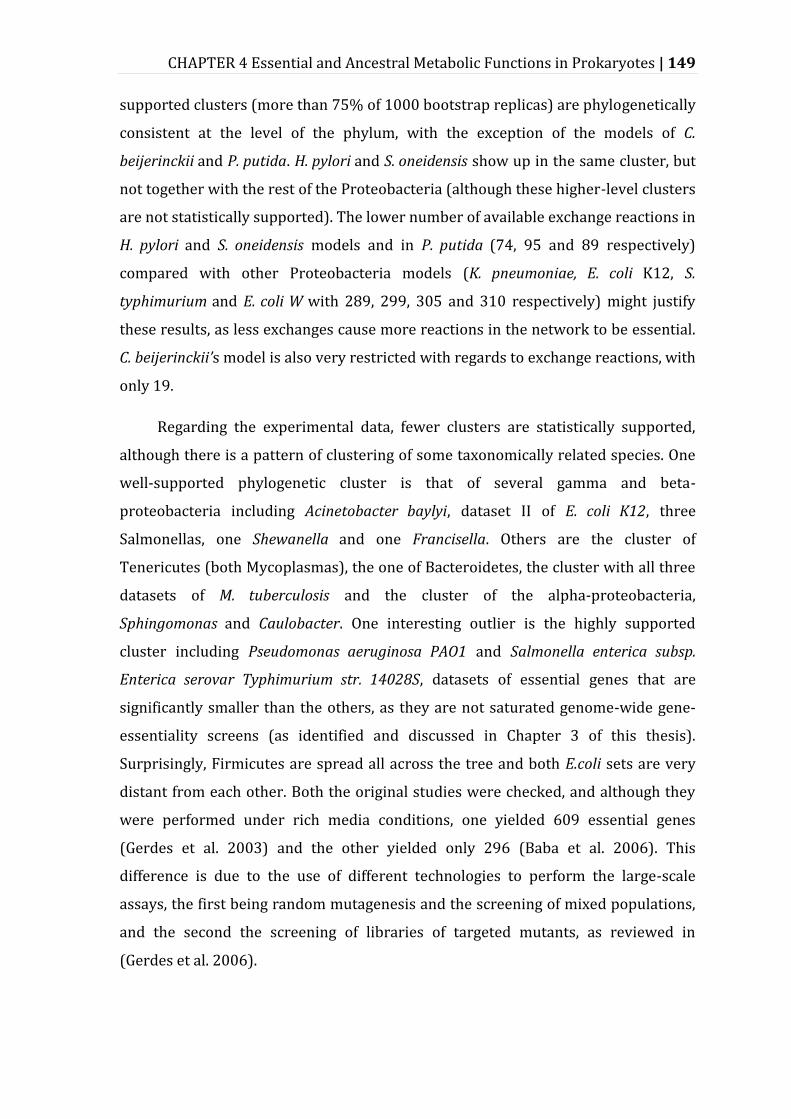
CHAPTER 4 Essential and Ancestral Metabolic Functions in Prokaryotes | 149
supported clusters (more than 75% of 1000 bootstrap replicas) are phylogenetically
consistent at the level of the phylum, with the exception of the models of C.
beijerinckii and P. putida. H. pylori and S. oneidensis show up in the same cluster, but
not together with the rest of the Proteobacteria (although these higher-level clusters
are not statistically supported). The lower number of available exchange reactions in
H. pylori and S. oneidensis models and in P. putida (74, 95 and 89 respectively)
compared with other Proteobacteria models (K. pneumoniae, E. coli K12, S.
typhimurium and E. coli W with 289, 299, 305 and 310 respectively) might justify
these results, as less exchanges cause more reactions in the network to be essential.
C. beijerinckii’s model is also very restricted with regards to exchange reactions, with
only 19.
Regarding the experimental data, fewer clusters are statistically supported,
although there is a pattern of clustering of some taxonomically related species. One
well-supported phylogenetic cluster is that of several gamma and beta-
proteobacteria including Acinetobacter baylyi, dataset II of E. coli K12, three
Salmonellas, one Shewanella and one Francisella. Others are the cluster of
Tenericutes (both Mycoplasmas), the one of Bacteroidetes, the cluster with all three
datasets of M. tuberculosis and the cluster of the alpha-proteobacteria,
Sphingomonas and Caulobacter. One interesting outlier is the highly supported
cluster including Pseudomonas aeruginosa PAO1 and Salmonella enterica subsp.
Enterica serovar Typhimurium str. 14028S, datasets of essential genes that are
significantly smaller than the others, as they are not saturated genome-wide gene-
essentiality screens (as identified and discussed in Chapter 3 of this thesis).
Surprisingly, Firmicutes are spread all across the tree and both E.coli sets are very
distant from each other. Both the original studies were checked, and although they
were performed under rich media conditions, one yielded 609 essential genes
(Gerdes et al. 2003) and the other yielded only 296 (Baba et al. 2006). This
difference is due to the use of different technologies to perform the large-scale
assays, the first being random mutagenesis and the screening of mixed populations,
and the second the screening of libraries of targeted mutants, as reviewed in
(Gerdes et al. 2006).
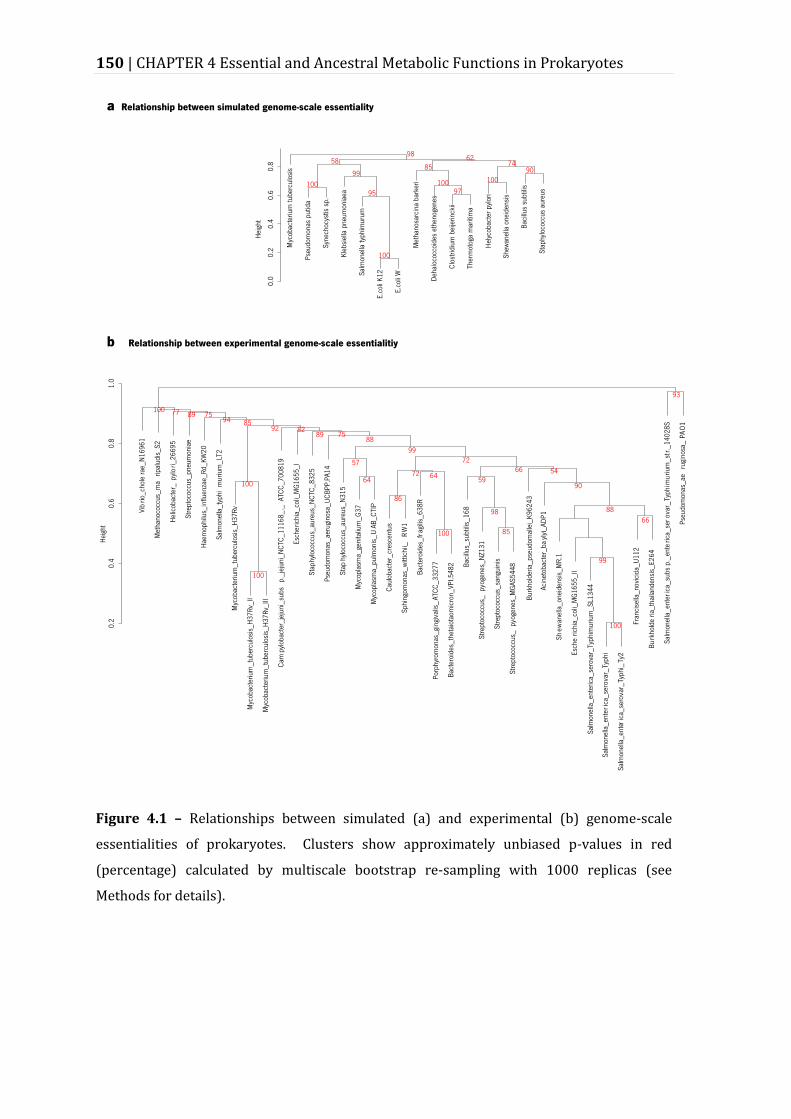
150 | CHAPTER 4 Essential and Ancestral Metabolic Functions in Prokaryotes
Figure 4.1 – Relationships between simulated (a) and experimental (b) genome-scale
essentialities of prokaryotes. Clusters show approximately unbiased p-values in red
(percentage) calculated by multiscale bootstrap re-sampling with 1000 replicas (see
Methods for details).
CHAPTER 4 Essential and Ancestral Metabolic Functions in Prokaryotes | 151
4.3.2 Cofactor Metabolism, Cell Wall and Lipids: Most
Essential Subsystems in Metabolic Networks
For an initial analysis of the simulations of single-reaction knockouts, all the
essential reactions calculated for the 15 GSMs were mapped to the corresponding
metabolic subsystem (see Methods; Supplementary Table 4.1). The total number of
essential reactions varies significantly between subsystems, as the total number of
reactions in those subsystems in the models, as shown in Figure 4.2. Both totals are
independent in the majority of the subsystems (p-value smaller than 0.05 in a Fisher
exact test). The subsystems of cofactor and prosthetic group biosynthesis, cell
envelope biosynthesis, membrane lipid metabolism and glycerophospholipid
metabolism are isolated with more than double the amount of essential reactions
than the following most essential subsystem, Transport.
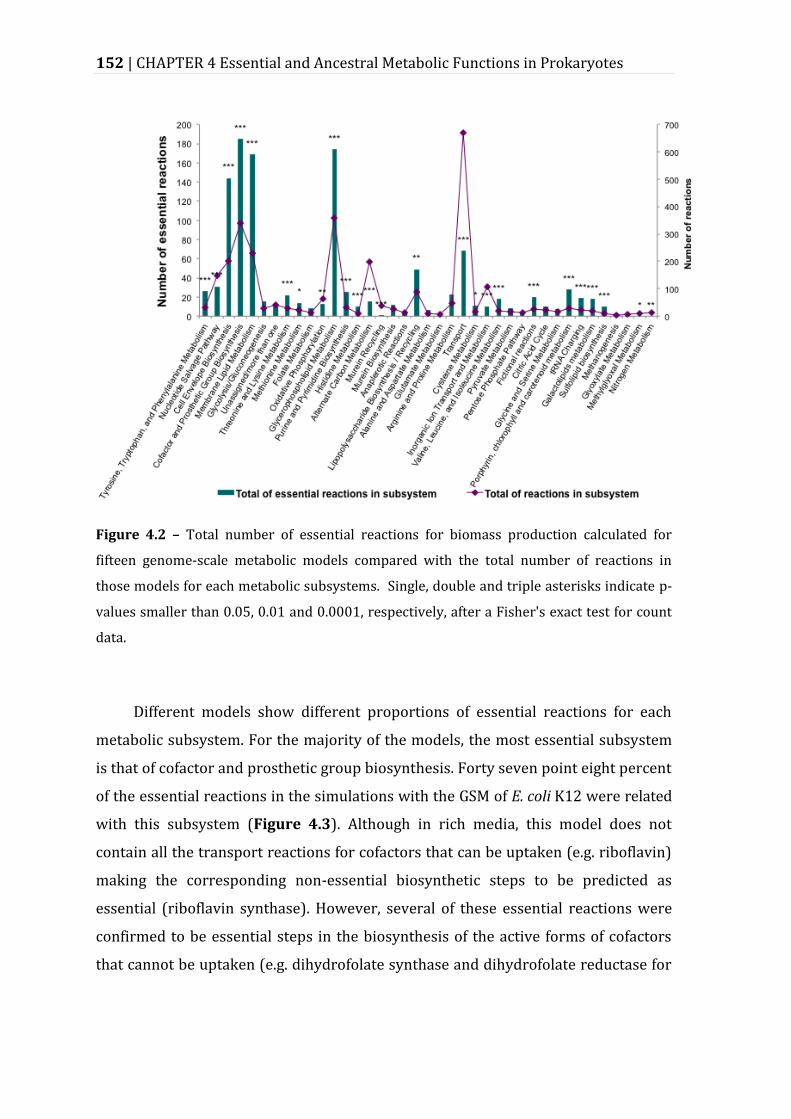
152 | CHAPTER 4 Essential and Ancestral Metabolic Functions in Prokaryotes
Figure 4.2 – Total number of essential reactions for biomass production calculated for
fifteen genome-scale metabolic models compared with the total number of reactions in
those models for each metabolic subsystems. Single, double and triple asterisks indicate p-
values smaller than 0.05, 0.01 and 0.0001, respectively, after a Fisher's exact test for count
data.
Different models show different proportions of essential reactions for each
metabolic subsystem. For the majority of the models, the most essential subsystem
is that of cofactor and prosthetic group biosynthesis. Forty seven point eight percent
of the essential reactions in the simulations with the GSM of E. coli K12 were related
with this subsystem (Figure 4.3). Although in rich media, this model does not
contain all the transport reactions for cofactors that can be uptaken (e.g. riboflavin)
making the corresponding non-essential biosynthetic steps to be predicted as
essential (riboflavin synthase). However, several of these essential reactions were
confirmed to be essential steps in the biosynthesis of the active forms of cofactors
that cannot be uptaken (e.g. dihydrofolate synthase and dihydrofolate reductase for
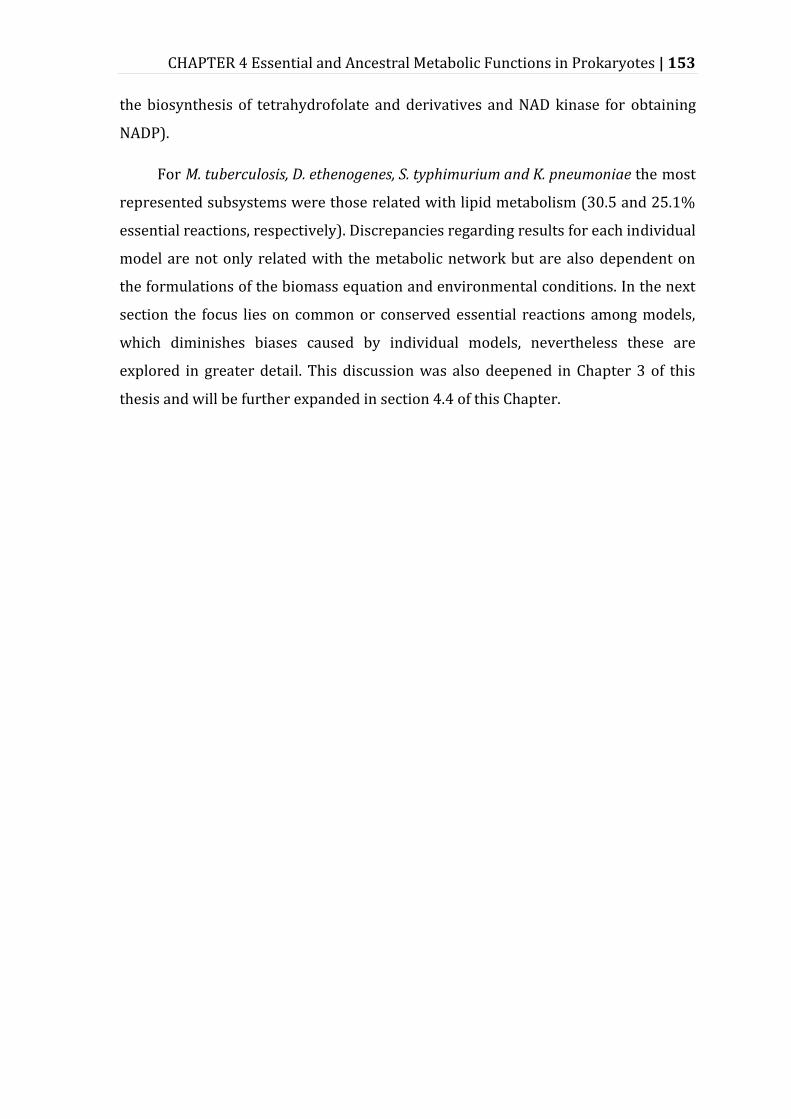
CHAPTER 4 Essential and Ancestral Metabolic Functions in Prokaryotes | 153
the biosynthesis of tetrahydrofolate and derivatives and NAD kinase for obtaining
NADP).
For M. tuberculosis, D. ethenogenes, S. typhimurium and K. pneumoniae the most
represented subsystems were those related with lipid metabolism (30.5 and 25.1%
essential reactions, respectively). Discrepancies regarding results for each individual
model are not only related with the metabolic network but are also dependent on
the formulations of the biomass equation and environmental conditions. In the next
section the focus lies on common or conserved essential reactions among models,
which diminishes biases caused by individual models, nevertheless these are
explored in greater detail. This discussion was also deepened in Chapter 3 of this
thesis and will be further expanded in section 4.4 of this Chapter.
154 | CHAPTER 4 Essential and Ancestral Metabolic Functions in Prokaryotes
Figure 4.3 – Percentage of essential reactions for biomass production of each of 15 genome-
scale metabolic models corresponding to each metabolic subsystem. The colour bar
represents the normalized percentage of essential genes for each subsystem compared to
the total number of essential genes for that model.
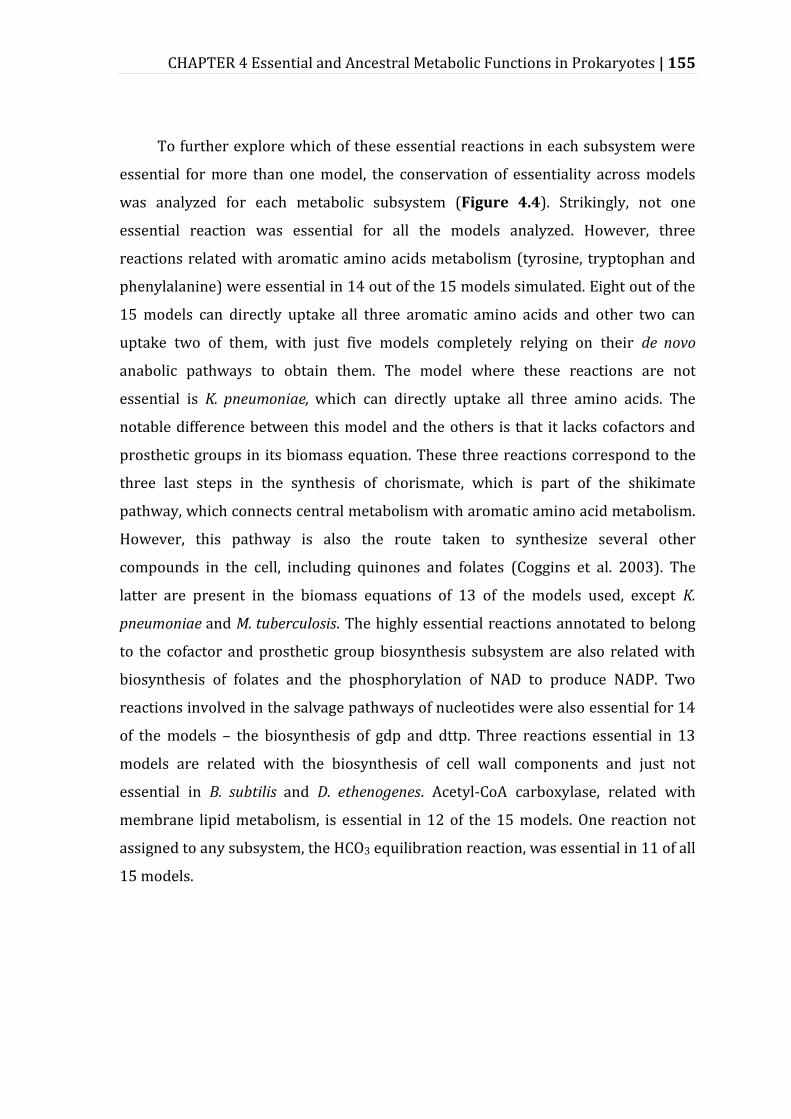
CHAPTER 4 Essential and Ancestral Metabolic Functions in Prokaryotes | 155
To further explore which of these essential reactions in each subsystem were
essential for more than one model, the conservation of essentiality across models
was analyzed for each metabolic subsystem (Figure 4.4). Strikingly, not one
essential reaction was essential for all the models analyzed. However, three
reactions related with aromatic amino acids metabolism (tyrosine, tryptophan and
phenylalanine) were essential in 14 out of the 15 models simulated. Eight out of the
15 models can directly uptake all three aromatic amino acids and other two can
uptake two of them, with just five models completely relying on their de novo
anabolic pathways to obtain them. The model where these reactions are not
essential is K. pneumoniae, which can directly uptake all three amino acids. The
notable difference between this model and the others is that it lacks cofactors and
prosthetic groups in its biomass equation. These three reactions correspond to the
three last steps in the synthesis of chorismate, which is part of the shikimate
pathway, which connects central metabolism with aromatic amino acid metabolism.
However, this pathway is also the route taken to synthesize several other
compounds in the cell, including quinones and folates (Coggins et al. 2003). The
latter are present in the biomass equations of 13 of the models used, except K.
pneumoniae and M. tuberculosis. The highly essential reactions annotated to belong
to the cofactor and prosthetic group biosynthesis subsystem are also related with
biosynthesis of folates and the phosphorylation of NAD to produce NADP. Two
reactions involved in the salvage pathways of nucleotides were also essential for 14
of the models – the biosynthesis of gdp and dttp. Three reactions essential in 13
models are related with the biosynthesis of cell wall components and just not
essential in B. subtilis and D. ethenogenes. Acetyl-CoA carboxylase, related with
membrane lipid metabolism, is essential in 12 of the 15 models. One reaction not
assigned to any subsystem, the HCO3 equilibration reaction, was essential in 11 of all
15 models.
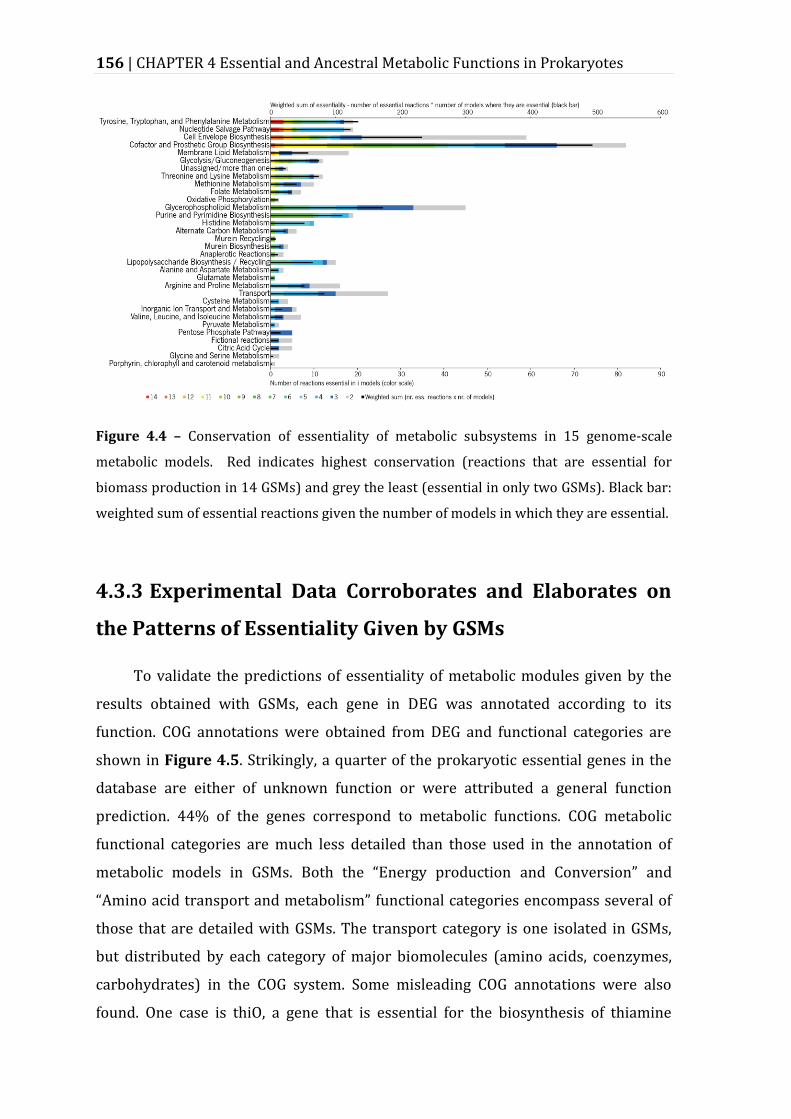
156 | CHAPTER 4 Essential and Ancestral Metabolic Functions in Prokaryotes
Figure 4.4 – Conservation of essentiality of metabolic subsystems in 15 genome-scale
metabolic models. Red indicates highest conservation (reactions that are essential for
biomass production in 14 GSMs) and grey the least (essential in only two GSMs). Black bar:
weighted sum of essential reactions given the number of models in which they are essential.
4.3.3 Experimental Data Corroborates and Elaborates on
the Patterns of Essentiality Given by GSMs
To validate the predictions of essentiality of metabolic modules given by the
results obtained with GSMs, each gene in DEG was annotated according to its
function. COG annotations were obtained from DEG and functional categories are
shown in Figure 4.5. Strikingly, a quarter of the prokaryotic essential genes in the
database are either of unknown function or were attributed a general function
prediction. 44% of the genes correspond to metabolic functions. COG metabolic
functional categories are much less detailed than those used in the annotation of
metabolic models in GSMs. Both the “Energy production and Conversion” and
“Amino acid transport and metabolism” functional categories encompass several of
those that are detailed with GSMs. The transport category is one isolated in GSMs,
but distributed by each category of major biomolecules (amino acids, coenzymes,
carbohydrates) in the COG system. Some misleading COG annotations were also
found. One case is thiO, a gene that is essential for the biosynthesis of thiamine
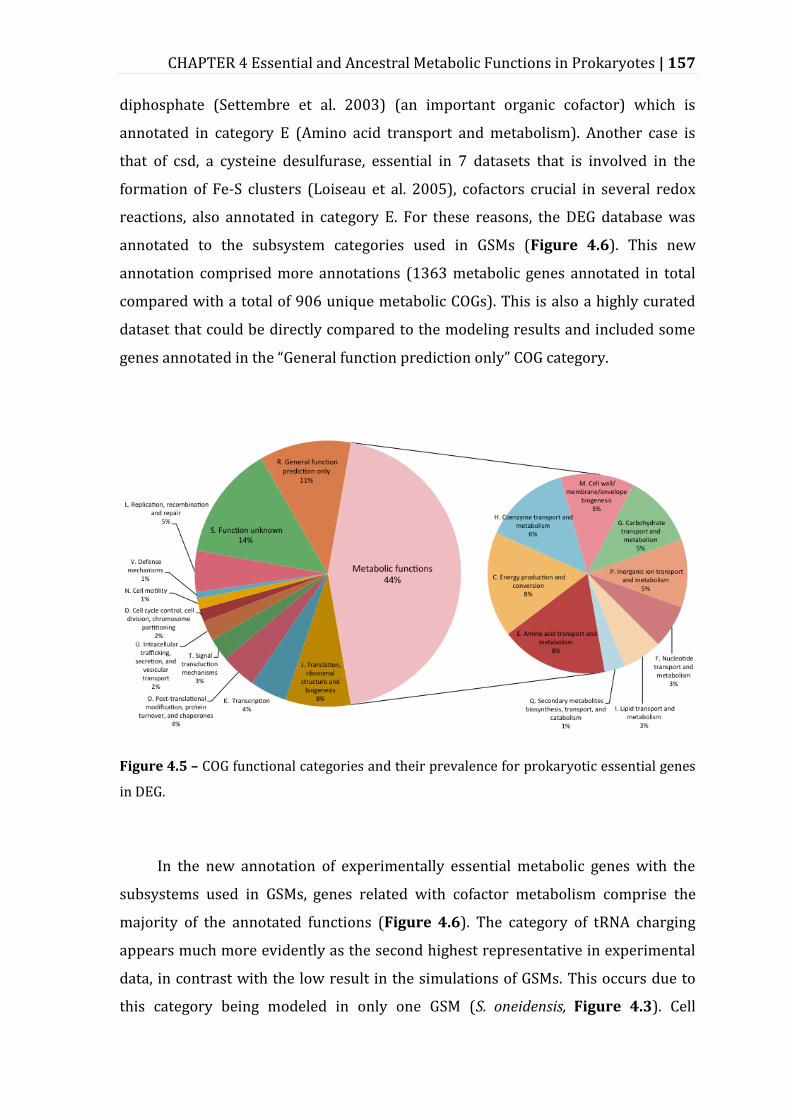
CHAPTER 4 Essential and Ancestral Metabolic Functions in Prokaryotes | 157
diphosphate (Settembre et al. 2003) (an important organic cofactor) which is
annotated in category E (Amino acid transport and metabolism). Another case is
that of csd, a cysteine desulfurase, essential in 7 datasets that is involved in the
formation of Fe-S clusters (Loiseau et al. 2005), cofactors crucial in several redox
reactions, also annotated in category E. For these reasons, the DEG database was
annotated to the subsystem categories used in GSMs (Figure 4.6). This new
annotation comprised more annotations (1363 metabolic genes annotated in total
compared with a total of 906 unique metabolic COGs). This is also a highly curated
dataset that could be directly compared to the modeling results and included some
genes annotated in the “General function prediction only” COG category.
Figure 4.5 – COG functional categories and their prevalence for prokaryotic essential genes
in DEG.
In the new annotation of experimentally essential metabolic genes with the
subsystems used in GSMs, genes related with cofactor metabolism comprise the
majority of the annotated functions (Figure 4.6). The category of tRNA charging
appears much more evidently as the second highest representative in experimental
data, in contrast with the low result in the simulations of GSMs. This occurs due to
this category being modeled in only one GSM (S. oneidensis, Figure 4.3). Cell
158 | CHAPTER 4 Essential and Ancestral Metabolic Functions in Prokaryotes
envelope biosynthesis genes follow as the third most essential functional module, in
accordance with the modeling results. To overview the relationship between
modeling and experimental results, both weighted sums for each set of results
(Figure 4.4 and Figure 4.6) were correlated. Figure 4.7 shows the high correlation
obtained between the weighted essentiality for each subsystem when excluding the
tRNA charging subsystem. It is expected that if this subsystem is included in the 14
remaining models it will be highly essential, as the biomass function would include
all 20 tRNAs charged with the corresponding amino acids.
Figure 4.6 – Conservation of essentiality of metabolic subsystems in 36 large-scale gene
essentiality datasets. Red indicates highest conservation (genes essential for growth in
more than 31 experiments) and grey the least (essential in less than 4 experiments). Black
bar: weighted sum of essential genes given the number of datasets in which they are
essential.
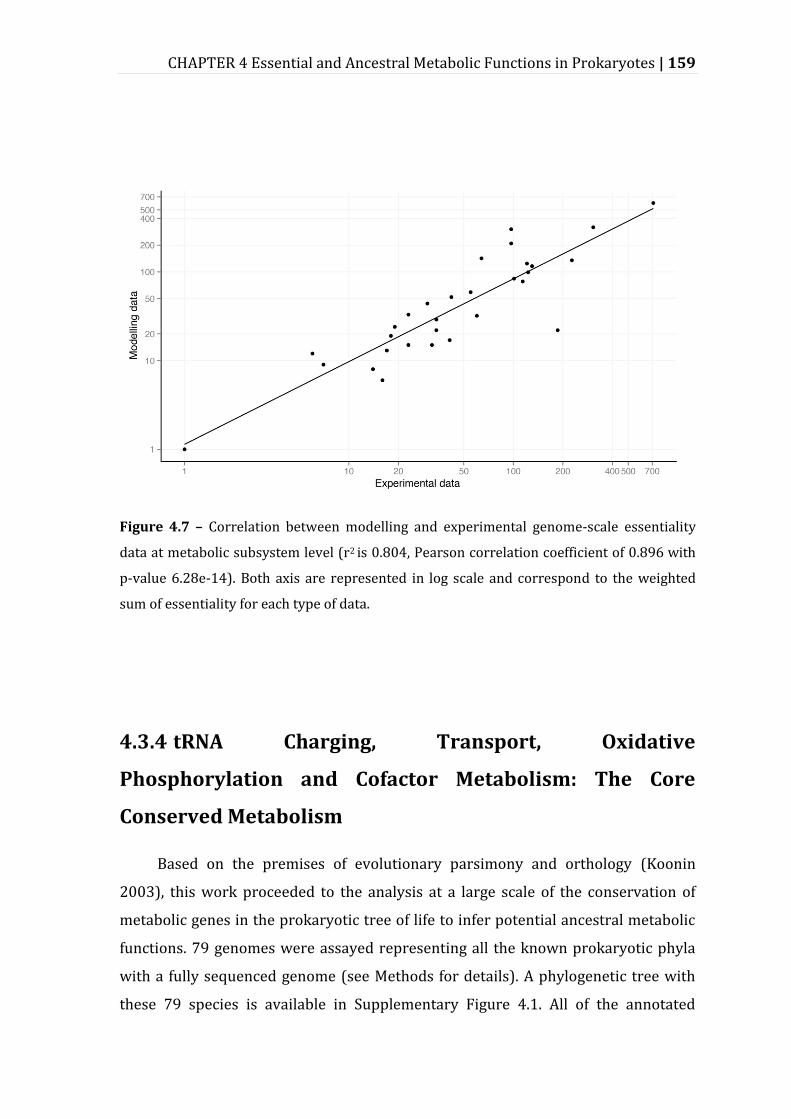
CHAPTER 4 Essential and Ancestral Metabolic Functions in Prokaryotes | 159
Figure 4.7 – Correlation between modelling and experimental genome-scale essentiality
data at metabolic subsystem level (r2 is 0.804, Pearson correlation coefficient of 0.896 with
p-value 6.28e-14). Both axis are represented in log scale and correspond to the weighted
sum of essentiality for each type of data.
4.3.4 tRNA Charging, Transport, Oxidative
Phosphorylation and Cofactor Metabolism: The Core
Conserved Metabolism
Based on the premises of evolutionary parsimony and orthology (Koonin
2003), this work proceeded to the analysis at a large scale of the conservation of
metabolic genes in the prokaryotic tree of life to infer potential ancestral metabolic
functions. 79 genomes were assayed representing all the known prokaryotic phyla
with a fully sequenced genome (see Methods for details). A phylogenetic tree with
these 79 species is available in Supplementary Figure 4.1. All of the annotated
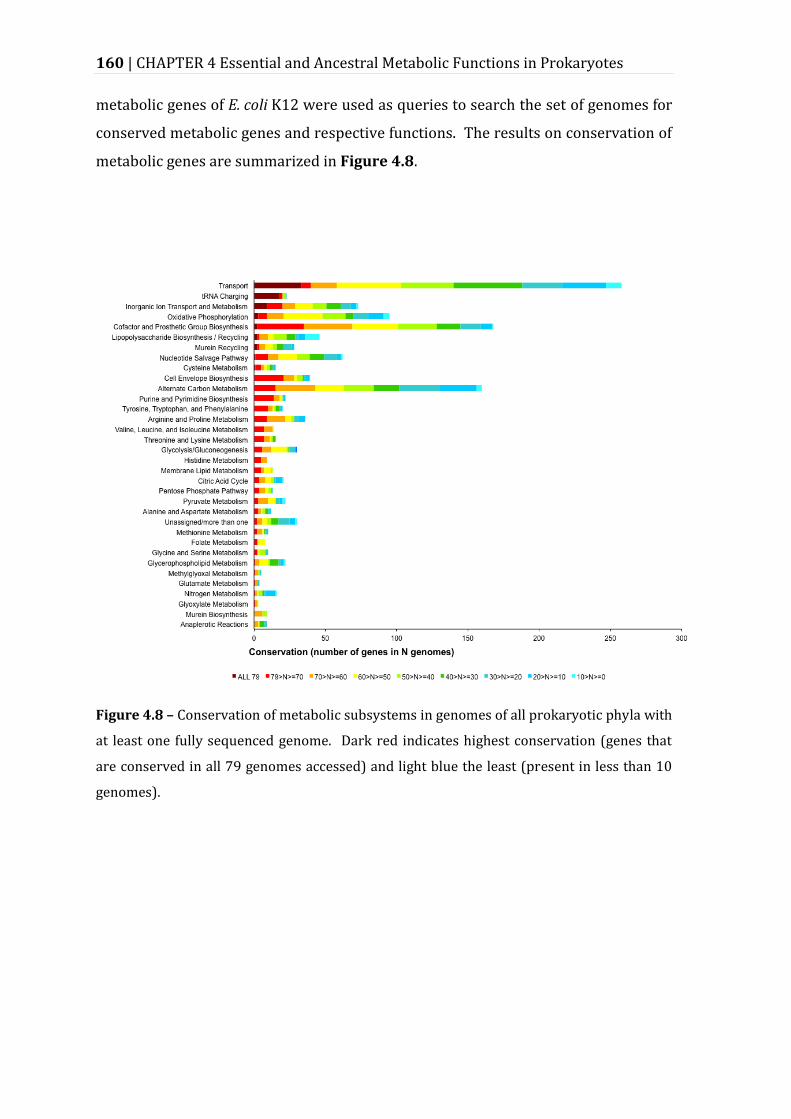
160 | CHAPTER 4 Essential and Ancestral Metabolic Functions in Prokaryotes
metabolic genes of E. coli K12 were used as queries to search the set of genomes for
conserved metabolic genes and respective functions. The results on conservation of
metabolic genes are summarized in Figure 4.8.
Figure 4.8 – Conservation of metabolic subsystems in genomes of all prokaryotic phyla with
at least one fully sequenced genome. Dark red indicates highest conservation (genes that
are conserved in all 79 genomes accessed) and light blue the least (present in less than 10
genomes).
CHAPTER 4 Essential and Ancestral Metabolic Functions in Prokaryotes | 161
The metabolic subsystem with more prevalent genes in more genomes is
Transport, followed by the universal tRNA charging genes (aminoacyl-tRNA
synthetases). It should be noted though that all the 33 transport genes conserved in
all 79 genomes correspond to ABC transporters (Table 4.3). The ATP-binding
domain in these genes is ubiquitous across all domains of life, and therefore it is not
clear if all the hits correspond to the same transported metabolites annotated for E.
coli. Three genes involved in oxidative phosphorylation were also conserved in all
genomes analysed: atpA, atpD (ATP synthase subunit alpha and beta, respectively)
and trxA (thioredoxin). In the subsystem of cofactors and prosthetic group
biosynthesis, glutX and sufC were also conserved in all genomes analysed. It should
be noted though that glutX corresponds actually to a tRNA charging protein, a
glutamyl-tRNA synthetase involved in the biosynthesis of heme, that should have a
double annotation; sufC is an atypical cytoplasmic ABC/ATPase required for the
assembly of iron-sulphur clusters (Nachin 2003).
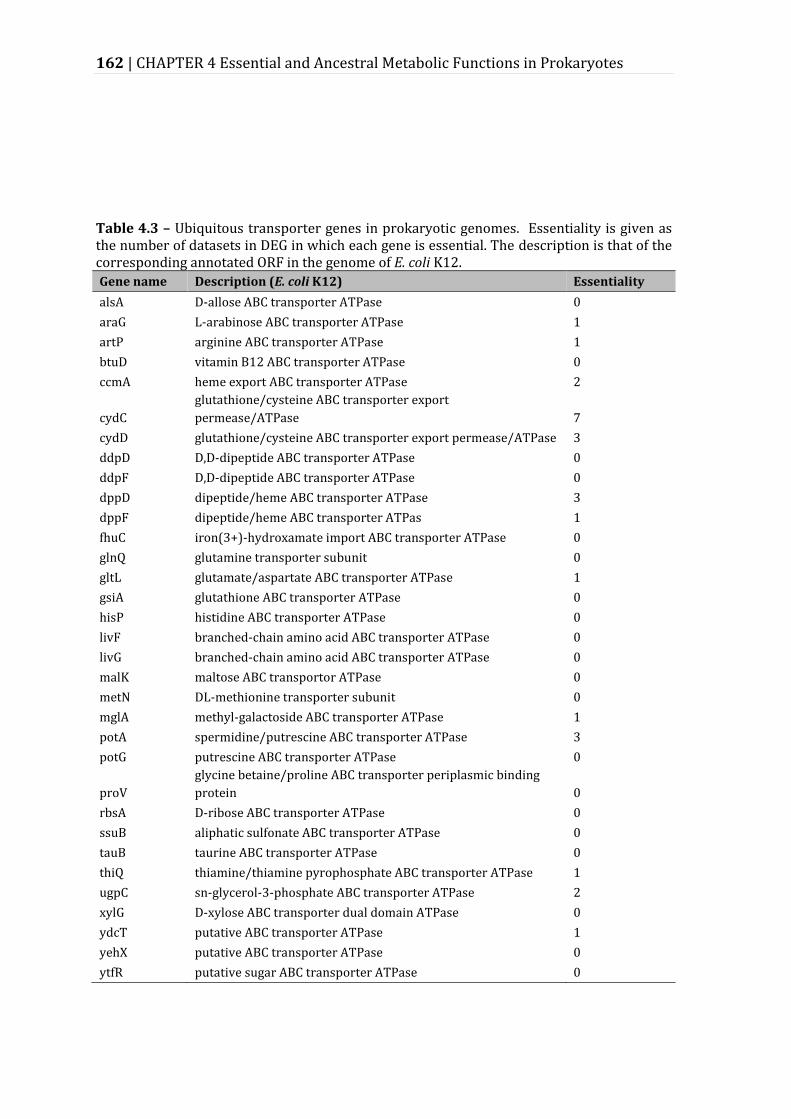
162 | CHAPTER 4 Essential and Ancestral Metabolic Functions in Prokaryotes
Table 4.3 – Ubiquitous transporter genes in prokaryotic genomes. Essentiality is given as the number of datasets in DEG in which each gene is essential. The description is that of the corresponding annotated ORF in the genome of E. coli K12.
Gene name Description (E. coli K12) Essentiality
alsA D-allose ABC transporter ATPase 0
araG L-arabinose ABC transporter ATPase 1
artP arginine ABC transporter ATPase 1
btuD vitamin B12 ABC transporter ATPase 0
ccmA heme export ABC transporter ATPase 2
cydC
glutathione/cysteine ABC transporter export
permease/ATPase 7
cydD glutathione/cysteine ABC transporter export permease/ATPase 3
ddpD D,D-dipeptide ABC transporter ATPase 0
ddpF D,D-dipeptide ABC transporter ATPase 0
dppD dipeptide/heme ABC transporter ATPase 3
dppF dipeptide/heme ABC transporter ATPas 1
fhuC iron(3+)-hydroxamate import ABC transporter ATPase 0
glnQ glutamine transporter subunit 0
gltL glutamate/aspartate ABC transporter ATPase 1
gsiA glutathione ABC transporter ATPase 0
hisP histidine ABC transporter ATPase 0
livF branched-chain amino acid ABC transporter ATPase 0
livG branched-chain amino acid ABC transporter ATPase 0
malK maltose ABC transportor ATPase 0
metN DL-methionine transporter subunit 0
mglA methyl-galactoside ABC transporter ATPase 1
potA spermidine/putrescine ABC transporter ATPase 3
potG putrescine ABC transporter ATPase 0
proV
glycine betaine/proline ABC transporter periplasmic binding
protein 0
rbsA D-ribose ABC transporter ATPase 0
ssuB aliphatic sulfonate ABC transporter ATPase 0
tauB taurine ABC transporter ATPase 0
thiQ thiamine/thiamine pyrophosphate ABC transporter ATPase 1
ugpC sn-glycerol-3-phosphate ABC transporter ATPase 2
xylG D-xylose ABC transporter dual domain ATPase 0
ydcT putative ABC transporter ATPase 1
yehX putative ABC transporter ATPase 0
ytfR putative sugar ABC transporter ATPase 0
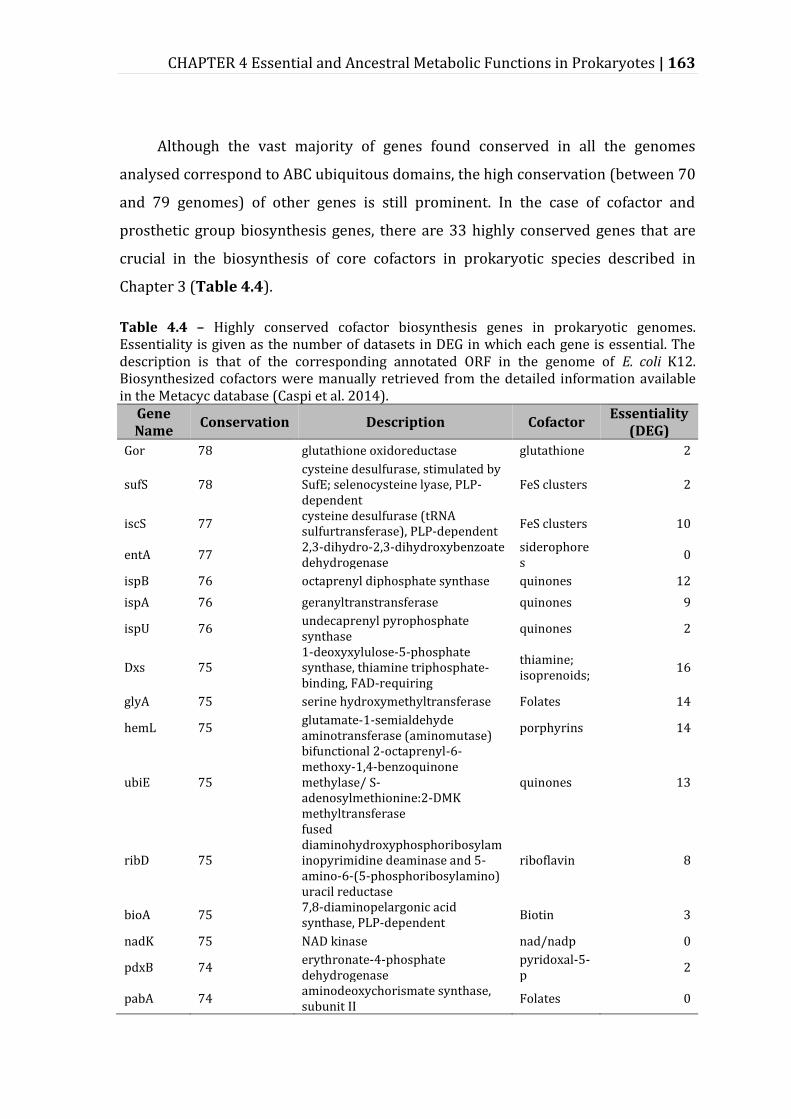
CHAPTER 4 Essential and Ancestral Metabolic Functions in Prokaryotes | 163
Although the vast majority of genes found conserved in all the genomes
analysed correspond to ABC ubiquitous domains, the high conservation (between 70
and 79 genomes) of other genes is still prominent. In the case of cofactor and
prosthetic group biosynthesis genes, there are 33 highly conserved genes that are
crucial in the biosynthesis of core cofactors in prokaryotic species described in
Chapter 3 (Table 4.4).
Table 4.4 – Highly conserved cofactor biosynthesis genes in prokaryotic genomes. Essentiality is given as the number of datasets in DEG in which each gene is essential. The description is that of the corresponding annotated ORF in the genome of E. coli K12. Biosynthesized cofactors were manually retrieved from the detailed information available in the Metacyc database (Caspi et al. 2014).
Gene Name
Conservation Description Cofactor Essentiality
(DEG)
Gor 78 glutathione oxidoreductase glutathione 2
sufS 78 cysteine desulfurase, stimulated by SufE; selenocysteine lyase, PLP-dependent
FeS clusters 2
iscS 77 cysteine desulfurase (tRNA sulfurtransferase), PLP-dependent
FeS clusters 10
entA 77 2,3-dihydro-2,3-dihydroxybenzoate dehydrogenase
siderophores
0
ispB 76 octaprenyl diphosphate synthase quinones 12
ispA 76 geranyltranstransferase quinones 9
ispU 76 undecaprenyl pyrophosphate synthase
quinones 2
Dxs 75 1-deoxyxylulose-5-phosphate synthase, thiamine triphosphate-binding, FAD-requiring
thiamine; isoprenoids;
16
glyA 75 serine hydroxymethyltransferase Folates 14
hemL 75 glutamate-1-semialdehyde aminotransferase (aminomutase)
porphyrins 14
ubiE 75
bifunctional 2-octaprenyl-6-methoxy-1,4-benzoquinone methylase/ S-adenosylmethionine:2-DMK methyltransferase
quinones 13
ribD 75
fused diaminohydroxyphosphoribosylaminopyrimidine deaminase and 5-amino-6-(5-phosphoribosylamino) uracil reductase
riboflavin 8
bioA 75 7,8-diaminopelargonic acid synthase, PLP-dependent
Biotin 3
nadK 75 NAD kinase nad/nadp 0
pdxB 74 erythronate-4-phosphate dehydrogenase
pyridoxal-5-p
2
pabA 74 aminodeoxychorismate synthase, subunit II
Folates 0
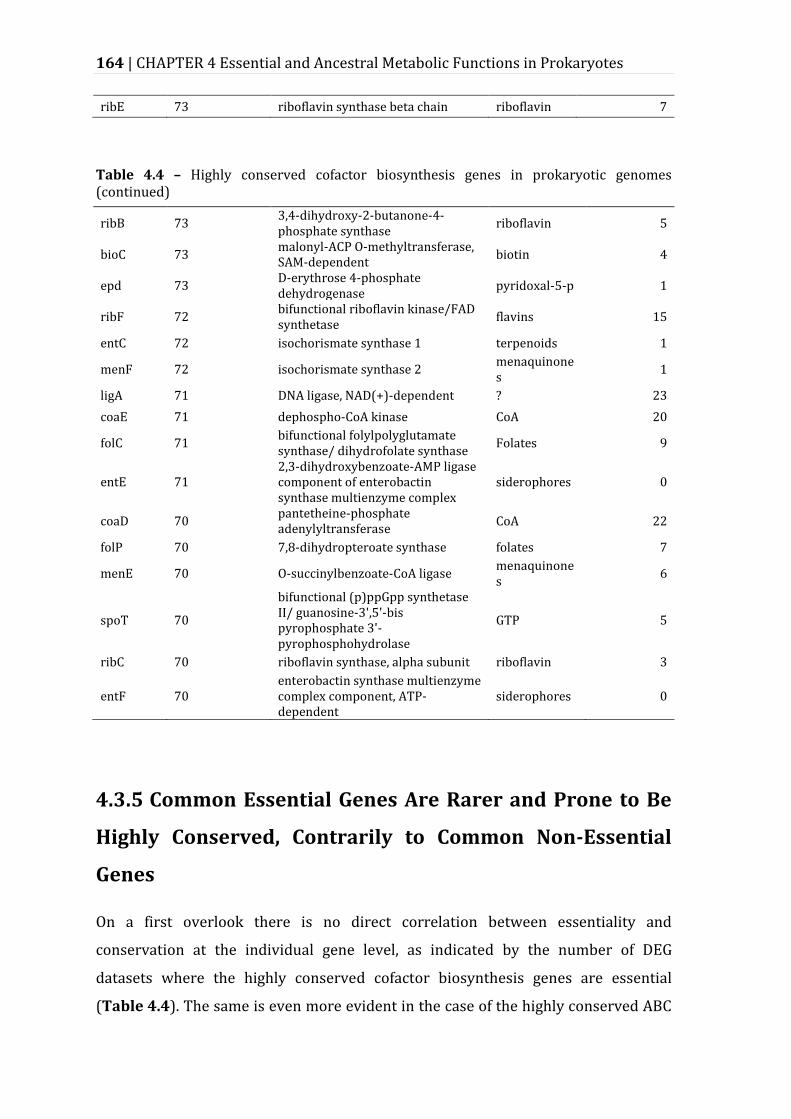
164 | CHAPTER 4 Essential and Ancestral Metabolic Functions in Prokaryotes
ribE 73 riboflavin synthase beta chain riboflavin 7
Table 4.4 – Highly conserved cofactor biosynthesis genes in prokaryotic genomes (continued)
ribB 73 3,4-dihydroxy-2-butanone-4-phosphate synthase
riboflavin 5
bioC 73 malonyl-ACP O-methyltransferase, SAM-dependent
biotin 4
epd 73 D-erythrose 4-phosphate dehydrogenase
pyridoxal-5-p 1
ribF 72 bifunctional riboflavin kinase/FAD synthetase
flavins 15
entC 72 isochorismate synthase 1 terpenoids 1
menF 72 isochorismate synthase 2 menaquinones
1
ligA 71 DNA ligase, NAD(+)-dependent ? 23
coaE 71 dephospho-CoA kinase CoA 20
folC 71 bifunctional folylpolyglutamate synthase/ dihydrofolate synthase
Folates 9
entE 71 2,3-dihydroxybenzoate-AMP ligase component of enterobactin synthase multienzyme complex
siderophores 0
coaD 70 pantetheine-phosphate adenylyltransferase
CoA 22
folP 70 7,8-dihydropteroate synthase folates 7
menE 70 O-succinylbenzoate-CoA ligase menaquinones
6
spoT 70
bifunctional (p)ppGpp synthetase II/ guanosine-3',5'-bis pyrophosphate 3'-pyrophosphohydrolase
GTP 5
ribC 70 riboflavin synthase, alpha subunit riboflavin 3
entF 70 enterobactin synthase multienzyme complex component, ATP-dependent
siderophores 0
4.3.5 Common Essential Genes Are Rarer and Prone to Be
Highly Conserved, Contrarily to Common Non-Essential
Genes
On a first overlook there is no direct correlation between essentiality and
conservation at the individual gene level, as indicated by the number of DEG
datasets where the highly conserved cofactor biosynthesis genes are essential
(Table 4.4). The same is even more evident in the case of the highly conserved ABC
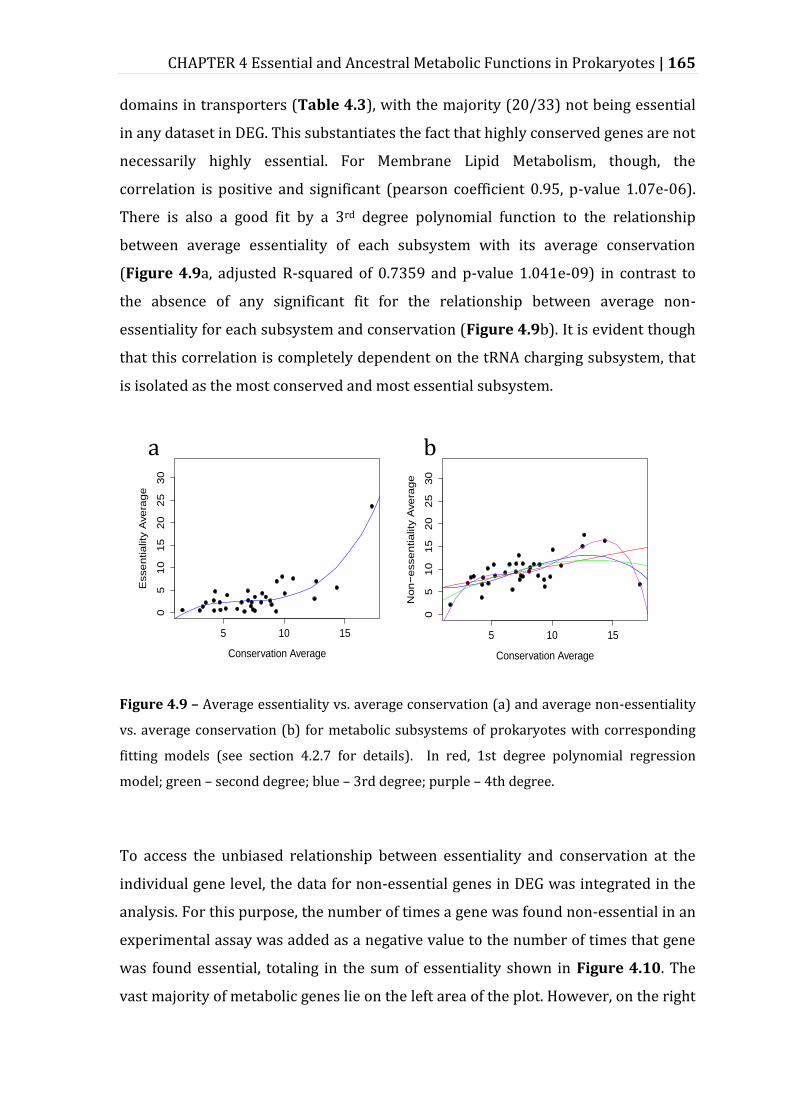
CHAPTER 4 Essential and Ancestral Metabolic Functions in Prokaryotes | 165
domains in transporters (Table 4.3), with the majority (20/33) not being essential
in any dataset in DEG. This substantiates the fact that highly conserved genes are not
necessarily highly essential. For Membrane Lipid Metabolism, though, the
correlation is positive and significant (pearson coefficient 0.95, p-value 1.07e-06).
There is also a good fit by a 3rd degree polynomial function to the relationship
between average essentiality of each subsystem with its average conservation
(Figure 4.9a, adjusted R-squared of 0.7359 and p-value 1.041e-09) in contrast to
the absence of any significant fit for the relationship between average non-
essentiality for each subsystem and conservation (Figure 4.9b). It is evident though
that this correlation is completely dependent on the tRNA charging subsystem, that
is isolated as the most conserved and most essential subsystem.
Figure 4.9 – Average essentiality vs. average conservation (a) and average non-essentiality
vs. average conservation (b) for metabolic subsystems of prokaryotes with corresponding
fitting models (see section 4.2.7 for details). In red, 1st degree polynomial regression
model; green – second degree; blue – 3rd degree; purple – 4th degree.
To access the unbiased relationship between essentiality and conservation at the
individual gene level, the data for non-essential genes in DEG was integrated in the
analysis. For this purpose, the number of times a gene was found non-essential in an
experimental assay was added as a negative value to the number of times that gene
was found essential, totaling in the sum of essentiality shown in Figure 4.10. The
vast majority of metabolic genes lie on the left area of the plot. However, on the right
5 10 15
05
10
15
20
25
30
Conservation Average
Esse
ntia
lity
Ave
rag
e
5 10 15
05
10
15
20
25
30
Conservation Average
Non−
esse
ntia
lity
Ave
rag
e
a b
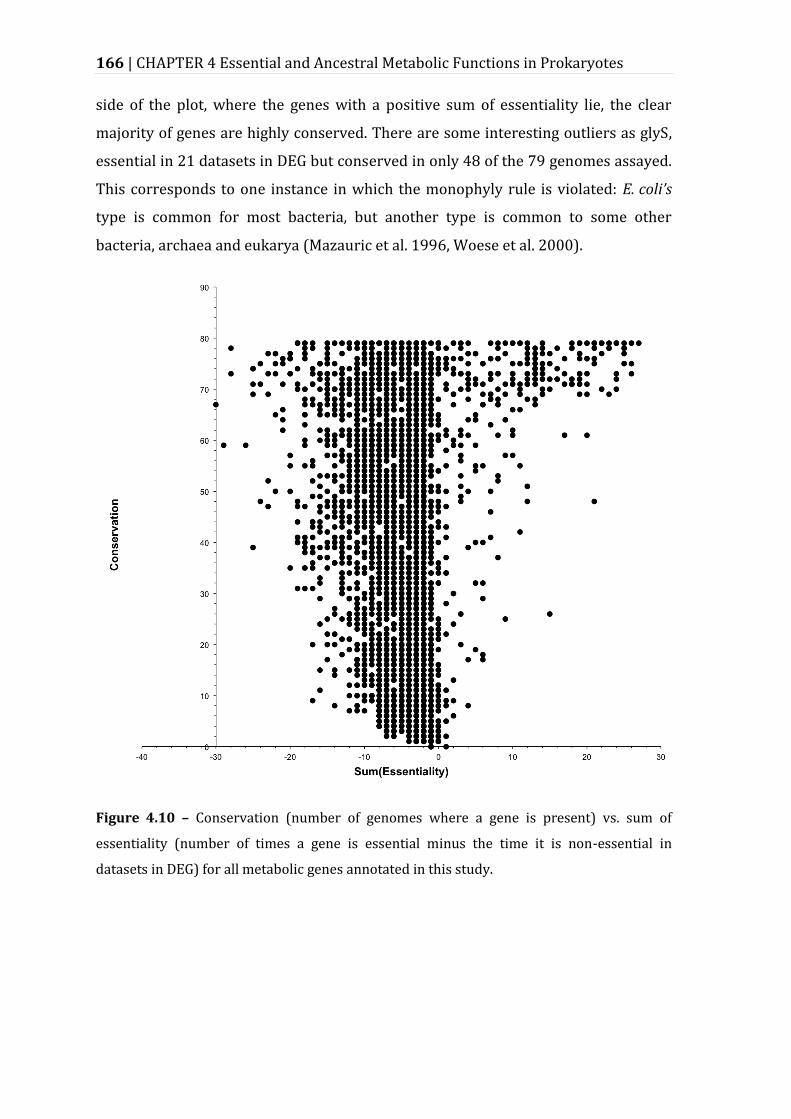
166 | CHAPTER 4 Essential and Ancestral Metabolic Functions in Prokaryotes
side of the plot, where the genes with a positive sum of essentiality lie, the clear
majority of genes are highly conserved. There are some interesting outliers as glyS,
essential in 21 datasets in DEG but conserved in only 48 of the 79 genomes assayed.
This corresponds to one instance in which the monophyly rule is violated: E. coli’s
type is common for most bacteria, but another type is common to some other
bacteria, archaea and eukarya (Mazauric et al. 1996, Woese et al. 2000).
Figure 4.10 – Conservation (number of genomes where a gene is present) vs. sum of
essentiality (number of times a gene is essential minus the time it is non-essential in
datasets in DEG) for all metabolic genes annotated in this study.
CHAPTER 4 Essential and Ancestral Metabolic Functions in Prokaryotes | 167
4.4 Discussion
The integration done here was the first of the kind for a wide variety of phyla
of the bacteria and archaea domains, encompassing experimental phenotypic data,
results of large-scale computational simulations and sequence data. The
experimental genome-scale essentiality data reveals that approximately 25% of
prokaryotic essential genes encode for unknown or general functions (categories S
and R in Figure 4.5), which is a strong warning on the need for experimental studies
on the phenotype of these essential proteins for prokaryotic physiology. While those
are not available, computational models can be valuable tools aiding in the task of
decoding prokaryotic metabolism.
Although GSMs are limited by the quality of the genome annotations, the
biomass equation and environmental formulations, the integration performed here
tried to reduce the impact of these limitations. First of all, the choice of the models
was based on a large survey of high-quality manually curated models
(Supplementary Table 3.1) for which 15 balanced, validated, comparable models
were chosen, that at the same time included wide phylogenetic diversity (Table
4.1). Secondly, the analysis filtered out the unique essential reactions that might
represent specific errors related with individual models, to find core and common
features to most of them. Also, as recognized by other authors, the predictive power
of comparative analysis can be significantly enhanced by using it within the
functional context of pathways and subsystems (Gerdes et al. 2006). The prediction
with GSMs of which metabolic subsystems have genes that are more commonly
essential in multiple species was accurate (Figure 4.7). The exception of the
experimentally demonstrated highly essential tRNA-charging functionality that was
not reflected in the simulations is due to the hindrance of just one model including
this subsystem (Pinchuk et al. 2010).
The problem of the unstandardized biomass composition, evidenced by the
GSM of K. pneumoniae not predicting any essential reaction involved in cofactor and
prosthetic group biosynthesis (Figure 4.3) was explored in Chapter 3 of this thesis.
Due to the incompleteness of the networks, it was not possible to complete the
equations with the missing cofactors without an impractical manual editing and
168 | CHAPTER 4 Essential and Ancestral Metabolic Functions in Prokaryotes
curation of most models. However, considering the results obtained here, this
incompleteness did not impair the prediction of an overwhelming majority of
essential reactions related with this subsystem. Interestingly, reactions annotated in
the metabolic subsystem of tryptophan, tyrosine and phenylalanine biosynthesis
were detected as commonly essential in metabolic networks but not in the
experimental data. It was found that these reactions are involved in the shikimate
pathway and have a broader functionality that is essential not only for the de novo
synthesis of aromatic amino acids but also the biosynthesis of folates, which are
essential in one carbon metabolism (Chapter 3). The active folates are core
prokaryotic cofactors present in most biomass equations (13 out of 15) and can’t be
directly uptaken (see section 4.3.2; Chapter 3 of this thesis). It could be expected
that essential vitamins could be uptaken directly in rich media by most prokaryotes,
but that is not the case, as it was confirmed by the results of experimental
essentiality (Figure 4.6). A closer look at the individual genes shows that other
essential cofactors cannot be uptaken in their active forms and therefore some
enzymes essential for their biosynthesis are essential for cell viability even in rich
media (eg. nadE for NAD; coaD and coaE for coenzyme A; hemC for heme; dxr for
isoprenoids).
The results of the comparison of modeling with essentiality results can help
raising specific hypothesis and directions for more detailed investigation. One
example is that of chorismate synthase. In the rich media essentiality datasets
studied, although this enzyme has been shown to be essential in some cases, it is
non-essential in the majority. However, in minimal media the knock-out of this gene
in E. coli impairs growth (Joyce et al. 2006). It has been shown that when provided
with p-aminobenzoic acid (PABA), para-hydroxybenzoic acid (PHBA) or a
combination of a precursor from PABA with a non-biological catalyst, the growth of
E. coli aroC mutant in M9 minimal medium could be rescued (Lee et al. 2013).
Transporters for these compounds or others that might compensate for the lethal
phenotype in rich media remain to be integrated in the genome-scale metabolic
models and further explored.
Still regarding the results of simulations with GSMs, the subsystems of
membrane lipid metabolism and cofactor and prosthetic group biosynthesis display
CHAPTER 4 Essential and Ancestral Metabolic Functions in Prokaryotes | 169
a similar total of essential reactions (169 and 184, respectively), but a very different
weighted sum of essentiality (Figure 4.4, W of 209 and 597; see section 4.2.7 for
details). This indicates that although both subsystems are crucial for cell viability,
the latter uses the same metabolic tools since early evolution, while the former
diversified early in a wider variety of entities and functionalities. This was
confirmed by the results of the analysis of conservation of the sequences of
metabolic genes in prokaryotic genomes (Figure 4.8). The experimental data
reflects these results (Figure 4.6), except for the total of essential genes in lipid
metabolism, which is highly likely to occur because of the use of E.coli to annotate
the metabolic genes, which excludes the lipid genes of Gram positive bacteria.
The analysis of conservation of metabolic genes here was the first using a
manually curated annotation system for metabolic pathways and subsystems, with
the latest and largest genome-scale metabolic model of a prokaryote to date (Orth et
al. 2011). Regarding inferences on ancestry, it is important to note that genes
encoding for functions that were lost throughout the evolution of prokaryotes might
have been present in the last common ancestor of prokaryotes and will not be
identified with this analysis. However, the genes identified here as present in all
genomes of all representative phyla are most likely genes present in the last
common ancestor (Koonin 2003).
Overall, the results of high conservation of the tRNA charging system,
Transport and Oxidative Phosphorylation point to a last common ancestor metabolic
network of the prokaryotes where most of the nutrients were uptaken with
nonspecific transporters at the expense of ATP and in which tRNA charging were
already present. This hypothesis might help bridge the gap in the debate of
metabolism or replication first (Pross 2004), by establishing a connection of simpler
information processing systems in the hypothetical RNA world with the metabolic
reactions that provided the required energy. The results also suggest that the
catalytic power of cofactors and prosthetic groups was a coin highly sought for in
early prebiotic systems. It is highly likely that genes encoding for enzymes aiding in
cofactor biosynthesis were selected for early in primordial evolution, as was
suggested elsewhere for the origin of anabolic pathways in prebiotic systems (Fani
& Fondi 2009).
170 | CHAPTER 4 Essential and Ancestral Metabolic Functions in Prokaryotes
This work also expanded considerably on previous related studies regarding the
relationship between gene conservation and essentiality in width and depth. Jordan
and coauthors used only E. coli essentiality data that was mapped to H. pylori and N.
meningitidis to show that essential genes are more evolutionary conserved that non-
essential (Jordan et al. 2002). Luo and coauthors used 23 experimentally essential
assays to corroborate that finding (Luo et al. 2015). Both studies used the ratio of
non-synonymous substitutions to synonymous substitutions in the genomes to
estimate conservation (Ka/Ks). Here, 36 experimentally essential datasets were
used, that included one Archaea (Table 4.2). The conservation was analyzed just by
looking at the presence of each gene in 79 genomes that were manually selected to
represent all the phyla with one fully-sequenced genome in the prokaryotic tree of
life. Because each gene is essential in some datasets in DEG, non-essential in others
and not assayed in yet others, instead of analyzing essential genes separately from
non-essential as in the two aforementioned studies, an alternative method was used:
a measure of essentiality for each gene (sum of essentiality) that takes into account
the datasets where it shows up as essential and those where it is non-essential
(Figure 4.10). The results show that genes with a positive sum of essentiality (more
datasets showing essential that non-essential) are much scarcer than those with a
negative sum, however it is much more likely that they are highly conserved. For
genes with a negative sum of essentiality, there is no tendency for high or low
conservation, with a uniform distribution of these genes for all the values of
conservation. Here, the results expanded also both previously mentioned studies by
integrating functional assessment of the data. The function of highly conserved
metabolic genes was explored, with the conclusion that with the exception of tRNA
charging subsystem, the majority of highly conserved genes related with transport
and cofactor biosynthesis are not highly essential (Figure 4.10, Table 4.3 and
Table 4.4). This confirms a well-known remarkable redundancy in metabolic
networks (Freilich et al. 2010) that is reflected in the resilience and robustness of
life forms, which was responsible for life’s endurance for the billions of years that it
has existed on Earth. Most of this redundancy is not only based on known
alternative metabolic routes but on promiscuous, general enzymatic activities, a
large amount of which is still poorly understood (evident in the percentage of genes
with general function prediction only in Figure 4.5) and that might be even more
CHAPTER 4 Essential and Ancestral Metabolic Functions in Prokaryotes | 171
prevalent than previously thought, although in many cases unpredictable (Patrick et
al. 2007).
References
Akerley BJ, Rubin EJ, Novick VL, Amaya K, Judson N, Mekalanos JJ. 2002. A genome-
scale analysis for identification of genes required for growth or survival of
Haemophilus influenzae. Proc. Natl. Acad. Sci. U. S. A. 99(2):966–71
Archer CT, Kim JF, Jeong H, Park JH, Vickers CE, et al. 2011. The genome sequence of
E. coli W (ATCC 9637): comparative genome analysis and an improved genome-
scale reconstruction of E. coli. BMC Genomics. 12(1):9
Baba T, Ara T, Hasegawa M. 2006. Construction of Escherichia coli K-12 in-frame,
single-gene knockout mutants: the Keio collection. Mol. Syst. Biol. 2:
Barquist L, Langridge GC, Turner DJ, Phan M-D, Turner AK, et al. 2013. A comparison
of dense transposon insertion libraries in the Salmonella serovars Typhi and
Typhimurium. Nucleic Acids Res. 41(8):4549–64
Baugh L, Gallagher LA, Patrapuvich R, Clifton MC, Gardberg AS, et al. 2013.
Combining functional and structural genomics to sample the essential
Burkholderia structome. PLoS One. 8(1):e53851
Becker S a, Palsson BØ. 2005. Genome-scale reconstruction of the metabolic network
in Staphylococcus aureus N315: an initial draft to the two-dimensional
annotation. BMC Microbiol. 5:8
Cameron DE, Urbach JM, Mekalanos JJ. 2008. A defined transposon mutant library
and its use in identifying motility genes in Vibrio cholerae. Proc. Natl. Acad. Sci.
U. S. A. 105(25):8736–41
Caspi R, Altman T, Billington R, Dreher K, Foerster H, et al. 2014. The MetaCyc
database of metabolic pathways and enzymes and the BioCyc collection of
Pathway/Genome Databases. Nucleic Acids Res. 42(Database issue):D459–71
Chaudhuri RR, Allen AG, Owen PJ, Shalom G, Stone K, et al. 2009. Comprehensive
identification of essential Staphylococcus aureus genes using Transposon-
Mediated Differential Hybridisation (TMDH). BMC Genomics. 10:291
Chen W-H, Minguez P, Lercher MJ, Bork P. 2012. OGEE: an online gene essentiality
database. Nucleic Acids Res. 40(Database issue):D901–6
Christen B, Abeliuk E, Collier JM, Kalogeraki VS, Passarelli B, et al. 2011. The
essential genome of a bacterium. Mol. Syst. Biol. 7:528
172 | CHAPTER 4 Essential and Ancestral Metabolic Functions in Prokaryotes
Cock PJA, Antao T, Chang JT, Chapman BA, Cox CJ, et al. 2009. Biopython: freely
available Python tools for computational molecular biology and bioinformatics.
Bioinformatics. 25(11):1422–23
Coggins JR, Abell C, Evans LB, Frederickson M, Robinson D a, et al. 2003. Experiences
with the shikimate-pathway enzymes as targets for rational drug design.
Biochem. Soc. Trans. 31(Pt 3):548–52
Cvijovic M, Olivares-Hernández R, Agren R, Dahr N, Vongsangnak W, et al. 2010.
BioMet Toolbox: genome-wide analysis of metabolism. Nucleic Acids Res.
38(Web Server issue):W144–49
de Berardinis V, Vallenet D, Castelli V, Besnard M, Pinet A, et al. 2008. A complete
collection of single-gene deletion mutants of Acinetobacter baylyi ADP1. Mol.
Syst. Biol. 4:174
Deutschbauer A, Price MN, Wetmore KM, Shao W, Baumohl JK, et al. 2011. Evidence-
based annotation of gene function in Shewanella oneidensis MR-1 using genome-
wide fitness profiling across 121 conditions. PLoS Genet. 7(11):e1002385
Edwards JS, Palsson BØ. 2000. The Escherichia coli MG1655 in silico metabolic
genotype: its definition, characteristics, and capabilities. Proc. Natl. Acad. Sci. U.
S. A. 97(10):5528–33
Fani R, Fondi M. 2009. Origin and evolution of metabolic pathways. Phys. Life Rev.
6(1):23–52
Fayet O, Ziegelhoffer T, Georgopoulos C. 1989. The groES and groEL heat shock gene
products of Escherichia coli are essential for bacterial growth at all
temperatures. J. Bacteriol. 171(3):1379–85
Feist AM, Henry CS, Reed JL, Krummenacker M, Joyce AR, et al. 2007. A genome-scale
metabolic reconstruction for Escherichia coli K-12 MG1655 that accounts for
1260 ORFs and thermodynamic information. Mol. Syst. Biol. 3(121):121
Feist AM, Scholten JCM, Palsson BØ, Brockman FJ, Ideker T. 2006. Modeling
methanogenesis with a genome-scale metabolic reconstruction of
Methanosarcina barkeri. Mol. Syst. Biol. 2:
Fournier GP, Andam CP, Gogarten JP. 2015. Ancient horizontal gene transfer and the
last common ancestors. BMC Evol. Biol. 15(1):70
Freilich S, Kreimer A, Borenstein E, Gophna U, Sharan R, Ruppin E. 2010. Decoupling
Environment-Dependent and Independent Genetic Robustness across Bacterial
Species. PLoS Comput. Biol. 6(2):
French CT, Lao P, Loraine AE, Matthews BT, Yu H, Dybvig K. 2008. Large-scale
transposon mutagenesis of Mycoplasma pulmonis. Mol. Microbiol. 69(1):67–76
CHAPTER 4 Essential and Ancestral Metabolic Functions in Prokaryotes | 173
Gallagher LA, Ramage E, Jacobs MA, Kaul R, Brittnacher M, Manoil C. 2007. A
comprehensive transposon mutant library of Francisella novicida, a bioweapon
surrogate. Proc. Natl. Acad. Sci. U. S. A. 104(3):1009–14
Gallagher LA, Shendure J, Manoil C. 2011. Genome-scale identification of resistance
functions in Pseudomonas aeruginosa using Tn-seq. MBio. 2(1):e00315–10
Gerdes S, Edwards R, Kubal M, Fonstein M, Stevens R, Osterman A. 2006. Essential
genes on metabolic maps. Curr. Opin. Biotechnol. 17(5):448–56
Gerdes SY, Scholle MD, Campbell JW, Balazsi G, Ravasz E, et al. 2003. Experimental
Determination and System Level Analysis of Essential Genes in Escherichia coli
MG1655. J. Bacteriol. 185(19):5673–84
Glass JI, Assad-Garcia N, Alperovich N, Yooseph S, Lewis MR, et al. 2006. Essential
genes of a minimal bacterium. Proc. Natl. Acad. Sci. U. S. A. 103(2):425–30
Goodman AL, McNulty NP, Zhao Y, Leip D, Mitra RD, et al. 2009. Identifying Genetic
Determinants Needed to Establish a Human Gut Symbiont in Its Habitat. Cell
Host Microbe. 6(3):279–89
Griffin JE, Gawronski JD, Dejesus MA, Ioerger TR, Akerley BJ, Sassetti CM. 2011. High-
resolution phenotypic profiling defines genes essential for mycobacterial
growth and cholesterol catabolism. PLoS Pathog. 7(9):e1002251
Islam MA, Edwards E a., Mahadevan R. 2010. Characterizing the metabolism of
Dehalococcoides with a constraint-based model. PLoS Comput. Biol. 6(8):
Jamshidi N, Palsson BØ. 2007. Investigating the metabolic capabilities of
Mycobacterium tuberculosis H37Rv using the in silico strain iNJ661 and
proposing alternative drug targets. BMC Syst. Biol. 1:26
Ji Y, Zhang B, Van SF, Horn, Warren P, et al. 2001. Identification of critical
staphylococcal genes using conditional phenotypes generated by antisense
RNA. Science 293(5538):2266–69
Jordan IK, Rogozin IB, Wolf YI, Koonin E V. 2002. Essential genes are more
evolutionarily conserved than are nonessential genes in bacteria. Genome Res.
12(6):962–68
Joyce AR, Reed JL, White A, Edwards R, Osterman A, et al. 2006. Experimental and
computational assessment of conditionally essential genes in Escherichia coli. J.
Bacteriol. 188(23):8259–71
Kauffman S. 1995. At Home in the Universe: The Search for the Laws of Self-
Organization and Complexity. Oxford University Press
Khatiwara A, Jiang T, Sung S-S, Dawoud T, Kim JN, et al. 2012. Genome scanning for
conditionally essential genes in Salmonella enterica Serotype Typhimurium.
174 | CHAPTER 4 Essential and Ancestral Metabolic Functions in Prokaryotes
Appl. Environ. Microbiol. 78(9):3098–3107
Kim KM, Caetano-Anollés G. 2011. The proteomic complexity and rise of the
primordial ancestor of diversified life. BMC Evol. Biol. 11(1):140
Klein B a, Tenorio EL, Lazinski DW, Camilli A, Duncan MJ, Hu LT. 2012. Identification
of Essential Genes of the Periodontal Pathogen Porphyromonas Gingivalis, Vol. 13
Knuth K, Niesalla H, Hueck CJ, Fuchs TM. 2004. Large-scale identification of essential
Salmonella genes by trapping lethal insertions. Mol. Microbiol. 51(6):1729–44
Kobayashi K, Ehrlich SD, Albertini a, Amati G, Andersen KK, et al. 2003. Essential
Bacillus subtilis genes. Proc. Natl. Acad. Sci. U. S. A. 100(8):4678–83
Koonin E V. 2003. Comparative genomics, minimal gene-sets and the last universal
common ancestor. Nat. Rev. Microbiol. 1(2):127–36
Langridge GC, Phan M-D, Turner DJ, Perkins TT, Parts L, et al. 2009. Simultaneous
assay of every Salmonella Typhi gene using one million transposon mutants.
Genome Res. 19(12):2308–16
Le Breton Y, Belew AT, Valdes KM, Islam E, Curry P, et al. 2015. Essential genes in
the core genome of the human pathogen Streptococcus pyogenes. Sci. Rep.
5:9838
Lee Y, Umeano A, Balskus EP. 2013. Rescuing auxotrophic microorganisms with
nonenzymatic chemistry. Angew. Chem. Int. Ed. Engl. 52(45):11800–803
Liao YC, Huang TW, Chen FC, Charusanti P, Hong JSJ, et al. 2011. An experimentally
validated genome-scale metabolic reconstruction of Klebsiella pneumoniae MGH
78578, iYL1228. J. Bacteriol. 193(7):1710–17
Liberati NT, Urbach JM, Miyata S, Lee DG, Drenkard E, et al. 2006. An ordered,
nonredundant library of Pseudomonas aeruginosa strain PA14 transposon
insertion mutants. Proc. Natl. Acad. Sci. U. S. A. 103(8):2833–38
Loiseau L, Ollagnier-de Choudens S, Lascoux D, Forest E, Fontecave M, Barras F.
2005. Analysis of the heteromeric CsdA-CsdE cysteine desulfurase, assisting Fe-
S cluster biogenesis in Escherichia coli. J. Biol. Chem. 280(29):26760–69
Luo H, Gao F, Lin Y. 2015. Evolutionary conservation analysis between the essential
and nonessential genes in bacterial genomes. Sci. Rep. 5:13210
Luo H, Lin Y, Gao F, Zhang C-TT, Zhang R. 2014. DEG 10, an update of the database of
essential genes that includes both protein-coding genes and noncoding genomic
elements. Nucleic Acids Res. 42(November 2013):574–80
Mampel J, Buescher JM, Meurer G, Eck J. 2013. Coping with complexity in metabolic
engineering. Trends Biotechnol. 31(1):52–60
CHAPTER 4 Essential and Ancestral Metabolic Functions in Prokaryotes | 175
Mazauric M-H, Reinbolt J, Lorber B, Ebel C, Keith G, et al. 1996. An Example of Non-
Conservation of Oligomeric Structure in Prokaryotic Aminoacyl-tRNA
Synthetases. Biochemical and Structural Properties of Glycyl-tRNA Synthetase
from Thermus thermophilus. Eur. J. Biochem. 241(3):814–26
Metris A, Reuter M, Gaskin DJH, Baranyi J, van Vliet AHM. 2011. In vivo and in silico
determination of essential genes of Campylobacter jejuni. BMC Genomics.
12(1):535
Milne CB, Eddy JA, Raju R, Ardekani S, Kim P-J, et al. 2011. Metabolic network
reconstruction and genome-scale model of butanol-producing strain
Clostridium beijerinckii NCIMB 8052. BMC Syst. Biol. 5(1):130
Moule MG, Hemsley CM, Seet Q, Guerra-Assuncao JA, Lim J, et al. 2014. Genome-wide
saturation mutagenesis of Burkholderia pseudomallei K96243 predicts essential
genes and novel targets for antimicrobial development. MBio. 5(1):e00926–13
Nachin L. 2003. SufC: an unorthodox cytoplasmic ABC/ATPase required for [Fe-S]
biogenesis under oxidative stress. EMBO J. 22(3):427–37
Nogales J, Gudmundsson S, Knight EM, Palsson BØ, Thiele I. 2012. Detailing the
optimality of photosynthesis in cyanobacteria through systems biology analysis.
Proc. Natl. Acad. Sci. U. S. A. 109(7):2678–83
Nogales J, Palsson BØ, Thiele I. 2008. A genome-scale metabolic reconstruction of
Pseudomonas putida KT2440: iJN746 as a cell factory. BMC Syst. Biol. 2:79
Oberhardt MA, Palsson BØ, Papin JA. 2009. Applications of genome-scale metabolic
reconstructions. Mol. Syst. Biol. 5:
Oh Y-K, Palsson BØ, Park SM, Schilling CH, Mahadevan R. 2007. Genome-scale
reconstruction of metabolic network in Bacillus subtilis based on high-
throughput phenotyping and gene essentiality data. J. Biol. Chem.
282(39):28791–99
Oltvai ZN, Barabási A-L. 2002. Systems biology. Life’s complexity pyramid. Science.
298(2002):763–64
Orth JD, Conrad TM, Na J, Lerman J a, Nam H, et al. 2011. A comprehensive genome-
scale reconstruction of Escherichia coli metabolism—2011. Mol. Syst. Biol.
7(535):1–9
Overbeek R, Olson R, Pusch GD, Olsen GJ, Davis JJ, et al. 2014. The SEED and the
Rapid Annotation of microbial genomes using Subsystems Technology (RAST).
Nucleic Acids Res. 42(Database issue):D206–14
Patrick WM, Quandt EM, Swartzlander DB, Matsumura I. 2007. Multicopy
suppression underpins metabolic evolvability. Mol. Biol. Evol. 24(12):2716–22
176 | CHAPTER 4 Essential and Ancestral Metabolic Functions in Prokaryotes
Peretó J. 2012. Out of fuzzy chemistry : from prebiotic chemistry to metabolic
networks. Chem. Soc. Rev. 41(16):5394–5403
Pinchuk GE, Hill EA, Geydebrekht O V, De Ingeniis J, Zhang X, et al. 2010. Constraint-
based model of Shewanella oneidensis MR-1 metabolism: a tool for data analysis
and hypothesis generation. PLoS Comput. Biol. 6(6):e1000822
Pross A. 2004. Causation and the Origin of Life. Metabolism or Replication First?
Orig. Life Evol. Biosph. 34(3):307–21
Rahman SA, Singh Y, Kohli S, Ahmad J, Ehtesham NZ, et al. 2014. Comparative
analyses of nonpathogenic, opportunistic, and totally pathogenic mycobacteria
reveal genomic and biochemical variabilities and highlight the survival
attributes of Mycobacterium tuberculosis. MBio. 5(6):e02020
Rasmussen S, Bedau MA, Chen L, Deamer D, Krakauer DC, et al., eds. 2008. Protocells.
London: The MIT Press. First ed.
Rocha EPC, Danchin A. 2003. Gene essentiality determines chromosome
organisation in bacteria. Nucleic Acids Res. 31(22):6570–77
Rocha I, Maia P, Evangelista P, Vilaça P, Soares S, et al. 2010. OptFlux: an open-
source software platform for in silico metabolic engineering. BMC Syst. Biol. 4:45
Roggo C, Coronado E, Moreno-Forero SK, Harshman K, Weber J, Van der Meer JR.
2013. Genome-wide transposon insertion scanning of environmental survival
functions in the polycyclic aromatic hydrocarbon degrading bacterium
Sphingomonas wittichii RW1. Environ. Microbiol. 15(10):2681–95
Salama NR, Shepherd B, Falkow S. 2004. Global transposon mutagenesis and
essential gene analysis of Helicobacter pylori. J. Bacteriol. 186(23):7926–35
Sarmiento F, Mrazek J, Whitman WB. 2013. Genome-scale analysis of gene function
in the hydrogenotrophic methanogenic archaeon Methanococcus maripaludis.
Proc. Natl. Acad. Sci. U. S. A.
Sassetti CM, Boyd DH, Rubin EJ. 2003. Genes required for mycobacterial growth
defined by high density mutagenesis. Mol. Microbiol. 48(1):77–84
Schuster P. 1996. How does complexity arise in evolution: Nature’s recipe for
mastering scarcity, abundance, and unpredictability. Complexity. 2(1):22–30
Seringhaus M, Paccanaro A, Borneman A, Snyder M, Gerstein M. 2006. Predicting
essential genes in fungal genomes. Genome Res. 16(9):1126–35
Settembre EC, Dorrestein PC, Park J-H, Augustine AM, Begley TP, Ealick SE. 2003.
Structural and mechanistic studies on ThiO, a glycine oxidase essential for
thiamin biosynthesis in Bacillus subtilis. Biochemistry. 42(10):2971–81
CHAPTER 4 Essential and Ancestral Metabolic Functions in Prokaryotes | 177
Skouloubris S, Thiberge JM, Labigne A, De Reuse H. 1998. The Helicobacter pylori
UreI protein is not involved in urease activity but is essential for bacterial
survival in vivo. Infect. Immun. 66(9):4517–21
Suzuki R, Shimodaira H. 2006. Pvclust: An R package for assessing the uncertainty in
hierarchical clustering. Bioinformatics. 22:1540–42
Thanassi JA, Hartman-Neumann SL, Dougherty TJ, Dougherty BA, Pucci MJ. 2002.
Identification of 113 conserved essential genes using a high-throughput gene
disruption system in Streptococcus pneumoniae. Nucleic Acids Res.
30(14):3152–62
Thiele I, Hyduke DR, Steeb B, Fankam G, Allen DK, et al. 2011. A community effort
towards a knowledge-base and mathematical model of the human pathogen
Salmonella Typhimurium LT2. BMC Syst. Biol. 5(1):8
Thiele I, Vo TD, Price ND, Palsson BØ. 2005. Expanded Metabolic Reconstruction of
Helicobacter pylori ( i IT341 GSM / GPR ): an In Silico Genome-Scale
Characterization of Single- and Double-Deletion Mutants. J. Bacteriol.
187(16):5818–30
Veeranagouda Y, Husain F, Tenorio EL, Wexler HM. 2014. Identification of genes
required for the survival of B. fragilis using massive parallel sequencing of a
saturated transposon mutant library. BMC Genomics. 15(1):429
Woese CR, Olsen GJ, Ibba M, Soll D. 2000. Aminoacyl-tRNA Synthetases, the Genetic
Code, and the Evolutionary Process. Microbiol. Mol. Biol. Rev. 64(1):202–36
Wu J, Ohta N, Zhao J-L, Newton A. 1999. A novel bacterial tyrosine kinase essential
for cell division and differentiation. Proc. Natl. Acad. Sci. 96(23):13068–73
Xu P, Ge X, Chen L, Wang X, Dou Y, et al. 2011. Genome-wide essential gene
identification in Streptococcus sanguinis. Sci. Rep. 1:1–9
Zhang X, Peng C, Zhang G, Gao F. 2015. Comparative analysis of essential genes in
prokaryotic genomic islands. Sci. Rep. 5:12561
Zhang Y, Thiele I, Weekes D, Li Z, Jaroszewski L, et al. 2009. Three-dimensional
structural view of the central metabolic network of Thermotoga maritima.
Science 325(5947):1544–49
Zhang YJ, Ioerger TR, Huttenhower C, Long JE, Sassetti CM, et al. 2012. Global
assessment of genomic regions required for growth in Mycobacterium
tuberculosis. PLoS Pathog. 8(9):e1002946

179
CHAPTER 5
Generating Minimal Metabolic Networks with a
Curated Universe of Prokaryotic Reactions
[…] from so simple a beginning endless forms most beautiful and most wonderful have
been, and are being, evolved.
—CHARLES DARWIN, On the Origin of Species (1859)
In this chapter the outputs from previous chapters are integrated in a strategy
to generate minimal metabolic networks for growth based on highly curated data.
The universally essential cofactors from Chapter 3 were integrated in a universal
prokaryotic biomass equation. Together with a highly curated universe of
prokaryotic metabolic reactions updated from Chapter 4, this biomass composition
was used to predict minimal metabolic networks viable in different growth media: a
complete medium simulated with all 496 exchanges in the universe of reactions and
abstractions of LB medium and M9 minimal medium with 67 and 20 components
respectively. One thousand variations of the minimal networks were generated for
each medium. The minimal networks obtained were analyzed regarding size,
metabolic subsystems, maximum growth rates, ATP and cofactor requirements. The
results are consistent with the sizes of minimal metabolic networks in previous
works, indicating to a core metabolism of ~250 metabolic reactions. The results
indicate no significant differences when using the complete or the LB medium.
Transport, cofactor and prosthetic groups, nucleotide and energy metabolism make
up the core of the networks in rich media. A significant increase in the number of
reactions relating to cofactor and prosthetic groups and nucleotide and amino acid
metabolism occurs when generating the networks in the minimal medium. Several
outliers in growth capacity and ATP and NAD(P) requirements indicate future
routes of investigation. The method and data provided may allow for further
exploratory studies of prokaryotic metabolism.
180 | CHAPTER 5 Generating Minimal Metabolic Networks
The information presented in this Chapter is being prepared for submission to a
peer reviewed journal:
Xavier JC, Machado D, Patil KR, Rocha I. Prediction of Minimal Metabolic Networks
With Diverse Manually Curated Data (in preparation).
CHAPTER 5 Generating Minimal Metabolic Networks | 181
5.1 Introduction
How many molecular components are necessary to sustain a living cell? This
bold and yet nebulous question has been gathering attention from the scientific
community especially since the advent of genomics, with a great focus on essential
genes that are part of hypothetical minimal genomes (Gil et al. 2002, 2004;
Hutchison et al. 1999, Itaya 1995, Mushegian & Koonin 1996). The motivations are
several and overlap partially, in the fundamental drive to uncover the core essential
requirements of life, the investigation of the origin of life, the contemporary search
for new antibiotic targets and the industrial requirements of highly modular but at
the same time versatile chassis cells (see Chapter 2 of this thesis).
The use of metabolic networks as an alternative approach to the question of
cellular minimization has been substantially less explored than pure genomics,
albeit it conveys a whole additional layer of information – that of functionality – and
it can be explored quantitatively with graph theory and other mathematical tools
(Gabaldón et al. 2007, Ravasz et al. 2002). Manually curated genome-scale metabolic
models (GSMs) are the prime representative of this approach and have been widely
used in predicting essential and non-essential reactions and metabolites of specific
species (Imieliński et al. 2005, Kim et al. 2010, 2011; Suthers et al. 2009) but also in
comparative studies to find core metabolic functions (Alam et al. 2011, Almaas et al.
2005). Moreover, these models can serve as databases of curated reactions to
predict smaller, viable minimal metabolic networks.
Escherichia coli, as a model organism, has been extensively used as a starting
point to achieve small viable networks with different approaches. An early model
was employed in a pioneer study with mixed-integer linear programming (MILP)
that concluded on minimal networks with 224 reactions on a glucose-only medium
and 122 in a rich medium (Burgard et al. 2001). The GSM iJR904 (Reed et al. 2003)
was used in a topological method of random addition and deletion of reactions to
achieve minimal reaction sets having between 140 and 232 reactions (Jiang et al.
2010). Another study used the same metabolic model, variable biomass
compositions and experimental assays to infer minimal metabolic networks for
three different substrates (Taymaz-Nikerel et al. 2010). The authors removed all
182 | CHAPTER 5 Generating Minimal Metabolic Networks
unnecessary transport reactions, dead-end reactions and zero-flux reactions and
reached a minimal model for glucose with 276 reactions. Other authors used E. coli
and a graph-theory approach combined with mixed integer linear programming to
achieve a minimal network; however, the model used represented only the central
carbon metabolism of this organism (Jonnalagadda & Srinivasan 2014). Central
carbon metabolism was also the starting point of a study intending to predict a
minimal E. coli cell for efficient production of ethanol that reduced the functional
space of the network from over 15,000 pathway possibilities to 6 pathway options
that support cell function (Trinh et al. 2008). Another quite ingenious study
predicted the reductive evolution of the endosymbiotic bacteria Buchnera aphidicola
and Wigglesworthia glossinidia with 80% accuracy by simulating the successive loss
of genes of E.coli’s network (Pál et al. 2006).
In the present work, a large universe of prokaryotic metabolic reactions with
re-annotated and curated metabolic subsystems was built and used in a subsequent
generation of minimal metabolic networks. Three different environmental
conditions were employed together with a manually curated biomass function
representing the universal metabolic requirements of prokaryotes common to both
bacteria and archaea. The main goal was to find core metabolic functions for
minimal prokaryotic metabolisms, expanding previous work with E. coli only, as
here the universe of reactions encompasses 15 GSMs representing several different
phyla of bacteria and one archaea. The aim was to analyze the differences between
networks generated in different growth conditions, in terms of size, growth capacity,
cofactor requirements, but also functional composition concerning the most
represented metabolic subsystems.
5.2 Methods
5.2.1 Construction of a Universe of Diverse Prokaryotic
Metabolic Reactions
CHAPTER 5 Generating Minimal Metabolic Networks | 183
A curated universe of metabolic reactions encompassing a wide variety of
prokaryotic phyla was built by integrating all models used in Chapter 4 (see Chapter
4, Table 4.1), with the exception of the model of Escherichia coli K12, iAF1260 (Feist
et al. 2007), instead of which the newer and more complete model, iJO1366 (Orth et
al. 2011) was used. All models were imported in the original SBML format and
tested for feasibility in biomass production using default flux bounds. When the
same reaction was present in one model as reversible and irreversible in another,
the reversible version was kept. When different reactions were present in different
models with the same ids, new unique ids were created. All exchange reaction fluxes
were set to a limit of -10 mmol gDW-1h-1 for the lower bound, representing the
consumption of the metabolite, and 1000 mmol gDW-1h-1 for the upper bound
representing the excretion. All other reaction bounds were cleaned, except for
irreversible reactions where the lower bound was fixed to zero. The universe
obtained in this manner was tested for feasibility with all biomass reactions from
the individual models. All blocked reactions and dead-end metabolites were
computed using FVA and removed from the universe. All artificial metabolite sinks
were also removed (with the exception of R_DM_4CRSOL, R_DM_5DRIB,
R_DM_AMOB, R_DM_MTHTHF).
5.2.2 Growth Media
Three growth media compositions were tested for the design of minimal
metabolic networks, all simulated at an exchange rate of 10 mmol gdW-1h-1 for
each component. The first composition was an extremely rich medium where all the
496 exchanges available in the 15 models were allowed to carry flux in the
simulations, representing a theoretical situation where there are no nutritional
limitations, that is also an approximation of a possible ancestral rich prebiotic
environment (Martin et al. 2008). The second condition was a common undefined
laboratory rich growth medium, Lysogeny Broth (LB) (Bertani 1951), for which an
abstraction was obtained from the ModelSEED culture media repository
(ArgonneLBMedium, (Henry et al. 2010)); the trace elements molybdenum and
nickel were added (as required by the imposed composition of the core biomass)
resulting in a total of 67 medium components. The third and final growth medium
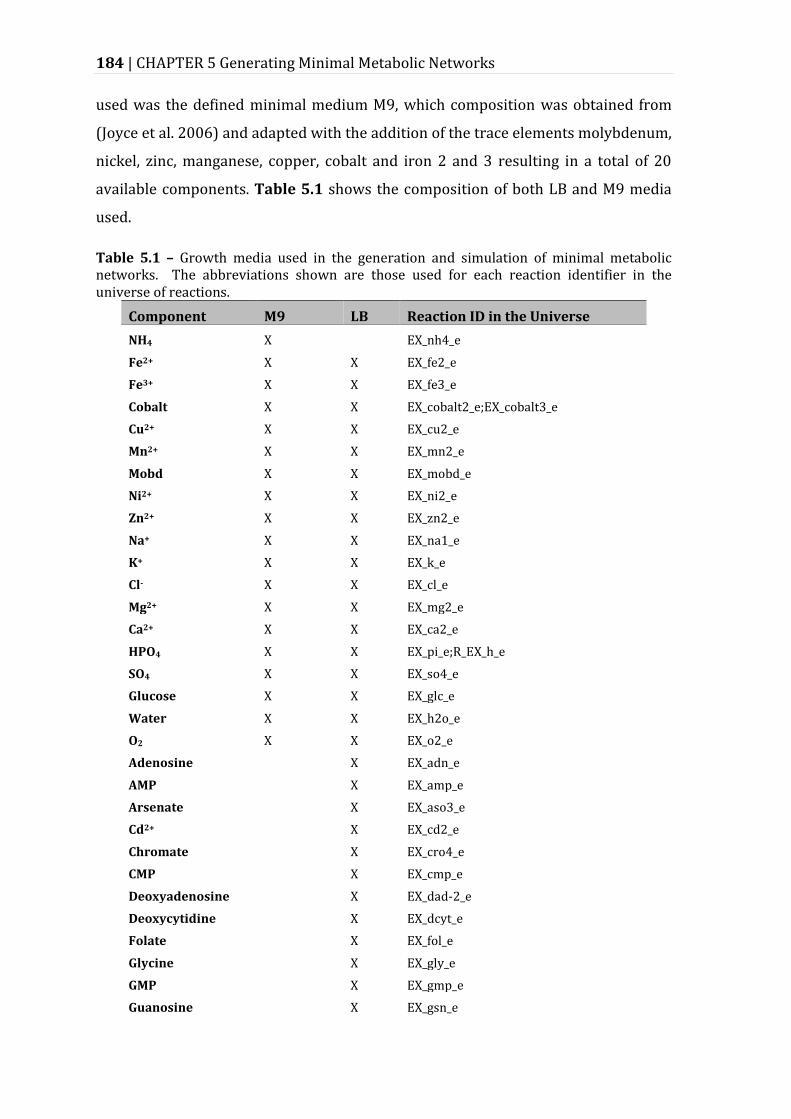
184 | CHAPTER 5 Generating Minimal Metabolic Networks
used was the defined minimal medium M9, which composition was obtained from
(Joyce et al. 2006) and adapted with the addition of the trace elements molybdenum,
nickel, zinc, manganese, copper, cobalt and iron 2 and 3 resulting in a total of 20
available components. Table 5.1 shows the composition of both LB and M9 media
used.
Table 5.1 – Growth media used in the generation and simulation of minimal metabolic networks. The abbreviations shown are those used for each reaction identifier in the universe of reactions.
Component M9 LB Reaction ID in the Universe
NH4 X EX_nh4_e
Fe2+ X X EX_fe2_e
Fe3+ X X EX_fe3_e
Cobalt X X EX_cobalt2_e;EX_cobalt3_e
Cu2+ X X EX_cu2_e
Mn2+ X X EX_mn2_e
Mobd X X EX_mobd_e
Ni2+ X X EX_ni2_e
Zn2+ X X EX_zn2_e
Na+ X X EX_na1_e
K+ X X EX_k_e
Cl- X X EX_cl_e
Mg2+ X X EX_mg2_e
Ca2+ X X EX_ca2_e
HPO4 X X EX_pi_e;R_EX_h_e
SO4 X X EX_so4_e
Glucose X X EX_glc_e
Water X X EX_h2o_e
O2 X X EX_o2_e
Adenosine X EX_adn_e
AMP X EX_amp_e
Arsenate X EX_aso3_e
Cd2+ X EX_cd2_e
Chromate X EX_cro4_e
CMP X EX_cmp_e
Deoxyadenosine X EX_dad-2_e
Deoxycytidine X EX_dcyt_e
Folate X EX_fol_e
Glycine X EX_gly_e
GMP X EX_gmp_e
Guanosine X EX_gsn_e
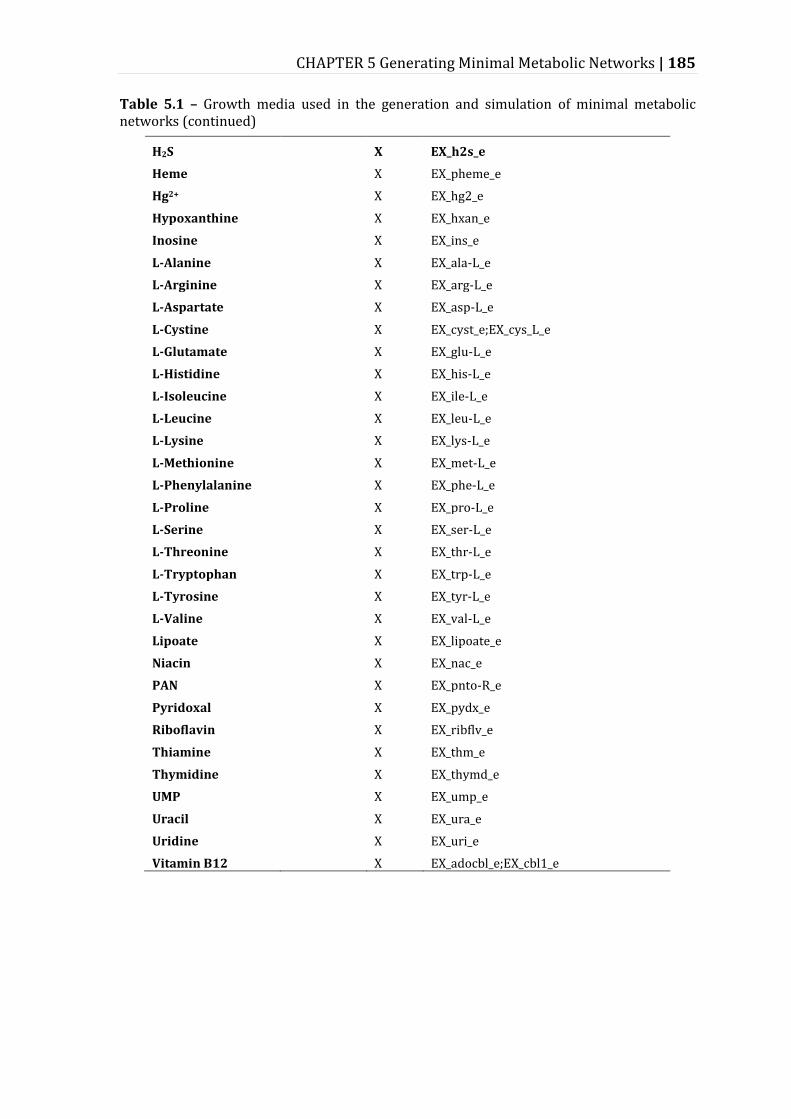
CHAPTER 5 Generating Minimal Metabolic Networks | 185
Table 5.1 – Growth media used in the generation and simulation of minimal metabolic networks (continued)
H2S X EX_h2s_e
Heme X EX_pheme_e
Hg2+ X EX_hg2_e
Hypoxanthine X EX_hxan_e
Inosine X EX_ins_e
L-Alanine X EX_ala-L_e
L-Arginine X EX_arg-L_e
L-Aspartate X EX_asp-L_e
L-Cystine X EX_cyst_e;EX_cys_L_e
L-Glutamate X EX_glu-L_e
L-Histidine X EX_his-L_e
L-Isoleucine X EX_ile-L_e
L-Leucine X EX_leu-L_e
L-Lysine X EX_lys-L_e
L-Methionine X EX_met-L_e
L-Phenylalanine X EX_phe-L_e
L-Proline X EX_pro-L_e
L-Serine X EX_ser-L_e
L-Threonine X EX_thr-L_e
L-Tryptophan X EX_trp-L_e
L-Tyrosine X EX_tyr-L_e
L-Valine X EX_val-L_e
Lipoate X EX_lipoate_e
Niacin X EX_nac_e
PAN X EX_pnto-R_e
Pyridoxal X EX_pydx_e
Riboflavin X EX_ribflv_e
Thiamine X EX_thm_e
Thymidine X EX_thymd_e
UMP X EX_ump_e
Uracil X EX_ura_e
Uridine X EX_uri_e
Vitamin B12 X EX_adocbl_e;EX_cbl1_e
186 | CHAPTER 5 Generating Minimal Metabolic Networks
5.2.3 Universal Biomass
The universal biomass equation used in all simulations was adapted from the
core biomass equation of E. coli’s model iJO1366,
R_Ec_biomass_iJO1366_core_53p95M (Orth et al. 2011). A manual curation was done
based on Chapter 3 of this thesis and other publications (Chopra et al. 2010,
Mendum et al. 2011, Orth & Palsson 2012, Paliy & Gunasekera 2007). All amino
acids and building blocks of RNA and DNA were maintained, for which all
coefficients were kept as in the original equation (Table 5.2). Alterations were done
to the pool of organic cofactors: bis-molybdopterin guanine dinucleotide, biotin, 2-
Octaprenyl-6-hydroxyphenol, Undecaprenyl-diphosphate, tetrahydrofolate,
protoheme and siroheme were removed and riboflavin was substituted directly by
the active cofactor flavin mononucleotide. The cytoplasmic lipid species were
substituted by a common precursor to both archaea and bacteria, dihydroxyacetone
phosphate (Koga 2011), for which a new coefficient was recalculated from the
stoichiometry of the substituted lipids. Murein and lipopolysaccharide were
removed for those are not universal components in the biomass of prokaryotes, the
latter being specific of Gram negative bacteria and the former of bacteria with cell
wall (exceptions in prokaryotes being Mollicutes and archaea).
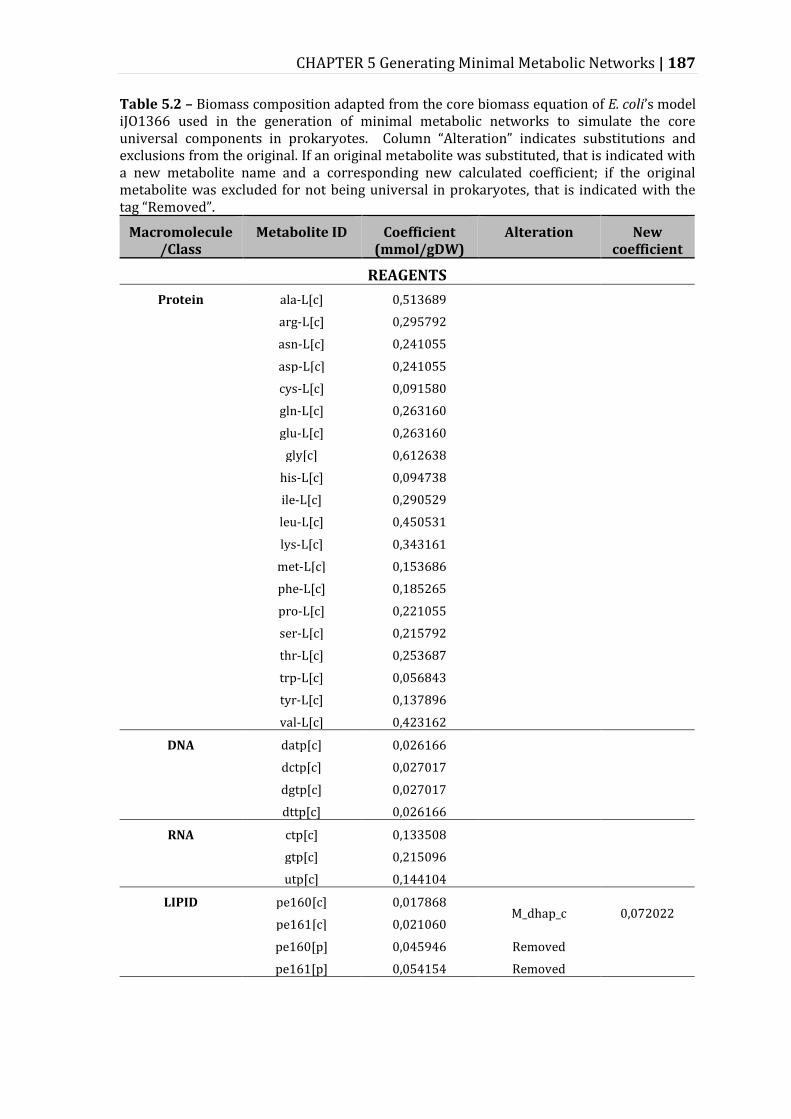
CHAPTER 5 Generating Minimal Metabolic Networks | 187
Table 5.2 – Biomass composition adapted from the core biomass equation of E. coli’s model iJO1366 used in the generation of minimal metabolic networks to simulate the core universal components in prokaryotes. Column “Alteration” indicates substitutions and exclusions from the original. If an original metabolite was substituted, that is indicated with a new metabolite name and a corresponding new calculated coefficient; if the original metabolite was excluded for not being universal in prokaryotes, that is indicated with the tag “Removed”.
Macromolecule/Class
Metabolite ID Coefficient (mmol/gDW)
Alteration New coefficient
REAGENTS
Protein ala-L[c] 0,513689
arg-L[c] 0,295792
asn-L[c] 0,241055
asp-L[c] 0,241055
cys-L[c] 0,091580
gln-L[c] 0,263160
glu-L[c] 0,263160
gly[c] 0,612638
his-L[c] 0,094738
ile-L[c] 0,290529
leu-L[c] 0,450531
lys-L[c] 0,343161
met-L[c] 0,153686
phe-L[c] 0,185265
pro-L[c] 0,221055
ser-L[c] 0,215792
thr-L[c] 0,253687
trp-L[c] 0,056843
tyr-L[c] 0,137896
val-L[c] 0,423162
DNA datp[c] 0,026166
dctp[c] 0,027017
dgtp[c] 0,027017
dttp[c] 0,026166
RNA ctp[c] 0,133508
gtp[c] 0,215096
utp[c] 0,144104
LIPID pe160[c] 0,017868 M_dhap_c 0,072022
pe161[c] 0,021060
pe160[p] 0,045946 Removed
pe161[p] 0,054154 Removed
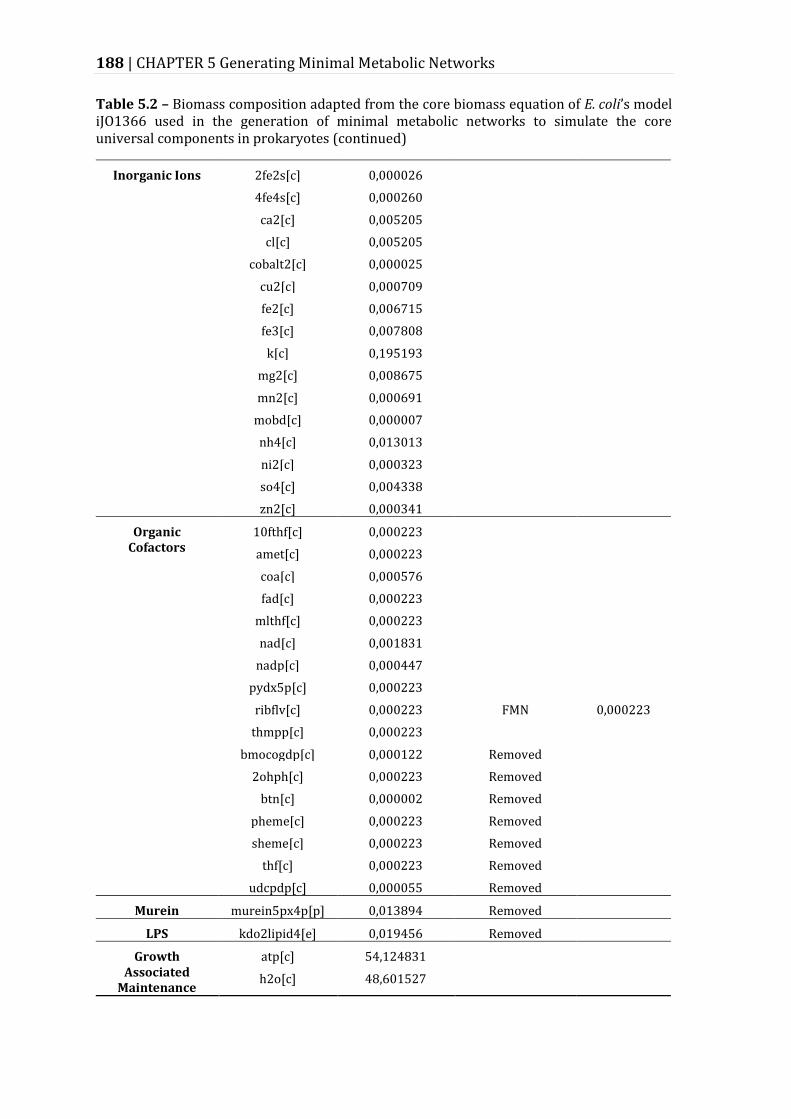
188 | CHAPTER 5 Generating Minimal Metabolic Networks
Table 5.2 – Biomass composition adapted from the core biomass equation of E. coli’s model iJO1366 used in the generation of minimal metabolic networks to simulate the core universal components in prokaryotes (continued)
Inorganic Ions 2fe2s[c] 0,000026
4fe4s[c] 0,000260
ca2[c] 0,005205
cl[c] 0,005205
cobalt2[c] 0,000025
cu2[c] 0,000709
fe2[c] 0,006715
fe3[c] 0,007808
k[c] 0,195193
mg2[c] 0,008675
mn2[c] 0,000691
mobd[c] 0,000007
nh4[c] 0,013013
ni2[c] 0,000323
so4[c] 0,004338
zn2[c] 0,000341
Organic Cofactors
10fthf[c] 0,000223
amet[c] 0,000223
coa[c] 0,000576
fad[c] 0,000223
mlthf[c] 0,000223
nad[c] 0,001831
nadp[c] 0,000447
pydx5p[c] 0,000223
ribflv[c] 0,000223 FMN 0,000223
thmpp[c] 0,000223
bmocogdp[c] 0,000122 Removed
2ohph[c] 0,000223 Removed
btn[c] 0,000002 Removed
pheme[c] 0,000223 Removed
sheme[c] 0,000223 Removed
thf[c] 0,000223 Removed
udcpdp[c] 0,000055 Removed
Murein murein5px4p[p] 0,013894 Removed
LPS kdo2lipid4[e] 0,019456 Removed
Growth Associated
Maintenance
atp[c] 54,124831
h2o[c] 48,601527
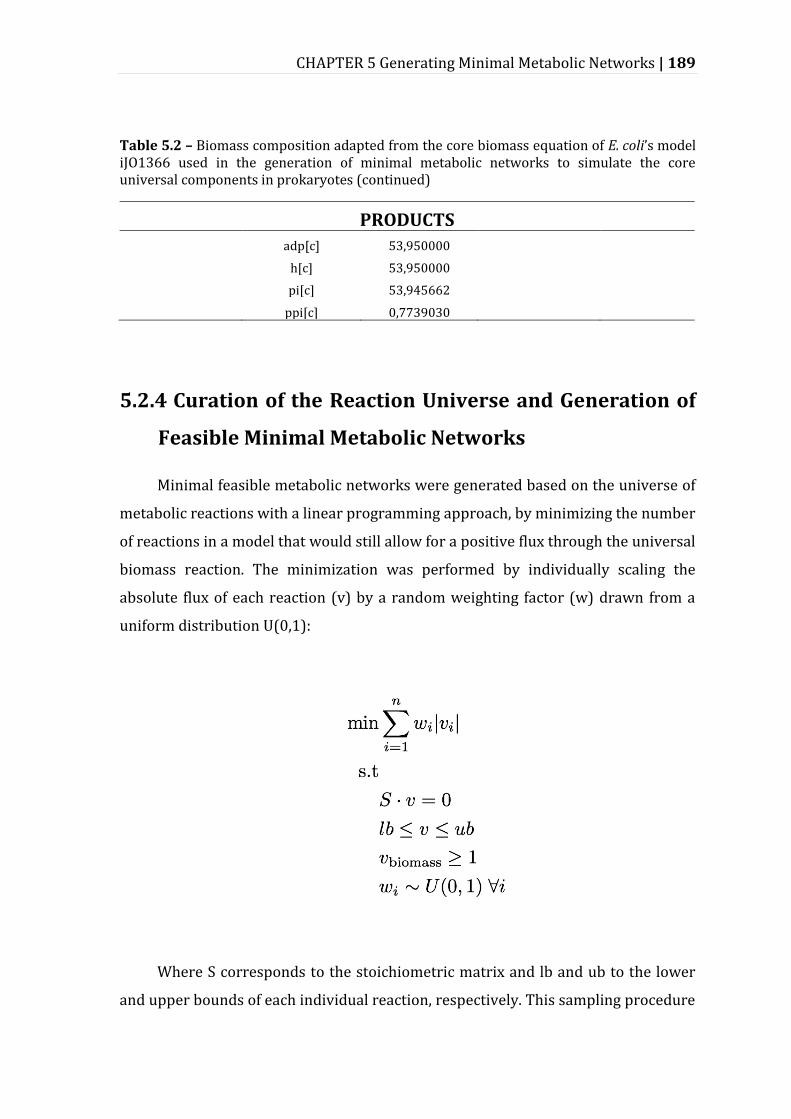
CHAPTER 5 Generating Minimal Metabolic Networks | 189
Table 5.2 – Biomass composition adapted from the core biomass equation of E. coli’s model iJO1366 used in the generation of minimal metabolic networks to simulate the core universal components in prokaryotes (continued)
PRODUCTS
adp[c] 53,950000
h[c] 53,950000
pi[c] 53,945662
ppi[c] 0,7739030
5.2.4 Curation of the Reaction Universe and Generation of
Feasible Minimal Metabolic Networks
Minimal feasible metabolic networks were generated based on the universe of
metabolic reactions with a linear programming approach, by minimizing the number
of reactions in a model that would still allow for a positive flux through the universal
biomass reaction. The minimization was performed by individually scaling the
absolute flux of each reaction (v) by a random weighting factor (w) drawn from a
uniform distribution U(0,1):
Where S corresponds to the stoichiometric matrix and lb and ub to the lower
and upper bounds of each individual reaction, respectively. This sampling procedure
190 | CHAPTER 5 Generating Minimal Metabolic Networks
generates an ensemble of alternative flux distributions with minimal support
vectors.
One thousand alternative feasible minimal networks were initially built for the
theoretical complete medium and the 47 reactions present in more than 70% of the
networks were manually checked. Six reactions were excluded based on this
analysis. Those were two reactions involved in the direct transport of Coenzyme A in
M. tuberculosis, since this cofactor has no known direct transport and there is
evidence of essentiality of its biosynthetic enzymes in M. tuberculosis (Chapter 3 of
this thesis; Kumar et al. 2007; Ambady et al. 2012). The other four reactions
excluded were reactions of transport of AMP, GMP, dTMP and CMP that are
symports with hydrogen, originally present only in the B. subtilis network. After this
curation, a new set of 1000 feasible minimal metabolic networks was generated for
each environmental condition: complete, LB and M9 medium.
5.2.5 Model Analysis
Each set of 1000 minimal metabolic networks was analyzed for the frequency
of individual reactions in the networks, network size, maximum biomass flux, ATP,
NADH and NADPH requirements. Simulations were performed with parsimonious
Flux Balance Analysis (pFBA) implemented with Gurobi optimizer 6.0. Cofactor
requirements were calculated as the turnover of each metabolite normalized by the
maximum biomass flux.
CHAPTER 5 Generating Minimal Metabolic Networks | 191
5.3 Results and Discussion
5.3.1 Universe of Prokaryotic Metabolic Reactions
The curated universe resulting of the integration of the 15 prokaryotic
genome-scale metabolic models is composed of 5768 metabolic reactions. These
were checked against each model metadata on metabolic subsystems and pathways,
resulting on 233 subsystem names that were manually integrated into a final set of
23 highly curated metabolic subsystems (Figure 5.1). A small set of 512 reactions -
8.88% of the universe - is composed of fictional reactions used to allow for
simulations (exchanges, sinks and lumping reactions). However, 496 of those are
exchange reactions that represent the individual components of the media available
for simulations. A large portion of the universe (25.7%) corresponds to transport
reactions in the different models, which allow for the passage of components
between the external compartment loaded by exchange reactions and the cytoplasm
or periplasm. These reactions include different alternatives for the transport with
different symports, antiports and energetic requirements. Given that six models
used in the construction of the universe include a periplasm compartment and the
other nine do not, several of the transport reactions are duplicated and the real size
of this subsystem in the universe is smaller. Following in size is the subsystem of
Lipid metabolism with 13.3% of the reactions in the universe and Cofactor and
Prosthetic Group metabolism with 10.1%. The universe is rich and diverse with 381
reactions allowing for the metabolism of alternative carbon sources and 131
reactions related with secondary metabolism and other miscellaneous functions.
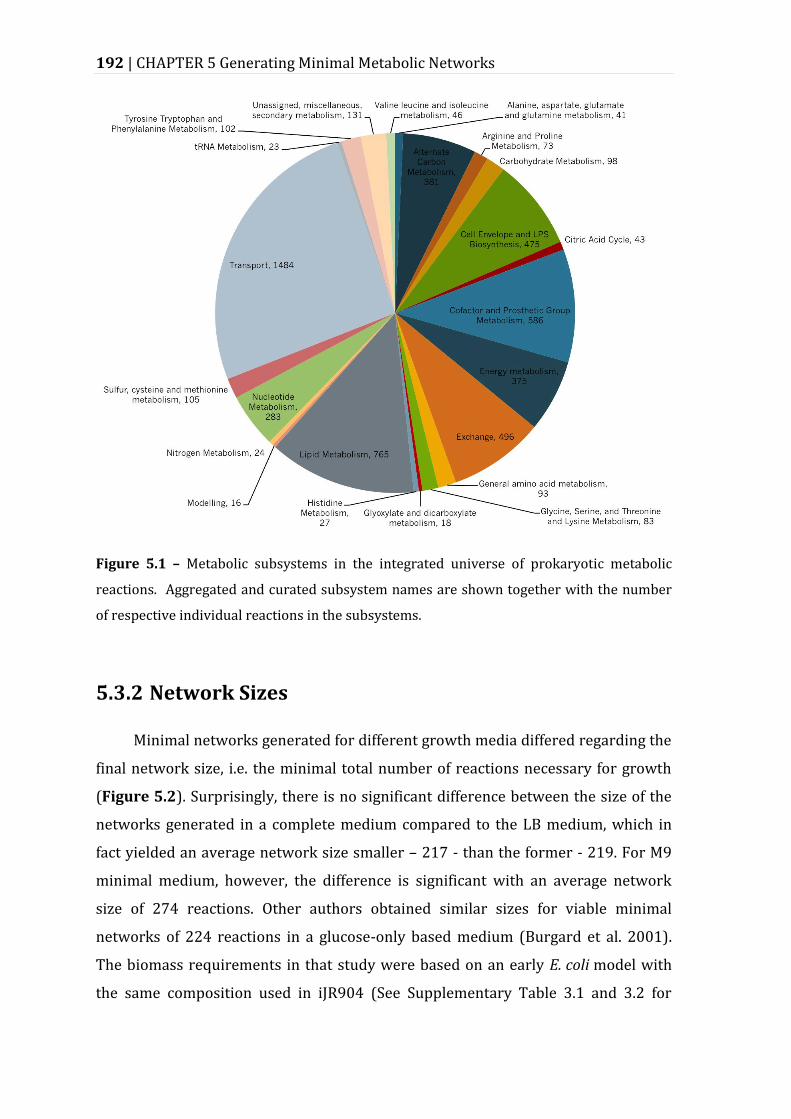
192 | CHAPTER 5 Generating Minimal Metabolic Networks
Figure 5.1 – Metabolic subsystems in the integrated universe of prokaryotic metabolic
reactions. Aggregated and curated subsystem names are shown together with the number
of respective individual reactions in the subsystems.
5.3.2 Network Sizes
Minimal networks generated for different growth media differed regarding the
final network size, i.e. the minimal total number of reactions necessary for growth
(Figure 5.2). Surprisingly, there is no significant difference between the size of the
networks generated in a complete medium compared to the LB medium, which in
fact yielded an average network size smaller – 217 - than the former - 219. For M9
minimal medium, however, the difference is significant with an average network
size of 274 reactions. Other authors obtained similar sizes for viable minimal
networks of 224 reactions in a glucose-only based medium (Burgard et al. 2001).
The biomass requirements in that study were based on an early E. coli model with
the same composition used in iJR904 (See Supplementary Table 3.1 and 3.2 for
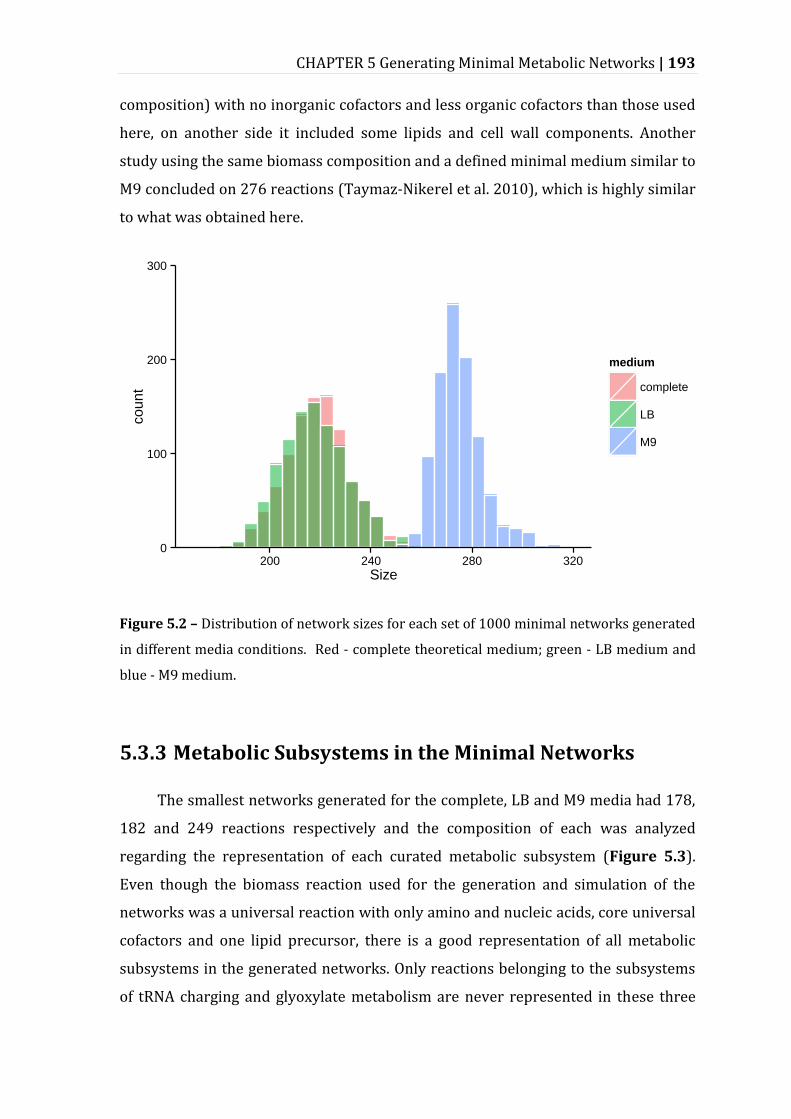
CHAPTER 5 Generating Minimal Metabolic Networks | 193
composition) with no inorganic cofactors and less organic cofactors than those used
here, on another side it included some lipids and cell wall components. Another
study using the same biomass composition and a defined minimal medium similar to
M9 concluded on 276 reactions (Taymaz-Nikerel et al. 2010), which is highly similar
to what was obtained here.
Figure 5.2 – Distribution of network sizes for each set of 1000 minimal networks generated
in different media conditions. Red - complete theoretical medium; green - LB medium and
blue - M9 medium.
5.3.3 Metabolic Subsystems in the Minimal Networks
The smallest networks generated for the complete, LB and M9 media had 178,
182 and 249 reactions respectively and the composition of each was analyzed
regarding the representation of each curated metabolic subsystem (Figure 5.3).
Even though the biomass reaction used for the generation and simulation of the
networks was a universal reaction with only amino and nucleic acids, core universal
cofactors and one lipid precursor, there is a good representation of all metabolic
subsystems in the generated networks. Only reactions belonging to the subsystems
of tRNA charging and glyoxylate metabolism are never represented in these three
0
100
200
300
200 240 280 320
Size
cou
nt
medium
complete
LB
M9
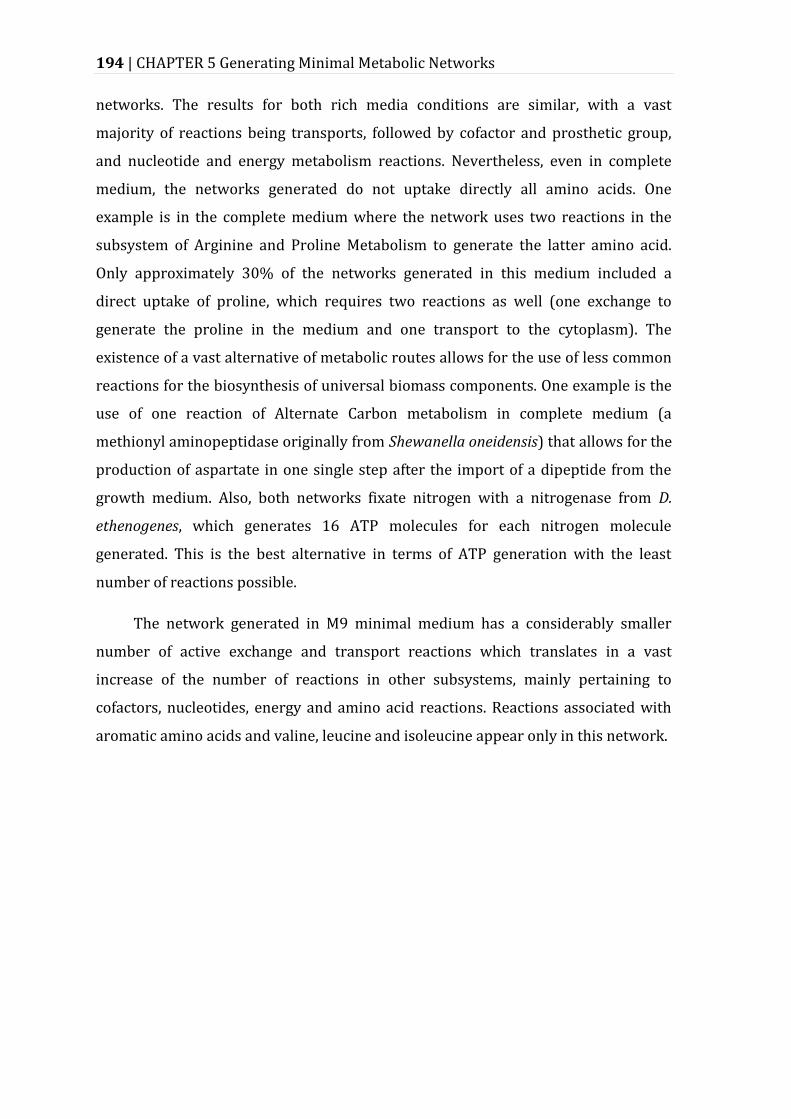
194 | CHAPTER 5 Generating Minimal Metabolic Networks
networks. The results for both rich media conditions are similar, with a vast
majority of reactions being transports, followed by cofactor and prosthetic group,
and nucleotide and energy metabolism reactions. Nevertheless, even in complete
medium, the networks generated do not uptake directly all amino acids. One
example is in the complete medium where the network uses two reactions in the
subsystem of Arginine and Proline Metabolism to generate the latter amino acid.
Only approximately 30% of the networks generated in this medium included a
direct uptake of proline, which requires two reactions as well (one exchange to
generate the proline in the medium and one transport to the cytoplasm). The
existence of a vast alternative of metabolic routes allows for the use of less common
reactions for the biosynthesis of universal biomass components. One example is the
use of one reaction of Alternate Carbon metabolism in complete medium (a
methionyl aminopeptidase originally from Shewanella oneidensis) that allows for the
production of aspartate in one single step after the import of a dipeptide from the
growth medium. Also, both networks fixate nitrogen with a nitrogenase from D.
ethenogenes, which generates 16 ATP molecules for each nitrogen molecule
generated. This is the best alternative in terms of ATP generation with the least
number of reactions possible.
The network generated in M9 minimal medium has a considerably smaller
number of active exchange and transport reactions which translates in a vast
increase of the number of reactions in other subsystems, mainly pertaining to
cofactors, nucleotides, energy and amino acid reactions. Reactions associated with
aromatic amino acids and valine, leucine and isoleucine appear only in this network.
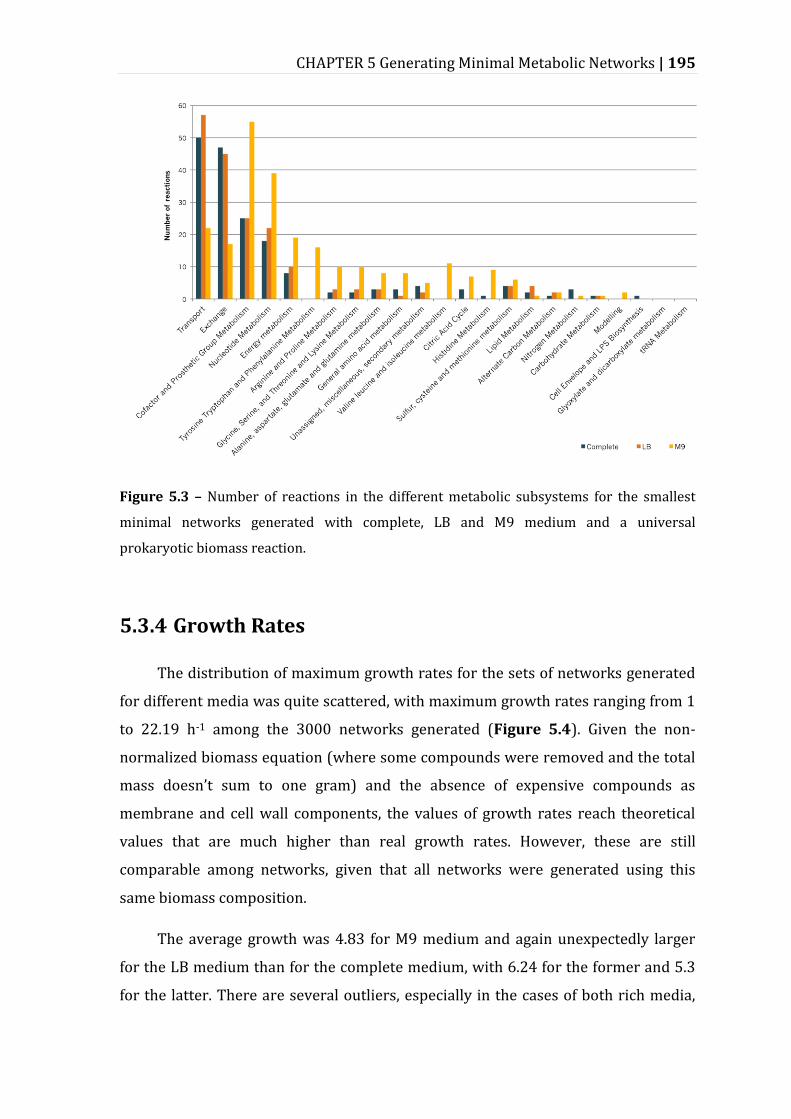
CHAPTER 5 Generating Minimal Metabolic Networks | 195
Figure 5.3 – Number of reactions in the different metabolic subsystems for the smallest
minimal networks generated with complete, LB and M9 medium and a universal
prokaryotic biomass reaction.
5.3.4 Growth Rates
The distribution of maximum growth rates for the sets of networks generated
for different media was quite scattered, with maximum growth rates ranging from 1
to 22.19 h-1 among the 3000 networks generated (Figure 5.4). Given the non-
normalized biomass equation (where some compounds were removed and the total
mass doesn’t sum to one gram) and the absence of expensive compounds as
membrane and cell wall components, the values of growth rates reach theoretical
values that are much higher than real growth rates. However, these are still
comparable among networks, given that all networks were generated using this
same biomass composition.
The average growth was 4.83 for M9 medium and again unexpectedly larger
for the LB medium than for the complete medium, with 6.24 for the former and 5.3
for the latter. There are several outliers, especially in the cases of both rich media,
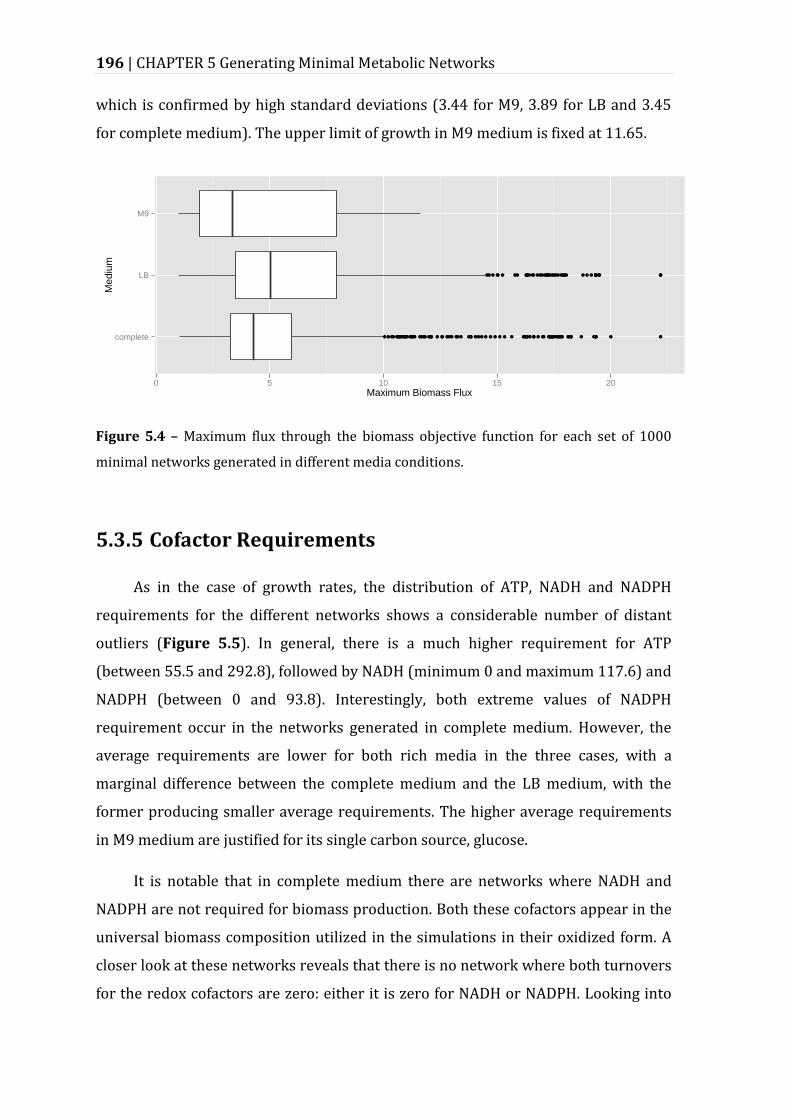
196 | CHAPTER 5 Generating Minimal Metabolic Networks
which is confirmed by high standard deviations (3.44 for M9, 3.89 for LB and 3.45
for complete medium). The upper limit of growth in M9 medium is fixed at 11.65.
Figure 5.4 – Maximum flux through the biomass objective function for each set of 1000
minimal networks generated in different media conditions.
5.3.5 Cofactor Requirements
As in the case of growth rates, the distribution of ATP, NADH and NADPH
requirements for the different networks shows a considerable number of distant
outliers (Figure 5.5). In general, there is a much higher requirement for ATP
(between 55.5 and 292.8), followed by NADH (minimum 0 and maximum 117.6) and
NADPH (between 0 and 93.8). Interestingly, both extreme values of NADPH
requirement occur in the networks generated in complete medium. However, the
average requirements are lower for both rich media in the three cases, with a
marginal difference between the complete medium and the LB medium, with the
former producing smaller average requirements. The higher average requirements
in M9 medium are justified for its single carbon source, glucose.
It is notable that in complete medium there are networks where NADH and
NADPH are not required for biomass production. Both these cofactors appear in the
universal biomass composition utilized in the simulations in their oxidized form. A
closer look at these networks reveals that there is no network where both turnovers
for the redox cofactors are zero: either it is zero for NADH or NADPH. Looking into
complete
LB
M9
0 5 10 15 20
Maximum Biomass Flux
Med
ium
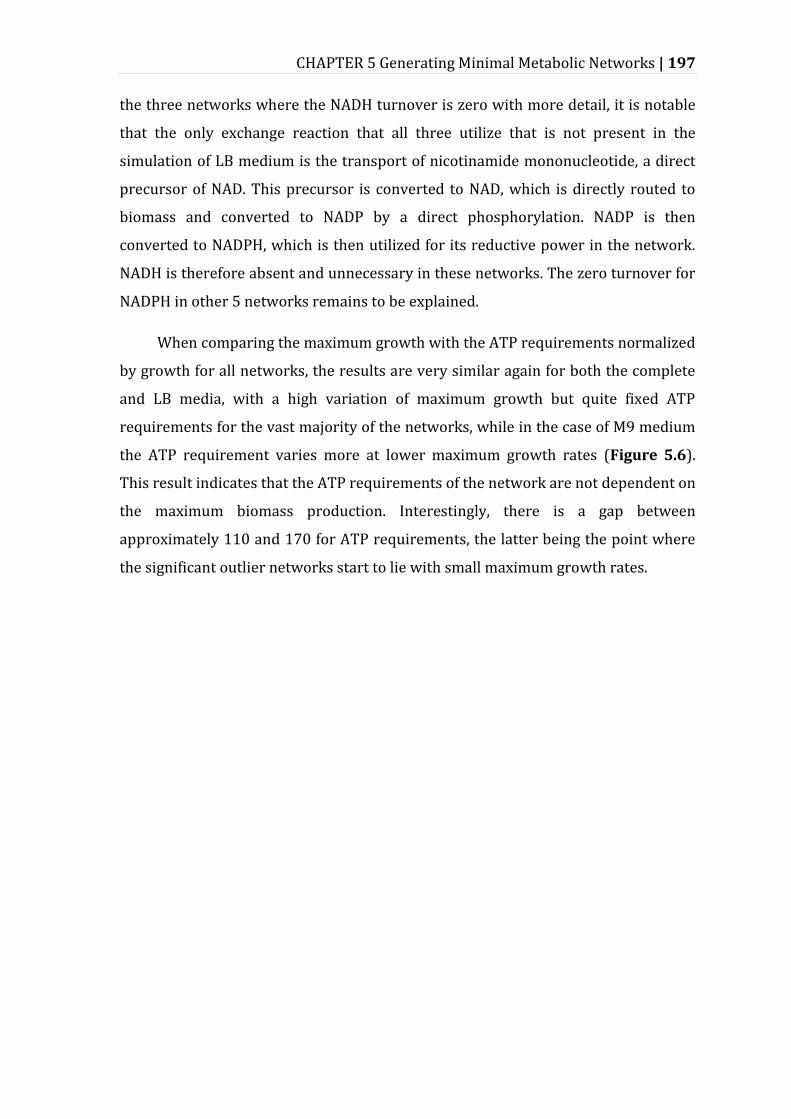
CHAPTER 5 Generating Minimal Metabolic Networks | 197
the three networks where the NADH turnover is zero with more detail, it is notable
that the only exchange reaction that all three utilize that is not present in the
simulation of LB medium is the transport of nicotinamide mononucleotide, a direct
precursor of NAD. This precursor is converted to NAD, which is directly routed to
biomass and converted to NADP by a direct phosphorylation. NADP is then
converted to NADPH, which is then utilized for its reductive power in the network.
NADH is therefore absent and unnecessary in these networks. The zero turnover for
NADPH in other 5 networks remains to be explained.
When comparing the maximum growth with the ATP requirements normalized
by growth for all networks, the results are very similar again for both the complete
and LB media, with a high variation of maximum growth but quite fixed ATP
requirements for the vast majority of the networks, while in the case of M9 medium
the ATP requirement varies more at lower maximum growth rates (Figure 5.6).
This result indicates that the ATP requirements of the network are not dependent on
the maximum biomass production. Interestingly, there is a gap between
approximately 110 and 170 for ATP requirements, the latter being the point where
the significant outlier networks start to lie with small maximum growth rates.
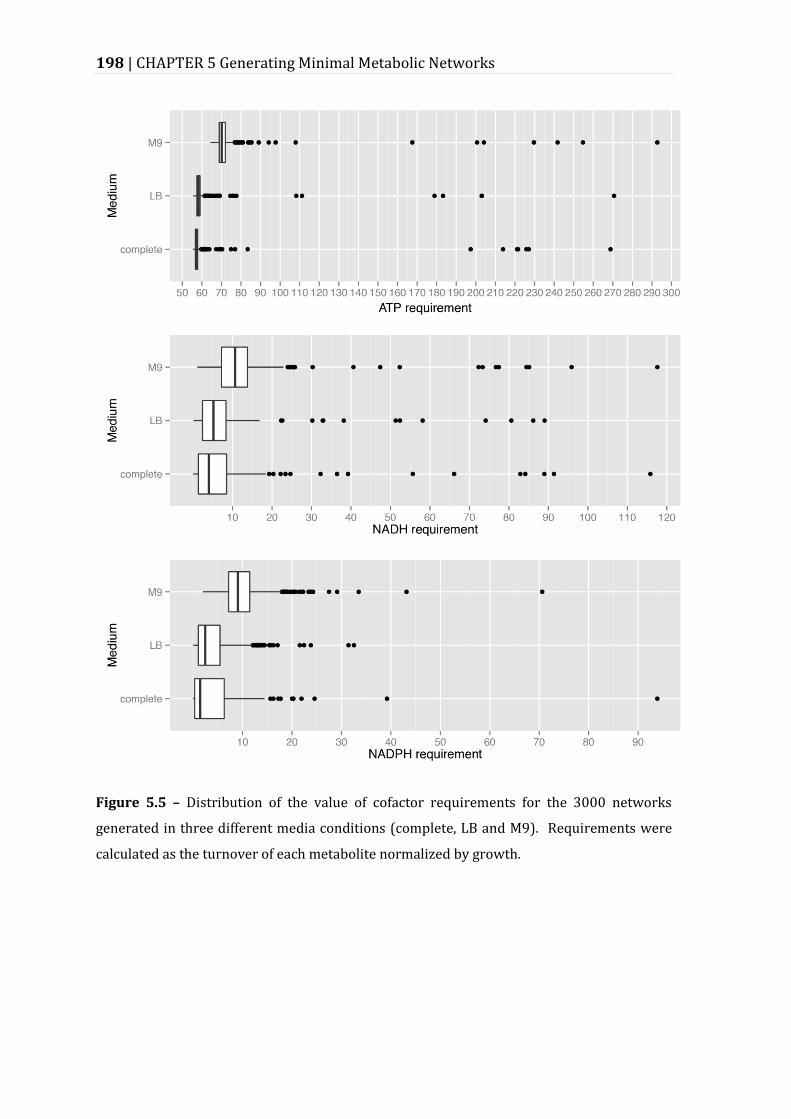
198 | CHAPTER 5 Generating Minimal Metabolic Networks
Figure 5.5 – Distribution of the value of cofactor requirements for the 3000 networks
generated in three different media conditions (complete, LB and M9). Requirements were
calculated as the turnover of each metabolite normalized by growth.
CHAPTER 5 Generating Minimal Metabolic Networks | 199
Figure 5.6 – Maximum growth and ATP requirements for the 3000 minimal networks
generated for the three growth media conditions. Red – complete medium, green – LB
medium and blue – M9 medium.
5.4 Conclusions
The present work derived a universe of 5768 curated metabolic reactions
depicting a wide variety of metabolic capacities of different bacteria and archaea in
an unprecedented manner, based on which, using a curated biomass reaction
representative of universal compounds in prokaryotes, 1000 minimal and viable
metabolic networks were generated for different growth media conditions. Average
network sizes of 219, 217 and 274 reactions for a complete medium, an abstraction
of LB medium and M9 minimal medium, respectively are highly similar to the results
obtained by other authors that concluded on viable networks of 224 (Burgard et al.
2001) and 276 (Taymaz-Nikerel et al. 2010) reactions and to other theoretical
minimal genome sizes with 206 (Gabaldón et al. 2007, Gil et al. 2004) and 256 genes
(Mushegian & Koonin 1996).
The minimal networks obtained for the abstraction of LB media with 67
components are surprisingly similar in size, metabolic content, cofactor
requirements and maximum growth rates to those obtained with a complete media
with 496 available components. This result indicates that the optimal conditions for
growth, among those tested, are represented in the LB medium and further
additional components are unnecessary to generate the smaller networks. It is
however evident from the results with M9 medium that the removal of some specific
0
5
10
15
20
50 60 70 80 90 100 110 120 130 140 150 160 170 180 190 200 210 220 230 240 250 260 270 280 290 300
ATP requirement
Ma
xim
um
Gro
wth Medium
complete
LB
M9
200 | CHAPTER 5 Generating Minimal Metabolic Networks
components will affect drastically the sizes and capabilities of the minimal networks.
A closer look at the composition of LB medium compared with M9 and the
subsystem distribution in the different networks indicates that the components that
are highly essential for generating smaller networks are amino acids and vitamins
and cofactors. An iterative study with individual randomly generated growth media
might shed a light on individual nutrients which have the highest impact on the
generated networks.
The universe of reactions and the minimal network generation method
provided here allow for future estimation of minimal networks with different
biomass requirements and growth media. Interesting studies may include the
minimal network requirements for the production of different compounds of
interest and growth on different metabolic modes, including autotrophy,
methanogenesis and nitrogen fixation. Although the universal biomass equation
used here excluded lipids and cell wall components, necessary reactions for their
production are available in the universe.
It is admitted in the current status of prokaryotic systems biology that there is
probably no single minimal genome or metabolic network, due to the extremely high
redundancy of prokaryotic networks (Koonin 2003)(see Chapter 2). This work not
only confirms this postulate by generating thousands of alternative hypothetical
minimal metabolic networks for a complete medium, but also allows for future
explorations of the trade-off between network capacities and the environment. It is
expected that this exploration can lead to a better understanding of the core
metabolism of prokaryotes, but also in the design of viable, optimized and modular
chassis cells for different biotechnological processes.
References
Alam MT, Medema MH, Takano E, Breitling R. 2011. Comparative genome-scale
metabolic modeling of actinomycetes: the topology of essential core
metabolism. FEBS Lett. 585(14):2389–94
CHAPTER 5 Generating Minimal Metabolic Networks | 201
Almaas E, Oltvai ZN, Barabási A-L. 2005. The activity reaction core and plasticity of
metabolic networks. PLoS Comput. Biol. 1(7):e68
Ambady A, Awasthy D, Yadav R, Basuthkar S, Seshadri K, Sharma U. 2012. Evaluation
of CoA biosynthesis proteins of Mycobacterium tuberculosis as potential drug
targets. Tuberculosis (Edinb). 92(6):521–28
Bertani G. 1951. Studies on lysogenesis. I. The mode of phage liberation by lysogenic
Escherichia coli. J. Bacteriol. 62:293–300
Burgard a P, Vaidyaraman S, Maranas CD. 2001. Minimal reaction sets for
Escherichia coli metabolism under different growth requirements and uptake
environments. Biotechnol. Prog. 17(5):791–97
Chopra A, Lineweaver CH, Brocks JJ, Ireland TR. 2010.
Palaeoecophylostoichiometrics: Searching for the Elemental Composition of the
Last Universal Common Ancestor. Aust. Sp. Sci. Conf. Ser. 9th Conf. Proc., pp. 91–
104.
Feist AM, Henry CS, Reed JL, Krummenacker M, Joyce AR, et al. 2007. A genome-scale
metabolic reconstruction for Escherichia coli K-12 MG1655 that accounts for
1260 ORFs and thermodynamic information. Mol. Syst. Biol. 3(121):121
Gabaldón T, Peretó J, Montero F, Gil R, Latorre A, Moya A. 2007. Structural analyses
of a hypothetical minimal metabolism. Philos. Trans. R. Soc. Lond. B. Biol. Sci.
362(1486):1751–62
Gil R, Sabater-Muñoz B, Latorre A, Silva FJ, Moya A. 2002. Extreme genome reduction
in Buchnera spp.: toward the minimal genome needed for symbiotic life. Proc.
Natl. Acad. Sci. U. S. A. 99(7):4454–58
Gil R, Silva FJ, Peretó J, Moya A. 2004. Determination of the core of a minimal
bacterial gene set. Microbiol. Mol. Biol. Rev. 68(3):518–37
Henry CS, DeJongh M, Best A a, Frybarger PM, Linsay B, Stevens RL. 2010. High-
throughput generation, optimization and analysis of genome-scale metabolic
models. Nat. Biotechnol. 28:977–82
Hutchison CA, Peterson SN, Gill SR, Cline RT, White O, et al. 1999. Global transposon
mutagenesis and a minimal Mycoplasma genome. Science. 286(5447):2165–69
Imieliński M, Belta C, Halász A, Rubin H. 2005. Investigating metabolite essentiality
through genome-scale analysis of Escherichia coli production capabilities.
Bioinformatics. 21(9):2008–16
Itaya M. 1995. An estimation of minimal genome size required for life. FEBS Lett.
362(3):257–60
Jiang D, Zhou S, Liu H, Chen Y-PP. 2010. Inferring minimal feasible metabolic
202 | CHAPTER 5 Generating Minimal Metabolic Networks
networks of Escherichia coli. Appl. Biochem. Biotechnol. 160(1):222–31
Jonnalagadda S, Srinivasan R. 2014. An efficient graph theory based method to
identify every minimal reaction set in a metabolic network. BMC Syst. Biol. 8:28
Joyce AR, Reed JL, White A, Edwards R, Osterman A, et al. 2006. Experimental and
computational assessment of conditionally essential genes in Escherichia coli. J.
Bacteriol. 188(23):8259–71
Kim HU, Kim SY, Jeong H, Kim TY, Kim JJ, et al. 2011. Integrative genome-scale
metabolic analysis of Vibrio vulnificus for drug targeting and discovery. Mol.
Syst. Biol. 7(460):460
Kim HU, Kim TY, Lee SY. 2010. Genome-scale metabolic network analysis and drug
targeting of multi-drug resistant pathogen Acinetobacter baumannii AYE. Mol.
Biosyst. 6:339–48
Koga Y. 2011. Early evolution of membrane lipids: how did the lipid divide occur? J.
Mol. Evol. 72(3):274–82
Koonin E V. 2003. Comparative genomics, minimal gene-sets and the last universal
common ancestor. Nat. Rev. Microbiol. 1(2):127–36
Kumar P, Chhibber M, Surolia A. 2007. How pantothenol intervenes in Coenzyme-A
biosynthesis of Mycobacterium tuberculosis. Biochem. Biophys. Res. Commun.
361(4):903–9
Martin W, Baross J, Kelley D, Russell MJ. 2008. Hydrothermal vents and the origin of
life. Nat. Rev. Microbiol. 6(11):805–14
Mendum T a, Newcombe J, Mannan A a, Kierzek AM, McFadden J. 2011. Interrogation
of global mutagenesis data with a genome scale model of Neisseria meningitidis
to assess gene fitness in vitro and in sera. Genome Biol. 12(12):R127
Mushegian A, Koonin E V. 1996. A minimal gene set for cellular life derived by
comparison of complete bacterial genomes. Proc. Natl. Acad. Sci. U. S. A.
93(19):10268–73
Orth JD, Conrad TM, Na J, Lerman J a, Nam H, et al. 2011. A comprehensive genome-
scale reconstruction of Escherichia coli metabolism—2011. Mol. Syst. Biol.
7(535):1–9
Orth JD, Palsson BØ. 2012. Gap-filling analysis of the iJO1366 Escherichia coli
metabolic network reconstruction for discovery of metabolic functions. BMC
Syst. Biol. 6(1):30
Pál C, Papp B, Lercher MJ, Csermely P, Oliver SG, Hurst LD. 2006. Chance and
necessity in the evolution of minimal metabolic networks. Nature
440(7084):667–70
CHAPTER 5 Generating Minimal Metabolic Networks | 203
Paliy O, Gunasekera TS. 2007. Growth of E. coli BL21 in minimal media with different
gluconeogenic carbon sources and salt contents. Appl. Microbiol. Biotechnol.
73:1169–72
Ravasz E, Somera a L, Mongru D a, Oltvai ZN, Barabási a L. 2002. Hierarchical
organization of modularity in metabolic networks. Science 297(5586):1551–55
Reed JL, Vo TD, Schilling CH, Palsson BØ. 2003. An expanded genome-scale model of
Escherichia coli K-12 (iJR904 GSM/GPR). Genome Biol. 4(9):R54
Suthers PF, Zomorrodi A, Maranas CD. 2009. Genome-scale gene/reaction
essentiality and synthetic lethality analysis. Mol. Syst. Biol. 5(301):301
Taymaz-Nikerel H, Borujeni AE, Verheijen PJT, Heijnen JJ, van Gulik WM. 2010.
Genome-derived minimal metabolic models for Escherichia coli MG1655 with
estimated in vivo respiratory ATP stoichiometry. Biotechnol. Bioeng.
107(2):369–81
Trinh CT, Unrean P, Srienc F. 2008. Minimal Escherichia coli cell for the most
efficient production of ethanol from hexoses and pentoses. Appl. Environ.
Microbiol. 74(12):3634–43

205
CHAPTER 6
Conclusions and Perspectives on Future
Research
We can only see a short distance ahead, but we can see plenty there that needs to be done.
— Alan Turing, Computing Machinery and Intelligence (1950)
In this final chapter the reader can find the main conclusions achieved by the
research described in this thesis. Some selected perspectives on future research
according to these conclusions and to the hypotheses raised throughout this work
are also advanced.

206 | CHAPTER 6 Conclusions and Perspectives on Future Research
CHAPTER 6 Conclusions and Perspectives on Future Research | 207
6.1 General Conclusions
The research conducted in this thesis had the overall objective of studying
minimal and essential metabolic functions within prokaryotic species. In order to
achieve this general objective, specific research aims were defined in Chapter 1 of
this thesis. Answering to those aims, the main conclusions obtained in each chapter
are discussed here.
In Chapter 2, an extensive review of the broad field of minimal and simpler
cells was performed. Several entangled concepts were uncovered and systematically
described (Table 2.1) together with the traditional and emergent systems biology
approaches to the field (Figure. 2.1). It became evident that the traditional analytical,
top-down approach has been prominent with large-scale identifications of essential
genes with a special emphasis on minimal genomes (Table 2.3). A fundamental
difference between two main goals in this field was exposed: the minimization of
cellular components that has been prominent in the traditional analytical approach
to the field, versus the simplification of cellular complexity that is more patent in
integrative approaches that include mathematical modeling.
In Chapter 3, the biomass objective function used in the modeling of metabolic
networks at genome-scale was analyzed. The main goal was to identify core
components that are essential for all prokaryotic species for further prediction of
core metabolic reactions in minimal networks. This goal was achieved and
surpassed with several side conclusions. A comparison of all the available
prokaryotic genome-scale metabolic models (GSMs) at the time of this work
(Supplementary Table 3.1) revealed a large heterogeneity in the definition and
formalization of the biomass composition in these models (Figure 3.1). With
sequential simulations of 5 GSMs with interchangeable biomass equations, it was
shown that the biomass composition can impact drastically the predictions of
essential reactions for growth (Figure 3.2). A set of universally essential organic
cofactors for prokaryotic species was uncovered (Figure 3.3 and Figure 3.5):
nicotinamide adenine dinucleotide (NAD), nicotinamide adenine dinucleotide
phosphate (NADP), S-adenosyl-methionine (SAM), flavin adenine dinucleotide
(FAD), pyridoxal 5-phosphate (P5P), coenzyme A (COA), thiamin diphosphate
208 | CHAPTER 6 Conclusions and Perspectives on Future Research
(THMPP) and flavin mononucleotide (FMN) plus one class of cofactors, which was
identified as one-carbon carriers (tetrahydrofolates for bacteria and
tetrahydromethanopterins for most archaea). A set of highly essential but not
universal cofactors was also identified and discussed. The universal cofactors
allowed for a revision of essentiality predictions in Klebsiella pneumoniae and the
prediction of a biosynthetic pathway absent in the model of M. tuberculosis that was
later found to have been confirmed experimentally by Dick and co-authors (Dick et
al. 2010). Moreover, in the same study, the authors validated the prediction done in
this work of the essentiality of vitamin B6 for the survival of M. tuberculosis.
In Chapter 4 fifteen comparable and validated GSMs were simulated in rich
media abstractions, predicting the metabolic subsystems of cofactor and prosthetic
group biosynthesis, cell envelope biosynthesis and membrane lipid and
glycerophospholipid metabolism to have the highest number of essential reactions
in all models (Fig. 4.2). The reactions that were essential in more models belonged
to the metabolic subsystems of aromatic amino acid metabolism, nucleotide salvage
pathway, cell envelope biosynthesis and cofactor and prosthetic group metabolism
(Fig. 4.4). These results were confirmed by experimental data, except for tRNA
metabolism, which was shown to be highly essential experimentally but that is not
included in most models (Figure 4.6). Three reactions essential in 14 out of the 15
metabolic models related with the shikimate pathway and annotated in the aromatic
amino-acid metabolism were shown to be essential for the biosynthesis of folates,
and therefore require a re-annotation. More specifically, the essentiality of
chorismate synthase in models but not in the experimental data led to the
hypothesis that a transporter for chorismate or another metabolite further down in
the biosynthesis of folates from chorismate is missing in the metabolic models. This
hypothesis was confirmed in the literature, with the experimental rescuing of a
mutant for chorismate synthase in minimal medium with p-aminobenzoic acid (Lee
et al. 2013). Still in this chapter, the results of essentiality were compared at a large-
scale with results of ancestry inferred from a BLAST of E. coli genes against a
manually-selected set of species representing all the phyla with one fully-sequenced
quality genome in the tree of life. The comparison revealed that genes with a
positive sum of essentiality (more datasets showing essential that non-essential) are
CHAPTER 6 Conclusions and Perspectives on Future Research | 209
much scarcer than those with a negative sum. However, it is much more likely that
those are highly conserved, and therefore, likely to be ancestral. In the case of genes
with a negative sum of essentiality, there is no tendency for high or low
conservation. A functional mapping to metabolic subsystems revealed that the genes
more likely to be ancestral are those in the tRNA charging subsystem, Transport and
Oxidative Phosphorylation.
Finally, in Chapter 5, the results obtained in the previous chapters were
integrated by devising of a method to generate minimal metabolic networks based
on highly curated data. A large universe of 5768 prokaryotic reactions was built and
re-annotated employing the 15 GSMs used in Chapter 4 (with the exception of the
model of E. coli for which a newer version was used (Orth et al. 2011)) and using a
new set of 23 curated metabolic subsystems (Figure 5.1), revealing a wide variety of
metabolic capacities of different bacteria and archaea in an unprecedented manner.
Three media conditions were tested (one theoretical complete medium and two
abstracted real media compositions, LB and M9) with a newly curated core biomass
reaction that included the universal cofactors identified in Chapter 3. The sizes of
minimal metabolic networks were consistent with previous works, indicating a core
metabolism of ~250 reactions (Burgard et al. 2001, Gabaldón et al. 2007, Gil et al.
2004, Mushegian & Koonin 1996, Taymaz-Nikerel et al. 2010). No significant change
was found between the characteristics of the networks when using the complete or
LB medium, which leads to the conclusion that LB represents the optimal conditions
for growth among those tested. This can be an indication of a minimal set of
components for the design of economically viable rich media for chassis cells.
Reactions involved in transport, cofactor and prosthetic groups metabolism,
nucleotide metabolism and energy metabolism make up the core of the networks in
rich media. The minimal medium generates networks with several more reactions
relating to the biosynthesis of cofactors and prosthetic groups, nucleotides and
amino acids. With the generation of thousands of alternative minimal networks for
all growth conditions, the results of this work confirm the postulate of high
metabolic redundancy in prokaryotic metabolism.
210 | CHAPTER 6 Conclusions and Perspectives on Future Research
6.2 Perspectives on Future Research
In any scientific project, several new questions arise in each step of the
process, and the current thesis is no exception. A long-winded discussion could
follow on new enquiries that were side results of this work. A selected set of topics
requiring further exploration is presented below.
The standardization of manually curated genome-scale metabolic
models. Several efforts have been taken by the community towards this goal
(Bernard et al. 2014, Henry et al. 2010, King et al. 2015, Kumar et al. 2012,
Sauls & Buescher 2014). However, the current state of the art still portrays a
heterogeneity that is large and impairs the comparison and integration of
results of GSMs. Very recently, an interesting and important debate on the
adoption of standards by the community was raised (Chindelevitch et al. 2015,
Ebrahim et al. 2015). It is expected that these standards will indeed be applied,
which would greatly facilitate the emergence of a comparative systems biology
based on GSMs that can be used to answer fundamental biological questions as
the ones that were the main goals of this thesis.
The use of more complete models and the inference of not only minimal
networks but minimal virtual cells. Different models of minimal cells were
described in Chapter 2, section 2.5.5 that represent more than only the
metabolic functions of cells. It should be highlighted also the new ME models
published recently that account for metabolism and gene expression in
Thermotoga maritima and E. coli (Lerman et al. 2012, O’Brien et al. 2013).
Although these are still not representative of a large-diversity of prokaryotic
phyla and species, they reveal features of regulation that seem to be central
and essential to prokaryotes. It remains to be found which of these regulation
features are core features for life.
The study of ancestral metabolic networks. Here, the subject of ancestral
metabolism was very briefly touched upon. The definition of a highly curated
ancestral environment based on solid geochemical science could help
constrain a metabolic model to infer an ancestral metabolism with the
resources provided in this thesis.
CHAPTER 6 Conclusions and Perspectives on Future Research | 211
The further exploration of the generation of minimal metabolic
networks. In Chapter 5 of this thesis, an algorithm was devised to generate
minimal metabolic networks based on a highly curated and diverse universe of
metabolic reactions. It was interesting to see the usage of different reactions to
produce a core set of biomass components given different growth media,
which included for example reactions of the archaea in some cases, and
nitrogen fixation from D. ethenogenes in most of the networks generated in
rich media. However, much remained to be explored. More complete biomass
equations, for example including a full set of essential lipids should be
investigated. Special conditional cofactor requirements can be analyzed for
specific purposes with the resources provided in Chapter 3. Furthermore, a
panoply of possibilities are open related with the exploration of different
growth media and nutritional requirements for different biomass objectives.
Randomized large-scale simulations can be easily developed. Another direction
of investigation is the design of specific minimal networks for the production
of specific metabolites of interest coupled with maximum or fixed growth.
6.3 Supplementary Material
All the Supplementary Material mentioned in this thesis is freely available for
download in http://darwin.di.uminho.pt/jcxavier/ and within the CD containing the
digital version of this document.
References
Bernard T, Bridge A, Morgat A, Moretti S, Xenarios I, Pagni M. 2014. Reconciliation of
metabolites and biochemical reactions for metabolic networks. Brief. Bioinform.
15(1):123–35
Burgard a P, Vaidyaraman S, Maranas CD. 2001. Minimal reaction sets for
212 | CHAPTER 6 Conclusions and Perspectives on Future Research
Escherichia coli metabolism under different growth requirements and uptake
environments. Biotechnol. Prog. 17(5):791–97
Chindelevitch L, Trigg J, Regev A, Berger B. 2015. Reply to “Do genome-scale models
need exact solvers or clearer standards?”. Mol. Syst. Biol. 11(10):830
Dick T, Manjunatha U, Kappes B, Gengenbacher M. 2010. Vitamin B6 biosynthesis is
essential for survival and virulence of Mycobacterium tuberculosis. Mol.
Microbiol. 78(4):980–88
Ebrahim A, Almaas E, Bauer E, Bordbar A, Burgard AP, et al. 2015. Do genome-scale
models need exact solvers or clearer standards? Mol. Syst. Biol. 11(10):831–831
Gabaldón T, Peretó J, Montero F, Gil R, Latorre A, Moya A. 2007. Structural analyses
of a hypothetical minimal metabolism. Philos. Trans. R. Soc. Lond. B. Biol. Sci.
362(1486):1751–62
Gil R, Silva FJ, Peretó J, Moya A. 2004. Determination of the core of a minimal
bacterial gene set. Microbiol. Mol. Biol. Rev. 68(3):518–37
Henry CS, DeJongh M, Best A a, Frybarger PM, Linsay B, Stevens RL. 2010. High-
throughput generation, optimization and analysis of genome-scale metabolic
models. Nat. Biotechnol. 28(9):977–82
King ZA, Lu J, Dräger A, Miller P, Federowicz S, et al. 2015. BiGG Models: A platform
for integrating, standardizing and sharing genome-scale models. Nucleic Acids
Res. gkv1049 –
Kumar A, Suthers PF, Maranas CD. 2012. MetRxn: a knowledgebase of metabolites
and reactions spanning metabolic models and databases. BMC Bioinformatics.
13(1):6
Lee Y, Umeano A, Balskus EP. 2013. Rescuing auxotrophic microorganisms with
nonenzymatic chemistry. Angew. Chem. Int. Ed. Engl. 52(45):11800–803
Lerman JA, Hyduke DR, Latif H, Portnoy VA, Lewis NE, et al. 2012. In silico method
for modelling metabolism and gene product expression at genome scale. Nat.
Commun. 3:929
Mushegian A, Koonin E V. 1996. A minimal gene set for cellular life derived by
comparison of complete bacterial genomes. Proc. Natl. Acad. Sci. U. S. A.
93(19):10268–73
O’Brien EJ, Lerman JA, Chang RL, Hyduke DR, Palsson BØ. 2013. Genome-scale
models of metabolism and gene expression extend and refine growth
phenotype prediction. Mol. Syst. Biol. 9:693
Orth JD, Conrad TM, Na J, Lerman J a, Nam H, et al. 2011. A comprehensive genome-
scale reconstruction of Escherichia coli metabolism—2011. Mol. Syst. Biol.

CHAPTER 6 Conclusions and Perspectives on Future Research | 213
7(535):1–9
Sauls JT, Buescher JM. 2014. Assimilating genome-scale metabolic reconstructions
with modelBorgifier. Bioinformatics. 30(7):1036–38
Taymaz-Nikerel H, Borujeni AE, Verheijen PJT, Heijnen JJ, van Gulik WM. 2010.
Genome-derived minimal metabolic models for Escherichia coli MG1655 with
estimated in vivo respiratory ATP stoichiometry. Biotechnol. Bioeng.
107(2):369–81