f o t The impact of MAO-A in cellular senescence c a · replicativa. Para trabalhos futuros, é...
53
Pedro Emanuel de Magalh ães Sequeiros The Impact of MAO-A in Cellular Senescence 2014 DEPARTAMENTO DE CIÊNCIAS DA VIDA FACULDADE DE CIÊNCIAS E TECNOLOGIA UNIVERSIDADE DE COIMBRA The impact of MAO-A in cellular senescence Pedro Emanuel de Magalhães Sequeiros 2014
Transcript of f o t The impact of MAO-A in cellular senescence c a · replicativa. Para trabalhos futuros, é...

Pedr
o Em
anue
l de
Mag
alhã
es S
eque
iros
The
Impa
ct o
f MA
O-A
in C
ellu
lar S
enes
cenc
e
2014DEPARTAMENTO DE CIÊNCIAS DA VIDA
FACULDADE DE CIÊNCIAS E TECNOLOGIAUNIVERSIDADE DE COIMBRA
The impact of MAO-A in cellular senescence
Pedro Emanuel de Magalhães Sequeiros
2014


DEPARTAMENTO DE CIÊNCIAS DA VIDA
FACULDADE DE CIÊNCIAS E TECNOLOGIAUNIVERSIDADE DE COIMBRA
The impact of MAO-A in cellular
senescence
Pedro Emanuel de Magalhães Sequeiros
2014
Dissertação apresentada à Universidade de Coimbra para cumprimento dos requisitos necessários à obtenção do grau de Mestre em Biologia Celular e Molecular, realizada sob a orientação científica do Professor Doutor João Passos (Institute for Ageing and Health) e com supervisão académica do Professor Doutor Carlos Jorge Alves Miranda Bandeira Duarte(Centro de Neurociências e Biologia Celular)

The present work was developed at the
University, under the supervision of
Erasmus programme.
The present work was developed at the Institute for Ageing and Health,
under the supervision of João Passos and funded by European Union by the
Newcastle
European Union by the
1
Index:
List of Abbreviations….....................................................................................................................2
Abstract……....................................................................................................................................3
Resumo……………………....................................................................................................................4
Introduction...................................................................................................................................5
Aim of the study...........................................................................................................................24
Materials and Methods ..............................................................................................................25
Results ........................................................................................................................................32
Discussion....................................................................................................................................41
Future perspectives and Conclusion............................................................................................42
Acknowledgments .......................................................................................................................43
References………...……………………………………………………….............................................................44

2
List of abbreviations
53bp1 p53 Binding Protein1
CDK Cyclin-dependent kinase
DDR DNA damage response
DSB Double-strand break
ECM Extracellular matrix
Immuno-FISH Immuno Fluorescence In Situ Hybridisation
IR Irradiated
LTE Long term experiment
MRC5 Fetal human lung fibroblasts
NIR Non irradiated
OIS Oncogene-induced senescence
PBS Phosphate buffer saline
PD Population doubling
PFA Paraformaldehyde
ROS Reactive oxygen species
SAHF Senescence-associated heterochromatic foci
SASP Senescence-associated secretory phenotype
SA-β-Gal Senescence-associated β-galactosidase
SSB Single-strand break
TAF Telomere-associated foci
TIF Telomere induced foci

3
Abstract: Aging, Cellular senescence and the possible role of
MAO-A
Cellular senescence is a tumour suppressor and a contributor to age-related loss of
tissue function and so ultimately related to the aging process itself. It has been classically
characterised in vitro as the result of a DNA damage response (DDR) to uncapped telomeres.
Senescence can also be induced by several other mechanisms, including oncogene activation,
agents that alter chromatin structure or DNA damage, with oxidative stress being the prominent
damaging agent. However, recent studies have revealed that senescence is in fact an intricate
process, involving the sequential activation of multiple cellular processes, which have proven
necessary for the establishment and maintenance of the phenotype. One of such multiple
cellular process includes the generation of Reactive Oxygen Species (ROS) and their role in the
establishment of the senescent phenotype, however the complexity of signalling pathways
involved and its consequences for senescence in vitro and in vivo are far from being understood.
MAO-A is a mitochondrial enzyme which catalyses the oxidative deamination of
monoamines and generates hydrogen peroxide, aldehyde and ammonia. Recently, it has been
demonstrated that MAO-A contributes to heart failure during ageing, by generating increased
ROS and activating p53. Moreover, it has been demonstrated that MAO-A expression increases
in human fibroblasts undergoing replicative senescence.
For future work it becames clear, the need to study the impact of MAO-A in cellular
senescence, and so, determining the impact of MAO-A in cellular senescence, mitochondrial
dysfunction, ROS production and DNA damage response.
These studies will provide a better understanding of the complexixity of cellular
senescence and its signaling pathaways and its relation with the aging process.
Keywords: Cellular Senescence; Aging; MAO-A; p53; ROS; DDR
4
Resumo: Senescência celular e o possível envolvimento da
MAO-A
Senescência celular é um mecanismo de supressão tumoral e um contribuinte para a
perda de função tecidual, a medida que envelhecemos, relacionado assim com o processo a que
chamamos envelhecimento. Ele tem sido e caracterizado in vitro, como o resultado de uma
resposta a danos no ADN em virtude de telómeros não disfuncionais. Senescência também pode
ser induzida por vários outros mecanismos, incluindo a ativação de oncogenes, agentes que
alteram a estrutura da cromatina ou danos no DNA, com o stress oxidativo a ser o agente de
degradação mais importante.
No entanto, estudos recentes revelaram que a senescência é, de facto, um processo
complexo, que envolve a ativação sequencial de vários processos celulares, que têm se
mostrado necessários para o estabelecimento e manutenção do fenótipo. Um desses múltiplos
processos celulares, inclui a geração de espécies reativas de oxigênio (ROS) e seu papel no
estabelecimento do fenótipo senescente, no entanto, a complexidade das vias de sinalização
envolvidas e suas consequências para a senescência in vitro e in vivo estão longe de serem
compreendidos.
MAO-A é uma enzima mitocondrial que catalisa a desaminação oxidativa de
monoaminas e produz peróxido de hidrogénio, aldeído e amónia. Recentemente, tem sido
demonstrado que a MAO-A contribui para a insuficiência cardíaca durante o envelhecimento,
através da geração de ROS aumentada e activação de p53. Além disso, tem sido demonstrado
que a MAO-A expressão aumenta em fibroblastos humanos submetidos a senescência
replicativa.
Para trabalhos futuros, é claro, a necessidade de estudar o impacto da MAO-A na
senescência celular, e assim, determinar o impacto da MAO-A em senescência celular, disfunção
mitocondrial, produção de ROS e resposta a danos do DNA.
Estes estudos proporcionam um melhor entendimento da complexidade da senescência
celular e seus mapas sinalização e a sua relação com o processo de envelhecimento.
Palavras chave: Senescência celular MAO-A; p53; ROS; DDR: envelhecimento
5
Introduction
Ageing
Ageing can be defined by the progressive loss of physiological integrity, leading to
impaired function and increased vulnerability to death and is characterized by changes in
appearance, such as a gradual reduction in height and weight loss due to loss of muscle and
bone mass, a lower metabolic rate, declines in certain memory functions, declines in sexual
activity, a functional decline in senses, declines in kidney, pulmonary, and immune functions,
declines in exercise performance, and multiple endocrine changes. [1] [2]
The phenotype of human aging is one in which practically any system, tissue or organ
can fail [3]. Clearly, the incidence of a number of pathologies increases with age however the
intricate process of ageing cannot be viewed as a disease or pathology, or at least as the
standard way we look at it, because aging has to be viewed as an extremely, multifactorial,
complex processes which interact simultaneously and operate at many levels of functional
organization [4] .Unlike any other pathology or disease, as so eloquently Hayflick describes [5],
age changes:
1. Occur in every multicellular animal;
2. Across almost all species barriers;
3. Occur in all members of a species specially after reproductive maturation;
4. Occur in all animals in protected environments like animals removed from the wild and
protected by humans even when that species probably has not experienced aging for
thousands years;
5. Occur in virtually all animate and inanimate matter (if you see ageing as a process of
molecular change over time);
6. Have the same universal molecular etiology, that is, thermodynamic instability.
Unlike ageing, there is no disease or pathology that shares these six qualities. Ageing is
unique because no other pathology shares these six characteristics.
Ageing shows a broad phylogenetic distribution but is not universal, as some species
show no age-associated increase in mortality or decline in fertility being such examples the
freshwater Hydra and the immortal jellyfish Turritopsis nutricula [6], [7]
6
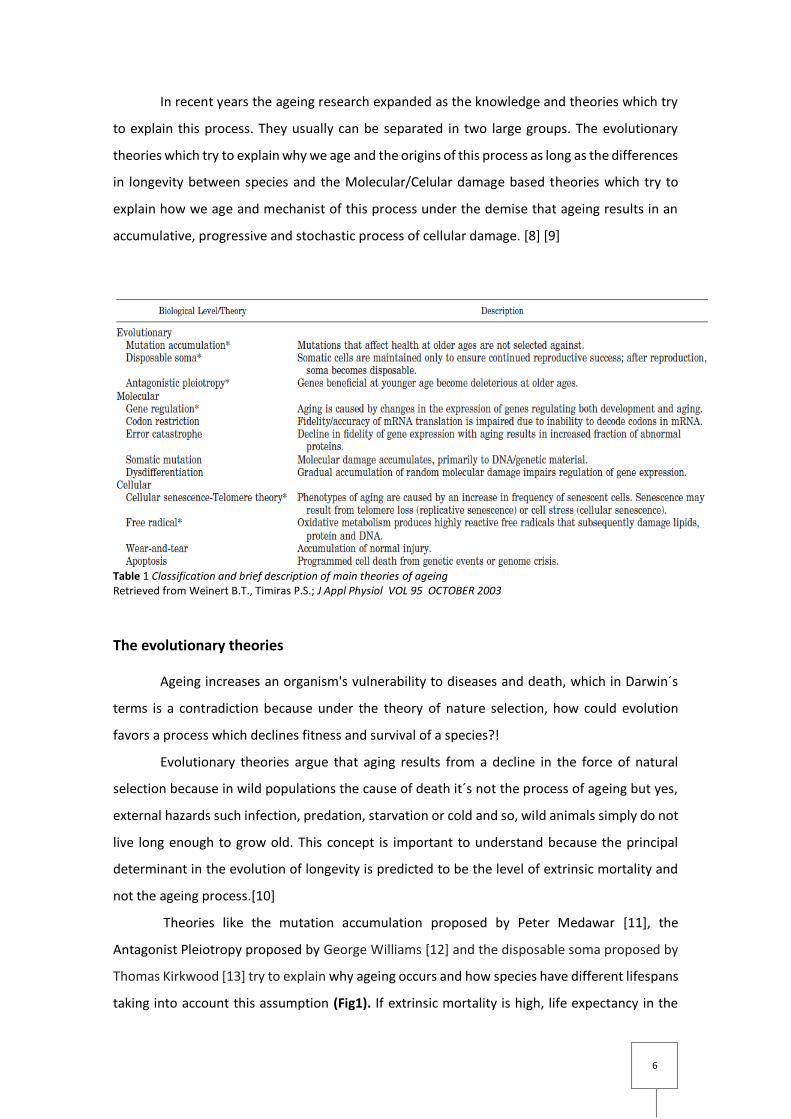
In recent years the ageing research expanded as the knowledge and theories which try
to explain this process. They usually can be separated in two large groups. The evolutionary
theories which try to explain why we age and the origins of this process as long as the differences
in longevity between species and the Molecular/Celular damage based theories which try to
explain how we age and mechanist of this process under the demise that ageing results in an
accumulative, progressive and stochastic process of cellular damage. [8] [9]
Table 1 Classification and brief description of main theories of ageing Retrieved from Weinert B.T., Timiras P.S.; J Appl Physiol VOL 95 OCTOBER 2003
The evolutionary theories Ageing increases an organism's vulnerability to diseases and death, which in Darwin´s
terms is a contradiction because under the theory of nature selection, how could evolution
favors a process which declines fitness and survival of a species?!
Evolutionary theories argue that aging results from a decline in the force of natural
selection because in wild populations the cause of death it´s not the process of ageing but yes,
external hazards such infection, predation, starvation or cold and so, wild animals simply do not
live long enough to grow old. This concept is important to understand because the principal
determinant in the evolution of longevity is predicted to be the level of extrinsic mortality and
not the ageing process.[10]
Theories like the mutation accumulation proposed by Peter Medawar [11], the
Antagonist Pleiotropy proposed by George Williams [12] and the disposable soma proposed by
Thomas Kirkwood [13] try to explain why ageing occurs and how species have different lifespans
taking into account this assumption (Fig1). If extrinsic mortality is high, life expectancy in the

7
wild is short, the force of selection attenuates fast, deleterious gene effects accumulate at
earlier ages, and there is little selection for genes with beneficial effects at old ages[12] or high
level of somatic maintenance[13]. So the opposite also happens, if the level of extrinsic mortality
is low, selection is predicted to postpone deleterious gene effects and to direct greater
investment in building and maintaining a durable soma (beneficial gene effects at old ages).
Fig.1 a, Extrinsic mortality in wild environments occurs to an extent that senescence-associated mortality is rare, undermining any idea that genes specifically for ageing have evolved. b, The ‘selection shadow’ at older ages may permit an accumulation of late-acting deleterious mutations (mutation-accumulation theory). c Pleiotropic genes that benefit organisms early in life will be favoured by selection even if they have bad effects at later ages (pleiotropy theory). d, Selection pressure to invest metabolic resources in somatic maintenance and repair is limited; all that is required is to keep the organism in sound condition for as long as it might survive in the wild (disposable-soma theory). Retrieved from " Kirkwood T.B.L, Austad S.N., "Why do we age?" Nature, vol. 408, 9 November 2000"
All this theories could all account for the life history theory which studies the changes
in organisms from conception to death, focusing on the schedule of reproduction maturity and
survival. The r/K selection is a life history simplified model proposed by Robert MacArthur and
Edward Wilson [14]. It hypothesis that natural selection and so, selective pressures drive
evolution in one of two generalized directions: r- or K-selection. Organisms r-selected will favor
early maturity onset, high fecundity, rapid development, small body sizes, and a short lifespan.
This is the case of semelparous species like the pacific salmon (genus Oncorhynchus) in which
8
individuals reproduce only once and then enter in a massive decrease of fitness ultimately
leading to death. Removal of the gonads allows this species to live much longer with the cost of
not being able to reproduce [15]. One the other hand organisms K-selected will favor delayed
development, few offspring larger body sizes, and a longer lifespan. This is obvious the case of
our species. This theory shows a clear tradeoff between fecundity, growth and longevity.[16]
Molecular/Celular damage based theories
This class of theories of aging is based on the concept that damage, either due to
normal toxic by-products of metabolism or inefficient repair/defensive systems, accumulates
throughout the entire lifespan and causes aging. Protein Damage (error catastrophe theory)
[17], cellular senescence and free radical theory [18], are some some examples of such
theories.
Ageing Hallmarks
Aging research has experienced an unprecedented advance over recent years, and
now is known that this process is ruled by genetic and biochemical pathways conserved in
evolution.[1]
Each hallmark should ideally fulfill the following criteria:
1. It should manifest during normal aging;
2. Its experimental aggravation should accelerate aging; and
3. Its experimental amelioration should retard the normal aging process and hence
increase healthy lifespan
Each hallmark is interconnected with each other, implying that experimental
amelioration of one particular hallmark may impinge on others. [1]
Some hallmarks like the processes of cellular senesce and it´s relation with
mitochondrial dysfunction and genomic instability specially in telomeres will be described in
more extent on this introduction (Fig.3)

9
Cellular senescence
Cellular senescence can be defined as the irreversible loss of division potential in
somatic cells in a response to cellular stress, and is marked by a number of distinct phenotypic
changes including protein aggregation in endoplasmic reticulum, enlarged dysfunctional
mitochondria and nonfunctional lysosomes [18], [19]. Despite entering in a permanent cell cycle
arrest, these cells remain viable and metabolically active for long time periods [20].
This cell state was first described by Hayflick and his colleague [21]. They discovered that
human embryo fibroblasts cells could only divide a finite number of times (around 50 times) in
cell culture. The number of divisions that cells complete upon reaching the end of their
replicative life span has been termed the Hayflick limit. Now it is known this replicative life is
Fig 2. The scheme enumerates the nine hallmarks described in this Review: genomic instability, telomere attrition, epigenetic alterations, loss of proteostasis, deregulated nutrient sensing, mitochondrial dysfunction, cellular senescence, stem cell exhaustion, and altered intercellular communication. Retrieved from Otin C.L., Blasco M.A., "The Hallmarks of Aging" Cell 153, June 6, 2013

10
intimately related to telomeres and it´s shortening in each cell division, function as a
replicometer and triggering replicative senescence[22], [23].(Fig.3)
The senescence arrest is considered irreversible because no known physiological stimuli
can stimulate senescent cells to reenter the cell cycle except by biological manipulations. for
examples inhibition of certain proteins involved in signaling pathways which maintain the
permanent cell cycle arrest and so, the senescent state. [25]
The permanence of the senescence growth arrest enforces the idea that the senescence
response evolved at least in part to suppress the development of cancer [24], which is the
opposite cell senescent state (continuous proliferation). So, cell senesce is a programmed
response which acts as a tumor suppressive mechanism [18].
Fig.3 Cellular senescence. Normal human fibroblasts enter a state of irreversible growth arrest after a finite number of cell divisions in vitro caused by telomere shortening but cancer cells appear to bypass this replicative limit and proliferate indefinitely. Cellular senescence can also be induced prematurely by a number of cellular stresses such as oncogenic stimuli, oxidative stress, and DNA damage, before reaching their limits of replicative life span. Senescent cells are characterized by a large and flat morphology, senescence-associated acidic galactosidase activity, and senescence-associated heterochromatic foci. Retrieved from Naoko Ohtani, David J. Mann and Eiji Hara Cellular senescence: Its role in tumor suppression and aging Cancer Sci, May 2009, vol. 100, no. 5, 792–797

11
The induction of cellular senesce
Now it is known the Hayflick limit and replicative live span is not the only stimulus which
leads to cell senescence such as DNA damage, damage to chromatin structure, oxidative stress
and oncogenic signaling [26] Here is the description of some of the causes and stimulus that
leads to this cellular state (fig.4):
Telomere-dependent senescence
Telomeres are stretches of repetitive DNA and associated proteins that cap the ends of
linear chromosomes and protect them from degradation or fusion by DNA-repair processes [27].
The structure of mammalian telomeres are thought to end in a large circular structure,
termed a t loop [28] and they are associated a proteins that bind to form a complex known as
shelterin [85]. Because standard DNA polymerases cannot completely replicate DNA ends - the
end-replication problem - cells lose base pairs of telomeric DNA during each cell division and
telomeres become shorter and shorter until become dysfunctional.
Functional telomeres prevent DNA repair machineries from recognizing chromosome
ends as DNA double-strand breaks (DSBs), and elicit the DNA damage response (DDR). The DDR
enables cells to sense damaged DNA, particularly double-strand breaks (DSBs), and to respond
by arresting cell-cycle progression and repairing the damage if possible. However, as telomeres
become dysfunctional (either by telomere shortening or other kind of induction of DNA
damage), DNA is recognized as DNA damage, forming DNA damage foci, in this case these
telomere-associated foci (TAF), and the DDR is activated and cell division is arrested without the
attempt to repair telomeres [29], [30]. These TAF are long lived and can occur within telomeric
repeats irrespectively of telomere length or telomerase activity [51]. So, dysfunctional
telomeres appear to be irreparable and as a consequence, cells with such telomeres experience
persistent DDR signaling and p53 activation which reinforce the senescence cell state [30], [31]
The end-replication problem and shortening of telomeres can be circumvented by the
enzyme telomerase, the reverse transcriptase that can replenish repetitive telomeric DNA de
novo [32]. Most normal, human cells do not express TERT (being the exception germ line, cancer
and stem cells), and telomere shortening is not prevented [33]. However, ectopic TERT
expression in normal human cells prevents telomere shortening and senescence caused by the
end-replication problem. [34]

12
Genomic Damage
Many cells undergo senescence in response to severely damaged DNA, regardless of the
genomic location DNA DSBs, such as those induced by ionizing radiation, topoisomerase
inhibitors, and other agents, are especially potent senescence inducers Many types of cytotoxic
chemotherapies are severe DNA-damaging agents that can induce senescence in both tumor
cells and surrounding normal cells [35], [36].
These lesion in DNA are known to generate persistent DDR signaling, the same kind in
telomere dependent senescence. This chronic DDR contrasts sharply with the response to mild
DNA damage, which generates a transient growth arrest and transient DDR signaling. Persistent
DDR signaling is generally identified by the long-term presence of nuclear DNA damage foci. [35]
Oncogene-induced senescenc/ Mitogens and Proliferation-Associated Signal
Cellular senescence can also be induced by strong and unbalanced mitogenic signals
[37], consistent with its role in suppressing tumorigenesis.. The first report of oncogene-induced
senescence showed that an oncogenic form of H-RAS (H-RASV12), which chronically stimulates
the mitogen-activated protein kinase (MAPK) signaling pathway, provokes senescence in normal
cells [38]. Subsequently, other members of the RAS signalling pathway (for example, RAF, MEK,
MOS and BRAF), as well as pro-proliferative nuclear proteins (E2F‑1), were shown to cause
senescence when overexpressed or expressed as oncogenic stimulus [39].
The mechanism for this oncogene induction senescece also involves DNA damage and
DDR and sometimes DDR independent signalling patahways like the p38MAPK [40].
Epigenomic Damage
Changes in the epigenome like chromatin organization like the formation of repressive
heterochromatin at several loci for proliferative genes -which usually involves E2F target genes
- and chromatin relaxion and consequent activation of the tumor supressos p16 are ways of
inducing senescence. senescence-associated heterochromatin are formed in this process. [41]
Under some circumstances, epigenomic perturbations can elicit a DDR in the absence of
physical DNA damage by activating the protein ATM of the DDR. [42]
Oxidative stress
Oxidative stress and the accumulation of intracellular reactive oxygen species (ROS) play
an important role in the induction of senescence. For example it has been shown that Human

13
fibroblasts when grown at 40-50% oxygen undergo to senescent state but the same does not
happen when the cells are cultured in a low ambient oxygen conditions (2 - 3%). [43]
The same results were achieved in experiments where ROS levels were increased either by
inhibition of anti oxidant enzymes or by hydrogen peroxide treatment.[44]
The increase in internal ROS production leads to the oxidation of biomolecules like DNA,
proteins and lipids. This oxidation, cause specially damage in telomeres and accelerates
telomere shortening through the induction of single strand breaks [45] [46]. This rise the
possibility that ROS promote senescence through telomere dysfunction. Another possibility is
that it is the induction of damage to genomic DNA by ROS that accelerates the senescence of
these cells through p53 and p21 activation [35]. More important, this p53 and p21 activation
can lead to the production of more ROS, creating a feedback positive loop [58] [81].
Fig.4 The signals activating senescence. Multiple types of stress can induce cells to undergo senescence. The
combined levels of stress determine how rapidly the entry into senescence will occur. Senescence functions as a self-
defence mechanism to prevent the proliferation of potentially damaged cells. In some instances, the same stimulus
might induce either senescence or apoptosis, but the mechanisms that govern the decision to engage one or the
other are not known
Collado M., Serrano M., " The power and the promise of oncogene-induced senescence markers
Nature Reviews Cancer 6, 472-476 (June 2006)

14
Cellular senescence hallmarks
Besides permanent cell cycle arrest, senescent cells are characterized by a myriad of
attributes (Fig 5) which includes:
Apoptotic resistance - what determines whether cells undergo senescence or apoptosis
is still unknown but the nature and intensity of the damage as well as cell type accounts for
such choice [47]. However once cells became senescent they acquire resistance to certain
apoptotic signals. the mechanism itself is not known but there is evidence that p53 is a
master regulator on this process [18]
Altered gene expression - CDKIs p21 (also termed CDKN1a, p21Cip1, Waf1 or SDI1) and
p16 (also termed CDKN2a or p16INK4a) are the most common altered expressed proteins in
senescent cells. These CDKIs are components of tumour-suppressor pathways that are
governed by the p53 and retinoblastoma (pRB). Ultimately, p21 and p16 maintain pRB in a
hypophosphorylated and active state. [18]
Also, senescent fibroblasts overexpress proteins like cytokines, chemokines, growth factors
and proteases that remodel the extracellular matrix or mediate local inflammation. This
phenotype of senescent cell is known as the senescence-associated secretory phenotype
(SASP) [48]. One particular fact of SASP is that can induce (and be activated) by reactive
oxygen species (ROS). In fact, there is evidence suggesting that ROS and the SASP cooperate
to induce and stabilise the senescent phenotype. Cytokines like IL-6 and IL-8 are involved in
this process [83], [84].
Senescent markers - Histochemical assay for β-galactosidase activity was the first widely
used marker to detect senescent cells and is still used in cell culture and vertebrate tissues
[49] but the specificity of this assay has been questioned and now, other markers such as
H2AX (-H2AX) and p53-binding protein-1 (53BP 1) which are present in senescence
associate DNA damage foci or in telomere induced/associated foci (TIF/TAF) are widely
used. [18] [51]
Also proteins that are overexpressed in senescent cell like p16 and p21 can serve as
markers.[18]
Some senescent cells can also be identified by the cytological markers of contain
senescence-associated heterochromatin foci (SAHF) [41]
DEC1 (differentiated embryo-chondrocyte expressed‑1), p15 (a CDKI) and DCR2 (decoy
death receptor-2), are promising additional markers.[50]

15
In the recent years, work has been made to create a framework for quantitative
assessment of markers for senescence, markers like γH2AX foci, p21 and Ki67 [82]. In this this,
some results are based in this assessment.
Fig.5 A schematic representation of the processes that lead to the establishment of cellular senescence as well as biomarkers. The progression of senescence has been separated into several components: (1) triggering events; (2) initiation of the senescence response; (3) entry into senescence; and (4) a further deepening of senescence phenotypes. This listing is not meant to be comprehensive and similarly, the order is not meant to imply the chronological acquisition of these features. Retrieved from Baker D.J., Sedivy J.M., Probing the depths of cellular senescence J. Cell Biol. Vol. 202 No. 1 11–13
Cellular senescence pathways and DDR
The processes by which cells repair damage to DNA and coordinate repair with cell cycle
progression are collectively known as the DDR (Fig 6). In cases in which the damage cannot be
repaired, prolonged cell cycle arrest can lead to senescence or the induction of apoptotic signals.
In the case of senescence response, it is characterized by activation of sensor kinases
(ATM/ATR, DNA-PK), formation of DNA damage foci containing phosphorylated histone H2A.X
(γH2A.X) and ultimately induction of checkpoint proteins, such as p53 (TP53) and the CDK
16
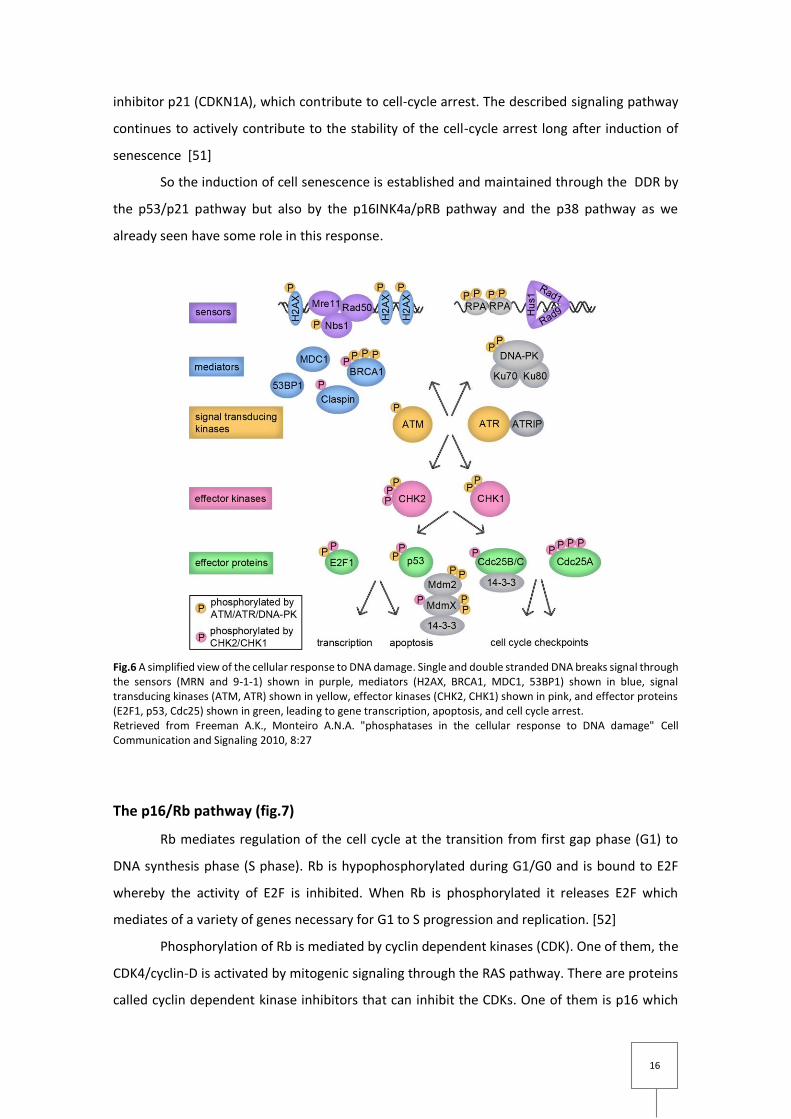
inhibitor p21 (CDKN1A), which contribute to cell-cycle arrest. The described signaling pathway
continues to actively contribute to the stability of the cell-cycle arrest long after induction of
senescence [51]
So the induction of cell senescence is established and maintained through the DDR by
the p53/p21 pathway but also by the p16INK4a/pRB pathway and the p38 pathway as we
already seen have some role in this response.
Fig.6 A simplified view of the cellular response to DNA damage. Single and double stranded DNA breaks signal through the sensors (MRN and 9-1-1) shown in purple, mediators (H2AX, BRCA1, MDC1, 53BP1) shown in blue, signal transducing kinases (ATM, ATR) shown in yellow, effector kinases (CHK2, CHK1) shown in pink, and effector proteins (E2F1, p53, Cdc25) shown in green, leading to gene transcription, apoptosis, and cell cycle arrest. Retrieved from Freeman A.K., Monteiro A.N.A. "phosphatases in the cellular response to DNA damage" Cell Communication and Signaling 2010, 8:27
The p16/Rb pathway (fig.7)
Rb mediates regulation of the cell cycle at the transition from first gap phase (G1) to
DNA synthesis phase (S phase). Rb is hypophosphorylated during G1/G0 and is bound to E2F
whereby the activity of E2F is inhibited. When Rb is phosphorylated it releases E2F which
mediates of a variety of genes necessary for G1 to S progression and replication. [52]
Phosphorylation of Rb is mediated by cyclin dependent kinases (CDK). One of them, the
CDK4/cyclin-D is activated by mitogenic signaling through the RAS pathway. There are proteins
called cyclin dependent kinase inhibitors that can inhibit the CDKs. One of them is p16 which

17
inhibits phosphorylation of Rb and thereby G1 to S progression by inhibiting CDK4/cyclin-D. p16
can in turn be regulated transcriptionally by several proteins and seems to be a sensor for
cellular stress [52]
In the last years, evidence for an important role by the p16/Rb pathway during the
induction of senescence. has been shown. [53][54]
The p53/p21 pathway (fig.8)
p53 the “guardian of the genome” acts as an integrator for various signals and can
mediate cell cycle arrest, apoptosis or even differentiation. This protein is mutated in 50% of all
tumors. There are several mechanisms that regulate the activity of p53. The DNA damage-
ATM/ATR-Chk1/Chk2 pathway activate p53 by phosphorylation leading to displacement of the
cellular protein MDM2, a inhibitor of p53 MDM2 can also be regulated by p19ARF, which
inactivates MDM2 leading to an increased activity of p53 Activity of p53 can be modulated by
protein modifications and many other protein interactions. [55]
One of the activated proteins that mediate the cell cycle arrest downstream of p53 is
p21.
p21 is a member of the “Cip/Kip” family of cyclin dependent kinase inhibitors (CDKI) that
inhibits CDK2/cyclin-E) and to a lesser extent CDK4/cyclin-D. p21 is believed to be the main
target for cell cycle arrest downstream of p53. [52]
Evidence for an important role by the p53/p21 pathway during the induction of
senescence, has been shown. Mouse embryonic fibroblasts (MEF) lacking p53 [56], or when is
inhibited in Human cells [57] do not senescence.
Reactive oxygen species (ROS) are possible mediators of the senescence response
downstream of p53/p21. It seems that, p53-and p21-induced senescence has been shown to be
at least partly dependent on ROS. [58][59]

18
Fig.7 Senescence activation models. Rb can be lineally activated through p53-p21 pathway, through p16-Rb, or through both pathways at the same time according to specific combinations and/or the severity of the factors that cause stress Noack L.C., Corredor M.C.S., Clavijo S.R.R., "The Dual Role of Senescence in Tumorigenesis" Int. J. Morphol., 28(1):37-50, 2010.
The p38 pathway (fig.8)
The p38 pathway is one of the mitogen-activated proteinkinase (MAPK) pathways and
c-Jun N-terminal kinase (JNK) pathways. [60]
In normal non-transformed cells, oncogene activation may lead to senescence by this
pathway. For example in oncogene induced senescence (OIS) the p16 cyclin-dependent protein
kinase (CDK) inhibitor and the transcription factor p53 are two major effectors that enforce
growth arrest and cell senescence.
Activation of p38 leads to increased expression of p16INK4A during OIS [61]. Other
studies indicate that p53 is a downstream effector of p38 pathway, mediated by ras induced
senescence. [62] Also ROS seems to have a paper in p38 activation and OIS. [63]

19
Fig.8 The p38 pathway and OIS. Signal-transduction pathways mediating the role of p38 in OIS are shown. Oncogenic ras, and possibly other oncogenes, induces sequential activation of the tumorigenic Raf–MEK–ERK MAPK pathway and the stress-induced MINK–MKK3/6–p38–PRAK MAPK pathway. Activation of the p38 pathway might be mediated by increased intracellular levels of reactive oxygen species (ROS) induced by the Ras–Raf–MEK–ERK signaling cascade. Activated components of the p38 pathway phosphorylate multiple residues on p53, including Ser33 and Ser46 (by p38), Ser37 (by PRAK), and possibly others, leading to increased transcriptional activity of p53 and induction of a transcriptional target of p53, p21WAF1. Through an unknown mechanism, active p38 also induces the expression of p16INK4A and p14/p19ARF, which, together with the p53–p21WAF1 cascade, cause premature senescence that serves as a tumor-suppressing defense mechanism both in cell culture and in vivo Retrieved from Han J., Sun P. (2007) "The pathways to tumor suppression via route p38" Trends in Biochemical Sciences, Vol.32, No.8
Cellular senescence in Vivo Classically, senescence has been described in somatic cells grown in vitro; however, a
question begin to rise if such senescence state is simply an artefact of cell culture or if it really
exists in vivo. [64]
Signals which induce senescence in culture cells may have a origin in extrinsic sources,
and stems from strains stresses that cells experience when they are explanted into culture
(“culture shock”) and so, the progressive loss in proliferative capacity may result from
cumulative trauma imposed by tissue culture and all the conditions underlying this process like
the lack of heterotypic interactions between cell types, plating of plastic, hyperoxia, the
medium-to-cell ratio among others. [65]
However, there is recent evidence that senesce also happens in vivo. The observation of
fibroblasts containing telomere-induced foci (TIF). [66]
Moreover, genetic manipulation of the classical senescence pathways (p53/p21; p16)
has been shown to impact on organismal ageing [67], [68], [69]. Additionally, there is evidence
that senescence has a role in cancer, showing once again, evidence that senesce is a tumor
suppressive response in vivo. [70][71]

20
Cellular senescence and mitochondrial dysfunction
Mitochondria suffer changes with replicative lifespan affecting metabolism and ROS
and dividing cells in vivo accumulate mtDNA mutations generating deficient respiratory
enzymes. These is correlated to mitochondrial dysfunction which can accelerate telomere
shortening by the rise in oxidative stress. [72 ] [73] [74] [75]. (Fig.9)
Fig.9 Mitochondrial ROS production contributes to telomere-dependent replicative senescence. ROS are produced as by-product of normal mitochondrial respiration and are partially detoxified by antioxidants. ROS cause mitochondrial DNA damage and mutation, which might enhance further ROS production. ROS accelerate telomere shortening and uncapping and may also result in some unrepaired DNA damage, both of which can activate a permanent DNA damage response that signals and maintains replicative senescence Retrieved from Passos J.F., von Zglinicki, T "Mitochondria, telomeres and cell senescence" Experimental Gerontology 40 (2005) 466–472

21
Cellular senescence, ageing and cancer The primary purpose of senescence is to prevent the propagation of damaged cells and
to trigger their demise by the immune system, contributing to rid tissues from damaged and
potentially oncogenic cells checkpoint.[1] However this tumor suppressive response, as time
pass by, leads to an increase and accumulation of senescent cells, including cells essential for
tissue function and regeneration. The depletion of the pool of mitotically competent and
functional cells will ultimately lead to a functional decline of various organ systems with
increasing age. It would also change the surrounding microenvironment and compromise tissue
repair and renewal since senescent cells secrete a number of matrix metalloproteinases and
inflammatory cytokines that can alter the surrounding tissue structure and cause local
inflammation. [18]
It seems that cellular senescence acts as a mediator in the trade-off between cancer and
ageing. Such trade-off can be seen in mice with constitutively hyperactive forms of p53. This
mice, despite tumour resistant show multiple signs of accelerated ageing. [67] [76]
Fig.10 Cellular senescence. In young organisms, cellular senescence prevents the proliferation of damaged cells, thus protecting from cancer and contributing to tissue homeostasis. In old organisms, the pervasive damage and the deficient clearance of senescent cells result in their accumulation, and this has a number of deleterious effects on tissue homeostasis that contribute to aging Retrieved from Otin C.L., Blasco M.A., "The Hallmarks of Aging" Cell 153, June 6, 2013
22
Monoamine Oxidases
Monoamine oxidase (MAO, EC 1.4.3.4) is a flavin-adnosine-dinucleotide (FAD)
containing enzyme located on the outer mitochondrial membrane. It exists in two functional
isozymic forms, termed MAO-A and MAO-B, which have 70% sequence identity as deduced from
their cDNA clones. These two forms of the enzyme can be distinguished by differences in
substrate preference, inhibitor specificity, tissue distribution, immunological properties, and
amino acid sequences. [77]
MAO-A and -B are expressed in most tissues [86]. Even so MAO-A is characteristically
abundant in fibroblasts and placenta in contrast to MAO-B isoenzyme which is expressed in
platelets and lymphocytes. Both isoenzymes are present in most brain regions; however,
certain areas are more prone to express one isoenzyme [88] [89].
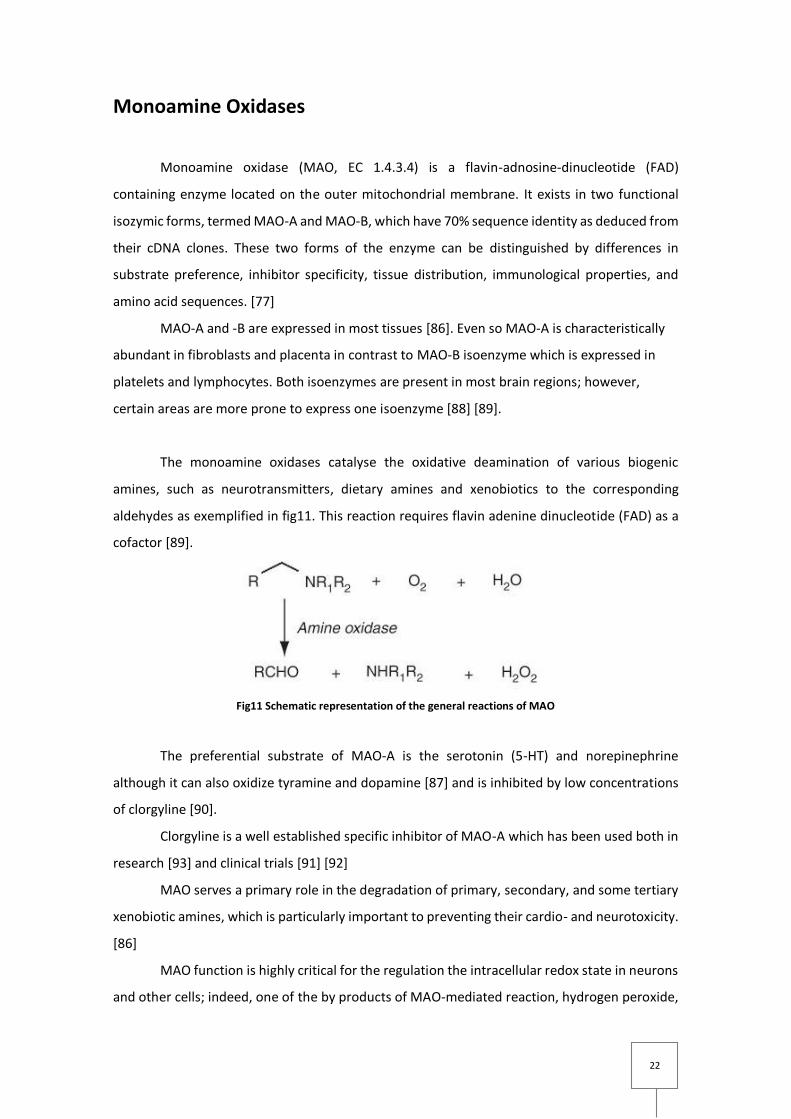
The monoamine oxidases catalyse the oxidative deamination of various biogenic
amines, such as neurotransmitters, dietary amines and xenobiotics to the corresponding
aldehydes as exemplified in fig11. This reaction requires flavin adenine dinucleotide (FAD) as a
cofactor [89].
Fig11 Schematic representation of the general reactions of MAO
The preferential substrate of MAO-A is the serotonin (5-HT) and norepinephrine
although it can also oxidize tyramine and dopamine [87] and is inhibited by low concentrations
of clorgyline [90].
Clorgyline is a well established specific inhibitor of MAO-A which has been used both in
research [93] and clinical trials [91] [92]
MAO serves a primary role in the degradation of primary, secondary, and some tertiary
xenobiotic amines, which is particularly important to preventing their cardio- and neurotoxicity.
[86]
MAO function is highly critical for the regulation the intracellular redox state in neurons
and other cells; indeed, one of the by products of MAO-mediated reaction, hydrogen peroxide,

23
is a potent oxidizer which can trigger the formation of superoxide radicals and other reactive
oxygen species, contributing to the progress of neurodegenerative disorders, such as Parkinson
as well as sleep and mood disorders. [89]

24
Aim of the study
Determine the contribution of MAO-A to cellular senescence and possible mechanistic
links between them.
Hypothesis: MAO-A and the induction in cellular senescence
MAO-A, the mitochondrial enzyme by catalyzing the oxidative deamination of biogenic
and exogenous amines, contributes to the ROS production (H2O2), and so, contributing to
senescence induction and ageing. three research articles have already proposed the influence
of MAO-A in the ageing heart by induction of cellular senescence through the increase of cardiac
oxidative stress and activation of the p53 pathway (fig12). [78], [79], [93], Also it was found in
an independent study that MAO-A mRNA expression is increases in human senescent fibroblasts
[80]. Furthermore, it is known that ROS production, DNA damage and DDR are all connected in
a positive feedback loop despite the precise mechanisms are unknown. [81]
Taking all this into account, further studies to determine the contribution of MAO-A to
the link between, ROS production, DNA damage and the permanent DDR to induce and maintain
cellular senescence are needed (Fig13)
Fig 12 The role of MAO-A in cellular senescence. The p53 activation will ultimately lead to cell senescence Retrieved from Villeneuve C., Frugier C.G., p53-PGC-1a Pathway Mediates Oxidative Mitochondrial Damage and Cardiomyocyte Necrosis Induced by Monoamine Oxidase-A Upregulation: Role in Chronic Left Ventricular Dysfunction in Mice ANTIOXIDANTS & REDOX SIGNALING Volume 00, Number 00, 2012
Fig 13 Scheme illustrating the feedback loop model between DDR, mitochondrial dysfunction and ROS generation, Telomere associated foci (TAF) (red), double strand breaks (black) trigger the DDR and signalling through TP53, CDKN1A, CDKN1A, GADD45, MAPK14 and TGFβ leading to mitochondrial dysfunction and an increase in ROS production, ROS causes further DNA damage which leads to a constitutively active DDR causing a permanent growth arrest and stabilisation of the senescent phenotype. MAO-A is hypothesised to contribute to this feedback loop through ROS production

25
Material and Methods
All chemicals were from Sigma unless indicated otherwise.
Cell lines
Normal human foetal lung fibroblasts were obtained from European Collection of Cell
Cultures (ECACC, #05090501) (Salisbury, UK).
Cell culture routine
Cells were cultured in Dulbecco’s Modified Eagle’s Medium (DMEM) (Sigma, D7596)
supplemented with foetal bovine serum (FBS) (10% v/v) (Sigma, 12133C), L-glutamine (2mM)
(Sigma, G3126), penicillin (100 units/ml)/streptomycin (100 g/ml) (Sigma, P4333) and
maintained at 37C, 5% CO2. Cell culture was carried out using aseptic technique in a class II
safety cabinet. Cell passaging included a phosphate buffered saline (PBS) wash, subsequent
trypsinisation with pre-warmed Trypsin-EDTA (TE) (0.5% Trypsin, 0.2% EDTA) (Sigma, T3924) at
37C followed by neutralisation with cell culture medium. Cells were then collected by
centrifugation or resuspended in fresh medium at a suitable density and reseeded into tissue
culture flasks or dishes. Renew of the medium was done every three days
Cryogenic storage
Exponentially growing adherent cells were trypsinised and centrifuged at 800 g for 5
minutes at room temperature. The supernatant was removed and cells were washed in sterile
PBS, recentrifuged and resuspended in FBS containing 5% (v/v) dimethyl sulfoxide (DMSO)
(Sigma, D2650) at a density of 1 x 10⁶ cells/ml. Aliquots of 1ml cell suspension were immediately
transferred to cryo-vials and placed in a NalgeneTM Cryo freezing container filled with
isopropanol. Cells were kept for 24 hours at -80C to allow them to slowly freeze before being
stored long-term in liquid nitrogen.

26
Thawing of frozen cells
Cryo-vials were removed from liquid nitrogen and quickly thawed at 37C for 1 to 2
minutes. Cells were immediately seeded into a 75 cm2 with 20 ml pre-warmed medium. Medium
was replaced after 24 hours to remove DMSO and cell debris.
Calculation of cell density and population doublings
To determine the concentration of cells within the cell suspension, 20 l of suspension
was added to a Fuchs-Rosenthal 0.2 mm haemocytometer (VWR International UK) and cells
manually counted under a standard microscope (DMIL, Leica Microsystems, UK). The average of
four counts of 8 squares was taken, which is equivalent to the number of cells x 104/ml. Cells
within and touching the top and left sides of the square were counted. Total cell number was
calculated by multiplying the total volume of cell suspension by the number of cells per ml. With
every cell passage, population doubling (PD) was calculated by comparing total cell number with
number previously plated, using the following equation:
PD = X + (ln(N1/N2))/ln2
Where:
PD= population doubling
X= previous PD
N1 = number of cells harvested
N2 = number of cells seeded
Cell treatments
Stress induced senescence in MRC5 fibroblasts was induced by X-ray irradiation with 20
Gy for 8 min. Following treatment, culture medium was refreshed. In the following experiments
cells that were stress induced by this method were analysed 3 to 10 days after radiation
To inhibit MAO-A, cells were treated with Clorgyline (Sigma M3778-50MG) dissolved in
water. The chemical inhibitor Clorgyline was replaced every 3 days in cell culture at 10 or 100
µM concentration unless in one experiment were it was replaced every day at a concentration
of 1 µM. (The goal of this experiment was to see the effect in PD of chronic clorgyline treatment
in MRC5 life span called here afterwards long term experiment (LTE)).

27
FACS
Calibration of the flow cytometer (Partec) was carried out using fluorescent beads to
ensure optimum performance and reproducibility. . For each experiment 1 x 10⁵ cells were
analysed per measurement.
For reactive oxygen species (ROS) production measurements, MRC5 fibroblasts (non-
irradiated and irradiated; treated and non-treated with clorgyline) were trypsinised followed by
neutralisation using DMEM (Sigma, Dorset, UK) supplemented with 1% penicillin/streptomycin,
2 mM L-Glutamine and 10% heat-inactivated foetal bovine serum. Cells were centrifuged at
1600 rpm for 2 minutes at room temperature, and the pellet was re-suspended in 1 ml of serum-
free DMEM containing either dihydroethidium (DHE; 5mM stock; 1µl/ml) (#D-23107,
Invitrogen), a blue fluorescent dye used to monitor superoxide production which, when reacts
with superoxide anions, DHE forms a red fluorescent product or dihydrorhodamine (DHR123;
5mM stock; 3µl/ml) (#D-23806, Invitrogen) which is a cell-permeable dye used to detect ROS,
including peroxynitrite and peroxide. Upon oxidation by ROS, Rhodamine 123 is formed, which
is highly fluorescent.
Cells were incubated in the dark for 30 minutes at 37°C. Following centrifugation at
1600 rpm for 2 minutes, the supernatant was discarded and serum free DMEM was added to
the pellets, which were re-suspended immediately before analysis by flow cytometry (Partec ).
The population of live cells is defined in a FSC/SSC dot plot and apoptotic cells and debris are
excluded. Fluorescence intensity is determined in FL3 for DHE and FL1 for DHR123, conveniently
in a FSC/FL3 or FSC/FL1 dot plot.
Western Blotting
Samples were prepared by adding the appropriate amount of protein lysate to 2X
sample buffer containing 50 µl 2-mercaptoethanol, such that a final concentration of 1µg/µl of
protein was achieved
MRC5 fibroblasts were lysed using ice-cold RIPA buffer (150 mM NaCl, 1% NP- 40, 0.5%
NaDoC, 0.1% SDS, 50 mM tris-HCl, pH 7.4, supplemented with Halt™ complete phosphatase and
protease inhibitor cocktail 1%(Thermo)). Cell lysates was then centrifuged at 4oC at 13000 rpm
for 10 mins to remove insoluble cellular components. Protein concentration was measured by
the Bradford assay (BioRad) using an Omega FLUOstar plate reader. Samples were prepared by
adding to them, SDS-Loading buffer (BioRad) in the presence of 5% β-Mercaptoethanol. Final

28
protein concentration in each sample should be between 30-50μg.
Samples were then heated at 100°C for 5 minutes, and placed on ice until loading.
Protein samples were loaded and run on 15% resolving gel (2.3 ml sterile H2O, 5 ml 30%
acrylamide, 2.5 ml 1.5 M Tris pH 8.8, 100 µl 10% SDS, 100 µl 10% ammonium persulphate and 4
µl TEMED) with running buffer Samples were run for 90 minutes at a voltage of 125 V in the
presence of running buffer (25mM Tris, 0.192 mM Glycine) and transferred to Immobilon®-P
(Millipore) membrane using Trans-Blot® Semi-Dry transfer (BioRad).
A protein ladder (Precision Plus ProteinTM Dual Color Standards) was also loaded.
Following transfer, membranes were incubated in Ponceau solution for 2 minutes to
allow protein band visualisation, and excess solution was washed off with water. Afterwards the
membrane was blocked in freshly prepared PBS containing 10% non-fat dry milk and 0.2%
Tween-20 (PBST-MLK) for 60 minutes at room temperature with shaking.
Membranes were incubated with 10-15 ml primary antibodies diluted in 5% milk PBST
(0.2%) sodium azide (20%) overnight at 4° (antibodies used: Rabbit anti-MAO-A 1:100, Santa
Cruz (sc-20156); Rabbit anti-p21 1:200, Abcam (ab7960); Rabbit anti-GAPDH, 1:5000, Cell
Signalling)
Following 5 washes in MilliQ water for 5 minutes each, the membrane were either incubated
with goat anti-mouse or goat anti-rabbit HRP conjugated IgG secondary antibody (1:5000)
(Sigma, UK) in PBS containing 5% non-fat milk and 0.2% Tween-20 for 1 hours at room
temperature on a shaker. Membranes were then 5 times in MilliQ water, 4 times in PBS with
0.05% Tween for 3 mins and a further 5 times in MilliQ water. Signal was detected by
chemiluminescence using FujiFilm LAS-4000 and the Amersham™ ECL™ prime Western blotting
kit (GE Healthcare)
Immunofluorescence/Immunocytochemistry
MRC5 fibroblasts were grown in coverslips and fixed with 2% PFA in PBS for 10 minutes
at room temperature. PFA was removed and cells were washed two times with PBS.
To permeabilise, cells were incubated with 1 ml PBG-Triton for 45 minutes at room
temperature.
Cells were incubated with primary antibody of interest (table 1) at room temperature
in a shaker for 2 hours. Subsequently, Cells were washed three times with PBG-Triton for 5

29
minutes and incubated for 45 minutes to 1 hour with fluorescein-conjugated secondary
antibody of interest (table 2) diluted 1:4000 in PBG-Triton away from light. Cells were washed
3 times with PBS for 5 minutes each, and then mounted with Vectashield hardset mounting
medium with DAPI. Imaging was done using a Leica DM5500B microscope.
Antibody Species Dilution
Ki67 (Abcam, ab15580) Rabbit polyclonal 1:250
anti-phospho-histone
H2A.X (γH2AX)
(Ser139) (Millipore, 05-
636)
Mouse monoclonal 1:2000
anti-53BP1 antibody
(Cell Signalling)
Rabbit 1:250
Rabbit anti-p21 1:200,
Abcam (ab7960
Rabbit polyclonal 1:200
Table 1 Primary antibodies used for immunofluorescence on cells
Antibody Species Dilution
Anti-rabbit
Fluorescein-conjugated
secondary antibody
AlexaFluor 594
(Invitrogen, A21213)
Goat 1:4000
Anti-mouse
Fluorescein-conjugated
secondary antibody
AlexaFluor 488
(Invitrogen, A21042)
Goat 1:4000
Table 2 Secondary antibodies used for immunofluorescence on cells

30
Immuno FISH (γH2AX-TeloFISH) staining on fixed cells
MRC5 fibroblasts were grown in coverslips and fixed with 2% paraformaldehyde (PFA)
in PBS. Cells were incubated with rabbit monoclonal anti-γH2A.X (Ser139) (1:200) (#9718A, Cell
Signalling) and mouse monoclonal anti-TRF2 (1:200) (#05-521, Clone 4A794, Millipore) primary
antibodies overnight at 4°C. Subsequently, AlexaFluor 647 goat anti-rabbit IgG (1:1000)
(#A21244, Invitrogen) and AlexaFluor 488 goat anti-mouse IgG (1:1000) (#A11001, Invitrogen)
secondary antibodies were applied and left to incubate for 1 hour at room temperature. Cells
were washed in PBS three times for 5 minutes, and fixed using methanol and acetic acid (3:1)
for 30 minutes. Following fixation, cells were dehydrated with 70%, 90% and 100% cold ethanol
for 2 minutes each, and then immersed in PBS at 37°C for 5 minutes. After incubation with 4%
PFA at 37°C for 2 minutes each, cells were washed with PBS and again dehydrated with 70%,
90%, 100% cold ethanol. Next, 10 µl of hybridisation buffer (70% deionised formamide, 25 mM
MgCl2, 1 mM Tris pH 7.2, 5% blocking reagent (Roche)) containing Cy-3-labelled telomere
specific (C3TA2)3 peptide nucleic acid (PNA) probe (4 ng µl-1) (Panagene) was applied to each
coverslip, followed by denaturation at 80°C for 10 minutes and hybridisation for 2 hours at room
temperature. Cells were washed with wash buffer containing 70% formamide and 30% SSC 2%
three times for 10 minutes each, and then with TBS-Tween 0.05% three times for 5 minutes
each. Following dehydration with 70%, 90% and 100% cold ethanol for 2 minutes each, cells
were allowed to air dry and then mounted with Vectashield hardset mounting medium with
DAPI. Imaging was done using Leica DM5500B microscope objective.
Senescence-associated β-galactosidase staining
Cells were grown in coverslips and fixed with 2% PFA in PBS. Cells were washed twice
with PBS and then incubated overnight at 37° C in senescence-associated β-galactosidade
staining solution containing 2 mM magnesium chloride, 150 mM sodium chloride, 40 mM citric
acid, 12 mM sodium phosphate dibasic, 5 mM potassium ferrocyanide, 5 mM potassium
ferricyanide and 1 mg/l 5-bromo-4-chloro-3-inolyl-β-d-galactoside (X-Gal) at pH 6.0. Next, cells
were washed three times with PBS for 5 minutes each, and nuclei were stained by incubating
with DAPI for 10 minutes at room temperature. Following three PBS washes for 5 minutes each,
coverslips were mounted using Vectashield hardset mounting medium and imaged using a Leica
DFC310FX microscope.

31
Microscopy
Samples for ImmunoFISH were imaged with a Leica DM 5500B Widefield Microscope
through an HCX PL APO 100x/1.40-0.70 oil objective using a Leica DFC 360 FX camera. Images
were captured as z-stacks separated by 0.247µm using the LAS-Leica software suite. Slides
obtained using immunofluorescence procedures were imaged on the same system using an HCX
PL APO 40x/1.25 oil objective for 53bp1 and γH2AX markers and an HCX PL APO 20x objective
for Ki67 and p21 markers.For the senescence-associated β-galactosidase staining images were
obtained using Leica DFC310FX microscope with an HCX PL APO 20x magnification Images were
analysed and prepared using the software ImageJ ( http://rsb.info.nih.gov/ij/), Adobe
Photoshop CS6 and paint.
ELISA (IL8)
Cytokine concentrations in cell culture supernatants were determined using
commercially available ELISA kits (Duoset, R&D systems), according to the manufacturer’s
instructions [94]. All assays were carried out at room temperature.

32
Results
MAO-A is expressed in proliferative and overexpressed in IR and RS
MRC5 fibroblasts
Using MRC5 fibroblasts as a model for studying cellular senesce [82], the first thing to
do was to observe differences in expression of MAO-A protein content between proliferative,
IR and RS cells, the last two representing 2 different models of cell senescence and check if
indeed there is some link between MAO-A and cellular senescence. To test this, a western blot
was made with anti MAO-A with the results represented in fig14.
The results show us an increase in the expression of MAO-A in IR cells at the early time
points and a huge increase of MAO-A in RS cells, both compared to proliferative cells. Such
observations indicate that, somehow, senescent cells, even in different models of cellular
senescence, MAO-A protein content are correlated even if it is not possible to determine the
casual/consequence of this relationship
It is still possible to observe that MAO-B protein content is much more expressed in IR
(all time points) and RS compared to proliferative cells.
Fig.14 Western blot to determine the expression of MAO-A protein content in proliferative, IR ( 20 Gy, timepoints 1,2,3,5,7,10 days) and RS MRC5 fibroblasts. Using anti-MAO-A antibody, two bands at distinctive molecular
weights appear. The top one corresponds to MAO-A (61 kDa) and the lower one corresponds to MAO-B (59 kDa). GAPDH (37 kDa) was the loading control
33
Clorgyline treated MRC5 fibroblasts decreases ROS in IR cells but not in
proliferative ones
In order to further characterise the role of MAO-A in cellular senescence we analysed
ROS measurements in IR and NIR MRC5 fibroblasts treated with clorgyline by FACS. Clorgyline is
a specific chemical inhibitor of MAO-A, and so, cells treated with clorgyline should have an
impact on the amount of ROS produced and has been shown that ROS are important in the
establishment and maintenance of senescence through a feedback loop involving DDR and
mitochondrial dysfunction.
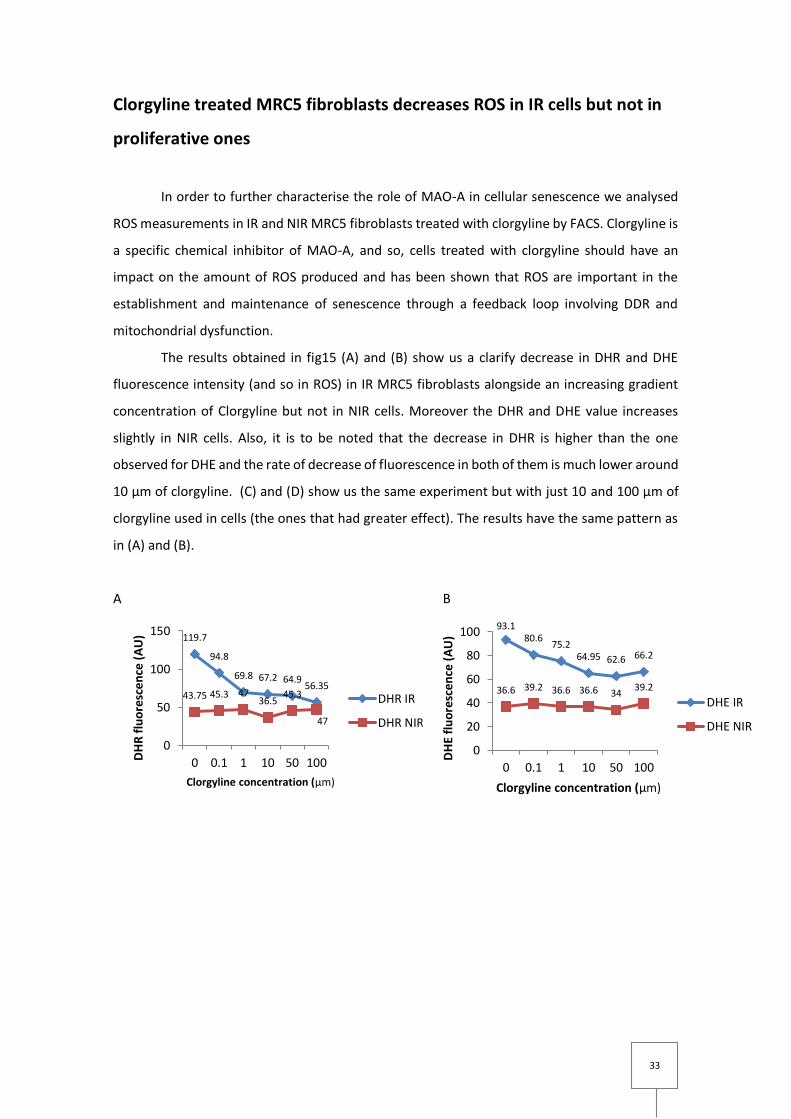
The results obtained in fig15 (A) and (B) show us a clarify decrease in DHR and DHE
fluorescence intensity (and so in ROS) in IR MRC5 fibroblasts alongside an increasing gradient
concentration of Clorgyline but not in NIR cells. Moreover the DHR and DHE value increases
slightly in NIR cells. Also, it is to be noted that the decrease in DHR is higher than the one
observed for DHE and the rate of decrease of fluorescence in both of them is much lower around
10 µm of clorgyline. (C) and (D) show us the same experiment but with just 10 and 100 µm of
clorgyline used in cells (the ones that had greater effect). The results have the same pattern as
in (A) and (B).
A B
119.7
94.8
69.8 67.2 64.956.35
43.75 45.3 4736.5
45.3
47
0
50
100
150
0 0.1 1 10 50 100DH
R f
luo
resc
ence
(A
U)
Clorgyline concentration (µm)
DHR IR
DHR NIR
93.180.6
75.264.95 62.6 66.2
36.6 39.2 36.6 36.6 3439.2
0
20
40
60
80
100
0 0.1 1 10 50 100
DH
E fl
uo
resc
en
ce (
AU
)
Clorgyline concentration (µm)
DHE IR
DHE NIR

34
C D
Figure 15 Quantification of ROS in IR and NIR MRC5 fibroblasts with clorgyline treatment, obtained using DHR (A and C) and DHE (B and D) intensity measured by flow cytometry. IR cells values were measured after 3 days of 20Gy X-ray radiation. (A) Change of DHR fluorescence intensity of MRC5 fibroblasts IR and NIR over a gradient concentration of clorgyline. (B) Change of DHE fluorescence intensity of MRC5 fibroblasts IR and NIR over a gradient concentration of clorgyline. (C) Change of DHR fluorescence intensity of MRC5 fibroblasts IR and NIR in controls and clogyline treated (10 µm and µm100) data are mean ± s.e.m of n=3( D) Change of DHR fluorescence intensity of MRC5 fibroblasts IR and NIR in controls and clogyline treated (10 µm and µm100). data are mean ± s.e.m of n=3
Clorgyline treated MRC5 fibroblasts slightly decreases senescent
phenotype in IR compared to control IR
After the observation that clorgyline reduces ROS in MRC5 IR cells (and so, in senescent
cells), we decided to proceed to the quantification of senescent marker [8] (ki67 and γH2A.X )
by immunocytochemistry in different four populations (control NIR; control IR; treated NIR;
treated IR) MRC5 fibroblasts cells. Clorgyline concentrations used, were 10 and 100 µm. MRC5
IR were analysed 3 days after irradiation.
Through fig 16 (A) and respective quantification (C) MRC5 irradiation eradicates
proliferation which can be seen by the steep decrease of the proliferative marker ki67 between
NIR an IR MRC5, although cells treated with clorgyline show some rescue. The higher the
concentration of clorgyline, the higher the rescue.

35
A
B
Fig 16 Representative images of NIR and IR (20Gy X-Ray irradiation) MRC5 cells treated with different concentrations of clorgyline, immunostained using (A) anti-Ki67 (B) anti- γH2A.X (γH2A.X and Ki67:red, Nucleus: blue) ;(C) Percentage of Ki67-positive cells in NIR and IR 3 day cells treated with MRC5 treated with different concentrations of clorgyline (D) Average number of γH2A.X foci per cell in NIR and IR 3 day cells treated with MRC5 treated with different concentrations of clorgyline. data are mean±s.e.m of n≥30.

36
The same kind of observation can be made into γH2A.X Foci (and so, DNA damage), by
looking into fig 16 (B) and (D). Irradiation induces in average, much more γH2A.X Foci per cell
than NIR cells but still, clorgyline treatment reduces the amount of Foci in irradiated cells (the
higher the concentration, the higher is the decrease), compared to irradiated non treated cells.
On the other way around it seems that in NIR cells, treatment with clorgyline increases the
average number of γH2A.X Foci per cell, despite, this increase is in the order of decimal (from
0.22 to 0.93) while in IR MRC5 the decrease in Foci is in units (from 9.26 to 7.76)
Furthermore, the same kind of analyse was made in a similar but independent
experiment which cells were analysed by the same senescent markers plus SA-β-Galactosidase
with different four populations (control NIR; control IR; treated NIR; treated IR) MRC5 fibroblasts
cells, but this time, MRC5 IR were analysed 10 days after irradiation.
Fig 16 Representative images of NIR and IR (20Gy X-Ray irradiation) MRC5 cells treated with different concentrations of clorgyline, immunostained using (A) anti-Ki67 (B) anti- γH2A.X (C) SA-β-Gal (γH2A.X and Ki67:red, SA-β-Gal: green blue shade around nucleus, Nucleus: blue) ;(D) Percentage of Ki67-positive cells in NIR and IR 10 day cells treated with MRC5 treated with different concentrations of clorgyline (E) Average number of γH2A.X foci per cell in NIR and IR 10 day cells treated with MRC5 treated with different concentrations of clorgyline. (F) Percentage of SA-β-G cells in NIR and IR 10 day cells treated with MRC5 treated with different concentrations of clorgyline. Data are mean±s.e.m of n≥30.

37
Regarding to ki67 and γH2A.X the results can be described as the same in the previous
experiment. An increase in proliferation markers in MRC5 treated with clorgyline both NIR and
IR; a decrease in DNA damage foci in cells treated with clorgyline in IR cells and a slightly increase
in NIR. After 10 days, cells treated with clorgyline 100µM were dead (NIR) in this experiment,
probably due to cytotoxicity of the chemical for prolonged exposure to the chemical. In IR
clorgyline has a beneficial effect and so, the opposite effect. Concerning SA-β-Gal staining, the
results are consistent to the results obtained for other markers. IR MRC5 treated with clorgyline
have a decrease (around 10 %) of SA-β-Gal stained compared to non treated. Differences
between NIR are not significant.
Clorgyline treatment slightly decreases senescent phenotype from
proliferative MRC5 fibroblasts until they reach RS
So far, the model of stress induced senescence through X-ray radiation has been the
major model for characterizing MAO-A in cellular senescence. In this experiment the RS model
was the one to be characterize.
Proliferative MRC5 cells with a PD around 30, started to being treated with clorgyline at
a low concentration (1µ) every day. Time points were obtained until they reached senescent
phenotype. This experiment lasted around 30 to 40 days (LTE).
Senescent markers (ki67 and 53bp1, P21), population doubling curve and ROS
production were analysed/obtained as depicted in fig.17. 53bp1 like γH2A.X is a marker of DNA
damage.
Despite senescent markers intensity increasing over time/(over PD) as they approach RS
state, MRC5 treated with clorgyline resulted, alike in the stress induced model through
radiation, a reduction in senescent markers compared to the control population.
Ki67 (A), (D) presents a difference of 3-20 % positive between treated and non treated
MRC5. 53bp1 (B) (E) in comparison to γH2A.X presents less foci per cell, but the ratio of foci
between treated and non treated still maintains. MRC5 treated presents 1-2 less foci than non
treated. P21 (C) (I) expression, (which is related directly to the induction of senescent
phenotype) also show a difference around 20% positive cells between treated and non treated
MRC5. ROS production (F) (G) also increase over time in both MRC5 cultures, but again, control
MRC5 produce much more than non treated MRC5.
The results in fig17, A B C D E F G probably contribute to the difference of PD between
the two populations in H.

38

39
Fig 17Assessment of several markers of senescence in MRC5 fibroblasts from median (PD 29) to senescence (PD 44) Images and ROS data are retrieved from time chosen time points (4, 14 and 31 days after beginning of clorgyline treatment. population doubling Representative images of immunostained using (A) anti-Ki67 (B) anti-53bp1 (C) p21 (53bp1, Ki67 and p21:red, Nucleus: blue) and respective quantifications (D), (E) (I). Data are mean±s.e.m of n≥30. (F) and (G) Change of DHR and DHE fluorescence intensity respectively at the time points previously described. (H) Growth curve showing the difference in PD over time between control (non treated) and treated MRC5
Telomere associated foci (TAF) have been recently associated with the senescent
phenotype [51], and were also checked in the described previous experiment.
Fig 18 Representative images of γH2A.X immuno-FISH of MRC5 fibroblasts. Both (A) and (B) represent each one, one cell. In (B) there is no TAF while in (A) there is one, amplified and indicated with an arrow. (C) Chart representative of the average number of TAF per cell at the same time points and same populations as previously described.

40
In fig18 C the results obtained are consistent with the ones previously described. The
number of TAF increases over time in both populations but the number of TAF obtained for each
population is different, being the control one, the one with higher mean over the treated one.
In the last result, SASP and more recently IL-8 have been related to the induction and
maintenance of the senescent phenotype [84]. IL-8 content was checked according to the
sample time points previously described (fig. 19)
Fig 19 ELISA for IL-8 performed in samples corresponding to the same time points and same populations as previously described.
The result show us that IL-8 secretion by MRC5 over time will increase more in the
population control than in the clorgyline treated. These data is consistent with the ones
previously described.

41
Discussion
MAO-A has been vastly described in many tissues and systems but never described its
role in cellular senescence. Because MAO-A produces (H2O2) as a byproduct of its catalytic
reaction, it is natural that MAO-A has a role in cellular senesce via the positive feedback loop
between ROS production, DNA damage and the permanent DDR [81].
Using MRC5 as a cellular model [82], we checked the protein content of MAO-A in this
cell line and, as expected, in models of cellular senescence (RS cells or stress induced by X-ray
radiation) this enzyme is overexpressed. It is of reference that MAO-B (which also contributes
to production of ROS) is also overexpressed in these cellular models and possibly also has a role
in cellular senescence.
Also, for all the markers established until now to quantify cellular senescence
(proliferation markers, DNA damage Foci; components of SASP; specific assays like Senescence-
associated β-galactosidase staining, ROS production), [52] [82] [88], for all of them, MAO-A
specific chemical inhibition with clorgyline [90], leaded always to an alleviation of senescent
phenotype in models of cellular senescence, although in proliferative cells, some senescent
markers tend to be slightly increased, probably due to cytotoxic effects of this inhibitor.

42
Future perspectives and conclusion
This study shows for the first time a possible link between MAO-A and cellular
senescence. Because it is the first of its kind, it is also in the elementary stages of research and
future work is required to understand better this link between this enzyme and this cellular
state.
First, immunohistochemistry of tissues with different ages, specially brain, skin and lung
with senescent markers should be the next steps to provide a better characterization between
MAO-A and cellular senescence. Also genomics to see the expression of MAO-A at the mRNA
levels in cells and tissues at different PD/age would give important insights how theses process
are linked.
Moreover, genetically engineered MRC5 to induce overexpression of MAO-A as also its
inhibition through shRNA would give new models to categorize better the effects of MAO-A in
cellular senescence.
Also, work should be done regarding to the monoamine oxidase B to check if does or
does not follow the same patterns regarding to the link between MAO-A and cellular
senescence.
At last but not least, experiments with mice should be an available option. If mice
treated with clorgyline had an effect in their longevity, such finding would definitely boost this
field of research
Much works still needs to be done but the perspective are enormous.
MAO-A inhibitors including Clorgyline are already in use, not just in research but also in
clinical trials for treatments of mood, sleep, aggressiveness disorders. Combine this
therapeutically potential with one described as anti-ageing (because fighting senescence is the
same as fighting age) is the same to unite the good of two worlds
MAO-A inhibition in MRC5 leads, even in a slightly way, to a decrease of senescent
markers, a decrease in ROS, and a somewhat extension of lifespan of the population, alleviating
senescent phenotype. This decrease in the senescent phenotype is probably due to the break of
feedback positive loop between ROS production, DNA damage and permanent DNA damage
response.
Despite just a slightly decrease in senescent phenotype on the model studied, is
undeniable that MAO-A has a role in cellular senescence and it is a question of time until MAO-
A research is focused on this cellular pathway.

43
Acknowledgments
I would like to offer my special thanks to Dr Joao Passos for accepting me in and
enthusiastic encouragement for this research work. Also I would like to thank all my
colleagues from the Passos lab for their advice, training, patience and support during this
project.
I would also like to thank the European Union and the University of Coimbra through
the Erasmus Programme for providing the mobility and funding and so, allowing me to pursue
my dream of studying and doing this thesis abroad in the expertise field that I wanted.
To my friends, who were always with me, thanks for all your support and friendship.
Most importantly, my gratitude to my family. None of this would have been possible
without the love and support from them.
Statement of originality
I hereby declare that this submission is my own work and that all the assistance
received throughout this project has been acknowledged.

44
References
1. Otin C.L., Blasco M.A., "The Hallmarks of Aging" Cell 153, June 6, 2013
2. http://www.senescence.info/aging_definition.html
3. Austad, S. N. (1997a). Why We Age: What Science Is Discovering about the Body's Journey
through Life
4. Kowald A and Kirkwood TB. A network theory of ageing: the interactions of defective
mitochondria, aberrant proteins, free radicals and scavengers in the ageing process. Mutat Res
316: 209–236, 1996
5. [5] HAYFLICK L., "Biological Aging Is No Longer an Unsolved Problem" Ann. N.Y. Acad. Sci. 1100:
1–13 (2007)
6. Mortality patterns suggest lack of senescence in hydra. Exp Gerontol 1998; 33: 217–25
7. F. Boero, B. Aeschbach, V. Schmid (1996). "Reversing the life cycle: medusae transforming into
polyps and cell transdifferentiation in Turritopsis nutricula (Cnidaria, Hydrozoa)". Biological
Bulletin 190 (3): 302–312
8. Weinert B.T., Timiras P.S.; Invited Review: Theories of aging, J Appl Physiol VOL 95 OCTOBER
2003
9. Teixeira INDO, Guariento ME, Biology of aging: theories, mechanisms, and perspectives, Ciência
& Saúde Coletiva, 15(6):2845-2857, 2010
10. Kirkwood T.B.L, Austad S.N., "Why do we age?" Nature, vol. 408, 9 November 2000
11. Medawar PB. An Unsolved Problem in Biology. London: Lewis, 1952.
12. Williams, G. C. (1957). "Pleiotropy, natural selection, and the evolution of senescence."
Evolution 11:398-411.
13. Kirkwood, T. B. (1977). "Evolution of ageing." Nature 270(5635):301-304
14. MacArthur, R. H., and Wilson, E. O. (1967). The Theory of Island Biogeography. Princeton
University Press, Princeton
15. Robertson OH. Prolongation of the life span of Kokanee salmon (Oncorhynkus nerka kennerlyi)
by castration before beginningof gonad development. Proc Natl Acad Sci U S A 1961; 49:517–
21.
16. Austad, S. N. (1997b). "Comparative aging and life histories in mammals." Exp Gerontol 32(1-
2):23-38
17. Orgel, L. E. (1963). "The maintenance of the accuracy of protein synthesis and its relevance to
ageing." Proc Natl Acad Sci U S A 49:517-521. Harman, D. (1956). "Aging: a theory based on free
radical and radiation chemistry." J Gerontol 11(3):298-300

45
18. Campisi, J. & d’Adda di Fagagna, F. Cellular senescence: when bad things happen to good cells.
Nat. Rev. Mol. Cell. Biol. 8, 729–740 (2007)
19. Hani Rayess, Marilene B. Wang, Eri S. Srivatsan Cellular senescence and tumor suppressor gene
p16 Int J Cancer. 2012 April 15; 130(8): 1715–1725
20. Goldstein, S. (1990). "Replicative senescence: the human fibroblast comes of age." Science
249(4973):1129-1133
21. Hayflick, L., and Moorhead, P. S. (1961). "The serial cultivation of human diploid cell strains."
Exp Cell Res 25:585-621
22. Hayflick, L. (1985). "The cell biology of aging." Clin Geriatr Med 1(1):15-27
23. . Olovnikov AM (1971) Principle of marginotomy in template synthesis of polynucleotides. Dokl
Akad Nauk SSSR201:1496–1499
24. Sager R. 1991. Senescence as a mode of tumor suppression. Environ. Health Persp. 93:59–62
25. Beausejour CM, Krtolica A, Galimi F, Narita M, Lowe SW, et al. 2003. Reversal of human cellular
senescence: roles of the p53 and p16 pathways. EMBO J. 22:4212–22
26. Serrano, M., & Blasco, M. A. (2001). Putting the stress on senescence.
27. d’Adda di Fagagna, F., Teo, S. H. & Jackson, S. P. Functional links between telomeres and proteins
of the DNA-damage response. Genes Dev. 18, 1781–1799 (2004).
28. Griffith, J. D. et al. Mammalian telomeres end in a large duplex loop. Cell 97, 503–514 (1999).
29. d’Adda di Fagagna F, Reaper PM, Clay-Farrace L, Fiegler H, Carr P, et al. 2003. A DNA damage
checkpoint response in telomere-initiated senescence. Nature 426:194–98
30. Rodier F, Kim SH, Nijjar T, Yaswen P, Campisi J. 2005. Cancer and aging: the importance of
telomeres in genome maintenance. Int. J. Biochem. Cell Biol. 37:977–90
31. Fumagalli M, Rossiello F, Clerici M, Barozzi S, Cittaro D, et al. 2012. Telomeric DNA damage is
irreparable and causes persistent DNA-damage-response activation. Nat. Cell Biol. 14:355–65
32. Collins, K. & Mitchell, J. R. Telomerase in the human organism. Oncogene 21, 564–579 (2002).
33. Weng NP, Hodes RJ. 2000. The role of telomerase expression and telomere length maintenance
in human and mouse. J. Clin. Immunol. 20:257–67
34. Bodnar, A. G. et al. Extension of life span by introduction of telomerase into normal human cells
Science 279, 349–352 (1998).
35. Sedelnikova OA, Horikawa I, Zimonjic DB, Popescu NC, Bonner WM, Barrett JC. 2004. Senescing
human cells and ageing mice accumulate DNA lesions with unrepairable double-strand breaks.
Nat. Cell Biol. 6:168–70
36. Chang BD, Swift ME, Shen M, Fang J, Broude EV, Roninson IB. 2002. Molecular determinants of
terminal growth arrest induced in tumor cells by a chemotherapeutic agent. Proc. Natl. Acad.
Sci. USA 99:389–94

46
37. Blagosklonny MV. 2003. Cell senescence and hypermitogenic arrest. EMBO Rep. 4:358–62
38. Serrano M, Lin AW, McCurrach ME, Beach D, Lowe SW. 1997. Oncogenic ras provokes premature
cell senescence associated with accumulation of p53 and p16INK4a. Cell 88:593–602
39. Lin, A. W. et al. Premature senescence involving p53 and p16 is activated in response to
constitutive MEK/ MAPK mitogenic signaling. Genes Dev. 12, 3008–3019 (1998).
40. Freund A, Patil PK, Campisi J. 2011. p38MAPK is a novelDNAdamage response-independent
regulator of the senescence-associated secretory phenotype. EMBO J. 30:1536–48
41. Narita M, Nunez S, Heard E, Narita M, Lin AW, et al. 2003. Rb-mediated heterochromatin
formation and silencing of E2F target genes during cellular senescence. Cell 113:703–16
42. Bakkenist CJ, Kastan MB. 2003. DNA damage activates ATM through intermolecular
autophosphorylation and dimer dissociation. Nature 421:499–506
43. Chen, Q., Fischer, A., Reagan, J. D., Yan, L. J., & Ames, B. N. (1995). OxidativeDNAdamage and
senescence of human diploid fibroblast cells. Proceedings of the National Academic Science USA,
92, 4337–4341.
44. Blander, G., Machado De Oliveira, R., Conboy, C. M., Haigis, M., & Guarente, L. (2003). SOD1
knock down induces senescence in human fibroblasts. Journal of Biological Chemistry, 18, 18
45. von Zglinicki, T., Pilger, R., & Sitte, N. (2000). Accumulation of single-strand breaks is the major
cause of telomere shortening in human fibroblasts. Free Radical Biology and Medicine, 28 64–
74.
46. von Zglinicki, T., Saretzki, G., Docke,W., & Lotze, C. (1995). Mild hyperoxia shortens telomeres
and inhibits proliferation of fibroblasts A model for senescence? Experimental Cell Research,
220, 186–193.
47. Rebbaa, A., Zheng, X., Chou, P. M. & Mirkin, B. L. Caspase inhibition switches doxorubicin-
induced apoptosis to senescence. Oncogene 22, 2805–2811 (2003)
48. Trougakos, I. P., Saridaki, A., Panayotou, G. & Gonos, E. S. Identification of differentially
expressed proteins in senescent human embryonic fibroblasts. Mech. Ageing Dev127, 88–92
(2006).
49. Dimri GP, Lee X, Basile G, Acosta M, Scott G, Roskelley C, Medrano EE, Linskens M, Rubelj I,
Pereira-Smith O et al (1995) A biomarker that identifies senescent human cells in culture and in
aging skin in vivo. Proc Natl Acad Sci USA 92:9363–9367
50. Collado, M. & Serrano, M. The power and the promise of oncogene-induced senescence
markers. Nature Rev. Cancer 6, 472–476 (2006).
51. Hewitt, G. Jurk D. (2012) Telomeres are favored targets of a persistent DNA damage response in
ageing and stress-induced senescence nature communications 3:708
52. Sherr CJ, McCormick F (2002) The RB and p53 pathways in cancer. Cancer Cell 2, 103-112.

47
53. McConnell BB, Starborg M, Brookes S, Peters G (1998) Inhibitors of cyclin-dependent kinases
induce features of replicative senescence in early passage human diploid fibroblasts. Curr Biol
8, 351-354.
54. Bond J, Jones C, Haughton M, DeMicco C, Kipling D, Wynford- Thomas D (2004) Direct evidence
from siRNA-directed "knock down" that p16(INK4a) is required for human fibroblast senescence
and for limiting ras-induced epithelial cell proliferation. Exp Cell Res 292, 151-156.
55. Sancar A, Lindsey-Boltz LA, Unsal-Kacmaz K, Linn S (2004) Molecular mechanisms of mammalian
DNA repair and the DNA damage checkpoints. Annu Rev Biochem 73, 39-85.
56. Harvey DM, Levine AJ (1991) p53 alteration is a common event in the spontaneous
immortalization of primary BALB/c murine embryo fibroblasts. Genes Dev 5, 2375-2385
57. Stein GH, Beeson M, Gordon L (1990) Failure to phosphorylate the retinoblastoma gene product
in senescent human fibroblasts. Science 249, 666-669
58. Macip S, Igarashi M, Berggren P, Yu J, Lee SW, Aaronson SA (2003) Influence of induced reactive
oxygen species in p53 mediated cell fate decisions. Mol Cell Biol 23, 8576 -8585.
59. Macip S, Igarashi M, Fang L, Chen A, Pan ZQ, Lee SW, Aaronson SA (2002) Inhibition of p21-
mediated ROS accumulation can rescue p21-induced senescence. Embo J 21, 2180-2188.
60. Han J., Sun P. (2007) "The pathways to tumor suppression via route p38" Trends in Biochemical
Sciences, Vol.32, No.8
61. Bulavin, D.V. et al. (2004) Inactivation of the Wip1 phosphatase inhibits mammary tumorigenesis
through p38 MAPK-mediated activation of the p16(Ink4a)-p19(Arf) pathway. Nat. Genet. 36,
343–350
62. Sun, P. et al. (2007) PRAK is essential for ras-induced senescence and tumor suppression. Cell
128, 295–308
63. Colavitti, R. and Finkel, T. (2005) Reactive oxygen species as mediators of cellular senescence.
IUBMB Life 57, 277–281
64. Passos J.F., Simillion C., "Cellular senescence: unravelling complexity" AGE (2009) 31:353–363
65. Sherr C.J. DePinho R.A Cellular Senescence: Mitotic Clock or Culture Shock? Cell, Vol. 102, 407–
410, August 18, 2000
66. Jeyapalan JC, Ferreira M, Sedivy JM, Herbig U. Accumulation of senescent cells in mitotic tissue
of aging primates. Mech Ageing Dev. 2007 Jan;128(1):36-44
67. Tyner SD, Venkatachalam S, Choi J, Jones S, Donehower LA (2002) p53 mutant mice that display
early ageing associated phenotypes. Nature 415:45–53
68. Choudhury AR, Ju Z, Djojosubroto MW, Rudolph KL (2007) Cdkn1a deletion improves stem cell
function and lifespan of mice with dysfunctional telomeres without accelerating cancer
formation. Nat Genet 39:99–105

48
69. Molofsky AV, Krishnamurthy J, Sharpless NE, Morrison SJ (2006) Increasing p16INK4a expression
decreases forebrain progenitors and neurogenesis during ageing. Nature 443:448–452
70. Collado M, Gil J, Efeyan A, Guerra C, Schuhmacher AJ, Barradas M et al. Tumour biology:
senescence in premalignant tumours. Nature 2005; 436: 642
71. Braig M, Lee S, Loddenkemper C et al. Oncogene-induced senescence as an initial barrier in
lymphoma development. Nature 2005; 436: 660–5
72. Hutter, E., Unterluggauer, H., Uberall, F., Schramek, H., Jansen-Durr, P.,2002. Replicative
senescence of human fibroblasts: the role of Rasdependent signaling and oxidative stress. Exp.
Gerontol. 37, 1165–1174
73. Taylor, R.W., Barron, M.J., Kirkwood, T., Turnbull, D.M., 2003. Mitochondrial DNA mutations in
human colonic crypt stem cells J.Clin, Invest. 112, 1351–1360.
74. Liu, L., Trimarchi, J.R., Smith, P.J., Keefe, D.L., 2002. Mitochondrial dysfunction leads to telomere
attrition and genomic instability. Aging Cell. 1, 40–46
75. von Zglinicki, T., 2002. Oxidative stress shortens telomeres. Trends Biochem Sci. 27, 339–344
76. Maier, B. et al. Modulation of mammalian life span by the sho)rt isoform of p53. Genes Dev. 18,
306–319 (2004)
77. Jian Yu "Synthesis and mechanistic studies on the monoamine oxidase (MAO) catalyzed
oxidation of 1,4-disubstituted-1,2,3,6- tetrahydropyridines" August 10, 1998 Blacksburg,
Virginia
78. Cadenas E, Davies KJ. Mitochondrial free radical generation, oxidative, and aging. Free Radic Biol
Med. 2000 Aug;29(3-4):222-30
79. Villeneuve C., Frugier C.G., p53-PGC-1a Pathway Mediates Oxidative Mitochondrial Damage and
Cardiomyocyte Necrosis Induced by Monoamine Oxidase-A Upregulation: Role in Chronic Left
Ventricular Dysfunction in Mice ANTIOXIDANTS & REDOX SIGNALING Volume 00, Number 00,
2012
80. Passos J.F., Saretzki G., von Zglinicki, T "Mitochondrial Dysfunction Accounts for the Stochastic
Heterogeneity in Telomere-Dependent Senescence" PLoS Biology, May 2007, Volume 5, Issue
5, e110
81. Passos J.F, Nelson G., von Zglinicki, T. "Feedback between p21 and reactive oxygen production
is necessary for cell senescence" Mol Syst Biol. 2010;6:347
82. Lawless C., Wang C., Passos J.F “Quantitative assessment of markers for cell senescence” Exp
Gerontol. 2010 Oct;45(10):772-8
83. Acosta JC, O'Loghlen A Gil J: Chemokine signaling via the CXCR2 receptor reinforces senescence.
Cell 2008, 133:1006–1018.

49
84. Correia-Melo C, Hewitt G, Passos JF “Telomeres, oxidative stress and inflammatory factors:
partners in cellular senescence?” Longev Healthspan. 2014 Jan 16;3(1):1
85. de Lange, T., Shelterin: the protein complex that shapes and safeguards human telomeres.
Genes Dev, 2005. 19(18): p. 2100-10.
86. Grimsby J, Lan NC, Neve R, Chen K, Shih JC. Tissue distribution of human monoamine oxidase A
and B mRNA. J Neurochem 1990;55:1166–9
87. Chen K. Organization of MAO A and MAO B promoters and regulation of gene expression.
Neurotoxicology. 2004 Jan;25(1-2):31-6
88. Edelstein SB, Breakefield XO. Monoamine oxidases A and B are differentially regulated by
glucocorticoids and "aging" in human skin fibroblasts Cell Mol Neurobiol. 1986 Jun;6(2):121-50
89. Bortolato M1, Shih JC. Behavioral outcomes of monoamine oxidase deficiency: preclinical and
clinical evidence. Int Rev Neurobiol. 2011;100:13-42. doi: 10.1016/B978-0-12-386467-3.00002-
9
90. Johnston JP. Some observations upon a new inhibitor of monoamine oxidase in brain tissue.
Biochem Pharmacol. 1968 Jul;17(7):1285-97
91. Du L, Bakish D, Ravindran A, Hrdina PD (September 2004). "MAOA gene polymorphisms are
associated with major depression and sleep disturbance in males". NeuroReport 15 (13): 2097–
101
92. Meyer JH, Ginovart N, Boovariwala A, Sagrati S, Hussey D, Garcia A, Young T, Praschak-Rieder N,
Wilson AA, Houle S (November 2006). "Elevated monoamine oxidase a levels in the brain: an
explanation for the monoamine imbalance of major depression". Arch. Gen. Psychiatry 63 (11):
1209–16.
93. Maurel A, Hernandez C, Kunduzova O, Bompart G, Cambon C, Parini A, Francés B. Age-
dependent increase in hydrogen peroxide production by cardiac monoamine oxidase A in rats
Am J Physiol Heart Circ Physiol. 2003 Apr;284(4)
94. http://www.rndsystems.com/pdf/dy206.pdf