
Estudo in silico das bases moleculares …Estudo in silico das bases moleculares responsáveis pela...
110
UNIVERSIDADE FEDERAL DO RIO GRANDE DO SUL DISSERTAÇÃO DE MESTRADO Estudo in silico das bases moleculares responsáveis pela reatividade cruzada entre epitopos virais restritos ao alelo HLA-A*02:01 DINLER AMARAL ANTUNES Dissertação submetida ao Programa de Pós-Graduação em Genética e Biologia Molecular da UFRGS como requisito parcial para a obtenção do grau de Mestre. Orientador: Prof. Dr. Gustavo Fioravanti Vieira Co-orientador: Prof. Dr. José Artur Bogo Chies PORTO ALEGRE MARÇO DE 2011
Transcript of Estudo in silico das bases moleculares …Estudo in silico das bases moleculares responsáveis pela...
UNIVERSIDADE FEDERAL DO RIO GRANDE DO SUL
DISSERTAÇÃO DE MESTRADO
Estudo in silico das bases moleculares responsáveis pela
reatividade cruzada entre epitopos virais restritos ao alelo
HLA-A*02:01
DINLER AMARAL ANTUNES
Dissertação submetida ao
Programa de Pós-Graduação
em Genética e Biologia
Molecular da UFRGS como
requisito parcial para a
obtenção do grau de Mestre.
Orientador: Prof. Dr. Gustavo Fioravanti Vieira
Co-orientador: Prof. Dr. José Artur Bogo Chies
PORTO ALEGRE
MARÇO DE 2011
Este trabalho foi realizado no Núcleo de Bioinformática do Laboratório de
Imunogenética, do Departamento de Genética do Instituto de Biociências da
Universidade Federal do Rio Grande do Sul.
Apoio financeiro
CNPq – Conselho Nacional de Desenvolvimento Científico e Tecnológico
CAPES – Coordenação de Aperfeiçoamento de Pessoal de Nível Superior
Bill & Melinda Foundation (Grand Challenges Explorations - Round 2)

AGRADECIMENTOS
A personalidade de um homem, bem como seu próprio destino, são atributos multifatoriais moldados por sua
herança, pela cultura de seu povo, e pelas escolhas que realiza ao longo da vida. A despeito da possibilidade de
trilharmos nosso próprio caminho, não se pode negar a influência dos caracteres herdados, tanto em termos genéticos
quanto "ambientais". Assim sendo, neste momento de agradecimento àqueles que colaboraram com a realização deste
trabalho, não poderia deixar de agradecer à contribuição inestimável de meus pais. Além de serem os responsáveis
pela "confecção" do meu genoma, forneceram também o ambiente familiar e o exemplo de caráter, moral, perseverança,
dignidade e honra. Muito obrigado, pai e mãe, por todo o apoio, amor e confiança que depositaram em mim. Vocês
são responsáveis diretos por todas as conquistas que eu vier a realizar.
Agradeço também ao meu irmão, Jonier, sobretudo pela amizade. Além do afeto fraternal, sinto grande
admiração por sua inteligência e por suas opiniões firmes, ainda que nem sempre concordantes com as minhas.
Agradeço também pelas inúmeras contribuições realizadas por ele ao longo do projeto, as quais vão desde discussões
filosóficas sobre fazer ciência, até colaborações técnicas no campo da matemática e a revisão gramatical de trechos da
dissertação.
Laura, a ti agradeço acima de tudo pelo companheirismo. És a pessoa que melhor me conhece e com quem
mais tenho gosto de partilhar o meu tempo. Obrigado por ter estado comigo durante estes seis anos, superando
obstáculos e aproveitando a vida. Tua contribuição também merece destaque, pois sem um relacionamento estável meu
desempenho no mestrado teria sido certamente prejudicado.
Agradeço ainda aos colegas de laboratório, em especial aos amigos Maurício, Marialva, Samuel,
Francis, Jader e Danieli. Além de nossa ótima convivência dentro e fora do ambiente de trabalho, eles também
fizeram importantes contribuições para este projeto, executando técnicas, discutindo resultados e sugerindo novas
abordagens. Neste contexto, também merecem destaque meus dois orientadores, Gustavo e José Artur. Muito obrigado
pela amizade, pela disponibilidade e pelo exemplo de dedicação ao trabalho e amor à pesquisa.
Por fim, agradeço a todas as demais pessoas que direta ou indiretamente colaboraram com a minha
formação. A citar, meus professores e meus colegas (tanto da graduação quanto da pós-graduação), os funcionários
da Universidade, em especial ao Elmo Cardoso (Coord. Administrativo-PPGBM), bem como meus demais amigos
e familiares. Muito Obrigado!!!

“Discovery consists of seeing what everybody has seen
and thinking what nobody has thought.”
Albert Szent-Gyorgyi (1893 – 1986)

SUMÁRIO
Abreviaturas ........................................................................................................................................................... 6
Resumo .................................................................................................................................................................... 7
Abstract ................................................................................................................................................................... 8
Capítulo I: Introdução e Objetivos ....................................................................................................................... 9
1 Introdução: ................................................................................................................................................... 10
1.1 Resposta imune humoral e resposta imune celular ............................................................................... 11
1.2 Região do MHC e a família gênica do HLA ......................................................................................... 12
1.3 Estrutura do MHC-I .............................................................................................................................. 14
1.4 Rota de apresentação de peptídeos endógenos ...................................................................................... 15
1.5 Reconhecimento pelos linfócitos T citotóxicos .................................................................................... 18
1.6 Memória imunológica ........................................................................................................................... 19
1.7 Imunidade heteróloga e reatividade cruzada ......................................................................................... 20
1.8 O Vírus da Hepatite C (HCV) ............................................................................................................... 23
1.9 Desenvolvimento de vacinas anti-HCV ................................................................................................ 25
1.10 A Bioinformática e suas aplicações à Imunologia ................................................................................ 27
1.11 Predição da estrutura tridimensional de complexos pMHC .................................................................. 29
2 Objetivos: ..................................................................................................................................................... 32
3 Capítulo II : Structural Allele-Specific Patterns Adopted by Epitopes in The MHC-I Cleft and
Reconstruction of MHC:Peptide Complexes to Cross-Reactivity Assessment - Artigo Completo
Publicado na Revista PLoS One ................................................................................................................. 33
4 Capítulo III : Structural in Silico Analysis of Cross-Genotype-Reactivity Among Naturally Occurring
HCV NS3-1073-Variants in The Context Of HLA-A*02:01 Allele - Artigo Completo Aceito para
Publicação na Revista Molecular Immunology ........................................................................................ 51
5 Capítulo IV: Discussão geral ..................................................................................................................... 78
6 Referências ................................................................................................................................................... 95
7 Anexos ......................................................................................................................................................... 100
7.1 Anexo 1: Errata submetida ao sitio da revista PLoS One. .................................................................. 101
7.2 Anexo 2: Versão editada da figura 4 (capítulo II). .............................................................................. 102
7.3 Anexo 3: Tabela com os valores preditos para a afinidade de ligação ao MHC-I. ............................. 103
7.4 Anexo 4: Valores de ASA para os peptídeos selecionados. ................................................................ 103
7.5 Anexo 5: Parâmetros das simulações (arquivos mdp). ........................................................................ 104
6
Abreviaturas
ATP _ Trifosfato de Adenosina (do inglês Adenosine Triphosphate).
CD8 _ Grupamento de Diferenciação 8 (do inglês Cluster of Differentiation 8).
cDNA _ DNA complementar (do inglês Complementary DNA).
CDR _ Regiões Determinantes de Complementaridade (do inglês Complementarity Determining Region).
CTL _ Linfócito T Citotóxico (do inglês Cytotoxic T Lymphocyte).
D1-EM-D2_ Docking 1-Energy Minimization-Docking 2.
DNA _ Ácido desoxirribonucleico (do inglês Deoxyribonucleic acid).
EM _ Minimização de Energia (do inglês Energy Minimization).
ER _ Retículo Endoplasmático (do inglês Endoplasmic Reticulum).
ERAP_ Aminopeptidase do Retículo Endoplasmático (do inglês Endoplasmic Reticulum Aminopeptidase).
HCV _ Vírus da Hepatite C (do inglês Hepatitis C Virus).
HLA _ Antígeno Leucocitário Humano (do inglês Human Leucocyte Antigen).
IC50 _ Concentração inibitória para 50% das células (do inglês Half maximal Inhibitory Concentration).
IFN _ Interferon.
MD _ Dinâmica Molecular (do inglês Molecular Dynamics).
MHC _ Complexo Principal de Histocompatibilidade (do inglês Major Histocompatibility Complex).
NK _ Células Assassinas Naturais (do inglês Natural Killer).
NMR _ Ressonância Magnética Nuclear (do inglês Nuclear Magnetic Resonance).
ORF _ Fase Aberta de Leitura (do inglês Open Reading Frame).
PAMPs _ Padrões Moleculares Associados a Patógenos (do inglês Pathogen-associated molecular patterns).
PCA _ Análise de Componentes Principais (do inglês Principal Component Analysis).
PDB _ Protein Data Bank.
PLC _ Complexo de Carregamento do Peptídeo (do inglês Peptide Load Complex).
RIC _ Resposta Imune Celular.
RIH _ Resposta Imune Humoral.
RMSD _ Desvio Quadrático Médio (do inglês Root Mean Square Deviation).
RNA _ Ácido Ribonucleico.
SI _ Sistema Imune.
TAP _ Transportador Associado ao Processamento de Antígenos (do inglês Transporter associated with Antigen Processing.
Tcm _ Células de Memória Central (do inglês Central Memory T cells).
TCR _ Receptor de Linfócitos T (do inglês T Cell Receptor).
Tem _ Células de Memória Efetora (do inglês Effector Memory T cells).
Treg _ Células T Reguladoras (do inglês Regulatory T cells).

7
Resumo
A apresentação de peptídeos endógenos pelo Complexo Principal de
Histocompatibilidade (MHC, do inglês Major Histocompatibility Complex) e seu reconhecimento
pelos Linfócitos T Citotóxicos representa a etapa final de uma importante via intracelular. Esta via
permite ao sistema imune realizar uma constante vigilância acerca do conteúdo citoplasmático de
todas as células nucleadas do organismo, sendo um mecanismo central na defesa antitumoral e
antiviral. A compreensão dos detalhes moleculares que levam um dado complexo peptídeo:MHC
(pMHC) a estimularem uma população de linfócitos é vital para o desenvolvimento de vacinas e
imunoterapias, tendo especial aplicação no entendimento da resposta imune ao Vírus da Hepatite
C (HCV, do inglês Hepatitis C Virus). Em um trabalho publicado em 2008, Paraskevi Fytili e
colaboradores avaliaram a imunogenicidade de um conjunto de variantes do epitopo
imunodominante HCV-NS31073 (CV/INGVCWTV) frente a uma população de linfócitos
previamente estimulada com o epitopo selvagem. Foram utilizadas tanto variantes naturais
quanto sintéticas, tendo sido observado uma grande variação na produção de IFN-gama pelas
células específicas contra o epitopo selvagem. O presente trabalho pretende avaliar esta
variabilidade em um nível molecular, através do uso de ferramentas de bioinformática. A prévia
identificação de padrões alelo específicos, adotados pelos epitopos na fenda do MHC, permitiu o
desenvolvimento de uma estratégia in silico para a construção de complexos pMHC, através do
uso combinado de Docking Molecular e Minimização de Energia (D1-EM-D2). Esta abordagem
inovadora foi aplicada para a construção de 10 complexos apresentando peptídeos sintéticos e
28 complexos apresentando variantes naturais, todos no contexto do alelo de MHC humano HLA-
A*02:01. A superfície destes complexos foi posteriormente avaliada quanto à topologia,
distribuição de cargas e área acessível ao solvente. Os resultados foram utilizados para agrupar
as variantes de acordo com a similaridade com o complexo apresentando o peptídeo selvagem,
sendo estes agrupamentos confrontados com os resultados previamente observados in vitro por
Fytili e colaboradores. Esta análise, corroborada pela utilização de métodos estatísticos
multivariados, permitiu evidenciar o compartilhamento de características estruturais entre os
complexos que estimulavam resposta in vitro, bem como identificar possíveis aspectos
moleculares responsáveis pela abolição da resposta imune celular contra determinadas variantes
de HCV. Este trabalho sugere a análise estrutural in silico de complexos pMHC como uma
importante ferramenta no desenvolvimento de vacinas, permitindo a predição do impacto de
mutações de escape viral e a seleção de epitopos com potencial para induzir respostas imunes
poli-específicas (cross-reactive immune responses).

8
Abstract
Recognition of the Major Histocompatibility Complex (MHC) by Cytotoxic T Lymphocytes
(CTLs) is the final step of an important intracellular pathway, responsible for presenting
endogenous peptides. This route allows the Immune System to perform a persistent surveillance
of the cytoplasmic content of all nucleated cells, being a pivotal mechanism in antiviral and
antitumoral defense. The understanding of molecular issues underlying the stimulation of a given
T cell population by a specific peptide:MHC (pMHC) complex is essential for vaccine
development, having special application to study the immunity against Hepatits C Virus (HCV). In
a recent work, Paraskevi Fytili and colleagues evaluated the immunogenicity of an HCV-NS31073
variants subset against a CTL population previously stimulated with the wild-type epitope. Both
natural and synthetic variants were used, and a large variation of IFN-gamma production by wild-
type-specific T cells was observed. In this work, we intend to evaluate this variability at molecular
level, through bioinformatics approaches. The prior identification of allele-specific patterns,
presented by epitopes in the MHC cleft, allowed the development of a strategy for in silico
construction of pMHC complexes, combining Molecular Docking and Energy Minimization (D1-
EM-D2). This innovative approach was used to build 10 complexes presenting synthetic peptides
and 28 complexes presenting naturally occurring variants, all in the context of human MHC allele
HLA-A*02:01. The molecular surface of these complexes was further evaluated regarding its
topology, electrostatic potential and Accessible Surface Area (ASA). Resulting data was used to
group the variants according to its similarity with the wild-type-presenting complex, being these
groups confronted with in vitro data, previously published by Fytili et al. This analysis,
corroborated by multivariate statistical methods, has highlighted the sharing of structural aspects
among complexes that stimulate response in vitro, as well as possible molecular issues
responsible for abrogation of cellular immune response against certain HCV variants. This work
suggests structural in silico analysis of pMHC complexes as a reliable tool for vaccine
development, affording to predict the impact of viral escape mutations and selection of epitopes
with potential to induce cross-reactive immune responses.
Capítulo I
Introdução e Objetivos

10
1 Introdução:
O conhecimento das causas que desencadeiam uma determinada doença,
bem como o entendimento dos meios pelos quais ela se dissemina na população,
tem sido uma busca constante desde os princípios de nossa civilização. Apesar das
limitações técnicas, em alguns casos o desconhecimento sobre o agente causador
não impediu que se desenvolvessem estratégias para ajudar nosso organismo a
enfrentar estes "inimigos invisíveis". O médico inglês Edward Jenner, por exemplo,
percebeu que o contato com o úbere de vacas contaminadas com uma forma branda
de varíola, chamada "Cow Pox", aparentemente protegia contra a varíola circulante
em humanos. Em maio de 1796, Jenner inoculou no braço do jovem James Phipps o
material retirado das pústulas presentes nas mãos de Sarah Nelmes, uma
camponesa que havia entrado em contato com a "Cow Pox". Este experimento é
referido como o marco inicial da imunologia como um campo da ciência e da
vacinação como uma ferramenta decisiva na prevenção de doenças infecto-
contagiosas. Mesmo desconhecendo os detalhes moleculares de seu experimento,
Jenner havia também realizado o primeiro caso descrito de imunização cruzada, uma
vez que utilizou um vírus circulante nas vacas (cowpox virus) para proteger o jovem
Phipps contra outro vírus que circulava em humanos, o smallpox virus.
Apesar do enorme avanço científico das últimas décadas e do
desenvolvimento de novas estratégias vacinais, a forma mais eficiente de vacinação
continua sendo um processo muito semelhante àquele empregado por Jenner,
utilizando partículas virais atenuadas. Isso ocorre porque vacinas contendo partículas
virais íntegras e atenuadas - conservando a capacidade de se replicar e infectar
novas células - são mais eficientes em desencadear todos os mecanismos da
resposta imune, tanto celular quanto humoral. Estratégias de vacinação utilizando
partículas virais inativadas são mais seguras, mas normalmente induzem fraca
resposta celular, a qual é imprescindível para o controle da viremia e para o
clearance viral. O desenvolvimento de novas abordagens que permitam uma
imunização mais eficiente permanece como um desafio atual na imunologia e, para
tanto, faz-se necessário um conhecimento mais detalhado acerca das moléculas
envolvidas nesses processos.
11
O presente trabalho irá se focar no Complexo Principal de
Histocompatibilidade (MHC, do inglês Major Histocompatibility Complex) uma das
moléculas chave no desenvolvimento da resposta imune celular, discutindo aspectos
estruturais envolvidos tanto no reconhecimento de um alvo viral, quanto na
estimulação de imunidade cruzada. Esta revisão bibliográfica abordará brevemente
as células, moléculas e mecanismos envolvidos na resposta imune celular. Também
será apresentado o Vírus da Hepatite C (HCV, do inglês Hepatitis C Virus), patógeno
que representa um dos maiores desafios da atualidade para o desenvolvimento de
vacinas e que foi utilizado como modelo em nosso estudo. Por último, será
apresentada uma breve revisão sobre o desenvolvimento de vacinas anti-HCV, e as
contribuições que a bioinformática pode oferecer a este campo.
1.1 Resposta Imune Humoral e Resposta Imune Celular
O Sistema Imune (SI) envolve diversos tipos de células e moléculas, sendo
tão versátil e complexo que, para fins didáticos, é normalmente dividido em várias
categorias. A divisão entre Imunidade Natural e Imunidade Adquirida é um dos mais
importantes exemplos deste tipo de divisão didática. A Imunidade Natural é
constituída por barreiras físicas e químicas, bem como por células com capacidade
fagocítica. Diz respeito a um conjunto de medidas de defesa evolutivamente mais
antigo. Embora eficiente na maioria dos casos, esta linha de defesa tem uma série de
limitações, especialmente no que se refere a mecanismos capazes de se adaptar a
grande variabilidade dos patógenos. A Imunidade Adquirida, por sua vez, é uma
inovação que surge com os vertebrados trazendo justamente a capacidade de gerar
respostas imunes adaptadas aos novos alvos com os quais o hospedeiro entra em
contato. Ela também traz a importante capacidade de gerar e conservar uma
memória imunológica, permitindo ao organismo estar preparado para futuros
encontros com o mesmo agente. Estas duas linhas de defesa, natural e adquirida,
utilizam conjuntos independentes de células e moléculas, mas é importante ressaltar
que são na verdade vias complementares dentro de um esquema global que está
presente nos vertebrados.
Do mesmo modo, as respostas desencadeadas pela Imunidade Adquirida
podem ser didaticamente divididas em Resposta Imune Humoral (RIH) e Resposta
Imune Celular (RIC). A RIH diz respeito à produção de anticorpos (imunoglobulinas)
12
pelos Linfócitos B, enquanto a resposta imune celular diz respeito à estimulação dos
Linfócitos T Citotóxicos (CTLs, do inglês Cytotoxic T Lymphocyte). Novamente, esta
divisão didática não reflete a intensa complementariedade que une estas duas vias
durante as etapas de uma resposta in vivo. O sucesso na supressão de uma infecção
viral, por exemplo, só é possível se houver a contribuição combinada de ambas as
vias. A produção de anticorpos específicos contra o patógeno e sua liberação na
corrente sanguínea permite uma constante vigilância, neutralizando imediatamente
partículas virais que estejam na circulação. No entanto, após ter infectado sua célula
alvo a partícula viral está protegida, inacessível à ação dos anticorpos. A resposta
celular, por outro lado, é capaz de identificar as células infectadas através da
interação direta com moléculas em sua membrana plasmática, desencadeando assim
uma resposta citotóxica capaz de eliminar as células que estavam sendo utilizadas
para a replicação do vírus. Os detalhes sobre como ocorre este reconhecimento das
células infectadas, bem como sobre as principais moléculas envolvidas, serão
apresentados a seguir.
1.2 A Região do MHC e a família gênica do HLA
A região mais polimórfica do genoma humano se encontra no braço curto do
cromossomo 6 (6p21.3), sendo referida como Região do MHC (Horton et al., 2004;
Vandiedonck & Knight, 2009). Não obstante, esta região também abriga a porção
mais densa do genoma em número de genes, alcançando em alguns trechos a média
de 8.5 genes por 100 Kb (Vandiedonck & Knight, 2009; Xie et al., 2003). Tamanha
variabilidade certamente reflete a importância desta região, estando amplamente
envolvida com a resposta imune e tento sido implicada na suscetibilidade a diversas
doenças, sobretudo doenças infecciosas e autoimunes (Vandiedonck & Knight, 2009).
Esta região recebeu o nome de Complexo Principal de Histocompatibilidade por seu
envolvimento com aloreatividade, contexto em que foi descoberta na década de 40
(Snell, 1986). A função fisiológica das moléculas codificadas por esta região, no
entanto, não apresenta relação direta com histocompatibilidade.
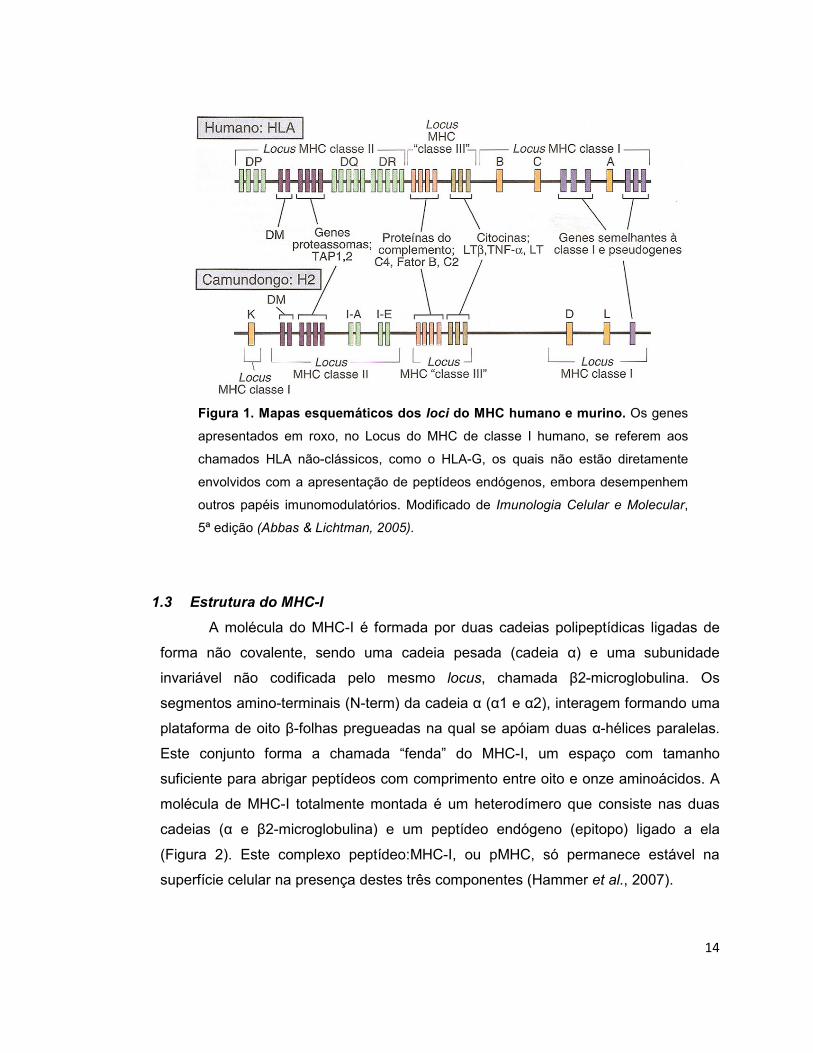
A região do MHC pode ser dividida em três loci: Locus do MHC de classe I,
Locus do MHC de classe II e Locus do MHC de classe III (Figura 1). Enquanto o
Locus do MHC de classe III codifica citocinas e proteínas do Sistema Complemento,
os dois primeiros Loci estão envolvidos com a apresentação de peptídeos (Horton et
13
al., 2004). Estas regiões codificam não apenas a molécula apresentadora em si, que
em humanos recebe o nome de Antígeno Leucocitário Humano (HLA, do inglês
Human Leukocyte Antigen), mas também outras proteínas envolvidas na geração
destes peptídeos (ex.: subunidades do proteossomo e da TAP). As moléculas do HLA
de classe I (ou MHC-I) representam a etapa final da chamada rota de apresentação
de peptídeos endógenos, a qual será detalhada na próxima sessão. Em linhas gerais,
esta rota está presente em todas as células nucleadas do organismo e permite uma
espécie de vigilância acerca do conteúdo citoplasmático destas células. As moléculas
do HLA de classe II (ou MHC-II), por sua vez, fazem parte da via de apresentação de
peptídeos exógenos, estando presente apenas em células com capacidade fagocítica
(Kelley et al., 2005).
O Locus do MHC de classe I pode ainda ser subdividido em genes clássicos e
não-clássicos. Os genes clássicos, HLA-A, HLA-B e HLA-C, codificam a cadeia
pesada do complexo responsável pela apresentação de peptídeos endógenos na
superfície das células (Kelley et al., 2005). Este locus abriga grande parte da
variabilidade encontrada na região do MHC, uma vez que existem mais de 1.519,
2.069 e 1.016 alelos descritos para os genes HLA-A, HLA-B e HLA-C,
respectivamente (IMGT/HLA-http://hla.alleles.org/nomenclature/stats.html). Este
grande número de alelos é provável fruto de seleção positiva atuando sobre a região
do MHC, no sentido da manutenção de sua variabilidade (Piertney & Oliver, 2006).
Cada alelo de MHC possui afinidade por um conjunto específico de peptídeos e,
assim sendo, um dado peptídeo só será apresentado no contexto de alguns alelos de
MHC (Cao et al., 2001). Indivíduos ou populações com maior variabilidade nestes
genes podem identificar e processar um número maior de antígenos patogênicos,
sendo potencialmente melhor sucedidos em uma ampla gama de desafios
imunológicos.
14
Figura 1. Mapas esquemáticos dos loci do MHC humano e murino. Os genes
apresentados em roxo, no Locus do MHC de classe I humano, se referem aos
chamados HLA não-clássicos, como o HLA-G, os quais não estão diretamente
envolvidos com a apresentação de peptídeos endógenos, embora desempenhem
outros papéis imunomodulatórios. Modificado de Imunologia Celular e Molecular,
5ª edição (Abbas & Lichtman, 2005).
1.3 Estrutura do MHC-I
A molécula do MHC-I é formada por duas cadeias polipeptídicas ligadas de
forma não covalente, sendo uma cadeia pesada (cadeia α) e uma subunidade
invariável não codificada pelo mesmo locus, chamada β2-microglobulina. Os
segmentos amino-terminais (N-term) da cadeia α (α1 e α2), interagem formando uma
plataforma de oito β-folhas pregueadas na qual se apóiam duas α-hélices paralelas.
Este conjunto forma a chamada “fenda” do MHC-I, um espaço com tamanho
suficiente para abrigar peptídeos com comprimento entre oito e onze aminoácidos. A
molécula de MHC-I totalmente montada é um heterodímero que consiste nas duas
cadeias (α e β2-microglobulina) e um peptídeo endógeno (epitopo) ligado a ela
(Figura 2). Este complexo peptídeo:MHC-I, ou pMHC, só permanece estável na
superfície celular na presença destes três componentes (Hammer et al., 2007).

15
Figura 2. Estrutura do heterodímero peptídeo:MHC-I. A molécula de MHC-I
está representada no modo ribbon e as cores identificam as cadeias α (azul) e β2-
microglobulina (roxo). A estrutura do epitopo está representada no formato ball &
stick e as cores identificam os átomos de oxigênio (vermelho), nitrogênio (azul) e
carbono (cinza). Ligações dissulfeto, essenciais para a estabilidade do complexo,
também são representadas (amarelo). Figura obtida com o pacote UCSF Chimera
(Pettersen et al., 2004).
1.4 Rota de apresentação de peptídeos endógenos
O sistema imune é normalmente retratado como um verdadeiro exército,
pronto para atacar ao menor sinal do “inimigo”. No entanto, a atuação do sistema
imune é muito mais sutil e constante do que aquela representada por um exército em
prontidão. A definição de quais são os “inimigos” também é muito mais complexa do
que pode sugerir uma análise superficial. A microbiota intestinal, por exemplo,
compreende uma complexa combinação de mais de 1014 bactérias, cujo crescimento
16
descontrolado levaria a uma série de patologias. A simples eliminação destes
“invasores”, no entanto, teria um efeito igualmente dramático sobre a saúde do
hospedeiro. Assim sendo, uma cuidadosa vigilância deve ser mantida, tolerando as
espécies comensais e eliminando - ou controlando - as espécies patogênicas. Esse
objetivo é alcançado por uma ação conjunta de mecanismos da Imunidade Natural e
da Imunidade Adquirida, dentre os quais se destacam a identificação de PAMPs (do
inglês Pathogen-associated molecular patterns), ação citotóxica e secretora das
células Natural Killer (NK), produção de anticorpos secretados nas mucosas (IgA) e a
ação imunoreguladora das células dendríticas (Di Santo et al., 2010; Tezuka &
Ohteki, 2010).
A manutenção da homeostase intestinal, apesar de se destacar pela
complexidade, não é o único item que exige atenção permanente do sistema imune.
Na verdade, todas as células do organismo merecem atenção, uma vez que podem
ser alvo de infecções ou foco inicial no desenvolvimento de tumores. Um dos
exemplos mais claros desta vigilância global realizada pelo SI é a chamada rota de
apresentação de peptídeos endógenos, também conhecida como via do MHC de
classe I. Esta via está presente em todas as células nucleadas do organismo,
atuando como uma espécie de “controle de qualidade” do conteúdo citoplasmático.
As principais proteínas envolvidas nesta rota também são codificadas por
genes localizados na região do MHC. Entre eles destacam-se as seqüências
codificadoras de um complexo enzimático com atividade proteásica - o proteossomo -
e do Transportador Associado ao Processamento de Antígenos (TAP). Uma amostra
de todas as proteínas celulares é marcada pelo processo de ubiquitinação o que as
direciona para o proteossomo. Este complexo é formado por um núcleo central (20S)
altamente conservado e por subunidades regulatórias (19S ou 11S). A subunidade
19S tem alta afinidade pela ubiquitina, sendo ainda capaz de realizar o
desdobramento, ATP dependente, da proteína ubiquitinada, direcionando a
sequência de aminoácidos semi-desnaturada para a região central do complexo
(Wang & Maldonado, 2006). No núcleo a proteína será digerida, liberando ubiquitinas
que serão reaproveitadas e peptídeos menores que serão transportados pela TAP
para o Retículo Endoplasmático (ER, do inglês Endoplasmic Reticulum). Os cortes do
proteossomo irão gerar com exatidão a extremidade carbóxi-terminal (C-term) dos
epitopos apresentados pelo MHC-I. Mais do que isso, existe uma verdadeira
17
“sintonia” entre proteossomo, TAP e MHC em termos de afinidade em C-term por um
aminoácido (ou um grupo físico-químico), sendo esta semelhança provável fruto da
co-evolução destes que são passos decisivos dentro de uma mesma rota (Paulsson,
2004). A extremidade N-term, no entanto, não é gerada pelo proteossomo, e os
peptídeos transportados pela TAP sofrerão ainda um desbastamento amino-terminal
– por proteases do ER, como ERAP - antes de serem enfim carregados na cadeia
nascente do MHC-I (Falk & Rotzschke, 2002).
O encaixe do epitopo na fenda do MHC é realizado por um Complexo de
Carregamento do Peptídeo (PLC, do inglês Peptide Loading Complex) que, além das
duas cadeias do MHC-I recém sintetizado, envolve uma série de chaperonas do ER
e moléculas acessórias, destacando-se as proteínas calnexina, Bap31, ERp57,
tapasina e a própria TAP (Purcell & Elliott, 2008). Complexos pMHC estáveis são
então reunidos em vesículas exocíticas e transportados através do Complexo de
Golgi até a superfície da membrana celular (Peaper & Cresswell, 2008).
Os peptídeos apresentados são derivados de proteínas endógenas à célula,
podendo ser tanto provenientes de proteínas citosólicas próprias quanto de proteínas
pertencentes a parasitas intracelulares. Proteínas defeituosas, truncadas ou com
problemas no dobramento (misfolded proteins) também são alvos de ubiquitinação,
tendo seus peptídeos apresentados na superfície da célula. Deste modo, o
reconhecimento dos complexos pMHC é a etapa final de uma rota de apresentação
que possui um importante papel no controle de patologias celulares, sobretudo na
imunidade contra tumores e na defesa antiviral (Hansen & Bouvier, 2009).
Cabe ainda ressaltar que o papel do MHC-I não está restrito à via clássica de
apresentação de peptídeos endógenos. Justamente por sua importância no controle
de infecções, esta via teve que ser flexibilizada para contornar os mais diversos
mecanismos de escape desenvolvidos pelos patógenos, transformando-se assim em
um complexo conjunto de rotas que convergem para a apresentação de peptídeos
aos linfócitos T CD8+ (Blanchard & Shastri, 2010). A própria restrição do MHC-I à
apresentação de peptídeos endógenos foi recentemente questionada, após a
descrição de uma rota alternativa na qual peptídeos derivados de proteínas exógenas
são apresentados no contexto de MHCs de classe I. Este mecanismo, batizado de
apresentação cruzada (cross-presentation), possui um papel central na atividade das
células dendríticas, permitindo que antígenos capturados na periferia sejam utilizados
18
para a seleção clonal de linfócitos T nos órgãos linfóides secundários (Amigorena &
Savina, 2010). A descoberta desta rota alternativa corrobora a necessidade de uma
compreensão mais detalhada sobre a interação TCR/pMHC, a medida que abre
novas possibilidades para o desenvolvimento de vacinas antivirais e antitumorais
(Win et al., 2011).
1.5 Reconhecimento pelos Linfócitos T Citotóxicos
Os linfócitos T CD8+ sofrem um rígido processo de seleção no timo onde,
mediante competição por estímulos, linfócitos não responsivos são negligenciados e
morrem. Linfócitos altamente auto-reativos são negativamente selecionados,
restando potencialmente uma população de linfócitos cujo Receptor de Célula T
(TCR, do inglês T Cell Receptor) possui apenas moderada ou baixa afinidade por
peptídeos próprios (Sohn et al., 2007). Este processo gera células capazes de
reconhecer peptídeos não-próprios, apresentados no contexto de MHCs de classe I
próprios. O reconhecimento de complexos apresentando peptídeos não-próprios, na
superfície de uma célula da periferia, desencadeia uma serie de mecanismos que, em
linhas gerais, levam a eliminação da célula alvo.
O receptor de células T é um heterodímero formado por uma cadeia α e uma
cadeia β ou, alternativamente, uma cadeia γ e uma δ. Dentro de cada uma dessas
cadeias existem três sítios hipervariáveis, conhecidos como regiões determinantes de
complementaridade (CDRs, do inglês Complementarity Determining Region), os quais
realizam o contato direto com resíduos do peptídeo e da molécula de MHC (Brehm et
al., 2004).
A formação do complexo TCR/pMHC é auxiliada pela interação de uma série
de moléculas acessórias cuja função é estabilizar e prolongar a interação com a
célula alvo, permitindo o reconhecimento e a consequente estimulação do linfócito T
(Chen et al., 2009; Rudolph et al., 2006). Dentre os co-receptores envolvidos nesse
processo destaca-se a molécula CD8, uma proteína das células T que se liga a
região não variável do MHC-I (região α3) e, juntamente com o TCR, transduz os
sinais que iniciam a ativação do CTL (do inglês Cytotoxic T Lymphocyte). Este
processo, desencadeado pela interação de algumas poucas moléculas, culmina com
a formação de uma região de interação tão densa e complexa - constituída por vários
19
conjuntos TCR/pMHC e moléculas acessórias - que recebe o nome de sinapse
imunológica (Saito et al., 2010; Thauland & Parker, 2010).
Uma análise mais profunda das vias de sinalização intracelular
desencadeadas durante a sinapse imunológica fogem ao escopo desta revisão
(Smith-Garvin et al., 2009), mas faz-se importante ressaltar que existe uma fina
regulação dessa interação, a qual pode desencadear diferentes níveis de estimulação
do linfócito (van der Merwe & Dushek, 2010). Dentre as atividades desencadeadas
pelo reconhecimento de um conjunto de complexos pMHC pode-se citar a secreção
de citosinas, a expansão clonal, a secreção de conteúdo citotóxico, a diferenciação e
o processo de anergia (Nel, 2002). Não obstante, uma conseqüência deste contato
pode ser a geração de linfócitos T de memória, mecanismo central na resposta imune
adaptativa e com especial importância para o desenvolvimento de vacinas (Seder et
al., 2008). Após sofrer infecção por um determinado vírus, ou ser vacinado, inicia-se
no organismo uma resposta imunológica que deverá eliminar o agente e gerar células
de memória. O advento de um segundo contato, com o mesmo agente, reativa estas
células de memória que, sendo específicas para o vírus infectante, guiarão uma
resposta rápida e eficaz, impedindo que o vírus desencadeie seu efeito patológico
sobre o organismo infectado.
1.6 Memória Imunológica
A memória imunológica é uma propriedade exclusiva do sistema imune
adquirido. Linfócitos T e B pré-ativados, com a ajuda de células dendríticas e
linfócitos T auxiliares (T helper), proliferam e diferenciam-se em resposta à uma
infecção primária, permanecendo no hospedeiro em títulos altos mesmo após a
resolução da infecção (Welsh et al., 2004). Células de memória conferem proteção
imediata e geram respostas secundárias mais rápidas e intensas que as respostas
primárias.
Com relação a resposta humoral, a proteção imediata é conferida por células
secretoras de longa duração, as quais estão presentes na medula óssea e
permanecem secretando anticorpos independentemente da presença do antígeno.
Esta atividade mantém níveis constantes de anticorpos circulantes no soro e nos
fluídos corporais. Um novo contato com o antígeno leva a rápida proliferação de

20
linfócitos B de memória, levando a um aumento no número de plasmócitos e a uma
importante elevação nos níveis de anticorpos circulantes (Sallusto et al., 2010).
Uma estratégia semelhante é utilizada pela resposta imune celular. Proteção
imediata é conferida por linfócitos T efetores de memória (Tem), que permanecem em
circulação ou alojados nos tecidos. Estas células realizam a vigilância periférica e são
capazes de desencadear ações efetoras imediatas, caso ocorra o reconhecimento do
antígeno na superfície de células infectadas. A presença do antígeno também
desencadeia a ativação de células T de memória central (Tcm), as quais circulam nos
tecidos linfóides secundários e podem proliferar rapidamente em resposta a
antígenos apresentados por células dendríticas (Sallusto et al., 2010).
Apenas uma pequena fração das células estimuladas durante a infecção
primária sobrevive na forma de células de memória. Estas células se mantêm em
níveis relativamente constantes mesmo na ausência do antígeno que desencadeou a
resposta, podendo permanecer viáveis, teoricamente, por toda a vida do organismo.
A sobrevivência destas células é determinada pelos níveis de determinadas citocinas,
liberadas em nichos específicos, as quais regularão o tamanho do estoque de
memória (memory pool).
Ainda existem muitas questões a serem respondidas sobre o funcionamento
da memória imunológica, mas foi o conhecimento básico de suas funções que nos
permitiu evoluir no desenvolvimento de vacinas (Sallusto et al., 2010). Apesar das
dificuldades e do número relativamente baixo de vacinas efetivamente aprovadas
para o uso em humanos, estima-se que em breve uma nova geração de vacinas será
desenvolvida, baseada em um melhor entendimento do sistema imune e dos detalhes
moleculares envolvidos em sua interação com os patógenos.
1.7 Imunidade Heteróloga e Reatividade Cruzada
O segundo contato com um alvo contra o qual o organismo foi previamente
imunizado leva a reativação das células de memória. No entanto, o contato com um
segundo agente – diferente daquele presente no primeiro contato – pode também
recrutar uma parte destas células de memórias, as quais serão ativadas, podendo
proteger o indivíduo contra este alvo desconhecido. Este fenômeno pelo qual um
contato prévio com um agente induz um estado de imunidade que pode conferir
21
proteção parcial contra outros imunógenos (relacionados ou não), ou afetar de
maneira significativa a resposta ao segundo alvo (causando alterações no curso da
patologia) foi denominado imunidade heteróloga.
Consideremos que respostas imunes estão sendo montadas a todo instante e
que parte dos linfócitos pré-ativados está sendo direcionada para o pool de memória.
Consideremos ainda que estas células de memória irão se ativar de forma mais
rápida e intensa que as células “virgens” e que tal ativação pode ser desencadeada
por antígenos heterólogos. Tendo em vista tais considerações, chega-se facilmente a
conclusão de que a resposta imunológica de um determinado indivíduo frente a um
determinado patógeno será seriamente influenciada pelo conjunto de infecções
sofridas por este indivíduo ao longo de sua vida (história imunológica).
Adicionalmente, pode-se concluir que a própria imunização induzida por uma
vacinação irá seguir caminhos distintos em cada indivíduo, e principalmente em
grupos étnicos independentes, tendo em vista não só a diversidade genética, mas
também a história imunológica dos indivíduos ou grupos (Welsh et al., 2010; Welsh &
Selin, 2002).
A diferenciação de linfócitos T CD8+ em células de memória não altera a
especificidade de seus TCRs, logo, a reativação deste grupo de células é dependente
do reconhecimento dos novos pMHCs, pelos mesmos TCRs das células de memória.
Considerando que infecções subseqüentes com vírus heterólogos gerarão complexos
pMHC apresentando diferentes peptídeos virais, a imunidade heteróloga só é
possível mediante um reconhecimento degenerado por parte do linfócito T. O termo
reatividade cruzada foi utilizado para definir esta capacidade de um linfócito T em
reconhecer peptídeos não relacionados, provenientes de um mesmo organismo ou
mesmo de organismos heterólogos (Welsh et al., 2010; Welsh & Fujinami, 2007).
Contrariando a visão clássica da imunologia, acredita-se que um mesmo TCR possa
reconhecer mais de um milhão de diferentes complexos pMHC (Mason, 1998) e há
cada vez mais dados corroborando a ocorrência de reconhecimento degenerado pelo
TCR (Godfrey et al., 2008; Welsh et al., 2010). Cabe ressaltar que existe uma grande
variação de especificidade no reconhecimento destes diferentes complexos pMHC,
sendo que sua interação com o TCR poderá desencadear comportamentos distintos
no linfócito T (conforme apresentado na sessão 1.5).
22
Linfócitos T são, ao mesmo tempo, específicos e poli-específicos (outro termo
empregado para se referir a reatividade cruzada). Específicos no sentido que
reconhecem apenas uma pequena fração do universo de possíveis pMHCs e poli-
específicos no sentido que esta pequena fração pode incluir complexos
completamente não relacionados, formados pela interação de diferentes alelos de
MHC com diversos peptídeos (Welsh et al., 2010). No entanto, para que consigam
estimular especificamente uma mesma população de linfócitos, pMHCs não
relacionados devem certamente compartilhar algum conjunto de características. Uma
discussão mais detalhada sobre a provável natureza destas características
compartilhadas será apresentada mais adiante.
A poli-especificidade dos TCRs é em parte fruto do próprio processo de
seleção dos linfócitos. A princípio eles devem ser positivamente selecionados no timo
ao reconhecerem, com baixa afinidade, complexos pMHC formados por peptídeos
próprios apresentados do contexto de MHCs próprios. Posteriormente, devem se
ativar na periferia ao reconhecer peptídeos não-próprios apresentados no mesmo
contexto dos MHCs próprios. A flexibilidade da estrutura do TCR também tem uma
importante contribuição para a poli-especificidade. A formação do complexo
TCR/pMHC inicia pela interação com determinadas regiões na estrutura do MHC,
normalmente na mesma orientação, o que é sucedido por mudanças conformacionais
no TCR, sobretudo na alça CDR3, buscando o melhor ajuste a este determinado
complexo pMHC. Durante este ajuste o TCR acabará também estabelecendo
interações diretas com aminoácidos do peptídeo, embora a maior parte de seu
contato continue sendo estabelecida com a própria molécula apresentadora (Welsh et
al., 2010).
Adicionalmente as características intrínsecas à estrutura do TCR e ao
processo de seleção dos linfócitos, um dos principais motivos para a ocorrência da
reatividade cruzada parece ser a limitação de espaço imposta ao sistema imune.
Cada vez que uma população de células expande, uma outra população de células
deverá ser eliminada, mantendo o número total de linfócitos relativamente estável.
Não será possível, portanto, guardar células de memória contra todos os antígenos
com os quais se teve contato sendo, neste contexto, de especial importância a
existência de células de memória poli-específicas, as quais poderão maximizar a
capacidade de resposta do estoque de memória enquanto minimizam o espaço físico

23
necessário a seu armazenamento (Selin et al., 2004; Welsh & Selin, 2002). A
reatividade cruzada está possivelmente envolvida em muitos outros mecanismos do
sistema imune, como na seleção positiva de timócitos imaturos, na indução de
autoimunidade por mimetismo molecular, na diferenciação de linfócitos e na
manutenção da memória de longo prazo (Reali et al., 1999; Regner, 2001).
Existem muitos relatos de imunidade heteróloga entre infecções por vírus não
relacionados e de autoimunidade induzida por mimetismo molecular (Sandalova et
al., 2005), bem como um amplo entendimento das implicações deste fenômeno sobre
a atividade do sistema imune (Welsh et al., 2010). No entanto, as propriedades
moleculares que possibilitam o reconhecimento cruzado de dois complexos pMHC
distintos por uma mesma população de linfócitos ainda não foram completamente
esclarecidos. Os primeiros trabalhos abordando reatividade cruzada identificaram
como alvos epitopos que compartilhavam entre si a maior parte da seqüência de
aminoácidos (Wedemeyer et al., 2001), no entanto, já foram demonstrados in vitro
alguns casos de reatividade cruzada entre epitopos que compartilhavam menos de
50% da seqüência (Clute et al., 2005). Mais recentemente, foi verificada a
contribuição das características físico-químicas dos aminoácidos (Vieira & Chies,
2005), apresentando inclusive certo sucesso ao tentar predizer a reatividade cruzada
induzida por epitopos com sequências relativamente distintas (Frankild et al., 2008). A
flexibilidade do reconhecimento pelo TCR, no entanto, parece ir além daquela
limitada pelos grupos de aminoácidos. Estudos com variantes do Vírus da Hepatite C,
por exemplo, demonstraram que mesmo trocas conservadas de aminoácidos em
sequências de epitopos imunodominantes, podem levar a completa abolição do
reconhecimento por linfócitos T específicos contra a sequência selvagem (Fytili et al.,
2008).
1.8 O Vírus da Hepatite C (HCV)
O Vírus da Hepatite C (HCV, do inglês Hepatitis C Virus), representa um sério
problema global de saúde pública, afetando cerca de 3% de toda a população
humana (Walker, 2010; Zeisel et al., 2009). A maior parte das infecções, cerca de
70% dos casos, resulta em persistência do vírus no organismo do hospedeiro, sendo
a principal causa de doença crônica do fígado, cirrose hepática e carcinoma
hepatocelular. Os demais indivíduos, menos de 30% dos casos, resolvem
24
espontaneamente a infecção, normalmente adquirindo uma imunidade protetora
contra futuras exposições ao patógeno. A resposta imune celular parece
desempenhar um papel fundamental no resultado da infecção, tendo sido associada
tanto a eliminação do vírus (clearance) quanto à imunopatologia associada ao HCV
(Thimme et al., 2002; Vertuani et al., 2002).
O HCV é um vírus envelopado com cerca de 50 nm de diâmetro, classificado
como um gênero distinto, Hepacivirus, dentro da família Flaviviridae. Seu genoma é
constituído por uma molécula de RNA, fita simples, com polaridade positiva e
contendo uma única ORF (Open Reading Frame). Esta ORF codifica uma
poliproteína com cerca de 3 mil aminoácidos, a qual é processada tanto por
proteases celulares quanto virais, dando origem a 10 proteínas maduras (Bostan &
Mahmood, 2010).
Conforme esperado para um vírus de RNA, uma enorme variabilidade
nucleotídica tem sido descrita nas sequências de HCV. A análise filogenética destas
sequências levou a uma classificação em seis genótipos, os quais foram confirmados
por uma série de estudos independentes (Bostan & Mahmood, 2010; Simmonds et
al., 2005; Simmonds et al., 1993). No entanto, o acúmulo de substituições
nucleotídicas levou a uma intensa diversificação dos vírus agrupados em cada
genótipo, levando a uma classificação em vários subtipos e quasispecies (Chayama
& Hayes, 2011).
A identificação dos diferentes genótipos é clinicamente importante por uma
série de razões. Em primeiro lugar, ela permite o ajuste da dose e da duração do
tratamento padrão, o qual faz o uso combinado de IFN-α peguilado e Ribavirina. Já
foi verificado, por exemplo, que os genótipos 1 e 4 são mais resistentes a terapias
baseadas em IFN do que os genótipos 2 e 3 (Bostan & Mahmood, 2010; Chayama &
Hayes, 2011). Em segundo lugar, as diferenças entre os genótipos podem ser
decisivas para o resultado da resposta imune celular e, consequentemente, para a
imunidade ao HCV de forma geral.
A resposta imune celular, sobretudo quando desencadeada de forma intensa
nas fases iniciais da infecção, foi associada ao controle e a erradicação do vírus.
Além disso, foram identificados alguns alvos imunodominantes na RIC, dentre os
quais se destaca o epitopo NS31073 (CV/INGVCWTV) (Hiroishi et al., 2010). No
entanto, mesmo uma limitada variação em um destes alvos imunodominantes pode

25
levar a ação defectiva de CTLs HCV-específicos, o que levaria à persistência viral e à
infecção crônica (Wedemeyer et al., 2002). Esta hipótese foi reforçada por resultados
com modelos de infecção por HCV em chimpanzés (Pan troglodytes), nos quais
animais desafiados com genótipos heterólogos de HCV mantiveram a viremia por
mais tempo e desenvolveram infecção crônica em uma taxa similar à de infecções
primárias (Prince et al., 2005).
1.9 Desenvolvimento de Vacinas anti-HCV
O HCV representa um dos maiores desafios modernos para o
desenvolvimento de vacinas. A vacinologia convencional utiliza basicamente dois
métodos: O primeiro diz respeito a atenuação de patógenos através de passagens
sequenciais in vitro, para obter cepas íntegras que possam ser utilizadas em vacinas
atenuadas, e o segundo, realiza a identificação de antígenos que possam ser
utilizados em vacinas inativadas ou de subunidades (Rappuoli, 2000). Em ambos os
casos, a etapa inicial do processo diz respeito ao cultivo do patógeno em laboratório.
O cultivo in vitro de HCV, no entanto, mostrou-se um grande desafio, o qual só foi
recentemente superado (Uprichard, 2010).
Vacinas com vírus atenuados permanecem sendo uma das mais eficientes
estratégias de imunização. Como as partículas virais utilizadas neste tipo de vacina
conservam sua capacidade de replicar e infectar novas células, elas acabam
desencadeando todos os mecanismos da imunidade antiviral, incluindo a ativação de
CTLs, a produção de anticorpos e a geração de células de memória. No entanto, este
tipo de abordagem não é viável no caso do HCV e do HIV (do inglês Human
Immunodeficiency Virus), por questões de segurança. Uma vez que a partícula
vacinal conserva sua capacidade replicativa, existe o risco de que ela sofra
recombinação com variantes selvagens do vírus, recuperando sua virulência ou até
mesmo dando origem a um novo vírus ainda mais agressivo que as variantes
conhecidas. Não obstante, ainda existe a questão da variabilidade do vírus e da
aparente falta de proteção frente a genótipos heterólogos. Considerando os pontos
previamente abordados nesta introdução, podemos antecipar o fato de que a simples
produção de uma variante atenuada de HCV não resultaria na produção de uma
vacina protetora contra todos os genótipos circulantes (Woolard & Kumaraguru,
2010).
26
Vacinas contendo partículas virais inativadas, ou apenas subunidades de um
vírus, são certamente mais seguras, uma vez que são incapazes de causar infecção
ou sofrer recombinação. Estas características também as tornam reconhecidamente
menos imunogênicas, mesmo em combinação com adjuvantes. Apesar de sua baixa
capacidade de estimular a resposta imune celular, tais vacinas podem ser utilizadas
com sucesso para estimular a produção de anticorpos neutralizantes. Em alguns
casos, a resposta humoral pode ser suficiente para proteger o organismo, mas isto
não ocorre com o HCV. Neste caso, os anticorpos neutralizantes parecem
desempenhar um papel negligenciável no controle da infecção e na prevenção de
reinfecções, sendo que indivíduos apresentando os níveis mais altos de anticorpos
acabam posteriormente desenvolvendo doença crônica (Woolard & Kumaraguru,
2010). Também neste caso, a variabilidade do vírus parece ser um dos principais
obstáculos. Em indivíduos infectados, o HCV se encontra distribuído em
quasispecies, um conjunto de variantes em constante mudança mas ainda
proximamente relacionadas. Diversificação desta população viral, associada a
demora na produção de altos títulos de anticorpos neutralizantes, permite o escape
viral e o estabelecimento da infecção crônica (Zeisel et al., 2009).
O planejamento de uma vacina eficiente também deve levar em consideração
os mecanismos de escape viral. Não por acaso, o HCV conta com um amplo arsenal
de mecanismos capazes de driblar a resposta imune do hospedeiro. Além da alta
variabilidade antigênica, que per se constitui um mecanismo de escape, o HCV é
ainda capaz de inibir a produção de IFN do tipo I e suprimir a atuação de células NK,
linfócitos T e células dendríticas. Adicionalmente, o HCV é capaz de induzir linfócitos
T regulatórios (Treg), os quais se encarregam da supressão periférica da resposta
imune (Hiroishi et al., 2010).
Tendo em vista as dificuldades encontradas para se desenvolver uma vacina
efetiva contra alguns patógenos, especialmente o HCV, e considerando que muitos
deles já possuíam genoma sequenciado, foi proposta a Vacinologia Reversa como
uma estratégia alternativa aos métodos convencionais (Rappuoli, 2000). Esta
abordagem prevê o uso de ferramentas de bioinformática para analisar o genoma do
patógeno e predizer os antígenos com maior probabilidade de se tornarem
candidatos ao uso em vacinas. Após identificado, este alvo pode ser incluído
diretamente na formulação de uma vacina de DNA. Neste caso, um fragmento de

27
cDNA contendo a informação dos antígenos selecionados é incluído na sequência de
um vetor, que pode ser um plasmídeo ou um vírus modificado, e este construto será
administrado ao indivíduo. Demonstrou-se que em modelos animais estes vetores
eram rapidamente incorporados por células do hospedeiro, levando a expressão do
antígeno e a indução da resposta imune. Apesar destes bons resultados e da grande
expectativa gerada, estudos em animais maiores não foram tão promissores, tendo
sido verificada baixa imunogenicidade das vacinas de DNA em humanos. Estudos
mais recentes tem demonstrado algum sucesso utilizando vacinas de DNA como
parte de uma estratégia de vacinação em múltiplas doses, especialmente quando
combinada com outros métodos de vacinação (Alvarez-Lajonchere & Dueñas-
Carrera, 2009; Castellanos et al., 2010; Lu, 2009).
1.10 A Bioinformática e suas aplicações à imunologia
A bioinformática é uma nova disciplina científica com raízes nas ciências da
computação, na estatística e na biologia molecular. Ela desenvolveu-se para
enfrentar os problemas referentes ao acúmulo de resultados das iniciativas de
sequenciamento de genes, que incluem uma quantidade cada vez maior de dados
sobre proteínas, DNA e RNA. A bioinformática nos fornece uma série de ferramentas
para o estudo in silico de problemas biológicos, como o alinhamento de sequências, a
modelagem de proteínas, a simulação de interações moleculares, redes gênicas e até
mesmo o estudo de rotas metabólicas.
Tendo em vista sua origem, a bioinformática pode ainda ser dividida em
Clássica, voltada à análise de sequências, e Estrutural, voltada a análise de
estruturas tridimensionais. Este segundo ramo da bioinformática é mais recente,
tendo em vista a dificuldade de se trabalhar com aspectos tridimensionais na
interpretação de fenômenos biológicos. No entanto, cabe ressaltar que a
bioinformática estrutural acabou incorporando uma série de conceitos e ferramentas
que já vinham sendo desenvolvidos nos campos da química e da física, desde a
década de 60, em uma área usualmente denominada Modelagem Molecular.
Uma importante ferramenta, muito utilizada em trabalhos de bioinformática
estrutural, é o chamado Docking, ou “Ancoramento” Molecular. Esta ferramenta vem
sendo utilizada com sucesso para realizar a complexação entre um ligante e seu
receptor ou explorar os possíveis sítios de interação (caso existentes) entre um

28
composto e uma proteína de interesse (Morris, 1998). Usualmente, são mantidas
algumas ligações flexíveis no ligante (com liberdade rotacional), enquanto o receptor
é mantido completamente rígido. Vários trabalhos descrevem o uso desta ferramenta
no design de fármacos e estudos de interação sítio-específica, colaborando para a
melhor compreensão do funcionamento de certos compostos e para o
desenvolvimento de novas drogas (Cavasotto & Orry, 2007). O docking normalmente
parte de uma estrutura previamente determinada do receptor, em muitos casos já
complexada a um determinado ligante. O procedimento de retirada do ligante,
seguida pelo docking deste mesmo ligante na fenda do receptor, é chamado
redoking. Este procedimento é normalmente utilizado para padronizar parâmetros do
docking, utilizando o cristal como controle. Por outro lado, a retirada do ligante que
estava presente no cristal, seguida por docking de um ligante diferente é chamada
cross-docking. O cross-docking representa evidentemente um desafio maior, uma vez
que o receptor, mantido rígido durante o processo de busca pela melhor conformação
do ligante, provavelmente não se encontra na conformação mais adequada para
interagir com este novo alvo.
Para refinar os modelos gerados por docking pode-se utilizar a Minimização
de Energia (EM). Esta técnica reduz a energia do sistema a um estado mínimo, no
qual não há fontes de energia externas (Morikis & Lambris, 2004). Outra ferramenta
bastante empregada em estudos estruturais é a Dinâmica Molecular (MD, do inglês
Molecular Dynamics). Este procedimento simula o comportamento da proteína de
interesse em solução aquosa, agregando energia ao sistema e permitindo a
observação de variações conformacionais. Após uma etapa de preparação do
sistema, a simulação é normalmente mantida a uma temperatura equivalente a 37ºC,
buscando mimetizar o estado desta proteína in vivo (Arnautova et al., 2009).
Conforme discutido na sessão anterior, a bioinformática também foi sugerida
como uma ferramenta para análise de sequências de patógenos e a identificação de
possíveis alvos para o desenvolvimento de vacinas. O próprio processo in vivo de
identificação de antígenos pelo sistema imune segue um conjunto de regras que
podem ser simuladas em computador. Surgiu assim uma série de preditores capazes
de simular etapas do processamento de antígenos, bem como bancos de dados
catalogando ligantes de TAP, ligantes de MHC e as características e restrições dos
alelos de MHC conhecidos. Este conjunto de aplicações da bioinformática à
29
imunologia cresceu e se diversificou rapidamente, vindo a ser referido como um novo
campo de pesquisa, a imunoinformática (Korber et al., 2006; Tomar & De, 2010).
Neste contexto também tem sido empregadas ferramentas de bioinformática
estrutural, como o docking molecular, sobretudo na predição da estrutura
tridimensional de complexos pMHC.
1.11 Predição da estrutura tridimensional de complexos pMHC
Os métodos experimentais mais utilizados para a resolução da estrutura
tridimensional de moléculas biológicas são a Cristalografia de Raio X e a
Ressonância Nuclear Magnética (NMR, do inglês Nuclear Magnetic Resonance).
Infelizmente ambos os métodos apresentam um elevado custo, além de
apresentarem uma série de limitações e demandarem muito tempo para a resolução
de cada estrutura. Algumas destas limitações tem sido contornadas por uma série de
inovações no campo da cristalografia e se acredita que o número de estruturas
resolvidas irá crescer bastante nos próximos anos (Jaskolski, 2010). Apesar dessa
expectativa otimista, a variabilidade dos sistemas biológicos está muito além da
capacidade de resolução dos métodos experimentais atuais. O locus do HLA-B, por
exemplo, possui mais de 2.069 alelos, cada um dos quais pode apresentar mais de
um milhão de peptídeos. O conhecimento da estrutura de cada um desses 2 bilhões e
sessenta e nove milhões de complexos pMHC seria do interesse da imunologia,
tendo em vista todas as questões anteriormente abordadas, mas este objetivo se
torna absolutamente inviável considerando-se as metodologias experimentais.
O PDB (do inglês Protein Data Bank) é referido como o principal repositório de
estruturas tridimensionais, possuindo hoje quase 80 mil estruturas depositadas
(Berman et al., 2000). No entanto, uma busca no IMGT/3Dstructure-DB – banco de
dados estruturais de proteínas do sistema imune, curados à partir do PDB – revela
que deste total de estruturas já determinadas, apenas 359 se referem a complexos
pMHC (Kaas et al., 2004). Se restringirmos nossa busca a um organismo específico,
ou a um determinado alelo de MHC, conseguiremos recuperar um número muito
menor de estruturas. Por exemplo, uma busca no IMGT/3Dstructure-DB pelo alelo de
MHC HLA-A2*02:01, o mais frequente nas populações humanas
(http://www.allelefrequencies.net/), nos retorna apenas cerca de 125 estruturas, das
quais muitas ainda apresentam o mesmo peptídeo (estruturas redundantes).
30
Conforme apresentado nas sessões anteriores, o conhecimento da estrutura
dos complexos pMHC é fundamental para a compreensão dos detalhes envolvidos na
regulação da resposta imune celular. Aspectos estruturais destes complexos podem
ser a base para esclarecermos fenômenos como autoimunidade, imunidade
heteróloga, resposta imune ao câncer e rejeição a transplantes. Tendo em vista as
limitações das metodologias experimentais, a predição acurada da estrutura
tridimensional de complexos pMHC se tornou um dos principais desafios no campo
da imunoinformática. Técnicas já consolidadas no campo da bioinformática estrutural,
como o docking molecular, passaram a ser empregadas neste contexto, esbarrando
inicialmente em uma série de peculiaridades do sistema pMHC.
A maioria das aplicações do docking molecular utiliza ligantes com até 10
ligações flexíveis (com liberdade rotacional) e receptores rígidos, ou apenas
parcialmente flexíveis. Ligantes com um número maior de ligações flexíveis são muito
mais difíceis de resolver, mesmo utilizando receptores completamente rígidos
(Cecchini et al., 2004; Fuhrmann et al., 2010; Kang et al., 2009). Um peptídeo típico,
com 9 aminoácidos (9-mer), possui entre 35 e 44 ligações flexíveis, número que pode
ser ainda maior de acordo com a sequência de aminoácidos do epitopo em questão.
Além disso, se utilizarmos uma única estrutura de MHC para receber qualquer
peptídeo que pode ser apresentado por este alelo (cross-docking), é preciso
considerar que as cadeias laterais na fenda do receptor não estão na conformação
mais adequada para receber todos estes ligantes, fazendo-se necessário o ajuste da
fenda para cada ligante.
Buscando contornar as dificuldades encontradas na reconstrução in silico de
complexos pMHC, muitos grupos optaram por dividir a predição da conformação do
ligante em problemas menores. Por exemplo, abordar separadamente a predição das
extremidades e da porção central, avaliar primeiro a cadeia principal e depois as
cadeias laterais, ou até mesmo calcular independentemente a conformação de cada
um dos aminoácidos do ligante (Bordner & Abagyan, 2006). Embora vários grupos
continuem estudando novas formas de abordar o problema, inclusive apresentando
algum sucesso em casos específicos, e embora também esteja sendo evidenciada a
contribuição dos métodos baseados em estrutura para a predição de ligação ao MHC,
até agora nenhuma metodologia foi capaz de reproduzir um número grande de
estruturas e tampouco se destacou como protocolo padrão para a construção in silico
31
de complexos pMHC (Bordner & Abagyan, 2006; Lafuente & Reche, 2009;
Lundegaard et al., 2010).
Em um trabalho anterior, nosso grupo sobrepôs as estruturas de epitopos
apresentados pelos alelos murinos H2-Db e H2-Kb (Antunes, 2008). Este estudo
sugeriu a existência de padrões conformacionais, compartilhados entre epitopos
apresentados por um dado alelo. Estes padrões se aplicavam sobretudo a cadeia
principal dos epitopos, enquanto as cadeias laterais sofriam um ajuste mais flexível,
determinado por características estruturais da fenda. Embora o estudo tenha
envolvido apenas dois alelos de MHC murinos, acreditamos que a existência destes
padrões possa ser extrapolada para outros alelos, inclusive humanos.
A existência de tais padrões alelo-específicos nos remete a interpretação de
que a conformação do epitopo no contexto do MHC é ativamente determinada pelo
formato da fenda deste alelo. Assim sendo, podemos antecipar que mesmo epitopos
com sequências distintas, ou cuja estrutura não foi determinada, adotarão - salvo
exceções - a mesma conformação no contexto de um dado alelo de MHC. Do mesmo
modo, o problema de predição da estrutura de complexos pMHC pode ser
simplificado para aqueles alelos em que o padrão conformacional do peptídeo já foi
determinado, uma vez que pode-se assumir esta conformação padrão para a cadeia
principal e concentrar-se na resolução das cadeias laterais do epitopo. Estas foram
as premissas que levaram ao desenvolvimento de uma nova abordagem para a
construção de complexos pMHC, a qual será apresentada no próximo capítulo. Além
de fornecer a estrutura de complexos que ainda não haviam sido determinados, esta
estratégia foi empregada para o estudo in silico da reatividade cruzada entre epitopos
de HCV, no contexto do alelo de MHC humano HLA-A*02:01.
32
2 Objetivos:
O objetivo do presente trabalho foi identificar características estruturais e
físico-químicas que possam estar envolvidas na estimulação da resposta imune, bem
como no reconhecimento cruzado de diferentes complexos pMHC por uma mesma
população de linfócitos, utilizando como modelo de estudo o alelo de MHC humano
HLA-A2*02:01.

Capítulo II
Structural allele-specific patterns adopted by epitopes in the MHC-I cleft and reconstruction of MHC:peptide complexes to cross-reactivity
assessment - Artigo completo publicado na revista PLoS One.

Structural Allele-Specific Patterns Adopted by Epitopesin the MHC-I Cleft and Reconstruction of MHC:peptideComplexes to Cross-Reactivity AssessmentDinler A. Antunes., Gustavo F. Vieira., Maurıcio M. Rigo, Samuel P. Cibulski, Marialva Sinigaglia,
Jose A. B. Chies*
Nucleo de Bioinformatica do Laboratorio de Imunogenetica, Department of Genetics, Federal University of Rio Grande do Sul, Porto Alegre, Brasil
Abstract
The immune system is engaged in a constant antigenic surveillance through the Major Histocompatibility Complex (MHC)class I antigen presentation pathway. This is an efficient mechanism for detection of intracellular infections, especially viralones. In this work we describe conformational patterns shared by epitopes presented by a given MHC allele and use thesefeatures to develop a docking approach that simulates the peptide loading into the MHC cleft. Our strategy, to construct insilico MHC:peptide complexes, was successfully tested by reproducing four different crystal structures of MHC-I moleculesavailable at the Protein Data Bank (PDB). An in silico study of cross-reactivity potential was also performed between the wild-type complex HLA-A2-NS31073 and nine MHC:peptide complexes presenting alanine exchange peptides. This indicates thatstructural similarities among the complexes can give us important clues about cross reactivity. The approach used in thiswork allows the selection of epitopes with potential to induce cross-reactive immune responses, providing useful tools forstudies in autoimmunity and to the development of more comprehensive vaccines.
Citation: Antunes DA, Vieira GF, Rigo MM, Cibulski SP, Sinigaglia M, et al. (2010) Structural Allele-Specific Patterns Adopted by Epitopes in the MHC-I Cleft andReconstruction of MHC:peptide Complexes to Cross-Reactivity Assessment. PLoS ONE 5(4): e10353. doi:10.1371/journal.pone.0010353
Editor: Anna Carla Goldberg, Albert Einstein Institute for Research and Education, Brazil
Received November 20, 2009; Accepted March 28, 2010; Published April 26, 2010
Copyright: � 2010 Antunes et al. This is an open-access article distributed under the terms of the Creative Commons Attribution License, which permitsunrestricted use, distribution, and reproduction in any medium, provided the original author and source are credited.
Funding: DAA and JABC received a CNPq (Conselho Nacional de Desenvolvimento Cientıfico e Tecnologico) grant and GFV received a CAPES (Coordenacao deAperfeicoamento de Pessoal de Nivel Superior) grant. Funded by a grant from Bill & Melinda Gates Foundation through the Grand Challenges ExplorationInitiative. The funders had no role in study design, data collection and analysis, decision to publish, or preparation of the manuscript.
Competing Interests: The authors have declared that no competing interests exist.
* E-mail: [email protected]
. These authors contributed equally to this work.
Introduction
Cytotoxic T Lymphocytes (CTLs) recognize processed peptides
presented in the context of the Major Histocompatibility Complex
(MHC) class I, on the surface of nucleated cells [1]. The presented
peptides, or epitopes, are short sequences with eight to twelve
amino acids in length. These epitopes are derived from proteins
endogenous to the cell and could derive from the cell itself or from
intracellular parasites, making this pathway an important
mechanism for antiviral defense [2]. The interaction between a
T Cell Receptor (TCR) and the MHC:peptide complex (pMHC) is
degenerated. It has been proposed that one single TCR can
recognize up to 106 different pMHCs [3]. This capacity of one
TCR to recognize different epitopes defines the phenomenon of
cross-reactivity [4].
The term ‘‘heterologous immunity’’ is used to describe a partial
immunity induced against a pathogen through the host immunization
with a non-related pathogen or antigen. This phenomenon, directly
related to the mechanism of cross-reactivity, depends on the
immunological history of the host and, consequently, on memory
lymphocytes. Heterologous immunity can be involved in situations as
diverse as pathogen clearance, chronic viral infection or autoimmunity
induction [5]. There are several reports of heterologous immunity
among non-related viruses and also reports on autoimmunity induced
by molecular mimicry [6,7,8], but the mechanisms that establish such
cross-reactions have not been completely solved [4]. Most studies on
cross-reactivity are focused on very similar epitopes that share almost
all amino acids [9]. However, cross-reactivity in vitro was already
observed between epitopes that share less than 40% of their linear
amino acid sequences [10]. Therefore, we need to look beyond the
linear amino acid sequences to study or predict cross recognition
between peptides. It is important to evaluate structural and chemical
features such as amino acids physicochemical characteristics of the
peptide [11], topology and electrostatic potential of the MHC:peptide
complex [7,8].
The HLA-A2-restricted NS31073 epitope (CI/VNGVCWTV) is
one of the main targets of the CTL response against Hepatitis C
Virus (HCV) and has been also reported in cross-reactivity events
[9,12,13]. In a work published in 2008, Fytili and colleagues
investigated the relevance of each amino acid position of this
epitope, for T cell recognition [13]. They tested alanine exchange
peptides against NS31073-specific CD8+ T cells and found that
even single amino acid changes could almost completely abolish
the production of interferon-a by wild-type-specific T cells.
Molecular docking, as a bioinformatic tool, has been success-
fully used to both perform the complexation between a ligand and
its receptor as well as to explore possible sites of interaction
between a given compound and one protein of interest [14]. There
have been several works describing the use of molecular docking in
drug design, not only contributing to a better understanding of the
PLoS ONE | www.plosone.org 1 April 2010 | Volume 5 | Issue 4 | e10353
functions of already described active compounds, but also adding
to the development of new ones [15]. To refine the models
generated by docking, an approach based on Energy Minimiza-
tion (EM) can be used. This technique, normally performed in
aqueous solution, induces the protein and its ligand to adopt a
more stable conformation, closer to in vivo state [16,17].
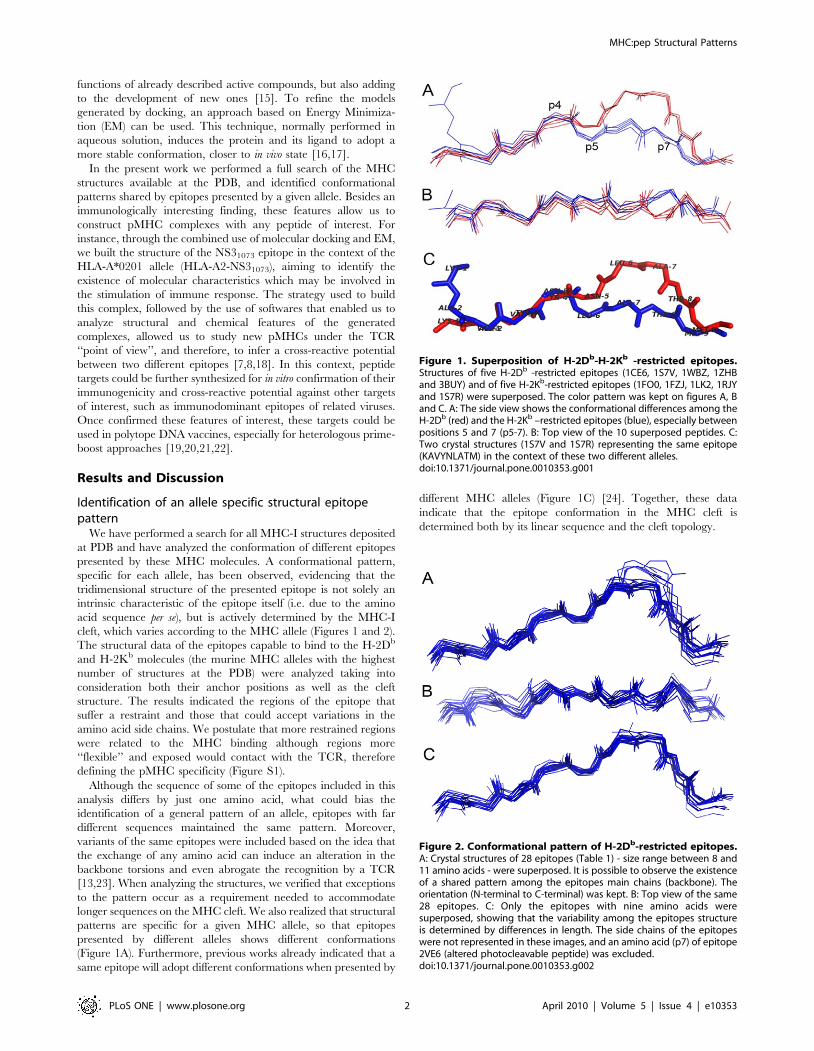
In the present work we performed a full search of the MHC
structures available at the PDB, and identified conformational
patterns shared by epitopes presented by a given allele. Besides an
immunologically interesting finding, these features allow us to
construct pMHC complexes with any peptide of interest. For
instance, through the combined use of molecular docking and EM,
we built the structure of the NS31073 epitope in the context of the
HLA-A*0201 allele (HLA-A2-NS31073), aiming to identify the
existence of molecular characteristics which may be involved in
the stimulation of immune response. The strategy used to build
this complex, followed by the use of softwares that enabled us to
analyze structural and chemical features of the generated
complexes, allowed us to study new pMHCs under the TCR
‘‘point of view’’, and therefore, to infer a cross-reactive potential
between two different epitopes [7,8,18]. In this context, peptide
targets could be further synthesized for in vitro confirmation of their
immunogenicity and cross-reactive potential against other targets
of interest, such as immunodominant epitopes of related viruses.
Once confirmed these features of interest, these targets could be
used in polytope DNA vaccines, especially for heterologous prime-
boost approaches [19,20,21,22].
Results and Discussion
Identification of an allele specific structural epitopepattern
We have performed a search for all MHC-I structures deposited
at PDB and have analyzed the conformation of different epitopes
presented by these MHC molecules. A conformational pattern,
specific for each allele, has been observed, evidencing that the
tridimensional structure of the presented epitope is not solely an
intrinsic characteristic of the epitope itself (i.e. due to the amino
acid sequence per se), but is actively determined by the MHC-I
cleft, which varies according to the MHC allele (Figures 1 and 2).
The structural data of the epitopes capable to bind to the H-2Db
and H-2Kb molecules (the murine MHC alleles with the highest
number of structures at the PDB) were analyzed taking into
consideration both their anchor positions as well as the cleft
structure. The results indicated the regions of the epitope that
suffer a restraint and those that could accept variations in the
amino acid side chains. We postulate that more restrained regions
were related to the MHC binding although regions more
‘‘flexible’’ and exposed would contact with the TCR, therefore
defining the pMHC specificity (Figure S1).
Although the sequence of some of the epitopes included in this
analysis differs by just one amino acid, what could bias the
identification of a general pattern of an allele, epitopes with far
different sequences maintained the same pattern. Moreover,
variants of the same epitopes were included based on the idea that
the exchange of any amino acid can induce an alteration in the
backbone torsions and even abrogate the recognition by a TCR
[13,23]. When analyzing the structures, we verified that exceptions
to the pattern occur as a requirement needed to accommodate
longer sequences on the MHC cleft. We also realized that structural
patterns are specific for a given MHC allele, so that epitopes
presented by different alleles shows different conformations
(Figure 1A). Furthermore, previous works already indicated that a
same epitope will adopt different conformations when presented by
different MHC alleles (Figure 1C) [24]. Together, these data
indicate that the epitope conformation in the MHC cleft is
determined both by its linear sequence and the cleft topology.
Figure 1. Superposition of H-2Db-H-2Kb -restricted epitopes.Structures of five H-2Db -restricted epitopes (1CE6, 1S7V, 1WBZ, 1ZHBand 3BUY) and of five H-2Kb-restricted epitopes (1FO0, 1FZJ, 1LK2, 1RJYand 1S7R) were superposed. The color pattern was kept on figures A, Band C. A: The side view shows the conformational differences among theH-2Db (red) and the H-2Kb –restricted epitopes (blue), especially betweenpositions 5 and 7 (p5-7). B: Top view of the 10 superposed peptides. C:Two crystal structures (1S7V and 1S7R) representing the same epitope(KAVYNLATM) in the context of these two different alleles.doi:10.1371/journal.pone.0010353.g001
Figure 2. Conformational pattern of H-2Db-restricted epitopes.A: Crystal structures of 28 epitopes (Table 1) - size range between 8 and11 amino acids - were superposed. It is possible to observe the existenceof a shared pattern among the epitopes main chains (backbone). Theorientation (N-terminal to C-terminal) was kept. B: Top view of the same28 epitopes. C: Only the epitopes with nine amino acids weresuperposed, showing that the variability among the epitopes structureis determined by differences in length. The side chains of the epitopeswere not represented in these images, and an amino acid (p7) of epitope2VE6 (altered photocleavable peptide) was excluded.doi:10.1371/journal.pone.0010353.g002
MHC:pep Structural Patterns
PLoS ONE | www.plosone.org 2 April 2010 | Volume 5 | Issue 4 | e10353

During the peptide loading process, the epitope is induced to
adopt an adequate conformation and to do so, some features
specific for each MHC allele are required. Most of these features
had already been discussed in literature, but they have not as yet
been directly related to conformational patterns of the presented
epitopes. For instance, the differences between peptides restricted
to H2-Db and H2-Kb can be partially explained based on the
pattern of hydrogen bounds generated between the peptide and
the MHC molecule in each allele [25] and the presence of a
tryptophan residue (Trp73), in the Db molecule [26] (Figure 3).
The Alpha-2 domain (a2) of MHC-I molecules is constituted by
two segments of a-helix joined by a little loop that protrudes from
the cleft. We verified that in most cases the peptide backbone
follows the a2 structure, having a bulge at the C-terminal, in the
same region of the bulged coil. Part of this bulge is probably
induced by the presence of a tryptophan residue (Trp147) in the
a2 domain that is highly conserved in several MHC alleles. H2-
Db-restricted epitopes have an even higher bulge at C term (p6-8)
because this allele has a second tryptophan residue (Trp73), in the
same region, but from the a1 domain. These two residues almost
close the cleft, forcing the peptide to pass above them (Figure S2).
An alignment of all entire sequences of H2-Db, H2-Kb and HLA-
A*0201 available at PDB, has revealed the presence of the
Trp147 in all sequences of these alleles. All the sequences of H2-
Db also have the Trp73 residue. The H2-Kb sequences have
serine in position 73 of a chain. The absence of the tryptophan
results in a deeper cleft in this region. Besides, we verified that in
some cases (e.g. 1LK2) the serine residue at this site also
establishes an hydrogen bound with the epitope at p5, that is one
of the anchor positions of the H2-Kb epitopes (data not shown).
In the HLA-A*0201 allele, the residue at position 73 is a
threonine (Thr73) and does not seem to be involved in any
hydrogen bond with the epitope. However, this allele has another
highly conserved residue (Asp77) that establishes H bonds with
the epitope C-terminal.
A main conformation for the backbone residues of the 9-mer
peptides restricted to the human allele HLA-A*0201 was also
identified in our work (Figure S3), although when compared to
murine described patterns, a greater divergence was observed.
Interestingly, most of the divergent peptides are cancer related
and, as already discussed in the literature, cancer related peptides
present great conformational variation [27]. Deviation of the
allele-specific pattern may not prevent the presentation on this
allele, but might interfere either in the stability of the complex or
in CTL stimulation. According to that, there is at least one
example of deviation from the pattern and reduction of TCR
recognition. Buslepp and colleagues published a paper on the
crystal structures of three HLA-A2:peptide complexes [28]. One of
them was an agonist (1I7U) of the TCR and the others were
described as null (1I7T) and antagonist peptides (1I7R). These
structures were herein superposed to other 31 HLA-A*0201-
restricted peptides and the agonist fit exactly with the described
pattern, while the other two peptides deviate from this pattern
(Figure S3).
We also looked for these conformational patterns in B*0801,
B*2705 and B*35 (Figure S3 and Table S1). We believe that the
existence of patterns could be extrapolated to other alleles, even
those of other species. However, this cannot be demonstrated now,
since the number of non-human/non-murine MHC-I structures
available is a very small.
Figure 3. Interactions between epitope and MHC cleft. A: Images of H-2Db (1CE6) and H-2Kb (1RJY) complexes are generated with Chimerapackage. Position of the complexes is indicated in the Side View Window (A1,B1,C1,D1). H-2Db-restricted peptide is depicted in red (A, B) and H-2Kb-restricted peptide is depicted in blue (C,D). MHC side chains that interact with the peptide are represented as sticks and Hydrogen bonds arerepresented as light blue lines. The MHC Alpha-1 domain (a1) and the first position of the peptide (p1) are indicated, as also some amino acid labels.doi:10.1371/journal.pone.0010353.g003
MHC:pep Structural Patterns
PLoS ONE | www.plosone.org 3 April 2010 | Volume 5 | Issue 4 | e10353
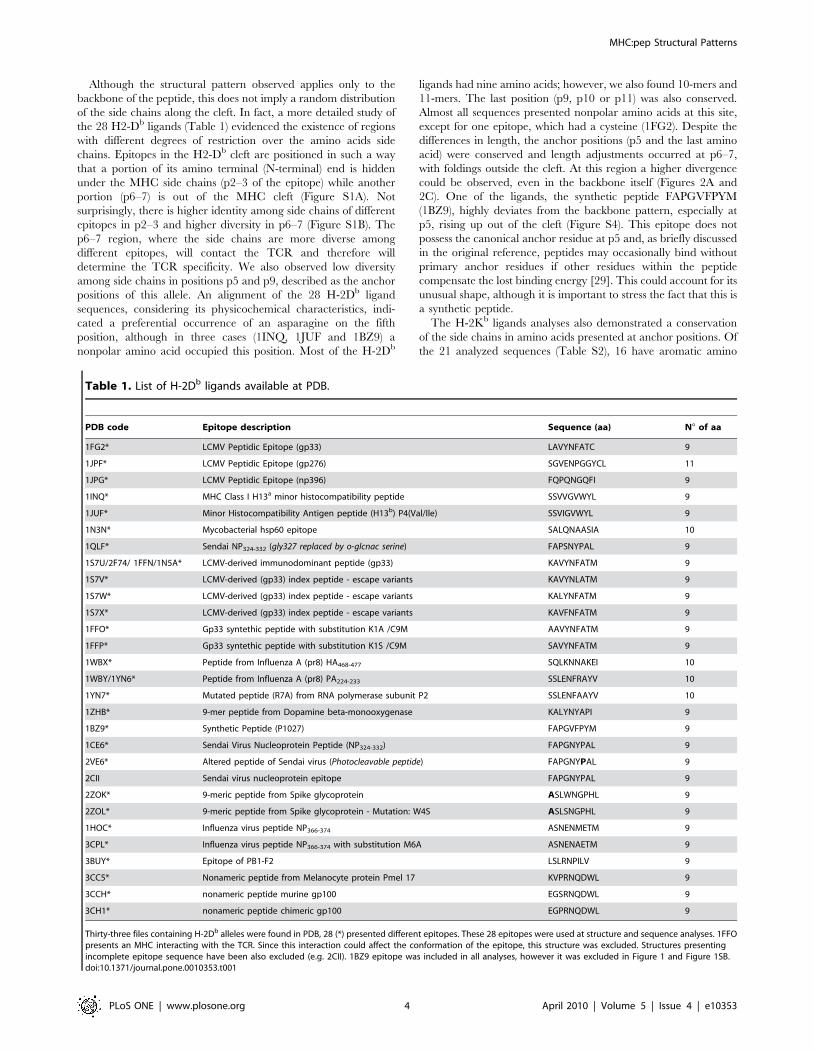
Although the structural pattern observed applies only to the
backbone of the peptide, this does not imply a random distribution
of the side chains along the cleft. In fact, a more detailed study of
the 28 H2-Db ligands (Table 1) evidenced the existence of regions
with different degrees of restriction over the amino acids side
chains. Epitopes in the H2-Db cleft are positioned in such a way
that a portion of its amino terminal (N-terminal) end is hidden
under the MHC side chains (p2–3 of the epitope) while another
portion (p6–7) is out of the MHC cleft (Figure S1A). Not
surprisingly, there is higher identity among side chains of different
epitopes in p2–3 and higher diversity in p6–7 (Figure S1B). The
p6–7 region, where the side chains are more diverse among
different epitopes, will contact the TCR and therefore will
determine the TCR specificity. We also observed low diversity
among side chains in positions p5 and p9, described as the anchor
positions of this allele. An alignment of the 28 H-2Db ligand
sequences, considering its physicochemical characteristics, indi-
cated a preferential occurrence of an asparagine on the fifth
position, although in three cases (1INQ, 1JUF and 1BZ9) a
nonpolar amino acid occupied this position. Most of the H-2Db
ligands had nine amino acids; however, we also found 10-mers and
11-mers. The last position (p9, p10 or p11) was also conserved.
Almost all sequences presented nonpolar amino acids at this site,
except for one epitope, which had a cysteine (1FG2). Despite the
differences in length, the anchor positions (p5 and the last amino
acid) were conserved and length adjustments occurred at p6–7,
with foldings outside the cleft. At this region a higher divergence
could be observed, even in the backbone itself (Figures 2A and
2C). One of the ligands, the synthetic peptide FAPGVFPYM
(1BZ9), highly deviates from the backbone pattern, especially at
p5, rising up out of the cleft (Figure S4). This epitope does not
possess the canonical anchor residue at p5 and, as briefly discussed
in the original reference, peptides may occasionally bind without
primary anchor residues if other residues within the peptide
compensate the lost binding energy [29]. This could account for its
unusual shape, although it is important to stress the fact that this is
a synthetic peptide.
The H-2Kb ligands analyses also demonstrated a conservation
of the side chains in amino acids presented at anchor positions. Of
the 21 analyzed sequences (Table S2), 16 have aromatic amino
Table 1. List of H-2Db ligands available at PDB.
PDB code Epitope description Sequence (aa) Nu of aa
1FG2* LCMV Peptidic Epitope (gp33) LAVYNFATC 9
1JPF* LCMV Peptidic Epitope (gp276) SGVENPGGYCL 11
1JPG* LCMV Peptidic Epitope (np396) FQPQNGQFI 9
1INQ* MHC Class I H13a minor histocompatibility peptide SSVVGVWYL 9
1JUF* Minor Histocompatibility Antigen peptide (H13b) P4(Val/Ile) SSVIGVWYL 9
1N3N* Mycobacterial hsp60 epitope SALQNAASIA 10
1QLF* Sendai NP324-332 (gly327 replaced by o-glcnac serine) FAPSNYPAL 9
1S7U/2F74/ 1FFN/1N5A* LCMV-derived immunodominant peptide (gp33) KAVYNFATM 9
1S7V* LCMV-derived (gp33) index peptide - escape variants KAVYNLATM 9
1S7W* LCMV-derived (gp33) index peptide - escape variants KALYNFATM 9
1S7X* LCMV-derived (gp33) index peptide - escape variants KAVFNFATM 9
1FFO* Gp33 syntethic peptide with substitution K1A /C9M AAVYNFATM 9
1FFP* Gp33 syntethic peptide with substitution K1S /C9M SAVYNFATM 9
1WBX* Peptide from Influenza A (pr8) HA468-477 SQLKNNAKEI 10
1WBY/1YN6* Peptide from Influenza A (pr8) PA224-233 SSLENFRAYV 10
1YN7* Mutated peptide (R7A) from RNA polymerase subunit P2 SSLENFAAYV 10
1ZHB* 9-mer peptide from Dopamine beta-monooxygenase KALYNYAPI 9
1BZ9* Synthetic Peptide (P1027) FAPGVFPYM 9
1CE6* Sendai Virus Nucleoprotein Peptide (NP324-332) FAPGNYPAL 9
2VE6* Altered peptide of Sendai virus (Photocleavable peptide) FAPGNYPAL 9
2CII Sendai virus nucleoprotein epitope FAPGNYPAL 9
2ZOK* 9-meric peptide from Spike glycoprotein ASLWNGPHL 9
2ZOL* 9-meric peptide from Spike glycoprotein - Mutation: W4S ASLSNGPHL 9
1HOC* Influenza virus peptide NP366-374 ASNENMETM 9
3CPL* Influenza virus peptide NP366-374 with substitution M6A ASNENAETM 9
3BUY* Epitope of PB1-F2 LSLRNPILV 9
3CC5* Nonameric peptide from Melanocyte protein Pmel 17 KVPRNQDWL 9
3CCH* nonameric peptide murine gp100 EGSRNQDWL 9
3CH1* nonameric peptide chimeric gp100 EGPRNQDWL 9
Thirty-three files containing H-2Db alleles were found in PDB, 28 (*) presented different epitopes. These 28 epitopes were used at structure and sequence analyses. 1FFOpresents an MHC interacting with the TCR. Since this interaction could affect the conformation of the epitope, this structure was excluded. Structures presentingincomplete epitope sequence have been also excluded (e.g. 2CII). 1BZ9 epitope was included in all analyses, however it was excluded in Figure 1 and Figure 1SB.doi:10.1371/journal.pone.0010353.t001
MHC:pep Structural Patterns
PLoS ONE | www.plosone.org 4 April 2010 | Volume 5 | Issue 4 | e10353
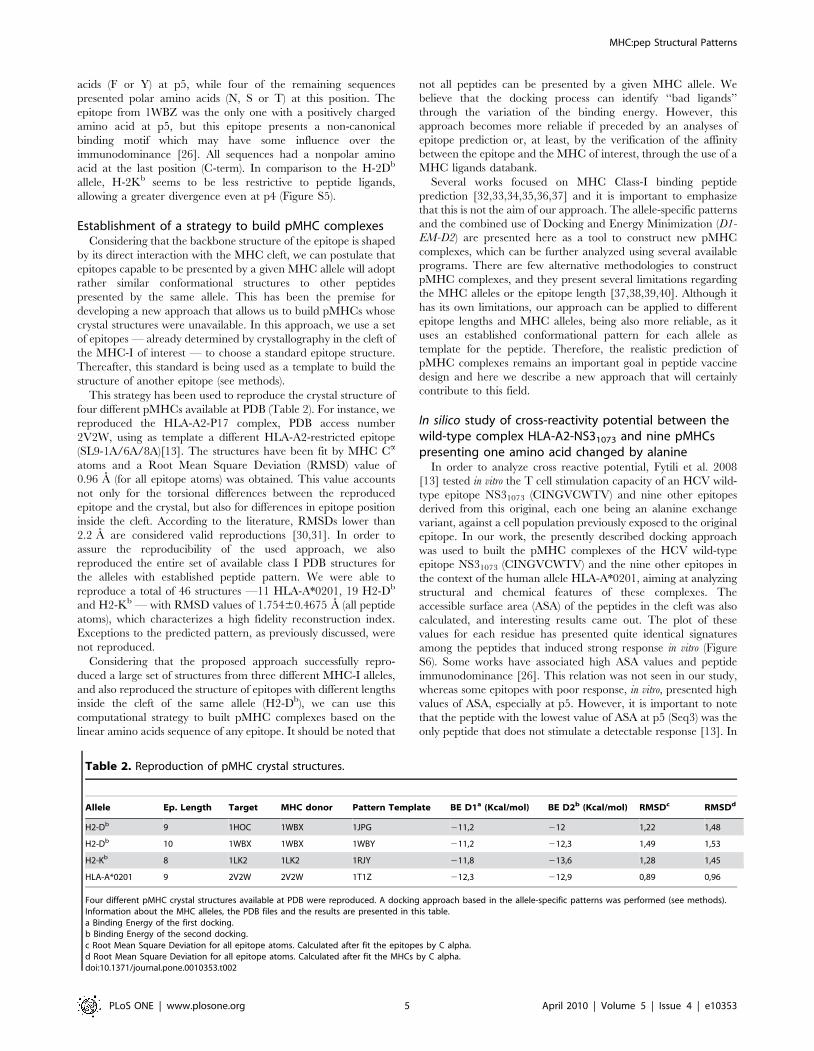
acids (F or Y) at p5, while four of the remaining sequences
presented polar amino acids (N, S or T) at this position. The
epitope from 1WBZ was the only one with a positively charged
amino acid at p5, but this epitope presents a non-canonical
binding motif which may have some influence over the
immunodominance [26]. All sequences had a nonpolar amino
acid at the last position (C-term). In comparison to the H-2Db
allele, H-2Kb seems to be less restrictive to peptide ligands,
allowing a greater divergence even at p4 (Figure S5).
Establishment of a strategy to build pMHC compIexesConsidering that the backbone structure of the epitope is shaped
by its direct interaction with the MHC cleft, we can postulate that
epitopes capable to be presented by a given MHC allele will adopt
rather similar conformational structures to other peptides
presented by the same allele. This has been the premise for
developing a new approach that allows us to build pMHCs whose
crystal structures were unavailable. In this approach, we use a set
of epitopes — already determined by crystallography in the cleft of
the MHC-I of interest — to choose a standard epitope structure.
Thereafter, this standard is being used as a template to build the
structure of another epitope (see methods).
This strategy has been used to reproduce the crystal structure of
four different pMHCs available at PDB (Table 2). For instance, we
reproduced the HLA-A2-P17 complex, PDB access number
2V2W, using as template a different HLA-A2-restricted epitope
(SL9-1A/6A/8A)[13]. The structures have been fit by MHC Ca
atoms and a Root Mean Square Deviation (RMSD) value of
0.96 A (for all epitope atoms) was obtained. This value accounts
not only for the torsional differences between the reproduced
epitope and the crystal, but also for differences in epitope position
inside the cleft. According to the literature, RMSDs lower than
2.2 A are considered valid reproductions [30,31]. In order to
assure the reproducibility of the used approach, we also
reproduced the entire set of available class I PDB structures for
the alleles with established peptide pattern. We were able to
reproduce a total of 46 structures —11 HLA-A*0201, 19 H2-Db
and H2-Kb — with RMSD values of 1.75460.4675 A (all peptide
atoms), which characterizes a high fidelity reconstruction index.
Exceptions to the predicted pattern, as previously discussed, were
not reproduced.
Considering that the proposed approach successfully repro-
duced a large set of structures from three different MHC-I alleles,
and also reproduced the structure of epitopes with different lengths
inside the cleft of the same allele (H2-Db), we can use this
computational strategy to built pMHC complexes based on the
linear amino acids sequence of any epitope. It should be noted that
not all peptides can be presented by a given MHC allele. We
believe that the docking process can identify ‘‘bad ligands’’
through the variation of the binding energy. However, this
approach becomes more reliable if preceded by an analyses of
epitope prediction or, at least, by the verification of the affinity
between the epitope and the MHC of interest, through the use of a
MHC ligands databank.
Several works focused on MHC Class-I binding peptide
prediction [32,33,34,35,36,37] and it is important to emphasize
that this is not the aim of our approach. The allele-specific patterns
and the combined use of Docking and Energy Minimization (D1-
EM-D2) are presented here as a tool to construct new pMHC
complexes, which can be further analyzed using several available
programs. There are few alternative methodologies to construct
pMHC complexes, and they present several limitations regarding
the MHC alleles or the epitope length [37,38,39,40]. Although it
has its own limitations, our approach can be applied to different
epitope lengths and MHC alleles, being also more reliable, as it
uses an established conformational pattern for each allele as
template for the peptide. Therefore, the realistic prediction of
pMHC complexes remains an important goal in peptide vaccine
design and here we describe a new approach that will certainly
contribute to this field.
In silico study of cross-reactivity potential between thewild-type complex HLA-A2-NS31073 and nine pMHCspresenting one amino acid changed by alanine
In order to analyze cross reactive potential, Fytili et al. 2008
[13] tested in vitro the T cell stimulation capacity of an HCV wild-
type epitope NS31073 (CINGVCWTV) and nine other epitopes
derived from this original, each one being an alanine exchange
variant, against a cell population previously exposed to the original
epitope. In our work, the presently described docking approach
was used to built the pMHC complexes of the HCV wild-type
epitope NS31073 (CINGVCWTV) and the nine other epitopes in
the context of the human allele HLA-A*0201, aiming at analyzing
structural and chemical features of these complexes. The
accessible surface area (ASA) of the peptides in the cleft was also
calculated, and interesting results came out. The plot of these
values for each residue has presented quite identical signatures
among the peptides that induced strong response in vitro (Figure
S6). Some works have associated high ASA values and peptide
immunodominance [26]. This relation was not seen in our study,
whereas some epitopes with poor response, in vitro, presented high
values of ASA, especially at p5. However, it is important to note
that the peptide with the lowest value of ASA at p5 (Seq3) was the
only peptide that does not stimulate a detectable response [13]. In
Table 2. Reproduction of pMHC crystal structures.
Allele Ep. Length Target MHC donor Pattern Template BE D1a (Kcal/mol) BE D2b (Kcal/mol) RMSDc RMSDd
H2-Db 9 1HOC 1WBX 1JPG 211,2 212 1,22 1,48
H2-Db 10 1WBX 1WBX 1WBY 211,2 212,3 1,49 1,53
H2-Kb 8 1LK2 1LK2 1RJY 211,8 213,6 1,28 1,45
HLA-A*0201 9 2V2W 2V2W 1T1Z 212,3 212,9 0,89 0,96
Four different pMHC crystal structures available at PDB were reproduced. A docking approach based in the allele-specific patterns was performed (see methods).Information about the MHC alleles, the PDB files and the results are presented in this table.a Binding Energy of the first docking.b Binding Energy of the second docking.c Root Mean Square Deviation for all epitope atoms. Calculated after fit the epitopes by C alpha.d Root Mean Square Deviation for all epitope atoms. Calculated after fit the MHCs by C alpha.doi:10.1371/journal.pone.0010353.t002
MHC:pep Structural Patterns
PLoS ONE | www.plosone.org 5 April 2010 | Volume 5 | Issue 4 | e10353

order to provide further evidence for the importance of the ASA
value, we also performed the construction and analysis of 28
pMHC complexes, from 6 different HCV genotypes, described by
Fytili et al. 2008. In their description, the experimental data
showed a cross-genotype-reactivity, particularly between the wild
type peptide (Peptide 1 from Genotype 1 or G1_1) and the
peptides from genotype 6 (G6_23 to G6_28). In agreement with
this data, the ASA values from genotype 6 presented the same
pattern of the wild type peptide (Figure S7) and the peptides with
higher deviation from this ‘‘ASA pattern’’ (G3_16, G3_18 and
G3_20), presented the lowest levels of IFN-c production in all
ELISPOT assays (Fytili et al. 2008). However, it is also important
to note that some peptides with low response in vitro presented
ASA values quite similar to the wild type. These results support the
idea that large deviations in ASA values may indicate a poor
stimulation in vitro, but the opposite is not true. Therefore, the
ASA values are just an indicator that may be taken into account
during a screening for possible targets, and cannot alone explain
all variation observed in vitro.
A previous work have already determined the importance of the
epitope central amino acids for the T cell recognition [5]. As
described by Fytili et al. 2008 [13], alanine exchanges at p3, p4, p5
and p7 strongly affected T cell stimulation capacity. However, the
peptide with the C6A exchange stimulated T cells at similar levels
as compared to the wild-type epitope. This is an important change
in terms of physicochemical characteristics and is quite curious
that this does not seem to affect T cell recognition. We have
analyzed the TCR-interacting surfaces of all complexes concern-
ing their topology and electrostatic potentials. The results
indicated that this C6A substitution has almost no effect in the
pMHC interacting surface (Figure 4J). In agreement with the
similar ASA values, the complexes 8, 9 and 10 presented quite
identical topologies and charge distribution. We therefore
postulate that this similarity is the main aspect responsible for
the described cross recognition of these complexes by the
CVNGVCWTV-specific CD8+ T cells [13].
Using the same dataset, the pMHC surfaces can also provide
information about the peptides that poorly stimulate the
production of interferon-a. For instance, the peptide number 5
(CIAGVCWTV) was the only out of ten peptides, in which the
tryptophan indole ring had turned to the C terminus end of the
peptide. This change of position caused not only a difference of
topology but also a reduction of a positively charged area at the
pMHC surface (Figure 4G). To ascertain that this observation was
not spurious, the steps to construct this complex were repeated
using a higher value of exhaustiveness ( = 15) at AutoDock Vina
program [31]. As discussed before, complex 3 presented the lowest
ASA value at p5, and this value reflects the existence of a less
bulging side chain at this site (Figure 4E). Analysis of the pMHCs
surface can help us predict cross reactivity potential, especially
when the complexes are very similar. However, to explain all the
variation of an immune response in terms of topology and
potential is certainly impossible. Complex 2 also has differences in
topology as compared to complex 10, but it is structurally similar
to complex 6, which stimulates an intermediated response.
Differences in other points of the antigen processing and
presentation pathway (or other related pathways) will probably
be responsible for such different capacities to induce an immune
response. For instance, we could suggest that a different stability of
those complexes could be responsible for a reduction, both in
number or in time of exposure, of those complexes on the
presenting cells surface. This would reduce the probability to
establish TCR:pMHC contacts long enough to activate the
CTLs.
In conclusion, our work provides a new approach to build up
and in silico analyze pMHCs. The structural allele-specific patterns
identified can be incorporated in other immunoinformatic
approaches, in order to provide more information about peptide
affinity for specific MHC-I alleles and the immunogenicity of the
resulting complexes. The new approach to construct pMHC-I
complexes helped us understand some of the differences in the
CD8+ CVNGVCWTV-specific response and could be applied to
other studies of cross-reactivity potential among any epitopes of
interest. As previously mentioned, these peptide targets could be
further synthesized for in vitro confirmation of their immunoge-
nicity and cross-reactive potential against other targets of interest,
such as immunodominant epitopes of related viruses. Once these
features of interest are confirmed, these targets could be used in
polytope DNA vaccines, especially for heterologous prime-boost
approaches [20,21,22].
Methods
Sequence alignmentThe sequences were analyzed using the Jalview multiple
alignment editor [41]. All sequences of each MHC allele were
separately aligned with the muscle algorithm. Epitope sequences
were aligned according to its physicochemical characteristics using
the software Bioedit 7.0.5.3. [42].
Construction of pMHC complexesThe pMHC complexes construction was performed through the
steps presented on Figure S8. First, we identified a PDB structure
(e.g. complex ‘‘A’’), wich includes the MHC allele of interest and
an epitope (template epitope ‘‘a’’) with the same number of amino
acids of the epitope that we want to model (e.g. ‘‘c’’ epitope).
Then, the structures of the MHC and the epitope (from ‘‘A’’
complex) were separated, saving the epitope structure in an
independent file that will be opened with the SPDBV 3.7 [43].
Using the Homology modelling menu of this software (SwissModel),
with Magic Fit, the FASTA sequence of the epitope to be modelled
(‘‘c’’ epitope) is superposed to the structure of the template epitope
‘‘a’’ (acquired from ‘‘A’’ complex). The ‘‘fit’’ structure of ‘‘c’’
epitope may have some atoms in energetically unfavorable
positions or amino acids with unfit torsions. These were corrected
running a short EM (nsteps = 100) with the GROMACS 3.3.3
package [44]. At this point, we have a 3D structure related to our
epitope of interest for the first time. This structure was subjected to
a first docking (Dock1) with a MHC molecule. In this step the
MHC molecule can be those from the ‘‘A’’ complex or from
another PDB file with the same MHC allele of interest. The
epitope originally presented by this ‘‘MHC donor’’ structure
should not interfere in the analysis. It is quite important to use a
PDB file with the best possible resolution. All MHC bonds are
maintained rigid during the docking, as most of the epitopes
backbone bonds, since the epitopes main chain is already in the
suitable conformation. During the docking procedure, the epitope
side chains are flexible, which allows a great conformational
variation. At this point, a 3D model of the pMHC complex is
available, but more steps are needed to refine this model. The
resulting pMHC, with the best docking result (or the most
frequent) is subjected to a longer EM (nsteps = 1000). This step is
important to adjust the MHC side chains that interact with the
new ligand, reducing unfavorable interactions. The last step is the
separation of the two components (MHC and epitope) from this
minimized complex and the use of both structures as inputs to a
second docking (Dock2) that will generate the pMHC of interest.
The second docking allows the docking program to search all over
MHC:pep Structural Patterns
PLoS ONE | www.plosone.org 6 April 2010 | Volume 5 | Issue 4 | e10353
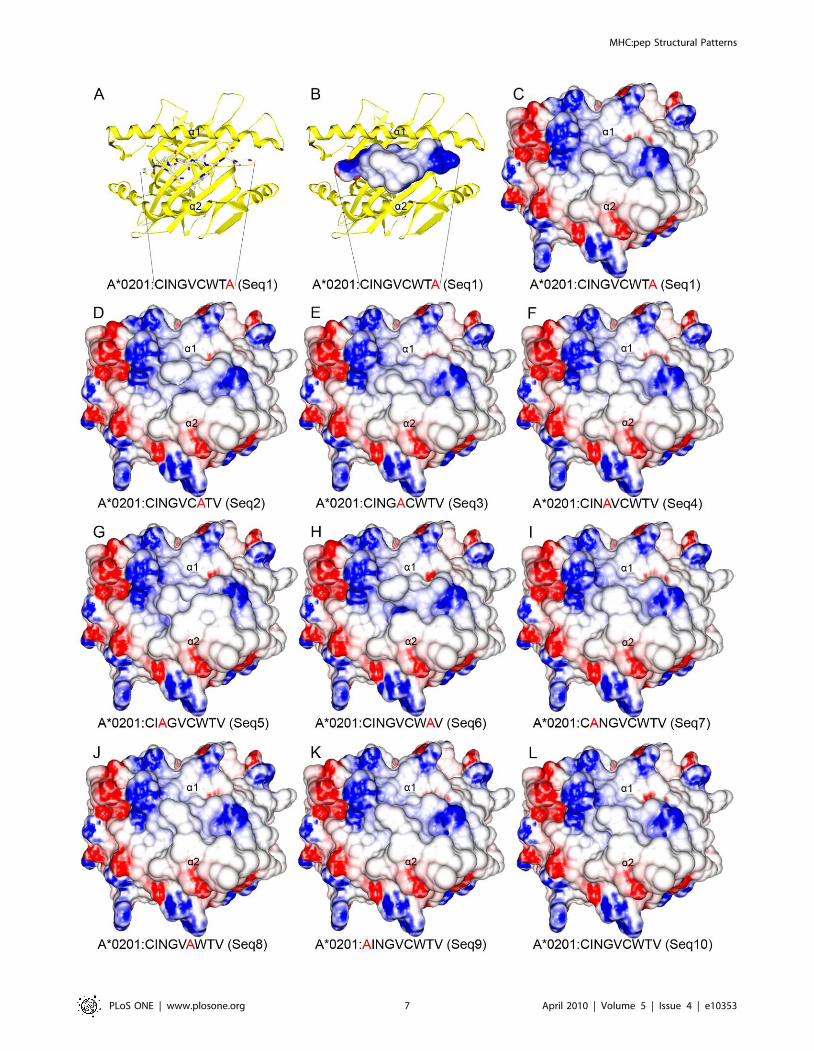
MHC:pep Structural Patterns
PLoS ONE | www.plosone.org 7 April 2010 | Volume 5 | Issue 4 | e10353

again for the best epitope conformation. The influence of pMHC
minimization over the docking results is confirmed by the
improvement of binding energies (see Table 2).
Molecular DockingThe molecular dockings were performed with AutoDock Vina
1.0.2 [31] using default values (e.g. exhaustiveness = 8). For each
epitope, the same input file was used to run AutoDock Vina 20
times, generating a final population with a thousand different
conformations (20 outputs with 50 structures each). The best
conformation of each output was open together in PyMol viewer
and was analyzed according to the frequency of occurrence and
binding energy values. One of the most frequent conformations
was selected to represent the final conformation of the epitope in
the MHC-I cleft. The running time of a simulation will vary
accordingly to the computational power used, and the number of
rotatable bonds of the epitope of interest. Using our default
configuration, the running time of each docking step (20 rounds) is
about three hours in a quad core computer (using the four cores at
full capacity) and the whole process to get a pMHC complex (D1-
EM-D2) takes about 7 hours in the same scenario.
Accessible Surface Area (ASA) analyzeThe ASA values were calculated in the NOC 3.01 program
[45]. The obtained values were plotted at the Microsoft Office
Excel 2007 software.
Construction of the HLA-A2-NS31073 complex and thenine variants
The PDB structure 2V2W was used as ‘‘MHC donor’’ and the
C chain of 1T1Z structure was used as template for the HLA-
A*0201 epitopes pattern. The ten complexes were independently
constructed and analyzed as previously described (Construction of
pMHC complexes).
Analyses of topology and charges distributionThe MHC surface analyses were performed with the GRASP2
program [46], on Windows XP platform. The electrostatic
potential was calculated with a scale from 210 to +10 kiloteslas.
Images acquisitionThe epitopes superposition was performed using SPDBV 3.7
[43], though the images were acquired with PyMOL 1.0 program
[47]. The pMHC top view images were generated with the
GRASP2 program [46]. Images of MHC:peptide interactions
were produced using the UCSF Chimera package from the
Resource for Biocomputing, Visualization, and Informatics at the
University of California, San Francisco (supported by NIH P41
RR-01081)[48]. All images were edited with Adobe Photoshop
CS2 v.9.0. program.
Supporting Information
Table S1 List of ligands used to identify HLA-restricted
patterns.
Found at: doi:10.1371/journal.pone.0010353.s001 (0.09 MB
DOC)
Table S2 List of H-2Kb ligands available at PDB.
Found at: doi:10.1371/journal.pone.0010353.s002 (0.04 MB
DOC)
Figure S1 Structural organization of the H-2Db-restricted
epitopes. A: Images of HBsAg30-39 epitope (presented in Ball and
Stick_CPK) in the cleft of the H-2Db-allele (represented as surface,
with negatively (red) and positively (blue) charged regions with a
scale from 210 to +10 kiloteslas). Partial N-terminal ending of the
epitope is hidden under MHC side chains (p2-3). Some regions of
the peptides (p6-7) protract out to the MHC cleft. B. Superposition
of 28 structures of H-2Db-restricted epitopes (Table 1), including
side chains. It is possible to observe a higher variability in the
protracted region as compared to the N-terminal and to the
anchor sites (p5 and p9). The position of the side chains of amino
acids 1, 5, 7 and 9 are shown in both images.
Found at: doi:10.1371/journal.pone.0010353.s003 (3.57 MB
TIF)
Figure S2 Topology of H2-Db and H2-Kb binding clefts. A:
Crystal structure of an H-2Db allele (PDB access code 1CE6) is
depicted as Ribbon and Surface. Epitopes inside the cleft are
depicted as Sticks. Two tryptophanes of the MHC alpha-chain
(W73 and W147) almost block the cleft, forcing the peptide to pass
above them. B: Crystal structure of an H-2Kb allele (PDB access
code 1RJY) is depicted with the same configuration. The absence
of tryptophan (W73) results in a deeper cleft in this allele.
Found at: doi:10.1371/journal.pone.0010353.s004 (4.42 MB
TIF)
Figure S3 Conformational patterns of human MHC alleles. A:
Thirty-four HLA-A*0201-restricted peptides (Table S1) were
superposed using SPDBv program. Peptides sharing an A*0201-
restricted pattern are depicted in blue. Exceptions to this pattern
are depicted in cyan. Cancer-related peptides are depicted in light
pink. Epitopes 1I7R and 1I7T are depicted in red (see Discussion).
B: Superposition of five B*0801-restricted peptides. C: Superpo-
sition of five B*2705 restricted peptides. D: Superposition of three
B*3501-restricted and two B*3508-restricted peptides. In this case,
we have not enough structures to predict a pattern. Besides that,
we can see that both B*3501-restricted 9-mers (blue) presented a
similar conformation. In addition, a 10-mer peptide (APQPAPE-
NAY) presented almost the same conformation when presented by
B*3501 (orange) and B*3508 (red). A B*3508-restricted 8-mer is
also depicted (green).
Found at: doi:10.1371/journal.pone.0010353.s005 (3.56 MB TIF)
Figure S4 Exception to the H-2Db pattern. A: The 1BZ9
epitope (red) does not have the conventional amino acid in the
anchor position (p5) and showed a significant deviation in the
main chain when compared to other epitopes. B: The side chains
of the epitope 1BZ9 (red) are in a similar conformation to other
epitopes of this allele, except in a phenylalanine at position 6 of the
epitope, which may be used as an alternative ‘‘anchor’’. Observe
the presence of an anchor amino acid in C-terminal and a hidden
Figure 4. Topology and electrostatic potential comparison among A2*0201:HCV complexes. TCR-interacting surfaces of ten differentpMHC complexes are depicted (C–L). Regions with positive (blue) and negative (red) charges are represented with a scale from 210 to +10 kiloteslas.Sequence of presented peptide is depicted above each complex and the position of the Alanine exchange is depicted in red. Alpha-1 and Alpha-2MHC domains are also indicated. Images A, B and C show the same pMHC, in the same position, size and orientation, although with differentrepresentations. TCR-interacting surfaces of complexes that stimulate high levels of IFN-c production by CVNGVCWTV-specific CD8+ T-cells (J,K and L)shared both topology and electrostatic potential. One complex that stimulates low levels of IFN-c production (G) presented differences in topologyand reduction of a negatively charged region in the TCR-interacting surface.doi:10.1371/journal.pone.0010353.g004
MHC:pep Structural Patterns
PLoS ONE | www.plosone.org 8 April 2010 | Volume 5 | Issue 4 | e10353
N-terminal extremity under the side chains of the MHC,
characteristics that may contribute to the presentation of this
unusual epitope.
Found at: doi:10.1371/journal.pone.0010353.s006 (2.86 MB TIF)
Figure S5 Structural pattern of H-2Kb restricted ligands. A:
Twenty-two epitopes (see Table S2) restricted to this allele were
superposed, four 9-mer (red) and 18 8-mer (blue). The H-2Kb
restricted ligands, just like those restricted to the H-2Db allele,
presented a higher identity in the side chains of the anchor
positions than in the side chains oriented outside of the cleft. B:
Backbone superposition of the 21 ligands shows a shared
conformation among the epitopes with the same length (8-mer).
The length adjustment, in this allele, seems to be in different
positions, when compared to the H-2Db allele.
Found at: doi:10.1371/journal.pone.0010353.s007 (2.86 MB TIF)
Figure S6 Analyze of HCV alanine exchanged peptides. The
wild type HCV derived peptide (CINGVCWTV) and nine alanine
exchanged peptides were analyzed. A: Sequences of 10 peptides
are indicated. Level of IFN-I3 production by CVNGVCWTV-
specific CD8+ T-cells, induced by each sequence, are also
represented [13]. Each bar (in black) represents the number of
the Spot Forming Units (SFU/104 cells) produced by each of the
peptides. Accessible Surface Area (ASA) plot of sequences that
stimulates low (B), intermediated (C) and high (D) IFN-cproduction are depicted. ASA values are measured in square
angstroms. The wild type sequence (S10) was included in all plots.
Found at: doi:10.1371/journal.pone.0010353.s008 (6.62 MB TIF)
Figure S7 Flowchart of a new pMHC complex construction.
ASA values of the wild type HCV derived peptide
(CVNGVCWTV) and 28 naturally occurring NS31073-variants
were analyzed. In agreement with experimental data, the ASA
values from genotype 6 presented the same pattern of the wild type
peptide and the peptides with higher deviation from this ‘‘ASA
pattern’’ (G3_16, G3_18 and G3_20), presented the lowest levels
of IFN-c production in all ELISPOT assays (Fytili et al. 2008).
Found at: doi:10.1371/journal.pone.0010353.s009 (2.15 MB TIF)
Figure S8 Flowchart of a new pMHC complex construction.
Consider an epitope ‘‘C’’ whose structure in the context of a given
MHC allele was not determined. A search at PDB is performed,
looking for a PDB file containing the allele of interest presenting
an epitope with the same length of the ‘‘c’’ epitope. In this
example, we found the ‘‘A’’ complex. Using the SPDBV program,
it was observed that the amino acid sequence of the epitope ‘‘c’’ is
‘‘Fit’’ on the 3D structure of the epitope present at the ‘‘A’’
complex. The generated structure of the epitope ‘‘c’’ is submitted
to an energy minimization (EM), and is used as input for the
docking with an ‘‘MHC donor’’ structure (B). In order to adjust
the MHC to this new epitope, an EM of the complex ‘‘D’’ is
performed. After minimization, epitope and MHC are separated
and used as inputs to a second docking, which will generate the
desired pMHC complex (E). For more information see methods.
Found at: doi:10.1371/journal.pone.0010353.s010 (2.86 MB TIF)
Acknowledgments
We thank the Centro Nacional de Supercomputacao (CESUP-RS) for allowing
access to its computational resources, and the collaboration of the Group of
Structural Bioinformatics from the Center of Biotechnology (Cbiot/
UFRGS), in sharing information about the installation of the programs. In
particular, we thank Eduarda Schultze, for the contributions about the
programs parameters and the interpretation of some data. We also thank
Paraskevi Fytili, from Hannover Medical School, for sharing data about his
work with the recognition of alanine exchange peptides by
CVNGVCWTV-specific CD8+ T-cells.
Author Contributions
Conceived and designed the experiments: GFV. Performed the experi-
ments: DAA. Analyzed the data: DAA GFV. Contributed reagents/
materials/analysis tools: MMR SPC MS. Wrote the paper: DAA JABC.
Participated in the study design and in the technical immunological aspects
of the study: JABC. Performed the bioinformatic analyses: DAA.
Conceived the study, participated in its design and coordination: GFV.
Helped to draft the manuscript: GFV. Contributed to the revision of the
manuscript: MMR. Contributed to the bioinformatic analyses: MMR.
Verified the peptides binding affinities, performed the ASA analyses, and
helped in the docking approach: SPC. Performed all the alignments and
helped to search for MHC-I structures at PDB: MS.
References
1. Yewdell JW, Bennink JR (1999) Immunodominance in major histocompatibility
complex class I-restricted T lymphocyte responses. Annu Rev Immunol 17:
51–88.
2. Welsh RM, Selin LK, Szomolanyi-Tsuda E (2004) Immunological memory to
viral infections. Annu Rev Immunol 22: 711–743.
3. Wilson DB, Wilson DH, Schroder K, Pinilla C, Blondelle S, et al. (2004)
Specificity and degeneracy of T cells. Mol Immunol 40: 1047–1055.
4. Welsh RM, Fujinami RS (2007) Pathogenic epitopes, heterologous immunity
and vaccine design. Nat Rev Microbiol 5: 555–563.
5. Welsh RM, Selin LK (2002) No one is naive: the significance of heterologous T-
cell immunity. Nat Rev Immunol 2: 417–426.
6. Ang CW, Jacobs BC, Laman JD (2004) The Guillain-Barre syndrome: a true
case of molecular mimicry. Trends Immunol 25: 61–66.
7. Sandalova T, Michaelsson J, Harris RA, Odeberg J, Schneider G, et al. (2005) A
structural basis for CD8+ T cell-dependent recognition of non-homologous
peptide ligands: implications for molecular mimicry in autoreactivity. J Biol
Chem 280: 27069–27075.
8. Apostolopoulos V, Lofthouse SA, Popovski V, Chelvanayagam G, Sandrin MS,
et al. (1998) Peptide mimics of a tumor antigen induce functional cytotoxic T
cells. Nat Biotechnol 16: 276–280.
9. Wedemeyer H, Mizukoshi E, Davis AR, Bennink JR, Rehermann B (2001)
Cross-reactivity between hepatitis C virus and Influenza A virus determinant-
specific cytotoxic T cells. J Virol 75: 11392–11400.
10. Clute SC, Watkin LB, Cornberg M, Naumov YN, Sullivan JL, et al. (2005)
Cross-reactive influenza virus-specific CD8+ T cells contribute to lymphopro-
liferation in Epstein-Barr virus-associated infectious mononucleosis. J Clin Invest
115: 3602–3612.
11. Frankild S, de Boer RJ, Lund O, Nielsen M, Kesmir C (2008) Amino acid
similarity accounts for T cell cross-reactivity and for "holes" in the T cell
repertoire. PLoS ONE 3: e1831.
12. Cucchiarini M, Kammer AR, Grabscheid B, Diepolder HM, Gerlach TJ, et al.
(2000) Vigorous peripheral blood cytotoxic T cell response during the acute
phase of hepatitis C virus infection. Cell Immunol 203: 111–123.
13. Fytili P, Dalekos GN, Schlaphoff V, Suneetha PV, Sarrazin C, et al. (2008)
Cross-genotype-reactivity of the immunodominant HCV CD8 T-cell epitope
NS3-1073. Vaccine 26: 3818–3826.
14. Morris GM, Goodsell DS, Halliday RS, Huey R, Hart WE, Belew RK, Olson AJ
(1998) Automated docking using a Lamarckian genetic algorithm and an
empirical binding free energy function. J Computational Chemistry 19.
15. Cavasotto CN, Orry AJ (2007) Ligand docking and structure-based virtual
screening in drug discovery. Curr Top Med Chem 7: 1006–1014.
16. Kmiecik S, Gront D, Kolinski A (2007) Towards the high-resolution protein
structure prediction. Fast refinement of reduced models with all-atom force field.
BMC Struct Biol 7: 43.
17. Dibrov A, Myal Y, Leygue E (2009) Computational Modelling of Protein
Interactions: Energy Minimization for the Refinement and Scoring of
Association Decoys. Acta Biotheor.
18. Rigo MM, Antunes DA, Vieira GF, Chies JAB (2009) MHC:Peptide Analysis:
Implications on the Immunogenicity of Hantaviruses N protein. Lect Notes
Comput Sci 5676: 160–163.
19. Korber B, LaBute M, Yusim K (2006) Immunoinformatics comes of age. PLoS
Comput Biol 2: e71.
20. Lu S (2009) Heterologous prime-boost vaccination. Curr Opin Immunol 21:
346–351.
MHC:pep Structural Patterns
PLoS ONE | www.plosone.org 9 April 2010 | Volume 5 | Issue 4 | e10353
21. Wang S, Kennedy JS, West K, Montefiori DC, Coley S, et al. (2008) Cross-
subtype antibody and cellular immune responses induced by a polyvalent DNAprime-protein boost HIV-1 vaccine in healthy human volunteers. Vaccine 26:
1098–1110.
22. Harari A, Bart PA, Stohr W, Tapia G, Garcia M, et al. (2008) An HIV-1 clade CDNA prime, NYVAC boost vaccine regimen induces reliable, polyfunctional,
and long-lasting T cell responses. J Exp Med 205: 63–77.23. Reali E, Guerrini R, Marastoni M, Tomatis R, Masucci MG, et al. (1999) A
single specific amino acid residue in peptide antigens is sufficient to activate
memory CTL: potential role of cross-reactive peptides in memory T cellmaintenance. J Immunol 162: 106–113.
24. Velloso LM, Michaelsson J, Ljunggren HG, Schneider G, Achour A (2004)Determination of structural principles underlying three different modes of
lymphocytic choriomeningitis virus escape from CTL recognition. J Immunol172: 5504–5511.
25. Tian F, Lv F, Zhou P, Yang Q, Jalbout AF (2008) Toward prediction of binding
affinities between the MHC protein and its peptide ligands using quantitativestructure-affinity relationship approach. Protein Pept Lett 15: 1033–1043.
26. Meijers R, Lai CC, Yang Y, Liu JH, Zhong W, et al. (2005) Crystal structures ofmurine MHC Class I H-2 D(b) and K(b) molecules in complex with CTL
epitopes from influenza A virus: implications for TCR repertoire selection and
immunodominance. J Mol Biol 345: 1099–1110.27. Borbulevych OY, Insaidoo FK, Baxter TK, Powell DJ, Jr., Johnson LA, et al.
(2007) Structures of MART-126/27-35 Peptide/HLA-A2 complexes reveal aremarkable disconnect between antigen structural homology and T cell
recognition. J Mol Biol 372: 1123–1136.28. Buslepp J, Zhao R, Donnini D, Loftus D, Saad M, et al. (2001) T cell activity
correlates with oligomeric peptide-major histocompatibility complex binding on
T cell surface. J Biol Chem 276: 47320–47328.29. Zhao R, Loftus DJ, Appella E, Collins EJ (1999) Structural evidence of T cell
xeno-reactivity in the absence of molecular mimicry. J Exp Med 189: 359–370.30. Madurga S, Belda I, Llora X, Giralt E (2005) Design of enhanced agonists
through the use of a new virtual screening method: application to peptides that
bind class I major histocompatibility complex (MHC) molecules. Protein Sci 14:2069–2079.
31. Trott O, Olson AJ (2009) AutoDock Vina: Improving the speed and accuracy ofdocking with a new scoring function, efficient optimization, and multithreading.
J Comput Chem.32. Zhang C, Anderson A, DeLisi C (1998) Structural principles that govern the
peptide-binding motifs of class I MHC molecules. J Mol Biol 281: 929–947.
33. Zen J, Treutlein HR, Rudy GB (2001) Predicting sequences and structures of
MHC-binding peptides: a computational combinatorial approach. J Comput
Aided Mol Des 15: 573–586.
34. Wulf M, Hoehn P, Trinder P (2009) Identification of human MHC class I
binding peptides using the iTOPIA- epitope discovery system. Methods Mol Biol
524: 361–367.
35. Zhang H, Lund O, Nielsen M (2009) The PickPocket method for predicting
binding specificities for receptors based on receptor pocket similarities:
application to MHC-peptide binding. Bioinformatics 25: 1293–1299.
36. Sidney J, Peters B, Frahm N, Brander C, Sette A (2008) HLA class I supertypes:
a revised and updated classification. BMC Immunol 9: 1.
37. Sieker F, May A, Zacharias M (2009) Predicting affinity and specificity of
antigenic peptide binding to major histocompatibility class I molecules. Curr
Protein Pept Sci 10: 286–296.
38. Tong JC, Tan TW, Ranganathan S (2004) Modeling the structure of bound
peptide ligands to major histocompatibility complex. Protein Sci 13: 2523–2532.
39. Bordner AJ, Abagyan R (2006) Ab initio prediction of peptide-MHC binding
geometry for diverse class I MHC allotypes. Proteins 63: 512–526.
40. Todman SJ, Halling-Brown MD, Davies MN, Flower DR, Kayikci M, et al.
(2008) Toward the atomistic simulation of T cell epitopes automated
construction of MHC: peptide structures for free energy calculations. J Mol
Graph Model 26: 957–961.
41. Waterhouse AM, Procter JB, Martin DM, Clamp M, Barton GJ (2009) Jalview
Version 2–a multiple sequence alignment editor and analysis workbench.
Bioinformatics 25: 1189–1191.
42. Hall TA (1999) Bioedit: a user-friendly biological sequence alignment editor and
analysis program for Windows 95/98/NT. Nucl Acids Symp Ser 41: 95–98.
43. Guex N, Peitsch MC (1997) SWISS-MODEL and the Swiss-PdbViewer: an
environment for comparative protein modeling. Electrophoresis 18: 2714–2723.
44. Van Der Spoel D, Lindahl E, Hess B, Groenhof G, Mark AE, et al. (2005)
GROMACS: fast, flexible, and free. J Comput Chem 26: 1701–1718.
45. ME Chen HXC, H Nymeyer NOC.
46. Petrey D, Honig B (2003) GRASP2: visualization, surface properties, and
electrostatics of macromolecular structures and sequences. Methods Enzymol
374: 492–509.
47. PyMOL. DeLano Scientific LLC.
48. Pettersen EF, Goddard TD, Huang CC, Couch GS, Greenblatt DM, et al.
(2004) UCSF Chimera–a visualization system for exploratory research and
analysis. J Comput Chem 25: 1605–1612.
MHC:pep Structural Patterns
PLoS ONE | www.plosone.org 10 April 2010 | Volume 5 | Issue 4 | e10353

44
Table S1 – List of ligands used to identify HLA-restricted patterns.
Allele PDB
code Epitope description Sequence (aa)
N° of
aa A2*0201 1JHT Peptide Ligand From The MART-1/Melan-A Mutation: A28L ALGIGILTV 9
A2*0201 1S9X NY-ESO-1 Peptide Analogue S9A SLLMWITQA 9
A2*0201 1S9Y NY-ESO-1 Peptide Analogue S9S SLLMWITQS 9
A2*0201 2VLL Flu Matrix Peptide GILGFVFTL 9
A2*0201 1I7R Peptide P1058 FAPGFFPYL 9
A2*0201 1I7T Peptide P1049-5v ALWGVFPVL 9
A2*0201 1I7U Peptide P1049-6v ALWGFVPVL 9
A2*0201 2V2W Hiv P17 SLYNTVATL 9
A2*0201 2V2X Hiv P17 SLFNTVATL 9
A2*0201 1S8D HIV Gag Peptide SLANTVATL 9
A2*0201 1T1W Hiv Gag Peptide SLFNTIAVL 9
A2*0201 1T1X Hiv Gag Peptide SLYLTVATL 9
A2*0201 1T1Y Hiv Gag Peptide SLYNVVATL 9
A2*0201 1T1Z Hiv Gag Peptide ALYNTAAAL 9
A2*0201 1T20 Hiv Gag Peptide SLYNTIATL 9
A2*0201 1T21 Hiv Gag Peptide SLYNTVATL 9
A2*0201 1B0G Peptide P1049 ALWGFFPVL 9
A2*0201 1DUZ Htlv-1 Octameric Tax Peptide LLFGYPVYV 9
A2*0201 1EEY Gp2 Peptide; Mutation: I2l,V5l,L9v ILSALVGIV 9
A2*0201 1EEZ Gp2 Peptide ILSALVGIL 9
A2*0201 1HHG Hiv-1 Gp120 Envelope Protein (Residues 195-207) TLTSCNTSV 9
A2*0201 1HHJ Hiv-1 Reverse Transcriptase (Residues 309-317 ILKEPVHGV 9
A2*0201 1TVB Epitope Of Melanocyte Protein Pmel 17 ITDQVPFSV 9
A2*0201 1TVH Epitope Of Melanocyte Protein Pmel 17 IMDQVPFSV 9
A2*0201 2GIT HTLV-1 TAX Peptide LLFGKPVYV 9
A2*0201 1QEW Protein (Melanoma-Associated Antigen 3) FLWGPRALV 9
A2*0201 1I1F Protein (Hiv-Rt Variant Peptide I1f (Flkepvhgv) FLKEPVHGV 9
A2*0201 1I1Y Hiv-Rt Variant Peptide I1y (Ylkepvhgv YLKEPVHGV 9
A2*0201 1QR1 Gp2 Peptide IISAVVGIL 9
A2*0201 2GTW Octapeptide From Melan-A/MART-1 LAGIGILTV 9
A2*0201 2GTZ Octapeptide From Melan-A/MART-1; Mutation: A28L ALGIGILTV 9
A2*0201 2GUO Native nonameric Melan-A/MART-1(27-35) peptide AAGIGILTV 9
A2*0201 3FQT Peptide 38-46 From Cell Division Cycle 25b (CDC25b) GLLGSPVRA 9
A2*0201 3FQW Peptide 1097-1105 From Insulin Receptor Substrate 2 (IRS2) RVASPTSGV 9
B*0801 1AGB Hiv-1 Gag Peptide (3r Mutation) GGRKKYKL 8
B*0801 1AGC Hiv-1 Gag Peptide (7q Mutation) GGKKKYQL 8
B*0801 1AGD Hiv-1 Gag Peptide (Index Peptide) GGKKKYKL 8
B*0801 1AGE Hiv-1 Gag Peptide (7r Mutation) GGKKKYRL 8
B*0801 1AGF Hiv-1 Gag Peptide (5r Mutation) GGKKRYKL 8
B*2705 1JGE Peptide M9 GRFAAAIAK 9
B*2705 1W0V Self-Peptide Tis From Egf-Response Factor 1 RRLPIFSRL 9
B*2705 2BSR Epstein-Barr Nuclear Antigen-6 RRIYDLIEL 9
B*2705 2BST Influenza Nucleoprotein SRYWAIRTR 9
B*2705 1HSA Model Peptide Sequence ARAAAAAAA 9
B*3501 1A9E Peptide From Ebna3c-Protein From Ebv LPPLDITPY 9
B*3501 2CIK Epitope Derived From Cytochrome P450 KPIVVLHGY 9
B*3501 2AXG 10-mer peptide from BZLF1 trans-activator protein APQPAPENAY 10
B*3508 2AXF 10-mer peptide from BZLF1 trans-activator protein APQPAPENAY 10
B*3508 3BWA Hcmv 8-Mer Peptide From The Pp65 Protein Molecule FPTKDVAL 8
Fourty-nine HLA-restricted epitopes were used to identify the epitope conformational
patterns restricted to human alleles A2*0201, B*0801, B*2705 and the supertype B*35.
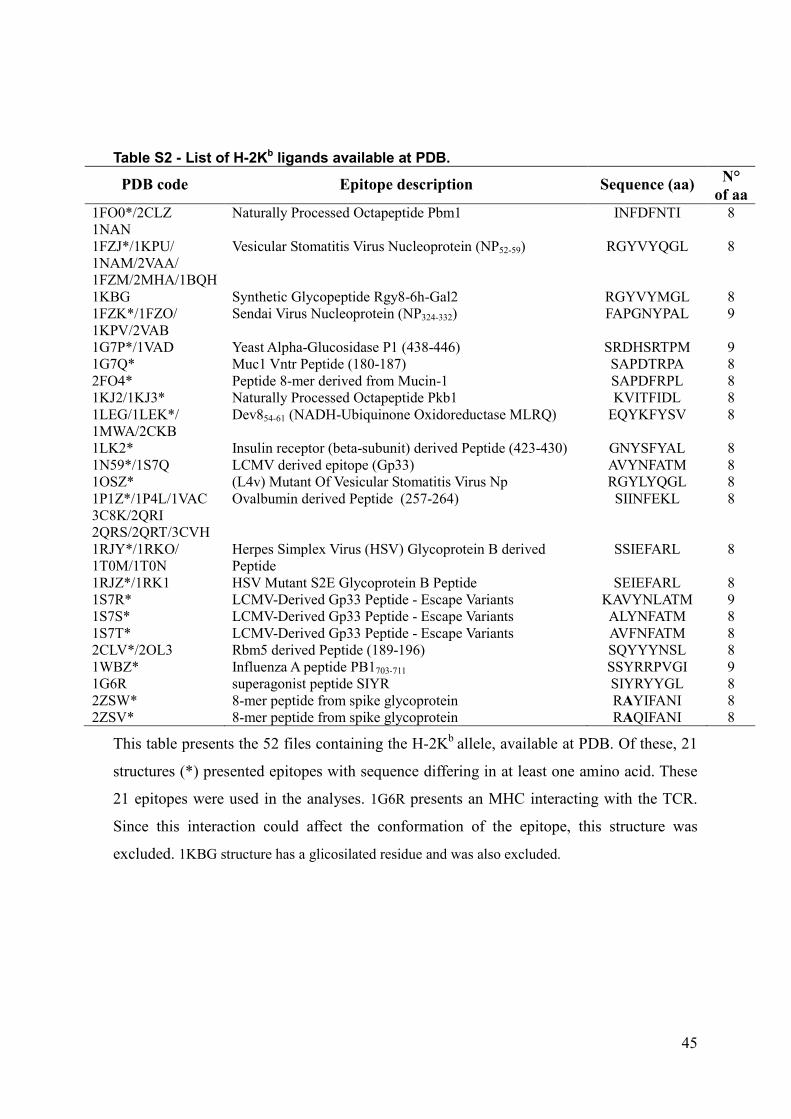
45
Table S2 - List of H-2Kb ligands available at PDB.
PDB code Epitope description Sequence (aa) N°
of aa 1FO0*/2CLZ
1NAN
Naturally Processed Octapeptide Pbm1 INFDFNTI 8
1FZJ*/1KPU/
1NAM/2VAA/
1FZM/2MHA/1BQH
Vesicular Stomatitis Virus Nucleoprotein (NP52-59) RGYVYQGL 8
1KBG Synthetic Glycopeptide Rgy8-6h-Gal2 RGYVYMGL 8
1FZK*/1FZO/
1KPV/2VAB
Sendai Virus Nucleoprotein (NP324-332) FAPGNYPAL 9
1G7P*/1VAD Yeast Alpha-Glucosidase P1 (438-446) SRDHSRTPM 9
1G7Q* Muc1 Vntr Peptide (180-187) SAPDTRPA 8
2FO4* Peptide 8-mer derived from Mucin-1 SAPDFRPL 8
1KJ2/1KJ3* Naturally Processed Octapeptide Pkb1 KVITFIDL 8
1LEG/1LEK*/
1MWA/2CKB
Dev854-61 (NADH-Ubiquinone Oxidoreductase MLRQ) EQYKFYSV 8
1LK2* Insulin receptor (beta-subunit) derived Peptide (423-430) GNYSFYAL 8
1N59*/1S7Q LCMV derived epitope (Gp33) AVYNFATM 8
1OSZ* (L4v) Mutant Of Vesicular Stomatitis Virus Np RGYLYQGL 8
1P1Z*/1P4L/1VAC
3C8K/2QRI
2QRS/2QRT/3CVH
Ovalbumin derived Peptide (257-264) SIINFEKL 8
1RJY*/1RKO/
1T0M/1T0N
Herpes Simplex Virus (HSV) Glycoprotein B derived
Peptide
SSIEFARL 8
1RJZ*/1RK1 HSV Mutant S2E Glycoprotein B Peptide SEIEFARL 8
1S7R* LCMV-Derived Gp33 Peptide - Escape Variants KAVYNLATM 9
1S7S* LCMV-Derived Gp33 Peptide - Escape Variants ALYNFATM 8
1S7T* LCMV-Derived Gp33 Peptide - Escape Variants AVFNFATM 8
2CLV*/2OL3 Rbm5 derived Peptide (189-196) SQYYYNSL 8
1WBZ* Influenza A peptide PB1703-711 SSYRRPVGI 9
1G6R superagonist peptide SIYR SIYRYYGL 8
2ZSW* 8-mer peptide from spike glycoprotein RAYIFANI 8
2ZSV* 8-mer peptide from spike glycoprotein RAQIFANI 8
This table presents the 52 files containing the H-2Kb allele, available at PDB. Of these, 21
structures (*) presented epitopes with sequence differing in at least one amino acid. These
21 epitopes were used in the analyses. 1G6R presents an MHC interacting with the TCR.
Since this interaction could affect the conformation of the epitope, this structure was
excluded. 1KBG structure has a glicosilated residue and was also excluded.
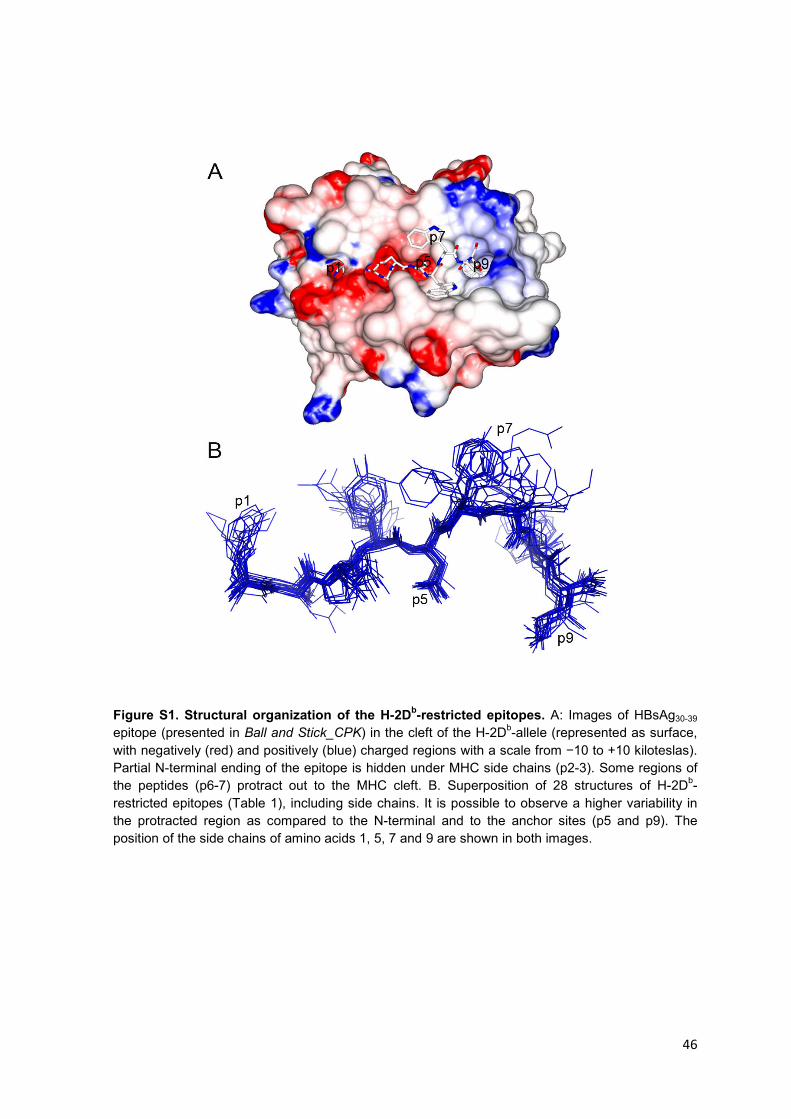
46
Figure S1. Structural organization of the H-2Db-restricted epitopes. A: Images of HBsAg30-39 epitope (presented in Ball and Stick_CPK) in the cleft of the H-2Db-allele (represented as surface, with negatively (red) and positively (blue) charged regions with a scale from −10 to +10 kiloteslas). Partial N-terminal ending of the epitope is hidden under MHC side chains (p2-3). Some regions of the peptides (p6-7) protract out to the MHC cleft. B. Superposition of 28 structures of H-2Db-restricted epitopes (Table 1), including side chains. It is possible to observe a higher variability in the protracted region as compared to the N-terminal and to the anchor sites (p5 and p9). The position of the side chains of amino acids 1, 5, 7 and 9 are shown in both images.
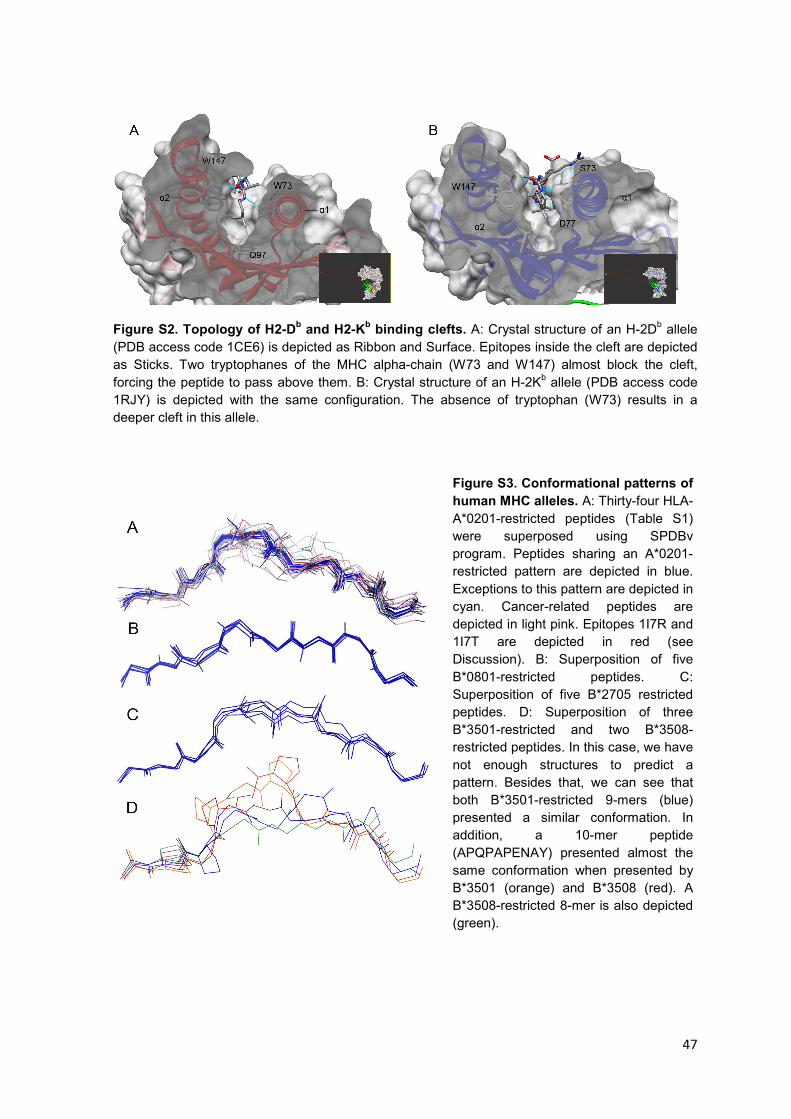
47
Figure S2. Topology of H2-Db and H2-K
b binding clefts. A: Crystal structure of an H-2Db allele
(PDB access code 1CE6) is depicted as Ribbon and Surface. Epitopes inside the cleft are depicted as Sticks. Two tryptophanes of the MHC alpha-chain (W73 and W147) almost block the cleft, forcing the peptide to pass above them. B: Crystal structure of an H-2Kb allele (PDB access code 1RJY) is depicted with the same configuration. The absence of tryptophan (W73) results in a deeper cleft in this allele.
Figure S3. Conformational patterns of
human MHC alleles. A: Thirty-four HLA-A*0201-restricted peptides (Table S1) were superposed using SPDBv program. Peptides sharing an A*0201-restricted pattern are depicted in blue. Exceptions to this pattern are depicted in cyan. Cancer-related peptides are depicted in light pink. Epitopes 1I7R and 1I7T are depicted in red (see Discussion). B: Superposition of five B*0801-restricted peptides. C: Superposition of five B*2705 restricted peptides. D: Superposition of three B*3501-restricted and two B*3508-restricted peptides. In this case, we have not enough structures to predict a pattern. Besides that, we can see that both B*3501-restricted 9-mers (blue) presented a similar conformation. In addition, a 10-mer peptide (APQPAPENAY) presented almost the same conformation when presented by B*3501 (orange) and B*3508 (red). A B*3508-restricted 8-mer is also depicted (green).

48
Figure S4. Exception to the H-2Db pattern. A: The 1BZ9 epitope (red) does not have the
conventional amino acid in the anchor position (p5) and showed a significant deviation in the main chain when compared to other epitopes. B: The side chains of the epitope 1BZ9 (red) are in a similar conformation to other epitopes of this allele, except in a phenylalanine at position 6 of the epitope, which may be used as an alternative “anchor”. Observe the presence of an anchor amino acid in C-terminal and a hidden N-terminal extremity under the side chains of the MHC, characteristics that may contribute to the presentation of this unusual epitope.
Figure S5. Structural pattern of H-
2Kb restricted ligands. A: Twenty-two
epitopes (see Table S2) restricted to this allele were superposed, four 9-mer (red) and 18 8-mer (blue). The H-2Kb restricted ligands, just like those restricted to the H-2Db allele, presented a higher identity in the side chains of the anchor positions than in the side chains oriented outside of the cleft. B: Backbone superposition of the 21 ligands shows a shared conformation among the epitopes with the same length (8-mer). The length adjustment, in this allele, seems to be in different positions, when compared to the H-2Db allele.
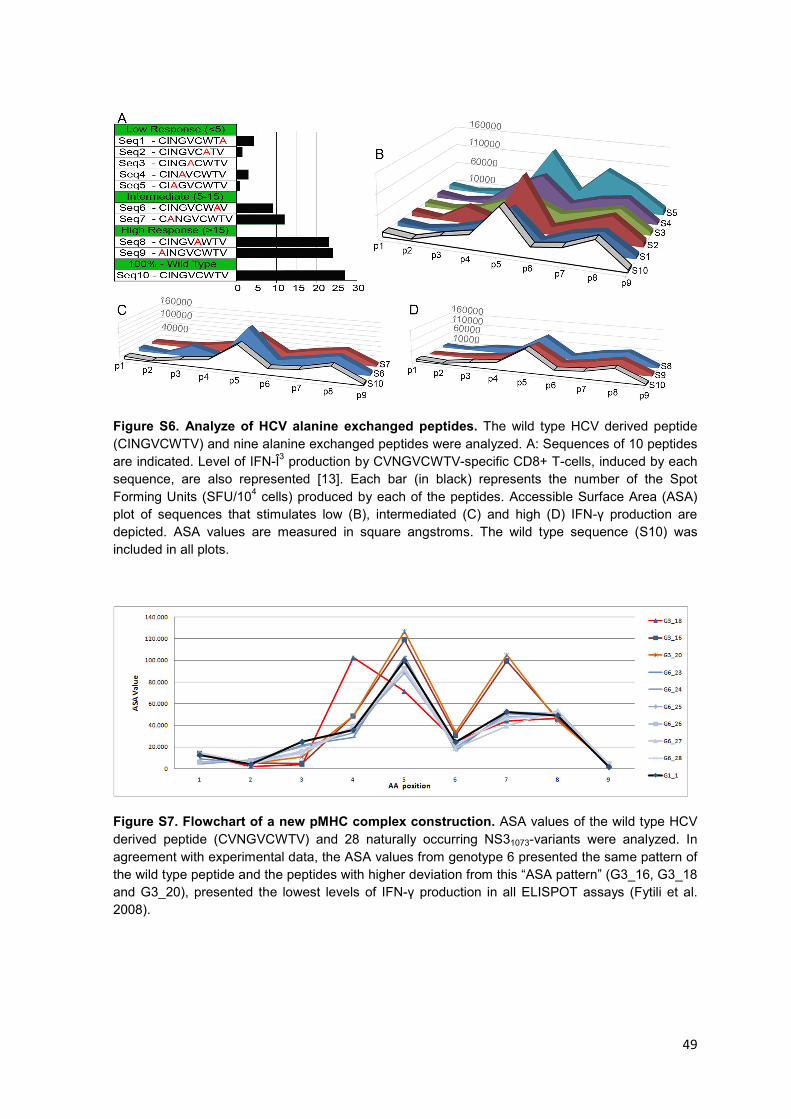
49
Figure S6. Analyze of HCV alanine exchanged peptides. The wild type HCV derived peptide (CINGVCWTV) and nine alanine exchanged peptides were analyzed. A: Sequences of 10 peptides are indicated. Level of IFN-Î3 production by CVNGVCWTV-specific CD8+ T-cells, induced by each sequence, are also represented [13]. Each bar (in black) represents the number of the Spot Forming Units (SFU/104 cells) produced by each of the peptides. Accessible Surface Area (ASA) plot of sequences that stimulates low (B), intermediated (C) and high (D) IFN-γ production are depicted. ASA values are measured in square angstroms. The wild type sequence (S10) was included in all plots.
Figure S7. Flowchart of a new pMHC complex construction. ASA values of the wild type HCV derived peptide (CVNGVCWTV) and 28 naturally occurring NS31073-variants were analyzed. In agreement with experimental data, the ASA values from genotype 6 presented the same pattern of the wild type peptide and the peptides with higher deviation from this “ASA pattern” (G3_16, G3_18 and G3_20), presented the lowest levels of IFN-γ production in all ELISPOT assays (Fytili et al. 2008).

50
Figure S8. Flowchart of a new pMHC complex construction. Consider an epitope “C” whose structure in the context of a given MHC allele was not determined. A search at PDB is performed, looking for a PDB file containing the allele of interest presenting an epitope with the same length of the “c” epitope. In this example, we found the “A” complex. Using the SPDBV program, it was observed that the amino acid sequence of the epitope “c” is “Fit” on the 3D structure of the epitope present at the “A” complex. The generated structure of the epitope “c” is submitted to an energy minimization (EM), and is used as input for the docking with an “MHC donor” structure (B). In order to adjust the MHC to this new epitope, an EM of the complex “D” is performed. After minimization, epitope and MHC are separated and used as inputs to a second docking, which will generate the desired pMHC complex (E). For more information see methods.

Capítulo III
Structural in silico analysis of cross-genotype-reactivity among naturally occurring HCV NS3-1073-variants in the context of HLA- A*02:01 allele - Artigo completo aceito para publicação na revista
Molecular Immunology.
52
Structural in silico analysis of cross-genotype-reactivity
among naturally occurring HCV NS3-1073-variants in the
context of HLA-A*02:01 allele
Dinler A Antunes, Maurício M Rigo, Jader P Silva, Samuel P Cibulski, Marialva
Sinigaglia, José A B Chies, Gustavo F Vieira §
NBLI - Núcleo de Bioinformática do Laboratório de Imunogenética, Department
of Genetics, Federal University of Rio Grande do Sul, Porto Alegre, Brazil.
§ Corresponding author.
Email addresses:
DAA: [email protected]
MMR: [email protected]
JPS: [email protected]
SPC: [email protected]
JABC: [email protected]
GFV: [email protected]
Address, Telephone and Fax Numbers (corresponding author):
Av. Bento Gonçalves 9500 Building 43323 Room 225
Bairro Agronomia
91501-970 - Porto Alegre, RS - Brazil - PO Box: 15053
Telephone: (51) 33089938
Fax: (51) 3308-7311
53
Abstract
Cellular immune response plays a central role in outcome of Hepatitis C Virus
(HCV) infection. While specific T-cell responses are related to viral clearance, impaired
responses can lead to chronic infection, turning HCV variability into a major obstacle for
vaccine development. In a recent work, Fytili et al. studied the cross reactive potential of
HCV specific CD8+ T-cells and observed a large variation in immunogenicity among 28
naturally occurring NS31073 variants. In this work, we intend to evaluate this immunogenic
variation at molecular level, through bioinformatics approaches. The D1-EM-D2 strategy
was used to build in silico MHC:peptide complexes (pMHC) of these HCV-derived
peptides in the context of HLA-A*02:01 allele. The TCR-interacting surface of these
complexes were evaluated using the GRASP2 program. Structural analysis indicated a
sharing of topological and electrostatic features among complexes that induced strong
response in vitro. Besides, complexes that induced low response presented an important
positively charged spot in the center of TCR-interacting area. This spot was seen even in
complexes with conservative amino acid changes and is consistent with the impairment of
recognition by wild-type-specific T-cells, observed in vitro. Furthermore, the most
remarkable difference in electrostatic potential was seen precisely in the only complex
unable to induce in vitro stimulation. All these observations were confirmed by Principal
Component Analysis (PCA) and this approach was also applied to a set of 45 non-related
immunogenic viral epitopes, indicating possible new targets for cross-reactivity studies.
Our results suggest structural in silico analysis of pMHC complexes as a reliable tool for
vaccine development, affording to predict the impact of viral escape mutations and
selection of epitopes with potential to induce cross-reactive immune responses.
KEYWORDS: Cross-reactivity; immunogenicity; structural bioinformatics; Hepatitis C
virus.

54
Abbreviations: HCV: Hepatitis C Virus
MHC: Major Histocompatibility Complex
pMHC: MHC-peptide complex
HLA: Human Leukocyte Antigen
TCR: T-Cell Receptor
PCA: Principal Component Analysis
1. Introduction
Hepatitis C Virus (HCV) infection is persistent in most of the infected individuals,
being the major cause of chronic liver disease, cirrhosis, and hepatocellular carcinoma.
Cytotoxic T Lymphocyte (CTL) response seems to play a central role in the outcome of
this infection, associated with both viral clearance and immunopathogenesis of the
infection (Thimme et al., 2002; Vertuani et al., 2002). Strong cellular immune response,
especially in the acute phase of infection, has been related to viral control and eradication,
nourishing expectations regarding vaccine development (Cucchiarini et al., 2000; Hiroishi
et al., 2010). In this context, the HLA-A2-restricted epitope NS31073 comes to light as a
promising target, being the most frequently recognized HCV-specific epitope (Engler et al.,
2004; Schlaphoff et al., 2007). NS31073-specific CTL response has been related to clearance
of acute HCV-infection (Lechner et al., 2000; Rehermann and Nascimbeni, 2005; Thimme
et al., 2002) and, probably due to its importance for viral fitness, this region presents a very
limited variation among the six HCV genotypes (Soderholm et al., 2006). However, even a
limited variation within an immunodominant target for host CTL response can be a huge
obstacle for vaccine development, since defective responses can lead to chronic infection
(Wedemeyer et al., 2002). This idea is also supported by experimental HCV infection in
chimpanzees, where animals rechallenged with heterologous HCV genotypes seem to be
viremic for a longer time and develop chronic infection in a rate similar to primary
infections (Prince et al., 2005).
In a recent work, Fytili et al. (Fytili et al., 2008) aimed to study the sequence
variability of the NS31073 epitope across all HCV-genotypes, to determine HLA-A2 binding
affinities of all variants identified and to investigate cross-reactivity of NS31073 wild-type-

55
specific CD8+ T-cells. In one of the performed assays, the authors used Peripheral Blood
Mononuclear Cells (PBMCs) from a healthy individual who was vaccinated with the
peptide vaccine IC41, which includes the wild-type epitope “CINGVCWTV”, and
observed a large variation of immunogenicity against 28 NS31073 peptides from naturally
occurring variants, in the context of HLA-A2, through ELISPOT assay. Although some
mutations in anchor positions partially affected the HLA binding affinity, these mutations
did not prevent TCR stimulation in vitro. Similarly, immunogenic variation was not
restricted to non-conservative amino acid exchanges, since even single conservative
exchanges may abolish recognition of wild-type-specific T-cells. Therefore, the amino acid
sequence analysis per se was not able to fully explain all the immunogenic variability
observed in vitro, and this unpredictability remains as an obstacle for vaccine development.
HCV represents a difficult challenge for conventional vaccinology and some
alternatives, such as Reverse Vaccinology, have already been suggested (Rappuoli, 2000).
In this scenario, bioinformatics tools are used to analyse the pathogen genome and predict
the antigens that are most likely to be vaccine candidates. In the past few years, many other
applications of computational power to address immunological problems have been
proposed, and immunoinformatic has emerged as a promising field (Korber et al., 2006;
Tong and Ren, 2009). One of the goals in this field is to predict the three-dimensional
structure of complexes formed by hosts Major Histocompatibility Complex (MHC) and
peptides derived from a given pathogen. These MHC:peptide complexes (pMHC) play a
central role in cellular immune response, once it allows the host lymphocytes to identify
infected cells through the interaction with T-Cell Receptor (TCR).
Our group has used structural bioinformatics tools, such as molecular docking and
molecular dynamics, to build in silico models of pMHC complexes that can be further
analysed regarding its topology and electrostatic potential, among other features (Antunes
et al., 2010; Rigo et al., 2009). Our approach, previously described as D1-EM-D2 (Docking
1 - Energy Minimization - Docking 2), uses a crystal structure of a given MHC as a
macromolecule for cross-docking with the structure of each peptide. One intermediate step
of Energy Minimization is also performed to accommodate the MHC side chains to each
new ligand. In the present work, this strategy was applied to build in silico pMHC
complexes of the 28 HCV derived peptides previously tested in vitro by Fytili et al.(Fytili
et al., 2008), in the context of human MHC allele HLA-A*02:01. Aiming to evaluate the
56
immunogenic variation of these complexes at molecular level, images of the TCR-
interacting area of these complexes were obtained and used as input to multivariate
statistical methods. In addition, we submitted these 28 complexes to a short molecular
dynamics and reevaluated their TCR-interacting surfaces.
2. Material and methods
2.1. Construction of pMHC complexes
Complexes were built through combined use of molecular docking and energy
minimization, previously described as D1-EM-D2 approach (Antunes et al., 2010). Briefly,
a crystal structure of HLA-A*02:01, Protein Data Bank (PDB) access code 2V2W, was
used as “MHC donor” (macromolecule) for cross-docking with the structure of each
peptide. Epitopes were built from its linear amino acid sequence using the crystal structure
of an HLA-A2-restricted peptide, PDB access code 1T1Z, as a reference for backbone
three-dimensional conformation. Molecular dockings were performed with AutoDock Vina
1.0.2 (Trott and Olson, 2009) using default values (e.g. exhaustiveness =8). All torsions in
the macromolecule were kept rigid, as torsions in ligand backbone, while ligand side
chains were kept completely flexible. For each epitope, the same input files were used to
run AutoDock Vina 20 times, generating a final population with up to thousand different
conformations (20 outputs with up to 50 structures each). Binding Energy (BE) values of
the best conformation of each output were used to establish a threshold, and the
conformations above this threshold were used to calculate the Root Mean Square Deviation
(RMSD) among the selected conformations. These steps were performed using an
automated script developed by our team, which uses the g_confrms software, GROMACS
4.0.7 package (Van Der Spoel et al., 2005), to calculate the RMSDs. The conformation
with the lowest deviation among the selected ones was chosen as the final docking result
(side chains in most frequent positions) and saved in a pdb file, along with the “MHC
donor”. This complex is then submitted to an energy minimization (EM) step, aiming to
adjust the “MHC donor” to its new ligand, and the resulting complex is used into a new
round of molecular docking. EMs were also performed with GROMACS 4.0.7 package
(Van Der Spoel et al., 2005).
All complexes built for these work, as well as GRASP2 images of these
complexes, are being compiled to be released as part of the CrossTope Structural Data

57
Bank for Cross-Reactivity Assessment (www. crosstope.com.br). This database also stores
the structures (PDB files) and GRASP2 images for other immunogenic viral peptides in the
context of four different MHC alleles (HLA-A*02:01, HLA-B*27:05, H-2Db and H-2K
b),
allowing on-line comparison of these complexes data (Sinigaglia M, personal
communication).
2.2. Analyses of topology and charges distribution
The MHC surface analyses were performed with the GRASP2 program (Petrey and
Honig, 2003), on Windows 7 platform. Electrostatic potential of the 28 NS3-1073-variants
was calculated with a scale from -10 to +10 kiloteslas. A narrower range, from -5 to +5
kiloteslas, was used to generate images of selected immunogenic viral epitopes. Images of
complexes after molecular dynamics were depicted with a range from -3 to +3 kiloteslas.
All images were obtained with complexes in the same position.
2.3. Images acquisition and data extraction
Top view images of pMHCs were generated with GRASP2 program (Petrey and
Honig, 2003) and seven selected regions were defined over the TCR-interacting surface
(Appendix A). Color histograms (RGB) of these selected areas were obtained from all
GRASP2 images using the ImageJ 1.43u software (National Institute of Health, USA,
http://rsb.info.nih.gov/ij). In total, 63 values were obtained from the seven histograms of
each image, such as color mean, mode and standard deviation. Figures included in the
article were edited with Adobe Photoshop CS2 v.9.0. program (Adobe, San Jose, Calif).
2.4. Principal Component Analysis (PCA)
Values of mean and standard deviation of each color (Red, Green and Blue) were
taken as correlated variables for a factor analysis using principal component method, using
the SPSS software (PASW Statistics 18, IBM, Chicago IL. USA). For the 28 NS3-1073-
variants, PCA was based on data from selected region 1 (S1) and two principal components
explained 94.5% of total variance. PCA for selected immunogenic viral epitopes was based
on data from three selected regions (S1, S2 and S5) and three principal components
explained just 68.2% of total variance. In this specific case, values regarding green color
were not included, given its poor contribution for the principal components.

58
2.5. Hierarchical Cluster Analysis (HCA)
Hierarchical Cluster Analysis was performed assisted by the SPSS software (PASW
Statistics 18, IBM, Chicago IL. USA). The centroid clustering method was used with
squared Euclidean distance interval and results were plotted as a dendrogram. HCA of the
28 NS3-1073-variants was based on data from selected region 1 (S1). HCA for selected
immunogenic viral epitopes was performed with data from all seven selected regions over
the TCR-interacting area of the pMHC complexes.
2.6. Molecular Dynamics
Complexes presenting 28 NS3-1073-variants were submitted to a short Molecular
Dynamics with GROMACS v4.0.7 package (Van Der Spoel et al., 2005), on Linux
platform (Ubuntu 9.10). An energy minimization step was performed using steepest-
descent integrator with no restrains (nsteps = 10000), allowing relaxation of the entire
system. Then, the system was submitted to an equilibration stage for 100 ps, with position
of non-hydrogen atoms restrained to allow the formation of solvation layers. Finally, the
system was gradually heated from 50 to 310 K preserving 100 kJ-1
nm-1
of positional
restraints for all heavy atoms, over a period of 100 ps. All simulations were performed with
G53a6 force field.
2.7. Selection of complexes presenting immunogenic viral epitopes
A set of 45 pMHC complexes presenting immunogenic viral epitopes was selected
from CrossTope Data Bank (http://www.crosstope.com.br/). These epitopes were curated
from two well-known epitope databases: SYFPEITHI (http://www.syfpeithi.de/)
(Rammensee et al., 1999) and IEDB (http://www.immuneepitope.org) (Vita et al., 2010).
Information about protein source and epitope position was manually verified (Appendix
B), as well as results of in vitro experiments performed to identify these epitopes as
immunogenic. Selected epitopes were complexed to HLA-A*02:01 structure for further
analysis of these pMHC complexes and inclusion in the CrossTope Data Bank.
59
3. Results/Discussion 3.1. In silico study of cross-reactivity potential among the wild-type complex HLA-
A2-NS31073 and 28 pMHCs presenting naturally occurring NS31073-variants
Two sequences are considered as wild-type for the NS31073 epitope, CVNGVCWTV
and CINGVCWTV. In one of their experiments, Fytili et al. used PBMCs from a healthy
individual vaccinated with the peptide vaccine IC41 (which includes "CINGVCWTV") in
an ELISPOT assay (Fytili et al., 2008). These cells were tested for IFN-gamma production
after stimulation with 28 naturally occurring variants, covering all six HCV genotypes and
including the wild-type CVNGVCWTV (these results were summarized in Figure 1A).
In a previous work, our group have already analysed Accessible Surface Area
(ASA) of this set of NS31073 peptides in the context of HLA-A*02:01 allele (Antunes et al.,
2010). Although this approach alone was not able to explain all variation observed in vitro,
ASA values from genotype 6 presented the same pattern of the wild type peptide, while
peptides with higher deviation from this “ASA pattern” were those with the lowest levels
of IFN-gamma production in all ELISPOT assays.
In this work, TCR-interacting surface analysis of these 28 pMHC complexes
confirmed a sharing of topological and electrostatic aspects among complexes that induced
strong response in vitro (depicted with black bars in Figure 1A), especially among the
wild-type (G1-1) and the variants from genotypes 4, 5 and 6 (Figures 1C to 1E).
Differences in electrostatic potential over the pMHC surface are referred to as being more
crucial for TCR recognition than subtle changes in topology (Jorgensen et al., 1992;
Kessels et al., 2004). Therefore, despite some minimal topological variation, these
complexes can be recognized by the same specific T-cell population. On the other hand,
complexes that induced lower responses, especially variants from genotypes 2 and 3,
presented an important positively charged spot in the center of the TCR-interacting area
(Figures 1F to 1H). Furthermore, the most remarkable difference in electrostatic potential
was seen precisely in G3-18, the only complex unable to induce an in vitro stimulation of
wild-type-specific T-cells (Figure 1I and Appendix C). This is not the only pMHC subset in
which our approach agreed with in vitro data regarding cross-reactive potential against a
wild-type-specific T-cell population. The basis of our in silico approach for cross-reactivity
assessment was used in a previously work to explain the immunogenic variation within a
group of HCV-derived alanine exchanged peptides in the context of HLA-A*02:01 allele
60
(Antunes et al., 2010).
Fytili et al. have also called attention for an observation that even single
conservative amino acid changes impaired recognition of wild-type-specific T-cells,
highlighting the risk for escape in this epitope (Fytili et al., 2008). This feature cannot be
predicted from the linear amino acid sequence, and could limit the potential efficacy of
vaccines containing the NS31073-wild-type peptide. However, our results suggest that this
feature could be predicted by TCR-interacting surface analysis, since the complexes with
affected CTL recognition due to conservative amino acid changes (G1-3, G1-4 and G1-6)
also presented a positively charged spot in the center of TCR-interacting area (Figure 1F
and Appendix C).
3.2. Confirmation of in silico observation by Principal Component Analysis (PCA)
Principal Component Analysis has been applied to a wide range of problems,
including structural bioinformatics and immunoinformatics (Andrusier et al., 2008; Bremel
and Homan, 2010a; Bremel and Homan, 2010b; Tian et al., 2008). In this work, PCA was
performed with a view to evaluating the contribution of a positively charged spot, seen in
some complexes surface, to the recognition by wild-type-specific T-cells. This analysis was
based on color histograms extracted from GRASP2 images (see methods) and confirmed
our previous observations, grouping peptides from genotypes 4, 5 and 6 with the optimal
responders from genotype 1 (Figure 2). Peptides from genotypes 2 and 3, which presented
poor in vitro stimulation, formed separate clusters. Also in agreement with in vitro data,
complex G3-18, the only non-inducer complex, was placed in a completely separated
position in the scatter plot.
Complexes G1-3, G1-4 and G1-6, in which conservative amino acid changes
affected CTL recognition, were distributed in positions far from genotype 6. In this
analysis, complexes G1-5 and G1-8 were placed among the optimal responders, although
these complexes induced an intermediate stimulation in vitro (depicted with dark grey bars
in Figure 1A). It is important to note that G1-5 complex, along with complexes G1-3 and
G1-6, presented the most remarkable topological differences among all the studied
complexes (Appendix C). This difference is given by the presence of an alanine at the fifth
position (p5), which occurs only in these complexes. Topological aspects, though less
important than electrostatic potential, can also influence the TCR/pMHC interaction. Since
61
this PCA was based only on color information, it does not reflect topological issues.
Although according to in vitro assay the complex G1-8 induced intermediate levels
of IFN-gamma production, this complex does not present any important structural
difference as compared to the wild type. However, it is important to stress that we are using
as reference just one of the experiments carried out by Fytili et al (Fytili et al., 2008). We
choose to focus our discussion in the results of the assay performed with PBMCs recovered
from the vaccinated individual, aiming to avoid any external issues that could enhance the
variability in our system and bias our results, but the authors presented in their work data
from 7 ELISPOT assays (representative of a larger group). These experiments were
performed with PBMCs recovered from seven individuals with different immunological
backgrounds: healthy volunteers (anti-HCV negative), as well as acute and chronically
HCV infected patients. It was observed some variation in the levels of IFN-gamma
production among different experiments, even comparing the values of the same HCV
variant. Considering the results of all these seven independent assays, the three complexes
that we grouped as intermediate responders (G1-5, G1-6 and G1-8) presented distinct
patterns. IFN-gamma production by complex G1-6 was around 20% in all assays and
complex G1-5 presented similar levels, except for one assay in which this complex
stimulated 40% of IFN-gamma production. On the other hand, complex G1-8 presented
more than 40% of IFN-gamma production in three assays performed both with CTLs from
healthy volunteers, as well as from recovered or chronically HCV infected patients.
Therefore, our structural analysis is in agreement with in vitro data, since it was able to
separate complex G1-8 from complexes G1-5 and G1-6, identifying in the former the
potential to be a cross-reactive target for NS31073-specific T-cells.
Apart from being involved in cross-genotype-reactivity, the HCV-derived NS31073
epitope is also implicated in cross-reactivity with epitopes from non-related viruses. For
instance, Wedemeyer at al. (Wedemeyer et al., 2001) were able to expand specific-NS31073-
CTLs from the blood of HCV-negative blood donors. The authors identified the
Neuraminidase-derived NA231 epitope, from Influenza Virus (IV), as the target for these
cross-reactive memory T-cells. This IV-derived epitope was included in Principal
Component Analysis and, in agreement with in vitro data, was placed near the NS31073
wild-type epitope (Figure 2). This result indicates that structural-based approaches for
cross-reactivity assessment can be used both to study determinants of related viruses, as
62
well as to identify possible targets for cross-reactivity among any other epitopes of interest.
In addition to PCA, we used the same data from GRASP2 images to perform a
Hierarchical Cluster Analysis (HCA). The results agreed with PCA, and were plotted as a
dendrogram using centroid linkage (Appendix D). All complexes from genotypes 4-6 were
placed in the same cluster, along with G1-1, G1-2, G1-7, G1-8 and IV-NA231. Complexes
G1-3, G1-4 and G1-6 were placed in a group close to complexes from genotype 2. Finally,
complexes from genotype 3 formed a separated cluster and the G3-18 complex remained
as the most distant one.
3.4. Molecular Dynamics with position restrains
All structural analyses described so far were taken over “static” complexes that
were obtained by D1-EM-D2 approach. Despite general similarity, some topological
differences were seen among these 28 complexes, especially in complexes G1-3, G1-5 and
G1-6. In order to verify if these topological differences would remain even in solution, all
complexes were submitted to an Energy Minimization (EM) followed by a short Molecular
Dynamics (MD). Once the main goal was to observe subtle variation in topology and
electrostatic potential, a mild position restrain for heavy atoms was preserved during the
simulations. These restrains allowed to accommodate side chains with unfavorable steric
interactions, while avoiding a greater variability of the solvent exposed side chains.
Structural analysis taken after MD presented results in agreement with our first
observations (Appendix E). Complexes G1-3, G1-5 and G1-6 preserved their topological
differences even after MD, with the absence of a neutral crest which was present in all
other complexes. All pMHCs from genotypes 2 and 3 preserved their positively charged
spot in the TCR-interacting area and, in all cases, this spot was represented as a small
cavity in the complexes surface. On the other hand, none of the complexes with good
response in vitro presented this cavity or the positively charged spot.
Molecular Dynamics also seems to smooth out the electrostatic potential over the
pMHC complex. Principal Component Analysis is affected by this, since PCA is based on
charge distribution differences. PCA using data from MD was able to cluster complexes
G1-7, G4-21, G5-22 and G6-23 as the most closely related with the wild-type (G1-01).
However, this analysis was not able to clearly separate all G6 complexes from those from
genotypes 2 and 3, even using images with a narrow electrostatic potential range.
63
3.5. In silico analysis of cross-reactivity among the HCV wild-type epitope
CVNGVCWTV (NS31073) and a set of selected immunogenic viral epitopes
Aiming at applying this structural analysis to a larger set of non-related pMHC
complexes, forty-five complexes presenting immunogenic viral epitopes in the context of
HLA-A*02:01 were selected from the CrossTope Data Bank (see methods). Most of these
complexes do not possess crystal structures available, and were built using the D1-EM-D2
approach. The IV-derived epitope CVNGSCFTV (NA231) was also included in this
analysis, along with the HCV-NS31073 wild-type and all variants from genotypes 4 to 6.
Relevant information about selected epitopes, totaling 55 sequences, is shown in Appendix
B.
PCA results for these 55 non-related structures preserved the clusterization of the
immunogenic HCV-NS31073 variants studied before, as well as the proximity between the
epitopes HCV-NS31073 (wild-type) and IV-NA231 (Appendix F). In addition, other
complexes were identified as having similar distribution according to three Principal
Components. For this analysis, we used data obtained from three different regions selected
over the TCR-interacting surface (see methods). The inclusion of these new areas,
however, made it impossible to summarize the whole span of variation in just two or even
three principal components. For instance, the three components used in this case explained
just 68.2% of the variance.
Inclusion of new selected regions can increase the power to discriminate among
complexes, and this information can be used directly to an Hierarchical Cluster Analysis
(HCA). For this alternative approach, GRASP2 images from the 55 selected complexes
were used to collect data from seven regions over the TCR-interacting surface (Appendix
A). Data from all these regions were used as input for a HCA and plotted as a dendrogram
using centroid linkage (Figure 3). As expected, all HCV-NS31073 variants were grouped
together. Interestingly, five complexes presenting non-related viral epitopes – CrossTope
IDs A0201_0014, A0201_0073, A0201_0076, A0201_0083 and A0201_0095 – were
placed in the same group.
Further evaluation of these five complexes revealed that at least two of them
(A0201_0073 and A0201_0095) presented little differences in both topology and
electrostatic potential, and could be promising candidates for in vitro cross-reactivity
64
assays (Appendix G). Two of the remaining complexes presented some topological
differences (A0201_0014 and A0201_0083) and complex A0201_0076 presented a
positively charged spot in a position that was not represented among the selected regions,
also differing from the HLA-A2-NS31073 complex presenting the wild-type.
One of the two promising complexes presents the HIV-1-derived peptide
“SLYNTVATL” (GAG77), which has not been so far described as a possible target for
cross-reactivity with the HCV-NS31073 epitope. Interestingly, this same HIV epitope was
already described as being cross-reactive with the HCV-NS5b peptide, in HIV/HCV co-
infected individuals (Vali et al., 2010). The other indicated complex present the
“LLWTLVVLL” peptide, from the Human herpesvirus 4 (LMP2329). It is important to note
that this peptide does not share even a single amino acid with the target peptide
(CV/INGVCWTV) and, nevertheless, presented almost the same structural pattern when
presented in the context of HLA-A*02:01. This result stresses the power of this structural
approach in prospecting new cross-reactive targets.
The present approach was able to reproduce in vitro data for the identification of
cross-reactive targets and suggested new candidates for future in vitro experiments. The
seven regions used to build the dendrogram were chosen considering the spots of variation
in charge distribution among the selected complexes in the whole TCR-interacting surface.
Interestingly, all these selected regions are placed within an area that corresponds to
already described footprints of public TCRs (Gras et al., 2009; Rudolph et al., 2006; Turner
et al., 2006). Therefore, the same variation that allowed us to discriminate among
complexes is probably involved with in vivo differential stimulation of CTLs. However, it
is important to consider that this structural approach must be refined before it can be safely
and efficiently used in other applications, such as vaccine development. For instance, we
could use information about the whole TCR-interacting surface, extracting data from
several spots and allowing the PCA to infer which spots contribute more or less to group
the complexes in a given analysis.
The main idea behind this work is that structural information about pMHC
complexes, especially regarding the electrostatic potential over the TCR-interacting area,
can be used to predict targets of cross-reactivity for immunological applications. In
addition, we postulate that future approaches for cross-reactivity prediction should
incorporate even more information about the complexes, such as topology measures, ASA
65
values, binding affinity and even data over pMHC stability, feeding one global analysis
that can cover most of many details underlying TCR/pMHC interaction. This work has
important implications especially to vaccine development against HCV, as it can be used to
design new cross-reactive vaccines that can safely protect against a group of related viral
genotypes (Hiroishi et al., 2010; Vieira and Chies, 2005; Wang et al., 2008; Yu and Chiang,
2010).
Acknowledgements
We thank the Centro Nacional de Supercomputação (CESUP-RS) for allowing
access to its computational resources, and the collaboration of the Group of Structural
Bioinformatics from the Center of Biotechnology (Cbiot/UFRGS). In particular, we thank
Guilherme Menegon Giesel, for contributions about molecular dynamics parameters and
standardization. We also thank Bruna Renata Silva Corrêa, from the The Laboratory for
Biological Information Processing (LabPIB/USP), for suggesting the use of ImageJ
software, and Sidia Maria Callegari Jacques, from the Department of Statistics (UFRGS),
for contributions about the multivariate statistical methods.

66
Figures
Figure 1 – Comparison between in vitro and in silico results for cross-reactivity
potential among HCV- NS31073-variants.
A: Results of an in vitro assay performed by Fytili et al. 2008, in which NS31073 wild-type-
specific CD8+ T-cells were tested for IFN-gamma production after stimulation with 28
NS31073 naturally occurring variants, in the context of HLA-A*02:01 allele (Fytili et al.,
2008). B-I: TCR-interacting area of pMHC complexes presenting some of these peptides,
after construction by D1-EM-D2 approach (Antunes et al., 2010). Charged areas over the
complexes surface were computed with GRASP2 program and represented as red (negative
charges) and blue (positive charges) spots, with a range from −10 to +10 kiloteslas.
Complexes with strong in vitro response (B-E) presented similar topology and charge
distribution, while those with poor in vitro response (F-I) presented charged areas that
differentiate them from the wild-type complex (green arrows). GRASP2 images for the
entire set of HLA-A2-NS31073 complexes are shown in Appendix C.

67
Figure 2 – Simple scatter plot of a Principal Component Analysis (PCA).
GRASP2 images were analysed using the ImageJ software and the color histogram (RGB)
of a selected area was used to a PCA assisted by the PASW Statistics 18 software (for more
information, see methods). Complexes presenting peptides from genotypes 4, 5 and 6 were
grouped with the optimal responders from genotype 1. Complex G3-18, the only non-
inducer complex, was placed in a completely separated position in the scatter plot.
Moreover, the already described cross-reactive target IV-NA231 was placed near the
NS31073 wild-type epitope.
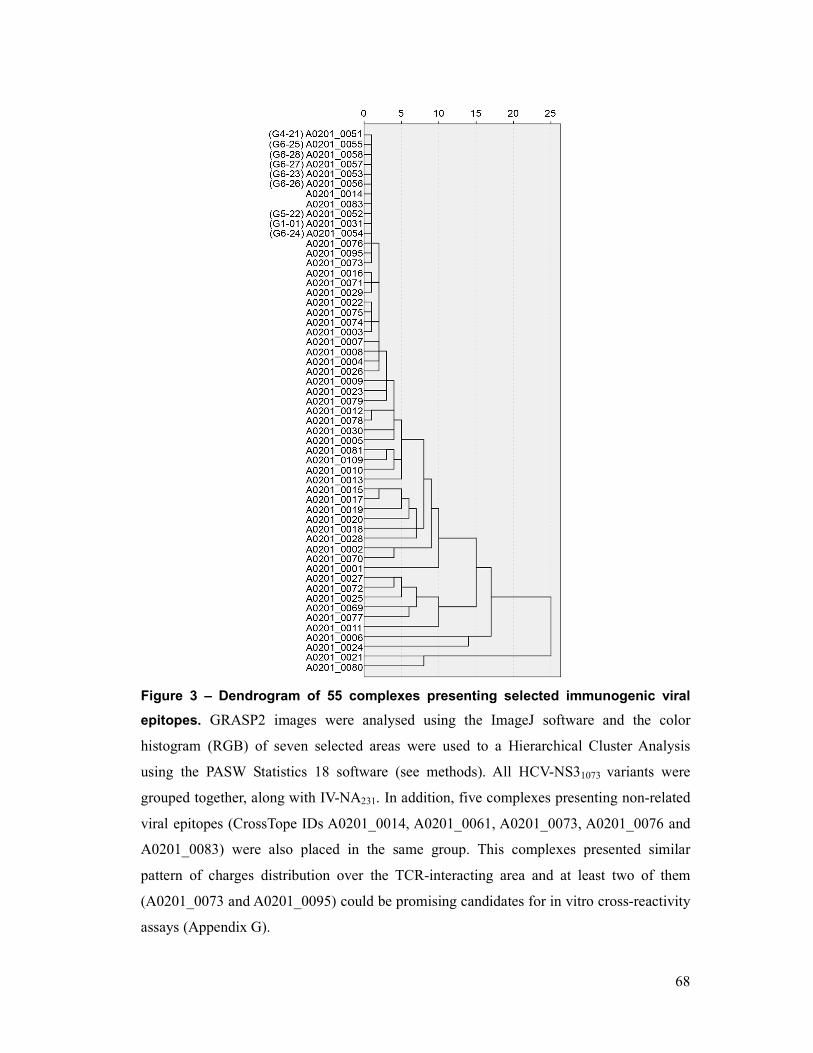
68
Figure 3 – Dendrogram of 55 complexes presenting selected immunogenic viral
epitopes. GRASP2 images were analysed using the ImageJ software and the color
histogram (RGB) of seven selected areas were used to a Hierarchical Cluster Analysis
using the PASW Statistics 18 software (see methods). All HCV-NS31073 variants were
grouped together, along with IV-NA231. In addition, five complexes presenting non-related
viral epitopes (CrossTope IDs A0201_0014, A0201_0061, A0201_0073, A0201_0076 and
A0201_0083) were also placed in the same group. This complexes presented similar
pattern of charges distribution over the TCR-interacting area and at least two of them
(A0201_0073 and A0201_0095) could be promising candidates for in vitro cross-reactivity
assays (Appendix G).
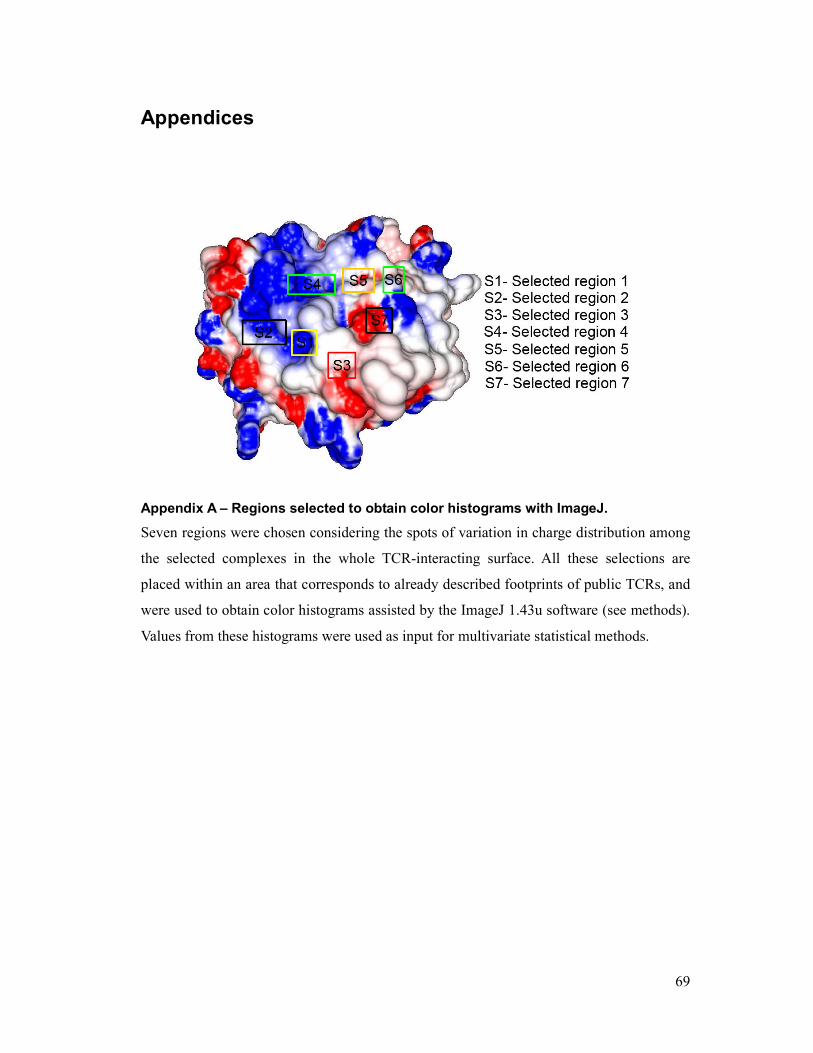
69
Appendices
Appendix A – Regions selected to obtain color histograms with ImageJ.
Seven regions were chosen considering the spots of variation in charge distribution among
the selected complexes in the whole TCR-interacting surface. All these selections are
placed within an area that corresponds to already described footprints of public TCRs, and
were used to obtain color histograms assisted by the ImageJ 1.43u software (see methods).
Values from these histograms were used as input for multivariate statistical methods.
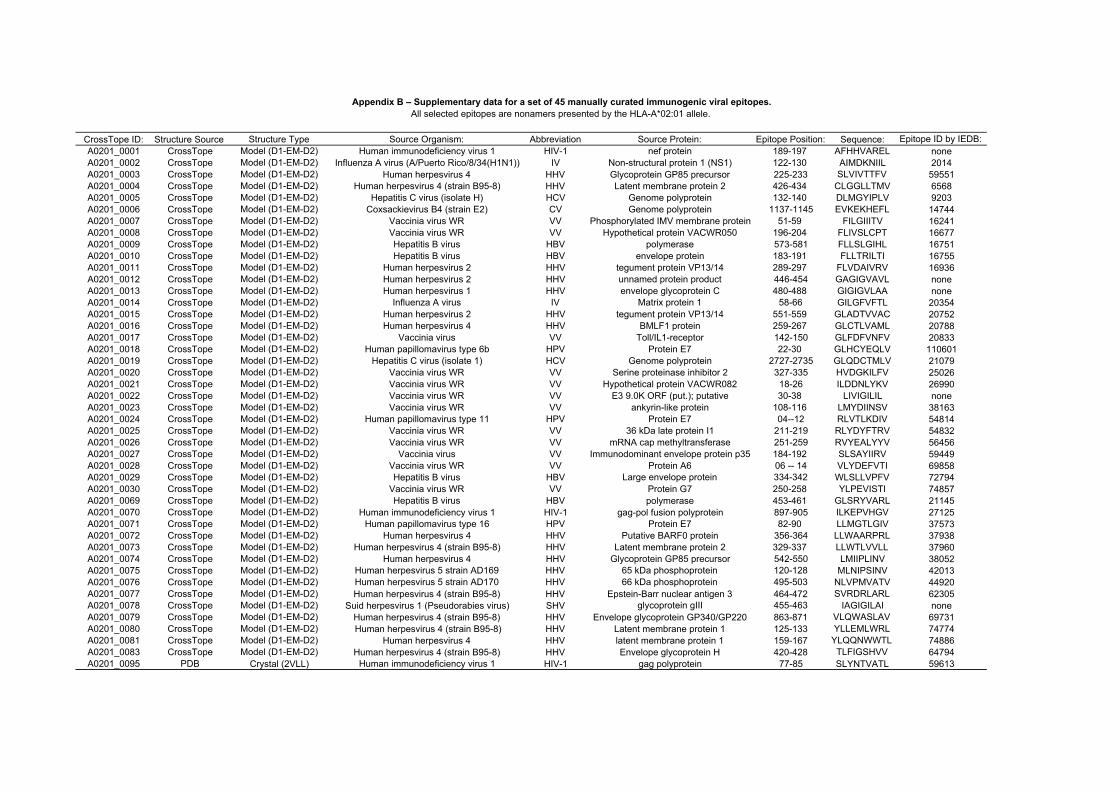
Appendix B – Supplementary data for a set of 45 manually curated immunogenic viral epitopes.
All selected epitopes are nonamers presented by the HLA-A*02:01 allele.
CrossTope ID: Structure Source Structure Type Source Organism: Abbreviation Source Protein: Epitope Position: Sequence: Epitope ID by IEDB:
A0201_0001 CrossTope Model (D1-EM-D2) Human immunodeficiency virus 1 HIV-1 nef protein 189-197 AFHHVAREL none
A0201_0002 CrossTope Model (D1-EM-D2) Influenza A virus (A/Puerto Rico/8/34(H1N1)) IV Non-structural protein 1 (NS1) 122-130 AIMDKNIIL 2014
A0201_0003 CrossTope Model (D1-EM-D2) Human herpesvirus 4 HHV Glycoprotein GP85 precursor 225-233 SLVIVTTFV 59551
A0201_0004 CrossTope Model (D1-EM-D2) Human herpesvirus 4 (strain B95-8) HHV Latent membrane protein 2 426-434 CLGGLLTMV 6568
A0201_0005 CrossTope Model (D1-EM-D2) Hepatitis C virus (isolate H) HCV Genome polyprotein 132-140 DLMGYIPLV 9203
A0201_0006 CrossTope Model (D1-EM-D2) Coxsackievirus B4 (strain E2) CV Genome polyprotein 1137-1145 EVKEKHEFL 14744
A0201_0007 CrossTope Model (D1-EM-D2) Vaccinia virus WR VV Phosphorylated IMV membrane protein 51-59 FILGIIITV 16241
A0201_0008 CrossTope Model (D1-EM-D2) Vaccinia virus WR VV Hypothetical protein VACWR050 196-204 FLIVSLCPT 16677
A0201_0009 CrossTope Model (D1-EM-D2) Hepatitis B virus HBV polymerase 573-581 FLLSLGIHL 16751
A0201_0010 CrossTope Model (D1-EM-D2) Hepatitis B virus HBV envelope protein 183-191 FLLTRILTI 16755
A0201_0011 CrossTope Model (D1-EM-D2) Human herpesvirus 2 HHV tegument protein VP13/14 289-297 FLVDAIVRV 16936
A0201_0012 CrossTope Model (D1-EM-D2) Human herpesvirus 2 HHV unnamed protein product 446-454 GAGIGVAVL none
A0201_0013 CrossTope Model (D1-EM-D2) Human herpesvirus 1 HHV envelope glycoprotein C 480-488 GIGIGVLAA none
A0201_0014 CrossTope Model (D1-EM-D2) Influenza A virus IV Matrix protein 1 58-66 GILGFVFTL 20354
A0201_0015 CrossTope Model (D1-EM-D2) Human herpesvirus 2 HHV tegument protein VP13/14 551-559 GLADTVVAC 20752
A0201_0016 CrossTope Model (D1-EM-D2) Human herpesvirus 4 HHV BMLF1 protein 259-267 GLCTLVAML 20788
A0201_0017 CrossTope Model (D1-EM-D2) Vaccinia virus VV Toll/IL1-receptor 142-150 GLFDFVNFV 20833
A0201_0018 CrossTope Model (D1-EM-D2) Human papillomavirus type 6b HPV Protein E7 22-30 GLHCYEQLV 110601
A0201_0019 CrossTope Model (D1-EM-D2) Hepatitis C virus (isolate 1) HCV Genome polyprotein 2727-2735 GLQDCTMLV 21079
A0201_0020 CrossTope Model (D1-EM-D2) Vaccinia virus WR VV Serine proteinase inhibitor 2 327-335 HVDGKILFV 25026
A0201_0021 CrossTope Model (D1-EM-D2) Vaccinia virus WR VV Hypothetical protein VACWR082 18-26 ILDDNLYKV 26990
A0201_0022 CrossTope Model (D1-EM-D2) Vaccinia virus WR VV E3 9.0K ORF (put.); putative 30-38 LIVIGILIL none
A0201_0023 CrossTope Model (D1-EM-D2) Vaccinia virus WR VV ankyrin-like protein 108-116 LMYDIINSV 38163
A0201_0024 CrossTope Model (D1-EM-D2) Human papillomavirus type 11 HPV Protein E7 04--12 RLVTLKDIV 54814
A0201_0025 CrossTope Model (D1-EM-D2) Vaccinia virus WR VV 36 kDa late protein I1 211-219 RLYDYFTRV 54832
A0201_0026 CrossTope Model (D1-EM-D2) Vaccinia virus WR VV mRNA cap methyltransferase 251-259 RVYEALYYV 56456
A0201_0027 CrossTope Model (D1-EM-D2) Vaccinia virus VV Immunodominant envelope protein p35 184-192 SLSAYIIRV 59449
A0201_0028 CrossTope Model (D1-EM-D2) Vaccinia virus WR VV Protein A6 06 -- 14 VLYDEFVTI 69858
A0201_0029 CrossTope Model (D1-EM-D2) Hepatitis B virus HBV Large envelope protein 334-342 WLSLLVPFV 72794
A0201_0030 CrossTope Model (D1-EM-D2) Vaccinia virus WR VV Protein G7 250-258 YLPEVISTI 74857
A0201_0069 CrossTope Model (D1-EM-D2) Hepatitis B virus HBV polymerase 453-461 GLSRYVARL 21145
A0201_0070 CrossTope Model (D1-EM-D2) Human immunodeficiency virus 1 HIV-1 gag-pol fusion polyprotein 897-905 ILKEPVHGV 27125
A0201_0071 CrossTope Model (D1-EM-D2) Human papillomavirus type 16 HPV Protein E7 82-90 LLMGTLGIV 37573
A0201_0072 CrossTope Model (D1-EM-D2) Human herpesvirus 4 HHV Putative BARF0 protein 356-364 LLWAARPRL 37938
A0201_0073 CrossTope Model (D1-EM-D2) Human herpesvirus 4 (strain B95-8) HHV Latent membrane protein 2 329-337 LLWTLVVLL 37960
A0201_0074 CrossTope Model (D1-EM-D2) Human herpesvirus 4 HHV Glycoprotein GP85 precursor 542-550 LMIIPLINV 38052
A0201_0075 CrossTope Model (D1-EM-D2) Human herpesvirus 5 strain AD169 HHV 65 kDa phosphoprotein 120-128 MLNIPSINV 42013
A0201_0076 CrossTope Model (D1-EM-D2) Human herpesvirus 5 strain AD170 HHV 66 kDa phosphoprotein 495-503 NLVPMVATV 44920
A0201_0077 CrossTope Model (D1-EM-D2) Human herpesvirus 4 (strain B95-8) HHV Epstein-Barr nuclear antigen 3 464-472 SVRDRLARL 62305
A0201_0078 CrossTope Model (D1-EM-D2) Suid herpesvirus 1 (Pseudorabies virus) SHV glycoprotein gIII 455-463 IAGIGILAI none
A0201_0079 CrossTope Model (D1-EM-D2) Human herpesvirus 4 (strain B95-8) HHV Envelope glycoprotein GP340/GP220 863-871 VLQWASLAV 69731
A0201_0080 CrossTope Model (D1-EM-D2) Human herpesvirus 4 (strain B95-8) HHV Latent membrane protein 1 125-133 YLLEMLWRL 74774
A0201_0081 CrossTope Model (D1-EM-D2) Human herpesvirus 4 HHV latent membrane protein 1 159-167 YLQQNWWTL 74886
A0201_0083 CrossTope Model (D1-EM-D2) Human herpesvirus 4 (strain B95-8) HHV Envelope glycoprotein H 420-428 TLFIGSHVV 64794
A0201_0095 PDB Crystal (2VLL) Human immunodeficiency virus 1 HIV-1 gag polyprotein 77-85 SLYNTVATL 59613
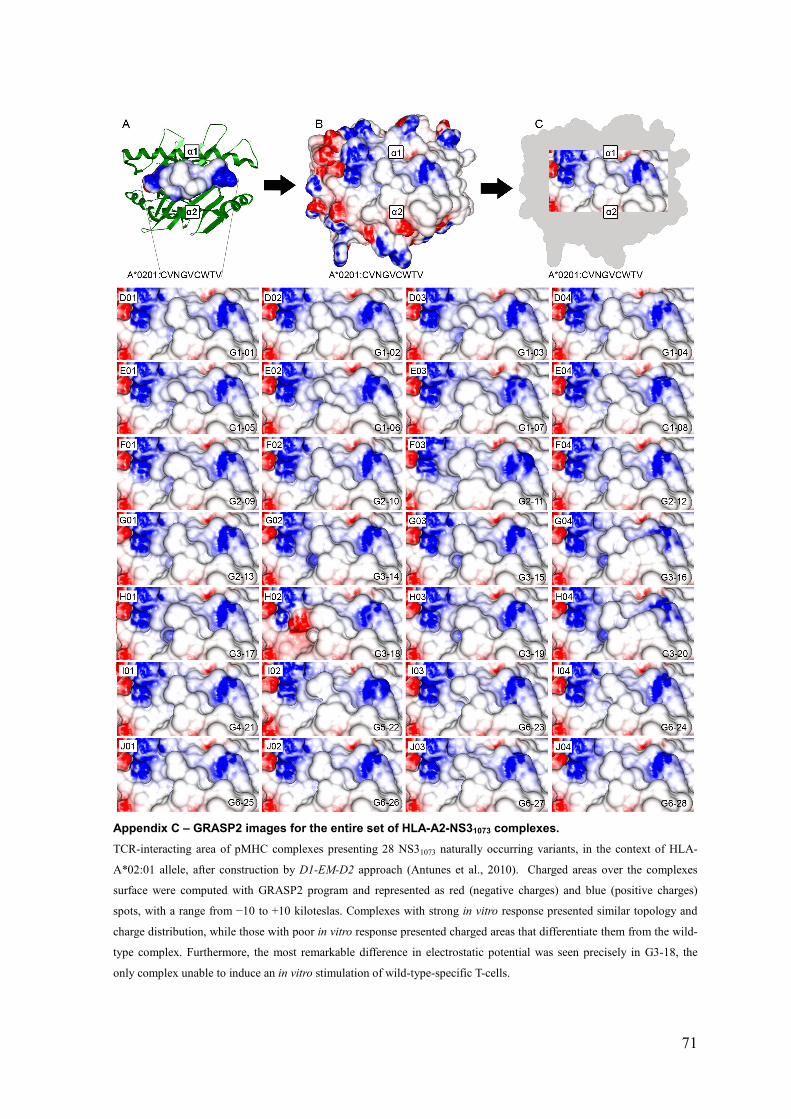
71
Appendix C – GRASP2 images for the entire set of HLA-A2-NS31073 complexes.
TCR-interacting area of pMHC complexes presenting 28 NS31073 naturally occurring variants, in the context of HLA-
A*02:01 allele, after construction by D1-EM-D2 approach (Antunes et al., 2010). Charged areas over the complexes
surface were computed with GRASP2 program and represented as red (negative charges) and blue (positive charges)
spots, with a range from −10 to +10 kiloteslas. Complexes with strong in vitro response presented similar topology and
charge distribution, while those with poor in vitro response presented charged areas that differentiate them from the wild-
type complex. Furthermore, the most remarkable difference in electrostatic potential was seen precisely in G3-18, the
only complex unable to induce an in vitro stimulation of wild-type-specific T-cells.
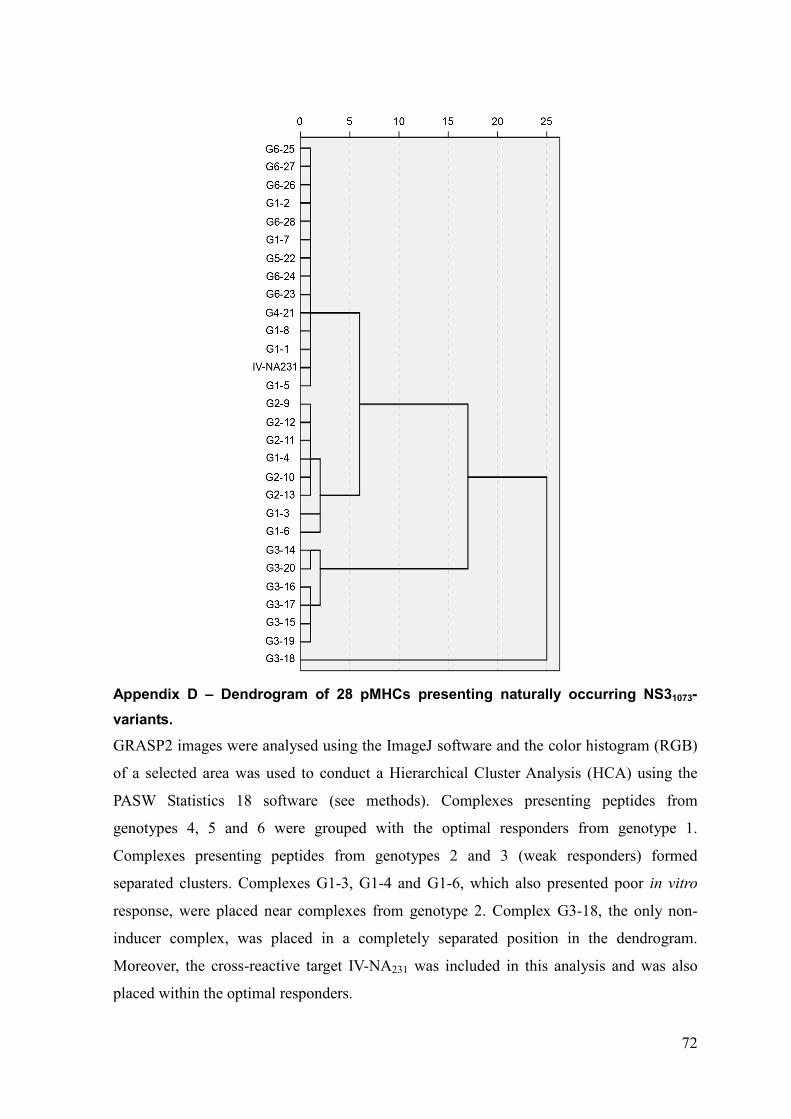
72
Appendix D – Dendrogram of 28 pMHCs presenting naturally occurring NS31073-
variants.
GRASP2 images were analysed using the ImageJ software and the color histogram (RGB)
of a selected area was used to conduct a Hierarchical Cluster Analysis (HCA) using the
PASW Statistics 18 software (see methods). Complexes presenting peptides from
genotypes 4, 5 and 6 were grouped with the optimal responders from genotype 1.
Complexes presenting peptides from genotypes 2 and 3 (weak responders) formed
separated clusters. Complexes G1-3, G1-4 and G1-6, which also presented poor in vitro
response, were placed near complexes from genotype 2. Complex G3-18, the only non-
inducer complex, was placed in a completely separated position in the dendrogram.
Moreover, the cross-reactive target IV-NA231 was included in this analysis and was also
placed within the optimal responders.
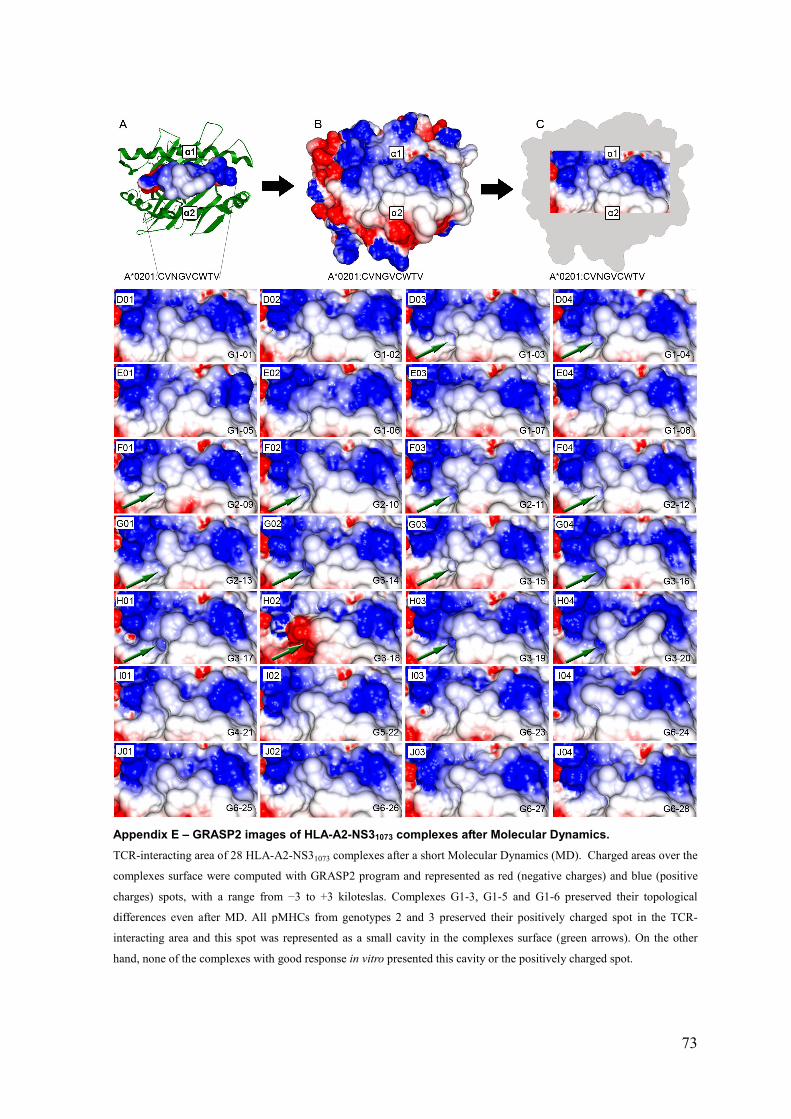
73
Appendix E – GRASP2 images of HLA-A2-NS31073 complexes after Molecular Dynamics.
TCR-interacting area of 28 HLA-A2-NS31073 complexes after a short Molecular Dynamics (MD). Charged areas over the
complexes surface were computed with GRASP2 program and represented as red (negative charges) and blue (positive
charges) spots, with a range from −3 to +3 kiloteslas. Complexes G1-3, G1-5 and G1-6 preserved their topological
differences even after MD. All pMHCs from genotypes 2 and 3 preserved their positively charged spot in the TCR-
interacting area and this spot was represented as a small cavity in the complexes surface (green arrows). On the other
hand, none of the complexes with good response in vitro presented this cavity or the positively charged spot.
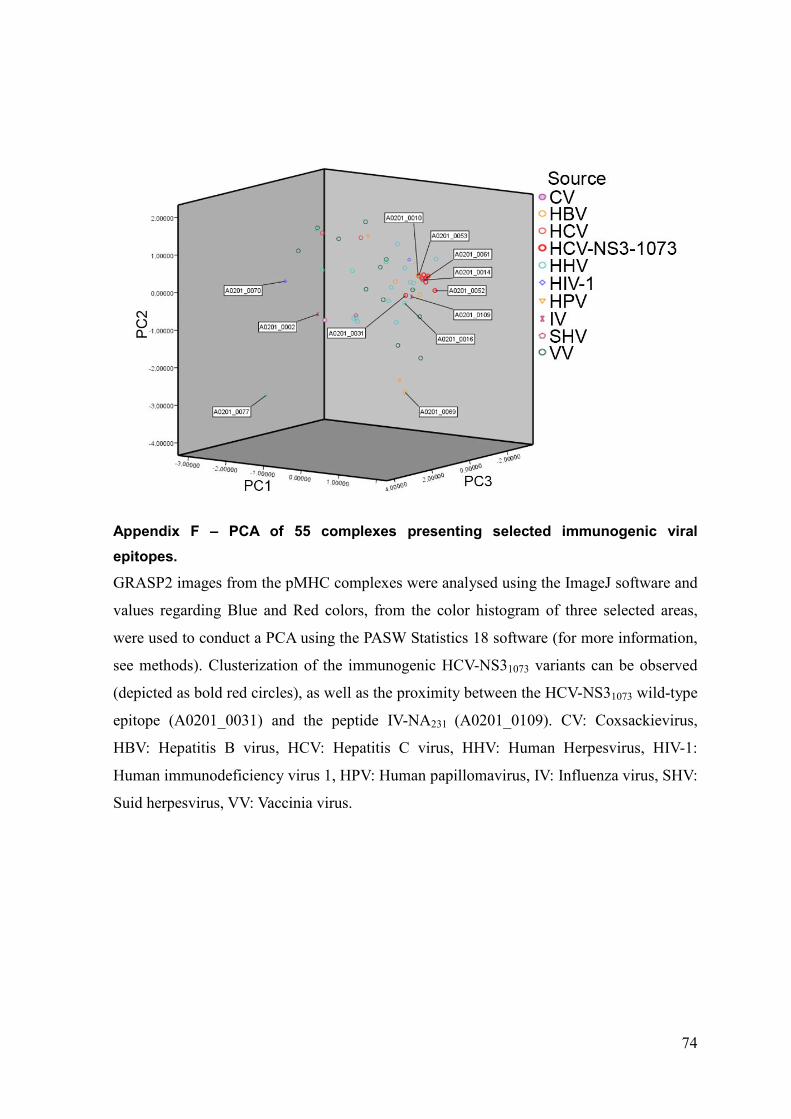
74
Appendix F – PCA of 55 complexes presenting selected immunogenic viral
epitopes.
GRASP2 images from the pMHC complexes were analysed using the ImageJ software and
values regarding Blue and Red colors, from the color histogram of three selected areas,
were used to conduct a PCA using the PASW Statistics 18 software (for more information,
see methods). Clusterization of the immunogenic HCV-NS31073 variants can be observed
(depicted as bold red circles), as well as the proximity between the HCV-NS31073 wild-type
epitope (A0201_0031) and the peptide IV-NA231 (A0201_0109). CV: Coxsackievirus,
HBV: Hepatitis B virus, HCV: Hepatitis C virus, HHV: Human Herpesvirus, HIV-1:
Human immunodeficiency virus 1, HPV: Human papillomavirus, IV: Influenza virus, SHV:
Suid herpesvirus, VV: Vaccinia virus.

75
Appendix G – GRASP2 images of possible targets for cross-reactivity in the context
of HLA-A*02:01 allele.
TCR-interacting surfaces of complexes placed in the same group of HCV-NS31073 variants
in a HCA performed with 55 non-related complexes. A-B: Complexes presented as
possible cross-reactive targets for wild-type-NS31073-specific T-cells. C: The already
described cross-reactive target IV-NA231 in the context of HLA-A*02:01. D-F: Complexes
presenting some structural differences (green arrows). Complex A0201_0095 (B) was
obtained from Protein Data Bank (PDB access code 2V2W). Complex A0201_0076 (E)
presented a positively charged spot in a position that was not represented among the
selected regions, differing from the HLA-A2-NS31073 complex presenting the wild-type
epitope.
76
References
Andrusier N., Mashiach E., Nussinov R. and Wolfson H. J. (2008) Principles of flexible protein-protein
docking. Proteins 73, 271-89.
Antunes D. A., Vieira G. F., Rigo M. M., Cibulski S. P., Sinigaglia M. and Chies J. A. (2010) Structural allele-
specific patterns adopted by epitopes in the MHC-I cleft and reconstruction of MHC:peptide
complexes to cross-reactivity assessment. PLoS One 5, e10353.
Bremel R. D. and Homan E. J. (2010a) An integrated approach to epitope analysis I: Dimensional reduction,
visualization and prediction of MHC binding using amino acid principal components and regression
approaches. Immunome research 6, 7.
Bremel R. D. and Homan E. J. (2010b) An integrated approach to epitope analysis II: A system for
proteomic-scale prediction of immunological characteristics. Immunome research 6, 8.
Cucchiarini M., Kammer A. R., Grabscheid B., Diepolder H. M., Gerlach T. J., Gruner N., Santantonio T.,
Reichen J., Pape G. R. and Cerny A. (2000) Vigorous peripheral blood cytotoxic T cell response
during the acute phase of hepatitis C virus infection. Cell Immunol 203, 111-23.
Engler O. B., Schwendener R. A., Dai W. J., Wölk B., Pichler W., Moradpour D., Brunner T. and Cerny A.
(2004) A liposomal peptide vaccine inducing CD8+ T cells in HLA-A2.1 transgenic mice, which
recognise human cells encoding hepatitis C virus (HCV) proteins. Vaccine 23, 58-68.
Fytili P., Dalekos G. N., Schlaphoff V., Suneetha P. V., Sarrazin C., Zauner W., Zachou K., Berg T., Manns M.
P., Klade C. S., Cornberg M. and Wedemeyer H. (2008) Cross-genotype-reactivity of the
immunodominant HCV CD8 T-cell epitope NS3-1073. Vaccine 26, 3818-26.
Gras S., Saulquin X., Reiser J.-B., Debeaupuis E., Echasserieau K., Kissenpfennig A., Legoux F., Chouquet
A., {Le Gorrec} M., Machillot P., Neveu B., Thielens N., Malissen B., Bonneville M. and Housset
D. (2009) Structural bases for the affinity-driven selection of a public TCR against a dominant
human cytomegalovirus epitope. Journal of immunology (Baltimore, Md. : 1950) 183, 430-7.
Hiroishi K., Eguchi J., Ishii S., Hiraide A., Sakaki M., Doi H., Omori R. and Imawari M. (2010) Immune
response of cytotoxic T lymphocytes and possibility of vaccine development for hepatitis C virus
infection. Journal of biomedicine & biotechnology 2010, 263810.
Jorgensen J. L., Esser U., Fazekas de St Groth B., Reay P. A. and Davis M. M. (1992) Mapping T-cell
receptor-peptide contacts by variant peptide immunization of single-chain transgenics. Nature 355,
224-30.
Kessels H. W., de Visser K. E., Tirion F. H., Coccoris M., Kruisbeek A. M. and Schumacher T. N. (2004) The
impact of self-tolerance on the polyclonal CD8+ T cell repertoire. J Immunol 172, 2324-31.
Korber B., LaBute M. and Yusim K. (2006) Immunoinformatics comes of age. PLoS Comput Biol 2, e71.
Lechner F., Gruener N. H., Urbani S., Uggeri J., Santantonio T., Kammer A. R., Cerny A., Phillips R., Ferrari
C., Pape G. R. and Klenerman P. (2000) CD8+ T lymphocyte responses are induced during acute
hepatitis C virus infection but are not sustained. Eur J Immunol 30, 2479-87.
Petrey D. and Honig B. (2003) GRASP2: visualization, surface properties, and electrostatics of
macromolecular structures and sequences. Methods Enzymol 374, 492-509.
Prince A. M., Brotman B., Lee D. H., Pfahler W., Tricoche N., Andrus L. and Shata M. T. (2005) Protection
against chronic hepatitis C virus infection after rechallenge with homologous, but not heterologous,
genotypes in a chimpanzee model. J Infect Dis 192, 1701-9.
Rammensee H., Bachmann J., Emmerich N. P., Bachor O. A. and Stevanovic S. (1999) SYFPEITHI:
database for MHC ligands and peptide motifs. Immunogenetics 50, 213-9.
Rappuoli R. (2000) Reverse vaccinology. Curr Opin Microbiol 3, 445-50.
Rehermann B. and Nascimbeni M. (2005) Immunology of hepatitis B virus and hepatitis C virus infection.
Nat Rev Immunol 5, 215-29.
Rigo M., Antunes D., Vieira G. and Chies J. (2009) MHC: Peptide Analysis: Implications on the
Immunogenicity of Hantaviruses’ N protein, Vol. 5676, p. 160-163. Springer Berlin / Heidelberg.
Rudolph M. G., Stanfield R. L. and Wilson I. A. (2006) How TCRs bind MHCs, peptides, and coreceptors.
Annual review of immunology 24, 419-66.
Schlaphoff V., Klade C. S., Jilma B., Jelovcan S. B., Cornberg M., Tauber E., Manns M. P. and Wedemeyer
H. (2007) Functional and phenotypic characterization of peptide-vaccine-induced HCV-specific
CD8+ T cells in healthy individuals and chronic hepatitis C patients. Vaccine 25, 6793-806.
Soderholm J., Ahlen G., Kaul A., Frelin L., Alheim M., Barnfield C., Liljestrom P., Weiland O., Milich D. R.,
77
Bartenschlager R. and Sallberg M. (2006) Relation between viral fitness and immune escape within
the hepatitis C virus protease. Gut 55, 266-74.
Thimme R., Bukh J., Spangenberg H. C., Wieland S., Pemberton J., Steiger C., Govindarajan S., Purcell R.
H. and Chisari F. V. (2002) Viral and immunological determinants of hepatitis C virus clearance,
persistence, and disease. Proc Natl Acad Sci U S A 99, 15661-8.
Tian F., Lv F., Zhou P., Yang Q. and Jalbout A. F. (2008) Toward prediction of binding affinities between the
MHC protein and its peptide ligands using quantitative structure-affinity relationship approach.
Protein Pept Lett 15, 1033-43.
Tong J. C. and Ren E. C. (2009) Immunoinformatics: Current trends and future directions. Drug Discov
Today 14, 684-9.
Trott O. and Olson A. J. (2009) AutoDock Vina: Improving the speed and accuracy of docking with a new
scoring function, efficient optimization, and multithreading. J Comput Chem.
Turner S. J., Doherty P. C., McCluskey J. and Rossjohn J. (2006) Structural determinants of T-cell receptor
bias in immunity. Nature reviews. Immunology 6, 883-94.
Vali B., Tohn R., Cohen M., Sakhdari A., Sheth P. M., Yue F. Y., Wong D., Kovacs C., Kaul R. and Ostrowski
M. A. (2010) Characterization of cross-reactive CD8+ T-cell recognition of HLA-A2-restricted HIV-
Gag: SLYNTVATL and HCV-NS5b: ALYDVVSKL epitopes in individuals infected with Human
Immunodeficiency and Hepatitis C Viruses. Journal of virology, JVI.01743-10-.
Van Der Spoel D., Lindahl E., Hess B., Groenhof G., Mark A. E. and Berendsen H. J. (2005) GROMACS:
fast, flexible, and free. J Comput Chem 26, 1701-18.
Vertuani S., Bazzaro M., Gualandi G., Micheletti F., Marastoni M., Fortini C., Canella A., Marino M.,
Tomatis R., Traniello S. and Gavioli R. (2002) Effect of interferon-alpha therapy on epitope-specific
cytotoxic T lymphocyte responses in hepatitis C virus-infected individuals. Eur J Immunol 32, 144-
54.
Vieira G. F. and Chies J. A. (2005) Immunodominant viral peptides as determinants of cross-reactivity in the
immune system--Can we develop wide spectrum viral vaccines? Med Hypotheses 65, 873-9.
Vita R., Zarebski L., Greenbaum J. a., Emami H., Hoof I., Salimi N., Damle R., Sette A. and Peters B. (2010)
The immune epitope database 2.0. Nucleic acids research 38, D854-62.
Wang S., Kennedy J. S., West K., Montefiori D. C., Coley S., Lawrence J., Shen S., Green S., Rothman A. L.,
Ennis F. A., Arthos J., Pal R., Markham P. and Lu S. (2008) Cross-subtype antibody and cellular
immune responses induced by a polyvalent DNA prime-protein boost HIV-1 vaccine in healthy
human volunteers. Vaccine 26, 1098-110.
Wedemeyer H., He X.-S., Nascimbeni M., Davis A. R., Greenberg H. B., Hoofnagle J. H., Liang T. J., Alter
H. and Rehermann B. (2002) Impaired Effector Function of Hepatitis C Virus-Specific CD8+ T
Cells in Chronic Hepatitis C Virus Infection. J. Immunol. 169, 3447-3458.
Wedemeyer H., Mizukoshi E., Davis A. R., Bennink J. R. and Rehermann B. (2001) Cross-reactivity between
hepatitis C virus and Influenza A virus determinant-specific cytotoxic T cells. J Virol 75, 11392-400.
Yu C. I. and Chiang B.-L. (2010) A new insight into hepatitis C vaccine development. Journal of biomedicine
& biotechnology 2010, 548280.
Capítulo IV
Discussão Geral
79
5 Discussão Geral
A ligação de peptídeos à fenda do MHC-I e a apresentação destes complexos
na superfície das células são passos centrais na montagem da Resposta Imune
Celular (RIC), constituindo a etapa final de uma série de vias alternativas. O
importante papel desempenhado por estas vias na vigilância contra infecções virais
confere uma posição de destaque ao complexo peptídeo:MHC-I (pMHC) no que se
refere à pesquisa básica relacionada ao desenvolvimento de vacinas. A determinação
da estrutura tridimensional de complexos pMHC tem se mostrado um grande desafio,
sobretudo devido a grande variabilidade do sistema MHC e a crescente variabilidade
das partículas virais. Este problema atraiu a atenção de diversos grupos de pesquisa,
muitos dos quais têm empregado ferramentas de bioinformática estrutural para
desenvolver abordagens capazes de predizer a estrutura de complexos pMHC.
O Docking, ou “Ancoramento” Molecular, destaca-se como uma das
ferramentas mais empregadas neste contexto, embora o grande número de ligações
flexíveis apresentadas por um peptídeo típico – restrito à MHC-I – exceda a
capacidade de resolução da maioria dos softwares disponíveis. A alternativa para
superar este obstáculo é o uso combinado do docking com ferramentas de
modelagem, ou ainda, a divisão da estrutura do peptídeo em problemas menores,
como cadeia principal e cadeias laterais. Um resumo das estratégias utilizadas para
determinar a estrutura tridimensional de complexos pMHC foi publicado por Bordner e
colaboradores em 2006 (Bordner & Abagyan, 2006). No mesmo trabalho, os autores
descrevem um novo método para docking de peptídeos em estruturas de MHC, o
qual foi testado pela comparação de 23 cristais do PDB com o resultado do docking-
cruzado (cross-docking) de 14 peptídeos em uma estrutura de HLA-A*02:01 (alelo de
MHC humano) e 9 peptídeos em uma estrutura de H2-Kb (alelo de MHC murino).
Este método conseguiu reproduzir estes 23 complexos pMHC com um RMSD (do
inglês Root Mean Square Deviation) médio de 1.09 Å para os complexos do alelo
humano e 0.66 Å para os complexos do alelo murino, considerando-se apenas os
átomos da cadeia principal do peptídeo. O RMSD para os átomos das cadeias
laterais dos resíduos enterrados nos pockets da fenda do MHC (“âncoras”) também
apresentou valores inferiores a 2 Å em ambos os sistemas, embora o RMSD das
cadeias laterais dos demais aminoácidos não tenha sido apresentado pelos autores.
De modo geral, pode-se concluir que o método apresentado por Bordner e

80
colaboradores permitiu reproduzir a conformação da cadeia principal dos peptídeos
apresentados pelos dois alelos de MHC em estudo. No entanto, a conformação da
cadeia principal do peptídeo representa apenas uma parte do problema, e a ausência
de informação à respeito do desvio (RMSD) considerando-se todos os átomos do
epitopo sugere uma importante limitação do método na predição conformacional de
complexos pMHC.
Os estudos estruturais envolvendo complexos pMHC podem estar voltados a
dois objetivos distintos: determinação da geometria do complexo ou determinação da
afinidade de ligação do peptídeo. A conformação adotada pela cadeia principal do
peptídeo na fenda do MHC, bem como a posição dos resíduos de ancoragem,
desempenham um importante papel na determinação da afinidade de um dado
epitopo por um dado alelo de MHC. A conformação das cadeias laterais dos demais
resíduos, por outro lado, não apresenta grande relevância para a predição de
afinidade. No entanto, a conformação das cadeias laterais dos resíduos centrais do
peptídeo, normalmente voltadas para fora da fenda do MHC, são fundamentais para
a especificidade do reconhecimento deste complexo pMHC por um dado TCR.
Considerando estes dois enfoques, cabe aqui salientar o bom resultado apresentado
por Bordner e colaboradores (Bordner & Abagyan, 2006) quanto à predição da
afinidade de ligação. Eles empregaram a metodologia desenvolvida para construir
uma série de complexos pMHC apresentando ligantes do alelo HLA-A*02:01, depois
utilizaram estes complexos para treinar uma ferramenta de inteligência artificial (SVM,
do inglês Support Vector Machines) a qual foi então capaz de classificar corretamente
ligantes e não-ligantes de HLA-A*02:01 em uma população de 608 peptídeos
(acurácia de 78%). Esta mesma ferramenta (SVM treinada em um banco de
complexos HLA:peptídeo), também apresentou sucesso na predição de afinidade de
54 peptídeos de H2-Kb.
Bordner e colaboradores fazem esta distinção entre a determinação da
geometria e a determinação da afinidade. Apesar dos bons resultados apresentados
com relação a ambos, esta metodologia não poderia ser empregada em um estudo
voltado à análise da região de interação com o TCR, uma vez que a técnica não se
mostrou capaz de determinar a conformação de todas as cadeias laterais do
peptídeo. Além disso, esta metodologia também desconsidera a flexibilidade das
cadeias laterais da fenda do MHC. Isso é apontado pelos autores como uma das
81
limitações da técnica visto que o melhor ajuste da fenda poderia contribuir com a
ligação do peptídeo. No entanto, os autores ponderam que o aumento nos graus de
liberdade iria provavelmente reduzir a acurácia do método, bem como aumentar o
tempo necessário para a construção de cada complexo. Este método exige um
grande conhecimento das ferramentas por parte do usuário e inclui etapas de
minimização do peptídeo por simulações de Monte Carlo, as quais podem demandar
um grande tempo computacional dependendo do tamanho do ligante.
Publicado no início de 2008 e disponível na internet desde o ano anterior, o
servidor MHCsim (http://igrid-ext.cryst.bbk.ac.uk/MHCsim/) permite ao usuário
construir complexos pMHC em poucos minutos, diretamente através da página na
internet e sem exigir qualquer conhecimento prévio das ferramentas de bioinformática
estrutural (Todman et al., 2008). Com muita facilidade, o usuário informa a sequência
do peptídeo e o alelo de MHC de interesse, podendo em seguida baixar o arquivo
pdb com as coordenadas espaciais do complexo que acabou de ser construído.
Apesar de rápido e prático, o serviço fornecido pelo MHCsim não é completo. Ao
receber os dados do usuário o servidor faz uma busca em um banco estrutural
próprio, derivado do PDB, tentando encontrar estruturas cuja sequência do MHC e do
peptídeo coincidam com o pedido do usuário. Na ausência desta estrutura, o servidor
escolhe o alinhamento com o melhor escore (considerando apenas a sequência) e
altera a estrutura referente a esta sequência (“muta” a estrutura) até torná-la igual a
sequência fornecida pelo usuário. Ao final deste processo, o servidor fornece um
arquivo contendo uma estrutura referente ao complexo desejado. Não há, no entanto,
qualquer garantia de que a conformação do peptídeo apresentada neste arquivo
realmente corresponda a geometria “final” do complexo pMHC desejado. A função do
MHCsim, portanto, não seria a de predizer a estrutura de complexos pMHC ou avaliar
a afinidade de ligação de um dado peptídeo, mas sim, de fornecer um arquivo de
coordenadas que possa ser posteriormente utilizado em etapas de refinamento
(modelagem) ou de dinâmica molecular (Vivona et al., 2008). Além disso, o servidor
apresenta algumas limitações técnicas. Ele permite a construção de complexos com
diversos alelos de MHC humanos, inclusive muitos ainda não cristalografados, mas
não permite a construção de complexos com alelos de nenhuma outra espécie. Ele
também só permite a construção de complexos apresentando peptídeos nonâmeros

82
(9-mers), embora muitos alelos de MHC também aceitem peptídeos com 8, 10 e até
11 aminoácidos.
Em setembro de 2010 foi publicado o pDOCK, a mais recente proposta
metodológica para docking de peptídeos em moléculas de MHC (Khan &
Ranganathan, 2010). Esta proposta também está baseada no cálculo de mapas de
interação molecular (GRID maps) e em etapas de minimização local utilizando Monte
Carlo, tendo sido testada através da reprodução de 149 complexos pMHC (RMSD Cα
< 2.5 Å). Os autores destacam ainda que 83% destas reproduções obtiveram um
desvio menor que 1 Å, considerando-se apenas os carbonos alfa do peptídeo (RMSD
Cα < 1 Å). Khan e Ranganathan apresentam uma ampla validação de seu método, o
qual demonstrou desempenho superior a métodos anteriormente publicados, na
reprodução de complexos com diferentes alelos humanos e murinos. No entanto,
embora esta abordagem inclua o cálculo da interação das cadeias laterais com a
fenda do MHC, bem como etapas de minimização destas cadeias laterais, não são
apresentados quaisquer dados a respeito do desvio das cadeias laterais dos
peptídeos reproduzidos. Assim como anteriormente discutido com relação ao método
descrito por Bordner e colaboradores (Bordner & Abagyan, 2006), o pDOCK não
poderia ser empregado em um estudo mais detalhado da superfície de complexos
pMHC, uma vez que permanece desconhecida sua capacidade de reproduzir com
precisão a conformação das cadeias laterais dos peptídeos.
O nosso grupo vem desenvolvendo, desde o início de 2008, uma alternativa
própria para a construção de complexos pMHC, visando aplicação no estudo in silico
de reatividade cruzada. Este objetivo se tornou viável à partir da identificação de
padrões conformacionais adotados por diferentes epitopos, quando apresentados por
um mesmo alelo de MHC. Esta observação foi inicialmente realizada em alelos
murinos (H2-Db e H2-Kb), os quais foram utilizados durante as etapas iniciais do
desenvolvimento da nova metodologia para a construção de complexos pMHC
(Antunes, 2008). Considerando-se que já seja conhecida a conformação adotada pela
cadeia principal dos peptídeos apresentados por um dado alelo de MHC (padrão
estrutural alelo-específico), torna-se possível assumir esta conformação para a
cadeia principal de um novo peptídeo (que se deseja modelar) e então focar a
atenção na resolução da conformação das cadeias laterais, e sua interação com a
fenda do MHC. Em nossa metodologia, este objetivo é alcançado através do docking

83
molecular. Conforme apresentado em maiores detalhes no capítulo II, a nossa técnica
também inclui uma etapa de Minimização de Energia (EM), visando ajuste das
cadeias laterais do MHC, e finalmente uma rodada de docking que irá determinar a
estrutura tridimensional do complexo pMHC em estudo. Considerando-se estas três
etapas, a metodologia foi batizada com a sigla D1-EM-D2 (do inglês Docking 1 -
Energy Minimization - Docking 2) (Antunes et al., 2010).
Existem vários programas para realizar o docking molecular, tanto pagos
quanto gratuitos, sendo que a nossa técnica foi inicialmente padronizada utilizando o
programa gratuito AutoDock (Morris, 1998). Durante as etapas iniciais deste projeto
de mestrado, foi publicada uma nova ferramenta gratuita para cálculos de docking.
Esta ferramenta, chamada AutoDock Vina (Trott & Olson, 2009), apresentava uma
série de vantagens com relação aos demais programas gratuitos. Dentre suas
características, se destacam o cálculo integrado dos mapas de interação (etapa única
para GRID e docking), o uso de uma nova função de escore, e a utilização de
processamento em paralelo, as quais acabaram determinando sua inclusão em nossa
metodologia. A simplicidade quanto aos dados de entrada e de saída do programa
também permitiu a automatização de várias etapas do processo de construção de
complexos pMHC, incluindo a conversão de arquivos, a etapa de minimização de
energia e a geração dos arquivos de entrada para o segundo docking. Além do
excelente desempenho verificado por nosso grupo na reprodução de complexos
pMHC (desempenhando papel central na abordagem D1-EM-D2), o AutoDock Vina
também foi apontado por outros grupos como sendo um programa rápido e eficiente
(Chang et al., 2010).
A metodologia D1-EM-D2 foi validada pela reprodução de 46 cristais de
complexos pMHC disponíveis no PDB, reproduzindo com sucesso complexos de três
alelos distintos, apresentando peptídeos com 8, 9 e até 10 aminoácidos (de acordo
com as restrições de cada alelo). As estruturas preditas apresentaram um desvio
médio de 1,754 Å (± 0.4675 Å), considerando-se não apenas os átomos da cadeia
principal ou os carbonos alfa, mas todos os átomos do peptídeo. Conforme
mencionado no capítulo III, esta técnica também foi posteriormente padronizada para
o alelo de MHC humano HLA-B*27:05. Adicionalmente, esta técnica foi aplicada na
construção de uma série de complexos pMHC apresentando peptídeos virais
imunogênicos, os quais estão sendo compilados para liberação como parte de um
84
banco de dados voltado ao estudo de reatividade cruzada (Sinigaglia, M.,
comunicação pessoal). Este banco, batizado de CrossTope (www.crosstope.com.br),
já abriga mais de 200 estruturas contendo peptídeos virais no contexto de quatro
alelos de MHC (HLA-A*02:01, HLA-B*27:05, H2-Db e H2-Kb). Além de permitir a
comparação entre as superfícies destes complexos, o CrossTope fornece todos os
dados sobre o alelo de MHC e o peptídeo apresentado, oferecendo vários atalhos
para outros bancos e permitindo ainda o acesso aos dados estruturais e aos mapas
de carga de cada complexo.
A metodologia D1-EM-D2 está sendo preparada para incorporação no banco
CrossTope, onde deverá ser oferecida como uma ferramenta acessível e confiável
para a construção de complexos pMHC. No entanto, ao mesmo tempo em que
simplifica o processo de construção de complexos pMHC, o uso de padrões
conformacionais para a cadeia principal do peptídeo também representa a principal
limitação desta técnica. Tais padrões alelo-específicos só podem ser determinados
pela observação de um conjunto de cristais (ou estruturas obtidas por NMR) contendo
a mesma molécula de MHC, mas apresentando em cada caso um peptídeo distinto.
Tendo em vista as limitações apresentadas na introdução quanto a determinação de
complexos pMHC por métodos experimentais (seção 1.11), existe no momento um
número limitado de alelos para os quais esta metodologia já pode ser padronizada.
Considerando que estes padrões alelo-específicos são impostos aos peptídeos em
função de características da fenda do MHC, nosso grupo vem trabalhando em
alternativas que permitam predizer estes padrões a partir da modelagem de novos
alelos de MHC. Alternativamente, poderíamos determinar estes padrões pelo uso de
abordagens já descritas na literatura. O pDOCK, por exemplo, parece ser capaz de
predizer com elevada eficiência e acurácia a conformação da cadeia principal de
peptídeos apresentados por um dado alelo de MHC, mesmo na ausência de
informação estrutural sobre este alelo. Após a utilização do pDOCK em um conjunto
de complexos pMHC, poderíamos proceder com a padronização da nossa própria
metodologia e, finalmente, iniciar a construção dos complexos pMHC apresentando
todos os peptídeos descritos para aquele alelo.
Conforme apresentado no capítulo II, nossa metodologia foi inicialmente
empregada na construção de 10 complexos apresentando peptídeos sintéticos no
contexto do alelo humano HLA-A*02:01. Estes peptídeos haviam sido obtidos pela

85
substituição, por uma alanina, em cada uma das nove posições do epitopo
imunodominante HCV-NS31073 (CINGVCWTV). Os dados referentes à estimulação in
vitro destes complexos frente a uma população de linfócitos T, previamente
estimulada com o peptídeo selvagem, já haviam sido publicados anteriormente e
serviram como controle para as nossas análises. O Objetivo deste trabalho era
verificar se características estruturais destes complexos poderiam explicar a grande
variabilidade observada in vitro, onde mesmo algumas mutações conservadas foram
capazes de afetar o reconhecimento pela população de linfócitos T utilizada nos
testes. Corroborando a hipótese de estudo, complexos que estimularam em altos
níveis a produção de IFN-gama apresentaram superfícies praticamente idênticas ao
complexo contendo o peptídeo selvagem. Esta semelhança foi tanto topológica
quanto em termos de potencial eletrostático. Por outro lado, complexos que induziram
baixa produção de IFN-gama apresentaram algumas diferenças estruturais que
puderam ser identificadas.
Neste contexto, foi discutido o caso do complexo 6, o qual parecia ser uma
exceção em nossas análises. Sua superfície era muito semelhante a superfície do
complexo 2, o qual apresentava fraca estimulação in vitro. Ambos estes complexos (2
e 6), apresentavam diferenças topológicas com relação ao complexo 10 (contendo o
epitopo selvagem) e, assim sendo, era de se esperar que ambos induzissem baixos
níveis de IFN-gama. Contrariando esta expectativa, o complexo 6 estimulava níveis
intermediários de produção desta citocina nos ensaios in vitro. No entanto,
recentemente nós realizamos uma ampla verificação de todos os complexos pMHC
construídos por nosso grupo, tendo sido identificado um erro de sequência no epitopo
presente na estrutura do complexo 6. Estando a estrutura incorreta, os dados
apresentados no capitulo I, referentes aos valores de ASA do complexo 6 e sua
superfície, devem ser desconsiderados. A análise da estrutura correta referente ao
complexo 6 (HLA-A*0201:CINGVCWAV) corrobora a hipótese original do trabalho,
visto que sua superfície não se assemelha a superfície do complexo 2. Na realidade,
sua topologia está mais próxima daquela apresentada pelo complexo 7, o outro
complexo que apresentou níveis intermediários de estimulação dos CTLs no
ELISPOT realizado por Fytili e colaboradores.
Visando esclarecer este equívoco, uma errata foi redigida e submetida como
um comentário na página que contém o nosso artigo, junto ao sitio da revista PLoS
86
One (Anexo 1). Uma versão corrigida da figura 4 (capítulo II) também é fornecida em
anexo (Anexo 2). Sobre a análise topológica dos pMHCs apresentados nesta figura,
cabe ainda ressaltar algumas considerações sobre os complexos 1 e 5. Dentre os
peptídeos sintéticos avaliados, o complexo 5 apresentou uma das piores respostas in
vitro. No capítulo II é discutida a possível influência do anel indólico do triptofano (p7),
que estando voltado para a extremidade amino-terminal do peptídeo (apenas neste
complexo), causa uma alteração de topologia e a redução de uma área positivamente
carregada sobre a extremidade N-terminal do peptídeo. No entanto, considerando-se
os resultados apresentados no capítulo III, poderíamos sugerir uma explicação
alternativa para a redução da resposta frente a uma população de linfócitos
específica contra o peptídeo selvagem NS31073. A análise dos 28 complexos
apresentando variantes naturais deste epitopo de HCV evidenciou a influência de
uma região positivamente carregada no centro na área de interação com o TCR,
referida com região S1 no capítulo III. Esta "mancha", gerada por uma carga positiva,
estava presente em todos os complexos que apresentaram fraca estimulação in vitro
(exceto G3-18) e não estava presente nos complexos que apresentaram reatividade
cruzada com o pMHC contendo o peptídeo selvagem (G1-1). O complexo
apresentando o peptídeo "CIAGVCWTV" (Seq5, capítulo II) também apresenta uma
carga positiva na mesma região S1, a qual poderia ser a principal responsável pela
redução da resposta estimulada por este complexo.
O complexo 1 (capítulo II) também apresenta uma considerável semelhança
estrutural com o complexo 10, embora tenha apresentado fraca estimulação dos
linfócitos T pré-sensibilizados com o peptídeo selvagem (seq10). Esta questão não foi
discutida no segundo capítulo, visto que este epitopo (Seq1) apresenta uma
substituição justamente na posição de ancoragem ao alelo HLA-A*02:01. Mesmo pela
simples análise da sequência, é possível determinar o forte impacto acarretado por
esta alteração sobre a afinidade do peptídeo a este alelo de MHC. A predição do IC50
de ligação (do inglês Half maximal Inhibitory Concentration), por exemplo, indica um
valor de 66,49 nM para a sequência selvagem (CINGVCWTV) e um valor muito maior
(menor afinidade), de 963.87 nM, para a sequência mutada (CINGVCWTA). Estes
valores foram fornecidos pela ferramenta de predição de ligação ao MHC-I
disponibilizada pelo Immune Epitope Database – IEDB (http://www.iedb.org/),
utilizando-se o método ANN (do inglês Artificial Neural Network). Assim sendo,
87
parece evidente que a redução da resposta induzida pelo complexo 1 não seja
determinada pela ausência de características topológicas ou eletrostáticas, mas sim,
pela menor estabilidade do complexo na superfície celular, a qual é determinada pela
redução da afinidade de ligação do peptídeo.
O alelo humano HLA-A*02:01 possui dois sítios de ancoragem que
correspondem as posições p2 e p9 dos peptídeos nonâmeros. Conforme já discutido,
a substituição de um dos aminoácidos âncora por uma alanina (V9A) acarreta uma
importante redução da afinidade do ligante. Fytili e colaboradores (Fytili et al., 2008)
avaliaram a afinidade de ligação de 28 variantes do epitopo NS31073, tendo observado
uma certa variabilidade no escore de ligação, sobretudo considerando-se os epitopos
do genótipo 1 (capítulo III). Esta variabilidade, no entanto, não correspondeu à
variação de imunogenicidade observada in vitro. O complexo G1-2, por exemplo,
apresentou um dos piores escores de ligação e, no entanto, apresentou altos níveis
de estimulação em praticamente todos os ensaios realizados. É importante ressaltar
que os valores de IC50 são normalmente utilizados para realizar uma separação
qualitativa dos ligantes em três categorias: Ótimos ligantes (IC50≤50), ligantes com
afinidade intermediária (50<IC50≤500) e ligantes fracos ou não-ligantes (IC50>500). A
valor de IC50 predito pelo IEDB para o peptídeo G1-2 (292,89 nM), apesar de maior, o
coloca na mesma categoria qualitativa ocupada pelos peptídeos selvagens
(CVNGVCWTV - IC50 = 110,78 nM; CINGVCWTV - IC50 = 66, 49 nM). Estes valores
de IC50 foram calculados pelo mesmo método citado no parágrafo anterior (ANN), o
que nos permite observar que a substituição por uma alanina em p9 (V9A) foi
suficiente para classificar o peptídeo do complexo 1 (Seq1, capítulo II) como um fraco
ligante de HLA-A*02:01.
Dentre os 10 peptídeos discutidos no capítulo II, foi estudado o peptídeo com
substituição na outra posição de ancoragem ao HLA-A*02:01 (V2A, Seq7). A predição
de IC50 para esta sequência (CANGVCWTV), pelo método ANN, a classifica como
fraco ligante de HLA-A*02:01 (IC50 = 950,71 nM). Curiosamente, o complexo contendo
este peptídeo (complexo 7, capítulo II) apresentou um desempenho intermediário no
ELISPOT realizado por Fytili e colaboradores. A pequena diferença entre os valores
de IC50 preditos para os dois peptídeos com substituições nos aminoácidos âncoras
(Seq1 e Seq7) certamente não pode ser responsabilizada pela variação de resposta
observada in vitro. Cabe ainda ressaltar que esta diferença é menor considerando-se
88
outros métodos para o cálculo da afinidade (Anexo 3), embora o método ANN ainda
seja referido como a metodologia com maior acerto na predição da afinidade de
ligação à moléculas de MHC-I (Buus et al., 2003). A análise da superfície, neste caso,
também não indica diferenças significativas entre os dois complexos. Estes dados
nos fazem retomar a discussão iniciada no final do terceiro capítulo, evidenciando
que nenhuma análise isolada será capaz de responder por toda a variabilidade
observada no complexo sistema de reconhecimento de pMHCs por Receptores de
Células T poli-específicas. Existem ainda vários outros detalhes que precisam ser
considerados, cada um realizando uma pequena contribuição para o entendimento
mais geral e preciso de todos os aspectos envolvidos na estimulação in vivo de
linfócitos T.
No segundo capítulo desta dissertação, foi apresentada outra análise que
poderia contribuir para o entendimento da variabilidade observada nos experimentos
de estimulação de linfócitos T. O cálculo da Área Acessível ao Solvente (ASA, do
inglês Accessible Surface Area) tem sido empregado em dinâmica molecular, na
modelagem de proteínas e na triagem de bancos de pequenas moléculas (Arnautova
et al., 2011; Seifert et al., 2007). No campo da imunologia, o valor de ASA já foi
correlacionado com imunogenicidade (Meijers et al., 2005) e também utilizado no
estudo do reconhecimento de pMHCs por TCRs (Davis-Harrison et al., 2007). De
acordo com nossos resultados, mesmo pequenas diferenças nos valores de ASA,
especialmente em p5 (posição central no contato com o TCR), parecem alterar
significativamente o reconhecimento de complexos pMHC. Peptídeos que
estimularam os níveis mais altos na produção de IFN-gama apresentaram os gráficos
de ASA com melhor ajuste ao gerado pelo peptídeo selvagem. Esta observação foi
válida tanto para a análise dos 10 peptídeos sintéticos quanto para a análise das 28
variantes naturais do peptídeo NS31073, as quais foram abordadas em maiores
detalhes no terceiro capítulo. Especialmente neste segundo conjunto de dados,
também foi observado que as variantes com maior desvio nos valores de ASA foram
justamente aquelas que apresentaram os menores níveis quanto a produção de IFN-
gama nos testes in vitro.
A análise de ASA para os dois peptídeos com substituições nos aminoácidos
de ancoragem ao HLA-A*02:01 (Seq1 e Seq7, capítulo II) indica um melhor ajuste
nos valores do peptídeo com resposta intermediária (Seq7) do que nos valores do
89
peptídeo com resposta fraca (Seq1) (Anexo 4). Tomando sempre como referência os
peptídeos com resposta elevada (Seq8, Seq9 e Seq10). Esta diferença se refere
principalmente a p5, embora o peptídeo Seq1 também tenha apresentado valores de
ASA mais baixos em outras posições. Ainda considerando a posição p5, os valores
de ambos os peptídeos (Seq1 e Seq7) foram bastante superiores ao apresentado
pelo único complexo que não apresentou resposta in vitro (Seq3).
Avaliando o comportamento dos dois peptídeos que apresentaram níveis
intermediários de estimulação (Seq6 e Seq7, capítulo II), percebemos que a presença
em p8 de uma alanina, aminoácido com uma cadeia lateral muito pequena, afetou
bastante o gráfico de ASA do peptídeo Seq6. Em concordância com esta redução nos
valores de ASA, este peptídeo apresentou uma estimulação in vitro um pouco inferior
àquela apresentada pelo epitopo Seq7. Naturalmente, existem variações que
enfraquecem o poder preditivo da ASA. O peptídeo Seq6 não apresentou apenas um
valor reduzido em p8, ele também possui um valor de ASA em p5 quase idêntico
(mas inferior) ao apresentado pelo peptídeo Seq1 (que apresentou fraca estimulação
in vitro). Uma avaliação baseada apenas nos valores de ASA indicaria uma vantagem
do peptídeo Seq1 sobre o peptídeo Seq6, quanto a probabilidade de induzir uma
resposta cruzada com o peptídeo selvagem NS31073. No entanto, conforme
apresentado anteriormente, o peptídeo Seq1 foi classificado como fraco ligante de
HLA-A*0201 (963,87 nM), enquanto o peptídeo Seq6 foi classificado como um bom
ligante para este alelo (89,37 nM), segundo o mesmo método de predição (ANN).
Enquanto a análise de ASA e de superfície nos trazem informações sobre a etapa
final do processo (reconhecimento pelo TCR), a afinidade de ligação ao MHC nos
informa sobre etapas anteriores deste mesmo processo de apresentação de
peptídeos via MHC-I. Um peptídeo com menor afinidade de ligação sugere uma
menor estabilidade deste complexo na superfície celular, o que consequentemente
reduzirá a capacidade de estimulação deste complexo (em função do tempo de
permanência e da menor probabilidade de interação com um TCR),
independentemente de ele possuir as características estruturais que seriam
reconhecidas por uma população de linfócitos T especifica.
Apesar de não considerar a influência de fatores como afinidade e
estabilidade, a análise da superfície de complexos pMHC, sobretudo no que se refere
ao potencial eletrostático, se destaca como uma medida capaz de fornecer
90
indicações importantes acerca do potencial para o reconhecimento cruzado. Os
resultados apresentados no capítulo III reforçam esta conclusão, sobretudo
considerando-se a confirmação dos dados através da Análise dos Componentes
Principais (PCA, do inglês Principal Component Analysis). Apesar de termos
realizado previamente um agrupamento visual dos complexos gerados, do mesmo
modo realizado no capítulo II, este agrupamento de forma alguma direcionou ou
influenciou os resultados obtidos pelo PCA. Foi identificado que a região S1 era o
principal ponto de divergência entre as imagens, mas dada a variação na intensidade
(bastante sutil em alguns casos) não poderíamos garantir visualmente a existência de
quaisquer agrupamentos. Foram então extraídos os valores referentes aos
componentes RGB (do inglês Red, Green, Blue) da área correspondente à seleção
S1, para utilização como entrada em uma PCA.
Também tomamos o cuidado de incluir nesta análise dados referentes a um
pMHC apresentando um peptídeo não relacionado (IV-NA231: CVNGSCFTV). Este
peptídeo de Influenza foi descrito por Wedemeyer e colaboradores, há exatamente
uma década, como sendo o alvo responsável pela presença de linfócitos T
específicos contra o epitopo HCV-NS31073, no sangue de doadores HCV-negativos
(Wedemeyer et al., 2001). Este trabalho, um marco no campo da imunidade
heteróloga e da reatividade cruzada entre epitopos virais, apontou a similaridade de
sequência destes peptídeos como sendo a responsável pelo reconhecimento
cruzado. Estes peptídeos compartilham 77% da sequência simples de aminoácidos
(7/9), no entanto, estas substituições se localizam justamente na região central do
peptídeo (p5 e p7), possivelmente alterando os pontos de contato com o TCR. Além
disso, conforme discutido no capítulo II, mesmo uma substituição pontual poderia
abolir o reconhecimento por uma dada população de linfócitos T.
O complexo HLA-A*0201: NA231 foi construído pelo método D1-EM-D2 e os
dados referentes às componentes RGB da área S1 foram incluídos na PCA.
Conforme esperado, esta análise dos componentes principais agrupou, muito
proximamente, os complexos apresentando os epitopos IV-NA231 e HCV-NS31073. Esta
mesma PCA, aproximou estes dois complexos daqueles apresentando epitopos dos
genótipos 4, 5 e 6 (genótipos “cross-reativos” com o tipo selvagem), ao mesmo tempo
em que manteve afastados os peptídeos dos genótipos 2 e 3 (genótipos com fraca
estimulação in vitro). Cabe ainda ressaltar que o uso de dois componentes principais

91
ajuda a distribuir melhor a variabilidade, sendo especialmente útil para representar a
separação dos valores apresentados pelo complexo G3-18 (único complexo que não
estimulou a população de linfócitos utilizada nos testes). No entanto, a maior parte da
variabilidade apresentada por este conjunto de dados (77,8 %) está representada
pelo PC1 (capítulo III, Figura 2, eixo x). Considerando-se apenas a separação
realizada por este componente, a existência de 3 grupos principais fica ainda mais
clara: (1) todos os complexos do genótipo 3 formam um grupo isolado a esquerda do
gráfico, (2) os complexos do genótipo 2 formam um conjunto isolado na parte central
do gráfico, incluindo três complexos do genótipo 1 que apresentam fraca resposta in
vitro (G1-3, G1-4 e G1-6) e (3) os demais complexos formam um grupo isolado à
direita do gráfico. Este último conjunto inclui somente os complexos que
apresentaram altos níveis de produção de IFN-gama frente a uma população de
CTLs específica contra o peptídeo selvagem, com exceção do complexo G1-5. Este
complexo apresenta capacidade de estimulação intermediária e sua inclusão no
cluster dos complexos com boa resposta já foi discutida no capítulo III. Apesar de sua
distribuição de cargas ser semelhante a do “complexo selvagem”, o G1-5 possui uma
diferença topológica justamente no centro da região de interação com o TCR.
Diferenças topológicas não foram consideradas durante a PCA e, a despeito de sua
possível influência sobre o reconhecimento de pMHCs, não puderam ser utilizadas
para aprimorar a classificação do complexo G1-5.
A análise in silico da reatividade cruzada entre o epitopo HCV-NS31073 e um
conjunto selecionado de epitopos virais imunogênicos, apresentada no capítulo III
(seção 3.5), também serve como um controle adicional deste agrupamento realizado
pela PCA. Em conjunto com 45 pMHCs apresentando peptídeos virais não-
relacionados, foram mantidos os complexos apresentando o epitopo de Influenza (IV-
NA231) e o peptídeo selvagem de HCV (HCV-NS31073), bem como as variantes de
HCV dos genótipos 4, 5 e 6. Mesmo em meio a uma amostra muito maior, e
considerando-se dados de sete regiões selecionadas sobre a superfície dos
complexos pMHC, foi mantido o agrupamento entre os complexos que apresentaram
altos níveis de produção de IFN-gama nos ensaios realizados por Fytili e
colaboradores (Fytili et al., 2008).
As sete regiões selecionadas para este estudo (capítulo III, apêndice A) foram
determinadas com base na identificação das áreas com maior variação no potencial
92
eletrostático, considerando-se as imagens dos 45 pMHCs não relacionados. Assim
sendo, não foram de modo algum influenciadas no intuito de confirmar os
agrupamentos observados na análise das 28 variantes naturais do peptídeo HCV-
NS31073. Adicionalmente, verificamos que estas regiões selecionadas estão incluídas
nas áreas já descritas como sendo zonas preferenciais de contato com TCRs
públicos (footprints). O fato de esta segunda análise ter mantido o agrupamento dos
complexos sabidamente “cross-reativos”, reforça a hipótese de que é possível
predizer reatividade cruzada com base na análise da superfície de complexos pMHC.
Todas as análises descritas no capítulo II e a maior parte das análises
descritas no capítulo III foram realizadas diretamente sobre as estruturas resultantes
do método D1-EM-D2, ou seja, sobre estruturas estáticas. Uma análise mais próxima
daquilo que ocorre in vivo, pode ser alcançada através da simulação por Dinâmica
Molecular (MD, do inglês, Molecular Dynamics). Esta abordagem foi aplicada sobre
os 28 complexos apresentando variantes do epitopo HCV-NS31073 (capítulo III, seção
3.4) visando avaliar a superfície destes complexos após a completa solvatação da
estrutura e termalização do sistema. No entanto, algumas medidas restritivas foram
tomadas. A MD é uma excelente ferramenta para nos fornecer informações sobre o
comportamento da proteína em solução, identificar regiões mais rígidas e mais
flexíveis, avaliar a conservação da estrutura secundária, etc. Para realizar estas
análises, após as etapas de equilíbrio (minimização e solvatação) e termalização
(aquecimento gradual), o sistema é mantido à uma temperatura constante
(normalmente 300K) durante um período normalmente superior a 8 ns. Várias
medidas podem ser realizadas para avaliar o comportamento do sistema durante este
período. A estrutura gerada ao final deste processo, no entanto, contém per se pouca
informação. Do mesmo modo, qualquer estrutura tomada ao acaso em pontos
específicos desta simulação, representa apenas um dos estados ocupados pela
estrutura ao longo da dinâmica molecular. Assim sendo, avaliar a imagem gerada
pelo GRASP2 a partir de uma estrutura em um ponto qualquer da simulação não nos
permitiria chegar a quaisquer conclusões sobre a topologia e o potencial eletrostático
de um dado pMHC em solução. Para evitar este problema, e considerando que nosso
objetivo era apenas simular a completa solvatação do sistema, nós realizamos
apenas as etapas iniciais do processo, avaliando a estrutura gerada ao final da etapa
de termalização. Além disso, foi mantida uma pequena força de restrição sobre os
93
átomos pesados do sistema (100 kJ-1nm 1), visando permitir o ajuste das cadeias
laterais com interações desfavoráveis e, ao mesmo tempo, evitar uma maior
variabilidade das cadeias laterais expostas ao solvente. O detalhamento dos
parâmetros utilizados em cada uma das etapas da simulação (arquivos mdp) esta
disponibilizado no Anexo 5.
A abordagem acima descrita foi conservadora e bastante limitada. O nosso
grupo está trabalhando na padronização de um protocolo de Dinâmica Molecular
mais completo, que nos forneça informações sobre a variação da topologia e do
potencial eletrostático ao longo da simulação, bem como dados sobre a estabilidade
do complexo pMHC em estudo e a variação nos valores de ASA. Nossa maior
preocupação tem sido realizar uma cuidadosa preparação do sistema, incluindo uma
etapa de solvatação (com elevada força de restrição agindo sobre o sistema),
seguida de várias etapas de redução gradual da força de restrição e aumento lento
da temperatura. Estes cuidados têm sido tomados para garantir que as possíveis
alterações estruturais vistas ao longo da simulação sejam de fato resultantes da
instabilidade do complexo em estudo e não apenas consequência de uma preparação
inadequada do sistema.
Por fim, considerando a revisão da literatura sobre a via do MHC de classe I e
os resultados apresentados e discutidos ao longo desta dissertação, postulamos a
existência de três níveis de seleção que irão determinar a imunogenicidade de um
dado peptídeo: Processamento, Estabilidade e Reatividade. Cada um destes níveis
pode ser subdividido em vários processos e até mesmo em vias alternativas. O
Processamento, por exemplo, refere-se a uma série de etapas já descritas, que vão
desde a ubiquitinação de uma proteína alvo até a ligação de um epitopo a uma
molécula de MHC. Os pontos mais importantes (“gargalos”) neste nível de seleção
são a clivagem pelo proteossomo, a qual determina especificamente a extremidade
carboxi-terminal do peptídeo, o transporte pela TAP, o desbastamento amino-terminal
e, finalmente, a ligação a uma molécula de MHC. O segundo nível de seleção se
refere a capacidade dinâmica do complexo pMHC de superar a etapa de exportação
e permanecer estável na superfície da célula apresentadora, como um heterotrímero
coeso e estruturalmente íntegro. Este nível sofre influência da afinidade de ligação do
peptídeo, mas não é exclusivamente determinado por ela. Detalhes estruturais de
cada alelo de MHC irão exercer um papel específico nesta etapa. A glicosilação deste

94
complexo pMHC também influenciará sua estabilidade, do mesmo modo que
características estruturais do peptídeo, como comprimento das cadeias laterais,
extensão da cadeia principal, área acessível ao solvente, etc. Alterações das
características do meio, como pH, concentração salina, interação com moléculas
acessórias e a presença de outros peptídeos em solução, também poderão
influenciar o comportamento do complexo nesta etapa, determinando sua capacidade
de se manter na superfície por tempo suficiente. Um peptídeo que tenha sido
corretamente gerado através das etapas de processamento e que tenha conseguido
se manter ligado à fenda do MHC durante o período de apresentação na superfície,
conseguirá garantir sua interação com o TCR. Sua imunogenicidade, no entanto,
ainda depende da capacidade deste peptídeo de “reagir” com o TCR, no contexto do
MHC em que está sendo apresentado.
Nesta etapa final, que irá determinar a estimulação do linfócito, características
como a topologia do complexo e a distribuição do potencial eletrostático na área de
interação com o TCR serão fundamentais. Também serão considerados aspectos
estruturais do TCR, como a composição de aminoácidos das regiões hipervariáveis, e
a orientação específica com que realiza o docking sobre o complexo pMHC.
Evidentemente estas etapas estão relacionadas, na medida em que aspectos
determinantes do processamento também poderão influenciar a estabilidade ou a
reatividade do complexo. De qualquer modo, é importante considerarmos estes três
momentos na apresentação de peptídeos por moléculas de MHC-I, procurando
identificar sobre qual deles refletem os resultados de cada análise realizada. Isso nos
permitirá atribuir uma ordem e valores às metodologias utilizadas, integrando seus
resultados em uma análise mais ampla, a qual poderá aprimorar nossas predições
quanto à imunogenicidade e reatividade cruzada.
Existe hoje um conhecimento vasto e detalhado sobre as moléculas e
mecanismos envolvidos no processamento. No entanto, em função de limitações
metodológicas, ainda sabemos pouco sobre a "constituição" da imunogenicidade e a
dinâmica da interação com o TCR. Estudos de imunoinformática estrutural poderão
fazer uma importante contribuição para esta área da imunologia, pavimentando o
avanço no caminho de uma melhor compreensão da resposta imune celular e
possibilitando a manipulação do sistema imune em favor da superação de doenças
que ainda afligem a humanidade.
95
6 Referências (relativas à Introdução e a Discussão Geral):
Abbas AK and Lichtman AH (2005) Imunologia Celular e Molecular. 5 edition. ELSEVIER, Rio de Janeiro,
576 pp. Alvarez-Lajonchere L and Dueñas-Carrera S (2009) Advances in DNA immunization against hepatitis C
virus infection: Opportunities and challenges. Human Vaccines 5:568-571. Amigorena S and Savina A (2010) Intracellular mechanisms of antigen cross presentation in dendritic
cells. Current opinion in immunology 22:109-117. Antunes DA, 2008 Utilização de Ferramentas de Bioinformática para a Análise do Potencial de
Reatividade Cruzada entre Epitopos Virais, pp. in Instituto de Ciências Básicas da Saúde. Universidade Federal do Rio Grande do Sul, Porto Alegre.
Antunes DA, Vieira GF, Rigo MM, Cibulski SP, Sinigaglia M and Chies JA (2010) Structural allele-specific patterns adopted by epitopes in the MHC-I cleft and reconstruction of MHC:peptide complexes to cross-reactivity assessment. PLoS One 5:e10353.
Arnautova YA, Abagyan RA and Totrov M (2011) Development of a new physics-based internal coordinate mechanics force field and its application to protein loop modeling. Proteins 79:477-498.
Arnautova YA, Vorobjev YN, Vila JA and Scheraga HA (2009) Identifying native-like protein structures with scoring functions based on all-atom ECEPP force fields, implicit solvent models and structure relaxation. Proteins 77:38-51.
Berman HM, Westbrook J, Feng Z, Gilliland G, Bhat TN, Weissig H, Shindyalov IN and Bourne PE (2000) The Protein Data Bank. Nucleic Acids Res 28:235-242.
Blanchard N and Shastri N (2010) Topological journey of parasite-derived antigens for presentation by MHC class I molecules. Trends in Immunology 31:414-421.
Bordner AJ and Abagyan R (2006) Ab initio prediction of peptide-MHC binding geometry for diverse class I MHC allotypes. Proteins 63:512-526.
Bostan N and Mahmood T (2010) An overview about hepatitis C: a devastating virus. Critical reviews in microbiology 36:91-133.
Brehm MA, Selin LK and Welsh RM (2004) CD8 T cell responses to viral infections in sequence. Cell Microbiol 6:411-421.
Buus S, Lauemøller SL, Worning P, Kesmir C, Frimurer T, Corbet S, Fomsgaard A, Hilden J, Holm A and Brunak S (2003) Sensitive quantitative predictions of peptide-MHC binding by a 'Query by Committee' artificial neural network approach. Tissue antigens 62:378-384.
Cao K, Hollenbach J, Shi X, Shi W, Chopek M and Fernandez-Vina MA (2001) Analysis of the frequencies of HLA-A, B, and C alleles and haplotypes in the five major ethnic groups of the United States reveals high levels of diversity in these loci and contrasting distribution patterns in these populations. Hum Immunol 62:1009-1030.
Castellanos M, Cinza Z, Dorta Z, Veliz G, Vega Hc, Lorenzo I, Ojeda S, Dueñas-Carrera S, Alvarez-Lajonchere L, MartÃ-nez G et al. (2010) Immunization with a DNA vaccine candidate in chronic hepatitis C patients is safe, well tolerated and does not impair immune response induction after anti-hepatitis B vaccination. The Journal of Gene Medicine 12:107-116.
Cavasotto CN and Orry AJ (2007) Ligand docking and structure-based virtual screening in drug discovery. Curr Top Med Chem 7:1006-1014.
Cecchini M, Kolb P, Majeux N and Caflisch A (2004) Automated docking of highly flexible ligands by genetic algorithms: a critical assessment. J Comput Chem 25:412-422.
96
Chang MW, Ayeni C, Breuer S and Torbett BE (2010) Virtual screening for HIV protease inhibitors: a comparison of AutoDock 4 and Vina. PloS one 5.
Chayama K and Hayes CN (2011) Hepatitis C virus: How genetic variability affects pathobiology of disease. Journal of gastroenterology and hepatology 26 Suppl 1:83-95.
Chen Y, Shi Y, Cheng H, An Y-Q and Gao GF (2009) Structural immunology and crystallography help immunologists see the immune system in action: how T and NK cells touch their ligands. IUBMB life 61:579-590.
Clute SC, Watkin LB, Cornberg M, Naumov YN, Sullivan JL, Luzuriaga K, Welsh RM and Selin LK (2005) Cross-reactive influenza virus-specific CD8+ T cells contribute to lymphoproliferation in Epstein-Barr virus-associated infectious mononucleosis. J Clin Invest 115:3602-3612.
Davis-Harrison RL, Insaidoo FK and Baker BM (2007) T cell receptor binding transition states and recognition of peptide/MHC. Biochemistry 46:1840-1850.
Di Santo JP, Vosshenrich CA and Satoh-Takayama N (2010) A 'natural' way to provide innate mucosal immunity. Current opinion in immunology.
Falk K and Rotzschke O (2002) The final cut: how ERAP1 trims MHC ligands to size. Nat Immunol 3:1121-1122.
Frankild S, de Boer RJ, Lund O, Nielsen M and Kesmir C (2008) Amino acid similarity accounts for T cell cross-reactivity and for "holes" in the T cell repertoire. PLoS ONE 3:e1831.
Fuhrmann J, Rurainski A, Lenhof HP and Neumann D (2010) A new Lamarckian genetic algorithm for flexible ligand-receptor docking. J Comput Chem.
Fytili P, Dalekos GN, Schlaphoff V, Suneetha PV, Sarrazin C, Zauner W, Zachou K, Berg T, Manns MP, Klade CS et al. (2008) Cross-genotype-reactivity of the immunodominant HCV CD8 T-cell epitope NS3-1073. Vaccine 26:3818-3826.
Godfrey DI, Rossjohn J and McCluskey J (2008) The fidelity, occasional promiscuity, and versatility of T cell receptor recognition. Immunity 28:304-314.
Hammer GE, Kanaseki T and Shastri N (2007) The final touches make perfect the peptide-MHC class I repertoire. Immunity 26:397-406.
Hansen TH and Bouvier M (2009) MHC class I antigen presentation: learning from viral evasion strategies. Nature reviews. Immunology 9:503-513.
Hiroishi K, Eguchi J, Ishii S, Hiraide A, Sakaki M, Doi H, Omori R and Imawari M (2010) Immune response of cytotoxic T lymphocytes and possibility of vaccine development for hepatitis C virus infection. Journal of biomedicine & biotechnology 2010:263810.
Horton R, Wilming L, Rand V, Lovering RC, Bruford Ea, Khodiyar VK, Lush MJ, Povey S, Talbot CC, Wright MW et al. (2004) Gene map of the extended human MHC. Nature reviews. Genetics 5:889-899.
Jaskolski M (2010) Personal remarks on the future of protein crystallography and structural biology. Acta Biochim Pol 57:261-264.
Kaas Q, Ruiz M and Lefranc M-P (2004) IMGT/3Dstructure-DB and IMGT/StructuralQuery, a database and a tool for immunoglobulin, T cell receptor and MHC structural data. Nucleic acids research 32:D208-210.
Kang L, Li H, Jiang H and Wang X (2009) An improved adaptive genetic algorithm for protein-ligand docking. J Comput Aided Mol Des 23:1-12.
Kelley J, Walter L and Trowsdale J (2005) Comparative genomics of major histocompatibility complexes. Immunogenetics 56:683-695.
Khan JM and Ranganathan S (2010) pDOCK: a new technique for rapid and accurate docking of peptide ligands to Major Histocompatibility Complexes. Immunome research 6 Suppl 1:S2.
97
Korber B, LaBute M and Yusim K (2006) Immunoinformatics comes of age. PLoS Comput Biol 2:e71. Lafuente EM and Reche Pa (2009) Prediction of MHC-peptide binding: a systematic and
comprehensive overview. Current pharmaceutical design 15:3209-3220. Lu S (2009) Heterologous prime-boost vaccination. Curr Opin Immunol 21:346-351. Lundegaard C, Lund O, Buus S and Nielsen M (2010) Major histocompatibility complex class I binding
predictions as a tool in epitope discovery. Immunology 130:309-318. Mason D (1998) A very high level of crossreactivity is an essential feature of the T-cell receptor.
Immunol Today 19:395-404. Meijers R, Lai CC, Yang Y, Liu JH, Zhong W, Wang JH and Reinherz EL (2005) Crystal structures of
murine MHC Class I H-2 D(b) and K(b) molecules in complex with CTL epitopes from influenza A virus: implications for TCR repertoire selection and immunodominance. J Mol Biol 345:1099-1110.
Morikis D and Lambris JD (2004) Physical methods for structure, dynamics and binding in immunological research. Trends Immunol 25:700-707.
Morris GM, Goodsell, D.S., Halliday R.S., Huey, R., Hart, W.E., Belew, R.K., Olson, A.J. (1998) Automated docking using a Lamarckian genetic algorithm and an empirical binding free energy function. J. Computational Chemistry, 19.
Nel AE (2002) T-cell activation through the antigen receptor. Part 1: signaling components, signaling pathways, and signal integration at the T-cell antigen receptor synapse. J Allergy Clin Immunol 109:758-770.
Paulsson KM (2004) Evolutionary and functional perspectives of the major histocompatibility complex class I antigen-processing machinery. Cell Mol Life Sci 61:2446-2460.
Peaper DR and Cresswell P (2008) Regulation of MHC class I assembly and peptide binding. Annual review of cell and developmental biology 24:343-368.
Pettersen EF, Goddard TD, Huang CC, Couch GS, Greenblatt DM, Meng EC and Ferrin TE (2004) UCSF Chimera--a visualization system for exploratory research and analysis. J Comput Chem 25:1605-1612.
Piertney SB and Oliver MK (2006) The evolutionary ecology of the major histocompatibility complex. Heredity 96:7-21.
Prince AM, Brotman B, Lee DH, Pfahler W, Tricoche N, Andrus L and Shata MT (2005) Protection against chronic hepatitis C virus infection after rechallenge with homologous, but not heterologous, genotypes in a chimpanzee model. J Infect Dis 192:1701-1709.
Purcell AW and Elliott T (2008) Molecular machinations of the MHC-I peptide loading complex. Curr Opin Immunol 20:75-81.
Rappuoli R (2000) Reverse vaccinology. Curr Opin Microbiol 3:445-450. Reali E, Guerrini R, Marastoni M, Tomatis R, Masucci MG, Traniello S and Gavioli R (1999) A single
specific amino acid residue in peptide antigens is sufficient to activate memory CTL: potential role of cross-reactive peptides in memory T cell maintenance. J Immunol 162:106-113.
Regner M (2001) Cross-reactivity in T-cell antigen recognition. Immunol Cell Biol 79:91-100. Rudolph MG, Stanfield RL and Wilson IA (2006) How TCRs bind MHCs, peptides, and coreceptors.
Annual review of immunology 24:419-466. Saito T, Yokosuka T and Hashimoto-Tane A (2010) Dynamic regulation of T cell activation and co-
stimulation through TCR-microclusters. FEBS letters 584:4865-4871. Sallusto F, Lanzavecchia A, Araki K and Ahmed R (2010) From vaccines to memory and back. Immunity
33:451-463.

98
Sandalova T, Michaelsson J, Harris RA, Odeberg J, Schneider G, Karre K and Achour A (2005) A structural basis for CD8+ T cell-dependent recognition of non-homologous peptide ligands: implications for molecular mimicry in autoreactivity. J Biol Chem 280:27069-27075.
Seder RA, Darrah PA and Roederer M (2008) T-cell quality in memory and protection: implications for vaccine design. Nat Rev Immunol 8:247-258.
Seifert MHJ, Kraus J and Kramer B (2007) Virtual high-throughput screening of molecular databases. Current opinion in drug discovery & development 10:298-307.
Selin LK, Cornberg M, Brehm MA, Kim SK, Calcagno C, Ghersi D, Puzone R, Celada F and Welsh RM (2004) CD8 memory T cells: cross-reactivity and heterologous immunity. Semin Immunol 16:335-347.
Simmonds P, Bukh J, Combet C, Deléage G, Enomoto N, Feinstone S, Halfon P, Inchauspé G, Kuiken C, Maertens G et al. (2005) Consensus proposals for a unified system of nomenclature of hepatitis C virus genotypes. Hepatology (Baltimore, Md.) 42:962-973.
Simmonds P, Holmes EC, Cha Ta, Chan SW, McOmish F, Irvine B, Beall E, Yap PL, Kolberg J and Urdea MS (1993) Classification of hepatitis C virus into six major genotypes and a series of subtypes by phylogenetic analysis of the NS-5 region. The Journal of general virology 74 ( Pt 11:2391-2399.
Smith-Garvin JE, Koretzky GA and Jordan MS (2009) T cell activation. Annual review of immunology 27:591-619.
Snell GD (1986) Some recollections of Peter Gorer and his work on this fiftieth anniversary of his discovery of H-2. Immunogenetics 24:339-340.
Sohn SJ, Thompson J and Winoto A (2007) Apoptosis during negative selection of autoreactive thymocytes. Curr Opin Immunol 19:510-515.
Tezuka H and Ohteki T (2010) Regulation of intestinal homeostasis by dendritic cells. Immunological reviews 234:247-258.
Thauland TJ and Parker DC (2010) Diversity in immunological synapse structure. Immunology 131:466-472.
Thimme R, Bukh J, Spangenberg HC, Wieland S, Pemberton J, Steiger C, Govindarajan S, Purcell RH and Chisari FV (2002) Viral and immunological determinants of hepatitis C virus clearance, persistence, and disease. Proc Natl Acad Sci U S A 99:15661-15668.
Todman SJ, Halling-Brown MD, Davies MN, Flower DR, Kayikci M and Moss DS (2008) Toward the atomistic simulation of T cell epitopes automated construction of MHC: peptide structures for free energy calculations. J Mol Graph Model 26:957-961.
Tomar N and De RK (2010) Immunoinformatics: an integrated scenario. Immunology:153-168. Trott O and Olson AJ (2009) AutoDock Vina: Improving the speed and accuracy of docking with a new
scoring function, efficient optimization, and multithreading. J Comput Chem. Uprichard SL (2010) Hepatitis C virus experimental model systems and antiviral drug research.
Virologica Sinica 25:227-245. van der Merwe PA and Dushek O (2010) Mechanisms for T cell receptor triggering. Nature reviews.
Immunology 11:47-55. Vandiedonck C and Knight JC (2009) The human Major Histocompatibility Complex as a paradigm in
genomics research. Briefings in functional genomics & proteomics 8:379-394. Vertuani S, Bazzaro M, Gualandi G, Micheletti F, Marastoni M, Fortini C, Canella A, Marino M, Tomatis
R, Traniello S et al. (2002) Effect of interferon-alpha therapy on epitope-specific cytotoxic T lymphocyte responses in hepatitis C virus-infected individuals. Eur J Immunol 32:144-154.

99
Vieira GF and Chies JA (2005) Immunodominant viral peptides as determinants of cross-reactivity in the immune system--Can we develop wide spectrum viral vaccines? Med Hypotheses 65:873-879.
Vivona S, Gardy JL, Ramachandran S, Brinkman FSL, Raghava GPS, Flower DR and Filippini F (2008) Computer-aided biotechnology: from immuno-informatics to reverse vaccinology. Trends in biotechnology 26:190-200.
Walker CM (2010) Adaptive immunity to the hepatitis C virus. Advances in virus research 78:43-86. Wang J and Maldonado MA (2006) The ubiquitin-proteasome system and its role in inflammatory and
autoimmune diseases. Cell Mol Immunol 3:255-261. Wedemeyer H, He X-S, Nascimbeni M, Davis AR, Greenberg HB, Hoofnagle JH, Liang TJ, Alter H and
Rehermann B (2002) Impaired Effector Function of Hepatitis C Virus-Specific CD8+ T Cells in Chronic Hepatitis C Virus Infection. J. Immunol. 169:3447-3458.
Wedemeyer H, Mizukoshi E, Davis AR, Bennink JR and Rehermann B (2001) Cross-reactivity between hepatitis C virus and Influenza A virus determinant-specific cytotoxic T cells. J Virol 75:11392-11400.
Welsh RM, Che JW, Brehm Ma and Selin LK (2010) Heterologous immunity between viruses. Immunological reviews 235:244-266.
Welsh RM and Fujinami RS (2007) Pathogenic epitopes, heterologous immunity and vaccine design. Nat Rev Microbiol 5:555-563.
Welsh RM and Selin LK (2002) No one is naive: the significance of heterologous T-cell immunity. Nat Rev Immunol 2:417-426.
Welsh RM, Selin LK and Szomolanyi-Tsuda E (2004) Immunological memory to viral infections. Annu Rev Immunol 22:711-743.
Win SJ, Ward VK, Dunbar PR, Young SL and Baird MA (2011) Cross-presentation of epitopes on virus-like particles via the MHC I receptor recycling pathway. Immunology and cell biology.
Woolard SN and Kumaraguru U (2010) Viral vaccines and CTL response. Journal of biomedicine & biotechnology 2010:141657.
Xie T, Rowen L, Aguado B, Ahearn ME, Madan A, Qin S, Campbell RD and Hood L (2003) Analysis of the gene-dense major histocompatibility complex class III region and its comparison to mouse. Genome research 13:2621-2636.
Zeisel MB, Fafi-Kremer S, Robinet E, Habersetzer F, Baumert TF and Stoll-Keller F (2009) Adaptive Immunity to Hepatitis C Virus. Viruses 1:276-297.

Anexos
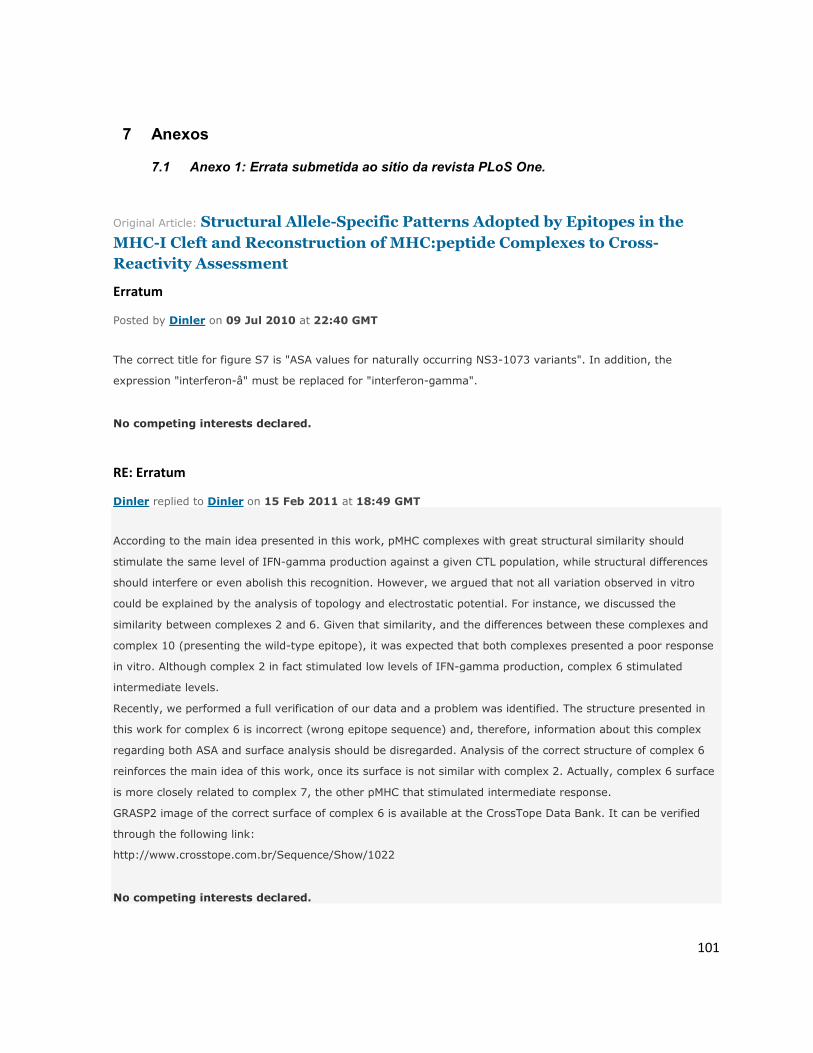
101
7 Anexos
7.1 Anexo 1: Errata submetida ao sitio da revista PLoS One.
Original Article: Structural Allele-Specific Patterns Adopted by Epitopes in the
MHC-I Cleft and Reconstruction of MHC:peptide Complexes to Cross-
Reactivity Assessment
Erratum
Posted by Dinler on 09 Jul 2010 at 22:40 GMT
The correct title for figure S7 is "ASA values for naturally occurring NS3-1073 variants". In addition, the
expression "interferon-â" must be replaced for "interferon-gamma".
No competing interests declared.
RE: Erratum
Dinler replied to Dinler on 15 Feb 2011 at 18:49 GMT
According to the main idea presented in this work, pMHC complexes with great structural similarity should
stimulate the same level of IFN-gamma production against a given CTL population, while structural differences
should interfere or even abolish this recognition. However, we argued that not all variation observed in vitro
could be explained by the analysis of topology and electrostatic potential. For instance, we discussed the
similarity between complexes 2 and 6. Given that similarity, and the differences between these complexes and
complex 10 (presenting the wild-type epitope), it was expected that both complexes presented a poor response
in vitro. Although complex 2 in fact stimulated low levels of IFN-gamma production, complex 6 stimulated
intermediate levels.
Recently, we performed a full verification of our data and a problem was identified. The structure presented in
this work for complex 6 is incorrect (wrong epitope sequence) and, therefore, information about this complex
regarding both ASA and surface analysis should be disregarded. Analysis of the correct structure of complex 6
reinforces the main idea of this work, once its surface is not similar with complex 2. Actually, complex 6 surface
is more closely related to complex 7, the other pMHC that stimulated intermediate response.
GRASP2 image of the correct surface of complex 6 is available at the CrossTope Data Bank. It can be verified
through the following link:
http://www.crosstope.com.br/Sequence/Show/1022
No competing interests declared.

102
7.2 Anexo 2: Versão editada da Figura 4 (Capítulo II).

103
7.3 Anexo 3: Tabela com os valores preditos para a afinidade de ligação ao MHC-I.
ID Alelo Sequencia Consenso (Percentile Rank)
IC50
(nM) ANN
IC50 (nM) SMM
MatrixScore for comblib_sidney2008
Seq10 HLA A*02:01
CINGVCWTV 1,70 66,49 73,62 0,00042
Seq6 HLA A*02:01
CINGVCWAV 2,00 89,37 76,08 0,00043
G1-1 HLA A*02:01
CVNGVCWTV 2,20 110,78 110,61 0,00038
G1-2 HLA A*02:01
CTNGVCWTV 3,20 292,89 216,29 0,00044
Seq7 HLA A*02:01
CANGVCWTV 4,70 950,71 319,43 0,00047
Seq1 HLA A*02:01
CINGVCWTA 4,70 963,87 354,67 0,0032
Predição de afinidade de ligação ao alelo HLA-A*02:01 para 6 peptídeos selecionados, realizada pela
ferramenta “Peptide binding to MHC class I molecules” do IEDB Analysis Resource (Immune Epitope
Database – http://www.iedb.org/).
7.4 Anexo 4: Valores de ASA para os peptídeos selecionados.
Gráfico com os valores da área acessível ao solvente para as nove posições de 8 peptídeos
selecionados (capítulo II), no contexto do alelo HLA-A*02:01. Os valores foram calculados pelo
software NOC 3.01 (http://noch.sourceforge.net/).
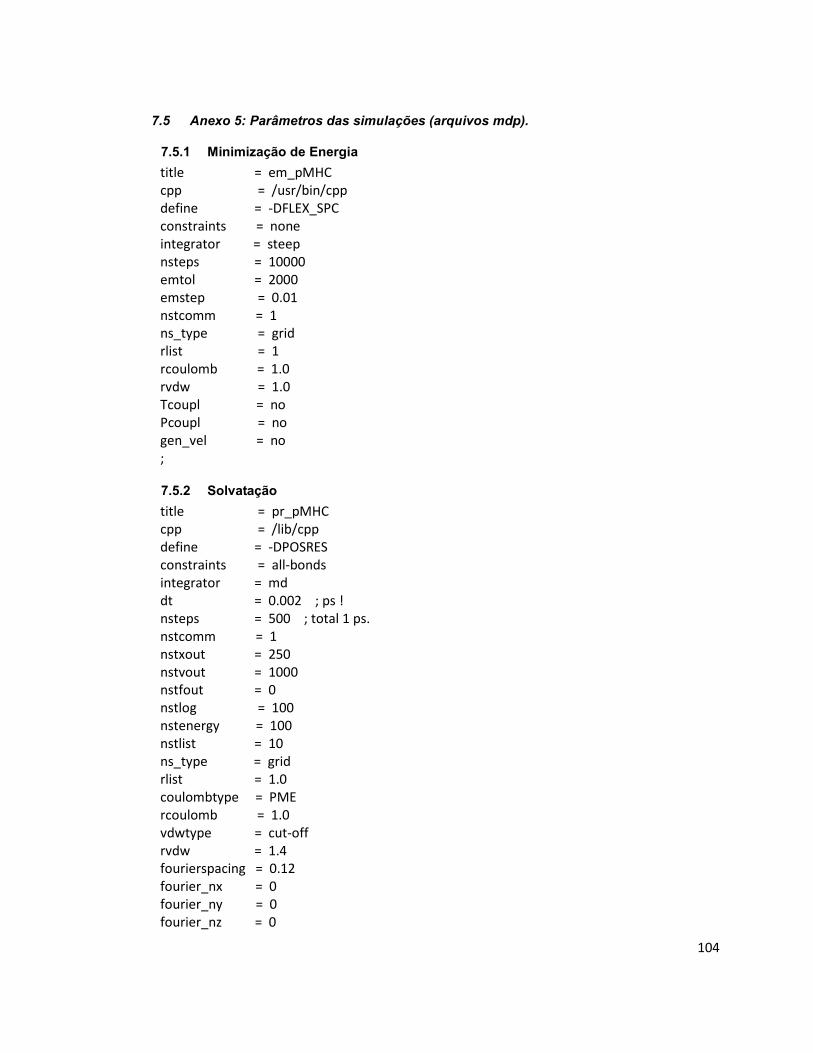
104
7.5 Anexo 5: Parâmetros das simulações (arquivos mdp).
7.5.1 Minimização de Energia
title = em_pMHC
cpp = /usr/bin/cpp
define = -DFLEX_SPC
constraints = none
integrator = steep
nsteps = 10000
emtol = 2000
emstep = 0.01
nstcomm = 1
ns_type = grid
rlist = 1
rcoulomb = 1.0
rvdw = 1.0
Tcoupl = no
Pcoupl = no
gen_vel = no
;
7.5.2 Solvatação
title = pr_pMHC
cpp = /lib/cpp
define = -DPOSRES
constraints = all-bonds
integrator = md
dt = 0.002 ; ps !
nsteps = 500 ; total 1 ps.
nstcomm = 1
nstxout = 250
nstvout = 1000
nstfout = 0
nstlog = 100
nstenergy = 100
nstlist = 10
ns_type = grid
rlist = 1.0
coulombtype = PME
rcoulomb = 1.0
vdwtype = cut-off
rvdw = 1.4
fourierspacing = 0.12
fourier_nx = 0
fourier_ny = 0
fourier_nz = 0
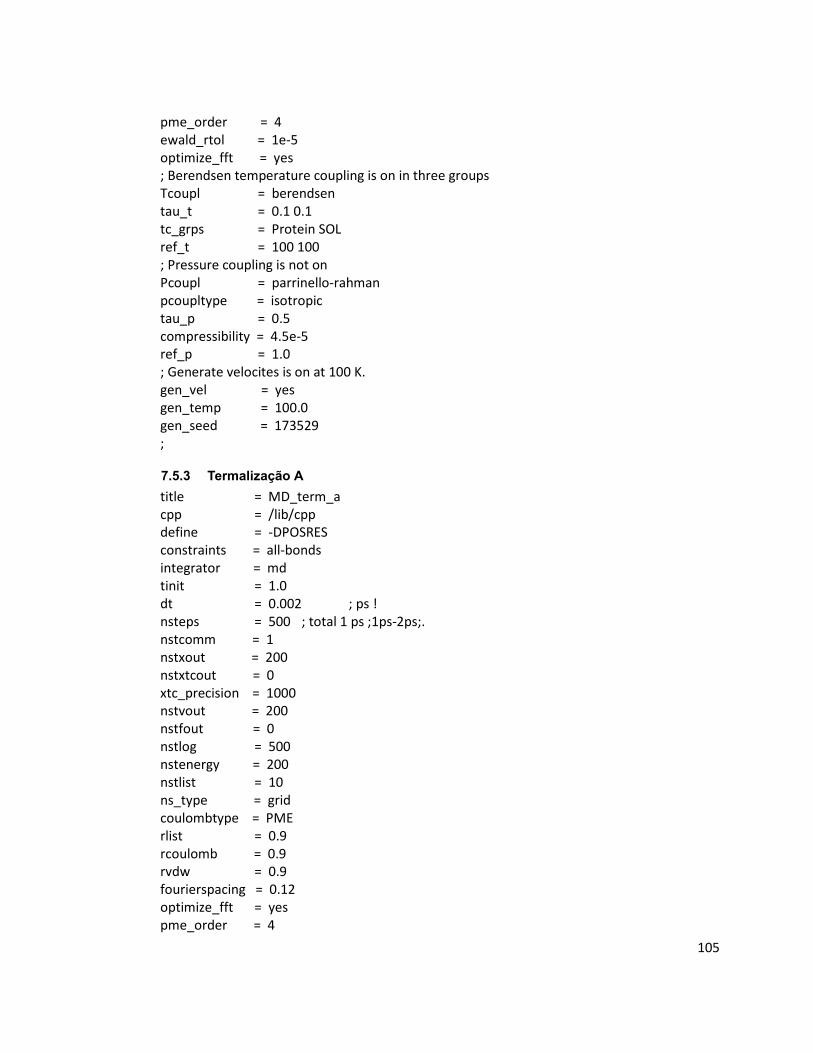
105
pme_order = 4
ewald_rtol = 1e-5
optimize_fft = yes
; Berendsen temperature coupling is on in three groups
Tcoupl = berendsen
tau_t = 0.1 0.1
tc_grps = Protein SOL
ref_t = 100 100
; Pressure coupling is not on
Pcoupl = parrinello-rahman
pcoupltype = isotropic
tau_p = 0.5
compressibility = 4.5e-5
ref_p = 1.0
; Generate velocites is on at 100 K.
gen_vel = yes
gen_temp = 100.0
gen_seed = 173529
;
7.5.3 Termalização A
title = MD_term_a
cpp = /lib/cpp
define = -DPOSRES
constraints = all-bonds
integrator = md
tinit = 1.0
dt = 0.002 ; ps !
nsteps = 500 ; total 1 ps ;1ps-2ps;.
nstcomm = 1
nstxout = 200
nstxtcout = 0
xtc_precision = 1000
nstvout = 200
nstfout = 0
nstlog = 500
nstenergy = 200
nstlist = 10
ns_type = grid
coulombtype = PME
rlist = 0.9
rcoulomb = 0.9
rvdw = 0.9
fourierspacing = 0.12
optimize_fft = yes
pme_order = 4
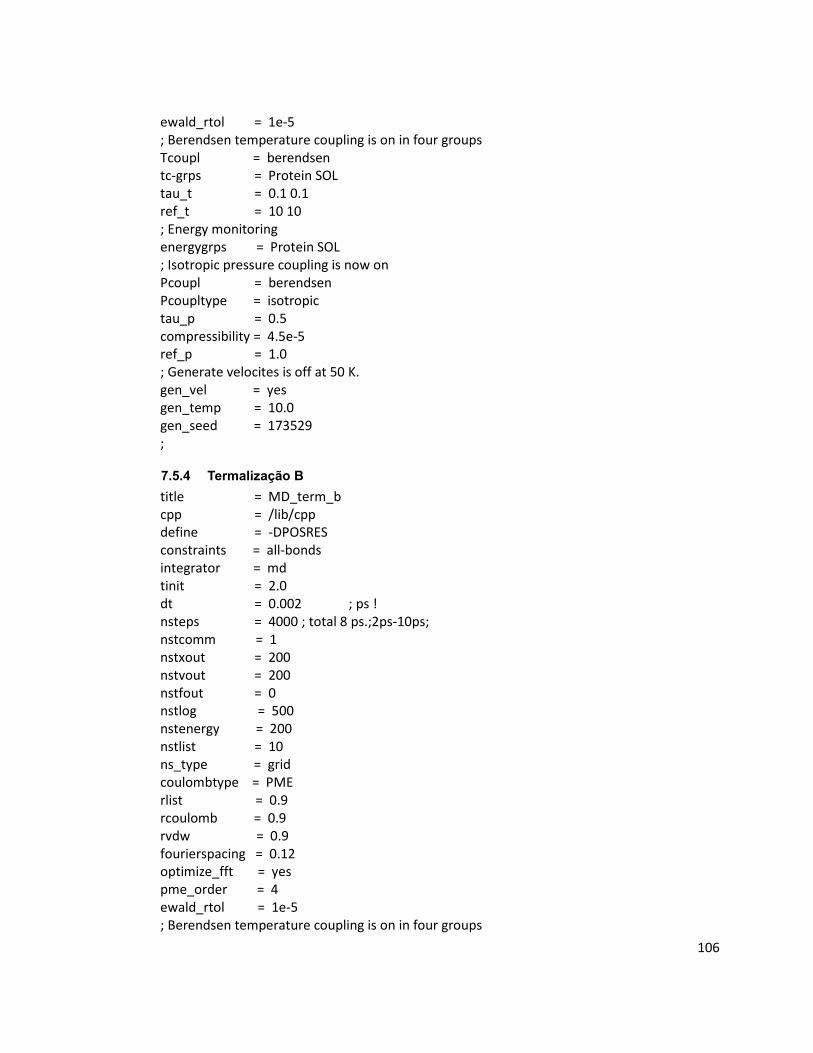
106
ewald_rtol = 1e-5
; Berendsen temperature coupling is on in four groups
Tcoupl = berendsen
tc-grps = Protein SOL
tau_t = 0.1 0.1
ref_t = 10 10
; Energy monitoring
energygrps = Protein SOL
; Isotropic pressure coupling is now on
Pcoupl = berendsen
Pcoupltype = isotropic
tau_p = 0.5
compressibility = 4.5e-5
ref_p = 1.0
; Generate velocites is off at 50 K.
gen_vel = yes
gen_temp = 10.0
gen_seed = 173529
;
7.5.4 Termalização B
title = MD_term_b
cpp = /lib/cpp
define = -DPOSRES
constraints = all-bonds
integrator = md
tinit = 2.0
dt = 0.002 ; ps !
nsteps = 4000 ; total 8 ps.;2ps-10ps;
nstcomm = 1
nstxout = 200
nstvout = 200
nstfout = 0
nstlog = 500
nstenergy = 200
nstlist = 10
ns_type = grid
coulombtype = PME
rlist = 0.9
rcoulomb = 0.9
rvdw = 0.9
fourierspacing = 0.12
optimize_fft = yes
pme_order = 4
ewald_rtol = 1e-5
; Berendsen temperature coupling is on in four groups

107
Tcoupl = berendsen
tc-grps = Protein SOL
tau_t = 0.1 0.1
ref_t = 50 50
; Energy monitoring
energygrps = Protein SOL
; Isotropic pressure coupling is now on
Pcoupl = berendsen
Pcoupltype = isotropic
tau_p = 0.5
compressibility = 4.5e-5
ref_p = 1.0
; Generate velocites is off at 50 K.
gen_vel = no
gen_temp = 50.0
gen_seed = 173529
;
7.5.5 Termalização C
title = MD_term_c
cpp = /lib/cpp
define = -DPOSRES
constraints = all-bonds
integrator = md
tinit = 10.0
dt = 0.002 ; ps !
nsteps = 2500 ; total 5 ps.;10-15ps;
nstcomm = 1
nstxout = 200
nstvout = 200
nstfout = 0
nstlog = 500
nstenergy = 200
nstlist = 10
ns_type = grid
coulombtype = PME
rlist = 0.9
rcoulomb = 0.9
rvdw = 0.9
fourierspacing = 0.12
optimize_fft = yes
pme_order = 4
ewald_rtol = 1e-5
; Berendsen temperature coupling is on in four groups
Tcoupl = berendsen
tc-grps = Protein SOL
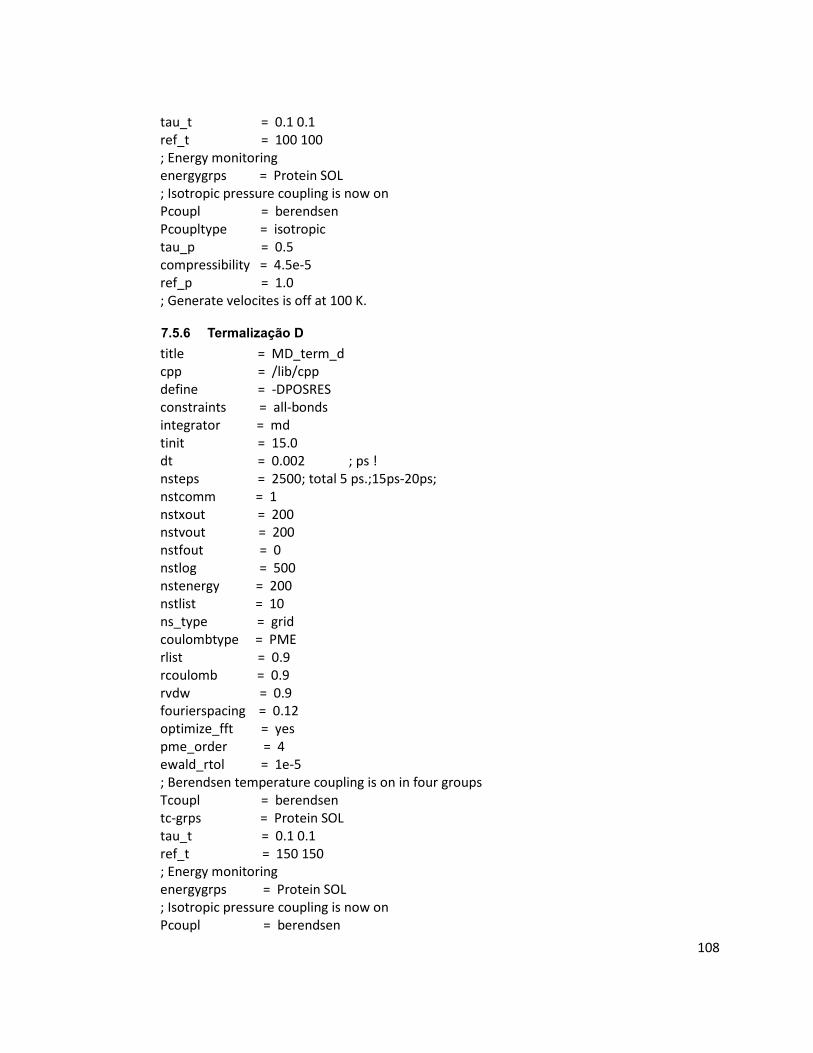
108
tau_t = 0.1 0.1
ref_t = 100 100
; Energy monitoring
energygrps = Protein SOL
; Isotropic pressure coupling is now on
Pcoupl = berendsen
Pcoupltype = isotropic
tau_p = 0.5
compressibility = 4.5e-5
ref_p = 1.0
; Generate velocites is off at 100 K.
7.5.6 Termalização D
title = MD_term_d
cpp = /lib/cpp
define = -DPOSRES
constraints = all-bonds
integrator = md
tinit = 15.0
dt = 0.002 ; ps !
nsteps = 2500 ; total 5 ps.;15ps-20ps;
nstcomm = 1
nstxout = 200
nstvout = 200
nstfout = 0
nstlog = 500
nstenergy = 200
nstlist = 10
ns_type = grid
coulombtype = PME
rlist = 0.9
rcoulomb = 0.9
rvdw = 0.9
fourierspacing = 0.12
optimize_fft = yes
pme_order = 4
ewald_rtol = 1e-5
; Berendsen temperature coupling is on in four groups
Tcoupl = berendsen
tc-grps = Protein SOL
tau_t = 0.1 0.1
ref_t = 150 150
; Energy monitoring
energygrps = Protein SOL
; Isotropic pressure coupling is now on
Pcoupl = berendsen
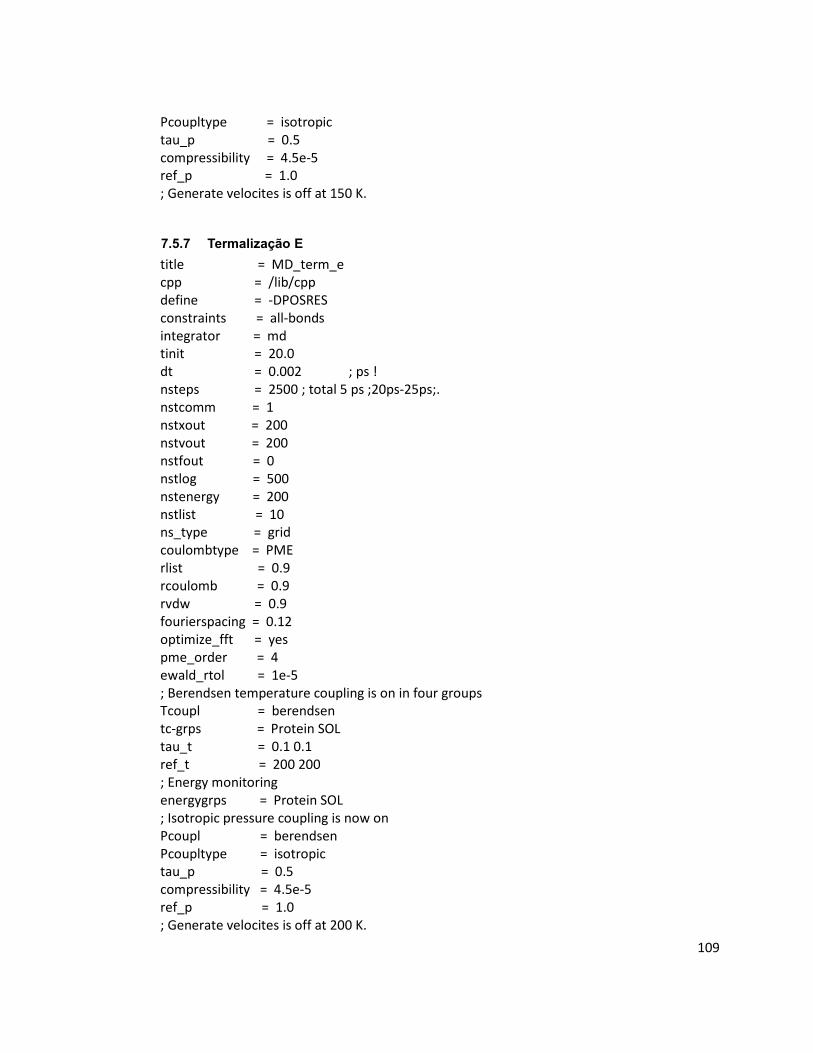
109
Pcoupltype = isotropic
tau_p = 0.5
compressibility = 4.5e-5
ref_p = 1.0
; Generate velocites is off at 150 K.
7.5.7 Termalização E
title = MD_term_e
cpp = /lib/cpp
define = -DPOSRES
constraints = all-bonds
integrator = md
tinit = 20.0
dt = 0.002 ; ps !
nsteps = 2500 ; total 5 ps ;20ps-25ps;.
nstcomm = 1
nstxout = 200
nstvout = 200
nstfout = 0
nstlog = 500
nstenergy = 200
nstlist = 10
ns_type = grid
coulombtype = PME
rlist = 0.9
rcoulomb = 0.9
rvdw = 0.9
fourierspacing = 0.12
optimize_fft = yes
pme_order = 4
ewald_rtol = 1e-5
; Berendsen temperature coupling is on in four groups
Tcoupl = berendsen
tc-grps = Protein SOL
tau_t = 0.1 0.1
ref_t = 200 200
; Energy monitoring
energygrps = Protein SOL
; Isotropic pressure coupling is now on
Pcoupl = berendsen
Pcoupltype = isotropic
tau_p = 0.5
compressibility = 4.5e-5
ref_p = 1.0
; Generate velocites is off at 200 K.
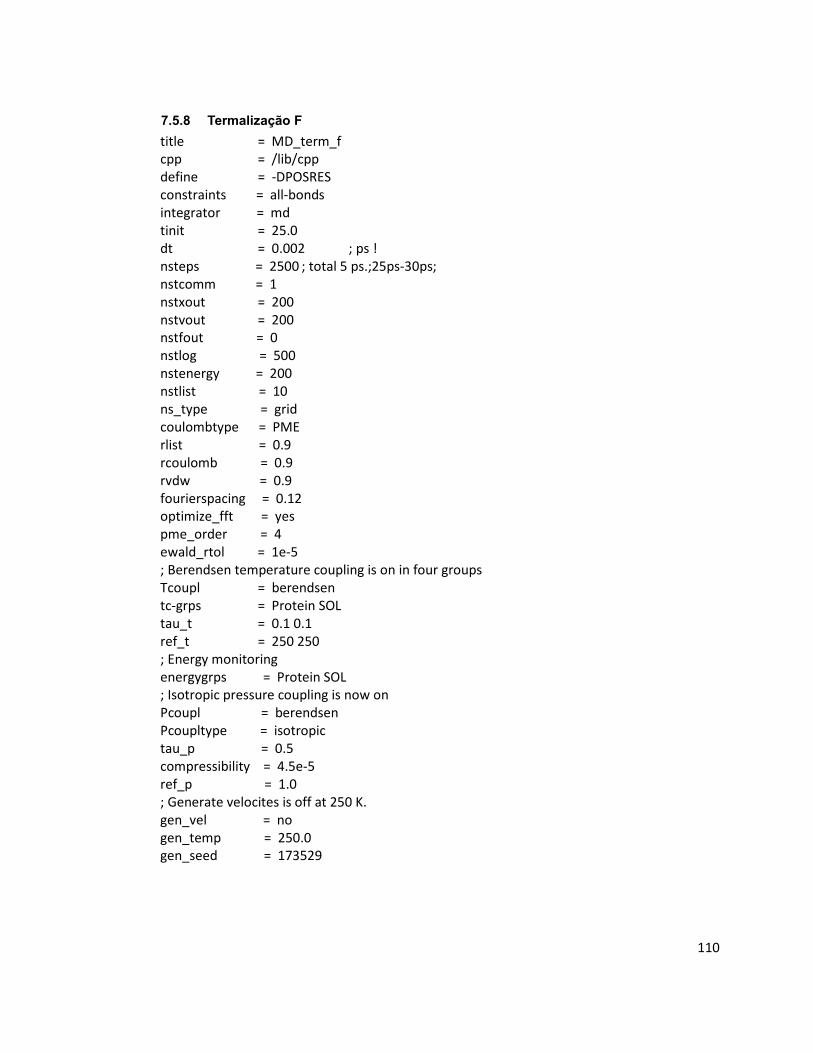
110
7.5.8 Termalização F
title = MD_term_f
cpp = /lib/cpp
define = -DPOSRES
constraints = all-bonds
integrator = md
tinit = 25.0
dt = 0.002 ; ps !
nsteps = 2500 ; total 5 ps.;25ps-30ps;
nstcomm = 1
nstxout = 200
nstvout = 200
nstfout = 0
nstlog = 500
nstenergy = 200
nstlist = 10
ns_type = grid
coulombtype = PME
rlist = 0.9
rcoulomb = 0.9
rvdw = 0.9
fourierspacing = 0.12
optimize_fft = yes
pme_order = 4
ewald_rtol = 1e-5
; Berendsen temperature coupling is on in four groups
Tcoupl = berendsen
tc-grps = Protein SOL
tau_t = 0.1 0.1
ref_t = 250 250
; Energy monitoring
energygrps = Protein SOL
; Isotropic pressure coupling is now on
Pcoupl = berendsen
Pcoupltype = isotropic
tau_p = 0.5
compressibility = 4.5e-5
ref_p = 1.0
; Generate velocites is off at 250 K.
gen_vel = no
gen_temp = 250.0
gen_seed = 173529