ALEJANDRO VARGAS VELÁSQUEZ - USP › teses › disponiveis › 10 › 10135 ›...
89
ALEJANDRO VARGAS VELÁSQUEZ Evaluation of internal and external markers for estimating dry matter intake and digestibility in cattle São Paulo 2017
Transcript of ALEJANDRO VARGAS VELÁSQUEZ - USP › teses › disponiveis › 10 › 10135 ›...

ALEJANDRO VARGAS VELÁSQUEZ
Evaluation of internal and external markers for estimating dry matter intake and
digestibility in cattle
São Paulo
2017
ALEJANDRO VARGAS VELÁSQUEZ
Evaluation of internal and external markers for estimating dry matter intake and
digestibility in cattle
Tese apresentada ao Programa de Pós-
Graduação em Nutrição e Produção Animal
da Faculdade de Medicina Veterinária e
Zootecnia da Universidade de São Paulo
para obtenção do título de Doutor em
Ciências.
Departamento:
Nutrição e Produção Animal
Área de concentração:
Nutrição e Produção Animal
Orientador: Prof. Dr. Romualdo Shigueo Fukushima
Pirassununga
2017
Autorizo a reprodução parcial ou total desta obra, para fins acadêmicos, desde que citada a fonte.
DADOS INTERNACIONAIS DE CATALOGAÇÃO NA PUBLICAÇÃO
(Biblioteca Virginie Buff D’Ápice da Faculdade de Medicina Veterinária e Zootecnia da Universidade de São Paulo)
T.3447 Velásquez, Alejandro Vargas FMVZ Evaluation of internal and external markers for estimating dry matter intake and
digestibility in cattle / Alejandro Vargas Velásquez. -- 2017. 89 f.
Título traduzido: Avaliação de marcadores internos e externos para estimar o consumo e a digestibilidade da matéria seca em bovinos.
Tese (Doutorado) - Universidade de São Paulo. Faculdade de Medicina Veterinária e
Zootecnia. Departamento de Nutrição e Produção Animal, Pirassununga, 2017. Programa de Pós-Graduação: Nutrição e Produção Animal.
Área de concentração: Nutrição e Produção Animal.
Orientador: Prof. Dr. Romualdo Shigueo Fukushima.
1. Cutina. 2. Dióxido de titânio. 3. Fibra indigestível. 4. Lignina. 5. Óxido de cromo. I. Título.
BIOETHICS

To my parents, Edgar and Gloria, and to my
family I dedicate this manuscript. For the
example and support given

ACKNOWLEDGMENTS
To my dear mother, for teaching me to thrive on challenges
To my amazing father, for teaching me that any goal is attainable through work
To my uncles, Hernan Dario and Álvaro, for always believing in me
To Professor Romualdo, for the opportunities and the contribution to my personal and
intellectual growth
To the teachers at VNP, for the knowledge passed on
To the VNP staff, for always being helpful
To my colleagues at VNP, for the friendship and welcoming manner that makes being away
from home easier
To Brazil, amazing country full of opportunities
RESUMO
VELASQUEZ, A.V. Avaliação de marcadores internos e externos para estimar o consumo
e a digestibilidade da matéria seca em bovinos. [Evaluation of internal and external markers
for estimating dry matter intake and digestibility in cattle]. 2017. 87 f. Tese (Doutorado em
Ciências) – Faculdade de Medicina Veterinária e Zootecnia, Universidade de São Paulo, 2017.
A determinação do consumo de alimentos é uma valiosa ferramenta na hora da tomada de
decisões de manejo do rebanho. O uso de marcadores, sejam internos ou externos, é
atualmente a técnica mais utilizada para estimar o consumo em animais de produção. Três
experimentos foram conduzidos. Em vacas de leite alimentadas com silagem de milho com
45% de concentrado, a recuperação fecal (RF) média de TiO2 foi maior do que a RF de Cr2O3 e
ambas foram maiores do que a unidade. A RF não foi afetada pelo método de coleta de fezes,
mas, as estimativas de digestibilidade da matéria seca e produção fecal (PF) foram. A dupla de
marcadores Cr2O3+i fibra detergente ácido indigestível (iADF) produziu estimativas de consumo
de matéria seca (CMS) acuradas. Em novilhos alimentados com diferentes fontes de forragem,
a RF do TiO2 foi próxima a 1 e este marcador produziu estimativas de PF adequadas. A RF foi
afetada pela fonte de forragem que compunha a dieta e nenhum dos marcadores produziu
estimativas de CMS acuradas. Em tourinhos Nelore alimentados com dietas compostas de
silagem de milho ou feno de Tifton-85 e diferentes relações de volumoso:concentrado, a RF
média dos marcadores internos lignina brometo de acetila (LBA), fibra detergente ácido
indigestível (iFDN), (iFDA) e cutina foi diferente de 100%. Os marcadores Cr2O3 e TiO2 tiveram
RF menor e maior que 100%, respectivamente. A combinação de marcadores internos e
externos para estimar o CMS produziu resultados acurados e satisfatórios, principalmente as
duplas Cr2O3 e iFDN ou iFDA. Os marcadores internos LBA e cutina merecem mais estudos. O
método de coleta GRAB produziu estimativas de DMS, PF e CMS acuradas, as quais foram
iguais ou melhores que as produzidas pelo método de coleta BULK. Independentemente do
método de coleta de fezes e da composição da dieta, é necessário estabelecer a RF real dos
marcadores que serão usados em experimento para obter estimativas corretas. Nenhum dos
marcadores teve RF completa e consistente nos 3 experimentos. A cutina e LBA tiveram RF
menor do que a unidade em todas as dietas e falharam em produzir estimativas acuradas de
DMS. Quando qualquer dos dois foi pareado com Cr2O3 ou TiO2 as estimativas de CMS
também não foram acuradas. Das fibras indigestíveis, iFDN e iFDA, a segunda foi mais
acurada em estimar o CMS quando pareada com Cr2O3. As estimativas de PF corrigida foram
acuradas para Cr2O3 em diferentes dietas sob metodologia de coleta GRAB. O mesmo não foi
observado para o TiO2, que produziu estimativas enviesadas inclusive após a correção. O
método de dosagem dos marcadores externos é extremadamente importante já que afeta e
determina em grande medida os resultados. Qualquer que seja o método, este deve permitir ao
animal comportar-se e alimentar-se normalmente sem comprometer seu desempenho. Os
métodos de coleta GRAB podem substituir a coleta total de fezes (CTF) (após determinação da
RF) o que poderá abrir novas possibilidades para estudos com animais em pastagem ou
alojados em baias coletivas.
Palavras-chave: Cutina. Dióxido de titânio. Fibra indigestível. Lignina. Oxido de cromo.
ABSTRACT
VELASQUEZ, A.V. Evaluation of internal and external markers for estimating dry matter
intake and digestibility in cattle. [Avaliação de marcadores internos e externos para estimar o
consumo e a digestibilidade da matéria seca em bovinos]. 2017. 87 f. Tese (Doutorado em
Ciências) – Faculdade de Medicina Veterinária e Zootecnia, Universidade de São Paulo, 2017.
Feed intake assessment is a valuable tool for herd management decisions. The use of markers,
either internal or external, is currently the most used technique for estimating feed intake in
production animals. Three experiments were conducted with beef and dairy cattle. In dairy cows
fed a corn silage based diet with 45% concentrate, the average fecal recovery (FR) of TiO2 was
higher than FR of Cr2O3 and both FR were more than unity. The FR was unaffected by the fecal
sampling procedure but, estimates for dry-matter digestibility (DMD) and fecal output (FO) were
affected. The Cr2O3+ indigestible acid detergent fiber (iADF) marker pair produced accurate dry-
matter intake (DMI) estimates. In steers fed diets with different forage sources FR of TiO2 was
close to 1 and this marker produced adequate FO estimates. The FR was affected by the forage
source that composed the diet and none of the marker pairs produced accurate DMI estimates.
In young Nelore bulls fed corn silage or Tifton-85 hay based diets with varying F:C ratios, the
average FR of internal markers acetyl bromide lignin (ABL), indigestible neutral detergent fiber
(iNDF), iADF and cutin was different from 100%. Markers Cr2O3 and TiO2 had FR lower and
higher than 100%, respectively. The combination of internal and external markers to estimate
DMI produced satisfactory and accurate results, particularly Cr2O3 based pairs with iNDF and
iADF. Internal markers ABL and cutin deserve more attention. The GRAB sampling procedures
yielded accurate DMD, FO and DMI estimates, which were as good as or better than BULK
sampling procedures. Regardless of the fecal sampling method and the composition of the diet,
it is necessary to establish the FR of the markers to be used in each experiment, in order to
obtain correct estimates. None of the markers had complete FR consistent throughout the 3
experiments. Cutin and ABL had lower than unity FR on all diets and failed to produce accurate
DMD estimates. When either one was paired with Cr2O3 or TiO2, DMI estimates were also not
accurate. Of the indigestible fibers, iNDF and iADF, the later was more accurate in estimating
DMI when paired with Cr2O3. Consistently throughout the experiments, FR was lower than and
higher than unity for internal and external markers, respectively. Corrected FO estimates were
accurate for Cr2O3 on various diets under GRAB sampling. The same was not true for TiO2,
which even after FR correction was applied failed to produce accurate FO estimates
consistently. The method of dosing the external markers is extremely important and greatly
affects and determines results. Whichever the method, it must allow the animals to display
normal feeding behavior and not affect performance. The GRAB sampling procedures can
replace TFC (once FR is established) which may open new possibilities for pasture based or
collectively housed animals.
Keywords: Cutin. Titanium dioxide. Indigestible fiber. Lignin. Chromic oxide.
11
List of Tables and Figures
Chapter 1:
Table 1. Sampling design protocols for BULK and GRAB feces samples ................................. 28
Figure 1. Relationship between Cr2O3 added and Cr2O3 analyzed ........................................... 30
Figure 2. Relationship between TiO2 added and TiO2 analyzed................................................ 31
Table 2. Chemical composition of feeds and total mixed ration (TMR), total-tract apparent
digestibility (TTAD), real fecal output (RFO) and real dry matter intake (RDMI) of TMR ............ 34
Table 3. Twenty-four hour fecal recovery (FR) (mean ± SE) of markers under two GRAB (4x4
and 9x3) and one BULK (72h) fecal sampling procedures ........................................................ 34
Table 4. Mean total tract apparent digestibility (TTAD) (g/kg DM) and dry matter digestibility
(DMD) (g/kg DM) estimates derived from internal markers on two GRAB (4x4 and 9x3) and one
BULK (72h) fecal sampling procedures ..................................................................................... 35
Table 5. Mean real fecal output (RFO) (g DM/day) and fecal output (FO) (g DM/day) estimates
derived from external markers on two GRAB (4x4 and 9x3) and one BULK (72h) fecal sampling
procedures ................................................................................................................................ 35
Table 6. Mean real dry matter intake (RDMI) (g DM/day) and dry matter intake (DMI) (g
DM/day) estimates derived from 1 internal + 1 external marker pairs on two GRAB (4x4 and
9x3) and one BULK (72h) fecal sampling procedures ............................................................... 36
Chapter 2:
Table 1. Composition of supplements and experimental diets .................................................. 45
Table 2. Chemical composition (g/kg of DM) of forages and supplements ................................ 49
Table 3. Chemical composition (g/kg of DM) of experimental diets ........................................... 50

12
Table 4. Twenty-four hour fecal recovery (FR) of internal markers and TiO2 in steers fed diets
with different forage sources ..................................................................................................... 50
Table 5. Mean DMD estimates ± SE (g/kg DM) for ABL, iNDF, iADF and Grow Safe® intake
data with TiO2 estimates of FO .................................................................................................. 51
Table 6. Mean FO (g DM/day) estimates for TiO2 and Grow Safe® intake data with DMD
estimates from internal markers ................................................................................................ 52
Table 7. Mean RDMI (g DM/day) from Grow Safe® data and DMI (g DM/day) estimates from
internal markers and TiO2 pairs ................................................................................................. 52
Chapter 3:
Table 1. Composition of concentrates and experimental diets .................................................. 61
Table 2. Sampling design protocols for BULK and GRAB feces samples ................................. 62
Table 3. Chemical composition (g/kg of DM) of forages and concentrates ................................ 67
Table 4. Chemical composition (g/kg of DM), of the experimental diets .................................... 68
Table 5. Effect of forage source (F, silage vs. hay) with two forage:concentrate ratios (C, 60:40
vs. 40:60) on total tract apparent digestibility (TTAD), real fecal output (RFO), real dry matter
intake (RDMI) obtained by total feces collection (72 hours) in young bulls fed TMR diets ......... 68
Table 6. Effect of forage source (F, silage vs. hay) with two forage:concentrate ratios (C, 60:40
vs. 40:60) on fecal recovery (FR) of external markers chromic oxide (Cr2O3), titanium dioxide
(TiO2) and of internal markers acetyl bromide lignin (ABL), indigestible neutral detergent fiber
(iNDF), indigestible acid detergent fiber (iADF) and cutin in young bulls fed TMR diets ............ 69

13
Table 7. Total tract apparent digestibility (TTAD) (mean ± SE) (g/kg DM) and dry matter
digestibility (DMD) (mean ± SE) (g/kg DM) estimates derived from internal markers on two
GRAB (4x4 and 9x3) and one BULK (72h) fecal sampling procedures ...................................... 70
Table 8. Real fecal output (RFO) (mean ± SE) (g DM/day) and fecal output (FO) (mean ± SE) (g
DM/day) estimates derived from external markers on two GRAB (4x4 and 9x3) and one BULK
(72h) fecal sampling procedures ............................................................................................... 71
Table 9. Real dry matter intake (RDMI) (mean ± SE) (g DM/day) and dry matter intake (DMI)
(mean ± SE) (g DM/day) estimates derived from 1 internal + 1 external marker pairs on two
GRAB (4x4 and 9x3) and one BULK (72h) fecal sampling procedures ...................................... 72

14
Table of Contents
List of Tables and Figures .........................................................................................................11
Chapter 1: .............................................................................................................................11
Chapter 2: .............................................................................................................................11
Chapter 3: .............................................................................................................................12
Introduction ...............................................................................................................................17
General Overview .....................................................................................................................18
Considerations on behavior and physiology of feed intake .................................................19
Methods for estimating voluntary intake .............................................................................20
Internal markers .................................................................................................................22
External markers ................................................................................................................24
Chapter 1. .................................................................................................................................25
Introduction ...........................................................................................................................25
Material and Methods ............................................................................................................26
Animals, diet and experimental design ...............................................................................27
Markers ..............................................................................................................................27
Feces .................................................................................................................................28
Chemical analysis and measurements ...............................................................................29
Calculations .......................................................................................................................32
Statistical Analysis .............................................................................................................32
Results ..................................................................................................................................34
Fecal recovery of markers ..................................................................................................34
Prediction of DMD based on fecal concentration of internal markers ..................................35
Prediction of FO based on fecal concentration of external markers ....................................35
Prediction of DMI based on internal and external marker pairs ..........................................36
Discussion .............................................................................................................................37
15
Fecal recovery of markers ..................................................................................................37
Prediction of DMD based on fecal concentration of internal markers ..................................39
Prediction of FO based on fecal concentration of external markers ....................................40
Prediction of DMI based on internal and external marker pairs ..........................................40
Conclusions ...........................................................................................................................41
Chapter 2. .................................................................................................................................42
Introduction ...........................................................................................................................42
Material and Methods ............................................................................................................44
Animals, diets and experimental design .............................................................................44
Markers ..............................................................................................................................45
Feces .................................................................................................................................46
Chemical analysis and measurements ...............................................................................46
Calculations .......................................................................................................................47
Statistical Analysis .............................................................................................................48
Results ..................................................................................................................................49
Fecal recovery of markers ..................................................................................................50
Prediction of DMD based on fecal concentration of internal markers ..................................50
Prediction of FO based on fecal concentration of TiO2 .......................................................51
Prediction of DMI based on internal markers and TiO2 pairs ..............................................52
Discussion .............................................................................................................................53
Fecal recovery of markers ..................................................................................................53
Prediction of DMD based on fecal concentration of internal markers ..................................55
Prediction of FO based on fecal concentration of TiO2 .......................................................56
Prediction of DMI based on internal markers and TiO2 pairs ..............................................56
Conclusions ...........................................................................................................................57
Chapter 3. .................................................................................................................................58
Introduction ...........................................................................................................................58
16
Material and Methods ............................................................................................................59
Animals, diets and experimental design .............................................................................60
Markers ..............................................................................................................................61
Feces .................................................................................................................................62
Chemical analysis and measurements ...............................................................................62
Calculations .......................................................................................................................64
Statistical Analysis .............................................................................................................66
Results ..................................................................................................................................67
Fecal recovery of markers ..................................................................................................68
Prediction of DMD based on fecal concentration of internal markers ..................................69
Prediction of FO based on fecal concentration of external markers ....................................70
Prediction of DMI based on internal and external marker pairs ..........................................71
Discussion .............................................................................................................................73
Fecal recovery of markers ..................................................................................................73
Prediction of DMD based on fecal concentration of internal markers ..................................75
Prediction of FO based on fecal concentration of external markers ....................................75
Prediction of DMI based on internal and external marker pairs ..........................................76
Conclusions ...........................................................................................................................77
Final Remarks ...........................................................................................................................79
Limitations ..........................................................................................................................80
Take home messages ........................................................................................................80
References ...............................................................................................................................81

17
Introduction
Feed intake assessment is an aid for herd management decisions. It is also the starting point for
interpretations about animal nutrition. Today, this topic has more relevance in relation to
evaluation of the environmental impact caused by livestock production, which requires accurate
estimates of how much forage animals consume when they are on pasture. Also, to determine
ration composition to meet animal requirements.
Scientist have been trying to estimate feed intake in ruminants for many years and several
strategies have been made available. Among these strategies is the use of prediction equations
with multiple regression analysis between observed intake and variables that are supposed to
affect it. These equations are based on feed composition but, organoleptic characteristics,
weather, management and learning among others, can alter voluntary intake. The use of
markers, either internal or external, is currently the most used technique for estimating feed
intake in production animals.
Even though the use of internal and external markers may be the most adequate for estimating
intake, the method has also received criticisms. Theoretically, all markers should be indigestible,
not secreted by the host, have passage characteristics similar to those of the feed being
consumed, be completely recovered in feces and allow for precise and practical analysis.
According to Merchen (1993), none of the substances that are used as markers fulfill all of these
characteristics, but some of them are adequate enough to produce important data. For this
reason, the search for an “ideal” marker is a topic that has been given attention by the scientific
community.
A reliable method for estimating intake should produce results with small variation and high
repeatability (SMITH et al., 2005). An “ideal” method should have minimal influence on animal
behavior (LE DU & PENNING, 1982), avoiding decreases in intake and consequently in
performance. Information about the currently available methods for measuring intake in
ruminants will allow the proposal of guidelines for the use of these tools.

18
General Overview
Approximately half of the meat produced around the world comes from tropical and subtropical
countries (JANK et al., 2005). In these countries, production systems are mostly pasture based
and are subject to strong variations in quantity and quality of pastures due to seasonal changes.
Through supplementation, these effects can be countered allowing for the evolution of national
beef and dairy herds raised under these conditions. The main difficulty in doing so, is that in
order to correctly, precisely and economically supplement an animal we must first have an
accurate idea of how much feed it can consume and the quality of the feed that it will be
consuming. When animals are individually housed (show animals, tie-stall or experimental
conditions) or with electronic feed bunks it is possible do determine how much an animal eats
per day. Under normal farm conditions, where animals are either on pasture or housed in
groups within free-stalls or feed-lots, individual intake can only be calculated as the average of
the group’s intake or inferred by measuring available forage before and after the animals enter
the paddocks. Although, these intake estimates may be of some use, they are not adequate
enough to allow for decision making, supplement formulation and balancing or even to
determine efficiency in the use of nutrients.
Voluntary intake depends on ruminal capacity (volume) and the chemical composition of the
feed which will determine the extent of ruminal fermentation. Thus, an increased rate of ruminal
fermentation results in faster passage rate which leads to increased voluntary intake. Ruminal
fermentation causes feed particles to diminish in size and increase in density. Once the particle
is small enough, it exits the rumen through the millimetric reticulo-omasal orifice and “opens
space” for new feed to be consumed. Mechanic receptors on the ruminal wall detect changes in
ruminal distension and signal the hypothalamus, causing the animal to start another feeding
episode. This mechanism causes that increased ruminal degradation results in shorter interval
between feeding episodes (BERCHIELLI et al., 2011).
Feed intake can be defined as the amount of dry matter (DM) ingested over 24-hours (kg
DM/day) and it involves a number of feeding episodes, duration of these episodes and the
respective rate of ingestion. Any change in intake is necessarily associated to one or more of
these three variables. Direct methods for measuring intake have tried to determine the average
values for each variable but, the variation among individuals and animal categories plus the
many factors than can affect each one have steered research towards more indirect approaches
like the use of markers.
19
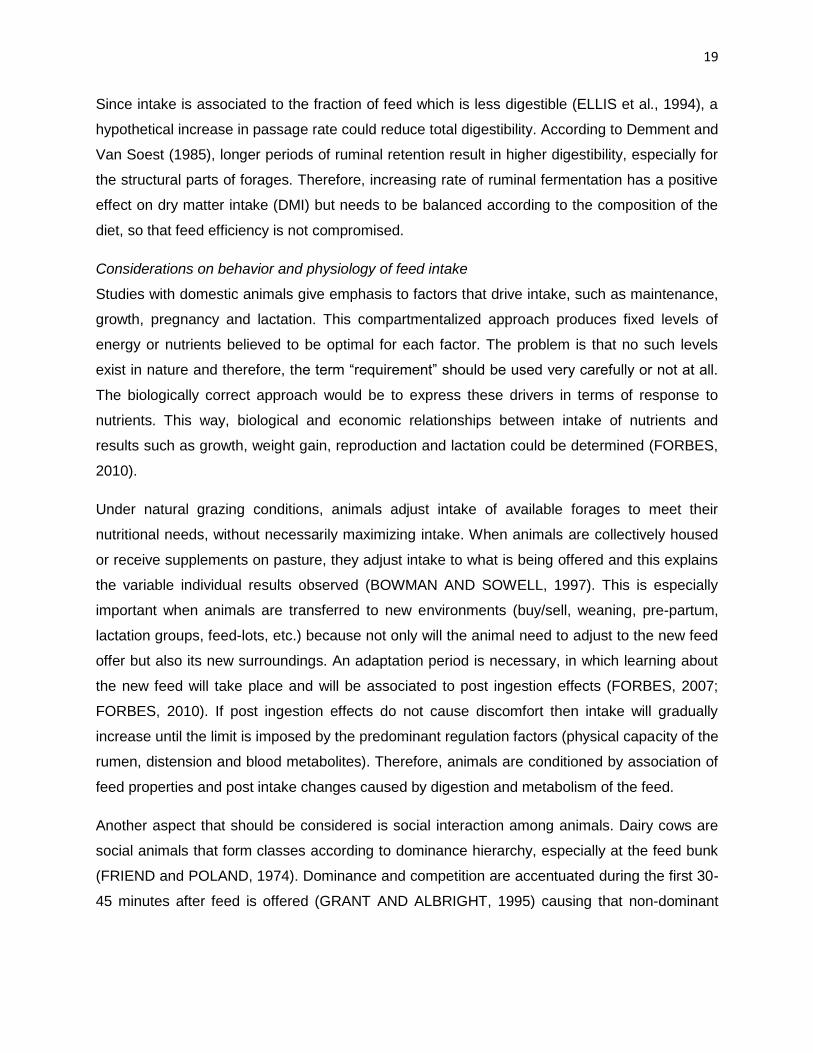
Since intake is associated to the fraction of feed which is less digestible (ELLIS et al., 1994), a
hypothetical increase in passage rate could reduce total digestibility. According to Demment and
Van Soest (1985), longer periods of ruminal retention result in higher digestibility, especially for
the structural parts of forages. Therefore, increasing rate of ruminal fermentation has a positive
effect on dry matter intake (DMI) but needs to be balanced according to the composition of the
diet, so that feed efficiency is not compromised.
Considerations on behavior and physiology of feed intake
Studies with domestic animals give emphasis to factors that drive intake, such as maintenance,
growth, pregnancy and lactation. This compartmentalized approach produces fixed levels of
energy or nutrients believed to be optimal for each factor. The problem is that no such levels
exist in nature and therefore, the term “requirement” should be used very carefully or not at all.
The biologically correct approach would be to express these drivers in terms of response to
nutrients. This way, biological and economic relationships between intake of nutrients and
results such as growth, weight gain, reproduction and lactation could be determined (FORBES,
2010).
Under natural grazing conditions, animals adjust intake of available forages to meet their
nutritional needs, without necessarily maximizing intake. When animals are collectively housed
or receive supplements on pasture, they adjust intake to what is being offered and this explains
the variable individual results observed (BOWMAN AND SOWELL, 1997). This is especially
important when animals are transferred to new environments (buy/sell, weaning, pre-partum,
lactation groups, feed-lots, etc.) because not only will the animal need to adjust to the new feed
offer but also its new surroundings. An adaptation period is necessary, in which learning about
the new feed will take place and will be associated to post ingestion effects (FORBES, 2007;
FORBES, 2010). If post ingestion effects do not cause discomfort then intake will gradually
increase until the limit is imposed by the predominant regulation factors (physical capacity of the
rumen, distension and blood metabolites). Therefore, animals are conditioned by association of
feed properties and post intake changes caused by digestion and metabolism of the feed.
Another aspect that should be considered is social interaction among animals. Dairy cows are
social animals that form classes according to dominance hierarchy, especially at the feed bunk
(FRIEND and POLAND, 1974). Dominance and competition are accentuated during the first 30-
45 minutes after feed is offered (GRANT AND ALBRIGHT, 1995) causing that non-dominant
20
animals consume less feed, with different composition than what was formulated which will
ultimately compromise animal performance.
Some breeds of cattle, especially Bos t. indicus and their crosses, tend to be more nervous than
others. This may be caused by minimum human contact or incorrect handling of animals during
routine management. Either way, nervous animals are easily stressed resulting in high
adrenaline and cortisol levels which negatively affect intake. It is important to consider this when
working with these breeds, to allow adaptation to humans, machinery and every-day activities.
Methods for estimating voluntary intake
Diverse approaches have been used when trying to solve the intake issue, especially with
animals on pasture. Methods can be divided into direct or indirect depending if the focus is on
the animal or on what it is consuming. It is possible to directly determine or indirectly estimate
fecal output (FO), dry matter digestibility (DMD) and dry matter intake (DMI), although any
procedure that is chosen will have advantages and disadvantages when compared to the
others.
Direct measurements are collected by weighing all feed that is offered, orts and total feces
collection (TFC). This procedure is the one that most reliably represents reality; on the other
hand, collection of this data is labor intensive, expensive and hard to obtain (BERCHIELLI et al.,
2000). According to Barbosa (2005), estimating DMD is the main method used to determine
nutritional value of feeds. For this, the most commonly used procedure is TFC. Considering the
elevated cost and labor required for TFC, the use of markers has become a convenient
alternative for this type of studies. Even though the use of markers might be the easiest and
most adequate way of estimating intake, the method has also received criticism.
Several alternative methods have been proposed with the objective of overcoming these
difficulties. Approaches that have been contemplated: differences in weight of feed (CORBETT,
1980; GARDNER, 1986 and BURNS et al., 1994), differences in body weight (HORN et al.,
1979), feeding behavior (LUGINBUHL et al., 1990), mathematical predictions or regression
equations (POPPI, 1996) and, more recently, biomass volume measurements through satellite
images (EDIRISINGHE et al., 2012). All of these methods have also received criticism for
reasons that vary from low reliability of results to excessively high cost of analysis, which
prevents their routine adoption.
21
Electronic methods are available, such as the Calan-gates®, GrowSafe® and Kloppen®
systems, allowing group housing with individual intake measurements. With these systems, the
feed bunk recognizes a magnetic collar or ear-tag on the animal and stores intake information
from each animal in the group. Each system has its own variations but the major problems with
these technologies is their high cost and the difficulty of receiving good technical support
outside the USA or Europe.
The use of markers to estimate intake is based on the principle that fecal output (FO) is
inversely proportional to dry matter digestibility (DMD) and directly proportional to dry matter
intake (DMI) (PENNING and JOHNSON, 1983), being calculated by the formula:
Estimating FO by the marker method consists of using a reference substance that allows
quantitative recovery (OWENS and HANSON, 1992). The premise of efficiency for markers is
the capacity of being recovered in feces. Knowing the amount of marker consumed by an
animal allows for estimates of FO from fecal marker concentration.
One of the difficulties associated to the marker method for estimating FO is the means of dosing
the animals with the external markers. Various approaches have been employed for this task
and all of them have advantages and disadvantages. The most important consideration is
choosing a form of delivery that minimizes handling of animals and stressful conditions, but at
the same time it must guarantee that an exact and known amount of marker is delivered.
Working with ruminally cannulated animals can be easier and allow for precise dosing but this
type of animal is usually used only for experimental purposes and not easily available in
practical conditions. Even with ruminally cannulated animals there is a need to use a chute to
safely deliver the markers, so this does not completely solve the issue of the excessive need for
human interaction with the animals. More handling results in stress for the animals and less time
spent feeding which may influence intake results.
The main difficulty associated to the use of markers is feces collection. Individually housed
animals are easier to work with but require constant monitoring to avoid loss or contamination of
samples. Collectively housed or pasture based animals pose a bigger challenge to avoid cross
contamination of feces and because the use a containment structure (chute) is necessary for
sampling. The sampling design to be used is very important and will determine how many days
of sampling and the interval between each sampling episode. About the length of the sampling
22
period, Schneider and Flatt (1975) reported that a minimum of 7-10 days of sampling were
necessary to avoid errors in FO estimates. Barbosa (2005) did not observe significant
differences between 5 or 6 days of sampling, but increasing the number of days produced more
precise estimates. Ferreira et al., (2008) reported no significant differences between 3 and 5
sampling days for estimating digestibility in beef and dairy cattle.
Research has shown that just as the number of sampling days can be reduced, collection of
various sub-samples throughout the day can represent TFC. These GRAB samples are
collected after spontaneous excretion or manually, directly from the rectum. These subsamples
are then pooled by animal, day and/or period for later analysis. The more recent results show
opportunity of collecting feces samples a few times a day without compromising results, which
opens new possibilities for this method. Therefore, it is possible to propose sampling designs
that occur only during the day or that are easily adaptable to everyday activities of research
centers and maybe even commercial operations.
After review, Valadares Filho et al., (2010) recommended that a 3 day feces sampling period
was enough and concluded that with the use of 1 internal and 1 external marker it is possible to
accurately estimate individual intake in collectively fed animals. Among the markers they
studied, chromic oxide (Cr2O3) and titanium dioxide (TiO2) worked best for estimating individual
supplement intake and, indigestible neutral detergent fiber (iNDF) and indigestible acid
detergent fiber (iADF) produced the best estimates of individual forage intake.
It is possible to estimate the indigestible fraction of a feed by laboratory analysis based on its
chemical composition. From this indigestible fraction, it is possible then calculate how much
intake would be. This seems easier and practical yet studies have shown that in vitro dry matter
digestibility (IVDMD) overestimated intake when compared to iNDF (DETMANN et al., 2001).
Therefore, they advised that IVDMD should not be used for intake estimates in ruminants.
Internal markers
Fecal recovery (FR) of indigestible feed fractions is the basis for using internal markers to
estimate DMD (VAN SOEST, 1994). Internal markers use is advantageous when compared to
external markers because they are already naturally present in the feed and they distribute
uniformly in digesta (PIAGGIO et al., 1991). On the other hand, they require prolonged
incubation periods, minimum of 144 hours (BERCHIELLI et al., 2000), to be considered an
indigestible fraction, such as iNDF and iADF. More so, longer incubation times have been
suggested recently, 288 hours (KRIZAN and HUHTANEN, 2013), due to variations among
23
different feeds. With grazing animals (DETMANN et al., 2001) or feeding sugarcane as forage to
heifers (FERREIRA et al., 2008), iNDF produced better estimates than iADF, but the opposite
happened when the same authors fed corn silage to lactating dairy cows.
According to Casali et al., (2008) there is no consensus among researchers on the incubation
time for indigestible fibers and published reports vary from 98 to 288 hours. In order to obtain
relevant data from the use of these markers it is necessary to standardize one procedure that is
adopted by the scientific community. This will validate results and allow for comparisons
between different studies.
Lignin is considered the primary limiting factor of cell wall degradation by constructing a physical
barrier that denies access to rumen microorganisms and their enzymes (BUXTON and
RUSSELL, 1988). Lignin, determined as acid detergent lignin (ADL), has been used as an
internal marker in digestion studies and is considered indigestible because there are no known
mammalian enzymes that can degrade it (VAN SOEST, 1994). Meanwhile, reservations exist
and no consensus is found in literature. Studies dated as far back as 1920 already showed that
lignin was not an inert part of animal diets. Thonney et al., (1979) used potassium
permanganate lignin as a marker for steers consuming 20, 30, 60, 80% concentrate and
observed that the marker underestimated digestibility, when compared to TFC, by 23.9
percentage points. Crampton (1940) reported that even if digested, lignin, did not have any
nutritional role in the animal because the small quantities that could be absorbed were excreted
via urine. Results are conflicting and point to problems with FR. Also, methods for quantification
of this cell wall component are controversial.
While much of the research is focused on modifications of the lignin molecule as it passes
through the GIT, experimental results justify the use of this compound as a marker. The
observations of Porter and Singleton (1971) showed that the chemical composition and amount
of lignin that passed through the duodenum was almost the same as fecal lignin. Since lignin is
intimately linked to the nutritive value of feeds, it deserves more attention to better understand
its role and how it can be used.
One of the main reasons for conflicting results observed for lignin is, as with iNDF and iADF, the
availability of several different methods to determine lignin and the proven flaws that most of
them have shown. Lignin procedures that use 72% sulfuric acid, such as ADL and Klason lignin,
can also measure cutin or some Maillard compounds as being lignin. On the contrary, part of
the lignin can be destroyed or solubilized during the procedure, either by the acid detergent
24
solution or during hydrolysis with 72% sulfuric acid. Fukushima et al., (2015) backed up this
observation by verifying ABL concentrations twice as high as ADL in grasses, but not in
legumes. This had already been reported by Kondo et al., (1987), who declared that this effect
was stronger on grasses.
The alternative method acetyl bromide lignin (ABL) calculates the concentration of this
compound by spectrophotometry at UV 280 nm. The lignin values obtained by this method have
presented strong correlation with IVDMD and in vitro NDF digestibility in studies conducted by
our research team. Thus, it seems interesting to use ABL for estimating DMD, FO and DMI.
Another compound with potential for being used as an internal marker is cutin. Cutin is a
polymer of esterified fatty acids linked to the aerial parts (leaves, fruits and stems) of some
plants. Silva et al., (2006) used it as an internal marker to calculate digestibility of nutritional
components in supplements for cattle, and their results indicated potential for this use. Siqueira
et al., (2009) used cutin as a marker to estimate apparent digestibility in horses and observed
that FR differed (P<0.05) from FR of ADL and Cr2O3. Studies that have used cutin as a marker
are rare.
External markers
External markers can be used to determine DMD, FO and other intake measurements when
feces sample collection is not a practical option. In this category, Cr2O3 has been widely studied
for estimating FO due to easiness of incorporating it into diets, relatively low cost and simplicity
of analysis (VALADARES FILHO et al., 2006). Titgemeyer (1997) under extensive review,
verified that FR was not complete, especially on pasture. On the other hand, Paixão et al.,
(2007) reported inert passage through the GIT and complete FR of the administered dose,
without significant difference between 1 and 5 sampling days. Penning (2004) review literature
data and concluded that for cattle, the recommended daily dose of Cr2O3 was between 5 to 10g,
divided into two doses administered with intervals between 8 and 16 hours, concomitant with
feces sampling. Prigge et al., (1981) used Cr2O3 to estimate FO and compared it to TFC in
confined dairy cows. The authors concluded that Cr2O3 given in two daily doses of 5g each, for
twelve days (7 days for adaptation and 5 days for sampling) was an efficient procedure to
estimate FO.
As an alternative to Cr2O3, TiO2 which was approved for legal use as a coloring additive for
supplements, (AAFCO, 1996), may be used as an external marker. During the las decade, TiO2
25
has received more attention by researchers and therefore it is important to collect information
that can allow progress to be made in the use of this external marker in ruminant studies.
Other markers such as Lithium (LiCl), Ytterbium (Yb), LIPE® (isolated, purified and enriched
Eucaliptus grandis lignin), and more recently alcanes, have all been subject of study. Results
are not conclusive and more research is necessary. Some of the results obtained from alcanes
are promising but the extremely high cost of this analysis is still the main limiting factor for wider
use.
Chapter 1.
Evaluating internal and external markers versus fecal sampling procedure interactions when
estimating intake in dairy cows consuming a corn silage-based diet
Introduction
Dry matter intake (DMI) determines nutrient intake and may be an index of the efficiency with
which nutrients are metabolized, therefore it is the main factor influencing animal performance.
Many different strategies have been used over the years to estimate voluntary DMI in
ruminants. Behavioral studies (time and rate of intake, mass of bite) (SILVA et al., 2004;
COSTA et al., 2011), before and after grazing pasture measurements (POPPI et al., 1987) and
multiple regression equations that consider different variables believed to affect intake, have
been commonly used approaches.
The use of markers is currently the most widely used technique to estimate DMI in ruminants.
Markers are indigestible substances that are not secreted by the animal, have passage rates
similar to feeds, can be recovered completely after ingestion and allow for practical and precise
chemical analysis (FAHEY and JUNG, 1983), among others characteristics. According to
Merchen (1993), none of the substances that are used as markers in ruminant digestion studies
meet all of the requirements but, some are adequate enough to produce important data for the
advance of research.
26
The marker technique to estimate intake uses an external marker to estimate fecal output (FO)
and an internal marker (naturally occurring in feedstuffs) to estimate dry matter digestibility
(DMD). Intake is then calculated by dividing FO by the indigestibility (1-DMD) of the feed. The
main criticisms to the technique are the difficulty and labor of feeding the external markers twice
a day, for several days; the need for excessive interaction between animals and people which
may negatively affect intake and the intensive labor and high cost of feces sample collection.
Total feces collection (TFC) is regularly used in intake studies as the standard to which
estimates are compared to and as the source of BULK samples for later analysis. The
recommended number of days for TFC ranges from 7-10 days (SCHNEIDER & FLATT, 1975) to
3-5 days (FERREIRA et al., 2008), with authors reporting no significant differences for
digestibility estimates. Just as number of days for TFC can be reduced, different fecal sampling
designs have been proposed in order to reduce the short term bias of estimates (LANGLANDS
et al., 1963), which accounts for the inconsistencies of obtaining the feces samples. In this
approach, GRAB samples collected at specific times during the day, either after spontaneous
excretion or collected directly from the rectum, are composited to make up the daily samples.
Sampaio et al., (2011) compared 9 different fecal sampling designs and reported that four daily
GRAB samples distributed along the whole day or just during the diurnal period will produce
accurate estimates.
From the above, it can be hypothesized that the combination of internal and external markers,
with fecal sampling designs that produce composite GRAB samples over 3-4 days of collection
period, should result in accurate estimates for DMD, FO and DMI in dairy cows consuming a
corn silage based diet.
The objective of the experiment was to test the accuracy of internal markers, acetyl bromide
lignin (ABL), cutin, indigestible neutral detergent fiber (iNDF) and indigestible acid detergent
fiber (iADF) for estimating DMD; of external markers, chromic oxide (Cr2O3) and titanium dioxide
(TiO2) for estimating FO; the combination of internal and external markers for estimating DMI
and to compare 3 different sampling designs against TFC.
Material and Methods
The experiment was conducted at the Dairy Cattle Research Laboratory of the Animal Nutrition
and Production Department at the University of São Paulo. The experiment was approved by
the Ethics Committee for Animal Use (CEUA) of the University of São Paulo (Approval number:
CEUA 24420603114). No animals were harmed or fell ill during the experiment.
27
Animals, diet and experimental design
Ten multiparous Holstein cows (average ± SD; parity: 1.2 ± 0.4 lactations; Days in milk: 123 ±
53.7 d; milk yield; 25.5 ± 3.8 kg/d; BW: 616.7 ± 67.2 kg), were used for the study. The mouth,
tongue and teeth of all cows were examined prior to starting the experiment in order to
guarantee absence of wounds or abnormalities that could compromise feed intake. Cows were
housed in a covered, concrete floor free-stall, divided by gates into individual stalls, each of
which had a feed bunk, access to clean water and a sand covered bed. Cows were milked twice
a day (07:00 and 15:00) and milk yield was recorded during the experimental period.
All cows received a corn silage-based diet, with 55:45 forage to concentrate ratio (F:C). Daily
allowances of the total mixed ration (TMR), plus 10% of calculated daily natural matter intake (to
guarantee orts), were fed in two equal portions at 08:00 and 16:00, to represent a natural
diurnal feeding pattern of cattle. Feed subsamples were taken on Mondays, Wednesdays and
Fridays for dry matter (DM) determination (drying in a forced draft oven (SOLAB Cientifica®) at
55°C for 3 days). Orts were collected daily so that ad libitum intake could be determined as the
difference between the DM offered and refused. The concentrate was composed of coarsely-
ground corn grains, soybean meal and whole roasted soybeans, cottonseed meal and mineral
mix. Cottonseed meal was added to replace part of the soybean meal, due to its high contents
of cutin (from added cotton hulls). Increasing the cutin concentration of the diet was desirable in
order to facilitate analysis and decrease variability of results. Composition of silage, concentrate
and TMR are shown in Table 2.
The experiment ran for 19 days (day regarded as the 24 h period from 8am to 8 am). The
experimental period consisted of three phases: d1-d5 were allocated to adaptation of the
animals to the diet; ten days (d5-d15) of marker excretion stabilization and the final 4 days (d16-
19) were for sample collection. The animals were adapted to the experimental conditions during
14 days prior to the experimental period. The 10 cows were distributed into a Split-plot design,
with the main plot (markers) being completely randomized and the sampling designs as sub-
plots.
Markers
Four internal markers (ABL, cutin, iNDF and iADF) were used to estimate DMD and two external
markers (Cr2O3 and TiO2) were used to estimate FO. The eight combinations (1 internal marker
and 1 external marker) derived from these six markers were used to estimate voluntary DMI.
28
Estimates of DMD, FO and DMI were compared against their reciprocal TTAD, RFO and RDMI
values, respectively.
Internal markers are naturally occurring indigestible fractions of feedstuffs. External markers, in
this case Cr2O3 and TiO2, need to be fed to the animals exogenously, be it orally or via ruminal
cannula. For the experiment, capsules containing 0.75 g of Cr2O3 or 1 g of TiO2 were prepared
at a local pharmacy. Cows received 15 g of Cr2O3 and 15 g of TiO2 daily. This dose was divided
into two equal parts and the animals were fed the capsules (mixed with a small amount of
concentrate and molasses) before receiving the rest of the meal (08:00 and 16:00). The animals
were dosed from d5 to d18 of the experimental period and had been receiving molasses with
concentrate before each meal during the 14 days prior to the start of the experiment.
Feces
On d15, all stalls were thoroughly cleaned (pressure hosed). On d16 at 06:00 stalls were
cleaned of what was excreted overnight and at 08:00 the 72 h TFC period started. Two people
teams constantly watched the animals, in 8 hour shifts, and collected all feces immediately after
excretion to avoid contamination with bedding sand or partial loss of material. Cows were slowly
and carefully followed to the milking parlor to collect any fecal matter excreted during this
procedure. Collected feces were placed into individual (1 per cow) plastic containers (previously
weighed empty) which were kept sealed and away from direct sunlight. At 07:30 of d17 to d19
the containers were weighed and the daily RFO recorded for each animal. Fecal matter in each
container was homogenized (mixed thoroughly with a ladle) and an approximately 500 g sample
was taken for each animal daily, during the sampling period. These BULK samples constituted
the 72-hour continuous sampling design.
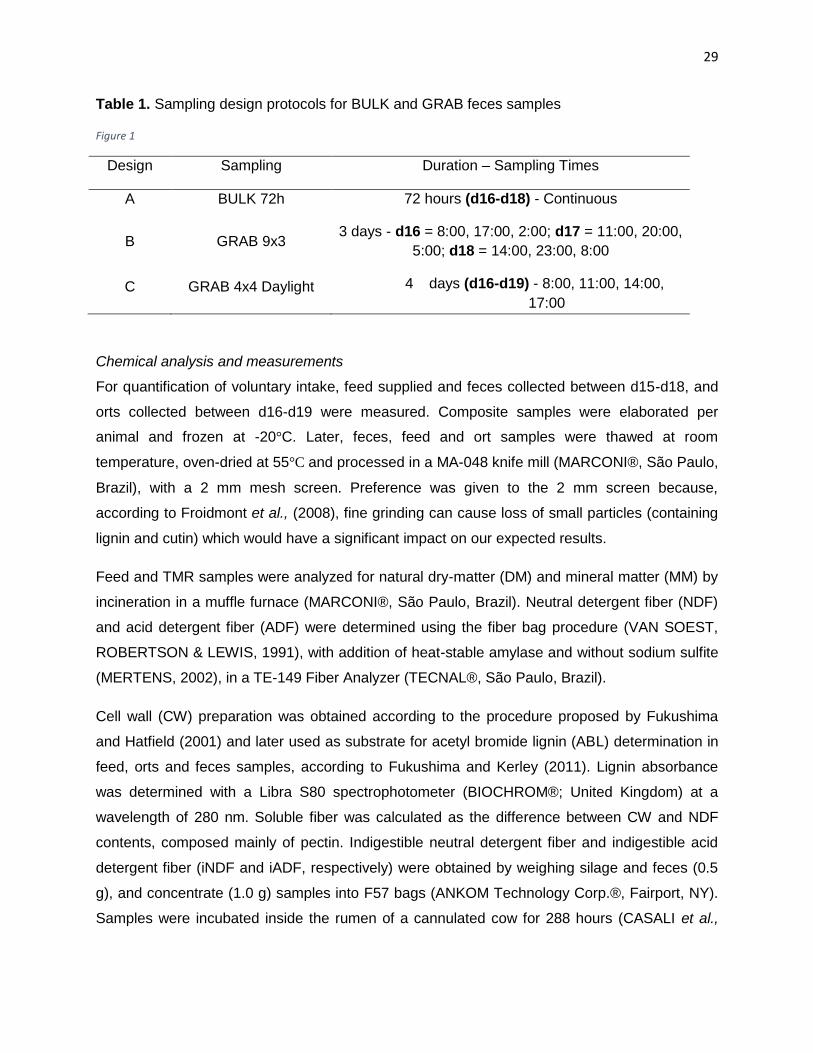
Two GRAB sampling designs were evaluated during this study. Sampaio et al., (2011b),
compared 9 different sampling design protocols and reported that 4 samples collected during
daylight hours were enough to obtain a representative sample of the daily excretion profile. A
commonly used design in marker studies is the 3-day sampling period with samples being taken
every 9 hours. This way, at the end of the three days, the 24 hours of a day will be represented
by the various samples. Table 1 illustrates the fecal sampling design protocols used in this
study.
29
Table 1. Sampling design protocols for BULK and GRAB feces samples
Figure 1
Design Sampling Duration – Sampling Times
A BULK 72h 72 hours (d16-d18) - Continuous
B GRAB 9x3 3 days - d16 = 8:00, 17:00, 2:00; d17 = 11:00, 20:00,
5:00; d18 = 14:00, 23:00, 8:00
C GRAB 4x4 Daylight 4 days (d16-d19) - 8:00, 11:00, 14:00,
17:00
Chemical analysis and measurements
For quantification of voluntary intake, feed supplied and feces collected between d15-d18, and
orts collected between d16-d19 were measured. Composite samples were elaborated per
animal and frozen at -20°C. Later, feces, feed and ort samples were thawed at room
temperature, oven-dried at 55°C and processed in a MA-048 knife mill (MARCONI®, São Paulo,
Brazil), with a 2 mm mesh screen. Preference was given to the 2 mm screen because,
according to Froidmont et al., (2008), fine grinding can cause loss of small particles (containing
lignin and cutin) which would have a significant impact on our expected results.
Feed and TMR samples were analyzed for natural dry-matter (DM) and mineral matter (MM) by
incineration in a muffle furnace (MARCONI®, São Paulo, Brazil). Neutral detergent fiber (NDF)
and acid detergent fiber (ADF) were determined using the fiber bag procedure (VAN SOEST,
ROBERTSON & LEWIS, 1991), with addition of heat-stable amylase and without sodium sulfite
(MERTENS, 2002), in a TE-149 Fiber Analyzer (TECNAL®, São Paulo, Brazil).
Cell wall (CW) preparation was obtained according to the procedure proposed by Fukushima
and Hatfield (2001) and later used as substrate for acetyl bromide lignin (ABL) determination in
feed, orts and feces samples, according to Fukushima and Kerley (2011). Lignin absorbance
was determined with a Libra S80 spectrophotometer (BIOCHROM®; United Kingdom) at a
wavelength of 280 nm. Soluble fiber was calculated as the difference between CW and NDF
contents, composed mainly of pectin. Indigestible neutral detergent fiber and indigestible acid
detergent fiber (iNDF and iADF, respectively) were obtained by weighing silage and feces (0.5
g), and concentrate (1.0 g) samples into F57 bags (ANKOM Technology Corp.®, Fairport, NY).
Samples were incubated inside the rumen of a cannulated cow for 288 hours (CASALI et al.,
30
2008; KRIZAN and HUHTANEN, 2013), washed with abundant water and treated according to
Van Soest and Robertson (1985) for determination of these indigestible fractions.
Cutin contents in feed, TMR and feces samples were determined in non-woven textile (NWT)
fiber bags according to the procedure described by Fukushima (personal communication).
Briefly, dry matter samples are sequentially treated with neutral detergent and acid detergent
solutions to obtain an acid detergent residue (ADR). Fiber bags containing ADR were treated
with potassium permanganate solution (KMnO4) in order to oxidize lignin and afterwards treated
with 72% sulfuric acid solution (H2SO4) to hydrolyze cellulose, leaving behind cutin and mineral
residue. Bags were dried in a forced draft oven at 105°C for 12 hours and weighed. Finally, the
residue containing bags are incinerated at 450°C in a muffle furnace and cutin contents is
calculated as:
Cutin% = ((WaH – (WaI - Wc) x100) ÷ SiW
where: WaH = weight after sulfuric acid hydrolysis, WaI = weight after incineration, Wc = weigh
of crucible and SiW = sample initial weight.
Crude protein (N% x 6.25) was determined in feed and TMR samples by the micro-kjeldahl
procedure in a TE 036/1 Nitrogen Distiller (TECNAL®, São Paulo, Brazil). Ether extract (Ee)
content of feeds and TMR was determined by petroleum ether extraction using a XT10 Extractor
(ANKOM Technology Corp.®, Fairport, NY).
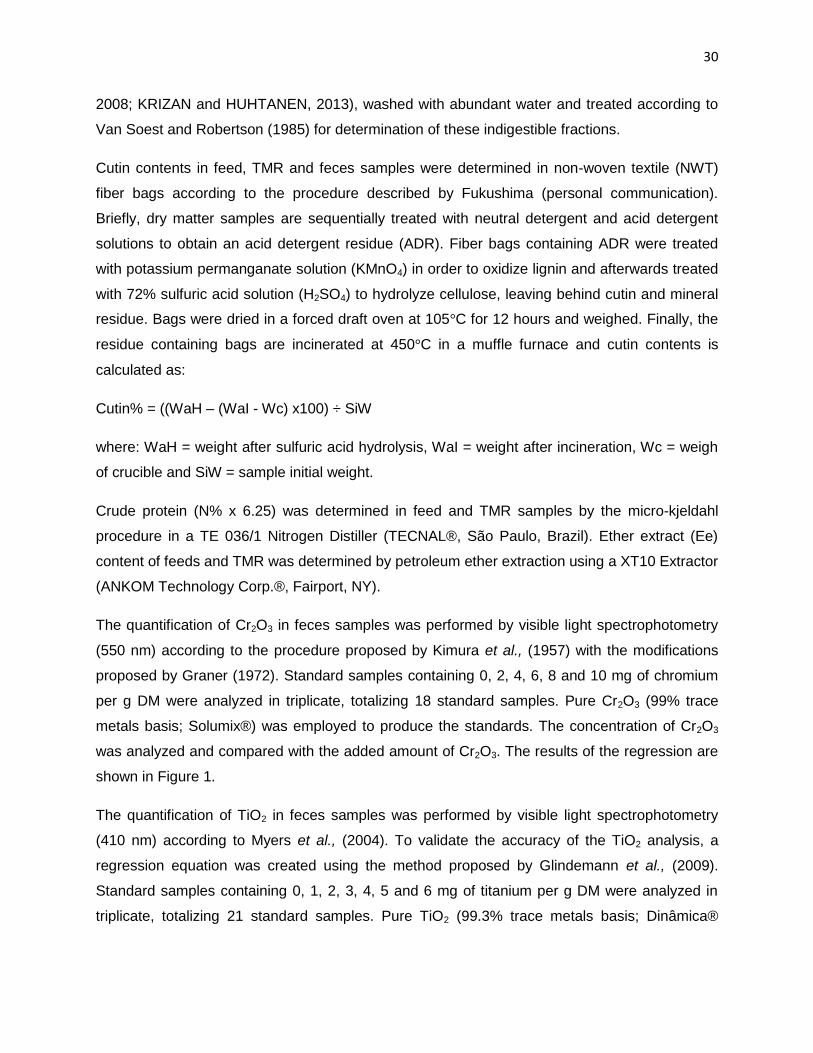
The quantification of Cr2O3 in feces samples was performed by visible light spectrophotometry
(550 nm) according to the procedure proposed by Kimura et al., (1957) with the modifications
proposed by Graner (1972). Standard samples containing 0, 2, 4, 6, 8 and 10 mg of chromium
per g DM were analyzed in triplicate, totalizing 18 standard samples. Pure Cr2O3 (99% trace
metals basis; Solumix®) was employed to produce the standards. The concentration of Cr2O3
was analyzed and compared with the added amount of Cr2O3. The results of the regression are
shown in Figure 1.
The quantification of TiO2 in feces samples was performed by visible light spectrophotometry
(410 nm) according to Myers et al., (2004). To validate the accuracy of the TiO2 analysis, a
regression equation was created using the method proposed by Glindemann et al., (2009).
Standard samples containing 0, 1, 2, 3, 4, 5 and 6 mg of titanium per g DM were analyzed in
triplicate, totalizing 21 standard samples. Pure TiO2 (99.3% trace metals basis; Dinâmica®
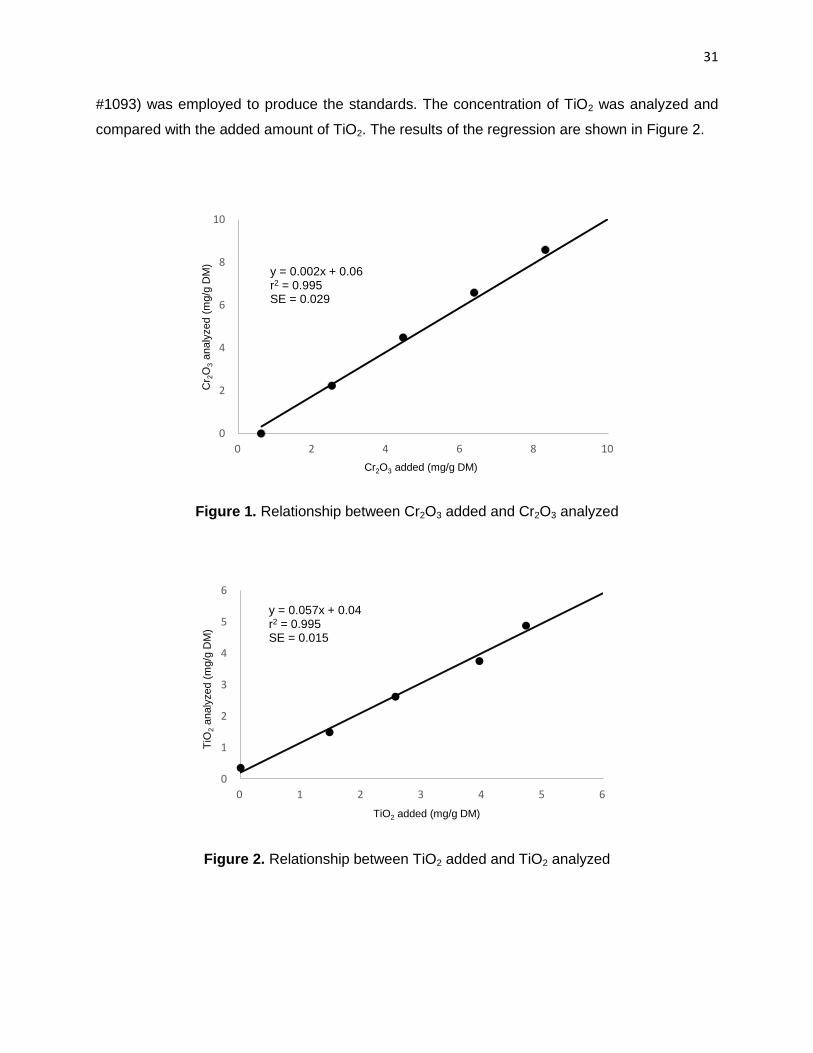
31
#1093) was employed to produce the standards. The concentration of TiO2 was analyzed and
compared with the added amount of TiO2. The results of the regression are shown in Figure 2.
Figure 1. Relationship between Cr2O3 added and Cr2O3 analyzed
Figure 2. Relationship between TiO2 added and TiO2 analyzed
0
2
4
6
8
10
0 2 4 6 8 10
Cr 2
O3 a
naly
zed (
mg/g
DM
)
y = 0.002x + 0.06 r2 = 0.995 SE = 0.029
Cr2O3 added (mg/g DM)
0
1
2
3
4
5
6
0 1 2 3 4 5 6
TiO
2 a
naly
zed (
mg/g
DM
)
y = 0.057x + 0.04 r2 = 0.995 SE = 0.015
TiO2 added (mg/g DM)

32
Calculations
Real DMI (RDMI) was calculated as daily feed offer minus daily orts (Equation 1) and Real FO
(RFO) was obtained by 3 days (d16-d18) of TFC (24-hour collection and daily weighing of
amount excreted). Total-tract apparent digestibility (TTAD) was calculated as RDMI minus RFO
(Equation 2):
– (1)
* (
)– (
)+
(2)
Equations (3) and (4) were used to estimate marker excretion and recovery rate. These
equations derived from both BULK and GRAB samples. The overall recovery rate of markers
was calculated from the total amount of marker given and the amount recovered during the fecal
sampling period (d15-d19). Daily recovery rate of markers was calculated from d16 to d19:
(
) (
)
(3)
(4)
Equation (5) was used to estimate FO using external markers and Equation (6) was used to
estimate DMD using internal markers:
(5)
(
)
(
)
(
)
(6)
Equation (7) was used to estimate total voluntary intake from FO and DMD estimates obtained
by equations (5) and (6). Total DMI was estimated for both BULK and GRAB samples:
(7)
Statistical Analysis
Results were analyzed with SAS® 9.3 (SAS®, 2011), after verifying normality of residuals and
homogeneity of variance. With normally distributed TTAD values and DMD estimates, a 4x4

33
factorial arrangement was adopted (4 markers and 4 sampling procedures) and data was
analyzed using PROC-MIXED, at 0.05 significance level, according to the model:
Yijk = µ + Ti + Mj + TMij + A(T)k + Ɛijk,
where Yijk = is the DMD estimated in animal k, by marker i, under sampling procedure j; µ = is
the general constant; Ti = is the fixed effect of internal marker; Mj = is the fixed effect of
sampling procedure; TMij = is the interaction between internal marker i and sampling procedure j
(fixed); A(T)k = is the random effect of animal k nested to marker i; and Ɛijk is the sampling error
supposed to be normal and independently distributed.
After verifying normal distribution of RFO values and FO estimates, a 2x4 factorial arrangement
was adopted (2 markers and 4 sampling procedures) and data was analyzed using PROC-
MIXED, at 0.05 significance level, according to the model:
Yxyz = µ + Tx + My + TMxy + A(T)z + Ɛxyz,
where Yxyz = is the FO estimated in animal z, by marker x, under sampling procedure y; µ = is
the general constant; Tx = is the fixed effect of external marker; My = is the fixed effect of
sampling procedure; TMxy = is the interaction between external marker x and sampling
procedure y (fixed); A(T)z = is the random effect of animal z nested to marker x; and Ɛxyz is the
sampling error supposed to be normal and independently distributed.
Values of RDMI and DMI estimates were checked for normal distribution and an 8x4 factorial
arrangement was adopted (8 marker pairs (1 internal + 1 external) and 4 sampling procedures).
Data was analyzed using PROC-MIXED, at 0.05 significance level, according to the model:
Ybcd = µ + Tb + Mc + TMbc + A(T)d + Ɛbcd,
where Ybcd = is the DMI estimated in animal d, by marker b, under sampling procedure c; µ = is
the general constant; Tb = is the fixed effect of marker pair; Mc = is the fixed effect of sampling
procedure; TMbc = is the interaction between marker pair b and sampling procedure c (fixed);
A(T)d = is the random effect of animal d nested to marker b; and Ɛbcd is the sampling error
supposed to be normal and independently distributed.
Linear regression analysis and Student’s paired t-test were used to compare estimates against
real observed values (those derived from TFC) for all variables being studied.
34
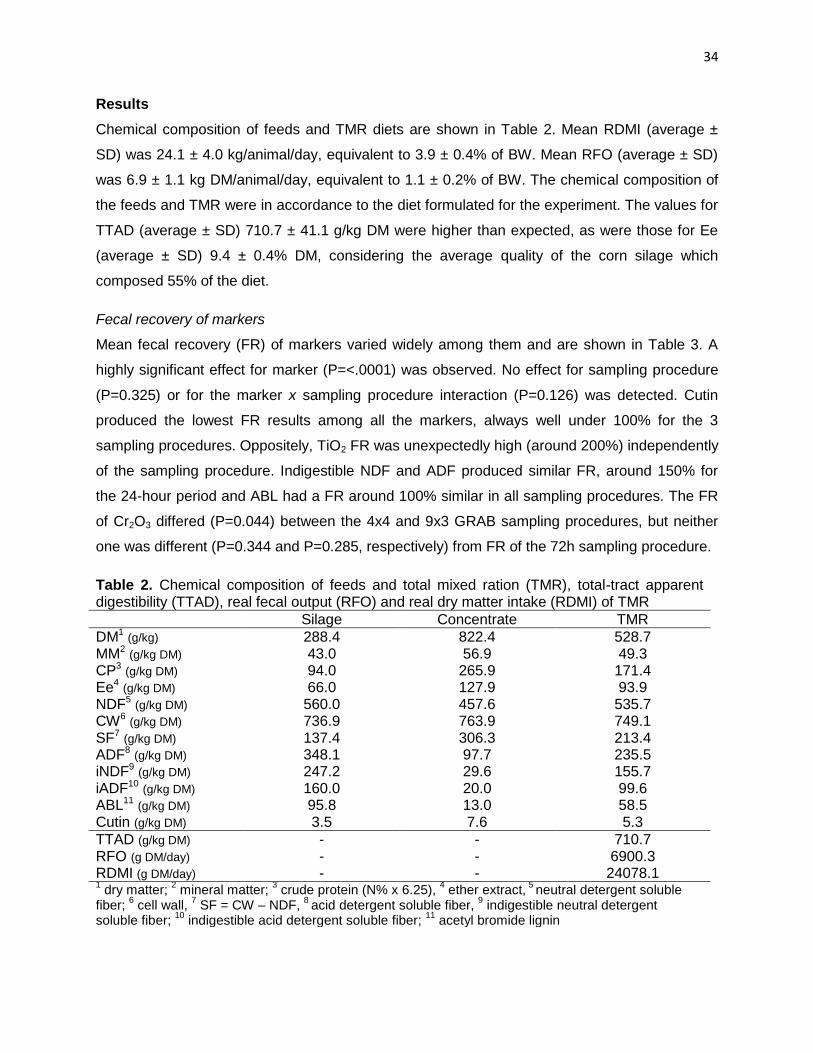
Results
Chemical composition of feeds and TMR diets are shown in Table 2. Mean RDMI (average ±
SD) was 24.1 ± 4.0 kg/animal/day, equivalent to 3.9 ± 0.4% of BW. Mean RFO (average ± SD)
was 6.9 ± 1.1 kg DM/animal/day, equivalent to 1.1 ± 0.2% of BW. The chemical composition of
the feeds and TMR were in accordance to the diet formulated for the experiment. The values for
TTAD (average ± SD) 710.7 ± 41.1 g/kg DM were higher than expected, as were those for Ee
(average ± SD) 9.4 ± 0.4% DM, considering the average quality of the corn silage which
composed 55% of the diet.
Fecal recovery of markers
Mean fecal recovery (FR) of markers varied widely among them and are shown in Table 3. A
highly significant effect for marker (P=<.0001) was observed. No effect for sampling procedure
(P=0.325) or for the marker x sampling procedure interaction (P=0.126) was detected. Cutin
produced the lowest FR results among all the markers, always well under 100% for the 3
sampling procedures. Oppositely, TiO2 FR was unexpectedly high (around 200%) independently
of the sampling procedure. Indigestible NDF and ADF produced similar FR, around 150% for
the 24-hour period and ABL had a FR around 100% similar in all sampling procedures. The FR
of Cr2O3 differed (P=0.044) between the 4x4 and 9x3 GRAB sampling procedures, but neither
one was different (P=0.344 and P=0.285, respectively) from FR of the 72h sampling procedure.
Table 2. Chemical composition of feeds and total mixed ration (TMR), total-tract apparent digestibility (TTAD), real fecal output (RFO) and real dry matter intake (RDMI) of TMR
Silage Concentrate TMR
DM1 (g/kg) 288.4 822.4 528.7 MM2 (g/kg DM) 43.0 56.9 49.3 CP3 (g/kg DM) 94.0 265.9 171.4 Ee4 (g/kg DM) 66.0 127.9 93.9 NDF5 (g/kg DM) 560.0 457.6 535.7 CW6 (g/kg DM) 736.9 763.9 749.1 SF7 (g/kg DM) 137.4 306.3 213.4 ADF8 (g/kg DM) 348.1 97.7 235.5 iNDF9 (g/kg DM) 247.2 29.6 155.7 iADF10 (g/kg DM) 160.0 20.0 99.6 ABL11 (g/kg DM) 95.8 13.0 58.5 Cutin (g/kg DM) 3.5 7.6 5.3
TTAD (g/kg DM) - - 710.7 RFO (g DM/day) - - 6900.3 RDMI (g DM/day) - - 24078.1 1 dry matter;
2 mineral matter;
3 crude protein (N% x 6.25),
4 ether extract,
5 neutral detergent soluble
fiber; 6 cell wall,
7 SF = CW – NDF,
8 acid detergent soluble fiber,
9 indigestible neutral detergent
soluble fiber; 10
indigestible acid detergent soluble fiber; 11
acetyl bromide lignin
35
Table 3. Twenty-four hour fecal recovery (FR) (mean ± SE) of markers under two GRAB (4x4 and 9x3) and one BULK (72h) fecal sampling procedures
Method
Marker 4x4 GRAB 9x3 GRAB 72h BULK
ABL 0.98cd ± 0.09 0.95d ± 0.08 1.11c ± 0.13 Cutin 0.81d ± 0.14 0.67e ± 0.09 0.80d ± 0.11 iADF 1.47b ± 0.08 1.55b ± 0.08 1.60b ± 0.08 iNDF 1.43b ± 0.07 1.50b ± 0.07 1.53b ± 0.08 Cr2O3 1.01Bc ± 0.06 1.23Ac ± 0.06 1.12ABc ± 0.06 TiO2 1.95a ± 0.16 1.99a ± 0.14 1.83a ± 0.14
Within a line, mean values with common upper case superscript are not significantly different by Fisher’s LSD (P<0.05). Within a column, mean values with common lower case superscript are not significantly different by Fisher’s LSD (P<0.05).
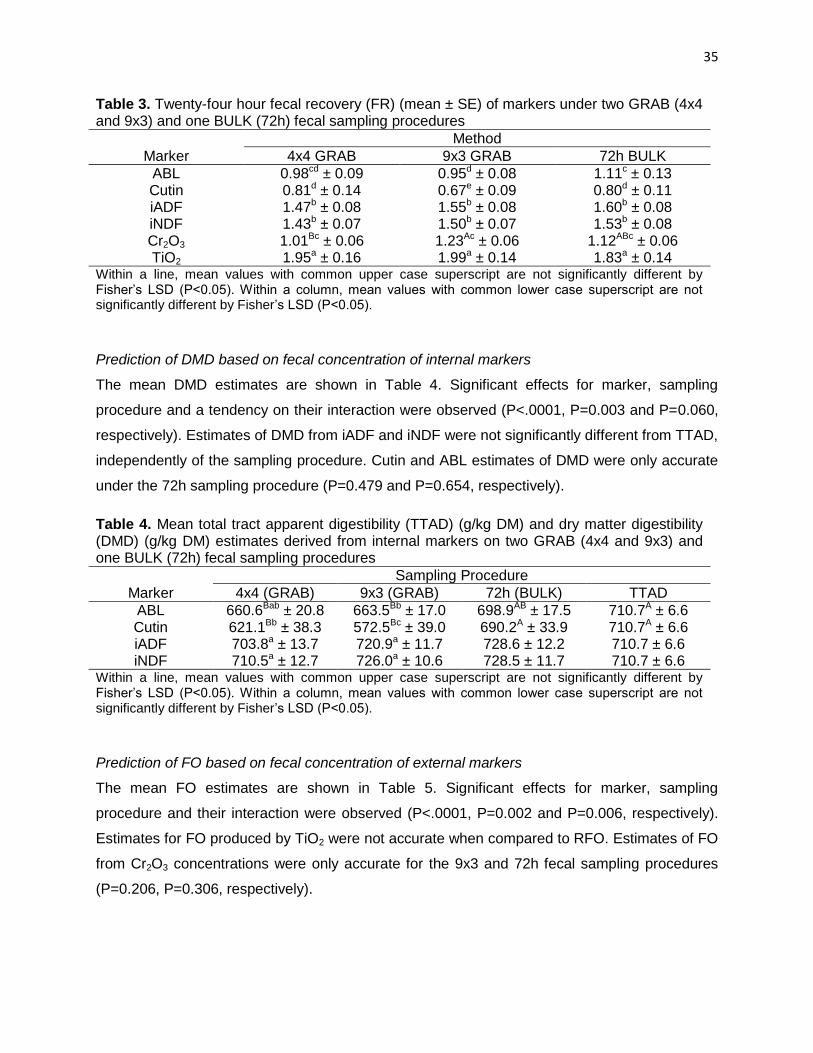
Prediction of DMD based on fecal concentration of internal markers
The mean DMD estimates are shown in Table 4. Significant effects for marker, sampling
procedure and a tendency on their interaction were observed (P<.0001, P=0.003 and P=0.060,
respectively). Estimates of DMD from iADF and iNDF were not significantly different from TTAD,
independently of the sampling procedure. Cutin and ABL estimates of DMD were only accurate
under the 72h sampling procedure (P=0.479 and P=0.654, respectively).
Table 4. Mean total tract apparent digestibility (TTAD) (g/kg DM) and dry matter digestibility (DMD) (g/kg DM) estimates derived from internal markers on two GRAB (4x4 and 9x3) and one BULK (72h) fecal sampling procedures
Sampling Procedure
Marker 4x4 (GRAB) 9x3 (GRAB) 72h (BULK) TTAD
ABL 660.6Bab ± 20.8 663.5Bb ± 17.0 698.9AB ± 17.5 710.7A ± 6.6 Cutin 621.1Bb ± 38.3 572.5Bc ± 39.0 690.2A ± 33.9 710.7A ± 6.6 iADF 703.8a ± 13.7 720.9a ± 11.7 728.6 ± 12.2 710.7 ± 6.6 iNDF 710.5a ± 12.7 726.0a ± 10.6 728.5 ± 11.7 710.7 ± 6.6
Within a line, mean values with common upper case superscript are not significantly different by Fisher’s LSD (P<0.05). Within a column, mean values with common lower case superscript are not significantly different by Fisher’s LSD (P<0.05).
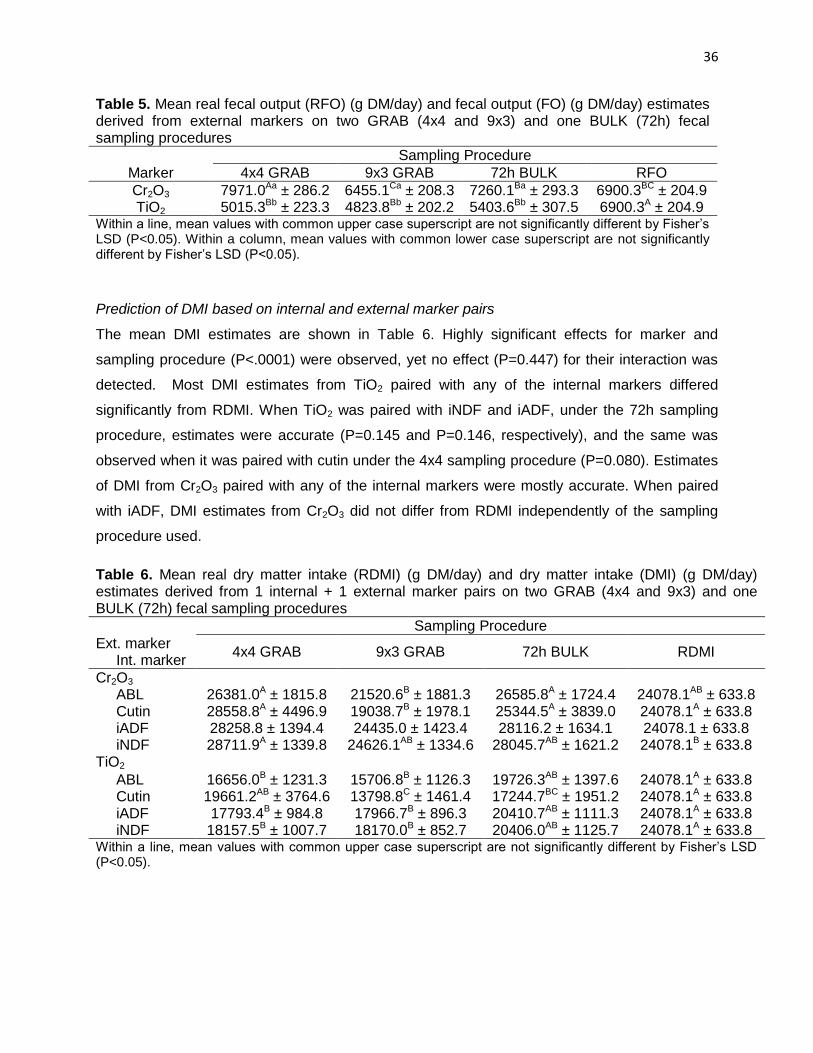
Prediction of FO based on fecal concentration of external markers
The mean FO estimates are shown in Table 5. Significant effects for marker, sampling
procedure and their interaction were observed (P<.0001, P=0.002 and P=0.006, respectively).
Estimates for FO produced by TiO2 were not accurate when compared to RFO. Estimates of FO
from Cr2O3 concentrations were only accurate for the 9x3 and 72h fecal sampling procedures
(P=0.206, P=0.306, respectively).
36
Table 5. Mean real fecal output (RFO) (g DM/day) and fecal output (FO) (g DM/day) estimates derived from external markers on two GRAB (4x4 and 9x3) and one BULK (72h) fecal sampling procedures
Sampling Procedure
Marker 4x4 GRAB 9x3 GRAB 72h BULK RFO
Cr2O3 7971.0Aa ± 286.2 6455.1Ca ± 208.3 7260.1Ba ± 293.3 6900.3BC ± 204.9 TiO2 5015.3Bb ± 223.3 4823.8Bb ± 202.2 5403.6Bb ± 307.5 6900.3A ± 204.9
Within a line, mean values with common upper case superscript are not significantly different by Fisher’s LSD (P<0.05). Within a column, mean values with common lower case superscript are not significantly different by Fisher’s LSD (P<0.05).
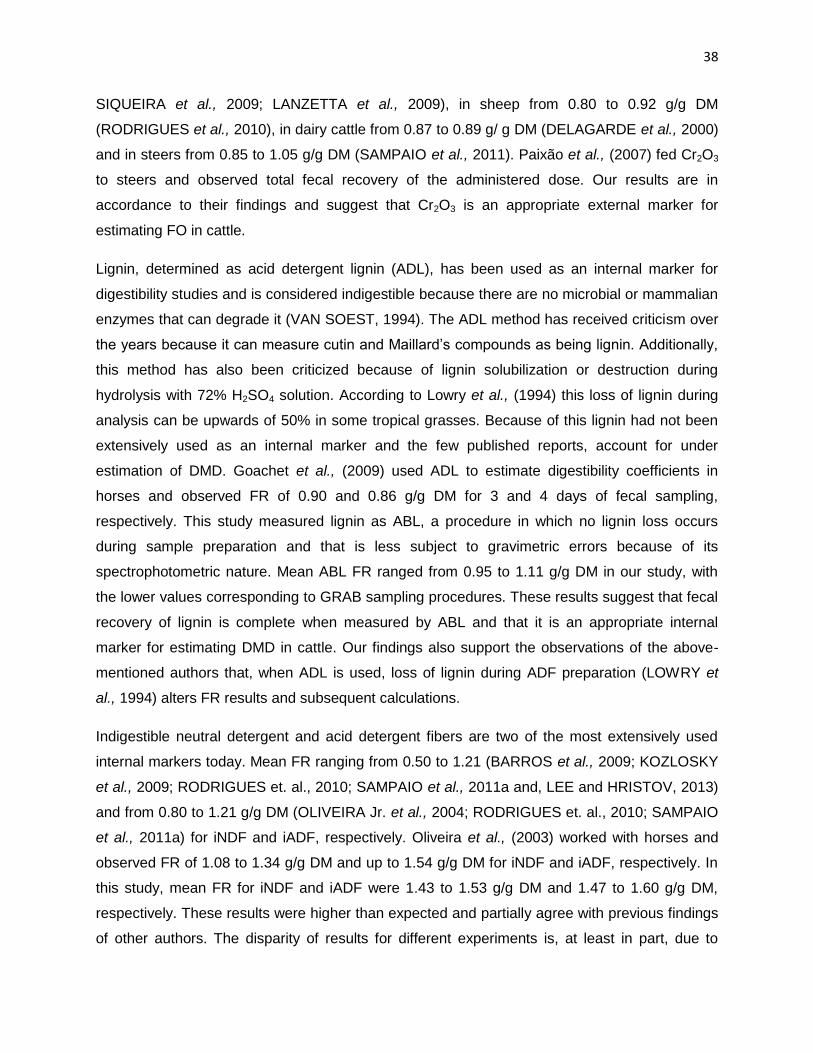
Prediction of DMI based on internal and external marker pairs
The mean DMI estimates are shown in Table 6. Highly significant effects for marker and
sampling procedure (P<.0001) were observed, yet no effect (P=0.447) for their interaction was
detected. Most DMI estimates from TiO2 paired with any of the internal markers differed
significantly from RDMI. When TiO2 was paired with iNDF and iADF, under the 72h sampling
procedure, estimates were accurate (P=0.145 and P=0.146, respectively), and the same was
observed when it was paired with cutin under the 4x4 sampling procedure (P=0.080). Estimates
of DMI from Cr2O3 paired with any of the internal markers were mostly accurate. When paired
with iADF, DMI estimates from Cr2O3 did not differ from RDMI independently of the sampling
procedure used.
Table 6. Mean real dry matter intake (RDMI) (g DM/day) and dry matter intake (DMI) (g DM/day) estimates derived from 1 internal + 1 external marker pairs on two GRAB (4x4 and 9x3) and one BULK (72h) fecal sampling procedures
Sampling Procedure
Ext. marker Int. marker
4x4 GRAB 9x3 GRAB 72h BULK RDMI
Cr2O3 ABL 26381.0A ± 1815.8 21520.6B ± 1881.3 26585.8A ± 1724.4 24078.1AB ± 633.8 Cutin 28558.8A ± 4496.9 19038.7B ± 1978.1 25344.5A ± 3839.0 24078.1A ± 633.8 iADF 28258.8 ± 1394.4 24435.0 ± 1423.4 28116.2 ± 1634.1 24078.1 ± 633.8 iNDF 28711.9A ± 1339.8 24626.1AB ± 1334.6 28045.7AB ± 1621.2 24078.1B ± 633.8 TiO2 ABL 16656.0B ± 1231.3 15706.8B ± 1126.3 19726.3AB ± 1397.6 24078.1A ± 633.8 Cutin 19661.2AB ± 3764.6 13798.8C ± 1461.4 17244.7BC ± 1951.2 24078.1A ± 633.8 iADF 17793.4B ± 984.8 17966.7B ± 896.3 20410.7AB ± 1111.3 24078.1A ± 633.8 iNDF 18157.5B ± 1007.7 18170.0B ± 852.7 20406.0AB ± 1125.7 24078.1A ± 633.8 Within a line, mean values with common upper case superscript are not significantly different by Fisher’s LSD (P<0.05).

37
Discussion
Fecal recovery of markers
Fecal recovery varied widely among markers and ranged from 0.67-0.81 g/g DM for cutin to
1.83-1.99 g/g DM for TiO2. No reports were found on the use of cutin as a marker in ruminant
digestion studies and therefore our data is novel to this field of research. Siqueira et al., (2009)
used cutin as DMD marker in horses consuming four different diets and observed FR around
1.51 g/g DM. The FR in horses was almost double of what our study observed for ruminants.
Obvious and known differences in digestive anatomy and physiology of both species could
account, at least partially, for these FR differences. Liquid and solid phase stratification of
contents in the rumen compared to the herbivore monogastric stomach are totally different. The
differences in these phases will directly influence how the cutin particle interacts and binds to
digesta around it. This interaction will in turn, determine the retention time (TR) and passage rate
(QP) of cutin and ultimately affect what fraction of ingested cutin will be excreted in feces over a
24-hour period. Njaa (1961) reported that mean FR less than one could be attributed to
inaccuracy of the analysis. Since cutin makes up such a small fraction of DM, gravimetric errors
tend to be more likely to happen.
Several authors (KOTB & LUCKEY, 1972; FAHEY & JUNG, 1983) have long described what
the properties of the ideal marker should be. Among these properties, one of the most important
ones is that the daily ingested/dosed amount of marker can be totally recovered in feces within
a 24-hour period. Many studies have been conducted over the last 3 decades using TiO2 and
the FR observed for it has been around 100%. Based on these findings the routinary use of
TiO2 in ruminal digestion trails has been suggested. Our findings do not support the use of TiO2
as an external marker to estimate FO in ruminants, since we observed FR that ranged from 1.83
to 1.99 g/g DM. These findings were contrary to those of Brandt and Allam, (1987); Hafez et al.,
(1988) and Titgemeyer et al., (2001), who observed mean FR for TiO2 of 0.96-0.99 in sheep,
0.96-1.02 and 0.90-0.95 in dairy cattle, respectively. Glindemann et al., (2009) found FR higher
than 1 and attributed this to possible ingestion of soil which contained TiO2 and therefore would
increase the fecal concentration. Our diet was composed of corn silage and concentrate, the
animals were kept in stalls with concrete flooring, so the risk of soil contamination is low.
Mean FR of Cr2O3 varied from 1.01 to 1.23 g/g DM in this study. Benvennuti et al., (2014)
worked with Brahman steers fed leafy or steamy grass hay and observed FR of 0.92 to 1.03 g/g
DM. Since Cr2O3 has been widely used as a marker in digestions studies, various FR have been
reported for it: in horses FR ranged from 0.712 to 1.031 g/g DM (OLIVEIRA et al., 2003;
38
SIQUEIRA et al., 2009; LANZETTA et al., 2009), in sheep from 0.80 to 0.92 g/g DM
(RODRIGUES et al., 2010), in dairy cattle from 0.87 to 0.89 g/ g DM (DELAGARDE et al., 2000)
and in steers from 0.85 to 1.05 g/g DM (SAMPAIO et al., 2011). Paixão et al., (2007) fed Cr2O3
to steers and observed total fecal recovery of the administered dose. Our results are in
accordance to their findings and suggest that Cr2O3 is an appropriate external marker for
estimating FO in cattle.
Lignin, determined as acid detergent lignin (ADL), has been used as an internal marker for
digestibility studies and is considered indigestible because there are no microbial or mammalian
enzymes that can degrade it (VAN SOEST, 1994). The ADL method has received criticism over
the years because it can measure cutin and Maillard’s compounds as being lignin. Additionally,
this method has also been criticized because of lignin solubilization or destruction during
hydrolysis with 72% H2SO4 solution. According to Lowry et al., (1994) this loss of lignin during
analysis can be upwards of 50% in some tropical grasses. Because of this lignin had not been
extensively used as an internal marker and the few published reports, account for under
estimation of DMD. Goachet et al., (2009) used ADL to estimate digestibility coefficients in
horses and observed FR of 0.90 and 0.86 g/g DM for 3 and 4 days of fecal sampling,
respectively. This study measured lignin as ABL, a procedure in which no lignin loss occurs
during sample preparation and that is less subject to gravimetric errors because of its
spectrophotometric nature. Mean ABL FR ranged from 0.95 to 1.11 g/g DM in our study, with
the lower values corresponding to GRAB sampling procedures. These results suggest that fecal
recovery of lignin is complete when measured by ABL and that it is an appropriate internal
marker for estimating DMD in cattle. Our findings also support the observations of the above-
mentioned authors that, when ADL is used, loss of lignin during ADF preparation (LOWRY et
al., 1994) alters FR results and subsequent calculations.
Indigestible neutral detergent and acid detergent fibers are two of the most extensively used
internal markers today. Mean FR ranging from 0.50 to 1.21 (BARROS et al., 2009; KOZLOSKY
et al., 2009; RODRIGUES et. al., 2010; SAMPAIO et al., 2011a and, LEE and HRISTOV, 2013)
and from 0.80 to 1.21 g/g DM (OLIVEIRA Jr. et al., 2004; RODRIGUES et. al., 2010; SAMPAIO
et al., 2011a) for iNDF and iADF, respectively. Oliveira et al., (2003) worked with horses and
observed FR of 1.08 to 1.34 g/g DM and up to 1.54 g/g DM for iNDF and iADF, respectively. In
this study, mean FR for iNDF and iADF were 1.43 to 1.53 g/g DM and 1.47 to 1.60 g/g DM,
respectively. These results were higher than expected and partially agree with previous findings
of other authors. The disparity of results for different experiments is, at least in part, due to

39
differences in incubation time of the samples for obtaining the fibrous fractions. Our study
followed the procedure proposed by Krizsan & Huhtanen (2013) who compared various
incubation times (144h, 240h and 288h) and reported that at least 12 days of incubation were
necessary to isolate the completely indigestible fiber pool in feeds fed to dairy cows. The results
in this study suggest that iNDF and iADF would not be adequate internal markers for ruminant
digestion studies, because higher than 1 FR lead to underestimation of DMD.
Prediction of DMD based on fecal concentration of internal markers
Values for DMD were under-estimated and differed significantly from TTAD when GRAB
sampling procedures and ABL or cutin were used. When fecal concentration was measured in
BULK samples, both markers produced accurate DMD estimates in comparison to TTAD. Cutin
is not a part of lignin but it is measured as such by the acid detergent lignin method. A possible
explanation for the low DMD estimates produced by these two markers under the GRAB
sampling procedures would be their low concentration in both diet and feces samples. Lower
concentrations make chemical analysis less reliable because of increased difficulty to detect
differences in such small amounts of residue that are left behind for weighing after the
procedures are performed. In this study, lignin was measured as ABL and thus gravimetric
related issues would not be a problem. The cutin procedure that is being proposed is
gravimetric and subject to these limitations. When BULK sampling was used, both markers
produced accurate DMD estimates. From our observations, neither ABL or cutin could be
suggested as accurate internal makers for determination of DMD in dairy cows if GRAB
sampling procedures were to be used. With the use of BULK sampling procedures, these two
markers deserve further attention to better understand how they behave. From what we know
after researching literature of the subject, nor ABL or cutin had ever been used in ruminant
digestion studies and therefore more research is necessary before discarding them as possible
markers.
Mean DMD estimates produced by iNDF and iADF fecal concentrations did not differ from TTAD
under any of the sampling procedures. Estimates were not different between the two
indigestible fractions when compared within the same sampling procedure, evidencing the close
relationship between both fibrous fractions. Using animals on pasture, Detmann et al., (2001)
reported more accurate DMD estimates when using iNDF compared to iADF. Berchielli et al.,
(2005) reported conflicting results when using these indigestible fractions, in response to the
incubation procedure as was mentioned before when discussing FR. With heifers fed fresh
sugar-cane iNDF produced better DMD estimates than iADF but, when corn silage was fed to

40
dairy cows, iADF estimates were more accurate than those of iNDF (FERREIRA et al., 2008).
Our findings suggest that both iNDF and iADF are suitable internal markers for estimating DMD.
Prediction of FO based on fecal concentration of external markers
Both Cr2O3 and TiO2 were unable to produce accurate FO estimates when compared to RFO
values. Only under the 72h BULK sampling procedure, Cr2O3 estimates did not significantly
differ (P=0.306) from RFO, with a mean estimate bias (residual error) of 5%. Fecal recovery of
Cr2O3, under the 4x4 GRAB sampling procedure, was 100% and therefore, over-estimated FO
was unexpected. No consistency was observed for Cr2O3 estimates as values were over-
estimated when 4x4 GRAB and 72h BULK sampling was used but under-estimated under 9x3
GRAB sampling procedure. When comparing Cr2O3 and TiO2 in steers, Titgemeyer et al., (2001)
observed that both markers significantly underestimated FO. Delagarde et al., (2000) reported
accurate FO estimates, derived both from BULK and GRAB sampling procedures, positively
correlated to RFO (R2 from 0.86 to 0.96) when using Cr2O3 as a marker in dairy cows. A more
recent study that fed Cr2O3 to steers, reported that FO estimates from GRAB samples were
significantly higher than RFO (BENVENUTTI et al., 2014). Our results suggest that Cr2O3 could
be used as a marker for estimating FO but, since FR differs from 100%, there is a need for TFC
and the best results derive from the 72h BULK sampling procedure.
During the last decade or so TiO2 has received increasing attention by researchers in response
to the potential health threats that have been attributed to Cr2O3 (MYERS et al., 2006). Studies
have reported that FO estimates are overestimated, not significantly different from RFO
(TITGEMEYER et al., 2001) or under-estimated (GLINDEMANN et al., 2009). The variety of
results appear to be caused by differences in FR which directly affects the FO estimates. In our
study, all of the TiO2 derived FO estimates were significantly underestimated, under all sampling
procedures, when compared to RFO. This is a reflex of the unusually high FR observed in our
experiment since higher than 100% FR lead to lower FO estimates.
Prediction of DMI based on internal and external marker pairs
Estimates of DMI varied widely among marker pairs and sampling procedures. Only the
Cr2O3+iADF pair produced accurate DMI estimates under all the sampling procedures. Not
significantly different DMI estimates were also observed for Cr2O3+cutin under 4x4 GRAB and
72h BULK sampling, as well as for Cr2O3+iNDF under 9x3 GRAB and 72h BULK sampling
procedures. Estimates of DMI for the Cr2O3+ABL pair did not differ significantly from RDMI but
the observed values were different between the sampling methods. Also, although not
41
significantly different from a statistical point of view, Cr2O3+ABL DMI estimates differed by an
average of 2456 g/day when compared to RDMI. This difference is equivalent to ± 10
percentage units error in DMI estimates, which may be manageable for practical situations but
not acceptable for research studies.
When TiO2 was paired with internal markers, accurate DMI estimates were only obtained under
4x4 GRAB sampling for cutin and under 72h BULK sampling for ABL, iADF and iNDF. Once
again, although estimates were “accurate”, the mean difference 4027 g/day or 17 percentage
units less than RDMI. This much of a difference would not be acceptable under any conditions.
Previous studies with TiO2 (TITGEMEYER et al., 2001) and Cr2O3 (RODRIGUES et al., 2006
and BENVENUTTI et al., 2014) observed that DMI estimates were lower than or equal to RDMI
for these markers, respectively. In their studies, the authors used each marker to estimate both
DMD and FO, in order to, estimate DMI from these values. What they reported as the main
cause for the inaccuracy of DMI estimates was FR different than 100% which resulted in under
or over estimation of FO. The higher the FR the lower FO estimates that will be obtained and
vice-versa. Given an accurate DMD estimate (or TTAD), if FO is underestimated then DMI will
also be lower than RDMI. The same thing happens when DMD is underestimated at a given or
accurate FO (or RFO). The degree of recovery of these markers has been variable
(BERCHIELLE et al., 2005 and RODRIGUES et al., 2006) and this happens because these
fractions do not constitute uniform chemical units that are constant throughout feeds.
The results of our study were in accordance with the observations of the above-mentioned
authors. Almost all TiO2 pairs derived estimates were lower than RDMI and this can be
explained by the unexpectedly higher FR for this external marker. Then, when these FO
estimates were paired with underestimated DMD estimates from the internal markers, the error
effect was additive. On the contrary, when estimates from Cr2O3 pairs were used the errors
seem to cancel each other out, as generally FO was a little over estimated and DMD estimates
were lower than TTAD (ABL and cutin) or more accurate (iNDF and iADF).
Conclusions
In dairy cows fed a corn silage based diet with 45% concentrate, the average FR of TiO2 was
higher than FR of Cr2O3 and both FR were more than unity. With internal markers, ABL and
cutin FR was lower than unity and average FR for indigestible NDF and ADF was 1.5. The FR
was unaffected by the fecal sampling procedure and appears to be an intrinsical property of
each molecule and how it interacts with digesta. Of the two external markers, only Cr2O3
42
produced accurate FO estimates and the same happened to DMD when iNDF and iADF were
used. Estimates for DMD and FO were affected by sampling procedure, being that 72h BULK
consistently produced accurate results. GRAB sampling procedures were accurate when using
either of the indigestible fibers (iNDF or iADF) to estimate DMD. As a result of these
observations, we can only recommend GRAB sampling procedures when concomitant TFC is
performed on at least 1 animal per treatment in order to determine FR. We can conclude that
Cr2O3 is a suitable marker for estimating FO and that iNDF and iADF are adequate for
estimating DMD. Moreover, the Cr2O3+iADF marker pair produces accurate DMI estimates and
deserves further attention for research in ruminant nutrition studies.
Chapter 2.
Forage versus marker interactions when estimating intake in collectively housed steers using
Grow Safe® technology
Introduction
The use of markers is currently the most widely used technique to estimate DMI in ruminants.
Markers are indigestible substances that are not secreted by the animal, have passage rates
similar to the feed, can be recovered completely after ingestion and allow for practical and
precise chemical analysis (FAHEY & JUNG, 1983), among others characteristics. According to
Merchen (1993), none of the substances that are used as markers in ruminant digestion studies
meet all of the requirements but, some are adequate enough to produce important data for the
advance of research.
The use of dietary markers to study feed utilization was proposed as far back as 1874 (KOTB &
LUCKEY, 1972). Daily dry matter intake (DMI) can be estimated by means of digestion markers
The most frequently used method estimates fecal output (FO) and dry matter digestibility (DMD)
(PENNING, 2004).
Estimating the digestibility of a diet is based on its apparent indigestibility as a starting point.
One basic parameter of indigestibility is FO since it represents the portion of what was ingested
that was not used during passage through the gastrointestinal tract (GIT) (DETMANN et al.,
2004). Estimation of FO is obtained through cause/effect relationships between the diet and the
43
events throughout the GIT (DETMANN et.al, 2007), which cause increase in marker
concentration of digesta as other compounds are removed by digestion and absorption
(ASTIGARRAGA, 1997).
The quality of forage consumed by animals affects the passage rate (Qp) (POPPI et al., 1981
a,b) and thus the retention time (Tr) (DIAS et al., 2011) of digesta in the GIT, therefore
influencing the rate of change of marker concentration in feces. The concentration of the marker
in feces will ultimately determine its fecal recovery (FR) which is a crucial characteristic, if not
the most, that any marker should possess in order to be free of recovery bias (DETMANN et al.,
2007). According to Langlands et al., (1963), FR appears to be an inherent characteristic of
each marker and how its interacts with feed particles.
Indigestible residues are the most commonly used internal markers in ruminant digestion
studies. These residues are commonly represented by indigestible neutral detergent fiber
(iNDF) and indigestible acid detergent fiber (iADF). Other indigestible, more specific, feed
fractions have also been used as internal markers, such is the case of lignin, mainly as acid
detergent lignin (ADL).
Several substances, especially rare earth materials have been used as external markers.
Titanium dioxide (TiO2) has been proposed as an alternative to chromic oxide (Cr2O3) for
ruminant studies (TITGEMEYER et al., 2001; MYERS et al., 2006; GLINDEMANN et al., 2009;
SAMPAIO et al., 2011a), in light of legal aspects regarding the use of Cr2O3 because of possible
carcinogenic properties (MYERS et al., 2006).
The marker technique to estimate intake uses an external marker to estimate FO and an
internal marker (naturally occurring in feedstuffs) to estimate (DMD). Intake is then calculated by
dividing FO by the indigestibility (1-DMD) of the feed. The main criticisms to the technique are
the difficulty and labor of feeding the external markers at least twice a day, for several days; the
need for excessive interaction between animals and people which may negatively affect intake
and the intensive labor and high cost of total feces sample collection (TFC). Sampling protocols
with GRAB feces sampling (directly from the rectum or upon spontaneous excretion) have been
tested in order to decrease the labor of TFC and some have reported satisfactory results. Still,
even though there is evidence to support the use of internal and external markers in ruminant
digestion studies, results are conflicting and further understanding is necessary.

44
From the above, it can be hypothesized that the combination of internal markers and TiO2
should result in accurate estimates for DMD, FO and DMI in steers consuming diets with
different forage sources. The objective of the experiment was to test the accuracy of internal
markers, acetyl bromide lignin (ABL), iNDF and iADF for estimating DMD, TiO2 for estimating
FO and the combination of these estimates for estimating DMI and compare it to real DMI
(RDMI) from data obtained by the Grow Safe® System.
Material and Methods
The experiment was conducted at the UM Beef Research and Teaching Farm of the Animal
Science Research Center (ASRC) at the University of Missouri (UM). The experiment was
approved by the Ethics Committee for Animal Use (CEUA) of the University of São Paulo
(Approval number: CEUA 24420603114). No animals were harmed during the experiment. Two
animals fell ill to respiratory disease during the sampling period so their data was not used in the
analysis.
Animals, diets and experimental design
Thirty Angus and 6 Charolais-cross steers (average ± SD; BW: 316.4 ± 18.6 kg) were randomly
allocated to 12 covered pens (8m x 6m) with concrete flooring. The mouth, tongue and teeth of
all steers were examined prior to starting the experiment in order to guarantee absence of
wounds or abnormalities that could compromise feed intake. Each pen had a Grow Safe® feed
bunk and allowed the animals access to clean water. The Grow Safe® System is an electronic
method that allows group housing with individual intake measurements. In this system, the feed
bunk recognizes a magnetic ear-tag on the animal and stores intake information from each
animal in the group. Two pens were assigned at random to each of the 6 experimental diets.
All diets were composed of a 70:30 forage to concentrate with a 20% corn-silage base. The
remainder of the forage portion of each diet was made up of one of six forage sources: 1)
Medicago sativa (Alfalfa hay); 2) Festuca arundinacea Schreb. (“Texoma” MaxQ II haylage”);
3) Avena sativa (Forage Oats haylage); 4) Sorghum bicolor ssp. Drummondii (Sorghum
Sudan haylage); 5) Festuca arundinacea Schreb mixture (varieties: Bar Optima, MaxQ Jesup,
Martin Free, K31, Protek Martin 2, Estancia, Protek Tower) (Variety Plot haylage) and 6)
Thinopyrum intermedium (Wheatgrass hay). Diets were formulated so that rumen fill, and not
metabolic satiety, would limit intake.
Daily allowances of the total mixed ration (TMR), plus 10% of calculated daily natural matter
intake (to guarantee orts), were fed once a day at 10:00. Feed subsamples were taken on

45
Mondays, Wednesdays and Fridays for dry matter (DM) determination (drying in a forced draft
oven (55°C for 3 days). Pen orts and individual intake were registered daily by the Grow Safe®
software. The concentrate was composed of dried distiller’s grains with solubles (DDGS),
AMINOPLUS®, minerals and vitamin premixes. Composition of supplements and TMR diets are
shown in Table 1.
Table 1. Composition of supplements and experimental diets
Concentrates
Ingredient, DM (%) S1 Alfalfa
S2 MaxQ II
S3 Oats S4 SSe S5 V.Plotf
S6 WG mixg
Amino Plus®a 8.2 13.3 11.9 11.9 13.8 11.6 DDGSb 23.9 18.9 19.4 20.2 18.3 20.4 ADE Nutra MIX®c 0.1 0.1 0.1 0.1 0.1 0.1 Custom Trace Mineral Premixd
0.03 0.03 0.03 0.03 0.03 0.03
Vitamin E 0.2 0.2 0.2 0.2 0.2 0.3 Lime 0.6 0.6 1.5 0.6 0.6 0.7 NaCl 0.3 0.3 0.3 0.3 0.3 0.3
Diets
Ingredient, DM (%) D1 D2 D3 D4 D5 D6
Treatment Forage 55.1 55.0 55.0 55.0 55.1 55.1 Corn Silage 11.6 11.6 11.6 11.6 11.6 11.6 Supplement 33.3 33.4 33.4 33.4 33.3 33.3 a
52% CP; b distiller's dried grains with solubles;
c vitamin mix ( 4,000,000 UI/lb vitamin A, 800,000 UI/lb
vitamin D3, 500 UI/lb vitamin E); d mineral mix (24,8 – 28,8% Ca, 100 ppm Co, 1% Cu, 2,5% Fe, 500 ppm I,
2% Mn, 100 ppm Se, 3% Zn); e sorghum Sudan haylage;
f variety plot haylage;
g Wheatgrass hay.
The experiment ran for 19 days (day regarded as the 24 h period from 8 am to 8 am). The
experimental period consisted of three phases: d1-d5 were allocated to adaptation of the
animals to the diets; ten days (d5-d15) of marker excretion stabilization and the final 4 days
(d16-19) were for sample collection. A completely randomized block design was used, with
animals being stratified by weight and allocated to two blocks per treatment.
Markers
Three internal markers (ABL, iNDF and iADF) were used to estimate DMD and one external
marker (TiO2) were used to estimate FO. The 4 combinations (1 internal marker and 1 external
marker) derived from these markers were used to estimate voluntary DMI. Values for DMD and
FO were estimated and used to estimate DMI which was compared to its RDMI obtained from
the Grow Safe® system.

46
Internal markers are naturally occurring indigestible fractions of feedstuffs. External markers, in
this case TiO2, need to be fed to the animals exogenously, be it orally or via ruminal cannula.
For the experiment, a water based suspension containing 2% carboxy-methyl cellulose (CMC)
and 0.25 g/mL of TiO2 was prepared. This suspension was fed twice daily (07:00 and 16:00), via
oral cannula connected to a pressure pump, with the animal contained inside a chute. Each
steer received 15 g of TiO2 per day, divided into two equal parts. Given the concentration of the
suspension, animals received 30 ml (7.5 g of TiO2) each time they were dosed.
Feces
From d15 to d19, fecal GRAB samples were obtained twice daily, directly from the rectum, when
the animals were contained at the chute for dosing. Composite samples were elaborated per
animal and frozen at -20°C for later analysis. Estimates for DMD, FO and DMI were then
grouped by pen and diet for statistical analysis.
Chemical analysis and measurements
For quantification of digestibility, feed samples were collected between d15-d18, and orts
collected between d16-d19. Composite samples were elaborated per pen and frozen at -20°C.
Later, feed, orts and feces samples were thawed at room temperature, oven-dried at 55°C and
processed in a Wiley mill (Arthur H. Thomas Company®, Philadelphia, PA) with a 2 mm mesh
screen. Preference was given to the 2 mm screen because, according to Froidmont et al.,
(2008), fine grinding can cause loss of small particles (containing lignin) which would have a
significant impact on our expected results.
Forage, concentrate and TMR samples were analyzed for dry-matter (DM) and mineral matter
(MM) by incineration in a muffle furnace. Ash and protein-free neutral detergent fiber (NDF) and
acid detergent fiber (ADF) were determined using the fiber bag procedure (VAN SOEST,
ROBERTSON & LEWIS, 1991), with addition of heat-stable amylase and without sodium sulfite
(MERTENS, 2002), in a A-200 Fiber Analyzer (ANKOM Technology Corp.®, Macedon, NY).
Cell wall (CW) preparation was obtained according to the procedure proposed by Fukushima
and Hatfield (2001) and later used as substrate for acetyl bromide lignin (ABL) determination in
feed, orts and feces samples, according to Fukushima and Kerley (2011). Lignin absorbance
was determined with an Evolution 201 spectrophotometer (Thermo Scientific®; Waltham, MA) at
a wavelength of 280 nm. Indigestible neutral detergent fiber and indigestible acid detergent fiber
(iNDF and iADF, respectively) were obtained by weighing forages and feces (0.5 g), and
concentrate (1.0 g) samples into F57 bags (ANKOM Technology Corp.®, Macedon, NY).
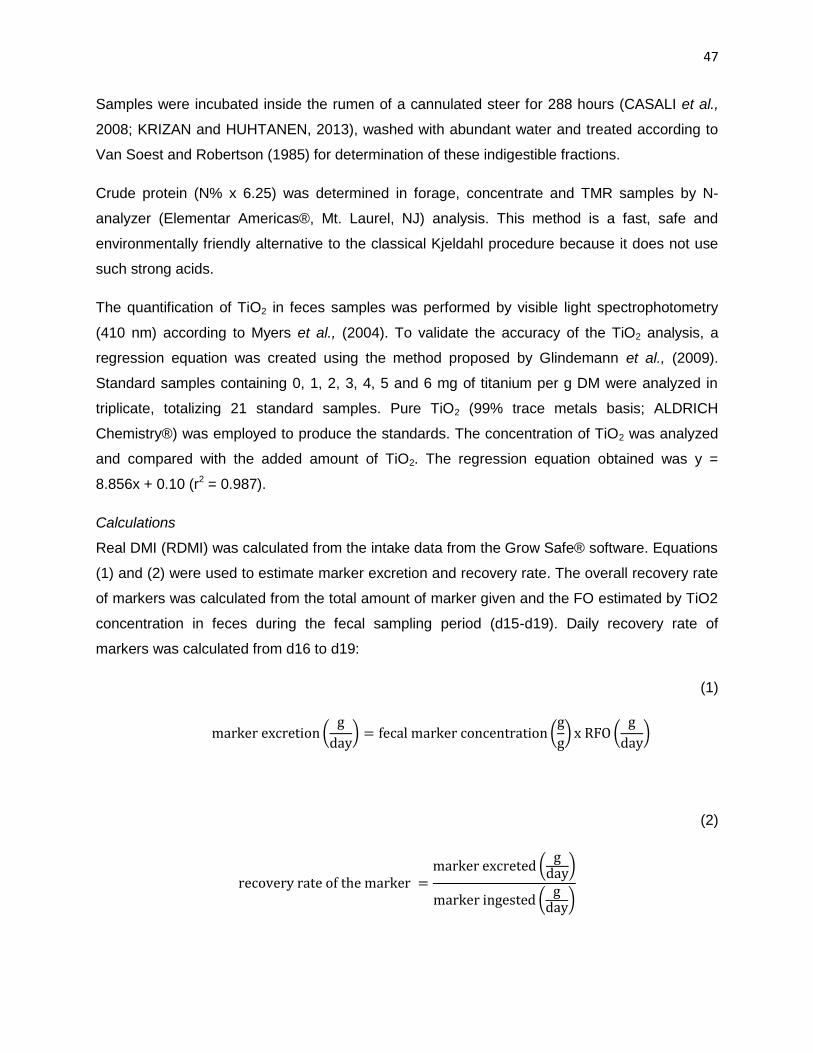
47
Samples were incubated inside the rumen of a cannulated steer for 288 hours (CASALI et al.,
2008; KRIZAN and HUHTANEN, 2013), washed with abundant water and treated according to
Van Soest and Robertson (1985) for determination of these indigestible fractions.
Crude protein (N% x 6.25) was determined in forage, concentrate and TMR samples by N-
analyzer (Elementar Americas®, Mt. Laurel, NJ) analysis. This method is a fast, safe and
environmentally friendly alternative to the classical Kjeldahl procedure because it does not use
such strong acids.
The quantification of TiO2 in feces samples was performed by visible light spectrophotometry
(410 nm) according to Myers et al., (2004). To validate the accuracy of the TiO2 analysis, a
regression equation was created using the method proposed by Glindemann et al., (2009).
Standard samples containing 0, 1, 2, 3, 4, 5 and 6 mg of titanium per g DM were analyzed in
triplicate, totalizing 21 standard samples. Pure TiO2 (99% trace metals basis; ALDRICH
Chemistry®) was employed to produce the standards. The concentration of TiO2 was analyzed
and compared with the added amount of TiO2. The regression equation obtained was y =
8.856x + 0.10 (r2 = 0.987).
Calculations
Real DMI (RDMI) was calculated from the intake data from the Grow Safe® software. Equations
(1) and (2) were used to estimate marker excretion and recovery rate. The overall recovery rate
of markers was calculated from the total amount of marker given and the FO estimated by TiO2
concentration in feces during the fecal sampling period (d15-d19). Daily recovery rate of
markers was calculated from d16 to d19:
(1)
(
) (
) (
)
(2)
(
)
(
)
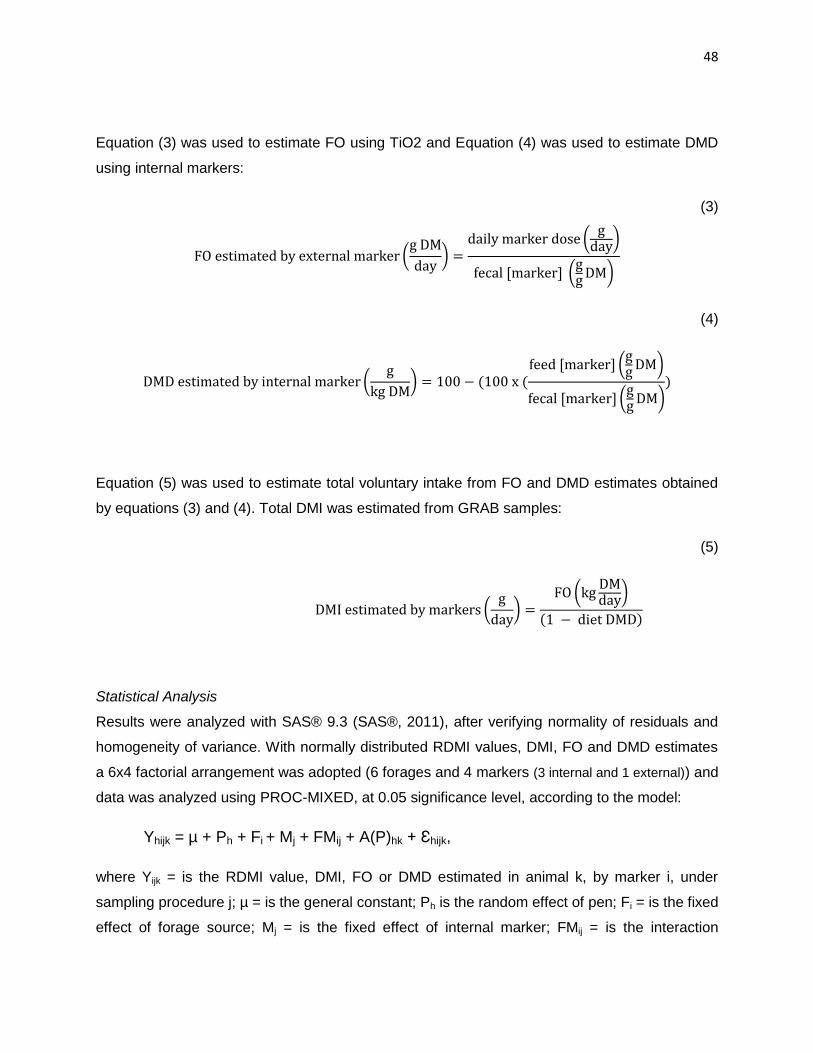
48
Equation (3) was used to estimate FO using TiO2 and Equation (4) was used to estimate DMD
using internal markers:
(3)
(
)
(
)
( )
(4)
(
)
( )
( )
Equation (5) was used to estimate total voluntary intake from FO and DMD estimates obtained
by equations (3) and (4). Total DMI was estimated from GRAB samples:
(5)
(
)
(
)
Statistical Analysis
Results were analyzed with SAS® 9.3 (SAS®, 2011), after verifying normality of residuals and
homogeneity of variance. With normally distributed RDMI values, DMI, FO and DMD estimates
a 6x4 factorial arrangement was adopted (6 forages and 4 markers (3 internal and 1 external)) and
data was analyzed using PROC-MIXED, at 0.05 significance level, according to the model:
Yhijk = µ + Ph + Fi + Mj + FMij + A(P)hk + Ɛhijk,
where Yijk = is the RDMI value, DMI, FO or DMD estimated in animal k, by marker i, under
sampling procedure j; µ = is the general constant; Ph is the random effect of pen; Fi = is the fixed
effect of forage source; Mj = is the fixed effect of internal marker; FMij = is the interaction
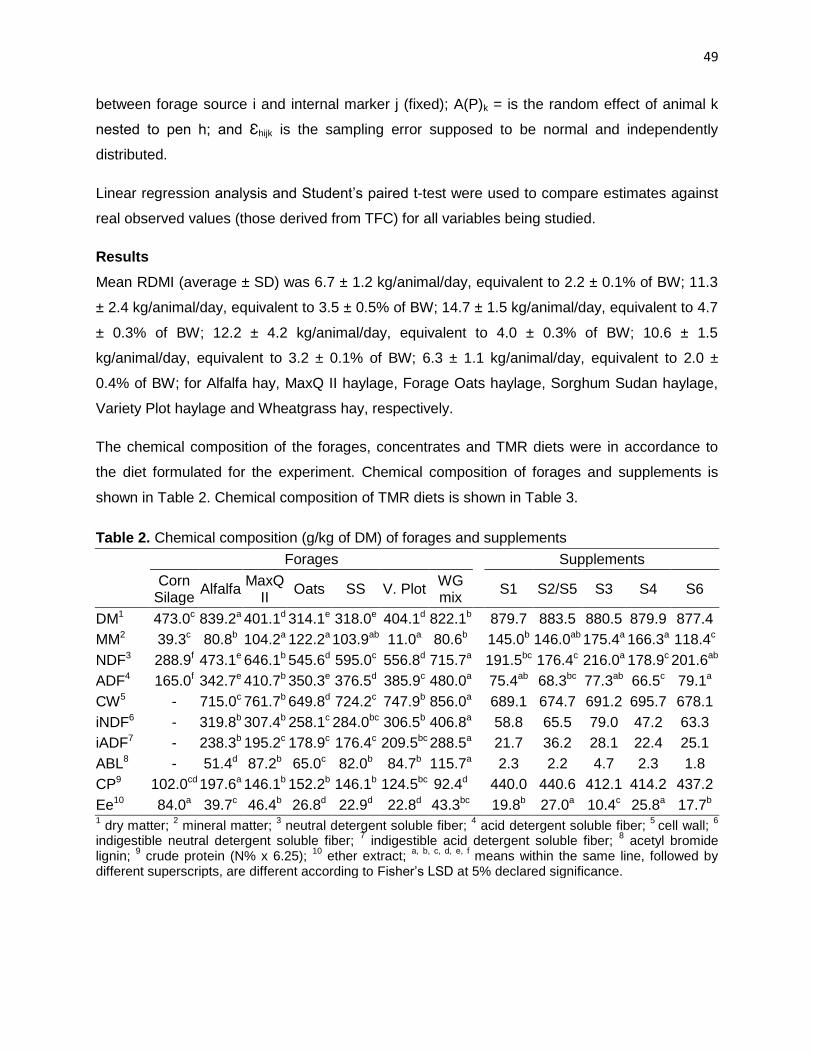
49
between forage source i and internal marker j (fixed); A(P)k = is the random effect of animal k
nested to pen h; and Ɛhijk is the sampling error supposed to be normal and independently
distributed.
Linear regression analysis and Student’s paired t-test were used to compare estimates against
real observed values (those derived from TFC) for all variables being studied.
Results
Mean RDMI (average ± SD) was 6.7 ± 1.2 kg/animal/day, equivalent to 2.2 ± 0.1% of BW; 11.3
± 2.4 kg/animal/day, equivalent to 3.5 ± 0.5% of BW; 14.7 ± 1.5 kg/animal/day, equivalent to 4.7
± 0.3% of BW; 12.2 ± 4.2 kg/animal/day, equivalent to 4.0 ± 0.3% of BW; 10.6 ± 1.5
kg/animal/day, equivalent to 3.2 ± 0.1% of BW; 6.3 ± 1.1 kg/animal/day, equivalent to 2.0 ±
0.4% of BW; for Alfalfa hay, MaxQ II haylage, Forage Oats haylage, Sorghum Sudan haylage,
Variety Plot haylage and Wheatgrass hay, respectively.
The chemical composition of the forages, concentrates and TMR diets were in accordance to
the diet formulated for the experiment. Chemical composition of forages and supplements is
shown in Table 2. Chemical composition of TMR diets is shown in Table 3.
Table 2. Chemical composition (g/kg of DM) of forages and supplements
Forages Supplements
Corn Silage
Alfalfa MaxQ
II Oats SS V. Plot
WG mix
S1 S2/S5 S3 S4 S6
DM1 473.0c 839.2a 401.1d 314.1e 318.0e 404.1d 822.1b 879.7 883.5 880.5 879.9 877.4
MM2 39.3c 80.8b 104.2a 122.2a 103.9ab 11.0a 80.6b 145.0b 146.0ab 175.4a 166.3a 118.4c
NDF3 288.9f 473.1e 646.1b 545.6d 595.0c 556.8d 715.7a 191.5bc 176.4c 216.0a 178.9c 201.6ab
ADF4 165.0f 342.7e 410.7b 350.3e 376.5d 385.9c 480.0a 75.4ab 68.3bc 77.3ab 66.5c 79.1a
CW5 - 715.0c 761.7b 649.8d 724.2c 747.9b 856.0a 689.1 674.7 691.2 695.7 678.1
iNDF6 - 319.8b 307.4b 258.1c 284.0bc 306.5b 406.8a 58.8 65.5 79.0 47.2 63.3
iADF7 - 238.3b 195.2c 178.9c 176.4c 209.5bc 288.5a 21.7 36.2 28.1 22.4 25.1
ABL8 - 51.4d 87.2b 65.0c 82.0b 84.7b 115.7a 2.3 2.2 4.7 2.3 1.8
CP9 102.0cd 197.6a 146.1b 152.2b 146.1b 124.5bc 92.4d 440.0 440.6 412.1 414.2 437.2
Ee10 84.0a 39.7c 46.4b 26.8d 22.9d 22.8d 43.3bc 19.8b 27.0a 10.4c 25.8a 17.7b 1 dry matter;
2 mineral matter;
3 neutral detergent soluble fiber;
4 acid detergent soluble fiber;
5 cell wall;
6
indigestible neutral detergent soluble fiber; 7 indigestible acid detergent soluble fiber;
8 acetyl bromide
lignin; 9 crude protein (N% x 6.25);
10 ether extract;
a, b, c, d, e, f means within the same line, followed by
different superscripts, are different according to Fisher’s LSD at 5% declared significance.

50
Table 3. Chemical composition (g/kg of DM) of experimental diets
Diets
D1 Alfalfa D2 MaxQ D3 Oats D4 SS D5 V. Plot D6 WG
DM1 775.7a 517.0c 442.6e 414.5f 470.0d 743.8b MM2 104.8a 100.2a 116.8a 98.3ab 102.3a 85.0b NDF3 399.8d 464.4b 444.9c 464.0b 469.8b 528.9a ADF4 223.9d 260.0c 258.4c 260.8c 294.4b 316.7a CW5 677.2c 721.9b 671.5c 702.3b 723.7b 780.4a iNDF6 197.4c 260.1b 245.2bc 209.0c 256.3b 371.0a iADF7 139.6bc 163.6bc 157.8bc 129.6c 175.2b 229.6a ABL8 40.0c 56.8b 50.5d 56.4b 61.9b 74.8a CP9 226.1a 227.8a 234.2a 213.2ab 186.0bc 175.2c Ee10 37.2b 46.2a 45.5a 45.9a 43.3a 31.8c 1 dry matter;
2 mineral matter;
3 neutral detergent soluble fiber;
4 acid detergent soluble fiber;
5 cell wall;
6 indigestible neutral detergent soluble fiber;
7 indigestible acid detergent soluble fiber;
8 acetyl bromide
lignin; 9 crude protein (N% x 6.25);
10 ether extract;
a, b, c, d, e, f means within the same line, followed by
different superscripts, are different according to Fisher’s LSD at 5% declared significance.
Fecal recovery of markers
A highly significant effect for marker (P=<.0001) was observed. An effect for diet (P=0.002) was
also observed, but no effect for the marker x diet interaction (P=0.114) was detected. The
lowest FR was observed for ABL and it differed from unity. The FR of TiO2 was complete and
did not differ from unity. Indigestible NDF and ADF produced similar incomplete FR, around
78% of what was consumed for the 24-hour period. All the internal markers had higher FR on
the hay diets and the recoveries were not different from unity (data not shown).
Table 4. Twenty-four hour fecal recovery (FR) of internal markers and TiO2 in steers fed diets with different forage sources
Diet
Alfalfa MaxQ II Oats SS4 V. Plot5 WG mix6 SD P value
FR 1.10a 0.81b 0.79c 0.78c 0.85bc 0.97ab 0.066 0.002 Marker
ABL1 iNDF2 iADF3 TiO2 SD P value
FR 0.73b 0.77b 0.79b 1.15a 0.062 <.0001 1 acetyl bromide lignin;
2 indigestible neutral detergent soluble fiber;
3 indigestible acid detergent
soluble fiber; 4 sorghum Sudan haylage;
5 variety plot haylage;
6 Wheatgrass hay; Within a line, mean
values with common upper case superscript are not significantly different by Fisher’s LSD (P<0.05).
Prediction of DMD based on fecal concentration of internal markers
The mean DMD estimates are shown in Table 5. Significant effects for forage, marker and their
interaction were observed (P=0.001, P<.0001 and P<.0001, respectively) on DMD. Estimates of
DMD from the Grow Safe® intake data and TiO2 estimates for FO (GS+TiO2) were compared
against DMD estimates from the internal markers. Values for DMD varied among markers and
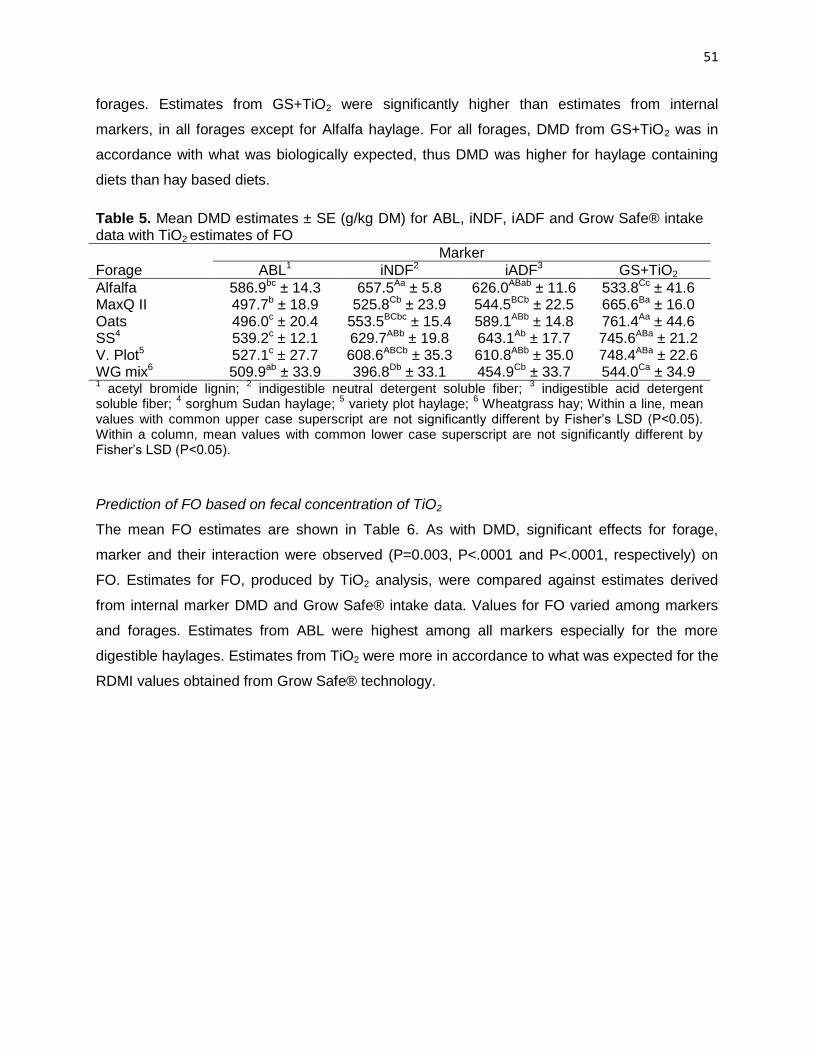
51
forages. Estimates from GS+TiO2 were significantly higher than estimates from internal
markers, in all forages except for Alfalfa haylage. For all forages, DMD from GS+TiO2 was in
accordance with what was biologically expected, thus DMD was higher for haylage containing
diets than hay based diets.
Table 5. Mean DMD estimates ± SE (g/kg DM) for ABL, iNDF, iADF and Grow Safe® intake data with TiO2 estimates of FO
Marker
Forage ABL1 iNDF2 iADF3 GS+TiO2
Alfalfa 586.9bc ± 14.3 657.5Aa ± 5.8 626.0ABab ± 11.6 533.8Cc ± 41.6 MaxQ II 497.7b ± 18.9 525.8Cb ± 23.9 544.5BCb ± 22.5 665.6Ba ± 16.0 Oats 496.0c ± 20.4 553.5BCbc ± 15.4 589.1ABb ± 14.8 761.4Aa ± 44.6 SS4 539.2c ± 12.1 629.7ABb ± 19.8 643.1Ab ± 17.7 745.6ABa ± 21.2 V. Plot5 527.1c ± 27.7 608.6ABCb ± 35.3 610.8ABb ± 35.0 748.4ABa ± 22.6 WG mix6 509.9ab ± 33.9 396.8Db ± 33.1 454.9Cb ± 33.7 544.0Ca ± 34.9 1 acetyl bromide lignin;
2 indigestible neutral detergent soluble fiber;
3 indigestible acid detergent
soluble fiber; 4 sorghum Sudan haylage;
5 variety plot haylage;
6 Wheatgrass hay; Within a line, mean
values with common upper case superscript are not significantly different by Fisher’s LSD (P<0.05). Within a column, mean values with common lower case superscript are not significantly different by Fisher’s LSD (P<0.05).
Prediction of FO based on fecal concentration of TiO2
The mean FO estimates are shown in Table 6. As with DMD, significant effects for forage,
marker and their interaction were observed (P=0.003, P<.0001 and P<.0001, respectively) on
FO. Estimates for FO, produced by TiO2 analysis, were compared against estimates derived
from internal marker DMD and Grow Safe® intake data. Values for FO varied among markers
and forages. Estimates from ABL were highest among all markers especially for the more
digestible haylages. Estimates from TiO2 were more in accordance to what was expected for the
RDMI values obtained from Grow Safe® technology.
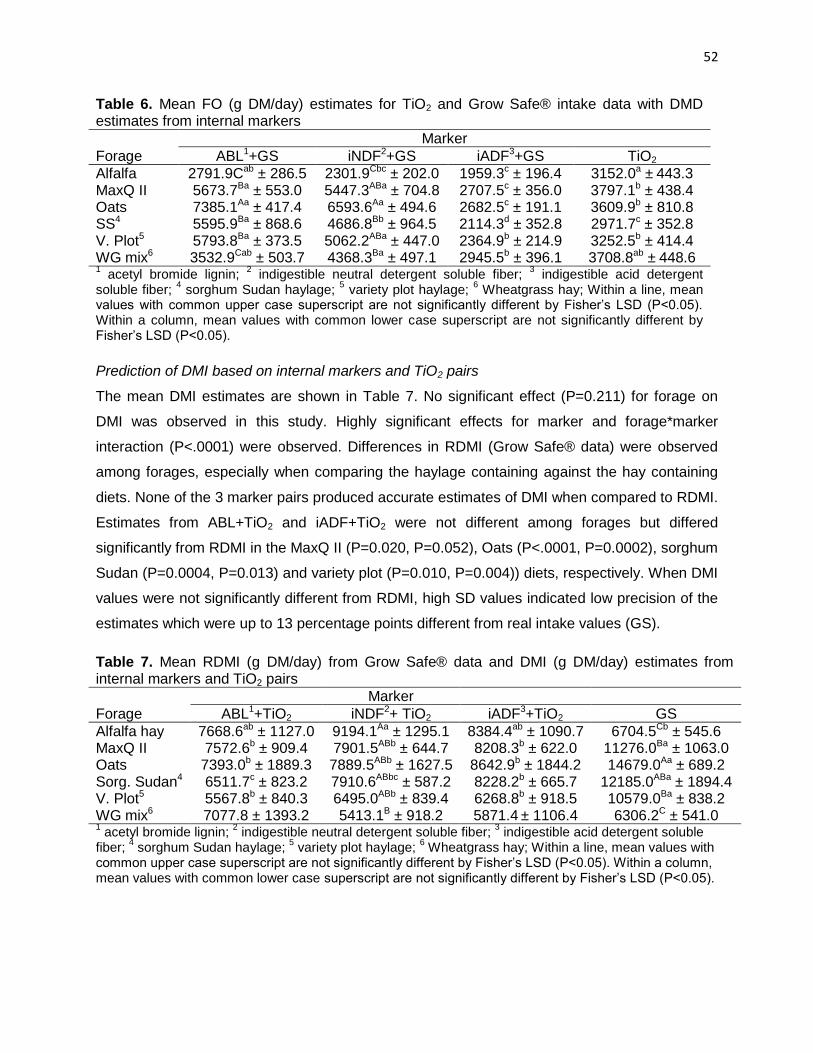
52
Table 6. Mean FO (g DM/day) estimates for TiO2 and Grow Safe® intake data with DMD estimates from internal markers
Marker
Forage ABL1+GS iNDF2+GS iADF3+GS TiO2
Alfalfa 2791.9Cab ± 286.5 2301.9Cbc ± 202.0 1959.3c ± 196.4 3152.0a ± 443.3 MaxQ II 5673.7Ba ± 553.0 5447.3ABa ± 704.8 2707.5c ± 356.0 3797.1b ± 438.4 Oats 7385.1Aa ± 417.4 6593.6Aa ± 494.6 2682.5c ± 191.1 3609.9b ± 810.8 SS4 5595.9Ba ± 868.6 4686.8Bb ± 964.5 2114.3d ± 352.8 2971.7c ± 352.8 V. Plot5 5793.8Ba ± 373.5 5062.2ABa ± 447.0 2364.9b ± 214.9 3252.5b ± 414.4 WG mix6 3532.9Cab ± 503.7 4368.3Ba ± 497.1 2945.5b ± 396.1 3708.8ab ± 448.6 1 acetyl bromide lignin;
2 indigestible neutral detergent soluble fiber;
3 indigestible acid detergent
soluble fiber; 4 sorghum Sudan haylage;
5 variety plot haylage;
6 Wheatgrass hay; Within a line, mean
values with common upper case superscript are not significantly different by Fisher’s LSD (P<0.05). Within a column, mean values with common lower case superscript are not significantly different by Fisher’s LSD (P<0.05).
Prediction of DMI based on internal markers and TiO2 pairs
The mean DMI estimates are shown in Table 7. No significant effect (P=0.211) for forage on
DMI was observed in this study. Highly significant effects for marker and forage*marker
interaction (P<.0001) were observed. Differences in RDMI (Grow Safe® data) were observed
among forages, especially when comparing the haylage containing against the hay containing
diets. None of the 3 marker pairs produced accurate estimates of DMI when compared to RDMI.
Estimates from ABL+TiO2 and iADF+TiO2 were not different among forages but differed
significantly from RDMI in the MaxQ II (P=0.020, P=0.052), Oats (P<.0001, P=0.0002), sorghum
Sudan (P=0.0004, P=0.013) and variety plot (P=0.010, P=0.004)) diets, respectively. When DMI
values were not significantly different from RDMI, high SD values indicated low precision of the
estimates which were up to 13 percentage points different from real intake values (GS).
Table 7. Mean RDMI (g DM/day) from Grow Safe® data and DMI (g DM/day) estimates from internal markers and TiO2 pairs
Marker
Forage ABL1+TiO2 iNDF2+ TiO2 iADF3+TiO2 GS
Alfalfa hay 7668.6ab ± 1127.0 9194.1Aa ± 1295.1 8384.4ab ± 1090.7 6704.5Cb ± 545.6 MaxQ II 7572.6b ± 909.4 7901.5ABb ± 644.7 8208.3b ± 622.0 11276.0Ba ± 1063.0 Oats 7393.0b ± 1889.3 7889.5ABb ± 1627.5 8642.9b ± 1844.2 14679.0Aa ± 689.2 Sorg. Sudan4 6511.7c ± 823.2 7910.6ABbc ± 587.2 8228.2b ± 665.7 12185.0ABa ± 1894.4 V. Plot5 5567.8b ± 840.3 6495.0ABb ± 839.4 6268.8b ± 918.5 10579.0Ba ± 838.2 WG mix6 7077.8 ± 1393.2 5413.1B ± 918.2 5871.4 ± 1106.4 6306.2C ± 541.0 1 acetyl bromide lignin;
2 indigestible neutral detergent soluble fiber;
3 indigestible acid detergent soluble
fiber; 4 sorghum Sudan haylage;
5 variety plot haylage;
6 Wheatgrass hay; Within a line, mean values with
common upper case superscript are not significantly different by Fisher’s LSD (P<0.05). Within a column, mean values with common lower case superscript are not significantly different by Fisher’s LSD (P<0.05).
53
Discussion
Fecal recovery of markers
Fecal recovery varied among markers and forages, ranging from 0.5 - 1.1 and from 0.6 – 1.3 for
ABL and iNDF, respectively. Lee and Hristov (2013) reported FR for iNDF of 0.89 for
multiparous Holstein cows fed corn silage based diets. No reports were found on the use of ABL
as a marker for estimating DMD in ruminants, therefore our data is novel to this field of
research. Liquid and solid phase stratification of ruminal contents directly influence how
particles interact and bind to digesta around it. This interaction will in turn, determine the
retention time (TR) and passage rate (QP) of the marker/particle and ultimately affect what
fraction of what is ingested will be excreted in feces over a 24-hour period. Mean FR of ABL,
iNDF and iADF were all lower than and different than unity. Njaa (1961) reported that mean FR
less than one could be attributed to inaccuracy of the analysis. These 3 procedures are all
gravimetric and since the residue left after acid digestion or rumen incubation is small, errors
are more likely to happen.
Several authors (KOTB & LUCKEY, 1972; FAHEY & JUNG, 1983) have long described what
the properties of the ideal marker should be. Among these properties, one of the most important
ones is, being totally recovered in a 24-hour period. Many studies have been conducted over
the last 3 decades using TiO2 and the FR observed for it has been around 100%. Based on
these findings the routinary use of TiO2 in ruminal digestion trails has been suggested. Our
findings support the use of TiO2 as an external marker to estimate FO in ruminants, since we
observed mean FR of 1.1 for the 6 experimental diets. These findings are in accordance to
those of Brandt and Allam, (1987); Hafez et al., (1988) and Titgemeyer et al., (2001), who
observed mean FR for TiO2 of 0.96-0.99 in sheep and 0.96-1.02, 0.90-0.95 in dairy cattle,
respectively. Glindemann et al., (2009) found FR higher than 1 and attributed this to possible
ingestion of soil which contained TiO2 and therefore would increase the fecal concentration. Our
diets were composed of corn silage, concentrate and the treatment forage which were all well
preserved and packaged, so the risk of soil contamination was low. Nonetheless, soil residues
could account in part for the slightly elevated FR observed. Also, FR in this study was calculated
using the FO estimates from TiO2 (since total feces collection was not performed) and therefore
the values will carry the bias that the FO estimates may have had. As shown in Table 6, FO
estimates from TiO2 were in accordance to what was biologically expected and did not differ
among diets.
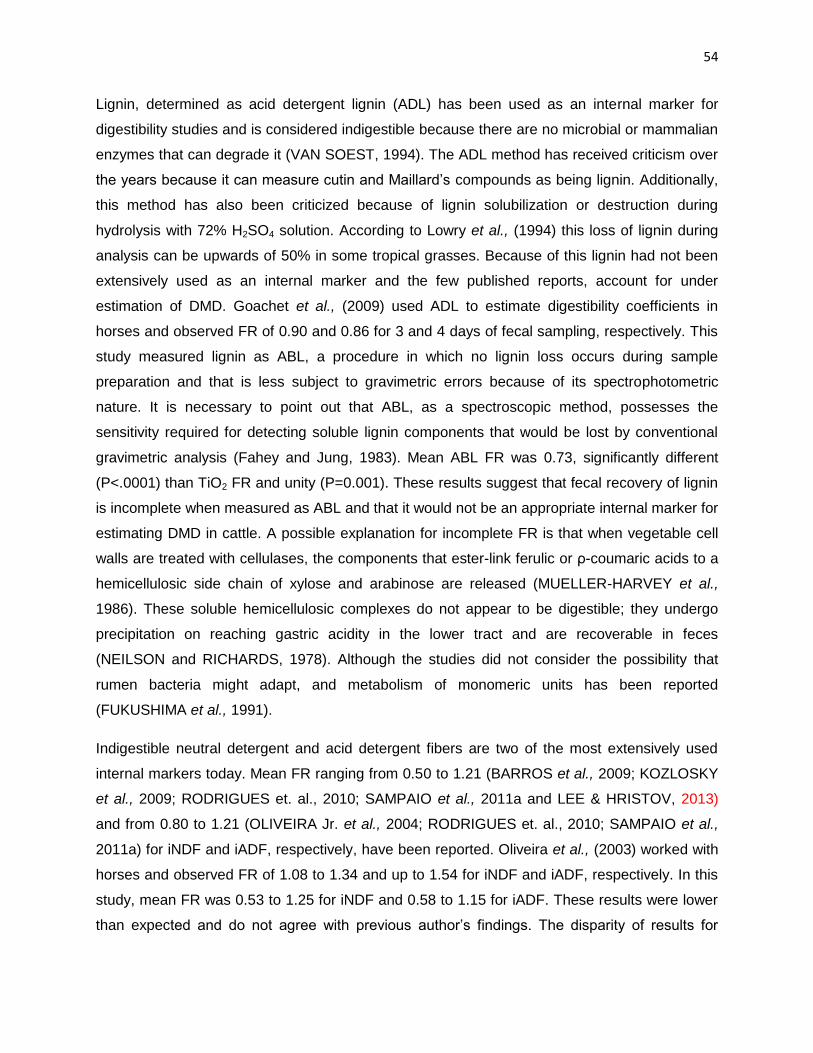
54
Lignin, determined as acid detergent lignin (ADL) has been used as an internal marker for
digestibility studies and is considered indigestible because there are no microbial or mammalian
enzymes that can degrade it (VAN SOEST, 1994). The ADL method has received criticism over
the years because it can measure cutin and Maillard’s compounds as being lignin. Additionally,
this method has also been criticized because of lignin solubilization or destruction during
hydrolysis with 72% H2SO4 solution. According to Lowry et al., (1994) this loss of lignin during
analysis can be upwards of 50% in some tropical grasses. Because of this lignin had not been
extensively used as an internal marker and the few published reports, account for under
estimation of DMD. Goachet et al., (2009) used ADL to estimate digestibility coefficients in
horses and observed FR of 0.90 and 0.86 for 3 and 4 days of fecal sampling, respectively. This
study measured lignin as ABL, a procedure in which no lignin loss occurs during sample
preparation and that is less subject to gravimetric errors because of its spectrophotometric
nature. It is necessary to point out that ABL, as a spectroscopic method, possesses the
sensitivity required for detecting soluble lignin components that would be lost by conventional
gravimetric analysis (Fahey and Jung, 1983). Mean ABL FR was 0.73, significantly different
(P<.0001) than TiO2 FR and unity (P=0.001). These results suggest that fecal recovery of lignin
is incomplete when measured as ABL and that it would not be an appropriate internal marker for
estimating DMD in cattle. A possible explanation for incomplete FR is that when vegetable cell
walls are treated with cellulases, the components that ester-link ferulic or ρ-coumaric acids to a
hemicellulosic side chain of xylose and arabinose are released (MUELLER-HARVEY et al.,
1986). These soluble hemicellulosic complexes do not appear to be digestible; they undergo
precipitation on reaching gastric acidity in the lower tract and are recoverable in feces
(NEILSON and RICHARDS, 1978). Although the studies did not consider the possibility that
rumen bacteria might adapt, and metabolism of monomeric units has been reported
(FUKUSHIMA et al., 1991).
Indigestible neutral detergent and acid detergent fibers are two of the most extensively used
internal markers today. Mean FR ranging from 0.50 to 1.21 (BARROS et al., 2009; KOZLOSKY
et al., 2009; RODRIGUES et. al., 2010; SAMPAIO et al., 2011a and LEE & HRISTOV, 2013)
and from 0.80 to 1.21 (OLIVEIRA Jr. et al., 2004; RODRIGUES et. al., 2010; SAMPAIO et al.,
2011a) for iNDF and iADF, respectively, have been reported. Oliveira et al., (2003) worked with
horses and observed FR of 1.08 to 1.34 and up to 1.54 for iNDF and iADF, respectively. In this
study, mean FR was 0.53 to 1.25 for iNDF and 0.58 to 1.15 for iADF. These results were lower
than expected and do not agree with previous author’s findings. The disparity of results for

55
different experiments is, at least in part, due to differences in incubation time of the samples for
obtaining the fibrous fractions. Our study followed the procedure proposed by Krizsan and
Huhtanen (2013) who compared various incubation times (144h, 240h and 288h) and reported
that at least 12 days of incubation were necessary to isolate the completely indigestible fiber
pool in feeds fed to dairy cows. The results in this study suggest that iNDF and iADF would not
be adequate internal markers for ruminant digestion studies, because low (<1) FR would lead to
overestimation of DMD. Even so, the opposite was observed with low FR and probable
underestimation of DMD by iNDF and iADF in all diets. Estimates of DMD from these markers
were significantly different from GS+TiO2 estimates and the values lacked biological coherence
for the different types of forages being studied.
Prediction of DMD based on fecal concentration of internal markers
Estimated values for DMD from GS+TiO2 were significantly different than estimates produced
by either of the three internal markers. The ABL procedure consistently produced the lowest
DMD estimates and this was caused, at least partially, because fecal recovery was not
complete. Another possible explanation for the low DMD estimates would be the low
concentration of lignin in both diet and feces samples. Lower concentrations make chemical
analysis less reliable because of increased difficulty to detect differences in such small amounts
of residue that are left behind for weighing after the gravimetric procedures are performed. The
ABL procedure is of spectrophotometric nature and therefore should not be subject to this type
of issues.
Mean DMD estimates produced by iNDF and iADF fecal concentrations were also lower than
expected. Estimates were not different between the two indigestible fractions when compared
within the same diet, evidencing the close relationship between both fibrous fractions. Using
animals on pasture, Detmann et al., (2001) reported more accurate DMD estimates when using
iNDF compared to iADF. Berchielli et al., (2005) reported conflicting results when using these
indigestible fractions, in response to the incubation procedure as was mentioned before when
discussing FR. With heifers fed fresh sugar-cane iNDF produced better DMD estimates than
iADF but, when corn silage was fed to dairy cows, iADF estimates were more accurate than
those of iNDF (FERREIRA et al., 2008). Our findings suggest that both iNDF and iADF are not
suitable internal markers for estimating DMD as the estimates they produced bare no biological
meaning.

56
Prediction of FO based on fecal concentration of TiO2
During the last decade or so TiO2 has received increasing attention by researchers in response
to the potential health threats that have been attributed to Cr2O3 (MYERS et al., 2006). Studies
have reported that FO estimates are over-estimated, not significantly different from RFO
(TITGEMEYER et al., 2001) or under-estimated (GLINDEMANN et al., 2009). The variety of
results appear to be caused by differences in FR which directly affects the FO estimates. When
used as an external marker for FO, TiO2 could produce satisfactory estimates that hold
biological meaning. Although FR of TiO2 was 10 percentage points higher than unity, the FO
estimates were coherent considering RDMI obtained from the Grow Safe® System in this study.
Values for FO did not differ between the 6 experimental diets, even though DMD of diets was
different. What this implies is that total digestibility of diets may have been similar but the rate of
digestion of each diet varied. Haylage containing diets, apart from having top quality forages,
had gone through a sort of “pre-digestion” during the ensiling process. The acid fermentation
that kills harmful microorganisms (MO’s) and allows for feed to be conserved by this process,
also breaks down part of the cell wall of plant cells. This break down allows for easier and faster
access of ruminal MO’s to the nutrients and digestible portion of the feed, thus increasing DMD
and DMI when consumed by ruminants. The Alfalfa and Wheatgrass hays did not go through
the “pre-digestion” process and therefore had lower digestion rates when compared to
haylages. The lower digestion rate resulted higher rumen retention time and ultimately lower
DMI for the diets containing these two forage sources. The FO estimates from TiO2 reflected
this phenomenon and thus deserve attention. From our observations, TiO2 seems to be a
suitable external marker for estimating FO in ruminants that are housed collectively or when
total feces collection is not possible.
Prediction of DMI based on internal markers and TiO2 pairs
Estimates of DMI varied widely among marker pairs and diets. Values of RDMI obtained by the
Grow Safe® software were different among the haylage diets and between hay containing and
haylage containing diets. Only on the hay diets (Alfalfa and WG mix) were the marker pairs able
to accurately estimate DMI. Even then, estimates differed from RDMI ± 15 percentage points.
Such numerical differences, although not significant from a statistical point of view, discourages
the use of the double marker technique because the practical consequences of such error can
be expensive in both time and resources.

57
When TiO2 was paired with internal markers, accurate DMI estimates were only obtained under
4x4 GRAB sampling for cutin and under 72h BULK sampling for ABL, iADF and iNDF. Once
again, although estimates were “accurate”, the mean difference was 4027 g/day or 17
percentage units less than RDMI. This difference would not be acceptable because decisions
made based on them would carry error with them.
A previous study with TiO2 (TITGEMEYER et al., 2001) observed that DMI estimates were lower
than or equal to RDMI for this marker. In this study, the authors used the marker to estimate
both DMD and FO, and from these values also estimate DMI. They reported as the main cause
for the inaccuracy of DMI estimates was that FR was different from 100% which resulted in
under or over estimation of FO. The higher the FR the lower FO estimates that will be obtained
and vice-versa. Given an accurate DMD estimate (or real TTAD from total feces collection), if
FO is underestimated then DMI will also be lower than RDMI. The same thing happens when
DMD is underestimated at a given or accurate FO (real FO from total feces collection). The
degree of recovery of these markers has been variable (BERCHIELLE et al., 2005 and
RODRIGUES et al., 2006) and this happens because these fractions do not constitute uniform
chemical units that are constant throughout feeds. The consequence of this is non-uniformity of
markers in feces. Additionally, no standard method has been defined to determine them
(LIPPKE, 2002). Possibly, marker dosing schedule will also affect fecal concentration of
markers and more information should be collected on this issue. Also, as mentioned before, the
uniformization of fecal samples during collection and later during analysis has great impact on
fecal marker concentration.
The results of our study were in accordance with the observations of the above-mentioned
authors. Most of the TiO2 pairs derived estimates of DMI differed from RDMI and this can be
explained by incomplete FR of internal markers. When TiO2 derived FO estimates were paired
with underestimated DMD estimates from the internal markers, the resulting DMI estimates
carried over the bias from low DMD. Even though FR was a little higher than 1, this was not
enough to compensate the incomplete FR of internal markers.
Conclusions
In steers fed diets with different forage sources FR of TiO2 was close to 1 and this marker
produced adequate FO estimates. Internal markers, ABL, iNDF and iADF had FR lower than
unity which compromised the accuracy of DMD estimates derived from these markers. The FR
was affected by the forage source that composed the diet, possibly due to soluble cell wall

58
fractions of the different forages. Although DMI estimates were not affected by the diet, the low
DMD estimates from internal markers resulted in DMI estimates different from RDMI. Because
of these observations, we can recommend the use of TiO2 for estimating FO with concomitant
TFC on at least 1 animal per treatment in order to determine FR. Based on our results we
cannot recommend the use of ABL, iNDF or iADF for estimating DMD. Although none of the
marker pairs produced accurate DMI estimates, these substances deserve further attention for
research in ruminant nutrition studies.
Chapter 3.
Diet, marker and fecal sampling method interactions with internal and external marker pairs
when estimating dry matter intake in ruminants.
Introduction
The use of dietary markers to study feed utilization was proposed as far back as 1874 (KOTB
and LUCKEY, 1972). Daily dry matter intake (DMI) can be estimated by means of digestion
markers The most frequently used method separately estimates fecal output (FO) and dry
matter digestibility (DMD) (PENNING, 2004).
The use of markers is currently the most widely used technique to estimate DMI in ruminants.
Markers are indigestible substances that are not secreted by the animal, have passage rates
similar to the feed, can be recovered completely after ingestion and allow for practical and
precise chemical analysis (FAHEY and JUNG, 1983), among others characteristics. According
to Merchen (1993), none of the substances that are used as markers in ruminant digestion
studies meet all of the requirements but, some are adequate enough to produce important data
for the advance of research.
The quality of forage consumed by animals affects the passage rate (Qp) (POPPI et al.,
1981a,b) and thus the retention time (Tr) (DIAS et al., 2011) of digesta in the GIT, therefore
influencing the rate of change of marker concentration in feces. The concentration of the marker
in feces will ultimately determine its fecal recovery (FR) which is a crucial characteristic, if not
the most, that any marker should possess in order to be free of recovery bias (DETMANN et al.,

59
2007). According to Langlands et al., (1963), FR appears to be an inherent characteristic of
each marker and how it interacts with feed particles.
The marker technique to estimate intake uses an external marker to estimate fecal output (FO)
and an internal marker (naturally occurring in feedstuffs) to estimate dry matter digestibility
(DMD). Intake is then calculated by dividing FO by the indigestibility (1-DMD) of the feed. The
main criticisms to the technique are the difficulty and labor of feeding the external markers twice
a day, for several days; the need for excessive interaction between animals and people which
may negatively affect intake and the intensive labor and high cost of feces sample collection.
Total feces collection (TFC) is regularly used in intake studies as the standard to which
estimates are compared to and as the source of BULK samples for later analysis. The
recommended number of days for TFC ranges from 7-10 days (SCHNEIDER & FLATT, 1975) to
3-5 days (FERREIRA et al., 2008), with authors reporting no significant differences for
digestibility estimates. Aiming to reduce the number of days for TFC, different fecal sampling
designs have been proposed (LANGLANDS et al., 1963), which accounts for the
inconsistencies of obtaining the feces samples. In this approach, GRAB samples collected at
specific times during the day, either after spontaneous excretion or collected directly from the
rectum, are composited to make up the daily samples. Sampaio et al., (2011b) compared 9
different fecal sampling designs and reported that four daily GRAB samples distributed along
the whole day or just during the diurnal period will produce accurate estimates.
From the above, it can be hypothesized that the combination of internal and external markers,
with fecal sampling designs that produce composite GRAB samples over 3-4 days of collection
period, should result in accurate estimates for DMD, FO and DMI in bulls consuming corn silage
or Tifton 85 hay based diets, with varying forage to concentrate ratios.
The objective of the experiment was to test the accuracy of internal markers, acetyl bromide
lignin (ABL), cutin, indigestible neutral detergent fiber (iNDF) and indigestible acid detergent
fiber (iADF) for estimating DMD; to test the utilization of external markers, chromic oxide (Cr2O3)
and titanium dioxide (TiO2) for estimating FO; examine the combination of internal and external
markers for estimating DMI and to compare 3 different sampling designs against TFC.
Material and Methods
The experiment was conducted at the Beef Cattle Research Laboratory of the Animal Nutrition
and Production Department at the University of São Paulo. The experiment was approved by
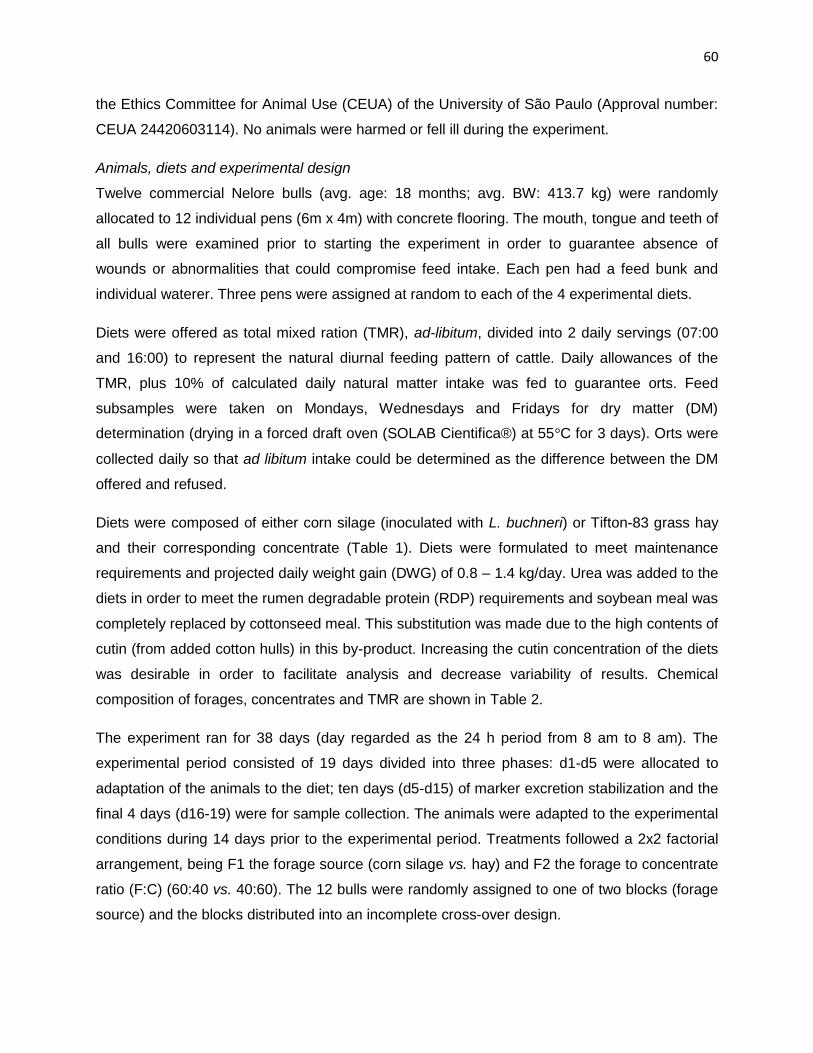
60
the Ethics Committee for Animal Use (CEUA) of the University of São Paulo (Approval number:
CEUA 24420603114). No animals were harmed or fell ill during the experiment.
Animals, diets and experimental design
Twelve commercial Nelore bulls (avg. age: 18 months; avg. BW: 413.7 kg) were randomly
allocated to 12 individual pens (6m x 4m) with concrete flooring. The mouth, tongue and teeth of
all bulls were examined prior to starting the experiment in order to guarantee absence of
wounds or abnormalities that could compromise feed intake. Each pen had a feed bunk and
individual waterer. Three pens were assigned at random to each of the 4 experimental diets.
Diets were offered as total mixed ration (TMR), ad-libitum, divided into 2 daily servings (07:00
and 16:00) to represent the natural diurnal feeding pattern of cattle. Daily allowances of the
TMR, plus 10% of calculated daily natural matter intake was fed to guarantee orts. Feed
subsamples were taken on Mondays, Wednesdays and Fridays for dry matter (DM)
determination (drying in a forced draft oven (SOLAB Cientifica®) at 55°C for 3 days). Orts were
collected daily so that ad libitum intake could be determined as the difference between the DM
offered and refused.
Diets were composed of either corn silage (inoculated with L. buchneri) or Tifton-83 grass hay
and their corresponding concentrate (Table 1). Diets were formulated to meet maintenance
requirements and projected daily weight gain (DWG) of 0.8 – 1.4 kg/day. Urea was added to the
diets in order to meet the rumen degradable protein (RDP) requirements and soybean meal was
completely replaced by cottonseed meal. This substitution was made due to the high contents of
cutin (from added cotton hulls) in this by-product. Increasing the cutin concentration of the diets
was desirable in order to facilitate analysis and decrease variability of results. Chemical
composition of forages, concentrates and TMR are shown in Table 2.
The experiment ran for 38 days (day regarded as the 24 h period from 8 am to 8 am). The
experimental period consisted of 19 days divided into three phases: d1-d5 were allocated to
adaptation of the animals to the diet; ten days (d5-d15) of marker excretion stabilization and the
final 4 days (d16-19) were for sample collection. The animals were adapted to the experimental
conditions during 14 days prior to the experimental period. Treatments followed a 2x2 factorial
arrangement, being F1 the forage source (corn silage vs. hay) and F2 the forage to concentrate
ratio (F:C) (60:40 vs. 40:60). The 12 bulls were randomly assigned to one of two blocks (forage
source) and the blocks distributed into an incomplete cross-over design.
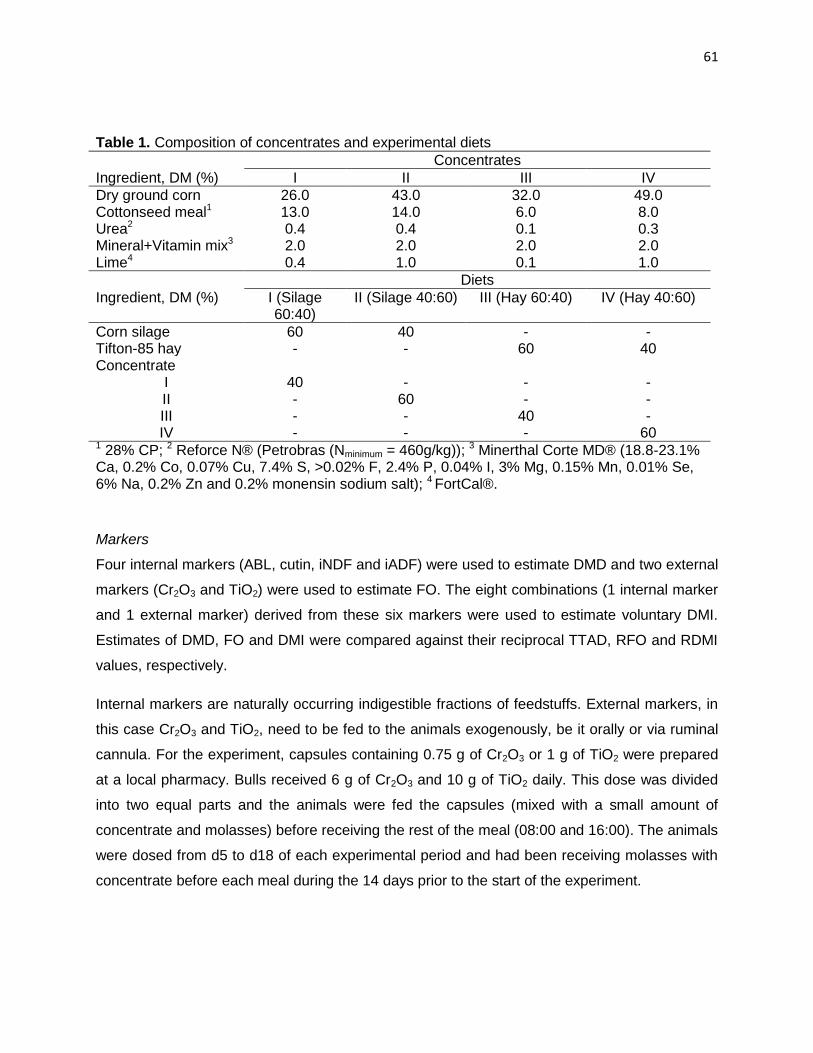
61
Table 1. Composition of concentrates and experimental diets
Concentrates
Ingredient, DM (%) I II III IV
Dry ground corn 26.0 43.0 32.0 49.0 Cottonseed meal1 13.0 14.0 6.0 8.0 Urea2 0.4 0.4 0.1 0.3 Mineral+Vitamin mix3 2.0 2.0 2.0 2.0 Lime4 0.4 1.0 0.1 1.0
Diets
Ingredient, DM (%) I (Silage 60:40)
II (Silage 40:60) III (Hay 60:40) IV (Hay 40:60)
Corn silage 60 40 - - Tifton-85 hay - - 60 40 Concentrate
I 40 - - - II - 60 - - III - - 40 - IV - - - 60
1 28% CP; 2 Reforce N® (Petrobras (Nminimum = 460g/kg)); 3 Minerthal Corte MD® (18.8-23.1% Ca, 0.2% Co, 0.07% Cu, 7.4% S, >0.02% F, 2.4% P, 0.04% I, 3% Mg, 0.15% Mn, 0.01% Se, 6% Na, 0.2% Zn and 0.2% monensin sodium salt); 4 FortCal®.
Markers
Four internal markers (ABL, cutin, iNDF and iADF) were used to estimate DMD and two external
markers (Cr2O3 and TiO2) were used to estimate FO. The eight combinations (1 internal marker
and 1 external marker) derived from these six markers were used to estimate voluntary DMI.
Estimates of DMD, FO and DMI were compared against their reciprocal TTAD, RFO and RDMI
values, respectively.
Internal markers are naturally occurring indigestible fractions of feedstuffs. External markers, in
this case Cr2O3 and TiO2, need to be fed to the animals exogenously, be it orally or via ruminal
cannula. For the experiment, capsules containing 0.75 g of Cr2O3 or 1 g of TiO2 were prepared
at a local pharmacy. Bulls received 6 g of Cr2O3 and 10 g of TiO2 daily. This dose was divided
into two equal parts and the animals were fed the capsules (mixed with a small amount of
concentrate and molasses) before receiving the rest of the meal (08:00 and 16:00). The animals
were dosed from d5 to d18 of each experimental period and had been receiving molasses with
concentrate before each meal during the 14 days prior to the start of the experiment.
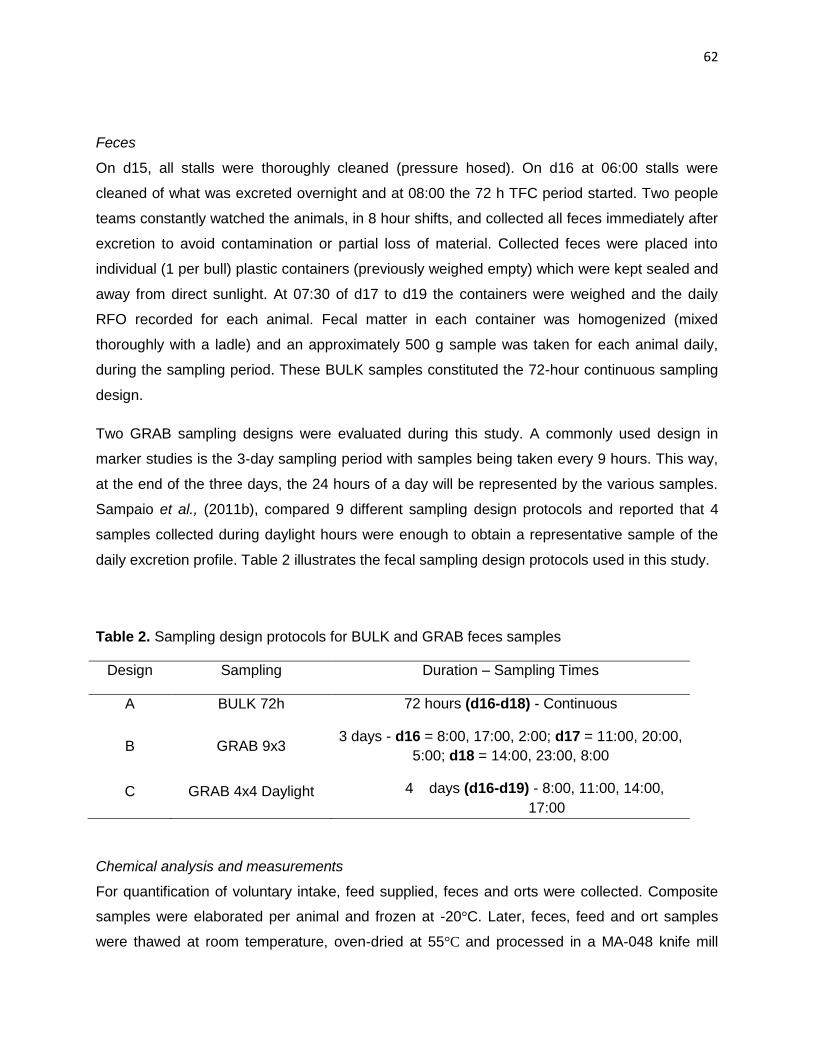
62
Feces
On d15, all stalls were thoroughly cleaned (pressure hosed). On d16 at 06:00 stalls were
cleaned of what was excreted overnight and at 08:00 the 72 h TFC period started. Two people
teams constantly watched the animals, in 8 hour shifts, and collected all feces immediately after
excretion to avoid contamination or partial loss of material. Collected feces were placed into
individual (1 per bull) plastic containers (previously weighed empty) which were kept sealed and
away from direct sunlight. At 07:30 of d17 to d19 the containers were weighed and the daily
RFO recorded for each animal. Fecal matter in each container was homogenized (mixed
thoroughly with a ladle) and an approximately 500 g sample was taken for each animal daily,
during the sampling period. These BULK samples constituted the 72-hour continuous sampling
design.
Two GRAB sampling designs were evaluated during this study. A commonly used design in
marker studies is the 3-day sampling period with samples being taken every 9 hours. This way,
at the end of the three days, the 24 hours of a day will be represented by the various samples.
Sampaio et al., (2011b), compared 9 different sampling design protocols and reported that 4
samples collected during daylight hours were enough to obtain a representative sample of the
daily excretion profile. Table 2 illustrates the fecal sampling design protocols used in this study.
Table 2. Sampling design protocols for BULK and GRAB feces samples
Design Sampling Duration – Sampling Times
A BULK 72h 72 hours (d16-d18) - Continuous
B GRAB 9x3 3 days - d16 = 8:00, 17:00, 2:00; d17 = 11:00, 20:00,
5:00; d18 = 14:00, 23:00, 8:00
C GRAB 4x4 Daylight 4 days (d16-d19) - 8:00, 11:00, 14:00,
17:00
Chemical analysis and measurements
For quantification of voluntary intake, feed supplied, feces and orts were collected. Composite
samples were elaborated per animal and frozen at -20°C. Later, feces, feed and ort samples
were thawed at room temperature, oven-dried at 55°C and processed in a MA-048 knife mill

63
(MARCONI®, São Paulo, Brazil), with a 2 mm mesh screen. Preference was given to the 2 mm
screen because, according to Froidmont et al., (2008), fine grinding can cause loss of small
particles (containing lignin and cutin) which would have a significant impact on our expected
results.
Feed and TMR samples were analyzed for dry-matter (DM) and mineral matter (MM) by
incineration in a muffle furnace (MARCONI®, São Paulo, Brazil). Neutral detergent fiber (NDF)
and acid detergent fiber (ADF) were determined by using the traditional method procedure (VAN
SOEST, ROBERTSON & LEWIS, 1991) where filter bags replaced the glass-sintered crucibles,
with addition of heat-stable amylase and without sodium sulfite (MERTENS, 2002), in a TE-149
Fiber Analyzer (TECNAL®, São Paulo, Brazil). Sodium sulfite was not used because it has been
reported to cause loss of lignin particles during the detergent procedure (MERTENS, 2002).
Cell wall (CW) preparation was obtained according to the procedure proposed by Fukushima
and Hatfield (2001) and later used as substrate for acetyl bromide lignin (ABL) determination in
feed, orts and feces samples, according to Fukushima and Kerley (2011). Lignin absorbance
was determined with a Libra S80 spectrophotometer (BIOCHROM®; United Kingdom) at a
wavelength of 280 nm. Soluble fiber was calculated as the difference between CW and NDF
contents, with pectin being one of its components. Indigestible neutral detergent fiber and
indigestible acid detergent fiber (iNDF and iADF, respectively) were obtained by weighing silage
and feces (0.5 g), and concentrate (1.0 g) samples into F57 bags (ANKOM Technology Corp.®,
Fairport, NY). Samples were incubated inside the rumen of a cannulated cow for 288 hours
(CASALI et al., 2008; KRIZAN and HUHTANEN, 2013), washed with abundant water and
treated according to Van Soest and Robertson (1985) for determination of these indigestible
fractions.
Cutin content in feed, TMR and feces samples were determined in non-woven textile (NWT)
fiber bags according to the procedure described by Fukushima (personal communication).
Briefly, dry matter samples were sequentially treated with neutral detergent and acid detergent
solutions to obtain an acid detergent residue (ADR). Fiber bags containing ADR were treated
with potassium permanganate solution (KMnO4) in order to oxidize lignin and afterwards treated
with 72% sulfuric acid solution (H2SO4) to hydrolyze cellulose, leaving behind cutin and mineral
residue. Bags were dried in a forced draft oven at 105°C for 12 hours and weighed. Finally, the
residue containing bags were incinerated at 450°C in a muffle furnace and cutin content was
calculated as:

64
Cutin% = ((WaH – (WaI - Wc) x100) ÷ SiW
where: WaH = weight after sulfuric acid hydrolysis, WaI = weight after incineration, Wc = weigh
of crucible and SiW = sample initial weight.
Crude protein (N% x 6.25) was determined in feed and TMR samples by the micro-kjeldahl
procedure in a TE 036/1 Nitrogen Distiller (TECNAL®, São Paulo, Brazil). Ether extract (Ee)
content of feeds and TMR was determined by petroleum ether extraction using a XT10 Extractor
(ANKOM Technology Corp.®, Fairport, NY).
The quantification of Cr2O3 in feces samples was performed by visible light spectrophotometry
(550 nm) according to the procedure proposed by Kimura et al., (1957) with the modifications
proposed by Graner (1972). Standard samples containing 0, 2, 4, 6, 8 and 10 mg of chromium
per g DM were analyzed in triplicate, totalizing 18 standard samples. Pure Cr2O3 (99% trace
metals basis; Solumix®) was employed to produce the standards. The concentration of Cr2O3
was analyzed and compared with the added amount of Cr2O3. The regression equation obtained
was: y = 0.002x + 0.06 (r2 = 0.995).
The quantification of TiO2 in feces samples was performed by visible light spectrophotometry
(410 nm) according to Myers et al., (2004). To validate the accuracy of the TiO2 analysis, a
regression equation was created using the method proposed by Glindemann et al., (2009).
Standard samples containing 0, 1, 2, 3, 4, 5 and 6 mg of titanium per g DM were analyzed in
triplicate, totalizing 21 standard samples. Pure TiO2 (99.3% trace metals basis; Dinâmica®
#1093) was employed to produce the standards. The concentration of TiO2 was analyzed and
compared with the added amount of TiO2. The regression equation obtained was: y = 0.057x +
0.04 (r2 = 0.995).
Calculations
Real DMI (RDMI) was calculated as daily feed offer minus daily orts (Equation 1) and Real FO
(RFO) was obtained by 3 days (d16-d18) of TFC (24-hour collection and daily weighing of
amount excreted). Total-tract apparent digestibility (TTAD) was calculated as RDMI minus RFO
(Equation 2):

65
(1)
–
(2)
[ (
) – (
)]
Equations (3) and (4) were used to estimate marker excretion and recovery rate. These
equations derived from both BULK and GRAB samples. The overall recovery rate of markers
was calculated from the total amount of marker given and the amount recovered during the fecal
sampling period (d15-d19). Daily recovery rate of markers was calculated from d16 to d19:
(3)
(
) (
)
(4)
Equation (5) was used to estimate FO using external markers and Equation (6) was used to
estimate DMD using internal markers:
(5)
(
)
(
)
( )
(6)
(
)
( )
( )
Equation (7) was used to estimate total voluntary intake from FO and DMD estimates obtained
by equations (5) and (6). Total DMI was estimated for both BULK and GRAB samples:

66
(7)
Statistical Analysis
Results were analyzed with SAS® 9.3 (SAS®, 2011), after verifying normality of residuals and
homogeneity of variance. Normally distributed values for TTAD, RFO and RDMI, data was
analyzed using PROC-MIXED, at 0.05 significance level, according to the model:
Yijkl = µ + Fi + Cj + FCij + Aijk + Pijkl+ Ɛijkl,
where Yijkl = is the TTAD, RFO or RDMI value for animal k, on forage i, with F:C ratio j, in period
l; µ = is the general constant; Fi = is the fixed effect of forage source; Cj = is the fixed effect of
forage to concentrate ratio; FCij = is the interaction between forage source i and F:C ratio j
(fixed); Aijkl = is the random effect of animal; Pijkl is the random effect of period and Ɛijkl is the
sampling error supposed to be NIID (normal independent and identically distributed).
Values for TTAD, RFO and RDMI were compared against DMD, FO and DMI estimates using
PROC MIXED, at 0.05 significance level, according to the model:
Yijklmn = µ + Fi + Cj + Tk + FCij + FTik + CTjk + FCTijk + Aijkl + Pm(ij) + Ɛijklmn,
where Yijklmn = is the DMD, FO or DMI estimated in animal l, on treatment (marker versus
sampling procedure) k; µ = is the general constant; Fi = is the fixed effect of forage; Cj = is the
fixed effect of forage to concentrate ratio; Tk = is the fixed effect of treatments, being, for DMD: 4
internal markers combined with 3 sampling procedures plus one treatment considered the “real
value” derived from TFC; for FO: 2 external markers combined with 3 sampling procedures plus
one treatment considered the “real value” derived from TFC; for DMI: 8 marker pairs (1 external
and 1 internal) combined with 3 sampling procedures plus one treatment considered the “real
value” derived from daily weighing of all feed and orts; FCij = is the interaction between forage
source i and F:C ratio j (fixed); FTik = is the interaction between forage source i and treatment k;
CTjk = is the interaction between forage to concentrate ratio j and treatment k; FCTijk = is the
interaction between forage source i, forage to concentrate ratio j and treatment k; Aijkl = is the
random effect of animal; Pijkl is the random effect of period and Ɛijkl is the experimental error
supposed to be NIID (normal independent and identically distributed).
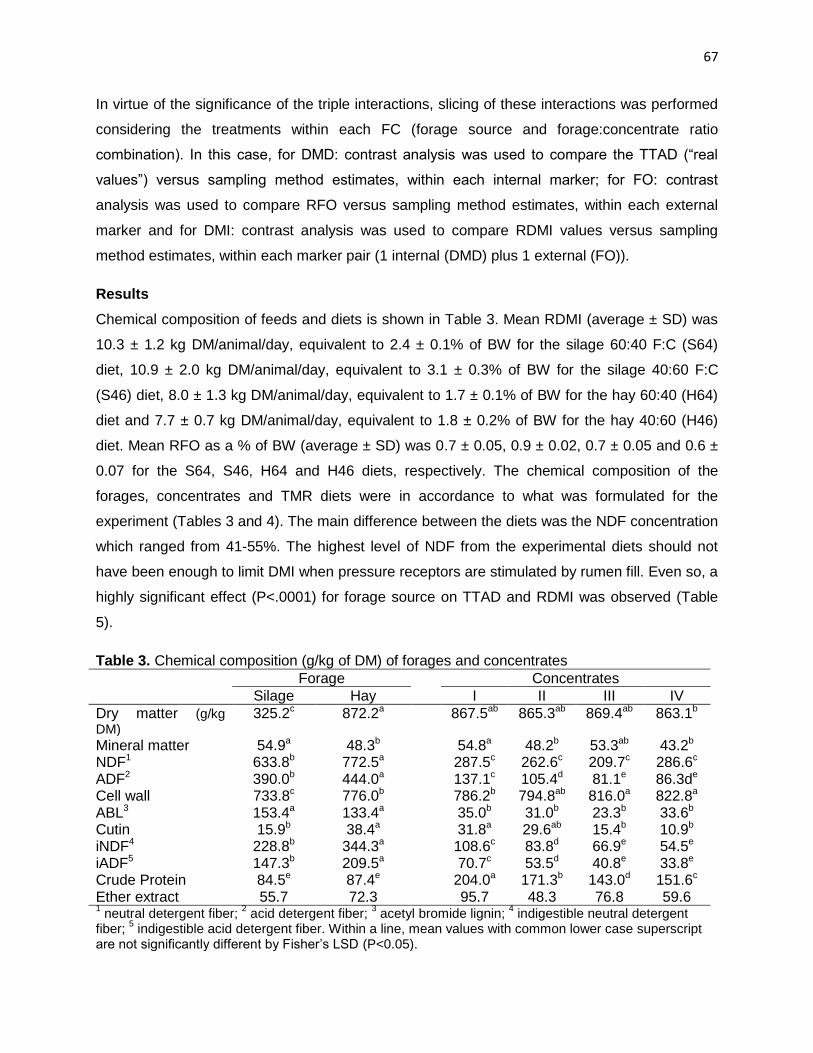
67
In virtue of the significance of the triple interactions, slicing of these interactions was performed
considering the treatments within each FC (forage source and forage:concentrate ratio
combination). In this case, for DMD: contrast analysis was used to compare the TTAD (“real
values”) versus sampling method estimates, within each internal marker; for FO: contrast
analysis was used to compare RFO versus sampling method estimates, within each external
marker and for DMI: contrast analysis was used to compare RDMI values versus sampling
method estimates, within each marker pair (1 internal (DMD) plus 1 external (FO)).
Results
Chemical composition of feeds and diets is shown in Table 3. Mean RDMI (average ± SD) was
10.3 ± 1.2 kg DM/animal/day, equivalent to 2.4 ± 0.1% of BW for the silage 60:40 F:C (S64)
diet, 10.9 ± 2.0 kg DM/animal/day, equivalent to 3.1 ± 0.3% of BW for the silage 40:60 F:C
(S46) diet, 8.0 ± 1.3 kg DM/animal/day, equivalent to 1.7 ± 0.1% of BW for the hay 60:40 (H64)
diet and 7.7 ± 0.7 kg DM/animal/day, equivalent to 1.8 ± 0.2% of BW for the hay 40:60 (H46)
diet. Mean RFO as a % of BW (average ± SD) was 0.7 ± 0.05, 0.9 ± 0.02, 0.7 ± 0.05 and 0.6 ±
0.07 for the S64, S46, H64 and H46 diets, respectively. The chemical composition of the
forages, concentrates and TMR diets were in accordance to what was formulated for the
experiment (Tables 3 and 4). The main difference between the diets was the NDF concentration
which ranged from 41-55%. The highest level of NDF from the experimental diets should not
have been enough to limit DMI when pressure receptors are stimulated by rumen fill. Even so, a
highly significant effect (P<.0001) for forage source on TTAD and RDMI was observed (Table
5).
Table 3. Chemical composition (g/kg of DM) of forages and concentrates
Forage Concentrates
Silage Hay I II III IV
Dry matter (g/kg DM)
325.2c 872.2a 867.5ab 865.3ab 869.4ab 863.1b
Mineral matter 54.9a 48.3b 54.8a 48.2b 53.3ab 43.2b NDF1 633.8b 772.5a 287.5c 262.6c 209.7c 286.6c ADF2 390.0b 444.0a 137.1c 105.4d 81.1e 86.3de Cell wall 733.8c 776.0b 786.2b 794.8ab 816.0a 822.8a ABL3 153.4a 133.4a 35.0b 31.0b 23.3b 33.6b Cutin 15.9b 38.4a 31.8a 29.6ab 15.4b 10.9b iNDF4 228.8b 344.3a 108.6c 83.8d 66.9e 54.5e iADF5 147.3b 209.5a 70.7c 53.5d 40.8e 33.8e Crude Protein 84.5e 87.4e 204.0a 171.3b 143.0d 151.6c Ether extract 55.7 72.3 95.7 48.3 76.8 59.6 1 neutral detergent fiber;
2 acid detergent fiber;
3 acetyl bromide lignin;
4 indigestible neutral detergent
fiber; 5 indigestible acid detergent fiber. Within a line, mean values with common lower case superscript
are not significantly different by Fisher’s LSD (P<0.05).

68
Table 4. Chemical composition (g/kg of DM), of the experimental diets
Forage Corn silage Tifton-85 hay
F:C ratio 60:40 40:60 60:40 40:60
Dry matter (g/kg) 542.1c 649.3b 870.1a 866.8a
Mineral matter 54.9a 50.9b 50.3b 45.2c NDF1 495.3ab 411.1b 547.3a 481.0ab ADF2 288.8a 219.2b 298.8a 229.4b Cell wall 754.8c 770.4bc 792.0ab 804.1a ABL3 106.0 79.9 89.4 73.5 Cutin 22.3 24.1 29.2 21.9 iNDF4 180.7b 141.8d 233.3a 170.4c iADF5 116.7b 91.0d 142.0a 104.1c Crude Protein 132.3a 136.6a 109.6c 125.9b Ether extract 71.7 51.2 74.1 64.7 1 neutral detergent fiber;
2 acid detergent fiber;
3 acetyl bromide lignin;
4 indigestible neutral detergent fiber;
5 indigestible acid detergent fiber. Within a line, mean values with common lower case superscript are not
significantly different by Fisher’s LSD (P<0.05).
Table 5. Effect of forage source (F, silage vs. hay) with two forage:concentrate ratios (C, 60:40 vs. 40:60) on total tract apparent digestibility (TTAD), real fecal output (RFO), real dry matter intake (RDMI) obtained by total feces collection (72 hours) in young bulls fed TMR diets
Forage (F) Corn silage Tifton-85 hay SDF2 SDC
3 P-value
F:C1 (C) 60:40 40:60 60:40 40:60 F C FxC
TTAD 708.3 700.5 612.8 641.7 54.6 14.0 <.0001 0.327 0.174 RFO 2715.7 3561.1 2940.7 2912.3 308.9 308.9 0.023 <.0001 0.046 RDMI 9328.5 11920.8 7597.8 8126.1 1953.5 1103.3 <.0001 <.0001 0.035 1 F:C, forage:concentrate ratio;
2 standard deviation of forage source;
3 standard deviation of F:C.
Fecal recovery of markers
Mean fecal recovery of markers varied among them and are shown in Table 6. Significant
effects were observed for both forage source and F:C ratio on both indigestible fibers (iNDF and
iADF) and cutin. For iNDF and iADF, FR was incomplete (P=0.028 and P=0.024, respectively)
on silage based diets and complete (P=0.625 and P=0.176, respectively) for the hay based
diets. The FR of cutin was unexpectedly high, around 120%, not in accordance to what would
be biologically expected. Both Cr2O3 and ABL were affected by forage source but not by F:C
ratio. For Cr2O3, a significant effect (P=0.035) was observed for the interaction between forage
source and F:C ratio, resulting in incomplete FR (P=0.019) for the corn silage 40:60 diet and
“complete” FR (P=0.110, P=0.102, P=0.154) for the corn silage 60:40, hay 60:40 and hay 40:60
diets, respectively. For ABL, FR was only complete (P=0.889 and P=0.476) on the hay diets and

69
around 50% for the corn silage diets (P<.0001). Contrarily, TiO2 was unaffected by forage
source but suffered an effect by F:C ratio, which led to, as with cutin, to FR higher than 1,
around 140%, not consistent to what would be expected.
Table 6. Effect of forage source (F, silage vs. hay) with two forage:concentrate ratios (C, 60:40 vs. 40:60) on fecal recovery (FR) of external markers chromic oxide (Cr2O3), titanium dioxide (TiO2) and of internal markers acetyl bromide lignin (ABL), indigestible neutral detergent fiber (iNDF), indigestible acid detergent fiber (iADF) and cutin in young bulls fed TMR diets
Forage (F) Corn silage Tifton-85 hay SDF2 SDC
3 P-value
F:C1 (C) 60:40 40:60 60:40 40:60 F C FxC
FR Cr2O3 0.80a 0.71b 0.80a 0.83a 0.04 0.04 0.008 0.101 0.035
TiO2 1.31 1.57 1.30 1.40 0.06 0.13 0.109 0.001 0.370
ABL 0.51 0.52 0.98 0.91 0.30 0.03 <.0001 0.104 0.520
iNDF 0.73 0.72 0.97 1.06 0.21 0.04 <.0001 0.026 0.079 iADF 0.81 0.80 1.06 1.17 0.22 0.04 <.0001 0.019 0.057
Cutin 1.16 0.89 1.45 1.38 0.28 0.12 <.0001 <.0001 0.537 1 F:C, forage:concentrate ratio;
2 standard deviation of forage source;
3 standard deviation of F:C. Within
a line, mean values with common lower case superscript are not significantly different by Fisher’s LSD (P<0.05).
Prediction of DMD based on fecal concentration of internal markers
The mean DMD estimates are shown in Table 7. No effect (P=0.435) was observed for
sampling procedure on DMD estimates. Significant effects for marker (P=0.021), diet (P<.0001)
and the interaction diet x marker x method (P<.0001) were observed. All markers produced
accurate DMD estimates when compared with TTAD. Estimates derived from the GRAB 9x3
fecal sampling procedure were consistently accurate, independently of the internal marker used.
Indigestible fibers (iNDF and iADF) consistently produced accurate estimates independently of
the fecal sampling procedure.
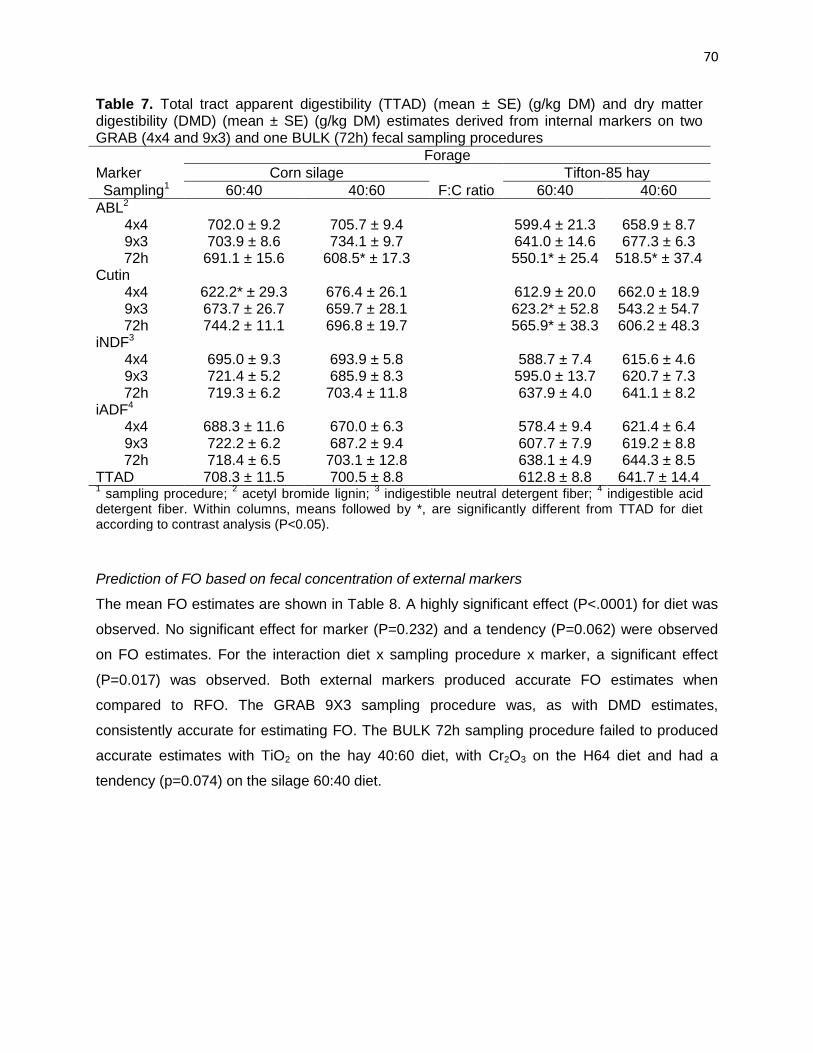
70
Table 7. Total tract apparent digestibility (TTAD) (mean ± SE) (g/kg DM) and dry matter digestibility (DMD) (mean ± SE) (g/kg DM) estimates derived from internal markers on two GRAB (4x4 and 9x3) and one BULK (72h) fecal sampling procedures
Forage
Marker Corn silage Tifton-85 hay
Sampling1 60:40 40:60 F:C ratio 60:40 40:60
ABL2 4x4 702.0 ± 9.2 705.7 ± 9.4 599.4 ± 21.3 658.9 ± 8.7 9x3 703.9 ± 8.6 734.1 ± 9.7 641.0 ± 14.6 677.3 ± 6.3 72h 691.1 ± 15.6 608.5* ± 17.3 550.1* ± 25.4 518.5* ± 37.4
Cutin 4x4 622.2* ± 29.3 676.4 ± 26.1 612.9 ± 20.0 662.0 ± 18.9 9x3 673.7 ± 26.7 659.7 ± 28.1 623.2* ± 52.8 543.2 ± 54.7 72h 744.2 ± 11.1 696.8 ± 19.7 565.9* ± 38.3 606.2 ± 48.3
iNDF3 4x4 695.0 ± 9.3 693.9 ± 5.8 588.7 ± 7.4 615.6 ± 4.6 9x3 721.4 ± 5.2 685.9 ± 8.3 595.0 ± 13.7 620.7 ± 7.3 72h 719.3 ± 6.2 703.4 ± 11.8 637.9 ± 4.0 641.1 ± 8.2
iADF4 4x4 688.3 ± 11.6 670.0 ± 6.3 578.4 ± 9.4 621.4 ± 6.4 9x3 722.2 ± 6.2 687.2 ± 9.4 607.7 ± 7.9 619.2 ± 8.8 72h 718.4 ± 6.5 703.1 ± 12.8 638.1 ± 4.9 644.3 ± 8.5
TTAD 708.3 ± 11.5 700.5 ± 8.8 612.8 ± 8.8 641.7 ± 14.4 1 sampling procedure;
2 acetyl bromide lignin;
3 indigestible neutral detergent fiber;
4 indigestible acid
detergent fiber. Within columns, means followed by *, are significantly different from TTAD for diet according to contrast analysis (P<0.05).
Prediction of FO based on fecal concentration of external markers
The mean FO estimates are shown in Table 8. A highly significant effect (P<.0001) for diet was
observed. No significant effect for marker (P=0.232) and a tendency (P=0.062) were observed
on FO estimates. For the interaction diet x sampling procedure x marker, a significant effect
(P=0.017) was observed. Both external markers produced accurate FO estimates when
compared to RFO. The GRAB 9X3 sampling procedure was, as with DMD estimates,
consistently accurate for estimating FO. The BULK 72h sampling procedure failed to produced
accurate estimates with TiO2 on the hay 40:60 diet, with Cr2O3 on the H64 diet and had a
tendency (p=0.074) on the silage 60:40 diet.

71
Table 8. Real fecal output (RFO) (mean ± SE) (g DM/day) and fecal output (FO) (mean ± SE) (g DM/day) estimates derived from external markers on two GRAB (4x4 and 9x3) and one BULK (72h) fecal sampling procedures
Forage
Marker Corn silage Tifton-85 hay
S. PROC1 60:40 40:60 F:C ratio 60:40 40:60
Cr2O3 4x4 2712.4 ± 183.0 3761.0 ± 318.1 3008.0 ± 178.4 2790.6 ± 120.6 9x3 2618.4 ± 124.2 3732.8 ± 207.4 2749.3 ± 103.7 3091.9 ± 174.0 72h 3107.0T ± 178.9 3801.3 ± 210.2 3416.4* ± 216.6 2927.7 ± 88.2
TiO2 4x4 3157.3* ± 163.7 3338.6 ± 122.8 3180.4 ± 171.1 3199.6 ± 145.5 9x3 2522.5 ± 140.0 3586.3 ± 240.8 2946.0 ± 218.6 3613.7 ± 326.9 72h 3059.9 ± 136.9 3909.5 ± 253.0 3508.0 ± 365.7 2787.9* ± 265.0
RFO 2715.7 ± 114.8 3561.1 ± 120.5 2940.7 ± 101.7 2912.3 ± 150.3 1 sampling procedure. Within columns, means followed by *, are significantly different from RFO for diet
according to contrast analysis (P<0.05).
Prediction of DMI based on internal and external marker pairs
The mean DMI estimates are shown in Table 9. Highly significant effects for forage source
(P<.0001), F:C ratio (P<.0001) and treatment (marker pair x sampling procedure) (P<.0001)
were observed. Interactions between forage source x F:C ratio, forage source x treatment and
F:C ratio x treatment were also significant with P=0.037, P<.002 and P<.0001, respectively. For
the triple interaction forage source x F:C ratio x treatment, a tendency (P=0.078) was observed.
Less DMI estimates from Cr2O3 marker pairs were significantly different from their reciprocal
RDMI values than the TiO2 derived marker pairs. Among the internal markers, the indigestible
fibers produced accurate estimates (not significantly different to the reciprocal RDMI value)
more constantly than ABL and cutin. Between the sampling procedures, the GRAB 9x3 and
GRAB 4x4 derived DMI estimates were more often accurate than the BULK 72h sampling
procedure. None of the marker pairs or sampling procedures produced accurate DMI estimates
for all diets.
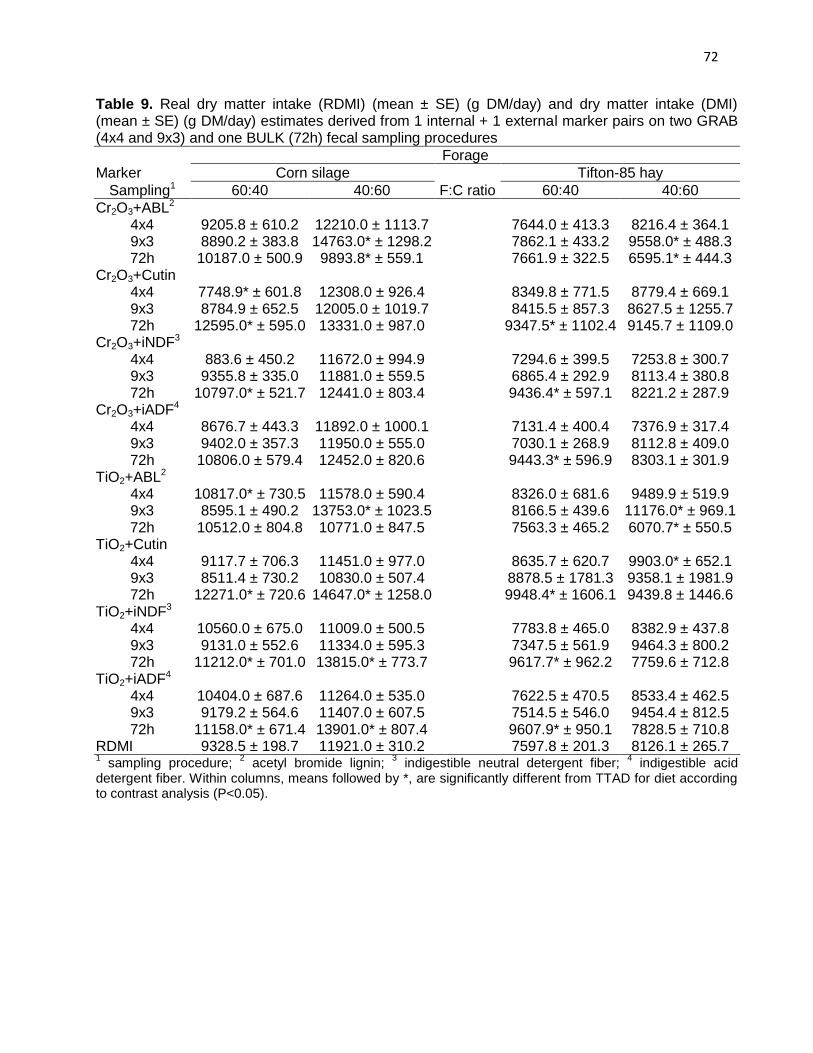
72
Table 9. Real dry matter intake (RDMI) (mean ± SE) (g DM/day) and dry matter intake (DMI) (mean ± SE) (g DM/day) estimates derived from 1 internal + 1 external marker pairs on two GRAB (4x4 and 9x3) and one BULK (72h) fecal sampling procedures
Forage
Marker Corn silage Tifton-85 hay
Sampling1 60:40 40:60 F:C ratio 60:40 40:60
Cr2O3+ABL2 4x4 9205.8 ± 610.2 12210.0 ± 1113.7 7644.0 ± 413.3 8216.4 ± 364.1 9x3 8890.2 ± 383.8 14763.0* ± 1298.2 7862.1 ± 433.2 9558.0* ± 488.3 72h 10187.0 ± 500.9 9893.8* ± 559.1 7661.9 ± 322.5 6595.1* ± 444.3
Cr2O3+Cutin 4x4 7748.9* ± 601.8 12308.0 ± 926.4 8349.8 ± 771.5 8779.4 ± 669.1 9x3 8784.9 ± 652.5 12005.0 ± 1019.7 8415.5 ± 857.3 8627.5 ± 1255.7 72h 12595.0* ± 595.0 13331.0 ± 987.0 9347.5* ± 1102.4 9145.7 ± 1109.0
Cr2O3+iNDF3 4x4 883.6 ± 450.2 11672.0 ± 994.9 7294.6 ± 399.5 7253.8 ± 300.7 9x3 9355.8 ± 335.0 11881.0 ± 559.5 6865.4 ± 292.9 8113.4 ± 380.8 72h 10797.0* ± 521.7 12441.0 ± 803.4 9436.4* ± 597.1 8221.2 ± 287.9
Cr2O3+iADF4 4x4 8676.7 ± 443.3 11892.0 ± 1000.1 7131.4 ± 400.4 7376.9 ± 317.4 9x3 9402.0 ± 357.3 11950.0 ± 555.0 7030.1 ± 268.9 8112.8 ± 409.0 72h 10806.0 ± 579.4 12452.0 ± 820.6 9443.3* ± 596.9 8303.1 ± 301.9
TiO2+ABL2 4x4 10817.0* ± 730.5 11578.0 ± 590.4 8326.0 ± 681.6 9489.9 ± 519.9 9x3 8595.1 ± 490.2 13753.0* ± 1023.5 8166.5 ± 439.6 11176.0* ± 969.1 72h 10512.0 ± 804.8 10771.0 ± 847.5 7563.3 ± 465.2 6070.7* ± 550.5
TiO2+Cutin 4x4 9117.7 ± 706.3 11451.0 ± 977.0 8635.7 ± 620.7 9903.0* ± 652.1 9x3 8511.4 ± 730.2 10830.0 ± 507.4 8878.5 ± 1781.3 9358.1 ± 1981.9 72h 12271.0* ± 720.6 14647.0* ± 1258.0 9948.4* ± 1606.1 9439.8 ± 1446.6
TiO2+iNDF3 4x4 10560.0 ± 675.0 11009.0 ± 500.5 7783.8 ± 465.0 8382.9 ± 437.8 9x3 9131.0 ± 552.6 11334.0 ± 595.3 7347.5 ± 561.9 9464.3 ± 800.2 72h 11212.0* ± 701.0 13815.0* ± 773.7 9617.7* ± 962.2 7759.6 ± 712.8
TiO2+iADF4 4x4 10404.0 ± 687.6 11264.0 ± 535.0 7622.5 ± 470.5 8533.4 ± 462.5 9x3 9179.2 ± 564.6 11407.0 ± 607.5 7514.5 ± 546.0 9454.4 ± 812.5 72h 11158.0* ± 671.4 13901.0* ± 807.4 9607.9* ± 950.1 7828.5 ± 710.8
RDMI 9328.5 ± 198.7 11921.0 ± 310.2 7597.8 ± 201.3 8126.1 ± 265.7 1 sampling procedure;
2 acetyl bromide lignin;
3 indigestible neutral detergent fiber;
4 indigestible acid
detergent fiber. Within columns, means followed by *, are significantly different from TTAD for diet according to contrast analysis (P<0.05).
73
Discussion
Fecal recovery of markers
Fecal recovery varied widely among markers and ranged from 0.71-0.83 for Cr2O3 to 1.30-1.57
for TiO2. No reports were found on the use of cutin as a marker in ruminant digestion studies
and therefore our data is novel to this field of research. Siqueira et al., (2009) used cutin as
DMD marker in horses consuming four different diets and observed FR around 1.51. The FR in
horses was very close to what was observed in this study. The interaction between the marker
molecule and digesta around it, will determine the retention time (TR) and passage rate (QP) of
the marker and ultimately affect what fraction of what is ingested will be excreted in feces over a
24-hour period. Njaa (1961) reported that mean FR less than one could be attributed to
inaccuracy of the analysis. A possible explanation for incomplete FR of internal markers is that
when vegetable cell walls are treated with cellulases, the components that ester-link ferulic or ρ-
coumaric acids to a hemicellulosic side chain of xylose and arabinose are released (MUELLER-
HARVEY et al., 1986). These soluble hemicellulosic complexes do not appear to be digestible;
they undergo precipitation on reaching gastric acidity in the lower tract and are recoverable in
feces (NEILSON and RICHARDS, 1978). Although the studies did not consider the possibility
that rumen bacteria might adapt, and metabolism of monomeric units has been reported
(FUKUSHIMA et al., 1991).
Several authors (KOTB and LUCKEY, 1972; FAHEY and JUNG, 1983) have long described the
properties of an ideal marker. Among them, one of the most important is to be totally recovered
in a 24-hour period. Many studies have been conducted over the last 3 decades using TiO2 and
the FR observed for it has been around 100%. Based on these findings the routinary use of
TiO2 in ruminal digestion trails has been suggested. Our findings do not support the established
concept that FR of TiO2 is 100%. The results of this study show that FR is higher than 100%
and varies between diets with different F:C ratio. These findings were contrary to those of
Brandt and Allam, (1987); Hafez et al., (1988) and Titgemeyer et al., (2001), who observed
mean FR for TiO2 of 0.96-0.99 in sheep and 0.96-1.02, 0.90-0.95 in dairy cattle, respectively.
Glindemann et al., (2009) found FR higher than 1 and attributed this to possible ingestion of soil
which contained TiO2 and therefore would increase the fecal concentration. Our diets were
composed of corn silage, hay and concentrates that were well preserved and packaged
correctly, so the risk of soil contamination is low.
Mean FR of Cr2O3 was lower than 100% in this study. Benvennuti et al., (2014) worked with
Brahman steers fed leafy or steamy grass hay and observed FR of 0.92 to 1.03. Since Cr2O3
74
has been widely used as a marker in digestions studies, various FR have been reported for it: in
horses FR ranged from 0.712 to 1.031 (OLIVEIRA et al., 2003; SIQUEIRA et al., 2009;
LANZETTA et al., 2009), in sheep from 0.80 to 0.92 (RODRIGUES et al., 2010), in dairy cattle
from 0.87 to 0.89 (DELAGARDE et al., 2010) and in steers from 0.85 to 1.05 (SAMPAIO et al.,
2011a,b). Paixão et al., (2007) fed Cr2O3 to steers and observed total fecal recovery of the
administered dose. Our results are not in accordance to their findings and suggest that Cr2O3 is
not completely recovered in feces when administered orally to steers fed corn silage and Tifton-
85 hay diets with different F:C ratios. For Cr2O3 to be used as a marker, it is necessary to
perform TCF on at least some of the animals to establish the FR.
This study measured lignin as ABL, a procedure in which no lignin loss occurs during sample
preparation and that is less subject to gravimetric errors because of its spectrophotometric
nature. Mean ABL FR ranged from 0.51 to 0.98 and was significantly different among forage
sources. These results suggest that fecal recovery of lignin is not stable therefore ABL would
not be a suitable marker. Further research is necessary to show how ABL can be applied to
ruminant nutrition studies and how appropriate an internal marker for estimating DMD it can be.
Indigestible neutral detergent and acid detergent fibers are two of the most extensively used
internal markers today. Mean FR ranging from 0.50 to 1.21 (BARROS et al., 2009; KOZLOSKY
et al., 2009; RODRIGUES et. al., 2010; SAMPAIO et al., 2011a and LEE and HRISTOV, 2013)
and from 0.80 to 1.21 (OLIVEIRA Jr. et al., 2004; RODRIGUES et. al., 2010; SAMPAIO et al.,
2011a) for iNDF and iADF, respectively. Oliveira et al., (2003) worked with horses and observed
FR of 1.08 to 1.34 and up to 1.54 for iNDF and iADF, respectively. In this study, mean FR for
iNDF and iADF were 0.72 to 1.06 and 0.80 to 1.17, respectively. For these two markers, both
forage source and F:C ratio had significant effect on FR. More so, the forage source versus F:C
ratio interaction had a tendency (P=0.071 and P=0.057, for iNDF and iADF, respectively) on
both markers. These results do not agree with previous findings of other authors that observed
or assumed complete FR for these internal markers. The disparity of results for different
experiments is, at least in part, due to differences in incubation time of the samples for obtaining
the fibrous fractions. Our study followed the procedure proposed by Krizsan and Huhtanen
(2013) who compared various incubation times (144h, 240h and 288h) and reported that at least
12 days (288h) of incubation were necessary to isolate the completely indigestible fiber pool in
feeds fed to dairy cows. The results in this study suggest that iNDF and iADF can be used as
internal markers for ruminant digestion studies, but FR must be determined by TFC, prior to or
during the experimental period.

75
Prediction of DMD based on fecal concentration of internal markers
All internal markers were able to produce accurate DMD estimates when compared to TTAD.
The indigestible fibers, iNDF and iADF, produced accurate estimates for all diets independently
of the fecal sampling procedure. However, values for DMD were under-estimated and differed
significantly from TTAD when the BULK 72h sampling procedure and ABL or cutin were used in
some diets. When fecal concentration was measured in GRAB samples, both markers produced
accurate DMD estimates in comparison to TTAD. Moreover, ABL was accurate with both GRAB
sampling procedures in all diets. These two molecules (lignin and cutin) are measured together
by some lignin analysis procedures. A possible explanation for the varying, inaccurate DMD
estimates produced by these two markers would be their low concentration in both the feed and
feces samples. Lower concentrations make chemical analysis less reliable because of
increased difficulty to detect differences in such small amounts of residue that are left behind for
weighing after the procedures are performed. In this study, lignin was measured as ABL and
thus gravimetric related issues would not be a problem. The cutin procedure that is being
proposed is gravimetric and subject to these limitations. After researching literature, nor ABL or
cutin (by the procedure being proposed) had ever been used in ruminant digestion studies and
therefore more research is necessary and worthwhile before discarding them as possible
internal markers.
Mean DMD estimates produced by iNDF and iADF fecal concentrations did not differ from TTAD
under any of the sampling procedures or diets. Detmann et al., (2001) reported more accurate
DMD estimates when using iNDF compared to iADF. Berchielli et al., (2005) reported conflicting
results when using these indigestible fractions, in response to the incubation procedure as was
mentioned before when discussing FR. With heifers fed fresh sugar-cane iNDF produced better
DMD estimates than iADF but, when corn silage was fed to dairy cows, iADF estimates were
more accurate than those of iNDF (FERREIRA et al., 2008). Our findings suggest that both
iNDF and iADF are suitable internal markers for estimating DMD under both BULK and GRAB
sampling procedures.
Prediction of FO based on fecal concentration of external markers
Both Cr2O3 and TiO2 were able to produce accurate FO estimates when compared to RFO
values in this study. Only under the 72h BULK sampling procedure, on the hay 60:40 diet was
the FO estimate not accurate. A tendency (P=0.074) was also observed on the silage 60:40 diet
when Cr2O3 was used to estimate FO. These differences could be explained by the significant
interaction between diet x forage source x F:C ratio that was observed for FO. Also, FR of Cr2O3

76
was incomplete which would lead to overestimation of FO. Estimates for FO derived from fecal
concentration of TiO2 were inaccurate for the hay 40:60 diet on BULK 72h sampling and for the
silage 60:40 diet on the GRAB 4x4 sampling procedure. Still, most of the FO estimates
produced by TiO2 were accurate even though the FR was 150% which should have resulted in
underestimation. When comparing Cr2O3 and TiO2 in steers, Titgemeyer et al., (2001) observed
that both markers significantly underestimated FO. Delagarde et al., (2010) reported accurate
FO estimates, derived both from BULK and GRAB sampling procedures, positively correlated to
RFO (R2 from 0.86 to 0.96) when using Cr2O3 as a marker in dairy cows. A more recent study
that fed Cr2O3 to steers, reported that FO estimates from GRAB samples significantly higher
that RFO (BENVENUTTI et al., 2014). Our results suggest that Cr2O3 and TiO2 can be used as
a marker for estimating FO in cattle. Our result show that GRAB sampling procedures produce
accurate FO estimates with these two external markers and therefore TFC is not strictly
necessary. Although, it is recommended that FR of markers is determined by trial TFC prior to
or concomitant with the study. Interestingly, the BULK 72h sampling procedure was the less
accurate among the procedures being studied. This procedure requires collecting all feces in a
24-hour period and then homogenizing the material to take a representative sample. The
process is not simple and therefore the concentration of markers in feces may vary, altering the
results. Error associated with homogenization of samples, will have greater impact on the BULK
sampling procedure because of the volume collected prior to sampling. The GRAB sampling
procedures on the other hand, do not have this problem because small quantities (150-500 g
max.) are usually completely used to make up the composite sample.
During the last decade or so TiO2 has received increasing attention by researchers in response
to the potential health threats that have been attributed to Cr2O3 (MYERS et al., 2006). Studies
have reported that FO estimates are overestimated, not significantly different from RFO
(TITGEMEYER et al., 2001) or underestimated (GLINDEMANN et al., 2009). The variety of
results appear to be caused by differences in FR which directly affects the FO estimates. In our
study, all but two, of the TiO2 derived FO estimates were not significantly different from RFO.
This was unexpected due to the high (140%) FR observed for this marker. Once again, this
shows the importance of TFC to have the “real” FR and correct fecal concentration values.
Prediction of DMI based on internal and external marker pairs
Estimates of DMI varied among marker pairs, sampling procedures and diets. All marker pairs
produced accurate DMI estimates, when compared to RDMI, but not under all fecal sampling
procedures. The Cr2O3+iNDF and Cr2O3+iADF marker pairs were the most accurate among

77
pairs which is consequent with the accurate DMD and FI estimates that the markers produced
individually. When iNDF and iADF were paired with TiO2, DMD estimates were accurate on the
GRAB sampling procedures but not for the BULK sampling procedure. This is similar to what
was observed for FO estimates from TiO2 and maybe be explained by the same difficulty of
obtaining representative samples from BULK samples.
Previous studies with TiO2 (TITGEMEYER et al., 2001) and Cr2O3 (RODRIGUES et al., 2006
and BENVENUTTI et al., 2014) observed that DMI estimates were lower than or equal to RDMI
for these markers, respectively. In their studies, the authors used each marker to estimate both
DMD and FO, and, from these values also estimate DMI. They reported as the main cause for
the inaccuracy of DMI estimates the FR different than 100% which resulted in under or over
estimation of FO. The higher the FR the lower FO estimates that will be obtained and vice-
versa. Given an accurate DMD estimate (or TTAD), if FO is underestimated then DMI will also
be lower than RDMI. The same thing happens when DMD is underestimated at a given FO (or
RFO). In our study, we observed FR different than 100% for all markers calculated from RFO.
Once fecal marker concentration was corrected for FR, accurate DMD and FO estimates were
obtained from internal and external markers, respectively. Accurate DMD and FO estimates led
to accurate DMI estimates for internal + external marker pairs. This highlights the importance of
performing FR trials prior to DMI experiments or having a representative group of animals to
determine FR simultaneously as a pasture based or collective housing experiment is conducted.
Conclusions
In young Nelore bulls fed corn silage or Tifton-85 hay based diets with varying F:C ratios, the
average FR of internal markers ABL, iNDF, iADF and cutin was different from 100%. Lower for
ABL, iNDF and iADF, and higher for cutin. After correction, iNDF and iADF produced accurate
DMD estimates under GRAB and BULK fecal sampling procedures. As long as RFO is
determined, these two markers are adequate to be used in ruminal digestion studies. External
markers Cr2O3 and TiO2 had FR lower and higher than 100%, respectively. As with internal
markers, the correction of fecal concentration by FR resulted in accurate FO estimates. These
two markers are also adequate for use in ruminant digestion studies, with preference being
given to Cr2O3, according to our results. Finally, the combination of internal and external
markers to estimate DMI produced satisfactory and accurate results and can definitely be
recommended for use in ruminant digestion studies. Preference is given to Cr2O3 based pairs
with iNDF and iADF. Internal markers ABL and cutin deserve more attention and further
research in order to better understand how they can be useful in ruminant nutrition studies.
78
GRAB sampling procedures yielded accurate DMD, FO and DMI estimates were as good as or
better than BULK sampling procedures. They are also much less invasive and labor demanding,
which make them an excellent alternative to the classical BULK sampling procedure from TFC.
The GRAB 4x4 daylight procedure can be adapted to various management practices like
milking and/or feeding schedules. GRAB sampling designs deserve more research in order to
propose new and better ones or to further validate the existing ones. The double marker
procedure is an available tool for ruminant nutrition studies that may be adopted by researchers,
to use in ruminant digestion trials.
Regardless of the fecal sampling method and the composition of the diet, it is necessary to
establish the FR of the markers to be used in each experiment, in order to obtain correct
estimates. Consistently throughout the experiments, FR was lower than and higher than unity
for internal and external markers, respectively. Corrected FO estimates were accurate for
Cr2O3 on various diets under GRAB sampling. The same was not true for TiO2, which even
after FR correction was applied failed to produce accurate FO estimates consistently. The
method of dosing the external markers has to allow the animals to display normal feeding
behavior and not affect performance. GRAB sampling procedures can replace TFC (once FR is
established) which will open new possibilities for pasture based or collectively housed animals.
Accurately knowing how much an animal eats under a given situation is a useful tool.

79
Final Remarks
None of the markers used in this study had stable FR after the 10 days of adaptation.
Consistently throughout the experiments, FR was lower than and higher than unity for internal
and external markers, respectively. Variation in fecal marker concentration was identified as the
major issue in regard to the accuracy of marker estimates. Regardless of the fecal sampling
method and the composition of the diet, it is necessary to establish the FR of the markers to be
used in each experiment, in order to obtain correct estimates. A short preliminary study can be
performed using one animal per experimental diet in order to determine FR. Once FR is
established, experiments can use a greater number of animals, housed in group or on pasture
and use different fecal GRAB sampling procedures because TFC is not necessary. Within each
laboratory, this information should be kept and organized, in order to create a FR log for the
markers used. This will allow comparison between diets and possible establishment of a
standard FR for markers in each laboratory conditions.
In spite of incomplete FR, corrected FO estimates were accurate for Cr2O3 on various diets
under GRAB sampling. The same was not true for TiO2, which even after FR correction was
applied failed to produce accurate FO estimates consistently. Various authors have reported
complete FR for TiO2 under diverse conditions. Our observations from two experiments where
TFC was performed do not support these statements. When FR of TiO2 is calculated from FO
estimates (like on experiment 2) in some cases FR does not differ from unity, but when it is
calculated from RFO obtained by TFC, FR is always higher than unity. Since it is legal to include
TiO2 in commercial diets and it is well known to the scientific community, more research with
TiO2 is important. Nonetheless, our observations do not support its use as an external marker
for estimating FO in ruminants. On the other hand, Cr2O3 can be used to estimate FO and
concomitantly with iADF to estimate DMI, as long as FR for both markers is determined by TFC
trial.
For internal markers, ABL, cutin, iNDF, and iADF the FR situation was similar to external
markers. None of the markers had complete FR consistently throughout the 3 experiments.
Cutin and ABL had lower than unity FR on all diets and failed to produce accurate DMD
estimates which resulted in innacurate DMI estimates when either one was paired with Cr2O3 or
TiO2. Of the indigestible fibers, iNDF and iADF, the later was more accurate in estimating DMI
when paired with Cr2O3. Still, iNDF produced accurate DMD estimates on different diets,
confirming its potential as an internal marker for ruminant studies.
80
From results of experiment 2 it is possible to infer that twice a day fecal GRAB sampling is not
enough to obtain a representative daily sample. These results varied greatly and DMI estimates
for all marker pairs were significantly different to RDMI measured by the Grow Safe® System.
Also from this experiment, we observed that the need to pass all animals through the chute,
twice a day for dosing external markers and fecal sampling, has a strong influence in feeding
behavior and therefore in animal performance. Although the method for dosing the animals
worked correctly, it should not be recommended because of the above observations. Less
invasive procedures, like mixing the external markers in the supplements should be given more
attention and be subject of study, since external marker dosing is probably the second major
issue for this type of studies. More research is necessary in this area and the development of
slow release capsules (formerly available) would greatly contribute to the task.
Limitations
Our study used 6 of the most commonly used markers today under different conditions. Still,
there are several other substances available that have been reported to work properly for
estimating DMI in ruminants. Of these substances, alcanes have been receiving major attention
and the published reports consistently support their use for ruminant digestion studies. Because
of budgetary issues, our study did not compare alcanes and conventional markers so no
conclusions can be drawn in regards to alcanes.
Take home messages
Marker technology for ruminant studies is available and widely documented. Although results
vary, data are useful enough to provide important information about DMD, FO and DMI. It is
necessary to determine real (TFC) FR for each marker that will be used. The method of dosing
the external markers has to allow the animals to display normal feeding behavior and not affect
performance. GRAB sampling procedures can replace TFC (once FR is established) which will
open new possibilities for pasture based or collectively housed animals. Obtaining accurate DMI
estimates will allow for better supplement formulation, more cost efficient feeding programs,
other ways of monitoring ruminal health and ultimately a better understanding of the ruminant
GIT. In a world where resources are becoming limited and where environmental concerns gain
political strength every day, it is important to improve economic efficiency of animal protein
production. Accurately knowing how much an animal eats under a given situation is a useful tool
for this purpose.
81
References
ASSOCIATION OF AMERICAN FEED CONRTOL OFFICIALS (AAFCO). Official Publication,
Atlanta, GA, 1996.
ASTIGARRAGA, L. Técnicas para la medición del consumo de rumiantes en pastoreo. In: Simpósio sobre avaliação de pastagens com animais, Maringá. Anais... p.1-23. Maringá: UEM, 1997.
BARBOSA, A. M. (2005). Período de coleta de urina e de fezes para avaliação da excreção
de creatinina, produção microbiana e digestibilidade aparente dos nutrientes em Nelore
(Doctoral dissertation, Universidade Federal de Viçosa).
BARROS, E. D., FONTES, C. D. A., DETMANN, E., VIEIRA, R. A. M., HENRIQUES, L. T.;
FERNANDES, A. M. Vícios na estimação da excreção fecal utilizando indicadores internos e
óxido crômico em ensaios de digestão com ruminantes. Revista Brasileira de Zootecnia, v.
38, no. 10, p. 2015-2020, 2009.
BENVENNUTI, M.A.; COATES, D. B.; BINDELLE, J.; POPPI, D. P.; GORDON, I. J. Can faecal
markers detect a short term reduction in forage intake by cattle? Animal Feed Science and
Technology, v. 194, p. 44–57, 2014.
BERCHIELLI, T.T.; ANDRADE, P.; FURLAN, C.L. Avaliação dos indicadores internos em
ensaios de digestibilidade. Revista Brasileira de Zootecnia, v.29, n.3, p.830-833, 2000.
BERCHIELLI, T.T.; OLIVEIRA, S.G.; GARCIA, A.V. Aplicação de técnicas para estudos de
ingestão, composição da dieta e digestibilidade. Archives of Veterinary Science, v.10, p.29-
40, 2005.
BERCHIELLI, T.T.; PIRES, A.V.; OLIVEIRA, S.G. Nutrição de Ruminantes. 2a edição.
Jaboticabal : Funep, 2011. 616p.
BOWMAN, J. G. P.; SOWELL, B. F. Delivery method and supplement consumption by grazing
ruminants: a review. Journal of Animal Science, v.75, p. 543-550, 1997.
BRANDT, M.; ALLAM, S. M. Analytik von Titandioxid im Darminhalt und Kot nach
Kjeldahlaufschluß. Archives of Animal Nutrition, v. 37, p. 453–454, 1987. .
BURNS, J. C.; POND, K. R.; FISHER, P. S. (1994). Measurement of forage intake. In: Forage
Quality, Evaluation and Utilization (Ed. G. C. FAHEY JR), PP. 494-532. Madison, WI.
BUXTON, D. R.; RUSSELL, J. R. Lignin constituents and cell-wall digestibility of grass and
legume stems. Crop Science, v. 28, n. 3, p. 553-558, May-Jun 1988.

82
CASALI, A.O.; DETMANN, E.; VALADARES FILHO, S.C.; PEREIRA, J.C.; HENRIQUES, L.T.;
FREITAS, S.G.; PAULINO, M.F. (2008). Influência do tempo de incubação e do tamanho de
partículas sobre os teores de compostos indigestíveis em alimentos e fezes bovinas obtidos por
procedimentos in situ. Revista Brasileira de Zootecnia, v.37, n.2, p.335-342.
CORBET, J. L. Measurement of forage intake of grazing animals. In: WHEELER, J. L.;
MOCHRIE, R. D. (Eds.). Forage Evaluation: Concepts and Techniques. Victoria: CSIRO,
1980. P. 287-298.
CRAMPTON, E. W. Weaknesses in feedstuff analysis. Feedstuffs, 1940, vol. 12, p. 16.
COSTA, L.T.; SILVA, F.F.; VELOSO, C.M.; PIRES, A.J.V.; ROCHA NETO, A.L.; MENDES,
F.B.L.; RODRIGUES, E.S.O.; SILVA, V.L. Análise econômica da adição de níveis crescentes
de concentrado em dietas para vacas leiteiras mestiças alimentadas com cana-de-açúcar.
Revista Brasileira de Zootecnia, v.11, n.5, p.1155-1162, 2011.
DECRUYENAERE, V.; BULDGEN, A.; STILMANT, D. Factors affecting intake by grazing
ruminants and related quantification methods: a review. Biotechnology, Agronomy and
Society and Environment, v.13, n. 4, p. 559-573, 2009.
DELAGARDE, R.; PEYRAUD, J. L.; DELABY, L. Influence of herbage allowance on intake and behavior of dairy cows grazing perennial ryegrass swards in autumn. In: Rook, A. J., Penning, P. D.(Eds.), Grazing Management ,Occasional Symposium No. 34. The British Grassland Society, UK, pp. 101–102, 2000.
DEMMENT, M. W,; VAN SOEST, P. J. (1985). A nutritional explanation for body-size patterns of
ruminant and non-ruminant herbivores. American Naturalist, v.125, p.641-672.
DETMANN, E.; PAULINO, M. F.; ZERVOUDAKIS, J. T.; VALADARES FILHO, S. D. C.;
EUCLYDES, R. F.; LANA, R. D. P.; QUEIROZ, D. D. (2001). Cromo e indicadores internos na
determinação do consumo de novilhos mestiços, suplementados, a pasto. Revista Brasileira
de Zootecnia, vol. 30, no 5, p, 1600-1609.
DETMANN, E.; SOUZA, A.L.; GARCIA, R.; VALADARES FILHO, S.C.; CABRAL, L.S.;
ZERVOUDAKIS, J.T. (2007). Avaliação do vício de "tempo longo" de indicadores internos em
ensaio de digestão com ruminantes. Arquivo Brasileiro de Medicina Veterinária e
Zootecnia, 59(1), 182-188.
DETMANN, E.; ZERVOUDAKIS, J.T.; CABRAL, L.S.; JUNIOR, V. R. R.; VALADARES FILHO,
S. C.; QUEIROZ, A. C.; PONCIANO, N. J.; MAGNO, F. A. Validação de equações preditivas da
fração indigestível da fibra em detergente neutro em gramíneas tropicais. Revista Brasileira
de Zootecnia, v.33, n.6, p.1866-1875, 2004.
DIAS, R. S.; PATINO, H. O.; LOPEZ, S.; PRATES, E.; SWANSON, K. C.; FRANCE, J.
Relationship between chewing behavior, digestibility, and digesta kinetics in steers fed oat hay
at restricted and ad libitum intakes. Journal of Animal Science, v. 89, p. 1873-1880, 2014.

83
EDIRISINGHE, A.; CLARK, D.; WAUGH, D. (2012) Spatio-temporal modelling of biomass of
intensively grazed perennial dairy pastures using multispectral remote sensing. International
Journal of Applied Earth Observation and Geoinformation, v.16, p. 5-16.
ELLIS, W.C.; MATIS, J.H.; HILL, T.M. et al. Methodology for estimating digestion and passage
kinetics of forage. In: FAHEY JR., G.C., MOSER, L.E., MERTENS, D.R., et al. (Eds.) National
Conference on Forage Quality, Evaluation, and Utilization. Madison: Soil Science Society of
America. 1994. p.682-756.
FAHEY, G. C.; JUNG, H. G. Lignin as a marker in digestion studies: a review. Journal of
Animal Science, v.57, n.1, p. 220-225, 1983.
FAHEY Jr, G.C.; McLAREN, G. A.; WILLIAMS, J. E. (1979). Lignin digestibility by lambs fed
both low quality and high quality roughages. Journal of Animal Science, 48:941.
FERREIRA M. A.; VALADARES FILHO, S. C.; MARCONDES, M. I. et al. Consumo Individual
de Matéria Seca Estimado em Bovinos de Corte e Leite Alimentados em Grupos. 1. Avaliação
de Indicadores. Revista Brasileira de Zootecnia, 2008.
FORBES, J. M. A personal view of how ruminant animals control their intake and Choice of
food: minimal total discomfort. Nutrition Research Reviews, v.20, p. 132-146, 2007.
FORBES, J. M. Conceitos sobre o consumo voluntário e seleção de dieta com referência
especial aos animais domésticos. In: VIEIRA, S. L. et al., (1a Ed.). Consumo e preferência
alimentar dos animais domesticos. Londrina: Phytobiotics Brasil, 2010. p. 315.
FRIEND, T. H.; POLAN, C. E. Social rank, feeding behavior and free stall utilization by dairy
cattle. Journal of Animal Science, v.57, n. 4, p. 1214-1224, 1974.
FROIDMONT, E.; BONNET, M.; OGER, R.; DECRUYENAERE, V.; ROMNÉE, J.; BECKERS,
Y.; BARTIAUX-THILL, N. Influence of the grinding level and extrusion on the nutritional value of
lupin seed (Lupinus albus) for cattle in the context of the Dutch protein evaluation system.
Animal Feed Science and Technology, 2008, no.142, p. 59-73.
FUKUSHIMA, R. S.; DEHORITY, B. A.; LOERCH, S. C. Modification of colorimetric analysis for
lignin and its use in studying the inhibitory effects of lignin on forage digestion by ruminal
microorganisms. Journal of Animal Science, v. 69, no. 1, p. 295-304, 1991.
FUKUSHIMA, R. S.; HATFIELD, R. D. Extraction and isolation of lignin for utilization as a
standard to determine lignin concentration using the acetyl bromide spectrophotometric method.
Journal of Agricultural and Food Chemistry, v. 49, n. 7, p. 3133-3139, Jul. 2001. ISSN 0021-
8561.
FUKUSHIMA, R. S.; KERLEY, M. S. Use of lignin extracted from different plant sources as
standards in the spectrophotometric acetyl bromide lignin method. Journal of Agricultural and
Food Chemistry, v. 59, n. 8, p. 3505-3509, Apr. 27 2011.

84
FUKUSHIMA, R. S.; KERLEY, M. S.; RAMOS, M. H.; PORTER, J. H.; KALLENBACH, R. L.
Comparison of acetyl bromide lignin with acid detergent lignin and Klason lignin and correlation
with in vitro forage digestibiity. Journal of Feed Science and Technlogy, v.201, p. 25-37,
2015.
GARDNER, A.L. Técnicas de pesquisa em pastagens e aplicabilidade de resultados em
sistemas de produção. Brasília: IICA/Embrapa CNPGL, 1986. 197p. (Série Publicações
Miscelâneas, 634).
GLINDEMANN, T.; TAS, B.M.; WANG, C.; ALVERS, S.; SUSENBETH, A. Evaluation of titanium
dioxide as an inert marker for estimating faecal excretion in grazing sheep. Animal Feed
Science and Technology, v.152, p.186-197, 2009.
GOACHET, A. G.; PHILIPPEAU, C.; VARLOUD, M.; JULIAND, V. Adaptations to standard
approaches for measuring total tract apparent digestibility and gastro-intestinal retention time in
horses in training. Animal Feed Science and Technology, v. 152, n. 1-2, p. 141-151, 2009.
GRANER, C.A.F. Determinação do crômio pelo método colorimétrico da σ-
difenilcarbazida. 1972. 112f. Dissertação (Mestrado em Zootecnia) – Faculdade de Ciências
Médicas e Biológicas/Universidade Estadual Paulista, Botucatu.
GRANT, R. J.; ALBRIGHT, J. L. Feeding behavior and management factors during the transition
period in dairy cattle. Journal of Animal Science, v.73, n. 9, p. 543-550, 1995.
HAFEZ, S.; JUNGE, W.; KALM, E. Schatzung der verdaulichkeit mit einer indicator-methode bei
milchkuhen im vergleich zum hohenheimer-futterwert-test. Arch. Tierernahr, v. 38, p. 929-945,
1988.
HORN, F. P.; MILLER, G. E. (1979). Bovine boots: a new research tool. Oklahoma
Agricultural Research Station Miscellaneous Publication, MP-104, p. 44-46.
JANK, L.; VALLE, C. D.; RESENDE, R. M. S.; McGILLOWAY, D. A. (2005). Grass and forage
plant improvement in the tropics and sub-tropics. Grassland: a global resource. Wageningen:
Wageningen Academic Publishers, 69-81.
KIMURA, F.T.; MÜLLER, V.L. Improved determination of chromic oxide in cal feed and feces.
Journal of Agricultural and Food Chemistry, v.5, n.2, p.216, 1957.
KONDO, T.; MIZUNO, K.; KATO, T. Some characteristics of forage plant lignin. Jarq-Japan
Agricultural Research Quarterly, v. 21, n. 1, Jul. 1987. ISSN 0021-3551.
KOTB, A. R.; LUCKEY, T. D. (1972). Markers in nutrition. Nutrition Abstracts and Reviews,
v.42, p. 813-845.
85
KOZLOSKI, G. V.; MESQUITA, F. R.; ALVES T. P.; CASTAGNINO, D. S.; STEFANELLO, C.
M.; SANCHEZ, L. M. D. Avaliação do uso de frações indigestíveis do alimento como
indicadores internos de digestibilidade em ovinos. Revista Brasileira de Zootecnia, v.38, n.9,
p.1819-1823, 2009.
KRIZAN, S. J.; HUHTANEN, P. (2013). Effect of diet composition and incubation time on feed
indigestible neutral detergent fiber concentration in dairy cows. Journal of Dairy Science, vol.
96, no. 3, p. 1715-1726.
LANGLANDS, J. P.; CORBETT, J. L.; McDONALD, I.; REID, G. W. (1963). Estimation of the
faeces output of ǵrazinǵ animals from the concentration of chromium sesquioxide in a sample of
faeces. British Journal of Nutrition, 17, pp 211-218.
LANZETTA, V.A.S.; REZENDE, A.S.C. et al. Validation of Lipe™ as method to evaluate the
apparent digestibility of nutrients in equines. Revista Brasileira de Zootecnia, v.38, n.1, p.69-
74, 2009.
LE DU, Y. L. P.; PENNING, P. D. (1982). Animal based techniques for estimating herbage
intake. In: LEAVER, J. D. (Ed.), Herbage Intake Handbook. British Grassland Society,
Reading, UK, pp. 37-75.
LEE, C.; HRISTOV, A. N. Short communication: Evaluation of acid-insoluble ash and
indigestible neutral detergent fiber as total-tract digestibility markers in dairy cows fed corn-
silage based diets. Journal of Dairy Science, v. 96, n. 8, p. 5295-5299, 2013.
LIPPKE, H. Estimation of forage intake by ruminants on pasture. Crop Science, v. 42, n. 3, p.
869-872, 2002.
LOWRY, J. B.; CONLAN, L. L.; SCHLINK, A. C.; McSWEENEY, C. S. Acid detergent
dispersible lignin in tropical grasses. Journal of the Science of Food and Agriculture, v. 65,
n. 1, p. 41-49, May 1994.
LUGINBUHL, J. M.; POND, K. R.; BURNS, J. C. Changes in ruminal and fecal particle weight
distribution of steers fed coastal Bermuda grass hay at four levels. Journal of Animal Science,
v.68, p. 2864–2873, 1990.
MERCHEN, N. R. Digestion, absortion and excretion in ruminants. In: CHURCH, D. C. (Ed).
The ruminant animal digestive physiology and nutrition. 4.ed. Carvallis: O&B Books. 1993,
p. 172-201.
MERTENS, D. Gravimetric determination of amylase-treated neutral detergent fiber in feeds
with refluxing in beakers or crucibles: collaborative study. Journal of AOAC International, v.
85, n. 6, p. 1217-1240, 2002.

86
MUELLER-HARVEY, I; HARTLEY, R. D. Linkage of p-coumaroyl and feruloyl groups to cell-wall
polysaccharides of barley straw. Carbohydrate Research, v. 148, n. 1, p. 71-85, 1986.
MYERS, W. D.; LUDDEN, P. A.; NAYIGIHUGU, V.; HESS, B. W. Thecnical Note: a procedure
for the preparation and quantitative analysis of samples for titanium dioxide. Journal of Animal
Science, v. 82, n. 1, p.179-183, 2004.
MYERS, W. D.; LUDDEN, P. A.; NAYIGIHUGU, V.; HESS, B. W. Excretion patterns of titanium
dioxide and chromic oxide in duodenal digesta and feces of ewews. Small Ruminant
Research, v. 63, n. 1-2, p. 135-141, 2006.
NATIONAL RESEARCH COUNCIL - NRC. Nutritional requirements of dairy cattle. 6.ed.
Washington, D.C.: National Academy Press, 1989. 157p.
NEILSON, M. J.; GEOFFREY, N. R. The fate of the soluble lignin-carbohydrate complex
produced in the bovine rumen. Journal of the Science of Food and Agriculture, v. 29, no. 6,
p. 513-519, 1978.
NJAA, L. R. Determination of protein digestibility with titanium dioxide as indicator substance.
Acta Agriculturae Scandinavica, v. 11, n. 3-4, p. 227-241, 1961.
OLIVEIRA, CAA.; ALMEIDA, F. Q.; VALADARES FILHO, S. C.; VIEIRA, A. A.; ALMEIDA, M. I.
V.; CORASSA, A.; LOPES, B. A.; MACEDO, R. Estimativa da digestibilidade aparente de
nutrientes em dietas para equinos com uso de oxido crômico e indicadores internos. Revista
Brasileira de Zootecnia, v. 32, no. 6, p. 1681-1689, 2003.
OLIVEIRA JÚNIOR, R. C.; PIRES, A. V.; FERNANDES, J. J. R.; SUSIN, I.; SANTOS, F. A. P.;
NASCIMENTO FILHO, V. F.; ARAUJO, F. C. Avaliação de marcadores para estimar a
digestibilidade dos nutrientes em novilhos nelore alimentados com dietas contendo alto teor de
concentrado e fontes nitrogenadas. Revista Brasileira de Zootecnia, v. 3, p. 749-758, 2004.
OWENS, F. N.; HANSON, C. F. External and internal markers for appraising site and extent of
digestion in ruminants. Journal of Dairy Science, 1992, vol. 75, no 9, p. 2605-2617.
PAIXÃO, M. L.; FILHO, S. D. C. V.; LEÃO, M. I.; CECON, P. R.; MARCONDES, M. I.; SILVA, P.
A.; PINA, M. G. D. S. (2007). Variação diária na excreção de indicadores interno (FDAi) e
externo. Revista Brasileira de Zootecnia, vol. 36, no 3, p. 739-747.
PENNING, P.D. Animal-based techniques for estimating herbage intake. In: PENNING, P.D.
(Ed.). Herbage Intake Handbook. 2ed. Reading, UK: The British Grassland Society, 2ed. p.53-
94. 2004.
PENNING, P.D., JONHSON, R.H. 1983. The use of internal markers to estimate herbage
digestibility and intake. 2. Indigestible acid insoluble fiber. Journal of Agricultural Science,
v.100:1, p. 133-138.
87
PIAGGIO, L.M.; PRATES, E.R.; PIRES, F.F. et al. Avaliação das cinzas insolúveis em ácido,
fibra em detergente ácido indigestível e lignina em detergente ácido indigestível como
indicadores internos da digestibilidade. Revista Brasileira de Zootecnia, v.20, n.2, p.306-312,
1991.
POPPI, D. P. (1996). Predictions of food intake in ruminants from analyses of food composition.
Australian Journal of Agriculture Research, v.47, p. 489–504.
POPPI, D.P.; HUGHES, T.P.; L'HUILLIER, P.J. Intake of pasture by grazing ruminants. In:
NICOL, A.M. (Ed.) Livestock feeding at pasture. Hamilton: New Zealand Society of Animal
Production, 1987. p.55-64. (Occasional publication, 10).
POPPI, D. P.; MINSON, D. J.; TERNOUTH, J. H. Studies of cattle and sheep eating leaf and stem fractions of grasses. 1. The voluntary intake, digestibility and retention time in the reticulo-rumen. Crop and Pasture Science, v. 32, n. 1, p. 99-108, 1981a.
POPPI, D. P.; MINSON, D. J.; TERNOUTH, J. H. Studies of cattle and sheep eating leaf and stem fractions of grasses. 3. The retention time in the rumen of large feed particles. Crop and Pasture Science, v. 32, n. 1, p. 123-137, 1981b.
PORTER, A.; SINGLETON, A. G. (1971). The degradation of lignin and quantitative aspects of
ruminant digestion. British Journal of Nutrition, 25:3.
PRIGGE, E. C.; VARGA, G. A.; VICINI, J. L. et al. Comparison of ytterbium chloride and
sesquioxide as fecal indicators. Journal of Animal Science, v.53, p. 1629-1633, 1981.
RODRIGUES, P. H. M.; GOMES, R. C.; SIQUEIRA, R. F. et al. Acurácia, precisão e robustez
das estimativas da dihgestibilidade aparente da matéria seca determinada com o uso de
indicadores em ovinos. Revista Brasileira de Zootecnia. V.39, p. 1118-1126, 2010.
SAMPAIO, C.B.; DETMANN, E.; VALENTE, T.N.P.; SOUZA, M. A.; VALADARES FILHO, S. C.;
PAULINO, M. F. Evaluation of fecal recovering and long term bias of internal and external
markers in a digestion assay with cattle. Revista Brasileira de Zootecnia, v.40, p.174-182,
(2011a).
SAMPAIO, C. B.; DETMANN, E.; VALENTE, T. N. P.; COSTA, V. A. C.; VALADARES FILHO,
S. C.; QUEIROZ, A. C. Fecal excretion patterns and short term bias of internal and external
markers in a digestion assay with cattle. Revista Brasileira de Zootecnia, 40(3), 657-665,
(2011b).
SCHNEIDER, B. H.; FLATT, W. P. (1975). The evaluation of feeds through digestibility
experiments. Athens: The University of Georgia Press. 1975. 422p.

88
SILVA, L. D. F.; EZEQUIEL, J. M. B.; AZEVEDO, P. S. CATTELAN, J. W. ; RIBEIRO, E. L. A.;
ROCHA, M. A.; CASTRO, V. S.; MENDES, A. R. Uso da cutina na estimativa das digestões
total e parcial de alguns componentes de rações contendo diferentes fontes de nitrogênio, em
bovinos. Revista Brasileira de Zootecnia. v. 35, n 2, p.600-606, 2006.
SILVA, R.R.; MAGALHÃES, A.F.; CARVALHO, G.G.P.; SILVA, F. F.; PRADO, I. N.; FRANCO,
I.L.; VELOSO, C.M.; CHAVES, M.A. Comportamento ingestivo de novilhas mestiças de
holandês suplementadas em pastejo de brachiaria decumbes. Aspectos metodológicos.
Revista Electrónica de Veterinaria, v.5, n.10, p.1-7, 2004.
SIQUEIRA, R. F.; GOMES, R. C.; RODRIGUES, P. H.; FUKUSHIMA, R. S.; GOBESSO, A. A.
Uso da cutina na estimativa da digestibilidade aparente de dietas para equinos; Use of cutin for
determining apparent digestibility of diets for horses. Arquivos Brasileiro de Medicina
Veterinaria e Zootecnia, vol. 61, no 6, p. 1373-1381, (2009).
SMITH, H. J.; TAWEEL, H. Z.; TAM, B.M. et al. Comparison of techniques for estimating
herbage intake of grazing dairy cows. Journal of Dairy Science, v.88, n. 5, p. 1827-1836,
2005.
STATISTICAL ANALYSIS SYSTEM INSTITUTE - SAS. Statistical analysis user’s guide.
Version 8.2. Cary, 2001. 1686p.
THONNEY, M. L.; DUHAIME, D. J.; MOE, P. W. et al. Acid insoluble ash and permanganate
lignin as indicators to determine digestibility of cattle rations. Journal of Animal Science, v.49,
n. 4, p. 112-146. 1979.
TITGEMEYER, E. C. Design and interpretation of nutrient digestion studies. Journal of Animal
Science, 1997, vol. 75, no 8, p. 2235-2247.
TITGEMEYER, E. C.; ARMENDARIZ, C. K.; BINDEL, D. J. et al. Evaluation of titanium dioxide
as a digestibility marker for cattle. Journal of Animal Science, v. 79, n. 4, p. 1059-1063, 2001.
VALADARES FILHO, S.C.; PAULINO, P.V.R.; DETMANN, E. et al. Exigências nutricionais de
zebuínos e tabelas de composição de alimentos BR-CORTE. Viçosa:UFV, DZO, 1ªed.,
2010, (142p.)
VALADARES FILHO, S.C.; PAULINO, P.V.R.; DETMANN, E. et al. Exigências nutricionais de
zebuínos no Brasil: I. Energia. In: VALADARES FILHO, S.C.; PAULINO, P.V.R.; MAGALHÃES,
K.A. Exigências nutricionais de zebuínos e tabelas de composição de alimentos BR-
Corte. Viçosa: UFV, 2006. 142p.
VAN SOEST, P.J. Nutritional Ecology of the Ruminant. 2ed. New York: Cornell University
Press, 1994. 476p.

89
VAN SOEST, P. J.; ROBERTSON, J. B Analysis of forages and fibrous foods. Ithaca: Cornell
University, 1985. 202p..
VANSOEST, P. J.; ROBERTSON, J. B.; LEWIS, B. A. Methods for dietary fiber, neutral
detergent fiber, and nonstarch polysaccharides in relation to animal nutrition. Journal of Dairy
Science, v. 74, n. 10, p. 3583-3597, Oct 1991.