ABAMEC* Presentation Rio de Janeiro and São Paulo November 2002 * Brazilian Analysts Association.
38
ABAMEC* Presentation Rio de Janeiro and São Paulo November 2002 * Brazilian Analysts Association
-
Upload
stella-daniel -
Category
Documents
-
view
214 -
download
0
Transcript of ABAMEC* Presentation Rio de Janeiro and São Paulo November 2002 * Brazilian Analysts Association.
ABAMEC* Presentation Rio de Janeiro and São Paulo
November 2002
* Brazilian Analysts Association
2
Part I
Corporate Structure

3
CORPORATE STRUCTURE
TELE NORTE LESTE
PARTICIPAÇÕES S.A
79.0% 18.7%
CONTAXCONTAX
TELEMAR PARTICIPAÇÕES
S.A.*
TELEMAR PARTICIPAÇÕES
S.A.*
TELEMARNorte LesteTELEMAR
Norte Leste
Treasury
79.5%
FREE FLOATFREE FLOAT
19.0%
Treasury
*53% of TNE Voting Shares ** Wholly owned subsidiary
FREE FLOATFREE FLOAT
2.3%
1.6%
** **
4
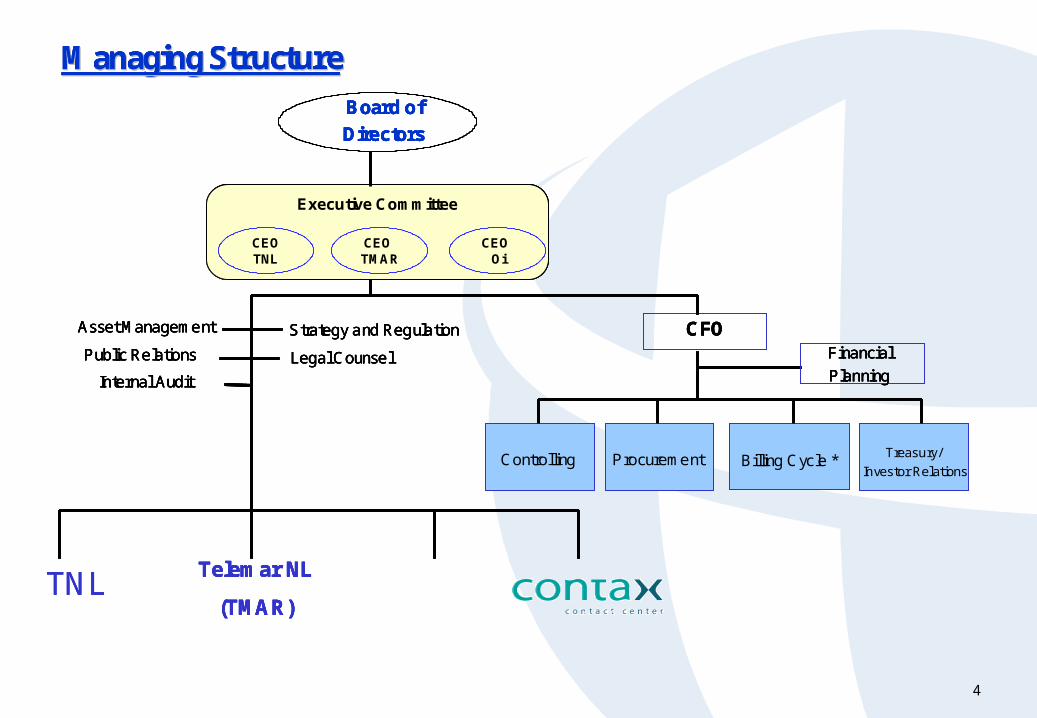
Managing StructureManaging Structure
Board of
Directors
Executive Committee
Controlling Procurement
CFO
Internal Audit
Strategy and Regulation
Legal Counsel Financial
Planning
Asset Management
Public Relations
CEOTNL
CEO TMAR
CEOOi
Billing Cycle *
Telemar NL
(TMAR)
Treasury/
Investor Relations
TNL
Managing StructureManaging Structure
Board of
Directors
Executive Committee
Controlling Procurement
CFO
Internal Audit
Strategy and Regulation
Legal Counsel Financial
Planning
Asset Management
Public Relations
CEOTNL
CEO TMAR
CEOOi
Billing Cycle *
Telemar NL
(TMAR)
Treasury/
Investor Relations
Managing StructureManaging Structure
Board of
Directors
Executive Committee
Controlling Procurement
CFO
Internal Audit
Strategy and Regulation
Legal Counsel Financial
Planning
Asset Management
Public Relations
CEOTNL
CEO TMAR
CEOOi
Billing Cycle *
Telemar NL
(TMAR)
Managing StructureManaging Structure
Board of
Directors
Executive Committee
Controlling Procurement
CFO
Internal Audit
Strategy and Regulation
Legal Counsel Financial
Planning
Asset Management
Public Relations
CEOTNL
CEO TMAR
CEOOi
Billing Cycle *
Telemar NL
(TMAR)
Treasury/
Investor Relations
TNL
5
Part II
TELEMAR NORTE LESTE
6
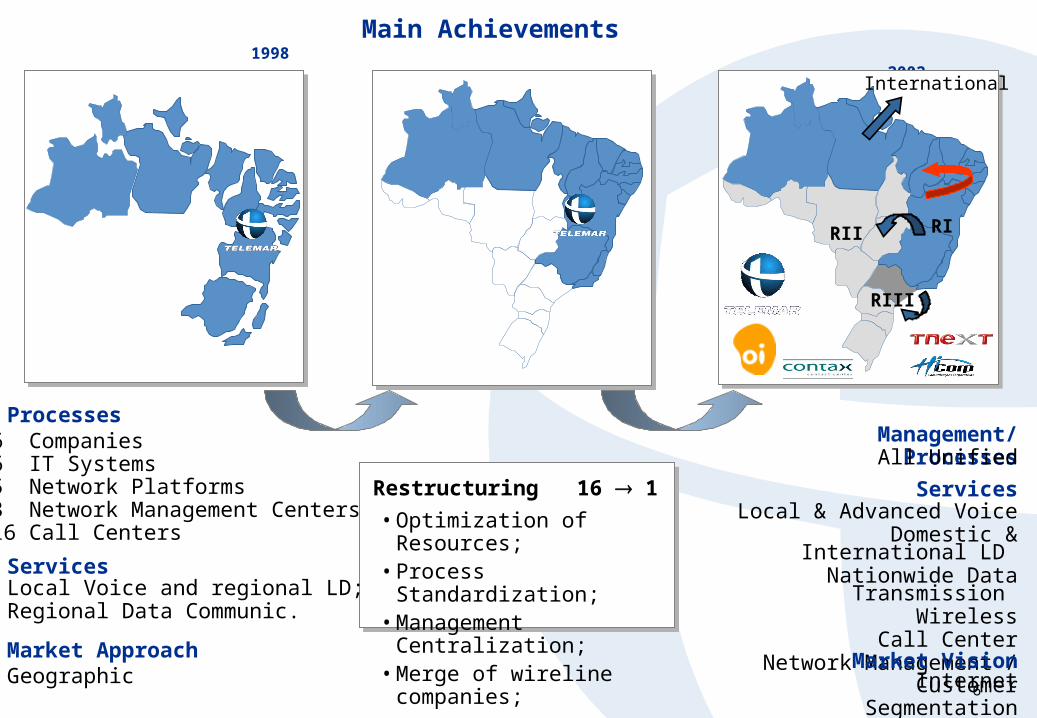
Main Achievements 1998 2002
Processes
Services
Market Approach
• Optimization of Resources;• Process Standardization;• Management Centralization;• Merge of wireline companies;
Restructuring 16 1
16 Companies 16 IT Systems 15 Network Platforms23 Network Management Centers116 Call Centers
Local Voice and regional LD;Regional Data Communic.
Geographic
Local & Advanced VoiceDomestic & International LD
Nationwide Data Transmission Wireless
Call CenterNetwork Management / Internet
Management/Processes
Services
Market VisionCustomer Segmentation
All Unified
International
RIII
RIRII

7
PLATFORM GROWTH – TMARMillion Lines in Service
+106%
7.27.8
9.7
11.8
14.8 14.615.1
Jul/98 1998 1999 2000 2001 Sep_01 Sep_02

8
+97%
* 1998, 1999 and 2000 refer to the Consolidated statement
6,946
5,158
8,433
6,222
10,851
8,127
13,687
10,133 9,997
7,391
11,573
8,516
1998* 1999* 2000* 2001 9M01 9M02
Gross Revenue Net Revenue
11,465
8,480
REVENUE GROWTH - TMARR$ Millions
9
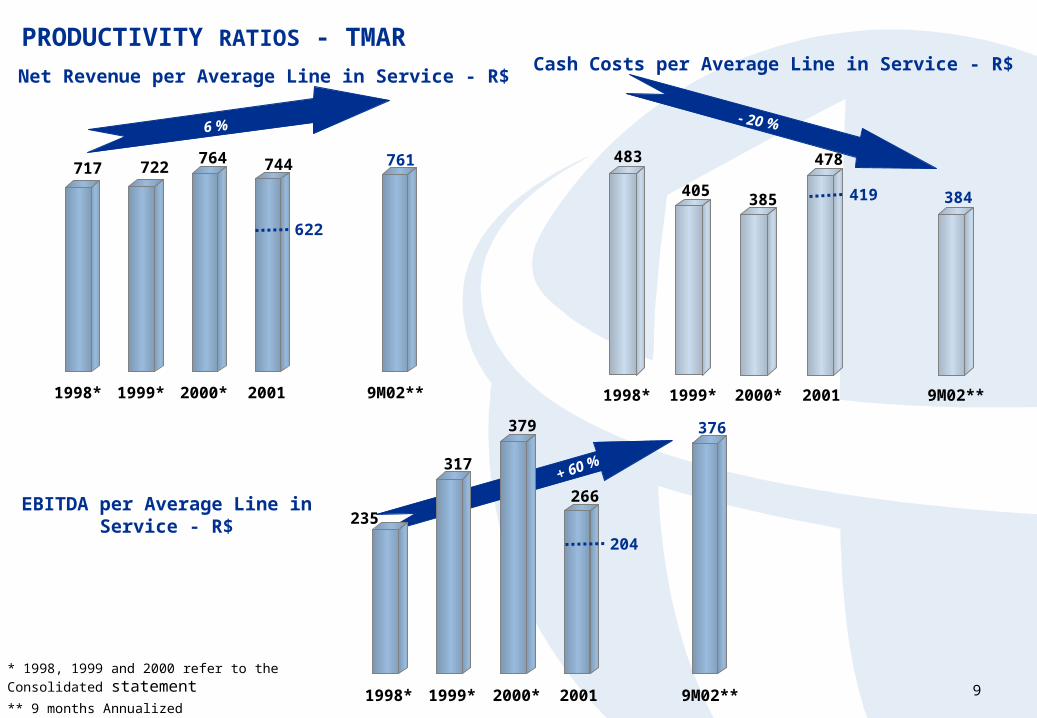
+ 60 %
6 %- 20 %
717 722764 744 761
1998* 1999* 2000* 2001 9M02**
483
405385
478
384
1998* 1999* 2000* 2001 9M02**
235
317
379
266
376
1998* 1999* 2000* 2001 9M02**
419
204
622
* 1998, 1999 and 2000 refer to the Consolidated statement** 9 months Annualized
EBITDA per Average Line in Service - R$
PRODUCTIVITY RATIOS - TMAR
Net Revenue per Average Line in Service - R$Cash Costs per Average Line in Service - R$

10
+ 342 %
322 397560
984
614
1,423
1998* 1999* 2000* 2001 9M01 9M02
+ 402 %
213255
385
673
1,069
1998* 1999* 2000* 2001 9M02**
70112
191
241
529
1998* 1999* 2000* 2001 9M02 **
184
563
+ 657 %
* 1998, 1999 and 2000 refer to the Consolidated statement** 9 months Annualized
EBITDA / Employee
(R$ Thousands)
EMPLOYEE PRODUCTIVITY - TMAR
Lines in Service / Employee
(R$ Thousands)
Net Revenue / Employee
(R$ Thousands)

11
CONSOLIDATED CAPEX - TNLR$ Millions
5 years R$ 19.0 bn
or US$ 9.6 bn
2,500 2,244 2,804
7,888
2,172
632702
1998 1999 2000 2001 9M02
Wireline Wireless
10,060
1,334

12
MANAGEMENT MODEL – MAIN PILLARS
Financial Management
Suppliers Management
Personnel Management
• Detailed Capex planning, cost and revenue matrix plan.• Strong cost control.• Strong budget control, focusing on return on investment/EVA.
• Meritocracy is key.• Talent management and retention of key personnel.• Culture based on corporate values and results oriented.• Formation of leaders and winning teams.• Quality management.• Strategic use of internal communication.
• Redesign of supply contracts, including quality and performance targets.
• Reduction of the supplier base and centralized management.• Development of strategic suppliers.• Outsoursing of non-core activities (call center, etc).• Consolidation of network technologies.
Corporate Management
• Specific targets broken-down to all management levels.• Monthly evaluation.• Simple structure with few hierarchic levels.• Redesign and standardization of key processes.• Variable remuneration based on achievement of targets.• Thematic decision making Committees.
13
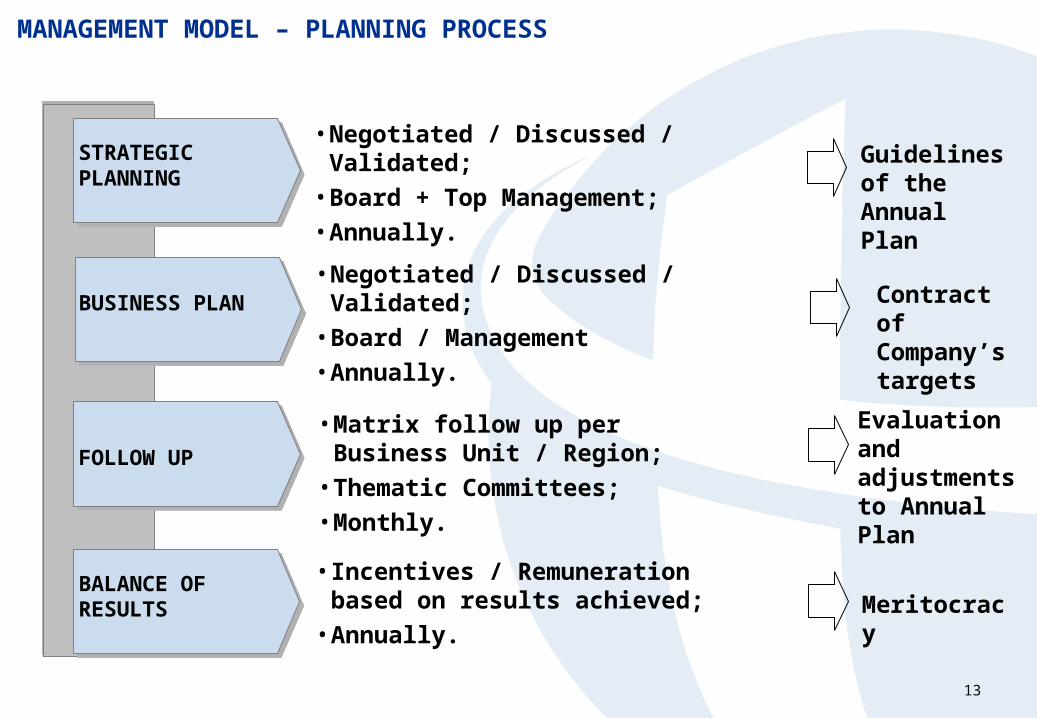
MANAGEMENT MODEL – PLANNING PROCESS
STRATEGIC PLANNING
FOLLOW UP
BUSINESS PLAN
• Negotiated / Discussed / Validated;
• Board + Top Management;
• Annually.
• Negotiated / Discussed / Validated;
• Board / Management
• Annually.
• Matrix follow up per Business Unit / Region;
• Thematic Committees;
• Monthly.
BALANCE OF RESULTS
• Incentives / Remuneration based on results achieved;
• Annually.
Guidelines of the Annual Plan
Contract of Company’s targets
Evaluation and adjustments to Annual Plan
Meritocracy
14
Part III
Achievements and Challenges
16
Achievements
Better than expected launching of a huge GSM startup;
Launching of a new brand, with a strong appeal to life style, with a different proposition to the market; cellular treated as a personal consumer product, instead of a telecommunication product;
500,000 clients in three months attracted by innovative marketing campaigns;
First GSM company in Brazil, with advantages in relation to incumbents such as worldwide handset scale, higher flexibility and security to customer, more sophisticated products and services;
Focus on innovative products and services (voice and data).
17
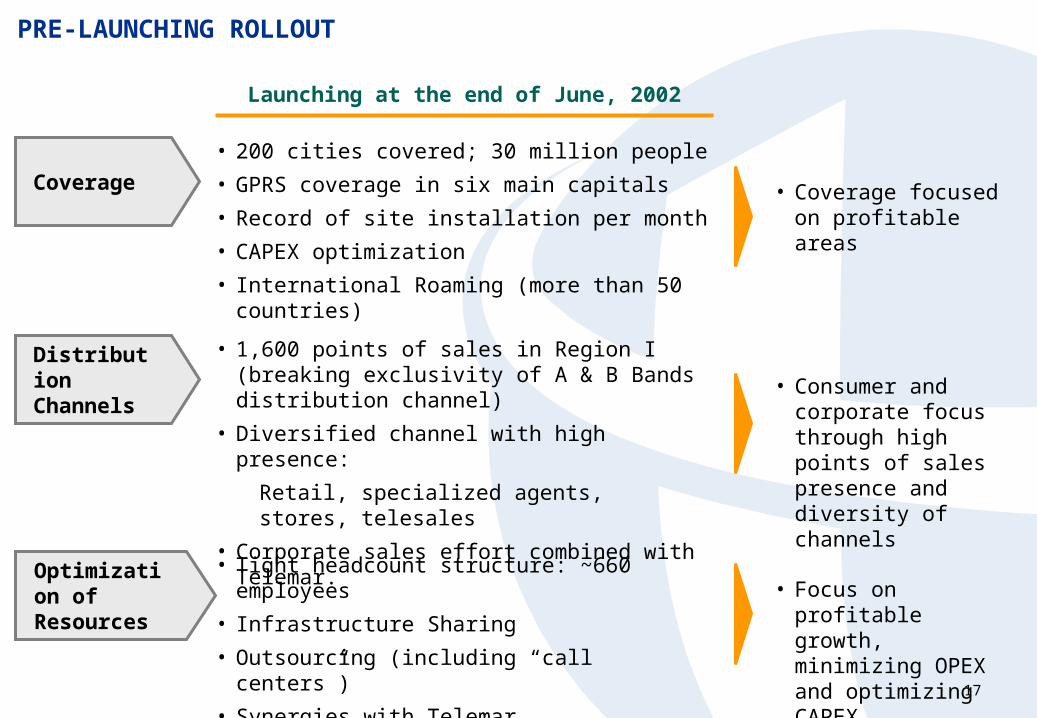
PRE-LAUNCHING ROLLOUT
Launching at the end of June, 2002
Coverage
• 200 cities covered; 30 million people
• GPRS coverage in six main capitals
• Record of site installation per month
• CAPEX optimization
• International Roaming (more than 50 countries)
• Coverage focused on profitable areas
Distribution Channels
• 1,600 points of sales in Region I (breaking exclusivity of A & B Bands distribution channel)
• Diversified channel with high presence:
Retail, specialized agents, stores, telesales
• Corporate sales effort combined with Telemar.
• Consumer and corporate focus through high points of sales presence and diversity of channels
Optimization of Resources
• Tight headcount structure: ~660 employees
• Infrastructure Sharing
• Outsourcing (including “call centers”)
• Synergies with Telemar.
• Focus on profitable growth, minimizing OPEX and optimizing CAPEX
18
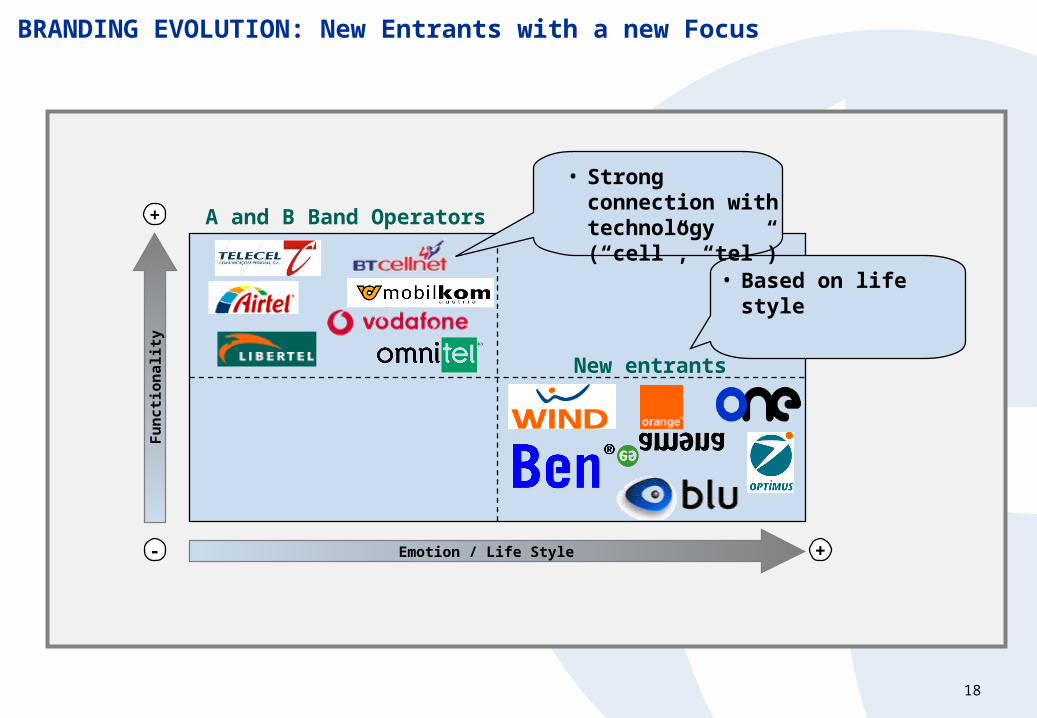
BRANDING EVOLUTION: New Entrants with a new Focus
Fu
nct
ion
alit
y
Emotion / Life Style-
+
+
A and B Band Operators
New entrants
• Strong connection with technology (“cell”, “tel”)
• Based on life style

19
Oi BRANDING
Instead of emphasizing Tel and Cell... ... focused on goods and emotions
20
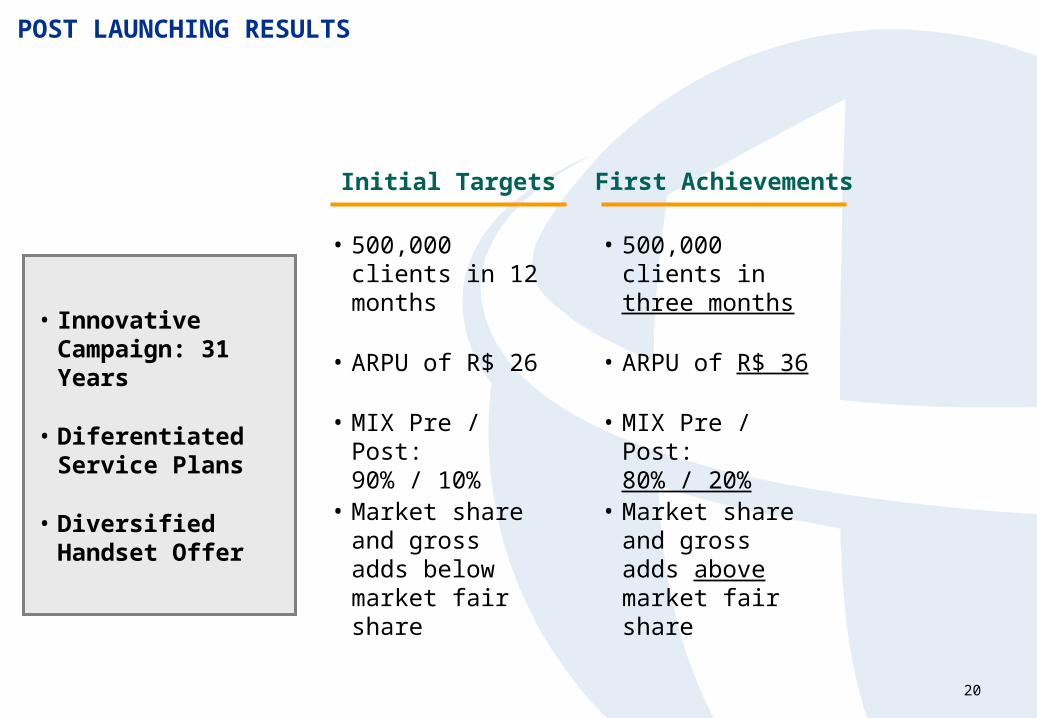
POST LAUNCHING RESULTS
• Innovative Campaign: 31 Years
• Diferentiated Service Plans
• Diversified Handset Offer
Initial Targets
• 500,000 clients in 12 months
• ARPU of R$ 26
• MIX Pre / Post: 90% / 10%
• Market share and gross adds below market fair share
First Achievements
• 500,000 clients in three months
• ARPU of R$ 36
• MIX Pre / Post: 80% / 20%
• Market share and gross adds above market fair share
21
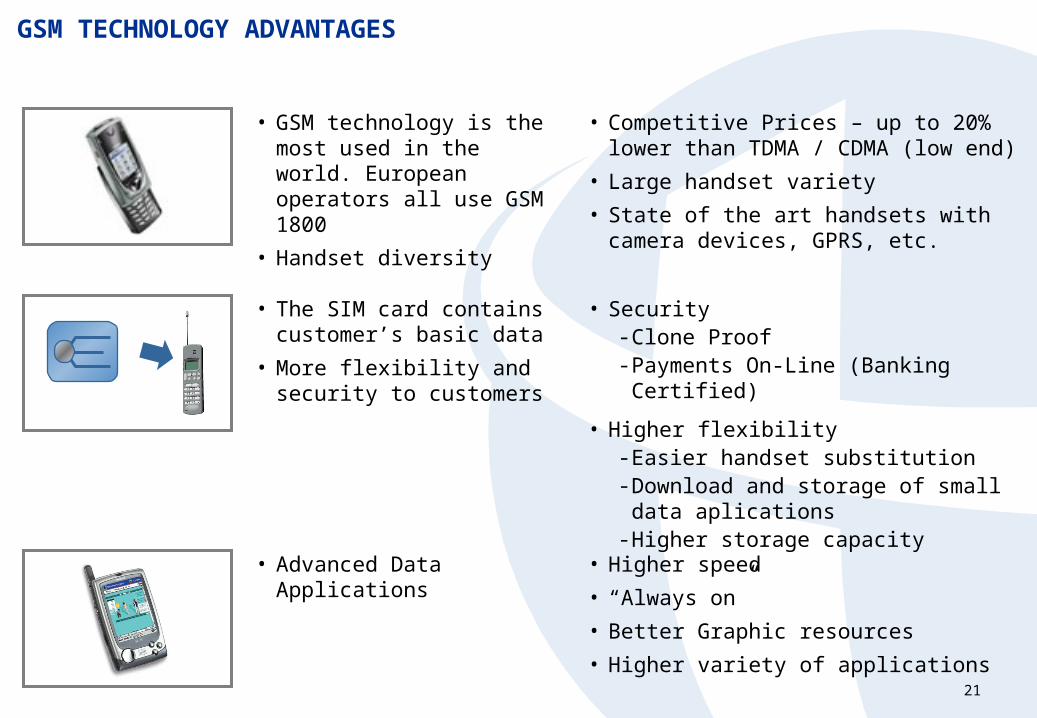
GSM TECHNOLOGY ADVANTAGES
• GSM technology is the most used in the world. European operators all use GSM 1800
• Handset diversity
• Competitive Prices – up to 20% lower than TDMA / CDMA (low end)
• Large handset variety
• State of the art handsets with camera devices, GPRS, etc.
• The SIM card contains customer’s basic data
• More flexibility and security to customers
• Security- Clone Proof- Payments On-Line (Banking Certified)
• Higher flexibility- Easier handset substitution - Download and storage of small data
aplications- Higher storage capacity
• Advanced Data Applications • Higher speed
• “Always on”
• Better Graphic resources
• Higher variety of applications
22
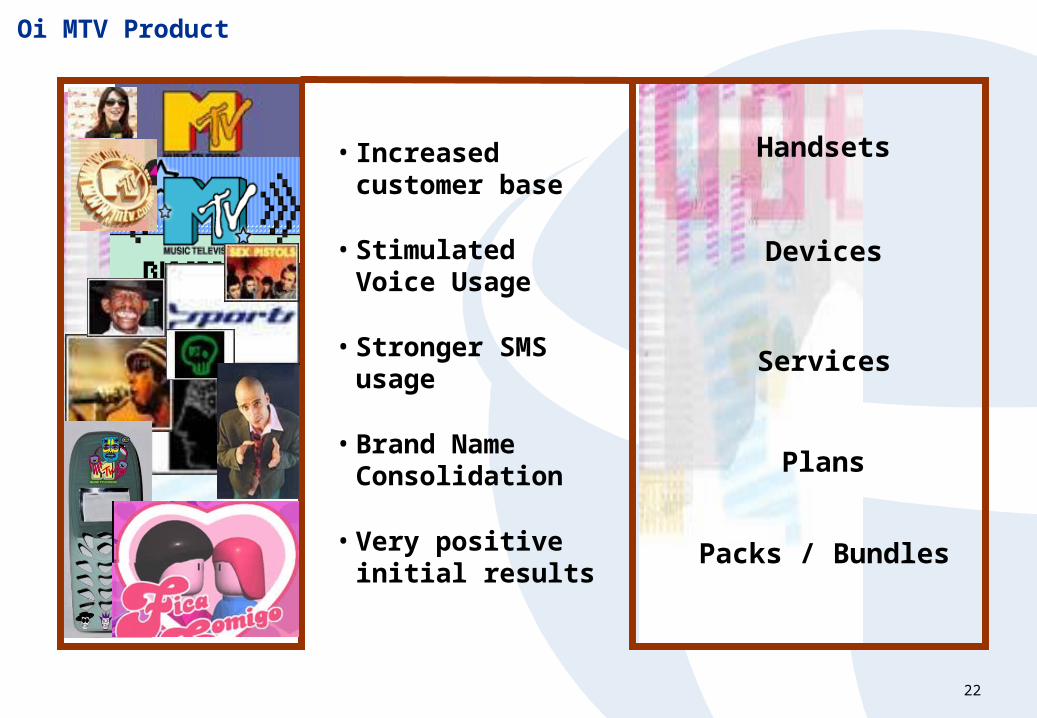
Oi MTV Product
Services
Plans
Handsets
Packs / Bundles
Devices
• Increased customer base
• Stimulated Voice Usage
• Stronger SMS usage
• Brand Name Consolidation
• Very positive initial results
23
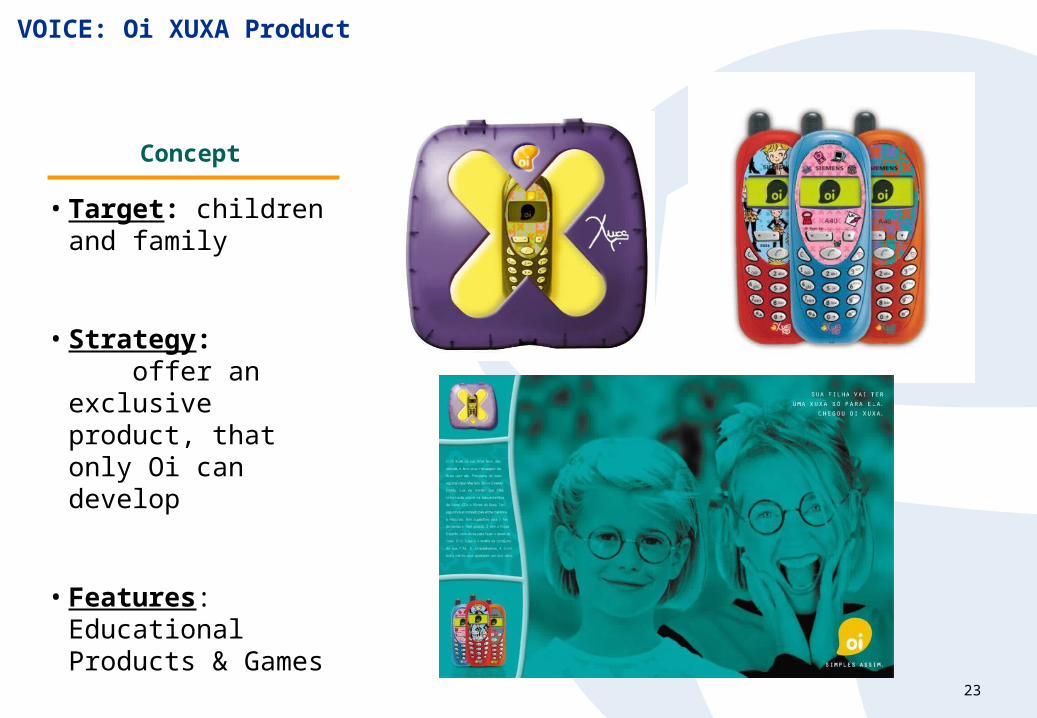
VOICE: Oi XUXA Product
Concept
• Target: children and family
• Strategy: offer an exclusive product, that only Oi can develop
• Features: Educational Products & Games
• Focus: Continued Service
24
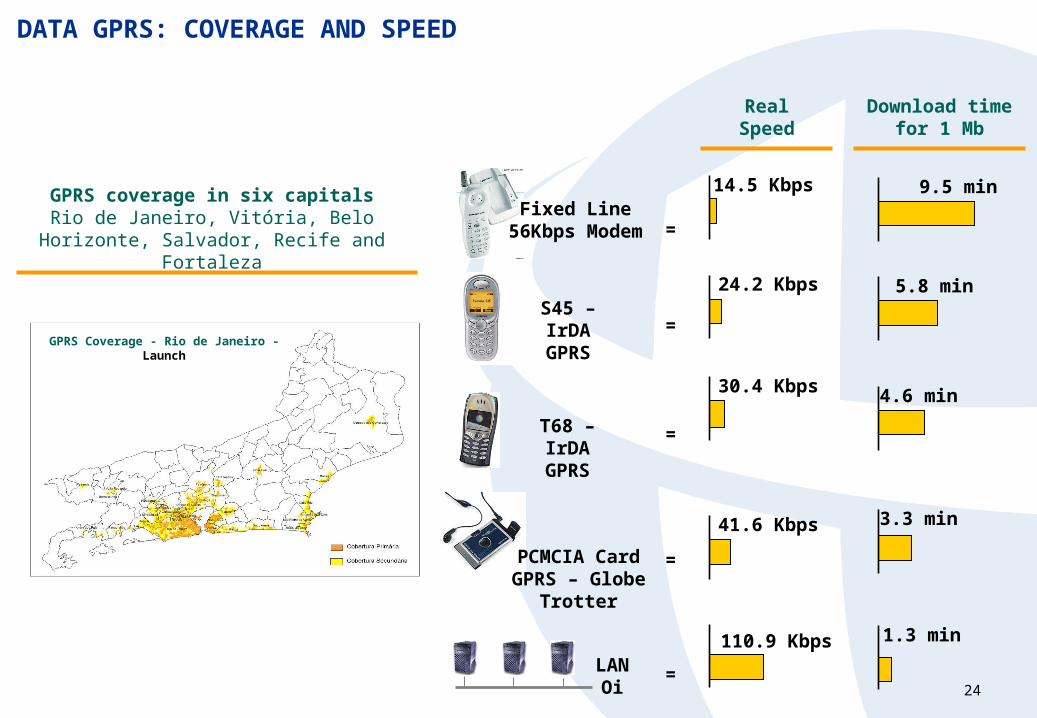
DATA GPRS: COVERAGE AND SPEED
GPRS coverage in six capitalsRio de Janeiro, Vitória, Belo Horizonte,
Salvador, Recife and Fortaleza
Fixed Line56Kbps Modem =
9.5 min14.5 Kbps
S45 – IrDAGPRS =
5.8 min24.2 Kbps
T68 – IrDAGPRS
=
4.6 min30.4 Kbps
PCMCIA CardGPRS – Globe
Trotter
=
3.3 min41.6 Kbps
LAN Oi =
1.3 min110.9 Kbps
Real Speed
Download time for 1 Mb
GPRS Coverage - Rio de Janeiro - Launch
25
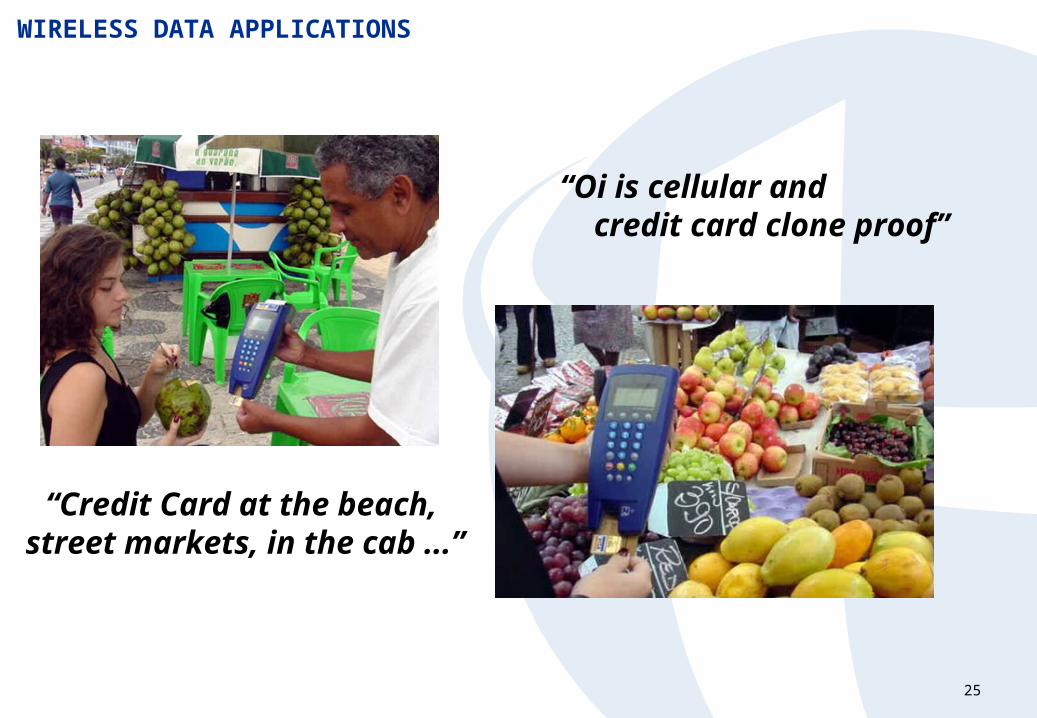
“Oi is cellular and credit card clone proof”
“Credit Card at the beach, street markets, in the cab ...”
WIRELESS DATA APPLICATIONS
26
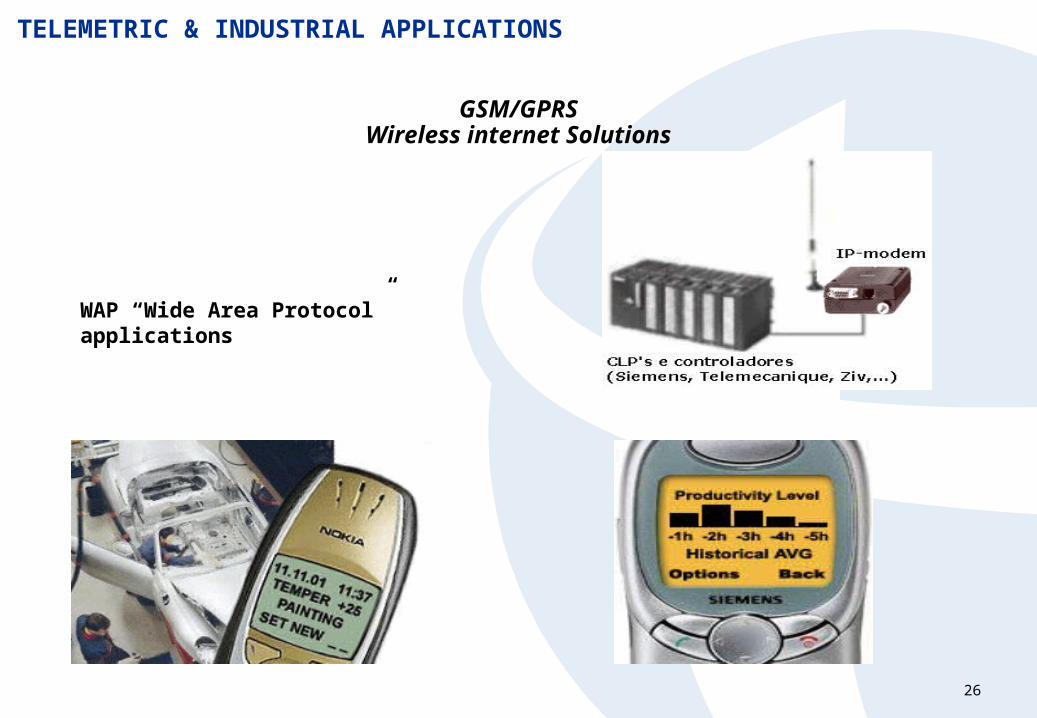
TELEMETRIC & INDUSTRIAL APPLICATIONS
WAP “Wide Area Protocol” applications
GSM/GPRSWireless internet Solutions
27
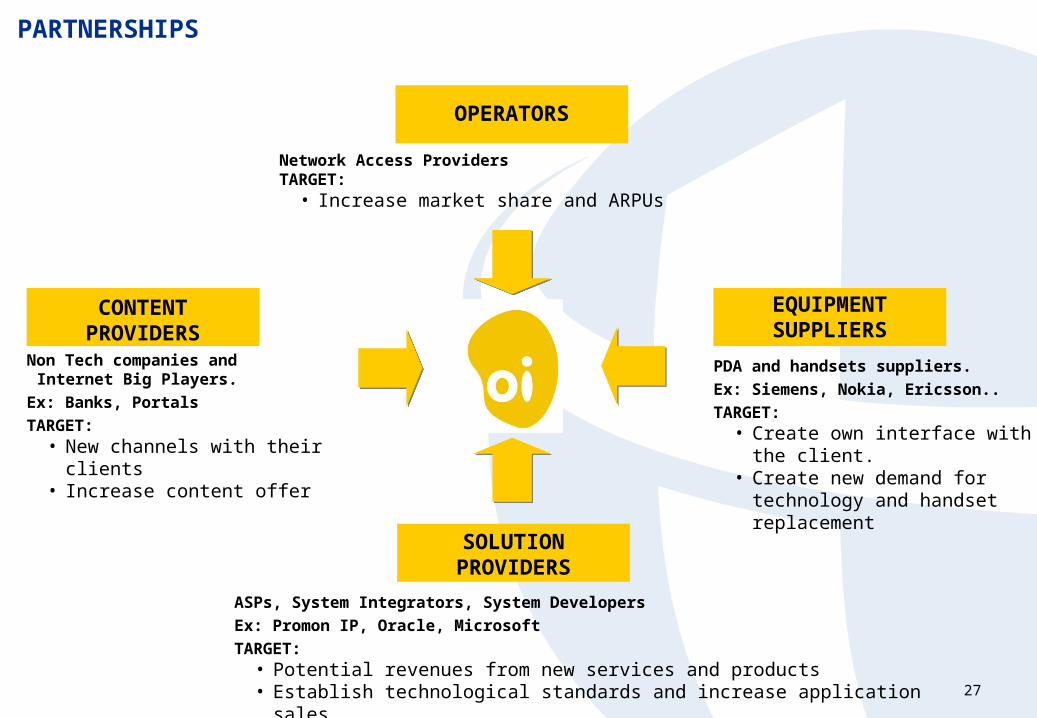
PARTNERSHIPS
OPERATORS
SOLUTION PROVIDERS
CONTENT PROVIDERS
Non Tech companies and Internet Big Players.
Ex: Banks, Portals
TARGET:• New channels with their clients• Increase content offer
EQUIPMENT SUPPLIERS
PDA and handsets suppliers.
Ex: Siemens, Nokia, Ericsson..
TARGET:• Create own interface with the
client.• Create new demand for
technology and handset replacement
ASPs, System Integrators, System Developers
Ex: Promon IP, Oracle, Microsoft
TARGET:• Potential revenues from new services and products • Establish technological standards and increase application sales.
Network Access ProvidersTARGET:
• Increase market share and ARPUs
28
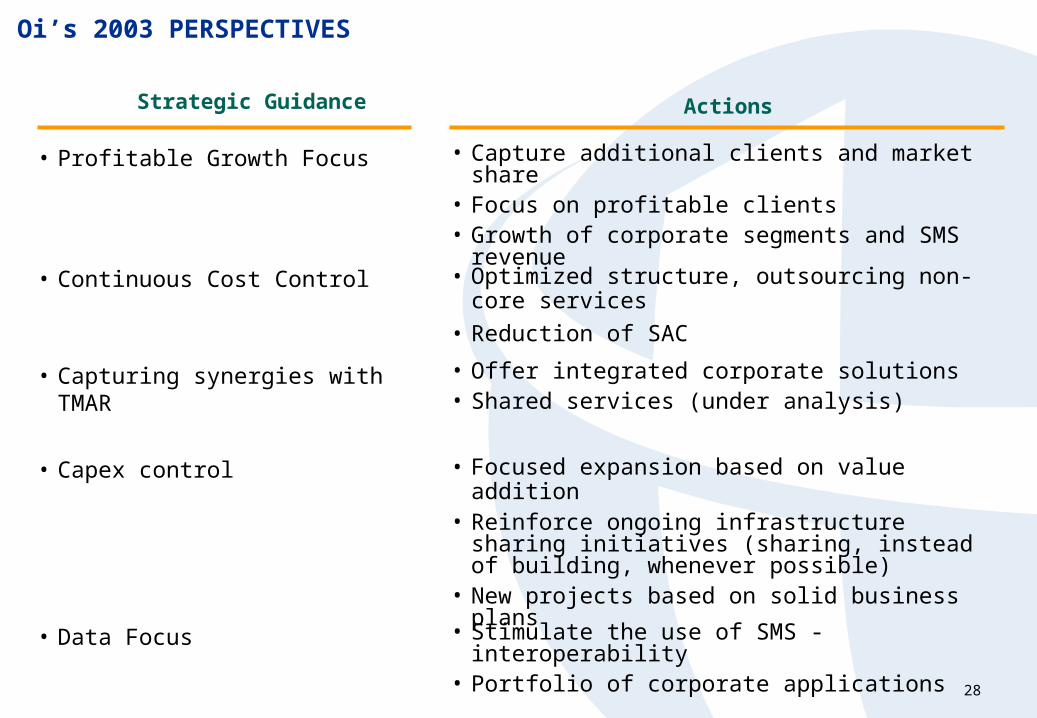
ActionsStrategic Guidance
• Capture additional clients and market share• Focus on profitable clients• Growth of corporate segments and SMS revenue
• Profitable Growth Focus
• Optimized structure, outsourcing non-core services
• Reduction of SAC• Continuous Cost Control
• Offer integrated corporate solutions • Shared services (under analysis)
• Capturing synergies with TMAR
• Focused expansion based on value addition• Reinforce ongoing infrastructure sharing initiatives
(sharing, instead of building, whenever possible)• New projects based on solid business plans
• Capex control
• Stimulate the use of SMS - interoperability• Portfolio of corporate applications
• Data Focus
Oi’s 2003 PERSPECTIVES

EASY AS IT IS!
30
Part IV
FINANCIAL RESULTS
31
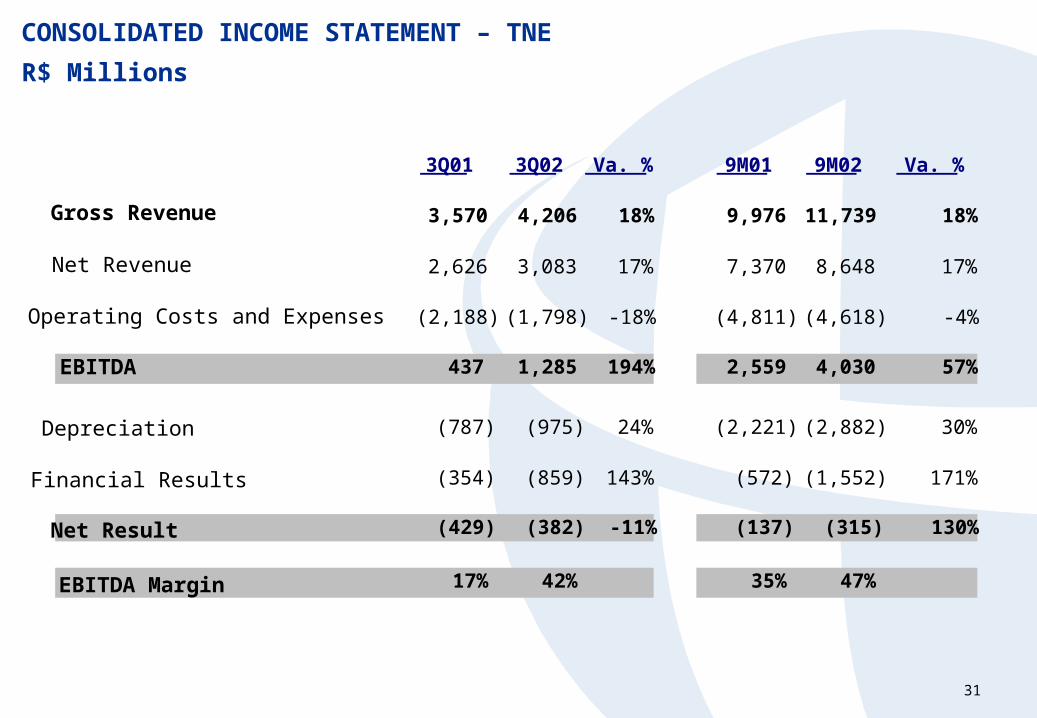
3Q01 3Q02 Va. % 9M01 9M02 Va. %
3,570 4,206 18% 9,976 11,739 18%
2,626 3,083 17% 7,370 8,648 17%
(2,188) (1,798) -18% (4,811) (4,618) -4%
437 1,285 194% 2,559 4,030 57%
(787) (975) 24% (2,221) (2,882) 30%
(354) (859) 143% (572) (1,552) 171%
(429) (382) -11% (137) (315) 130%
17% 42% 35% 47%
Gross Revenue
Net Revenue
Operating Costs and Expenses
EBITDA
Depreciation
Financial Results
Net Result
EBITDA Margin
CONSOLIDATED INCOME STATEMENT – TNE
R$ Millions
32
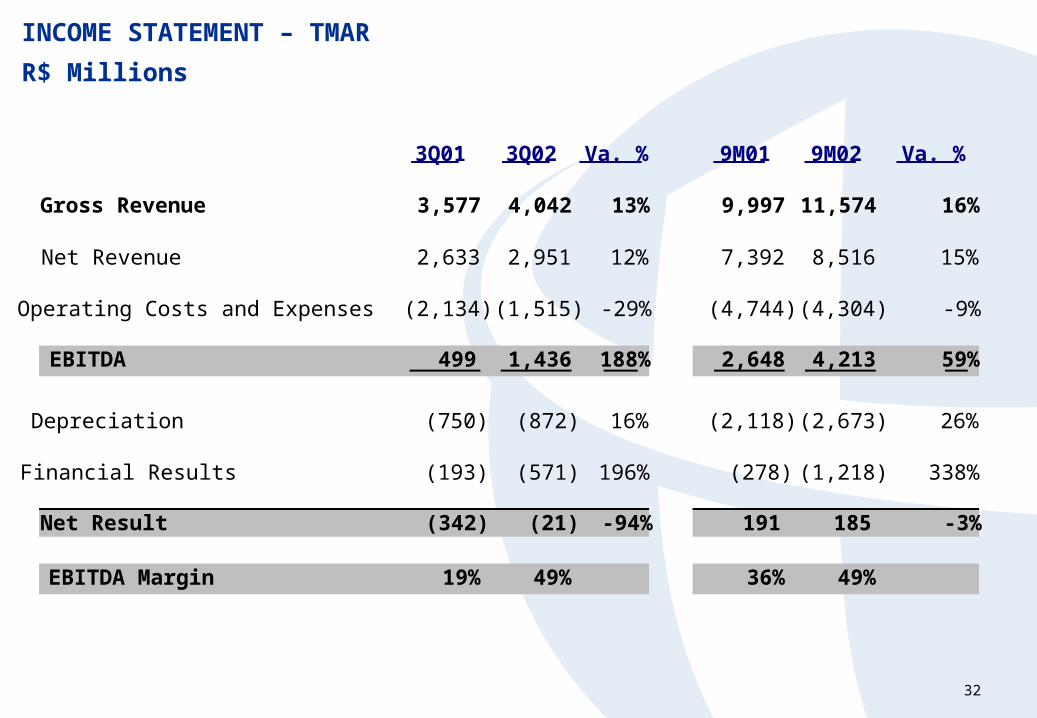
INCOME STATEMENT – TMAR
R$ Millions
3Q01 3Q02 Va. % 9M01 9M02 Va. %
Gross Revenue 3,577 4,042 13% 9,997 11,574 16%
Net Revenue 2,633 2,951 12% 7,392 8,516 15%
Operating Costs and Expenses (2,134) (1,515) -29% (4,744) (4,304) -9%
EBITDA 499 1,436 188% 2,648 4,213 59%
Depreciation (750) (872) 16% (2,118) (2,673) 26%
Financial Results (193) (571) 196% (278) (1,218) 338%
Net Result (342) (21) -94% 191 185 -3%
EBITDA Margin 19% 49% 36% 49%
33
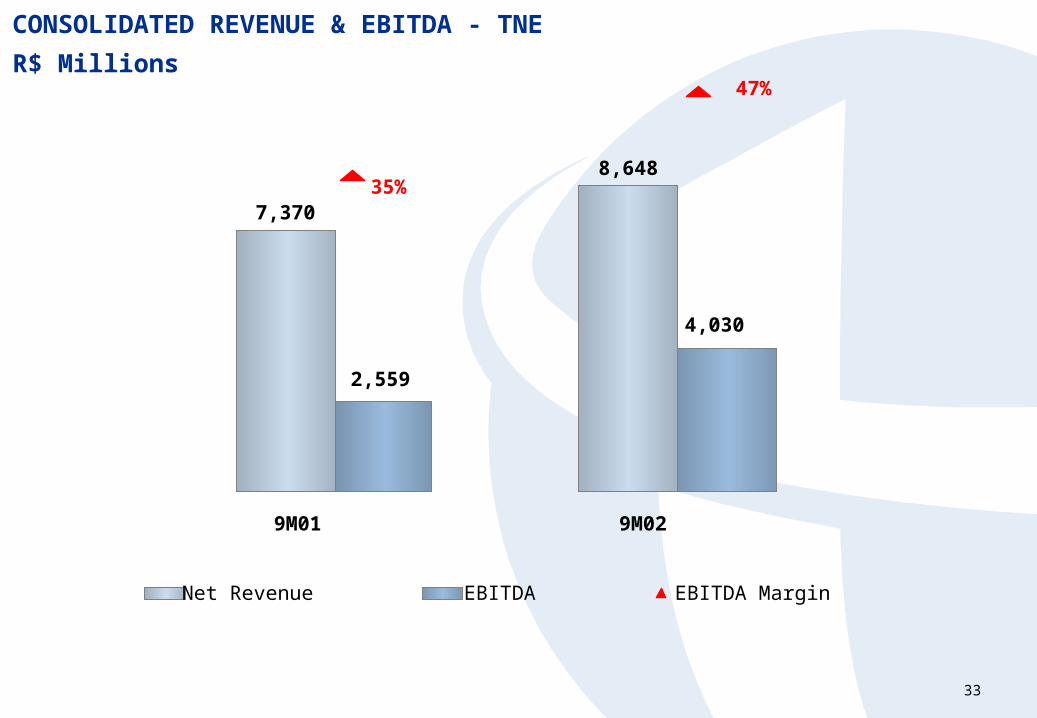
CONSOLIDATED REVENUE & EBITDA - TNE
R$ Millions
7,370
8,648
4,030
2,559
47%
35%
9M01 9M02
Net Revenue EBITDA EBITDA Margin

34
CONSOLIDATED CAPEX - TNER$ Millions
2,000
6,222
8,1228,648
10,060
1.334
7,058
2,8042,2442,500
7,370
5,158
10,103
1998 1999 2000 2001 9M01 9M02 2002E
Capex Net Revenue
CAPEX / Net Revenue (%)
96%
17%
48%
36% 35%
100%
15%
1998 1999 2000 2001 9M01 9M02 2002E
35
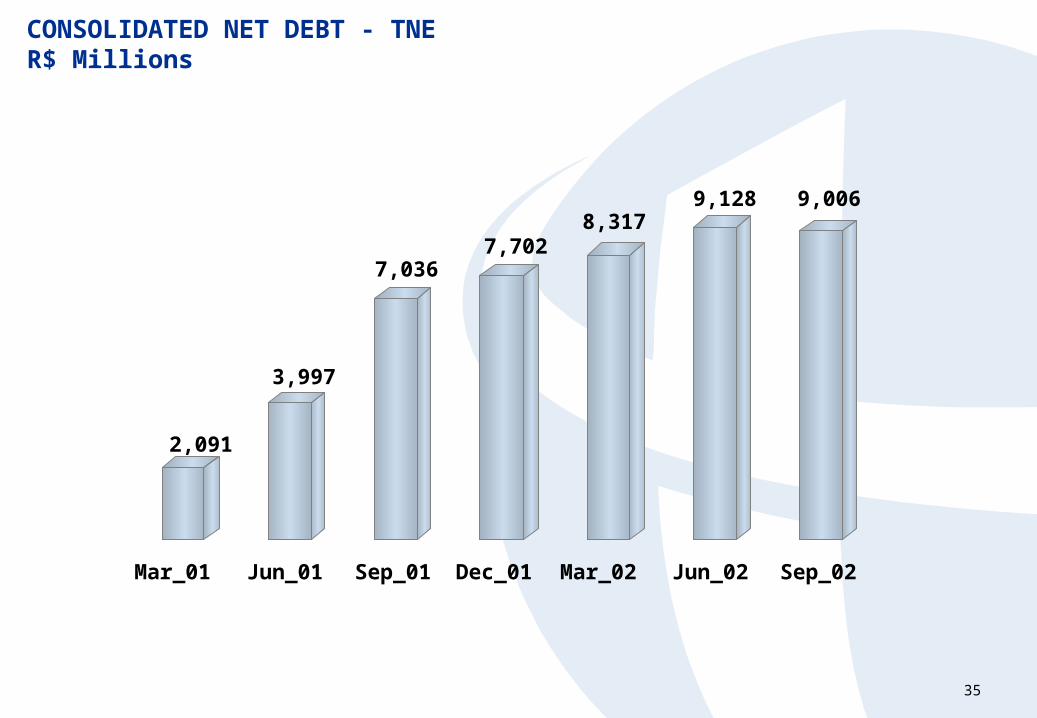
CONSOLIDATED NET DEBT - TNER$ Millions
2,091
3,997
7,0367,702
8,3179,128 9,006
Mar_01 Jun_01 Sep_01 Dec_01 Mar_02 Jun_02 Sep_02

36
CONSOLIDATED DEBT – CURRENCY AND COST (SEP/02)
Currency
46%
11%
10%
33%
Domestic
US$
Yen (Swap to US$)
Currency
Basket
52%
15%
20%
13% CDI
TJLP
Floating Rate (US$)
Interest
Currency Cost (% p.a.)US$ Libor + 5 Yen 1.7
Basket 12.3Real 16.0
Cost of Debt
Fixed Rate (US$)
37
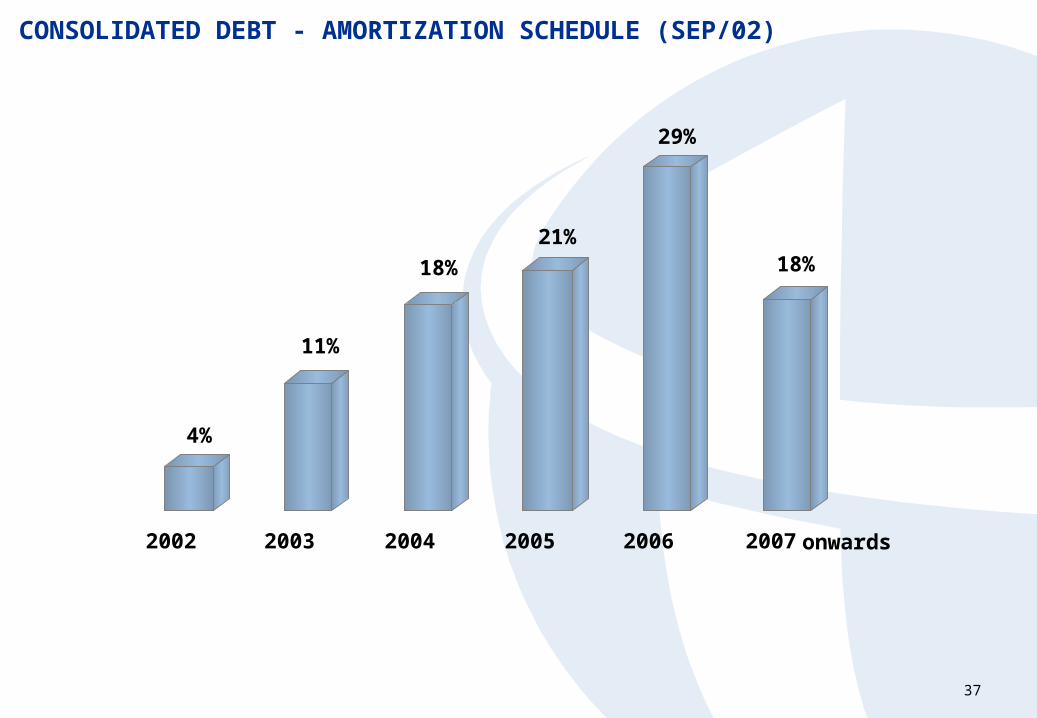
CONSOLIDATED DEBT - AMORTIZATION SCHEDULE (SEP/02)
4%
11%
18%
21%
29%
18%
2002 2003 2004 2005 2006 2007 onwards

38
This presentation contains forward-looking statements. Statements that are not historical facts, including
statements about our beliefs and expectations, are forward-looking statements and involve inherent risks
and uncertainties. These statements are based on current plans, estimates and projections, and therefore
you should not place undue reliance on them. Forward-looking statements speak only as of the date they
are made, and we undertake no obligation to update publicly any of them in light of new information or
future events.
““SAFE HARBOR” STATEMENTSAFE HARBOR” STATEMENT
Investor Relations
Rua Humberto de Campos, 425 / 8º andar
Leblon
Rio de Janeiro -RJ
Phone: ( 55 21) 3131-1314/1313/1315/1316/1317
Fax: (55 21) 3131-1155
E-mail: [email protected]
Visit our website: http://www.telemar.com.br/ri