


Línguas
Páginas
Legal


Sara Costa Granja
Outubro de 2009
Universidade do Minho
Escola de Ciências
The role of monocarboxylate transporters onembryonic development on two animal models:Rattus norvegicus e Gallus gallus

Tese de MestradoMestrado de Genética Molecular
Trabalho efectuado sob a orientação daDoutora Fátima Baltazar
Sara Costa Granja
Outubro de 2009
Universidade do Minho
Escola de Ciências
The role of monocarboxylate transporters onembryonic development on two animal models:Rattus norvegicus e Gallus gallus

III
DECLARAÇÃO
Nome:
Sara Costa Granja
Endereço electrónico: [email protected] Telefone: 917501594
Número do Bilhete de Identidade:
Título dissertação
The role of monocarboxylate transporters on embryonic development on two
animal models: Rattus norvegicus e Gallus gallus
Orientadora:
Doutora Fátima Baltazar
Ano de conclusão: 2009
Designação do Mestrado:
Mestrado de Genética Molecular
É AUTORIZADA A REPRODUÇÃO INTEGRAL DESTA TESE/TRABALHO
APENAS PARA EFEITOS DE INVESTIGAÇÃO, MEDIANTE DECLARAÇÃO
ESCRITA DO INTERESSADO, QU E A TAL SE COMPROMETE
Universidade do Minho, 31 de Outubro de 2009
Assinatura:__________________________________________


ACKNOWLEDGMENTS/AGRADECIMENTOS


VII
ACKNOWLEDGMENTS/AGRADECIMENTOS À Professora Fátima Baltazar por me ter dado esta oportunidade em realizar o meu
trabalho sob sua orientação. Quero agradecer todo o apoio, simpatia e incentivo
prestado. Muito Obrigada;
Aos Professores Doutores Jorge Correia Pinto e Isabel Palmeirim pela ajuda sempre
disponível;
Um especial agradecimento à Doutora Raquel Andrade por toda a paciência, apoio,
simpatia e disponibilidade dada;
À Drª. Cristina Silva por toda a disponibilidade, apoio e ajuda dada;
A todas as pessoas do laboratório e companheiros de diversão: Sandra, Olga, Celine,
Vera, Tatiana, Ana Paula, Mónica, Helena, João, Bruno. Obrigada pelo apoio,
companheirismo e pelos bons momentos;
Ao meu mano e aos meus amigos por terem estado sempre presentes
E por último ao meu papa e à minha mamã por me terem dado mais esta oportunidade e
por me apoiaram em todas as decisões da minha vida. Obrigada


ABSTRACT/RESUMO


Abstract
xi
ABSTRACT
According to the literature, the human embryo and human placenta develop in
a hypoxic environment during the first trimester. In this way, cells have to resource to
glycolitic pathways for energy supply, leading to an intracellular accumulation of
monocarboxylates such as lactate and pyruvate. These acids have an important role in
cell metabolism and their rapid transport across the plasma membrane is crucial for the
maintenance of intracellular pH homeostasis. This transport is mediated by a family of
transporters, designated as monocarboxylate transporters (MCTs), namely isoforms 1, 2,
3 and 4. Regarding the regulation of MCTs, it is known that MCT1, MCT3 and MCT4
depend on an ancilary protein, CD147, while MCT2 depends on GP70 for activity and
correct localization in the plasma membrane. Their expression is also regulated by
hypoxia, being HIF-1α an important regulator of MCT4 expression.
The general aim of this project was to characterize the expression of MCT1-
MCT4 during lung embryo development of Rattus Norvegicus and over several stages
of embryo development of Gallus gallus to elucidate the function of MCTs in
embryogenesis. Furthermore, we intended to study the role of MCTs by studying the
effects of inhibition their expression in fetal lung explants culture.
Our findings identified the expression pattern of MCT4 during chick embryo
development.
Regarding rat lung embryonic development, our results showed that the
expression of MCTs varies during lung embryonic development and that CHC (α-
cyano-4-hydroxycinnamate) appears to have an inhibitory effect on lung branching and
viability in a dose dependent way.
To conclude it appears that MCTs play a role in embryo development, since
their expression varies along embryogenesis. Lung explant and viability seemed to be
sensitive to MCT inhibition, however, to prove the dependence of MCT activity further
studies will be needed.

Resumo
xii
RESUMO
Segundo a literatura, o embrião humano e a placenta desenvolvem-se num
ambiente de hipóxia durante o 1º trimestre de gestação. Deste modo, as células recorrem
as vias glicolíticas para a obtenção de energia, resultando num acúmulo intracelular de
monocarboxilatos, como o lactato e o piruvato. Estes têm um papel fundamental no
metabolismo celular e o seu rápido transporte através da membrana é vital para a
manutenção do pH da célula. Este transporte é mediado por proteínas transmembranares
conhecidas por transportadores de monocarboxilatos (MCTs), nomeadamente as
isoformas 1, 2, 3 e 4. Relativamente à regulação da expressão dos MCT1 e MCT4, sabe-
se que necessitam de uma proteína auxiliar, CD147, para correcta expressão membranar
e actividade. A sua expressão é também regulada pela hipóxia, sendo o factor de
transcrição HIF-1α um importante regulador da expressão do MCT4.
O objectivo geral desta tese foi caracterizar a expressão dos MCT1-MCT4
durante o desenvolvimento embrionário do pulmão de Rattus norvegicus e ao longo de
vários estadios do desenvolvimento embrionário de Gallus gallus de modo a elucidar a
função dos MCTs na embriogénese. Além disso estudou-se o papel dos MCTs através
da inibição da sua actividade em cultura de explantes de pulmão de rato.
Neste trabalho descrevemos o padrão de expressão do MCT4 durante o
desenvolvimento embrionário de galinha.
No que diz respeito ao desenvolvimento embrionário de pulmão de rato, os
nossos resultados mostraram que a expressão dos MCTs varia ao longo do
desenvolvimento embrionário do pulmão e que o CHC (α-cyano-4-hydroxycinnamate)
parece ter um efeito inibitório na ramificação do pulmão e da viabilidade de uma
maneira dose dependente.
Para concluir, parece que os MCTs desempenham um papel no desenvolvimento
do embrião, uma vez que a sua expressão varia ao longo embriogênese. Explantes de
pulmão e a sua viabilidade pareceu ser sensível à inibição dos MCTs, no entanto,
estudos adicionais serão necessários para provar a dependência na atividade dos MCT.

TABLE OF CONTENTS


Table of contents
xvi
TABLE OF CONTENTS
Acknowledgments/Agradecimentos ............................................................................... vii
Abstract ............................................................................................................................ xi
Resumo ........................................................................................................................... xii
Abbreviations ................................................................................................................ xix
CHAPTER 1 – GENERAL INTRODUCTION ............................................................ xix
Developmental biology .............................................................................................. 23
Embryogenesis: cellular metabolism .......................................................................... 23
Metabolism and Monocarboxylate transporters ......................................................... 25
Regulation of MCTs ................................................................................................... 29
MCT Inhibition ........................................................................................................... 30
Role of MCTs during embryo development ............................................................... 31
Aims ............................................................................................................................... 33
CHAPTER 2 – Characterization of MCTs expression pattern during chick embryo
development ................................................................................................................... 34
Gallus gallus ............................................................................................................... 37
Material and Methods ................................................................................................. 40
1. Eggs and embryos ........................................................................................ 40
2. In situ Hibridization ..................................................................................... 40
Results ........................................................................................................................ 47
1. Probe synthesis ............................................................................................. 47
2. Optimization of in situ hybridization conditions.......................................... 49
3. Expression pattern of mct4 during chick embryo development ................... 50
Discussion ................................................................................................................... 53
CHAPTER 3– Role of MCTs in lung rat embryo development..................................... 54
Rattus norvegicus ....................................................................................................... 57
Table of contents
xvii
Material and Methods ................................................................................................. 59
1. Animals model ............................................................................................. 59
2. Fetal lung explants cultures .......................................................................... 59
3. Morphometric analysis of lung explant ........................................................ 59
4. Immunohistochemistry ................................................................................. 59
5. Western Blot ................................................................................................. 60
Results ........................................................................................................................ 62
1. Expression of MCTs during lung embryo development .............................. 62
1. MCT inhibition in lung explants .................................................................. 66
Discussion ....................................................................................................................... 68
CHAPTER 4 – Conclusion ............................................................................................. 69
References ...................................................................................................................... 73

ABBREVIATIONS


Abbreviations
xix
ABBREVIATIONS
CHC: α-cyano-4-hydroxycinnamate;
DIDS: 4,4′-diisothiocyanatostilbene-2,2′-disulfonic acid;
Dpc: day pos-conception;
EtBr: Ethidium bromide
GD: gestational day;
HH: Hamburger-Hamilton;
HIF-1: hypoxia inducible factor-1;
IHC: Immunohistochemistry;
ISH: In situ hybridization;
LDH: lactate dehydrogenase;
MCT: H+-monocarboxylate cotransporter;
MMP: matrix metalloproteinase;
pCMBS: p-chloromercuribenzenesulfonic acid;
pHi: intracellular pH;
RPE: Retinal pigment epithelium;
RT: Room temperature;
TM: transmembrane α-helical;
VEGF: vascular endothelial growth factor;


CHAPTER 1 – GENERAL INTRODUCTION


The role of MCTs on embryonic development
23
Developmental biology
The process by which the embryo is formed and develops is known as
embryogenesis. It is initiated by a process called fertilization that is the fusion of genetic
material from the two gametes, the sperm and the egg. After that cleavage begins which
consist on a series of rapid mitotic divisions wherein the zygote is divided into numerous
smaller cells. These different cells derived from cleavage, up to the blastula stage, are
called blastomeres. The blastula is usually a spherical layer of cells, the blastoderm,
surrounding a fluid-filled or yolk-filled cavity, the blastocoel. The cells then migrate to
the interior of the blastula, consequently forming three germ layers. During this process
the embryo is called gastrula. The germ layers are referred to as the ectoderm, mesoderm
and endoderm and give rise to all of an animal’s tissues and organs through the process of
organogenesis [1].
Embryogenesis: cellular metabolism
Embryonic and fetal development is strongly influenced by the oxygen
environment [2, 3].
Studies relative to placenta formation indicate that the human embryo and human
placenta are developed in a hypoxic environment during the first trimester. The placenta
consists of a gestational sac, villi with few capillaries, a trophoblast layer and an
exocoelomic cavity which do not contain oxygen transport system but anti-oxidant
molecules are present, protecting the embryo from oxidative damage. Thus, these features
are indirect evidence that the gestational sac limits the embryonic oxygen exposure [4, 5].
Low oxygen concentrations induce a whole spectrum of cellular and systemic responses
[6, 7]. The oxygen level in the cells and organs is regulated by pathways that affect the
expression and activity of numerous cellular proteins [8]. Sensing and responding
alterations in oxygen tension are important variations in the physiology, and tissues have
developed essential mechanisms of response to physiological oxygen reduction [4].
Hypoxia is commonly associated with pathologies such as tissue ischaemia and
inflammation. However, hypoxic microenvironments also occur in both the developing
embryo and the adult, and often create specific niches that regulate cellular differentiation
[9, 10]. Molecular mechanisms through which O2 levels interfere with embryonic
development have been elucidated by the characterization of hypoxia inducible factors
(HIFs), which are dimeric transcription factors that regulate hypoxic responses in cells
and tissues [8, 11, 11]. HIF-1 is considered a master switch that allows cells to respond to

The role of MCTs on embryonic development
24
falling oxygen levels. The protein consists of two essential subunits, HIF-1α and HIF-1β,
which heterodimerize [12]. Many genes are transcriptionally activated by HIF-1 in
response to hypoxia, such as glucose transporters, glycolitic enzymes, and vascular
endothelial growth factor (VEGF) for angiogenesis [2, 3]. Some authors suggest that the
initial low hypoxia levels normally present within the heart fields and neural tissue
activate HIF1-inducible genes for normal development [4]. The fundamental effects of
oxygen levels on development, physiology, and disease pathophysiology are now being
recognized. It seems that the development takes place in a physiologically low oxygen
environment and energy demands rely on glycolysis [4, 13]. Preimplantation embryos in
vivo develop in uterine fluid and they derive their ATP predominantly by oxidative
metabolism of pyruvate, lactate, and amino acids. The mouse embryo becomes more
dependent on aerobic glycolysis after implantation [13]. Mouse embryos (gestational day
6.5–9.5) grown in vitro convert 90% of the catabolized glucose to lactate, even though the
embryos are cultured in 20% oxygen, which should favor oxidative pathways [14]. For rat
and mouse embryos, it appears that for the start of the organogenic period, including the
period of neural tube closure, the embryo is largely dependent on glycolysis even when
conditions favor more efficient pathways [15, 16]. However, the availability of oxygen to
the embryo in vivo is not really known [3]. During the early stages of human and mouse,
pyruvate and lactate are the most important energy sources. Pyruvate, besides the function
of energy production, has ability to react with hydrogen peroxide [17] and / or may serve
as a means of removing ammonia of the embryo, converting it into alanine [18]. Lactate
formed by early human embryos derived from pyruvate [19] and its exchange with the
extracellular space, seems to be important for the regulation of the intracellular pH (pHi)
and / or to maintain the NAD/NADH ratio [20].
Cellular function depends on its metabolism, and metabolism generates
intracellular acid by the formation of H+ ions. The ability of cells to control their ionic
composition in response to external ionic stress is, therefore, likely to be an important
determinant of developmental progress, but there are limited knowledge on the ion
transporters and channels at these early stages of development. For example, H+ ions can
exert particularly powerful influences on cell function, and so understanding the nature
and properties of the proton transport and buffering systems available to the conceptus is
of particular significance[21, 22]. The pHi may also play a role in developmental
signaling. It has been described as an important trigger for the later developmental events
of neural induction [23, 24] and posterior axial [24]. The importance of the pHi for

The role of MCTs on embryonic development
25
successful early development was first demonstrated empirically in Bavister’s studies on
the pH dependence of monospermic fertilization in the hamster. Cells regulate pHi
through exchangers on the plasma membrane. These transports include Na+/H+
exchanger, Na+,HCO3-/CL- exchanger, however, the mechanism of pHi regulation during
embryo development is not really elucidated [25].
Posterior studies were done and demonstrated that controlling pHi could be also
carried out by a family of transporters designated by H+-monocarboxylate cotransporter
(MCT) [25].
Metabolism and Monocarboxylate transporters
Monocarboxylic acids such as lactate and pyruvate play an important role in
cellular metabolism. Some tissues like white skeletal muscle, erythrocytes and many
tumour cells depend on glycolysis to produce their ATP under normal physiologic
conditions, while all tissues become dependent on glycolysis during conditions as
hypoxia and ischemia [26].
Human cells have a series of mechanism in order to generate and meet the primary
energy demands of cell metabolism. One of the mechanisms is glycolitic pathway, which
involves a series of cytoplasmatic enzymes that converts glucose into pyruvate [27].
Then, pyruvate enters the mitochondria for the realization of oxidative phosphorylation.
These two processes in sequences generate the equivalent of 38 ATP units per glucose
molecule [27, 28]. Such is the energetic fate of glucose in healthy tissue under normal
physiological conditions. Under anaerobic conditions, where oxygen is limited, glycolysis
may be the main energy source of an organism. More specifically, the differences in
aerobic and anaerobic respiration depend on the different roles played by the NADH
molecules produced. In both aerobic and anaerobic respiration, NADH is an enzyme
complex and must be restored to its oxidized state (NAD). Under aerobic conditions,
meaning oxygen availability, NADH can be transported into the mitochondria where it
can be immediately reoxidized NAD, playing a role in the electron transport chain.
However, under anaerobic conditions, NADH is reoxidized to NAD through anaerobic
mechanisms, either homolactic or alcoholic fermentation. Pyruvate, product of glycolysis,
is converted into lactic acid by the enzyme lactate dehydrogenase (LDH). In this reaction,
the hydrogen from NADH molecule is transferred to the pyruvate molecule, leading to
production of lactate. From the lactate product, lactic acid can be formed. These
anaerobic conditions lead to glycolytic products other than pyruvate. These different

The role of MCTs on embryonic development
26
products are necessary for NADH reoxidization so that it allows in the next round
of glycolysis [29]. Lactic acid transport across the plasma membrane is fundamental for
metabolism and pH regulation of all cells, by removing lactic acid produced by glycolysis
and allowing uptake by those cells that utilize it as a respiratory fuel, as does the heart
[30]. If lactic acid effluxes do not happen, the intracellular concentration increase leads to
a decrease in pH inside the cell, leading to the inhibition of glycolysis [31]. Although it is
lactic acid that is both produced and utilized by metabolism, the pK of lactic acid is 3.86,
which ensures that it dissociates almost entirely to the lactate anion at physiological pH.
This charged species cannot cross the plasma membrane readily by free diffusion, but
require a specific transport mechanism, provided by MCTs [26, 30]. Transport of
monocarboxylates via MCTs is fully reversible and the direction of transport is
determined by both substrate and proton gradient [20].
Although lactate is the monocarboxylate which transport through the plasma
membrane takes place in highest quantities, MCTs are also essential for the transport of
other metabolically important monocarboxylates such as pyruvate and ketone bodies. So
being, MCTs have a central role in mammalian metabolism and are critical for the
metabolic communication between cells [26].
Figure 1 shows the metabolic pathways involved in monocarboxylate transport.
Figure 1: Pathways that involve the transport of monocarboxylates [26].
Fourteen MCTs were already described, each one with properties connected with
metabolic requests of the tissues in which they are expressed. Table 1 describes the main
characteristics of MCTs family.

The role of MCTs on embryonic development
27
Table 1: Principal characteristics of MCT family [32].
The monocarboxylate transporter family
Protein Name
Predominant Substrates
Transport type/ Coupling ions
Tissue distribution and cellular/ sub cellular expression
MCT-1 Lactate, pyruvate, ketone bodies
C / H+ or E / monocarboxylate Ubiquitous
MCT-2 Pyruvate, lactate, ketone bodies C / H+
Kidney, brain
MCT-3 Lactate
C / H+ (pH dependent
but cotransport not
confirmed
experimentally)
Retinal pigment epithelium, choroid plexus
MCT-4 Lactate, pyruvate, ketone bodies C / H+ Skeletal muscle, chondrocytes,
leukocytes, testis, lung, placenta, heart
MCT-5 O Brain, muscle, liver, kidney, lung, ovary, placenta, heart
MCT-6 O Kidney, muscle, brain, heart, pancreas, prostate, lung, placenta
MCT-7 O Brain, pancreas, muscle
MCT-8 T3, T4 (unpublished) F Liver, heart, brain, thymus, intestine, ovary, prostate, pancreas, placenta
MCT-9 O Endometrium, testis, ovary, breast, brain, kidney, adrenal, retina
TAT1/ MCT-10
Aromatic amino acids (W, Y, F, L-Dopa)
Kidney, intestine, muscle, placenta, heart
MCT-11 O Skin, lung, ovary, breast, lung, pancreas, retinal pigment epithelium, choroid plexus
MCT-12 O Kidney
MCT-13 O Breast, bone marrow stem cells
MCT-14 O Brain, heart, ovary, breast, lung, pancreas retinal pigment epithelium, choroid plexus
C: Cotransporter E: Exchanger
F: Facilitated transporter O: Orphan transporter

The role of MCTs on embryonic development
28
It is described that the topology of MCTs consists of 12 transmembrane α-helical
(TM) domains for MCT1, MCT2, MCT3, MCT7 and MCT8 and between 10 and 12 for
the other MCTs, including MCT4. Thus, it seems probable that there are 12 TM domains
with the N- and C-termini located within the cytoplasm as it can be seen in Figure 2 [26,
33].
Only the first four members, MCT1-MCT4, have been experimentally
demonstrated to catalyze proton coupled transport of monocarvoxylates [26, 34-38]
Therefore, they will be the ones to be boarded along this work.
The first MCT, named MCT1, was cloned from Chinese hamster ovary cells and
later functionally expressed in a breast tumour cell line. Similar transporters from human,
rat and mouse have been cloned and sequenced. Western and Northern blotting has shown
that MCT1 is found in the majority of tissues examined in both hamster and rat. MCT1 is
encoded by the gene mct1 and it has been mapped and located in the chromosomal band
1p13.2-p12. It is the most well-studied and functionally characterized member of the
MCT family, largely due to the fact that it is the only monocarboxylate transporter
expressed in human red blood cells, and it also has the widest tissue distribution. It has
values of Km of 1-10mM for the pyruvate, lactate and ketone bodies [20, 33, 39]. Garcia
et al [40] have cloned and sequenced the second isoform of MCT from Syrian hamster
liver, a tissue where MCT1 is absent. Named MCT2, it shares 60% identity with MCT1
[32, 39]. MCT2 is encoded by the gene slc16a7 and it is located in the locus 12q14.1. It
has great affinity for monocarboxylates, increasing the affinity for the substrate relative to
Figure 2: Membrane topology of the MCT family [26]. The sequence showed
is of MCT1.

The role of MCTs on embryonic development
29
MCT1. It is present in the cells where a rapid uptake of monocarboxylates is necessary,
where these are in low concentrations and in cells which release of the lactate is rare.
Thus, it is expressed in proximal kidney tubules, neurons, sperm tails, cardiac myocytes
and liver [20, 40, 41].
MCT3 was identified in the retinal epithelium cells of chicken. It is encoded by
the gene slc16a8 and it is located in the locus 22q13.1. It seems to be a very specialized
MCT since it is only found on the basal membrane of the retinal pigment epithelium
(RPE) of the eye and on the Choroid Plexus epithelium [41-43].
MCT4 is encoded by the gene slc16a3 and it is situated in the locus 17q25.3. It is
a transporter of low affinity adapted for the export of lactate of glycolitic cells like muscle
cells, tumour cells and white cells. It is expressed to chondrocytes, leucocytes, testicle,
lung and in placenta where is necessary a quick transport of lactate from the fetus to the
motherly circulation. The predominant substrates transported for MCT4 are lactate,
pyruvate and ketone bodies [20, 41, 44].
To facilitate the interpretation, the following nomenclature regarding genes names
will be adopted: for slc16a1 we will use mct1, for slc16a7 mct2, for slc16a8 mct3 and for
slc16a3 mct4.
Regulation of MCTs
Many membrane proteins are tightly associated with other glycosylated membrane
proteins. MCT1, MCT3 and MCT4 have been shown to interact with a cell surface
glycoprotein CD147 [45-47] and MCT2 with a closely related protein gp70 [48].
The glycoprotein of cellular surface CD147 also known as basigin or EMMPRIN
is widely distributed and expressed in high levels in many tissues, mainly in metabolically
active cells such as lymphoblasts and malignant tumor cells. Elevated CD147 stimulates
matrix metalloproteinase (MMP)-production in stromal fibroblasts and endothelial cells,
leading to extracellular matrix degradation, tumor growth promotion, and metastasis.
CD147 also stimulates expression of VEGF [49]. CD147 has an extracellular region with
two Ig domains and a N-terminal with several enzyme catalytic sites. The intracellular
domain is well conserved between species. The transmembrane domain of CD147
contains a glutamic acid residue, a charged residue which could be involved in the protein
association to the plasma membrane (Figure 3). Acting as an essential chaperone, CD147
leads the correct activity and targeting of MCTs to the plasma membrane [47]. MCT2
interacts with an ancillary protein called embigin (gp70), which is a CD147 homologue

The role of MCTs on embryonic development
30
with an unreactive Ig-like V domain in place of the C2 domain [46]. Other basigin family
members may bind different ligands through the extracellular Ig-like domains, which are
less similar than the transmembrane and cytoplasmatic regions [48]. GP70, that shares the
ability of CD147 to also interact with MCT1, is strongly and broadly expressed during
early stages of embryogenesis, but has a much more restricted distribution in adults [45].
Figure 3: Interaction between MCTs and the chaperone CD147 (red) [41] MCT Inhibition
There are some chemicals that are known to inhibit the function of MCTs [50].
Several studies have demonstrated the affinity and specificity of each inhibitor to each
MCT isoform.
The inhibitors known are [32, 50]:
• Aromatic compounds such as α-cyano-4-hydroxycinnamate (CHC) and
phenypyruvate. These are competitive inhibitors and have ki value of 50-
500 µM. These inhibitors inhibit MCTs with higher affinity to MCT1,
althouth, also inhibit others membrane transporters;
• Thiol reagents as p-chloromercuribenzenesulfonic acid (p-CMBS);
• Stilbenedisulphonates as 4,4’-dibenzamidostilbene - 2,2’disulfonate
(DIDS). These inhibitors act as irreversible inhibitors, reflecting covalent
modification of the transport. DIDS inhibits MCTs and also inhibits others
anion transporters;
• Bioflavonoids such as phloretin and quercetin;

The role of MCTs on embryonic development
31
Table 2: Sensitivity of MCT1, MCT2 and MCT4 to each type of inhibitor.
Transporter Inhibitor Ref.
MCT1 Sensitive to CHC, PCMBS, DIDS and
phloretin; 12,24
MCT2 Sensitive to CHC and DIDS; 12
MCT4 Sensitive to CHC and pCMBS. 12,24
Role of MCTs during embryo development
Studies have shown that embryonic and fetal development are influenced by the
oxygen environment and may primarily rely on glycolytic metabolism for its energy
supply, a necessary adaptation for the environmental hypoxia that exists during early
embryogenesis [4].
Several studies have been already demonstrated the expression of MCTs during
pre-implantation development of the human and mouse. The authors [51, 52]
demonstrated that since the development of the zygote until the stage of 2 cells, there is
an absolute requirement for pyruvate and that lactate could support the development of
the embryo in stages of 4 and 8 cells. For that is required a system that is capable of
transporting lactate, pyruvate and protons in order to counteract the decreasing of pH
inside the cell. Thus, Hérubel et al [20] analyzed and compared the expression of MCT1,
MCT2, MCT3, MCT4 and basigin during stages of the early embryonic development of
the human and mouse. For both human and mouse the transcript of MCT1 and MCT2
were detected during all stages studied. MCT3 was detected neither in human nor in
mouse and MCT4 was detected during all stages but only for mouse. Basigin was also
detected in both organisms in all stages.
Another study done during pre implantation development of the mouse embryo
was performed by Harding et al [52] that examined changes in the activity of the MCTs
during early development and the relationship between MCTs and pHi. They
demonstrated the presence of mRNA for MCT1, MCT2 and MCT3 isoforms throughout
pre-implantation of the mouse. Furthermore, they studied MCT activity by inhibition with
pCMBS and they suggested that MCT1 is the predominant isoform on the regulation of
the pHi during early development of the mouse.


The role of MCTs on embryonic development
33
AIMS
The purpose of this work was to study the role of MCTs during embryonic
development of Rattus norvegicus and Gallus gallus.
Regarding the study of lung embryo development of Rattus norvegicus, the
specific aims were:
1. Characterization of MCT1, MCT2 and MCT4 Immunohistochemical
expression in different gestational ages of lung development using paraffin sections of
fetuses of 13.5, 15.5, 17.5, 19.5 and 21.5 dpc and by Western Blot using fresh tissue
samples of the same stages;
2. Evaluation of the effects of MCT inhibition on lung viability and
branching (Morphometric analysis) by CHC in fetal lung explants.
Regarding to the chick (Gallus gallus) embryo the specific aims were:
1. Characterization of the expression pattern of MCT1, MCT2, MCT3,
MCT4 and Hif1α by In Situ Hybridization.


CHAPTER 2 – CHARACTERIZATION OF MCTS EXPRESSION PATTERN DURING
CHICK EMBRYO DEVELOPMENT


Characterization of MCTs expression pattern during chick embryo development
37
Gallus gallus
The chicken embryo has long been one of the most widely used laboratory
animals for both teaching and research and the reasons are clear to see. The chick
embryo is well characterized and has been used for the study of embryonic development
and analysis of expression patterns of several genes [53]. The advantages of using this
model are that fertilized eggs are cheap and available in large number, some genes and
physiology of the embryo are well known and the development lasts approximately 21
days [54]. However, the developmental rate can be affected by several factors like
incubation temperature, the delay between laying and lab-induced incubation and the
season of the year. Thus, a standardized system is needed to characterize the embryo.
The Hamburger-Hamilton (HH) system allows the developing chick to be accurately
staged both at embryonic and fetal stages, and is used universally in chick embryology
(Table 3) [54, 55]. Chick embryos can be "staged" according to different morphological
characteristics. In the very early embryo, the primitive streak is the only visible feature,
and its shape and size are used to stage HH1-5 embryos. Stages 5-8 may be defined by
the formation of the head fold, the neural folds, and their fusion to form the neural tube.
The expansion of anterior neural tube to form the brain may also be used to identify
later stages. Somitogenesis, the progressive segmentation of the paraxial mesoderm,
provides a convenient method for staging embryos between stage 7 and 14. Somites
form with surprising regularity every 90 minutes. Stage 10 embryos have 10 somites,
and the embryo gains 3 somites during each stage (i.e. Stage 11 embryos have 13
somites; Stage 12 embryos have 16, etc). Formation of the branchial arches, which will
give rise to the jaw, pharynx and larynx structures, begins at HH14 and is used as a
marker throughout development. The morphology of the limbs, starting with the
appearance of wing bud at stage 16, is a useful characteristic for staging chick embryos
and fetuses until hatching. Between stages 24 and 35, the appearance of specific
structures within the limbs (such as joints and digits); at later stages the length of the
toes is used. The formation and development of the eyelids, primordial feathers and
beak are used in a similar way to stage later development [1, 54, 55].

Characterization of MCTs expression pattern during chick embryo development
38
Table 3: Chick embryo developmental stages, according to Hamburger & Hamilton (adapted from [55]).
Hamburger Hamilton
Stages Incubation time Identification of Stages
… … …
St4 18-19 hr Definitive primitive
streak,
St5 19-22 hr Regression of Hensen’s
node
St6 23-25 hr Head fold
St7 23-26 hr 1 somite; neural folds
St8 26-29 hr 4 Somites
St9 29-33 hr 7 Somites
St10 33-38 hr 10 Somites
St11 40-45 hr 13 Somites
St12 45-49hr 16 Somites
St13 48-52 hr 19 Somites
St14 50-53 hr 22 Somites
St15-16 50-56 hr 24-28 Somites
St20 70-72 hr Characterization of
limb buds
St25 4 days Characterization of
limb buds
In what concerns to the expression of MCTs during chick embryo development,
few studies exist. Han et al [4] localized a member of the MCT family, MCT-4, and the
chaperone 5A11/Basigin immunohistochemically during early cardiomyocyte
differentiation. These results were confirmed by RT-PCR for MCT1, MCT4 and
5A11/basigin. This study was done from stages 5 to 42 of chick embryo development.
Relatively to MCT1 expression, it was first detectable at stage 18 and remained
expressed throughout the late fetal stages. MCT4 was expressed in all stages studied.
Although the band was weak, 5A11 was also expressed in all stages. Another study
regarding MCT expression during chick embryo development was performed by Philp
et al [42] where they described the expression of MCT3. In this study they showed that
MCT3 expression is restricted to the membrane of RPE and that MCT3 is firstly
detected at embryonic day 5 and persists until the last days of the gestation.

Characterization of MCTs expression pattern during chick embryo development
39
Tissue hypoxia may induce a lot of responses, many of which are dependent on
hypoxia-inducible transcription factors (HIFs) [11]. Ullah et al [56] demonstrated that
MCT4, like others glycolytic enzymes, is up-regulated by hypoxia through a mechanism
mediated by Hif1α.
Regarding chick embryo
development, there is a study [57] that
describes the expression pattern of
hif1α from stages HH4 to HH14
(Figure 4). They demonstrated that
hif1α is expressed exclusively in
embryonic regions, and was detected
mainly in the neural ectoderm at
stHH4, on the dorsal neural plate at
stHH6 and on restrictive groups of
differentiating neurons in closing
neural tube. They showed that
embryonic non-neural ectoderm and
foregut endoderm were also positive
for hif1α.
Due to the lack of studies relating MCTs and embryogenesis and since this is a
complex process that should be explored and understood, we aimed to study the
expression of MCTs during chick embryo development and compare the expression
pattern of MCTs, mainly MCT4 with the expression pattern of Hif1α.
Figure 4: hif1α expression pattern in chickembryos from HH4 to HH14, evaluated by wholemount in situ hybridization (A) Transversal serialsections of hif1α expression (B) [57].
Characterization of MCTs expression pattern during chick embryo development
40
Material and Methods
1. Eggs and embryos
Chick embryos (Gallus gallus) were used for this study. Fertilized eggs were
obtained commercially and incubated at 37ºC in a 49% humidified atmosphere.
Embryos were staged according to Hamburger and Hamilton (HH) classification [55].
Chick embryos from stage HH4 - HH25 were used in this study.
2. In situ Hibridization
In situ hybridization (ISH) is a technique which allows the detection of the
spatial distribution of a specific mRNA species in cells/tissues/organs, using an
antisense RNA probe. In whole-mount in situ hybridization, the entire embryo can be
stained for specific mRNAs. This method allows the visualization of the pattern of gene
expression in an entire organism [58]. One of the first steps of this technique is the
synthesis of the probe to be used. Probes are prepared by in vitro transcription using the
corresponding cDNA sequences cloned into appropriate plasmids as templates [58].
2.1 Primer design and RT-PCR
To generate in situ hybridization probes for MCT1, MCT2, MCT3, MCT4 and
Hif1α, primers were designed considering the GenBank gene sequences
NM_001006323 (MCT1), XM_416057 (MCT2), NM_205140 (MCT3), NM_204663
(MCT4) and NM_204297 (Hif1α) (Table 4) and RT-PCR reactions were performed.
Total RNA was isolated from whole HH24 and HH34 (2 and 8 days of
incubation respectively) embryos. After being harvested, the embryo was immersed and
macerated in 2 ml Trizol until an homogeneous mixture was obtained. After
homogenization, the sample was left for 5 min at room temperature (RT) to allow
complete dissociation of protein complexes and their sedimentation. Then, 0.2 ml of
chloroform/1ml of Trizol was added and shaked vigorously. After centrifugation at
13.000 rpm for 15 minutes at 4 ºC, the aqueous supernatant was transferred to a new
tube for RNA precipitation with 0.5 ml of isopropyl alcohol, followed by centrifugation
at 13.000 rpm for 10 min at 4 ºC. The supernatant was removed and the pellet was
washed with 75% ethanol and further centrifuged at 8.000 rpm for 5 min at 4 ºC. After
brief drying, RNA was dissolved in 20 μl RNase-free water. Finally, the RNA solution
was quantified by spectrophotometry (NanoDrop Technologies) and stored at -20ºC.

Characterization of MCTs expression pattern during chick embryo development
41
The first-strand reaction was carried out using the SuperScript® First-Strand Synthesis
System for RT-PCR (Invitrogen). In a PCR tube, 1 μl of RNA, 1 μl of Randon primer
and 10 μl of DEPC-water were incubated for 10 min at 70 ºC followed by an incubation
5 min at 4 ºC. The following mixture (8 μl) was added to the tube: 2 μl of PCR buffer
10x, 2 μl of 25 mM MgCl2, 1 μl of 10 mM dNTP mix, 2 μl of 0.1 M DTT and 1 μl of
RNase out. After incubation for 5 min at 42ºC, 1 μl of Super Script RT enzyme was
added and the mix was incubated for 50 min at 42 ºC and then for further 15 min at
70ºC. To complete a reaction 1 μl of RNase H was added and the mix was incubated for
20 min ate 37 ºC. The resulting cDNA was then stored at -20 ºC. PCR was performed
with the purpose of assessing the presence of these genes in the chick embryo and to
prepare cDNA templates for probe synthesis. PCR was carried out with cDNA from
stage HH24, in a total volume of 50 μl with the following composition: 2.5 mM MgCl2,
20 μM of each primer, 10 μM dNTPs (Fermentas), PCR 10x buffer (Fermentas), 2 U
Taq DNA polymerase (Fermentas) and 1 μl of cDNA. The primer sequences used are
shown in Table 4
Table 4: Primer pairs for the genes under study: sequence, annealing temperatures tested and
product size.
Primer Sequence (5’-3’)
Annealing
temperatures
tested
Product
size (bp)
slc16a1 Forward accgtggaggagctctacttctgc 48ºC, 50ºC,
52ºC,56ºC, 58ºC 709
Reverse tgatttacaatggggtgtgccacc
slc16a7 Forward gtatggtagccgaccagtgatgat
50ºC 651 Reverse tatgtttgctaggccttcaatggg
slc16a8 Forward atggggagagctgaccgagaggaa 48ºC, 50ºC,
52ºC,56ºC, 58ºC 906
Reverse ctggggcaagtgctgctggagaa
slc16a3 Forward ggatttcctccattctgttggcca
50ºC 697 Reverse aatggtagctggtctcaagtgggt
hif1a Forward agcctcccatgacgtgcttg
50ºC 678 Reverse tctcactggatgaggggagca
gapdh Forward ccggaattcatggtgaaagtcggagtcaacg
50ºC 1000 Reverse ccgctcgagtcactccttggatgccatgt
slc16a1 (MCT1), slc16a7 (MCT2), slc16a8 (MCT3), slc16a3 (MCT4)

Characterization of MCTs expression pattern during chick embryo development
42
Reactions were performed in a termocycler as follows: DNA denaturation step at
96 °C for 3 min, followed by 30 cycles of denaturation at 96 °C for 1 min, annealing at
corresponding temperature of each primer for 1 min, and extension at 72 °C for 1 min.
At the end, a final extension step of 5 min at 72 °C was performed. An aliquot (5 μl) of
each PCR product was separated on a 0.8 % agarose gel, stained with ethidium bromide
(EtBr) and gel images were visualized with Alphaimager (Invitrogen).
2.2 DNA cloning, transformation and plasmid isolation
Each DNA fragment obtained previously, was cloned into pCR®II-TOPO®
vector (Invitrogen). DNA cloning is a method used for isolating a particular sequence of
DNA from a complex mixture of different DNA sequences. In order to clone a fragment
of DNA, we need to insert it into a vector. A plasmid vector contains three elements: a
cloning site where the foreign DNA fragment can be inserted; a drug-resistance gene,
which destroys antibiotics – like ampicillin – to allow selective growth of the host cell;
and a replication origin to allow the plasmid to replicate in the host cell [58]. The
mixture contained 2 μl of PCR product, 1 μl of the salt solution, 1 μl of the TOPO
vector and water to a final volume of 6 μl. After mixing, the mixture was incubated for
5 min at RT and then placed on ice.
Each ligation mixture was then inserted into a host cell – E. coli bacteria. These
cells had been chemically treated in order to make them permeable to DNA molecules.
This process is called transformation. Before incubation (30 min), the cells, mixed with
the vector, were subjected to a thermal shock at 42 ºC for 20 seconds. Then they were
transferred into 250 μl of medium and placed in an orbital incubator for 1 hour at 37 °C
with shaking (225 rpm). Subsequently, the bacteria were plated on LB medium
containing the antibiotic ampicillin, X-GAL and IPTG. Thus, only the cells that
possess the plasmid containing the ampicillin resistance gene could grow. The cells
were allowed to grow and multiply at 37 ºC overnight. Only white, isolated colonies
were subcultured in a tube containing 5 ml of LB medium with ampicillin and allowed
to grow overnight (orbital incubator, 37 °C, 225 rpm). Plasmids were isolated with the
GenElute Plasmid Miniprep Kit [(Sigma) Figure 5], DNA was then quantified by
spectrophotometry (NanoDrop Technologies, Inc., USA) and stored at -20 ºC.
Restriction analysis was performed to confirm the presence and correct
orientation of the insert. This analysis was done by placing in an Eppendorf tube: 8 μl of

Characterization of MCTs expression pattern during chick embryo development
43
plasmid DNA, 0.5 μl of restriction enzyme, 1.5 μl buffer 10x specific of each enzyme
and 5 μl of H2O. The reaction was carried out overnight at 37 ºC and the product was
separated on a 0.8 % agarose gel. Gel image was visualized with Alphaimager
(Invitrogen). The restriction enzymes for each plasmid are identified in Table 5
The constructs were confirmed upon sequencing.
Plasmid Name RestrictionEnzyme
SP6 -> T7 (bp)
T7 -> SP6 (bp)
pCRII-MCT1pb BamH I 3993 4582
689 100
pCRII-MCT2pb Nco I 2592 2831
2032 1793
pCRII-MCT3pb Pst I 3541 2821
1190 1190
82 786
66 82
pCRII-MCT4pb Nco I 2500 2969
2170 1701
pCRII-Hif1Apb Xcm I 3018 3669
1633 982
2.3 Synthesis of antisense RNA probes
Synthesized RNA probes were labelled with digoxigenin, a non-radioactive
marker. The labelled nucleotides are incorporated into the nucleic acid molecule by an
in vitro transcription reaction. Before in vitro transcription, however, the plasmid should
be linearized by a restriction enzyme in a specific site. Then, the linearized plasmid is
incubated with the following reaction mixture: 14 μl H2O RNase free, 7 μl 5x
transcription buffer, 4 μl 0.1M DTT, 2 μl 10x DIG RNA labeling mix (Roche), 2 μl
RNA polymerase (depending on fragment orientation T7 polymerase or SP6
polymerase) and 2μl RNasin (Promega). After incubation for 3h at 37 ºC, 4 μl of RNase
Table 5: Restriction analyses for confirmation of the insertion and
orientation of the DNA fragment in the plasmid. Restriction
enzymes and expected fragment sizes for MCT1, MCT2, MCT3,
MCT4 and Hif1α plasmids.
Figure 5: The protocol of the GenElutePlasmid Miniprep Kit used for plasmidisolation.

Characterization of MCTs expression pattern during chick embryo development
44
free DNase (Promega) and 2 μl of RNasin were added and the mixture further incubated
at 37 ºC for 30 min. For RNA precipitation 200 μl of TE, 20 μl of 4 M LiCl2 and 600 μl
of 100% ethanol were added to the mixture and left overnight at -20 ºC. After
centrifugation (12000 rpm at 4 ºC for 30 min), supernatant was discarded and 1 ml of
cold 70 % ethanol was added. The supernatant was discarded, the pellet was air dried
for a few minutes and ressuspended in 50 μl of H2O RNase free. The sample was then
run on a 0.8 % agarose gel and gel image was visualized with Alphaimager (Invitrogen).
To diminish the size of the probe and to enhance adequate tissue penetration and
access to its specific transcript target, a chemical treatment can be done. Thus, the
length of the probe was reduced to approximately 200 bases as follows [59]: to 40 μl of
labelled RNA probe, 5 μl 0.6 M Na2CO3 and 5 μl 0.4 M NaHCO3 were added and the
probe was hydrolysed for 30 min at 60 ºC. The time of incubation was determined by
the following equation:
t = (L0 – Lf) / (K · L0 · Lf); being:
L0 = starting length of probe RNA (for MCT4 it was 0.7 kb)
Lf = length of probe RNA (in kb) (Lf = 0.2 kb.)
K = rate constant (K = 0.11 kb/min.)
t = hydrolysis time in min
After hydrolysis, the RNA probe was purified with the following solution: 200
μl of H2O RNase free, 25 μl of 3 M sodium acetate and 600 μl of cold 100 % ethanol,
and precipitated overnight at -20 ºC. After centrifugation (12000 rpm at 4 ºC for 30
min), the supernatant was discarded and 1 ml of cold 7 % ethanol was added. After
further centrifugation for 15 min, the pellet was left to air dry and resusspended in 80 μl
of water. The final RNA probe was stored at -20 ºC.
2.4 In situ Hybridization Procedure
All steps of this technique, especially until the second day, must be carried out
under RNase free conditions, to protect the mRNA and prevent digestion by
ribonucleases. For all reactions, a probe for fgf8, previously tested in the laboratory, was
used as positive control.

Characterization of MCTs expression pattern during chick embryo development
45
First of all, embryos were rehydrated in a series of methanol/PBT solutions. A
series of pretreatment steps before hybridization were performed to increase the
efficiency of hybridization and reduce nonspecific background staining [60] In this way
and after washing with PBT, the embryos were treated with 20mg/ml proteinase K (pK)
to increase the accessibility of the target nucleic acid. The time period of treatment
depends on the HH stage of the embryo. Thus for embryos younger than stage HH15,
the incubation time in minutes was equal to the HH stage. From stage 16 on, the
incubation time was as shown in Table 6: Table 6: Incubation times of proteinase K (pK) for ISH (embryos from stage 16 on).
HH Stage Time (min.) pK
16-18 25 20 mg/ml
19-20 30 20 mg/ml
21-25 35 20 mg/ml
26 40 20 mg/ml
27-29 45 20 mg/ml
After washing with PBT, the embryos were post-fixed in a solution of 37 %
formaldehyde and 25 % glutaraldehyde in PBT. After several washes with PBT and
hybmix the embryos were incubated overnight with the probe diluted in hybmix
(3/1000). Temperature is one of the most important factors that influences the
hybridization of the probe to the target mRNA. To find the optimal hybridization
conditions, different incubation temperatures were tested.
On the second day, the embryos were passed through a series of washes with
Hybmix and MABT. In order to reduce the background, embryos were incubated for
more than 1h on a solution of goat serum and blocking in MABT. The embryos were
then incubated (overnight) with a solution of goat serum, blocking and MABT
containing an antibody against digoxigenin conjugated with alkaline phosphatase (Anti-
Digoxigenin-AP, Fab fragments, Roche).
On the third day and after washing with MABT and NTMT, embryos were
incubated at 37 ºC with a NBT-BCIP solution. This solution is used for the detection of
alkaline phosphatase that is conjugated with the antibody. After stained, embryos were
photographed at 1-2x magnification (Leica DFC320 digital camera coupled to a Leica
MZFLIII stereomicroscope). Some embryos were included in methacrylate and
sectioned and slides were visualized under the microscope and photographed.


Characterization of MCTs expression pattern during chick embryo development
47
Results
1. Probe synthesis
In order to study the expression pattern of the genes mct1, mct2, mct3, mct4 and
hif1α by in situ hybridization (ISH), antisense RNA probes for each gene were
synthesized. Beforehand, the PCR conditions were optimized to confirm that the primer
pairs (Table 4) were able to detect the presence of these genes in chick embryo cDNA.
1.1 PCR optimization
The first PCR reaction was carried out using cDNA synthesized from stage
HH24 chick embryo total RNA and all primer pairs, at an annealing temperature of 50
ºC, as described in section 2.1 of Material and Methods. The amplification of a portion
of the gapdh gene was used as positive control. In these conditions, we only obtained
amplification bands with the expected size for mct2 (MCT2), mct4 (MCT4) and hif1α
(HIF-1α) (Figure 6A). For mct3 (MCT3) we obtained an amplification band under 500
pb, however, the expected size for the amplified product was 906 pb. Thus, and since
we did not have amplification for mct1, a PCR reaction with a gradient of primer
annealing temperature was performed for mct1 and mct3. For this PCR reaction, the
same conditions, cDNA and primers pairs for both genes were used as before, but 4
different annealing temperatures were tested for each primer pair: 48 ºC, 52 ºC, 56 ºC
and 58ºC. The results are shown in Figure 6B. For mct1 we obtained amplification
bands of the correct size for an annealing temperature of 52 ºC, 56 ºC and 58 ºC. For
mct3, we obtained the same results as previously (low size of the amplified band). Since
this result persisted, even when using another primer pair, we decided to clone and
sequence this fragment.
Figure 6: Amplification of a portion of the genes under study by PCR. A: first reaction with an annealing temperature of50ºC. Lane 1: λDNA digested with PstI used as standard DNA molecular weight marker, 2: positive control, amplificationof a portion of gapdh of approximately 1000pb, 3: mct1, 4: slc16a7, 5: mct3 with an amplification band but with incorrectsize, 6: mct4, 7: hif1α. B: PCR reaction for mct1 (2-5) and mct3 (6-9) with temperature gradient. 1: λPstI, 2,6: 48ºC,3,7:52ºC, 4,8: 56ºC, 5,9:58ºC.

Characterization of MCTs expression pattern during chick embryo development
48
1.2 Evaluation of insert orientation in the plasmid by restriction analysis
After plasmid isolation using a Miniprep kit (GenElute Plasmid Miniprep Kit,
Sigma), and to confirm the presence and orientation of the insert, restriction analyses
were performed for each constructed vector. The restriction enzymes used in each case
are described in Table 5. For hif1α, all candidate vectors were sequenced since no
appropriate restriction enzymes could be identified. The restriction fragments obtained
for plasmids carrying mct3 and mct1 amplicons are shown in Figure 7A and for mct2
and mct4 plasmids in Figure 7B. Two possible results were expected for each plasmid
depending on the orientation of the insert. By analysis of Figure 7A, we can observe
that for mct3, we obtained for clones 2, 3 and 5 (lane 2, 3 and 5) 3 bands one of them
with approximately 786 pb suggesting that these clones were orientated from T7 to SP6.
on the other hand for clone 4 (lane 4) we obtained 2 amplificand (3541 and 1190 pb)
suggesting that could be inserted with an orientation from SP6 to T7. Regarding mct1
restriction analysis for clones 6, 7 and 8 (lane 6, 7 e 8), we obtained a strong
amplification band with approximately 4000 pb and a weak band in the region between
514 pb and 805 pb revealing that for those clones the insert could be orientated SP6 to
T7. On the other hand, for clone 9 (lane 9) the result obtained is similar to the one that
indicate the orientation from T7 to SP6.
Regarding mct4, only one clone appear to have a result similar to the expected
with two amplified bands with 2500 bp and 2170 bp (Figure 7B, clone 2 lane). For mct2
only clone 9 (lane 9) revealed a similar result to the expected one (2592 bp and 2170
bp). All these possible clones were sequencing.
After sequencing, the results revealed that, only the plasmids with mct4 (clone 2)
and hif1α had the correct insert. mct4 and hif1α were oriented from SP6 to T7,
indicating that the synthesis of an antisense RNA probe should be performed using the
T7 polymerase.
Figure 7: A Restriction fragments obtained for plasmids carrying inserts for A - mct3,clones 1-4 (lanes 2-5) or mct1, clones 1-4 (lanes 6-9); B- mct4, clones 1-4 (lanes 2-5) orscl16a7, clones 1-4 (lanes 6-9) inserts. Lane 1: λPstI.

Characterization of MCTs expression pattern during chick embryo development
49
Figure 8 presents a scheme of the plasmid obtained with an insert for MCT4.
1.3 Synthesis of antisense RNA probes for in situ hybridization
An in vitro transcription reaction was performed for both genes to produce an
antisense RNA, complementary to the mRNA present in embryo cells, as described in
section 0. An antisense RNA probe for fgf8 was used as positive control of in situ
hybridization technique.
2. Optimization of in situ hybridization conditions
In situ hybridization technique was already established in the laboratory
however, the results were not satisfactory for the genes under study. Thus, the technique
required optimization. The parameters tested were the hybridization temperature (37 ºC,
50 ºC and 70 ºC) and the length of the probe, having hydrolyzed the mct4 and hif1α
probes to fragments of 200 pb. Satisfactory results for mct4 probe were only obtained
with a hybridization temperature of 50 ºC Figure 9. For hif1α, and since we did not
obtain staining in any condition tested, we requested probe plasmid to Ota et al [57] In
situ hybridization was performed with this hif1α probe and the results obtained were in
agreement with those previously published by these authors.
pCRII-MCT4pb4670 bp
Amp(R)
Kan(R)
MCT4pb
SENSE PRM
ANTISENSE PRM
M13 (-20) forward primerM13 (-40) forward primer
M13 reverse primerSP6 primer
T7 primer
Kan promoter
lac promoter
SP6 promoter
T7 promoter
lac repressor binding site
TOPO® binding site
TOPO® binding site
f1 origin
pUC origin
AvaI (738)
BamHI (4629)
HindIII (4611)
ApaLI (2650)
ApaLI (3896) EcoRI (705)
EcoRI (4660)
NcoI (113)
NcoI (2283)
PstI (714)
PstI (1904)
Figure 8: The MCT4 probe plasmid, showing the cloning site where DNA fragment of
MCT4 is inserted (green); the drug-resistance gene (Amp(R)), the replication origin to
allow the plasmid to replicate in the host (pUC origin) and SP6 and T7 promoters that
allows in vitro transcription of sense RNA and antisense RNA respectively.

Characterization of MCTs expression pattern during chick embryo development
50
3. Expression pattern of mct4 during chick embryo development
The expression pattern of chick mct4 was characterized for the first time in this
study. After preparation of the probe, in situ hybridization experiments were performed
in chick embryos from stages HH4 to HH26. By the analysis of Figure 10, we can
observe that for all stages studied, mct4 is expressed in the neural tube and somites,
although it is not expressed in early somites, as we can see for stage HH7. By analysis
of serial transversal sections of these embryos (Figure 11), we found that neither
endoderm nor ectoderm express this gene. We also noticed that mct4 seems to be
mainly expressed in the anterior two thirds of the embryo before stage HH20.
At stage HH7, mct4 is expressed in the neural fold (Figure 11, section b and c)
and open neural plate (Figure 11, section d and e). Expression of mct4 is not observed in
early somites or in either endoderm or ectoderm.
Figure 12 shows stage HH10 (Figure11A) and HH11 (Figure 12C) embryos
hybridized with mct4 probe, and some transverse serial sections from each embryo. At
stage HH10, mct4 expression is detected on the developing head of the embryo, being
this expression confirmed on section a and b of Figure 12B. mct4 is expressed
throughout the neural tube and in the somites (Figure 12, section c and d) and is absent
from the PSM (Figure 12, section e) and notochord (Figure 12, section d and e). By this
stage, mct4 is expressed in the heart. For stage HH11, mct4 has a pattern similar to stage
HH10. The expression of mct4 is also detected in the lateral plate mesoderm and it can
be observed for both stages (Figure11B, section c and d section h and j). At both stages
mct4 expression is not detected either in the endoderm or in the ectoderm.
Figure 9: Optimization of in situ hybridization conditions. A: positive control –
fgf8 – hybridized at 70ºC; B: hydrolized mct4 probe hybridized at 50ºC; C:
hydrolized mct4 probe hybridized at 70ºC.

Characterization of MCTs expression pattern during chick embryo development
51
Figure 11: Details of mct4 expression at stage HH7. A: whole mount in situhybridization, B: Transversal serial sections are shown: a- level of head process b and c- neural fold, d- early somites (es), e- primitive streak (ps). Endoderm (en); ectoderm (ec); open neural plate (onp); pre-somitic mesoderm (psm).
Figure 10: mct4 expression pattern in chick embryos from stage HH4 to HH25, evaluated bywhole mount in situ hybridization. All figures present dorsal view, except for H and J: lateralview.

Characterization of MCTs expression pattern during chick embryo development
52
Figure 13: Dorsal view of embryos stageHH20 (A) and HH25 (B), stained by in situhybridization for mct4. Wing bud (wb),somite (s), neural tube (nt), leg bud (lb).
For stage HH13- and HH15, mct4 expression is detected mainly in the anterior
part of the embryo. It is expressed in the prosencephalon, mesencephal on and
rhombencephalon. Moreover, mct4 expression is observed throughout the neural tube
and in the somites. The lateral plate mesoderm expresses mct4 as happens for other
stages.
In what concerns stage HH20 and HH25, mct4 expression is observed in the
brain (Figure 10). It is expressed throughout the neural tube (Figure 13). On limbs, wing
buds and leg buds, mct4 expression is restricted to mesoderm, being absent from the
ectoderm. In stage 25 it appears that mct4 MCT4 is expressed in the place where digits
will be formed (Figure 13B, red arrow).
Figure 12: Details of mct4 expression at stage HH10 (A, B) and stage HH11 (C, D). Transversal serialsections of each embryo are shown (B, D). prosencephalon (p), mesencephalon (m), optic vesicle (opv),neural tube (nt), notochord (n), somites (s),pre-somitic mesoderm (psm), ectoderm (ec), endoderm (en).

Characterization of MCTs expression pattern during chick embryo development
53
Discussion
Embryonic and fetal developmental is strongly influenced by oxygen availability
in the environment. Several studies have demonstrated the importance of hypoxia for
normal embryonic development in regards to gene expression changes [6]. It is known
that cells have capabilities for surviving in hypoxia environments [3]
The expression of mct4 (MCT4) is detected in all stages of chick embryo
development studied. By analyzing our data we observed that mct4 is mainly expressed
in the anterior two thirds of the embryo, in the neural tube, somites and in the
developing head. Ullah et al [56] showed that MCT4, as the predominant isoform found
in glycolytic cells, is over expressed in hypoxia in order to export high quantities of
lactate. They also described that this up-regulation of MCT4 expression by hypoxia was
mediated by Hif1α. Ota et al [57] analyzed hif1a expression pattern from stage HH4 to
HH14 of chick embryo development by in situ hybridization. Comparing their results
with mct4 expression obtained with this study, we can observe that for stage HH4, mct4
expression does not overlap with hif1α expression. At stage HH7, both genes are
expressed in the neural fold and in the neural plate, although mct4 is not found in the
lateral plate as hif1α. Regarding stage HH10, mct4 and hif1α are both expressed in the
head process and along the neural tube.
From our data, it is possible to observe that mct4 expression is detected in the
heart from stage HH10 to HH15. These results are in accordance with previous studies
in chick embryo performed by Han et al [4]. They demonstrated the expression of
MCT4 during cardiac differentiation of chick embryo. Once early development requires
hypoxic conditions, they showed by immunohistochemical analyses that MCT4 is
expressed within the initial steps of cardiac cell differentiation where EF5, a hypoxia
marker, is also expressed. Thus, they conclude that the MCT4, MCT1 and 5A11
expression during chick embryo development is in agreement with the concept that
development takes place in a low oxygen environment, and that cardiac cellular energy
demands rely on glycolysis. As our data indicate that MCT4 is expressed throughout
chick embryo development, and once it was demonstrated that embryos survive in a low
oxygen environment, it could mean that cells must have the ability to generate energy
by glycolysis during embryogenesis and could use MCT4 for lactate efflux.
Unfortunately, we were not able to determine the expression of other MCT isoforms,
like MCT1, MCT2 and MCT3. More studies are needed to get these results and to
understand the role of MCTs during embryogenesis.

Characterization of MCTs expression pattern during chick embryo development
54
An interesting result is that MCT4 is expressed in the central nervous system
structures from the earliest stages, and this expression is maintained in all stages
studied. The brain has been shown to express three different MCTs: MCT1, MCT2 and
MCT4 [61, 62]. Regarding MCT4 expression it appears to be restricted to astrocytes in
adult brain [63, 64]. Rafiki et al [64] demonstrated that MCT4 is present in astrocytes
during all stages of development. During development of the brain both lactate and
ketone bodies are used as energy substrates [65]. Thus, MCT4 could be exporting
lactate that is produced during glycolysis in astrocyte cells. Lactate enters the
extracellular space from which it is transported by MCT2 for neuron [61].
To conclude, MCT4 is expressed during chick embryo development, as well as
hif1α, as previous described by Ota et al [57]. The expression patterns of both genes
present common domains in some stages, which suggest that MCT4 may play an
important role in regulating intracellular pH by the efflux of lactate, since MCT4 is a
low affinity transporter involved in monocarboxylate efflux and the embryo
development takes place in hypoxic environment, utilizing glycolytic metabolism for
energy supply.

CHAPTER 3– ROLE OF MCTS IN LUNG RAT EMBRYO DEVELOPMENT

Role of MCTs in rat lung embryo development
57
Rattus norvegicus
Rats are one of the most commonly animals used of all laboratory animals. Due
to its extensive use in biomedical research, many biological data about them are
currently available. The rat is widely used as an organism model for the study of normal
processes and illness in the human, mainly because of a vast body of knowledge of the
physiological mechanisms, a significant number of rat models that mimic human
disease and because of the easiness of reproduction. Once genes are identified in rats,
pathophysiological mechanisms can be elucidated, lending clues to the identification of
human genetic counter-parts. The gestation period is only 21 days and litters can
number up to fourteen [66]. The development of the lung appears on the day 14th of
gestation [1] and starts with the appearance of the tracheal outgrowth from de foregut
and ending in early childhood. The bronchial tree develops by branching of the
bronchial epithelium around the mesenchyme [67]. The development of the lung can be
divided into 5 stages: embryonic, pseudoglandular, canalicular, saccular and alveolar
stage .
Embryonic stage starts at 9.5 day pos-conception (dpc) with the budding of
primitive lung mass and at 12 dpc lung bud forms the preliminary trachea and
pulmonary bronchi forming single left lobe and four lobes of the right lung.
Pseudoglandular stage which goes from 13 dpc until 17 dpc is characterized by
expansion of bronchial tree, including formation of the bronchi and bronchioles. At this
stage epithelia cells start to differentiate to form pre alveolar saccules. In the subsequent
canalicular stage (18 dpc-19 dpc) airway branching pattern is completed. During this
sage respiratory bronchioli appears, interstitial tissue decreases and vascularization of
peripheral mesenchyme increases. During saccular stage (20-22 dpc) the pulmonary
parenchyma growth, the connective tissue starts being thin and maturation of the
surfactant system occurs. The last stage, alveolar stage (after birth), is characterized by
alveoli formation through a septation process [68].
Localized hypoxia is a normal component of embryo development, and it seems
to be one of the most important extracellular factor for lung morphogenesis which is a
complex process [69, 70]. Troug et al [69] evaluated the hypoxia effects on lung
development. After exposure of pregnant females for 10 days to hypoxia, rat embryos
were harvested with 14 days of gestation. They used the rat-specific wide array chip
analysis and detected upregulated and downregulated genes after rat lung hypoxia

Role of MCTs in rat lung embryo development
58
exposure. One of the upregulated genes found was MCT4. They concluded that hypoxia
interrupted lung development and that several pathways are involved in this mechanism.
Preliminary results obtained in ICVS showed different expression of MCT1,
MCT2 and MCT4 throughout the embryonic lung development of Rattus Norvegicus.
Since there are no studies in the literature on the expression and activity of these
molecules during lung embryonic development, in this work we aimed to study and
characterize MCT expression in lung development and to evaluate the effect of MCT
inhibition on branching morphogenesis of rat fetal lung.

Role of MCTs in rat lung embryo development
59
Material and Methods
1. Animals model
Female rats were maintained in appropriate cages under controlled conditions.
All pregnant rats were sacrificed by decapitation at 13.5 dpc. After that, fetuses were
removed by caesarean section and the dissection of the lungs was gently made by
Cristina Silva (MD, PhD student).
2. Fetal lung explants cultures
After harvesting of the lung, they were transferred to Nucleopore Membranes
that had been put in DMEM for 1hour in a 24-well culture plates. 200 μL of medium
was added to the explants and they were incubated for one hour in 5 % CO2 at 3 ºC. The
composition of the medium consisted of: 50 % of DMEM, 50 % of nutrient mixture F-
12 (Invitrogen) with 100 mg/mL of streptomycin, 100 units/mL of penicillin
(Invitrogen), 0.25 mg/mL of ascorbic acid (Sigma) and 10 % of fetal calf serum
(Invitrogen). After one hour of incubation 2 μl of the inhibitor was added. Fetal lung
explants were incubated in a 5 % CO2 for 96 h at 37 ºC. The medium was replaced
every 48 h and the inhibitor – CHC - was daily added. Fetal lungs were photographed
daily and D0 was considered the first day and D4 the last. At the end of the incubation
time, explants were subjected a series of washes in PBS and were stored at -80 ºC until
use.
3. Morphometric analysis of lung explant
The lung explants were daily photographed to monitored branching
morphogenesis. The total number of peripheral airway buds (branching) was determined
at D0 and D4, such as the area, using AxionVision Rel. 4.3 software. For all
experimental conditions, the results of branching and area were expressed as D4/D0
ratio.
4. Immunohistochemistry
Immunohistochemistry (IHC) is a technique that consists on the localization of
proteins in a cell or a tissue section. It is based on the linking of a specific antibody (ab)
to an antigen (ag) [71]. For IHC studies paraffin sections of fetuses with 13.5, 15.5,
17.5, 19.5 and 21.5 dpc were used to study MCT expression during lung

Role of MCTs in rat lung embryo development
60
development. IHC was also performed in lung explants used for the inhibition studies.
These lungs explants were fixed in formalin and embedded in paraffin. Sections of 5μm
were used for IHC. IHC was performed according to avidin–biotin–peroxidase complex
principle (R.T.U. VECTASTAIN Elite ABC Kit (Universal), Vector Laboratories).
Paraffin embedded sections were deparaffinized in xylene and hydrated in a graded
series of ethanol. During hydratation paraffin sections were treated with 0.3% hydrogen
peroxide to inactivate endogenous peroxidases. For antigen retrieval, slides were
incubated with 10mM citrate buffered solution (pH 6.0) for 20 min in water bath at
98ºC and then washed in PBS. Slides were incubated with a blocking solution (Normal
Horse Serum) for 20 min and then followed by incubation overnight at room
temperature with the primary antibody:
• MCT1 (AB3538P,Chemicon) diluted 1:200;
• MCT2 (sc-14926, Santa Cruz Biotechnology) diluted 1:50;
• MCT4 (AB3316P, Chemicon) diluted 1:200.
After rinsing in PBS slides were incubated with a secondary biotinylated
antibody for 30 min and then with R.T.U. Vectastain® Elite ABC reagent for 45 min at
37°C. After that, tissues were stained with 3,3′-diamino-benzidine (DAB+ Substrate
System, DakoCytomation) for 10 min, counterstained with haematoxylin and mounted
with Entellan®.
For positive control normal tissue of skin were used for MCT1 and MCT4 and
kidney for MCT2.
The slides were evaluated and then photographed under a microscope.
5. Western Blot
This is an analytical technique used to detect specific proteins in a given sample
of tissue homogenate or extract. For the detection of MCT1, MCT2 and MCT4 the
antibodies used in immunohistochemistry were evaluated by Western Blotting. The
protein was extracted from the lung explants at stage 14. After maceration of the lungs
with lysis buffer, the homogenate was centrifuged at 13000 rpm 15 min at 4ºC. The
supernatants were collected and protein concentrations were determined by using the
Kit DC Protein Assay (BioRad). Protein extracted from fetuses lung of stages 15.5,
17.5, 19.5 and 21.5 were already available. Tissue samples of colon were used as
positive controls for the expression of MCT1, 2, and 4. 20 ug of protein of each sample
were separated on a 10% (w/v) polyacrylamide gel and transferred onto a nitrocellulose

Role of MCTs in rat lung embryo development
61
membrane. After that, membranes were blocked with 0.1% Tween, 5% milk in TBS
for1h and then incubated overnight at 4°C with primary polyclonal antibodies. After
washing with TBS-0.1%Tween, membranes were incubated with the secondary
antibody coupled to horseradish peroxidase (SantaCruz Biotechnology). For MCT1 and
MCT4, the secondary antibody used was an anti-rabbit antibody with a dilution of
1:10000 in TBS-0.1% Tween, 1% milk. For MCT2 and β-actin an anti-goat antibody
with a dilution of 1:5000 in TBS-0.1% Tween, 5% milk was used. At the end, bound
antibodies were visualized by chemiluminescence with the SuperSignal West Femto
Maximum Sensivity Substrate. The results were quantified by ImageJ Software.

Role of MCTs in rat lung embryo development
62
Results
1. Expression of MCTs during lung embryo development
Expression of MCTs was evaluated by Immunohistochemistry and Western
Blot. Preliminary results performed in our laboratory had demonstrated the presence of
MCTs throughout lung development. In the present study we repeated some
immunohistochemical studies with different samples (from other animals) to confirmed
that results. Thus, Immunohistochemistry and Western Blot were carried out on samples
corresponding to stages 14 (13.5 dpc), 16 (15.5 dpc), 18 (17,5 dpc), 20 (19.5 dpc) and
22 (21.5 dpc) of rat lung development for MCT1, MCT2 and MCT4.
1.1 Expression of MCT1
By analysis of Figure 14 we observed that MCT1 is more expressed at the
earliest stage of rat lung development (13.5 dpc) and decreased in subsequent stages
being absent during the saccular stage (19.5 dpc) of rat lung development. For stage 14,
16 and 18 staining is cytoplasmatic and occasionally membrane and it is restricted to the
bronchial epithelium confined to the bronchial lumen. During stage 22 MCT1 is also
expressed in the cytoplasm and membrane of the cells. In this stage, although the
staining appeared in the bronchial epithelium, it also appeared in some stromal cells.
Western blot analysis revealed a band around 50 Kda consistent with the
molecular weight described for this protein (Figure 15). MCT1 expression was observed
in all stages studied. By analysis of Figure 20 it appears that MCT1 expression
decreases along lung development.
Figure 14: Immunohistochemical expression of MCT1 during normal rat lung development. E14:13,5 dpc (n=2); E16: 15,5 dpc (n=2); E18: 17,5 dpc (n=2); E20: 19,5 dpc (n=2); E22: 21,5 dpc (n=2).

Role of MCTs in rat lung embryo development
63
1.2 Expression of MCT2
IHC studies revealed that MCT2 expression is not detected in the earliest stages
of rat lung development, during the pseudoglandular stage (13.5 and 15.5 dpc). But it is
expressed in the bronqui epithelial cells of the canalicular stage (17.5 dpc) and it is
weakly expressed or even absent in stage 20 (Figure 15). By stage 22, MCT2 it is not
expressed in the fetal rat lung. Regarding MCT2 expression during the canalicular stage
(17.5 dpc), it has both a cytoplasmatic and membrane staining and as for MCT1 the
cytoplasmatic expression is restricted to the bronchial epithelium with stronger staining
in the apical region.
For MCT2 we obtained by western blot a band around 50 Kda consistent with
the molecular weight described for this protein (Figure 17). As for MCT1, we observed
that MCT2 is expressed in all stages studied. Protein levels of MCT2 and β-actin were
measured and MCT2 expression seems to increase with lung development (Figure 20).
MCT1
β-actin
E16
E18
E20
E22
MW
Figure 15: Western blotting for MCT1 in fetal rat
lung, E16: 15,5 dpc; E18: 17,5 dpc; E20: 19,5 dpc;
E22: 21,5 dpc. The reference gene used was β-
actin. MW: molecular weight.
52 KDa
Figure 16: Immunohistochemical expression of MCT2 during normal rat lung development. E14:13,5 dpc (n=2); E16: 15,5 dpc (n=2); E18: 17,5 dpc (n=2); E20: 19,5 dpc (n=2); E22: 21,5 dpc (n=2).

Role of MCTs in rat lung embryo development
64
1.3 Expression of MCT4
As for the other isoforms, IHC studies revealed that expression of MCT4 varies
throughout lung development. MCT4 expression is observed in the earliest stage of rat
lung development (13.5 dpc) with a cytoplasmatic and membrane expression in the
bronchial epithelium directed to the bronchial lumen. Differently from what happens to
the other isoforms, MCT4 is also expressed in the peri-bronchial region. This
expression pattern is repeated for stages 18 and 22 although, staining is predominantly
in the membrane, with stromal cells also stained. However, during stages 16 and 20 of
lung development MCT4 expression is absent (Figure 18).
MCT4 expression was also detected in all stages studied, with protein band
around 50 Kda by Western blot (Figure 19). Protein levels of MCT4 and β-actin were
measured with IMAGEJ program and as we can observe in Figure 20, MCT4
expression slightly decreases up to stage 20 and increases from stage 20 to stage 22.
E16
E18
E20
E22
MCT2
Β-actin
MW
Figure 17: Western blotting for MCT2 in fetal
rat lung, E16: 15,5 dpc; E18: 17,5 dpc; E20: 19,5
dpc; E22: 21,5 dpc. The reference gene used was
β-actin. MW: molecular weight.
52 KDa
Figure 18: Immunohistochemical expression of MCT4 during normal rat lung development. E14:13,5 dpc (n=2); E16: 15,5 dpc (n=2); E18: 17,5 dpc (n=2); E20: 19,5 dpc (n=2); E22: 21,5 dpc (n=2).

Role of MCTs in rat lung embryo development
65
Table 7: MCT isoforms expression throughout lung rat embryo development by IHC.
MCT isoform Lung
development stage
IHC expression Localization
MCT1
E14 + Cytoplasmatic and membrane; Bronchial epithelium;
E16 + ´´ E18 + ´´ E20 -
E22 + Cytoplasmatic and membrane;
Bronchial epithelium; Stromal cells
MCT2
E14 - E16 -
E18 + Cytoplasmatic and membrane; Bronchial epithelium;
E20 - E22 -
MCT4
E14 + Cytoplasmatic and membrane; Peri-bronchial and Bronchial epithelium;
E16 -
E18 + Cytoplasmatic and membrane;
Peri-bronchial and Bronchial epithelium; Stromal cells;
E20 -
E22 + Cytoplasmatic and membrane;
Peri-bronchial and Bronchial epithelium; Stromal cells;
(+) – positive expression; (-) – negative expression
MCT4
Β-actin
Figure 19: Western blotting for MCT4 in fetal rat lung, E14: 13,5 dpc; E16: 15,5 dpc; E18: 17,5 dpc; E20: 19,5 dpc; E22: 2w1,5 dpc. The reference gene used was β-actin; MW: molecular weight.
E16
E18
E20
E22
E14 MW
Figure 20: MCT isoform expression throughout lung rat embryo
development (E16-E22). Quantification of western blot results of
Figs 14.16 e 18. Results are presented as MCT/β- actin ratio.

Role of MCTs in rat lung embryo development
66
1. MCT inhibition in lung explants
Lung explants were cultured and treated with CHC to determine which would be
the effect of MCT inhibition in branching morphogenesis of the lung. For that it was
studied different doses of CHC (0.1mM to 50 mM).
The first experiments were performed with the addition of 2μl of inhibitor
directly in explant culture. However, for higher concentrations (10 and 50mM) we
observed a pH alteration of the medium (this changed color). In fact after 24h of
incubation these lungs showed no viable. In Figure 22, representative examples of fetal
lung explants of these experiments are illustrated. Comparing fetal lung explants treated
with 0.1mM and 1mM with control (DMSO) at D4, it appears that CHC had an inhibitor
effect. On the other hand, as lung explants treated with 10 and 50 mM were not viable at
D4 we decided to perform an experiment where the medium pH with the inhibitor was
controlled (pH 7.4) before being added to the explants culture. In Figure 22,
representative examples of fetal lung explants, with pH controlling, are illustrated.
Comparing fetal lung explants treated with CHC at D4 with control (DMSO) it appears
that CHC had an inhibitory effect.
Morphometric analysis results, of the fetal lung explants are shown in Figure 22.
CHC appears to have an inhibitor effect in branching morphogenesis of lung
development in a dose dependent way. However, the number of lung explants used for
each concentration is low. These experiments should be repeated in a higher
representative sample to confirm these results.
Figure 21: Rat lung explant system treated with increasing concentrations of CHC. Upper image, lung explant
with no treatment (control) at D0; bottom lung explants treated with increasing doses of CHC at D4.
Experiment with no pH controlling of inhibition solutions.

Role of MCTs in rat lung embryo development
67
Figure 23: Morphometric branching analysis of rat lung explant system treated with different
CHCdoses: total number of peripheral airway buds (D4/D0 ratio). DMSO (n=3); 1mM (n=6);
10mM (n=3)
0
2
4
6
8
10
12
14
DMSO 1mM 10mM
Num
ber o
f periphe
ral
airw
ay bud
s (D4/D0)
CHC concentration
Figure 22: Rat lung explant system treated with increasing concentrations of CHC. Upper image lung
explant with no treatment (control) at D0 and at the bottom lung explants treated with increasing doses of
CHC at D4. Experiment with pH controlled.

Role of MCTs in rat lung embryo development
68
DISCUSSION
Lung development involves several biochemical, cellular and ultrastructural
changes [70] There are no studies on the role of MCTs during lung embryo
development. The present study demonstrated that in normal fetal lung, MCT isoform
expression varies throughout the lung development stages. MCT1 and MCT4 were
expressed in primitive epithelial cells as early as the pseudoglandular stage (13.5 dpc) of
lung development while MCT2 was absent on this stage. Stage 14 samples used were
lungs harvested from embryos which were cultured for 96 hours and this fact could
have interfered with protein expression. Thus, it is important to repeat those studies
using freshly harvested lungs from embryo at 13.5 dpc. Regarding stage 16 and 18,
MCT1 remained expressed although with a lower intensity. MCT2 was not expressed in
stage 16 however, during canalicular stage (17.5 dpc) it was expressed in the cytoplasm
and membrane of bronchial epithelium cells. MCT4 was not expressed in stage 16, but
its expression was detected during canalicular stage. Curiously, during saccular stage
(19.5 dpc) no MCT isoform was expressed, which could be due to the fact that this
stage is characterized by alveolar formation. On stage 22, MCT1 and MCT4 were both
expressed in the bronchial epithelium cells, in the peri-bronchial region and in the
stroma.
Since for western blot samples (homogenized tissue), which contained other
cells rather than lung tissue (e.g. erythrocytes) was used, we obtained MCT positivity
for stages that were negative by IHC. Besides, we obtained a blot with some bands with
different sizes. This could be due to the fact that the antibodies used were described as
human specific and only with 60% of homology with rat. Bonen et al [72] performed a
study where they examined MCT protein expression in a large number of rat adult
tissues. They used several antibodies for each MCT isoform, and they used the same
antibodies for MCT1 and MCT4 as we used. They conclude that these antibodies
detected bands with different sizes in rat tissues (35 KDa for MCT1 and some bands
between 35-50 KDa for MCT4) from those obtained in human tissues (46 KDa for
MCT1 and 52 KDa for MCT4). However, this report is only based by the visualization
of the blot and, in their study, they did not do complementary analysis such as
densitometric quantitation, correlation with mRNA and peptide antigen blocking, to
validate specificity. Besides, we compared our results with human tissue. Thus,

Role of MCTs in rat lung embryo development
69
We considered the band corresponding to the size of our human positive control (around
50 KDa).
Our data demonstrated that the three MCT isoforms are distinctly expressed
throughout rat lung embryonic stages development, suggesting that they could be
involved in lung development. MCTs have already been identified in other organs
during embryo development. Han et al [4] demonstrated that MCT4 is expressed during
chick cardiac cell development and that MCT4 is crucial for cell development in
hypoxic environment of embryogenesis. Troug et al [69] showed that after 10 days of
exposure to hypoxia, MCT4 was one of the genes upregulated in fetal lung. Thus,
MCTs may have an important role during lung embryo development, and could be
related with the adaptation of the pulmonary cells to hypoxia.
In order to understand if MCTs played a role in lung morphogenesis, some
studies using a fetal lung explant models were performed. Increasing doses of CHC,
inhibitor of MCTs, were added to lung explant and it was observed that as CHC
concentration increased, the lungs presented higher branching inhibition and with the
higher dose (50mM) they were not viable. Also the sample number should be higher.
Although CHC is considered as a classical inhibitor for MCT activity, it is not only
specific for these transporters and can inhibit others anion exchangers as mitochondrial
pyruvate transporter however, there are no evidences showing CHC plasma membrane
uptake [73]. Thus, further experiments (e.g. RNAi) should be done to determine the
specific role of MCTs on branching morphogenesis in lung development.


CHAPTER 4 – CONCLUSION


The role of MCTs on embryonic development
73
CONCLUSION
Embryonic developmental is strongly influenced by oxygen availability in the
environment [2]. Several studies have demonstrated the importance of hypoxia for
normal embryonic development in regards to gene expression changes [3]. It is known
that cells are able to surviving in hypoxia environments using glycolytic metabolism to
supply energy. In this study we used two animal models, Gallus gallus and Rattus
norvegicus, where MCT expression was characterized. The expression of mct4 varies
throughout chick embryo development. Regarding rat embryo lung development the
expression of MCT1, MCT2 and MCT4 also varies. However, more studies will be
need in both organisms to understand the role of MCTs in embryogenesis and to prove
embryo dependence on MCT activity.


REFERENCES

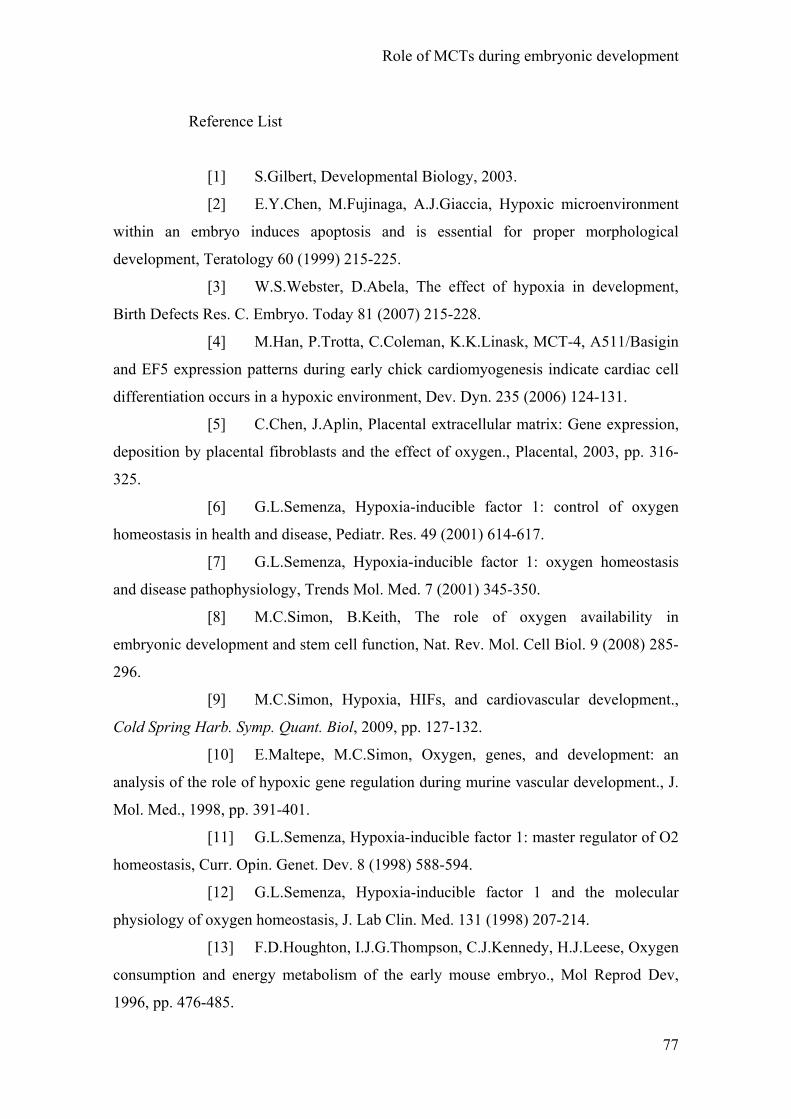
Role of MCTs during embryonic development
77
Reference List
[1] S.Gilbert, Developmental Biology, 2003.
[2] E.Y.Chen, M.Fujinaga, A.J.Giaccia, Hypoxic microenvironment
within an embryo induces apoptosis and is essential for proper morphological
development, Teratology 60 (1999) 215-225.
[3] W.S.Webster, D.Abela, The effect of hypoxia in development,
Birth Defects Res. C. Embryo. Today 81 (2007) 215-228.
[4] M.Han, P.Trotta, C.Coleman, K.K.Linask, MCT-4, A511/Basigin
and EF5 expression patterns during early chick cardiomyogenesis indicate cardiac cell
differentiation occurs in a hypoxic environment, Dev. Dyn. 235 (2006) 124-131.
[5] C.Chen, J.Aplin, Placental extracellular matrix: Gene expression,
deposition by placental fibroblasts and the effect of oxygen., Placental, 2003, pp. 316-
325.
[6] G.L.Semenza, Hypoxia-inducible factor 1: control of oxygen
homeostasis in health and disease, Pediatr. Res. 49 (2001) 614-617.
[7] G.L.Semenza, Hypoxia-inducible factor 1: oxygen homeostasis
and disease pathophysiology, Trends Mol. Med. 7 (2001) 345-350.
[8] M.C.Simon, B.Keith, The role of oxygen availability in
embryonic development and stem cell function, Nat. Rev. Mol. Cell Biol. 9 (2008) 285-
296.
[9] M.C.Simon, Hypoxia, HIFs, and cardiovascular development.,
Cold Spring Harb. Symp. Quant. Biol, 2009, pp. 127-132.
[10] E.Maltepe, M.C.Simon, Oxygen, genes, and development: an
analysis of the role of hypoxic gene regulation during murine vascular development., J.
Mol. Med., 1998, pp. 391-401.
[11] G.L.Semenza, Hypoxia-inducible factor 1: master regulator of O2
homeostasis, Curr. Opin. Genet. Dev. 8 (1998) 588-594.
[12] G.L.Semenza, Hypoxia-inducible factor 1 and the molecular
physiology of oxygen homeostasis, J. Lab Clin. Med. 131 (1998) 207-214.
[13] F.D.Houghton, I.J.G.Thompson, C.J.Kennedy, H.J.Leese, Oxygen
consumption and energy metabolism of the early mouse embryo., Mol Reprod Dev,
1996, pp. 476-485.

Role of MCTs during embryonic development
78
[14] J.R.Clough, Metabolism of (14C)glucose by postimplantation
mouse embryos in vitro., J Embryol Exp Morphol, 1983, pp. 133-142.
[15] B.Fischer, B.D.Bavister, Oxygen tension in the oviduct and uterus
of rhesus monkeys, hamsters and rabbits., J Reprod Fertil, 1993, pp. 673-679.
[16] S.Akazawa, T.Unterman, B.E.Metzger, Glucose metabolism in
separated embryos and investing membranes during organogenesis in the rat.,
Metabolism, 1994, pp. 830-835.
[17] H.Morales, P.Tilquin, J.F.Rees, Pyruvate prevents peroxide-
induced injury of in vitro preimplantation bovine embryos., Mol. Reprod. Dev., 1999,
pp. 149-157.
[18] R.J.Partridge, H.J.Leese, Consumption of amino acids by bovine
preimplantation embryos., Reprod. Fertil.Dev., 1996, pp. 945-950.
[19] L.Butcher, A.Coates, K.L.Martin, Metabolism of pyruvate by
early human embryo., Biol. Reprod., 1998, pp. 1054-1056.
[20] F.Hérubel, S.Mouatassim, I.Guérin, R.Frydman, V.Ménézo,
Genetic expression of monocarboxylate transporters during human and murine oocyte
maturation and early embryonic development, Zygote, 2002, pp. 175-181.
[21] W.B.Busa, R.Nucitelli, Metabolic regulation via intracellular pH.,
Am J Physiol, 1984, pp. 409-438.
[22] R.W.Putnam, Intracellular pH regulation., 1995, pp. 212-229.
[23] A.K.Sater, J.M.Alderton, R.A.Steinhardt, An increase in
intracellular pH during neural induction in Xenopus., Development, 1994, pp. 433-442.
[24] D.R.Gutknecht, C.H.Koster, L.G.J.Tertoolen, S.W.Delaat,
A.J.Durston, Intracellular acidification of gastrula endoderm is important for posterior
axial development in Xenopus., Development, 1995, pp. 1911-1925.
[25] E.A.Harding, C.A.Gibb, M.H.Johnson, D.I.Cook, M.L.Day,
Developmental changes in the management of acid loads during preimplantation mouse
development, Biol. Reprod. 67 (2002) 1419-1429.
[26] A.P.Halestrap, N.T.Price, The proton-linked monocarboxylate
transporter (MCT) family: structure, function and regulation, Biochem. J. 343 Pt 2
(1999) 281-299.
[27] S.P.Mathupala, C.B.Colen, P.Parajuli, A.E.Sloan, Lactate and
malignant tumors: a therapeutic target at the end stage of glycolysis, J. Bioenerg.
Biomembr. 39 (2007) 73-77

Role of MCTs during embryonic development
79
[28] J.M.Berg, J.L.Tymoczko, L.Stryer, Biochemistry., New York,WH
Freeman, 2006.
[29] S.Yeluri, B.Madhok, K.R.Prasad, P.Quirke, D.G.Jayne, Cancer's
craving for sugar: an opportunity for clinical exploitation, J. Cancer Res. Clin. Oncol.
135 (2009) 867-877.
[30] R.C.Poole, A.P.Halestrap, Transport of lactate and other
monocarboxylates across mammalian plasma membranes, Am. J. Physiol 264 (1993)
C761-C782.
[31] R.A.Robergs, F.Ghiasvand, D.Parker, Biochemistry of exercise
induced metabolic acidosis. Am J Physiol Regul Integr Comp Physiol, 2004, pp. 502-
516.
[32] A.P.Halestrap, D.Meredith, The SLC16 gene family-from
monocarboxylate transporters (MCTs) to aromatic amino acid transporters and beyond,
Pflugers Arch. 447 (2004) 619-628.
[33] N.T.Price, V.N.Jackson, A.P.Halestrap, Cloning and sequencing
of four new mammalian monocarboxylate transporter (MCT) homologues confirms the
existence of a transporter family with an ancient past, Biochem. J. 329 ( Pt 2) (1998)
321-328.
[34] J.E.Manning Fox, D.Meredith, A.P.Halestrap, Characterisation of
human monocarboxylate transporter 4 substantiates its role in lactic acid efflux from
skeletal muscle, J. Physiol 529 Pt 2 (2000) 285-293. bv
[35] D.K.Kim, et al., Expression cloning of a Na_-independent
aromatic amino acid transporter with structural similarity to H_/monocarboxylate
transporters. 276:17221-17228., J Biol Chem, 2001, pp. 17221-17228.
[36] M.C.Wilson, et al., Lactic acid efflux from white skeletal muscle
is catalyzed by the monocarboxylate transporter isoform MCT3, J. Biol. Chem. 273
(1998) 15920-15926.
[37] C.K.Garcia, J.L.Goldstein, R.K.Pathak, R.G.Anderson,
M.S.Brown, Molecular characterization of a membrane transporter for lactate,
pyruvate, and other monocarboxylates: implications for the Cori cycle. Cell, 1994, pp.
865-873.
[38] C.K.Garcia, X.Li, J.Luna, U.Francke, cDNA cloning of the
human monocarboxylate transporter 1 and chromosomal localization of the SLC16A1
locus to 1p13.2-p12. Genomics, 1994, pp. 500-503

Role of MCTs during embryonic development
80
[39] N.Merezhinskaya, W.N.Fishbein, Monocarboxylate transporters:
past, present, and future, Histol. Histopathol. 24 (2009) 243-264.
[40] C.Garcia, M.Brown, J.Goldstein, cDNA cloning of MCT2, a
second monocarboxylate transporter expressed in different cells than MCT1., Journal of
Biology Chemistry, 1995, pp. 1843-1849.
[41] R.William, The influence of aging and cardiovascular training
status upon monocarboxylate transporters, 2005.
[42] H.Yoon, N.J.Philp, Genomic structure and developmental
expression of the chicken nonocarboxylate transporter MCT3 gene, Exp. Eye Res. 67
(1998) 417-424.
[43] N.J.Philp, H.Yoon, L.Lombardi, Mouse MCT3 gene is expressed
preferentially in retinal pigment and choroid plexus epithelia, Am. J. Physiol Cell
Physiol 280 (2001) C1319-C1326.
[44] K.S.Dimmer, B.Friedrich, F.Lang, J.W.Deitmer, S.Broer, The
low-affinity monocarboxylate transporter MCT4 is adapted to the export of lactate in
highly glycolytic cells, Biochem. J. 350 Pt 1 (2000) 219-227.
[45] P.Kirk, et al., CD147 is tightly associated with lactate transporters
MCT1 and MCT4 and facilitates their cell surface expression, EMBO J. 19 (2000)
3896-3904.
[46] M.C.Wilson, et al., Basigin (CD147) is the target for
organomercurial inhibition of monocarboxylate transporter isoforms 1 and 4: the
ancillary protein for the insensitive MCT2 is EMBIGIN (gp70), J. Biol. Chem. 280
(2005) 27213-27221.
[47] J.L.Jiang, J.Tang, CD147 and its interacting proteins in cellular
functions, Sheng Li Xue. Bao. 59 (2007) 517-523.
[48] R.C.Poole, A.P.Halestrap, Interaction of the erythrocyte lactate
transporter (monocarboxylate transporter 1) with an integral 70-kDa membrane
glycoprotein of the immunoglobulin superfamily, J. Biol. Chem. 272 (1997) 14624-
14628.
[49] J.Su, X.Chen, T.Kanekura, A CD147-targeting siRNA inhibits the
proliferation, invasiveness, and VEGF production of human malignant melanoma cells
by down-regulating glycolysis, Cancer Lett. 273 (2009) 140-147.

Role of MCTs during embryonic development
81
[50] B.E.Enerson, L.R.Drewes, Molecular features, regulation, and
function of monocarboxylate transporters: implications for drug delivery, J. Pharm. Sci.
92 (2003) 1531-1544.
[51] M.Lane, D.K.Gardner, Lactate Regulates Pyruvate Uptake and
Metabolism in the Preimplantation Mouse Embryo, Biology of Reproduction, 2000, pp.
16-22.
[52] E.A.Harding, M.L.Day, C.A.Gibb, M.H.Johnson, D.I.Cook, The
activity of the H+-monocarboxylate cotransporter during pre-implantation development
in the mouse, Pflugers Arch. 438 (1999) 397-404.
[53] H.Rashidi, V.Sottile, The chick embryo: hatching a model for
contemporary biomedical research, Bioessays 31 (2009) 459-465.
[54] R.Bellairs, M.Osmond, The Atlas of Chick Development,
Elsevier, 2003.
[55] V.Hamburger, H.L.Hamilton, A series of normal stages in the
development of the chick embryo. 1951, Dev. Dyn. 195 (1992) 231-272.
[56] M.S.Ullah, A.J.Davies, A.P.Halestrap, The plasma membrane
lactate transporter MCT4, but not MCT1, is up-regulated by hypoxia through a HIF-
1alpha-dependent mechanism, J. Biol. Chem. 281 (2006) 9030-9037.
[57] K.Ota, H.Nagai, G.Sheng, Expression and hypoxic regulation of
hif1á and hif2á during early blood and endothelial cell diferentiation in chick., Gene
Expression Patterns, 2007, pp. 761-766.
[58] L.Jin, R.V.Lloyd, In situ hybridization: Methods and
Applications, Journal of Clinical Laboratory Analysis, 1997, pp. 2-9.
[59] M.DeBlock, D.Debrouver, Procedures for in situ hybridization to
Chromosomes, Cells and Tissue Sections, In Situ, 1993, pp. 172-177.
[60] F.C.Almeida, A.Ferraz, In situ hybridization with non-radioactive
riboprobes: principles and aplications in pathology, J Bras Patol Med Lab, 2006, pp.
207-213.
[61] L.H.Bergersen, Is lactate food for neurons? Comparison of
monocarboxylate transporter subtypes in brain and muscle, Neuroscience, 2007, pp. 11-
19.
[62] L.Pellerin, L.H.Bergersen, A.P.Halestrap, K.Pierre, Cellular and
subcellular distribution of monocarboxylate transporters in cultured brain cells and in
the adult brain, J. Neurosci. Res. 79 (2005) 55-64.

Role of MCTs during embryonic development
82
[63] L.Bergersen, et al., A novel postsynaptic density protein: the
monocarboxylate transporter MCT2 is colocalized with delta 2 glutamate receptors in
postsynaptic densities of parallel fiber-Purkinje cell synapses.136:523-534., Exp Brain
Res, 2001, pp. 523-534.
[64] A.Rafiki, J.L.Boulland, A.P.Halestrap, O.P.Ottersen, L.Bergersen,
Highly differential expression of the monocarboxylate transporters MCT2 and MCT4 in
the developing rat brain, Neuroscience 122 (2003) 677-688.
[65] L.H.Bergersen, Lactate in the brain--without turning sour, 2006,
pp. 2094-2097.
[66] L.Van Zupten, V.Baumans, A.Beyneu, Principles of Laboratory
animal science, Elsevier., 2001.
[67] R.J.Metzger, The branching programme of mouse lung
development., Nature, 2008, pp. 745-751.
[68] I.Copland, M.Post, Lung development and fetal lung growth,
Paediatr. Respir. Rev. 5 Suppl A (2004) S259-S264.
[69] W.E.Truog, et al., Chronic hypoxia and rat lung development:
analysis by morphometry and directed microarray, Pediatr. Res. 64 (2008) 56-62.
[70] Y.Saini, Hif1á is essential for normal intrauterine diferentiation
of alveolar epithelium and surfactant production in the newborn lung of mice., Journal
of Biological Chemistry, 2008, pp. 1-18.
[71] Handbook Immunochemical staining Methods, T.Boenisch,Dako
Corporation.
[72] A.Bonen, et al., Abundance and subcellular distribution of MCT1
and MCT4 in heart and fast-twitch skeletal muscles, Am. J. Physiol Endocrinol. Metab
278 (2000) E1067-E1077.
[73] M.Gareskog, P.Wentzel, N-Acetylcysteine and a-cyano-4-
hydroxycinnamic acid alter protein kinase C (PKC)-d and PKC-z and diminish
dysmorphogenesis in rat embryos cultured with high glucose in vitro, Journal of
Endocrinology, 2007, pp. 207-214.
Top Related