


Línguas
Páginas
Legal


Joana Rosa
A web-based
framework devised
using a
ModelViewController
architecture
Relatório de Estágio submetida como
requisito parcial para obtenção do grau
de Mestre em Engenharia Biomédica
Júri
Presidente (Prof. Doutor, Helena Caria,
ESS/IPS)
Orientador (Prof. Doutor, Ricardo Matias,
ESS/IPS)
Vogal (Prof. Doutor, Cláudio Sapateiro,
ESTSetúbal/IPS)
13 de Março, 2015

A web-based framework devised using a
ModelViewController architecture
Relatório de Estágio do 2º ano
Mestrado em Engenharia Biomédica - Desporto e reHabilitação
Joana Rosa nº120289004
Orientador: Prof. Doutor Ricardo Matias
Setúbal,
13 de Março, 2015


AGRADECIMENTOS
i
Agradecimentos
A elaboração deste trabalho não seria exequível sem o apoio, o empenho e
a motivação de distintas pessoas.
Em primeiro lugar, ao Professor Doutor Ricardo Matias pela oportunidade
deste estágio, pela sua disponibilidade, ensinamento, apoio e motivação.
Ao Engenheiro Hugo Silva que durante estes meses, sempre me recebeu
com cordialidade e sempre disponível com o seu conhecimento técnico, apoio,
paciência e incentivo. Sem ele, a concretização deste trabalho nunca seria
possível.
À Professora Doutora Ana Fred por me ter dado a oportunidade única de
trabalhar com a equipa BIT do Instituto de Telecomunicações do Instituto
Superior Técnico. Estes mantêm uma colaboração com o Laboratório de
Movimento Humano da Escola Superior de Saúde do Instituto Politécnico de
Setúbal, o que me permitiu usufruir deste trabalho conjunto.
À Equipa BIT, que se destaca pelo seu bom ambiente, camaradagem, mas
sobretudo pela sua grande motivação, paixão e alegria no trabalho, capaz de
inspirar qualquer um.
Aos meus colegas do laboratório de Movimento Humano da Escola
Superior de Saúde do Instituto Politécnico de Setúbal, João Magarreiro, Ana
Antunes e Rodrigo Martins pelo vosso apoio e preocupação.
À minha grande amiga Sofia Patrocínio. Mesmo longe está sempre
disponível para ajudar. Ao Tiago Brito Esteves e a todos os outros amigos pelo
apoio, força e amizade verdadeira, obrigada.
À Minha Família, Tios, Primos, Afilhados, Compadres e em especial aos
Meus Pais, António e Lúcia Rosa, ao Meu Irmão Ricardo Rosa, à Minha Cunhada
Patrícia Laia, Sobrinho e Afilhado Rafael e Avó Matilde, um enorme obrigada por
acreditarem sempre em mim e naquilo que faço e por todos os ensinamentos de
vida. Espero que esta etapa, que agora termino, possa, de alguma forma, retribuir
e compensar todo o carinho, apoio e dedicação que, constantemente, me oferecem.

RESUMO
ii
Resumo
Este trabalho tem como objetivo desenvolver uma web-based framework
devised using a ModelViewController architecture. Esta aplicação foi
desenvolvida para a elaboração de relatórios de análise de marcha ou movimento
do complexo do ombro, utilizando os benefícios da modelagem biomecânica do
OpenSim. Foi construído combinando as tecnologias web e a linguagem de
programação Python, de forma a melhorar a usabilidade, interação,
extensibilidade e acrescentar um grau de automação necessário em aplicações
clínicas.
A interface foi projetada sob uma arquitetura Model-View-Controller
(MVC) num servidor web Apache.
Esta permite aos usuários efectuarem upload de informações clínicas do
paciente (por exemplo, informações sobre gênero, idade, dor, incapacidade e
outros), determinar como o modelo de antropometria musculoesquelético
selecionado deve ser modificado, de modo a que corresponda melhor às
características dos pacientes e em que grau o segmento de cada modelo
(marcadores), deve coincidir com os dados de movimento recolhidos durante o
processo de cinemática inversa. Por fim permite ao usuário definir as variáveis de
relatório; se o relatório deve conter resultados de um dado ensaio, uma análise
inter-ensaios ou comparar o movimento reconstruído com conjunto de dados
normativos correspondentes; se a classificação apresenta uma disfunção do
movimento e qual é a sua precisão; bem como pode colocar anotações com
informação para cada gráfico.
A interface foi testada com o Sytem Usability Scale (SUS) em dois grupos,
que são representativos dos potenciais usuários: a) estudantes de engenharia
biomédica; b) clínicos e estudantes de fisioterapia. Neste teste, avaliámos a
usability (com scores de 74,2 e 84,4 para o grupo a) e b), respetivamente) e a
learnability (com scores de 67,9 e 78,6 para o grupo a) e b), respetivamente)
demonstrando que a interface é útil, clara, fácil de usar, intuitiva e recomendável.
Palavras-chave: Web framework, Movimento Humano, Database, Metadata

ABSTRACT
iii
Abstract
This work aims to develop a web-based framework devised using a
ModelViewController architecture. This application was developed to preparate
gait or shoulder movement analysis reports using the benefits of the
biomechanical modeling from OpenSim. It was built combining the advantages of
web based technologies and the Python programming language, in order to
improve the usability, interaction, extensibility and add a degree of necessary
automation in clinical applications.
This interface was designed under a Model-View-Controller (MVC)
architecture in an Apache web server.
The users can upload patient clinical information (e.g. gender, age, pain and
disability information, and others), choose how the selected musculoskeletal
model anthropometry should be modified so it can best match patients
characteristics and in which degree each model’s segment (markers) should
concur with the collected motion data during the inverse kinematics process.
Finally, the user is able to select the report variables; if it should encapsulate
results of one given trial, an inter-trials analysis or compare the reconstructed
motion with the match normative data set; if the classification presents a
movement disorder and what´s its accuracy; as well as write annotations in each
plot.
The interface was tested with Sytem Usability Scale (SUS) in two groups,
which represent the potential end-user populations: a) Biomedical engineering
students; b) Physiotherapy Clinicians and students. In this test we have tested the
usability (with scores of 74,2 and 84,4 for group a) and b), respectively) and
learnability (with scores of 67,9 and 78,6 for group a) and b), respectively) of the
interface, proving that it is useful, clear, easy-to-use and learn and
recommendable.
Keywords: Web framework, Human motion, Database, Metadata.

CONTENTS
iv
Contents Agradecimentos ......................................................................................... i
Resumo ..................................................................................................... ii
Abstract .................................................................................................... iii
Contents ................................................................................................... iv
List of Figures .......................................................................................... vi
List of Tables............................................................................................. x
Introduction ............................................................................................... 1
1.1. Motivation ........................................................................................... 2
1.2. Objectives ........................................................................................... 4
1.3. Structure of the document ................................................................ 5
Chapter 2 ................................................................................................... 6
Literature review ....................................................................................... 6
2.1. Musculoskeletal System ................................................................... 6
2.1.1. The skeletal system ................................................................................ 6
2.1.1.1. Cartilage ............................................................................................. 6
2.1.1.2. Skeleton .............................................................................................. 7
2.1.2. Muscular System.................................................................................... 9
2.2. Kinematic models ............................................................................ 11
2.3. Modeling Software ........................................................................... 13
2.3.1. Clinical benefits versus clinical limitations ........................................ 14
2.3.2. OpenSim .............................................................................................. 14
2.3.2.1. Motion Reconstruction with OpenSim .............................................. 16
Chapter 3 ................................................................................................. 20
Methodology ........................................................................................... 20
3.1. System requirements ...................................................................... 20
3.2. System Architecture ........................................................................ 21
3.2.1. Model code .......................................................................................... 23
3.2.2. View ..................................................................................................... 28
3.2.3. Controller ....................................................................................... 53
3.2.4. System Usability Scale......................................................................... 56

CONTENTS
v
Chapter 4 Results ............................................................................... 58
4.1.1. View ..................................................................................................... 58
4.1.1.1. Controller ......................................................................................... 70
4.1.1.2. Model ................................................................................................ 71
4.1.2. Usability and Learnability Assessment ............................................... 73
Chapter 5 Discussion ............................................................................. 74
Chapter 6 Conclusions and future work ............................................... 77
6.1. Conclusions ..................................................................................... 77
6.2. Future work ...................................................................................... 78
6.3. Current Work Publications .............................................................. 78
References .............................................................................................. 80
Appendix I ................................................................................................ A

LIST OF FIGURES
vi
List of Figures
Figure 1.1- Improvements that the CDSS offers to the clinicians……………….3
Figure 2.1 - Cartilage types……………………………………………………….7
Figure 2.2 - Bone types…………………………………………………………...8
Figure 2.3 – Types of Synovial Joint……………………………………………..9
Figure 2.4 – Muscle fiber………………………………………………………..10
Figure 2.5 - Overview of musculoskeletal models and their interaction………..11
Figure 2.6 - Screenshot from OpenSim. Gait2354 model used in interface.
Muscles are shown as red lines; virtual markers are shown as pink spheres…….15
Figure 2.7 - Experimental marker positions are measured with motion capture
equipment (pink spheres). Virtual markers are placed on a model in anatomical
correspondence. ………………………………………………………………….17
Figure 2.8 - Inputs and Outputs of the Scale Tool in gait model - Experimental
data is shown in green; OpenSim files (.osim) are shown in red; settings files are
shown in blue…………………………………………………………………….18
Figure 2.9 - Inverse Kinematics (IK) Tool Overview. Inputs and Outputs of the
IK Tool in gait model. Experimental data are shown in green; OpenSim files
(.osim) are shown in orange; settings files are shown in blue and motion file
generated are show in purple. Graph with angular data of the motion file.
Redrawn and adapted from Antonio Araujo……………………………………..19
Figure 3.1 – Requirements for front-end and back-end of interface…………….20
Figure 3.2 - Interface architecture: HTTP - HyperText Transfer Protocol, wb –
WebScocket………………………………………………………………………22
Figure 3.3 - Search the elements of setup_scale file in Python………………….24
Figure 3.4 - Search the elements of setup_IK file in Python……………………24
Figure 3.5 - Elements are sending for setting function…………………………24
Figure 3.6 - Function changesettingsScaleMarker in Python…………………..25
Figure 3.7 - Function changesettingsScale……………………………………...25
Figure 3.8 - Function changesettingsIK………………………………………...26

LIST OF FIGURES
vii
Figure 3.9- Function changeout…………………………………………………26
Figure 3.10 - Function changemarkerScale……………………………………..27
Figure 3.11 - Function changemarkerIK………………………………………..27
Figure 3.12 – Function process………………………………………………….27
Figure 3.13 – Function anatomico……………………………………………….28
Figure 3. 14 – Function dados…………………………………………………..28
Figure 3.15- Home page html code……………………………………………...29
Figure 3.16 – D3.js html code…………………………………………………...29
Figure 3.17 - Function pacient…………………………………………………..30
Figure 3.18 - Function motfile…………………………………………………..30
Figure 3. 19 - Patient Clinical Data page html code…………………………..32
Figure 3.20- Function Validate()……………………………………………….33
Figure 3.21 - Upload files page…………………………………………………33
Figure 3.22 – Model drop-down list html code…………………………………34
Figure 3.23 – Marker file drop-down list html code……………………………34
Figure 3.24 – Upload static and dynamic file html code……………………….35
Figure 3.25- Checkbox and submit button html code………………………….35
Figure 3.26 - Function checkCheckBoxes()……………………………………36
Figure 3.27- Function markerchecked………………………………………….37
Figure 3.28 - Function setting…………………………………………………..37
Figure 3.29 -Tabs of widgets html code………………………………………...38
Figure 3.30 – Continuation of Tabs of widgets html code………………………39
Figure 3.31 - Function checkvalue………………………………………………39
Figure 3.32 - Function IKMarker……………………………………………….40
Figure 3.33- Button with right icon and button with wrong icon……………….40
Figure 3.34– Function settingsfile……………………………………………….40
Figure 3.35 - Function changesettings…………………………………………..41

LIST OF FIGURES
viii
Figure 3.36 – Function outfile…………………………………………………..42
Figure 3.37 - Function dynamic…………………………………………………43
Figure 3.38 – Function motfile…………………………………………………..43
Figure 3.39 – Select Motion file page html code………………………………..44
Figure 3.40– Function send……………………………………………………...44
Figure 3.41- Html code of Report Variables page………………………………45
Figure 3.42- Function number…………………………………………………..45
Figure 3.43- Function subplots………………………………………………….46
Figure 3.44 – Function header…………………………………………………..47
Figure 3.45- Report button………………………………………………………48
Figure 3.46- Html code of Inverse Kinematics page……………………………48
Figure 3.47 – Function draw_suplot…………………………………………….49
Figure 3.48– Function get_field…………………………………………………50
Figure 3.49 – Function graph……………………………………………………51
Figure 3.50 – Function plotAccordingToChoices……………………………….52
Figure 3.51 – Continuation of function plotAccordingToChoices……………..53
Figure 3.52 - WebSocket builder………………………………………………..54
Figure 3.53 - Libraries in python………………………………………………..54
Figure 3.54 - The server protocol………………………………………………..55
Figure 3.55 Class ServerBITFactory…………………………………………...56
Figure 3.56- Class ServerBITFactory…………………………………………...57
Figure 4.1 - The SUS response format…………………………………………58
Figure 4.2 - Home page………………………………………………………...59
Figure 4.3 – Options in homepage……………………………………………..60
Figure 4.4 – Patient clinical and sociodemographic information………………61
Figure 4.5 - Upload Files page…………………………………………………61

LIST OF FIGURES
ix
Figure 4.6- Drop-down list (Model)……………………………………………62
Figure 4.7 - Drop-down list (Marker file)……………………………………...63
Figure 4.8 – Select an Unselect apply homogeneous marker weights in a
checkbox…………………………………………………………………………64
Figure 4.9 – Tabs of widgets of jQuery UI to Settings page………………….65
Figure 4.10 – Upload three files and rename files for labels plot………………65
Figure 4.11 – The user uploads the normative file and rename to "Norm"…….66
Figure 4.12 – The user slide the cursor in “Choose number of subplots” appears a
drop list numerate to ten and choose the number of charts want in your
report……………………………………………………………………………..67
Figure 4.13 – The user used the search box to assist in the selection of
movements and drag the motion element to subplot……………………………..67
Figure 4.14 – The user dragged the motion element out of the subplot…………68
Figure 4.15 - Click Generate Report…………………………………………….69
Figure 4.16 - Inverse Kinematics Report ……………………………………….69
Figure 4.17 - Inverse Kinematics Report with normative data and pathological
data……………………………………………………………………………….69
Figure 4.18– Explanatory diagram with MVC Architecture of our interface…...69

LIST OF TABLES
x
List of Tables
Table 2.1 - Musculoskeletal modeling software…………………………………13
Table 4.1 - SUS Questionnaire: results of each question, in terms of mean, and
standard deviation (s). The rating is on a five point scale from “Strongly
Disagree” to “Strongly Agree”…………………………………………………...67
Table 4.2 – Results of SUS usability test in terms of minimum, maximum, mean,
and standard deviation (s) of usability and learnability score (clinicians and
students of physiotherapy)……………………………………………………….67
Table 4.3 – Results of SUS usability test in terms of minimum, maximum , mean,
and standard deviation (s) of usability and learnability score (biomedical
engineering)………………………………………………………………………67

LIST OF ACRONYMS
xi
List of Acronyms
3D – Three-dimensional;
APIs – Application Programming Interfaces;
CDSS - Clinical Decision Support System;
CMC – Computed Muscle Control;
CPOE - Computed Physician Order Entry;
CSS – Cascading Style Sheets;
DEC – Digital Equipment Corporation;
Dll´s – Dynamic-link library´s;
GUI – Graphical User Interface;
HER - Electronic Health Record;
HTML – Hypertext Markup Language;
HTTP – Hypertext Transfer Protocol;
IK – Inverse Kinematics;
JS – Javascript;
MBS – Multibody system;
MVC – Model-View-Controller;
PHP – Hypertext Preprocessor;
SDK – Software Development Kit;
SIMM – Software for Interactive Muscoloskeletal Modeling;
SQL – Structured Query Language
SUS – Sytem Usability Scale;
TCP – Transmission Control Protocol;
WAMP – Window, Apache, MySQL, PHP – Perl – Python;

CHAPTER 1: INTRODUCTION
1
Chapter 1
Introduction
This document presents a detailed report of the training period developed
on the scope of the curricular units of Stage I/ Project I and Stage II/ Project II,
part of the last year of the MSc Biomedical Engineering - Sports and
Rehabilitation, taught in the School of Technology, in association with the School
of Healthcare, both from the Polytechnic Institute of Setubal, as requisite for the
degree of Master of Biomedical Engineering.
During the two semesters, the stage was conducted at the Laboratory of
Human Movement, School of Healthcare, Polytechnic Institute of Setubal, and
with a close collaboration with the Institute of Telecommunications (IT),
Technical Superior Institute (IST) part of the University of Lisbon, with the team
BIT (Biosignal Team Igniter).
The main mission of the Laboratory of Human Movement is experimental
research, modeling and simulation in clinical biomechanics and sports application
in order to establish quantitative and reliable measurements in the treatment /
enhancement of musculoskeletal movement disorders.
The BIT team works on innovative pattern recognition, signal processing
and information and communication technologies to handle multimodal data, with
core skills on physiological signals.

CHAPTER 1: INTRODUCTION
2
1.1. Motivation
In a world with large technological advances and where technology takes a
primordial place in society, the interaction between technology and health is
increasingly present. It’s impressive to realise that in the past years the number of
the users that use the Web to acquire health information, is growing exponentially,
forcing physicians, clinics, hospitals and insurance companies to redefine their
business practices, incorporating the Internet and web delivery system [1].
The Health Information Technology (HIT) aims to improve the delivery of
healthcare using the Information Technology (IT) [2]. It is an area that “combines
Information Systems, Computer Science and Healthcare”[2] and is thought as a
possible solution to healthcare problems, bringing benefits in quality, efficiency,
patient safety and cost reduction.
This technology is used in various systems, for example [2]:
Electronic Health Record (EHR);
Electronic Medical Record (EMR);
Computed Physician Order Entry (CPOE);
Clinical Decision Support System (CDSS).
The CDSS is a good example of web technology and health combined
systems. The CDSS are defined as ‘‘any software designed to directly aid in
clinical decision, making in which characteristics of individual patients are
matched to a computerized knowledge base for the purpose of generating patient-
specific assessments or recommendations that are then presented to clinicians for
consideration” [3]. The CDSS helps clinicians to deal with patients medical data
allowing to make effective clinical decisions that will provide relevant clinical
information, improving patient care, evaluation of rehabilitation and consistent
building evidence for the effectiveness, figure 1.1, [3, 4].

CHAPTER 1: INTRODUCTION
3
Figure 1.1- Improvements that the CDSS offers to the clinicians [5].
The CDSS can be divided into three different systems [6];
Information Management Systems – These systems acquire and
record clinical data so it can be later interpreted by the clinician.
Focusing Attention Systems - These systems warn the user of possible
complications that may not have been taken into account;
Patient Specific Recommendation Systems - Systems that use
algorithms that recognize patterns and through them can provide
useful information for the evaluation of the patient.
However, when speaking of CDSS for human movement, the current
clinical practice still lacks accurate and tractable tools, able to merge patient
clinical information. Existing approaches are mostly comprised of proprietary
monolithic software systems designed for standalone operation, with high cost
and/or not user-friendly. So it is essential the “emergence of innovative designs,
easy to use, open-source and, using a complementary approach that combines
biomechanical modeling, patient data, high-quality cinematic rules to support
clinical decision making” [7].
Clinical decision
makers team
Diagnosis
Prognosis
Treatment
Evolution
Prevention

CHAPTER 1: INTRODUCTION
4
1.2. Objectives
Contextualized in the preceding introduction, this work is part of a larger
project, that aims to develop a tractable cloud-based open-source framework for
human movement analysis and classification, that benefits from the
complementary information of biomechanical modeling, patient clinical
information, and high quality normative kinematic gait and shoulder data sets,
with algorithms for multi-dimensional data classification called Movement
System Diagnoses.
The main objective of this present work is to develop one of the first parts
of a HTML interface / CSS / Javascript with dll's (dynamic-link library´s)
connection of the OpenSim software (Inverse Kinematics and Scale) hereinafter
referred to as Movement System Diagnosis framework.
Due to the complexity of the project, the main objective was subdivided
into three points which together will lead to the interface:
1. Development of a multiplatform rich graphical user interface, designed
combining the convenience of HTML5/Javascript/CSS3 with the back-end
in Python programming language, using two validated musculoskeletal
models from OpenSim;
2. Assess the usability and learnability of the framework's interface;
3. Installing the framework to run on a web server.

CHAPTER 1: INTRODUCTION
5
1.3. Structure of the document
This document was organized into five chapters:
Chapter 1 – introduction and objectives (relating to the stage)
Chapter 2 – literature review, base theoretical concepts,
Kinematic models, Modeling Software and OpenSim
Chapter 3 – interface architecture description and functioning.
Results.
Chapter 4 – discussion of the results.
Chapter 5 – conclusions and future work.

CHAPTER 2: LITERATURE REVIEW
6
Chapter 2 Literature review 2.1. Musculoskeletal System
The Musculoskeletal system is the combination between muscular and
skeletal systems. The muscular and skeletal systems are the main responsible for
the human body movement [6, 7] and this is one of the reasons why the two
systems are linked in a unique system. So it can be easily explained, thereafter
they will be describe individually.
2.1.1. The skeletal system
The skeletal system comprises cartilage and bone. It’s major functions are
support and protect of the body internal structures and organs, levers on which
muscles act to produce movement, reservoirs calcium and phosphorus and
containers for blood-producing cells [6, 8].
2.1.1.1. Cartilage
The cartilage is similar to connective tissue but it is more rigid, however, less
rigid than the bone. It is an avascular tissue and it is formed by chondrocytes and
chondroblasts coated by perichondrium. Its main functions are to protect, coat,
shap, support some parts of the body and prevent friction between the bones.
There are three types of cartilage. The most common, the hyaline, has a matrix
with a moderate amount of collagen fibers. Other, called elastic has a matrix
containning collagen fibers along with a large number of elastic fibers. Lastly, the
fibrocartilage has a matrix with a limited number of cells and ground substance
in the middle of a substantial amount of collagen fibers, figure 2.1, [6, 8].

CHAPTER 2: LITERATURE REVIEW
7
Figure 2.1 - Cartilage types. Copy from [11].
2.1.1.2. Skeleton
The adult human skeleton has 206 bones that can be divided into two
subgroups, named axial skeleton consists of the skull, spinal column, sacrum, ribs,
sternum, ear ossicles and hyoid bone, and the appendicular skeleton contains
shoulder girdle, arms, pelvic girdle and legs [11].
There are two basic types of bone [8]:
Compact bone - dense bone that configures the outer layer of all the
around bone and surrounds spongy bone;
Spongy bone - closed cavity containing blood-forming cells
(marrow) through bone spicules.
Regarding the shape of bone there are different classifications. This work was
based in Drake et al, that classifies into five different bones, figure 2.2 [8]:
Long bones – Tubular shape;
Short bones- Cuboidal shape;
Flat bones – Two compact bone plates separated by sponge bone;
Irregular bones – Various shapes;
Sesamoid bones – Round or oval bones develop within tendon.

CHAPTER 2: LITERATURE REVIEW
8
Figure 2.2 - Bone types. Copy from [12].
The connection components between the elements of the skeletal system are
called joints.
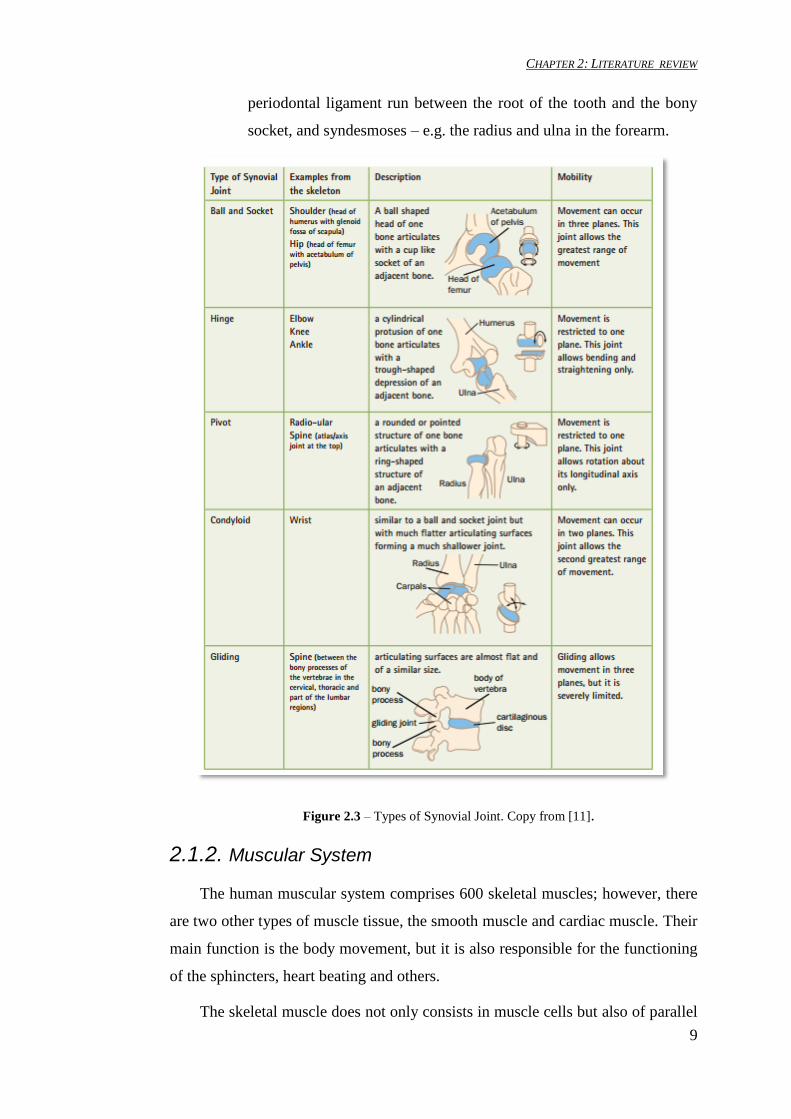
The joints are classified in three ways according to the functionally [6, 8]:
Synovial Joint – Joining skeletal components that are separated by a
narrow joint cavity. Being found between the bones of the arms and
legs and your mobility are free movement. Based on the movement,
the synovial joint could be uniaxial (movement in one plane), biaxial
(movement in two plans), and multi-axial (movement in three planes).
Regarding the shape articular surfaces, the synovial joint could be
plane, hinge, pivot, bicondylar, condylar, saddle, and ball and socket,
figure 2.3;
Cartilaginous Joints – Connecting adjacent bones made of cartilage
that enable small movements. These include synchondroses – e.g. the
growth plate that occurs between the head and shaft of developing
long bones, and symphyses – e.g. the intervertebral discs and pubic
symphysis;
Fibrous Joints – Joint bones with fibrous, allowing very little
movement or any movement at all. These include sutures – e.g. the
skull sutures, gomphoses, the short collagen tissue fibers in the
CHAPTER 2: LITERATURE REVIEW
9
periodontal ligament run between the root of the tooth and the bony
socket, and syndesmoses – e.g. the radius and ulna in the forearm.
Figure 2.3 – Types of Synovial Joint. Copy from [11].
2.1.2. Muscular System
The human muscular system comprises 600 skeletal muscles; however, there
are two other types of muscle tissue, the smooth muscle and cardiac muscle. Their
main function is the body movement, but it is also responsible for the functioning
of the sphincters, heart beating and others.
The skeletal muscle does not only consists in muscle cells but also of parallel

CHAPTER 2: LITERATURE REVIEW
10
bundles of long, multinucleated fibers with transverse stripes, capable of powerful
contractions, being innervated by somatic and branchial motor nerves [8, 6].
The multinucleated fibers have up to approximately 10.000 sarcomeres, made
with contractile proteins called actin and myosin. Each sarcomere, when
stimulated, is responsible for the contraction of a muscle, figure 2.4 [10].
Figure 2.4 – Muscle fiber. Redrawn and adapted from [8,11].
This muscle is employed for the bones movement and other structures. It is
also responsible to provide support and shape to the body.
The cardiac muscle is found in the walls of the heart (named myocardium)
and in some of the large vessels close to where they join the heart. The cardiac
muscle is striated, and it’s innervated by visceral motor nerves. The cardiac cells
are networked electrically and mechanically with the intention of working as a
unit. This is an fatigue resistant muscle and it’s contractions are less powerful than
those that are produced by the skeletal muscle [6,8].
Lastly, the smooth muscle comprises elongated or spindle-shaped fibers,
controlled by the autonomic nervous system. It is usual to be found in the walls of
the blood vessels, associated with hair follicles in the skin, in the eyeball and in
various structures associated with gastrointestinal, respiratory, genitourinary and
urogenital systems [8][10].

CHAPTER 2: LITERATURE REVIEW
11
2.2. Kinematic models
As previously mentioned, many elements of the musculoskeletal system
interact to enable coordinated movement. Clinicians and scientists who deal with
human movement, conducted throw the years several studies designed to describe
and understand all the elements that compose the human movement. Several of
them have the purpose to comprehend the associations between the observed
motion patterns and the muscle behavior [12, 13].
Kinematics, is one branch of interest centered in the study of the stability
and movement functions created by tissues and structures described above, such
as bones, muscles, cartilage, and others, without reference to the external forces
that produce this motion [14, 15]. For an ample and precise quantitative
explanation are necessary large volumes of data and variables [16].
For help analysis, scientists use a powerful tool called biodynamic. This
uses the modeling and simulation of the musculoskeletal system [18] . The
greatest benefit of this tool is the aid to the patient's diagnosis, with the
elucidation of biomechanics processes cause and effect in musculoskeletal
disorders. The results in the surgical treatments and rehabilitation are more
effective, safe and reduces costs [17, 18, 19, 20].
The biodynamic used models, in most cases, are the existing models in
modeling software, however, if it is necessary to develop, there are two ways: a
rigid multi-body model or a deformable model, figure 2.5, [23].
Figure 2.5 - Overview of musculoskeletal models and their interaction. Copy from [23].
The deformable model uses tissues properties and studies the interaction
of structures, considering or not, the fluid under normal and abnormal load
conditions through the finite element method[23].

CHAPTER 2: LITERATURE REVIEW
12
To the rigid multi-body model was assigned the rigid multi-body
dynamics, using tissue properties and Newton’s laws of motion, to define the
kinematic and dynamic behavior of the musculoskeletal system [23]. In the rigid
multi-body model it is used a 3D musculoskeletal model in the framework of rigid
multi-body dynamics. The 3D musculoskeletal model can be depicted in two
approaches [23]:
Generic parameterized model – This approach uses modeling software
that already contains musculoskeletal models. The musculoskeletal
modeling is defined “in a predictive computational approach that represent
bones, muscles, tendons and ligament anatomy, driven in simulation by
measurements of subject specific mechanics”[24]. It is considered a quick
and easy process;
Patient-specific model – This approach uses common medical images to
create individualized geometries and properties of the subject/patient
under investigation, leading to more accurate simulation results. However,
this is a longer process that requires more modeling knowledge and skills.
The biomechanics studies based on rigid body models can be applied to a
variety of problems, related to clinical, sport and industrial applications, such as
the assessment of the effect of the muscle tendon surgeries, assessment of the
performance sportive and gait abnormalities, the development of neural
prostheses, valuation of the consequence of musculotendon loss or injury on the
overall joint moment capacity and studied the effect of load carriage design on
walking performance [21,23] .

CHAPTER 2: LITERATURE REVIEW
13
2.3. Modeling Software
Many relevant engineering software applications have been developed
with the purpose of analysing and/or simulating the human motion with 3D
musculoskeletal models. The table 2.1 presents five commercial software and two
open-source musculoskeletal modelling software.
Table 2.1 - Musculoskeletal modeling software [22, 21].
Name AnyBody
[26]
Visual
3D[27]
VIMS
[25, 26]
LifeMod
[30] SIMM[31]
BodyMech
[32]
OpenSim
[33]
Type Commercial Commerci
al
Commerci
al Commercial
Commercia
l Open Source Open Source
Society
AnyBody Technology
(Denmark)
C-Motion,
Inc
Engineerin
g Animation
Inc., Ames,
Iowa
BRG(USA)
Musculo Graphics
(USA)
Jaap Harlaar
(VU
University, Netherlands)
Scott Delp (U. Stanford,
USA)
Analysis 3D 3D 3D 3D 3D 2D 3D
Model setup AnyScript Visual
3DScript
Graphical
user
interface
Graphical
user
interface
Graphical
user
interface
Matlab Script C++ Code
XML script
Kinematics
Inverse
kinematics
(skin-based
markers)
Inverse
kinematics
(skin-based
markers)
Inverse
kinematics
(skin-based markers,
joint
angles)
Inverse
kinematics
(skin-based
markers)
Inverse
kinematics
(skin-based markers,
joint
angles)
Inverse
kinematics
(skin-based
markers)
Inverse kinematics
(skin-based
markers, joint angles)
Kinetics Inverse
dynamics Inverse
dynamics
Inverse dynamics
Inverse dynamics
Inverse dynamics
Inverse dynamics
Muscle
model Hill-based
Closer loop
Hill-based Hill-based Hill-based
Muscle
forces
Static
optimization
Static
optimizatio
n
Static
optimizatio
n
Static optimization
Cominserted
muscle
control
Real time Motion
Analysis
Motion
Analysis
Motion
Analysis
Individualize
d model Bone
Bone
geometries
(CT, MRI)
Bone
geometries
(CT, MRI)
Bone
geometries
(CT, MRI)
Bone
geometries
(CT, MRI)
User routine ADAMS
script Matlab script C++ script

CHAPTER 2: LITERATURE REVIEW
14
2.3.1. Clinical benefits versus clinical limitations
Nowadays the most of biomechanics problems are resolved using musculoskeletal
modeling software, because it is a safe and fast solution. Considering the clinical
application there are several benefits such as the clinical decision-making could be
constructed on a knowledge model, statistically derived from a patient population
and all patient data might be used to help this decision-making, can be used to
propose a precise treatment according to the state of each patient and allows the
evaluation of the effect or the quality of the treatment before and after its
application and finally could be used to support the clinicians in their diagnosis
process [23]. Despite the recent great progress and success, there are still many
clinicians that don't use the benefits of musculoskeletal modeling software. The
first reason that may explain this fact, as can be seen on table 2.1, is that between
the seven software presented, only two are open-source. Another reason to be
considered is the clinicians lack of technical knowledge and one final reason is
that this software are limited by their one databases.
Facing this facts it is essential an “emergence of innovative designs, easy
to use, open-source and, using a complementary approach that combines
biomechanical modeling, patient data and high-quality cinematic rules to support
clinical decision making” [7] .
The interface that we propose sets its main attention to one of the most
used open-source software, the OpenSim, that is the only open-source software in
table 2.1 with 3D analysis.
2.3.2. OpenSim
In the early 1990s, Scott L. Delp and Peter Loan introduced the
commercial musculoskeletal modeling software, SIMM (Software for Interactive
Musculoskeletal Modeling), presented in table 2.1. This software allows users to
create, change, and evaluate models of many different musculoskeletal structures
[14]. However, the SIMM does not allow the full access to the source code, which
prevents the improvement of analysis and dynamic simulation tools. Another gap
is that it does not have any assistance for the calculation of muscle excitations,
which produce coordinated movement. Because these gaps and the appearance of

CHAPTER 2: LITERATURE REVIEW
15
new technologies in software engineering, emerged the need to develop an open
source simulation environment. This open source simulation environment was
called OpenSim, figure 2.6 [14].
Figure 2.6 - Screenshot from OpenSim. Gait2354 model used in interface. Muscles are
shown as red lines; virtual markers are shown as pink spheres.
The OpenSim was “an open-source platform for modeling, simulating, and
analysing the neuromusculoskeletal system” [14]. It was developed under the
framework of multibody system (MBS) methodologies that [34]:
Allows the creation and simulation of musculoskeletal models;
Allows the visualization of experimental and simulated motion;
Provides the inverse kinematics, the inverse dynamics, the static
optimization, the forward dynamics, and computed muscle control
(CMC).
This framework includes [19]:
An end-user application with a graphical user interface (GUI);
A set of command-line utilities;
A software development kit (SDK) including application programming
interfaces (APIs) and correspondent libraries;
An homogeneous set of file formats for describing and sharing
neuromusculoskeletal models and related data;

CHAPTER 2: LITERATURE REVIEW
16
Update the Musculoskeletal models developed and published by various
researchers.
OpenSim has been developed and maintained on Simtk.org, where we can
find a public repository for data, models, and computational tools related to
physics-based simulation of biological structures [14]. As can be observed in table
2.1, the software was written in C++ programmable language, and the graphical
user interface was written in Java. The OpenSim was compiled and run in a
Windows operating system.
2.3.2.1. Motion Reconstruction with OpenSim
To collect data for the motion analysis it is necessary to use marker
trajectories or joint angles from motion capture, force data, typically ground
reaction forces and moments and/or centers of pressure and electromyography
[35]. To analyze experimental data with a generic model, OpenSim has several
tools. For the present work, were considered three mainly tools:
1. Preparing and importing experimental data;
2. Scaling;
3. Inverse Kinematics.
1. Preparing and importing experimental data
The first step is preparing files of experimental data in formats that can be
imported in OpenSim:
Marker trajectories - .trc files;
Ground reaction and center of pressure data - .sto or .mot files;
Joint angles - .sto or .mot files;
EMG data - .sto or .mot files.
Then, the files are imported into OpenSim and can start the next phase.
2. Scaling
In this step we use the Scale Tool of OpenSim. The aim was to change the
anthropometry of a model so it can matches a particular subject as closely as
possible. In addition the Scale Tool can be used to adjust the locations of virtual
markers so they can better match the experimental data – figure 2.7 [35].

CHAPTER 2: LITERATURE REVIEW
17
To have a resolution of inverse kinematics problems without errors is
necessary to make an scaling process with precision and efficiency [35].
Figure 2.7 - Experimental marker positions are measured with motion capture equipment (pink
spheres). Virtual markers are placed on a model in anatomical correspondence.
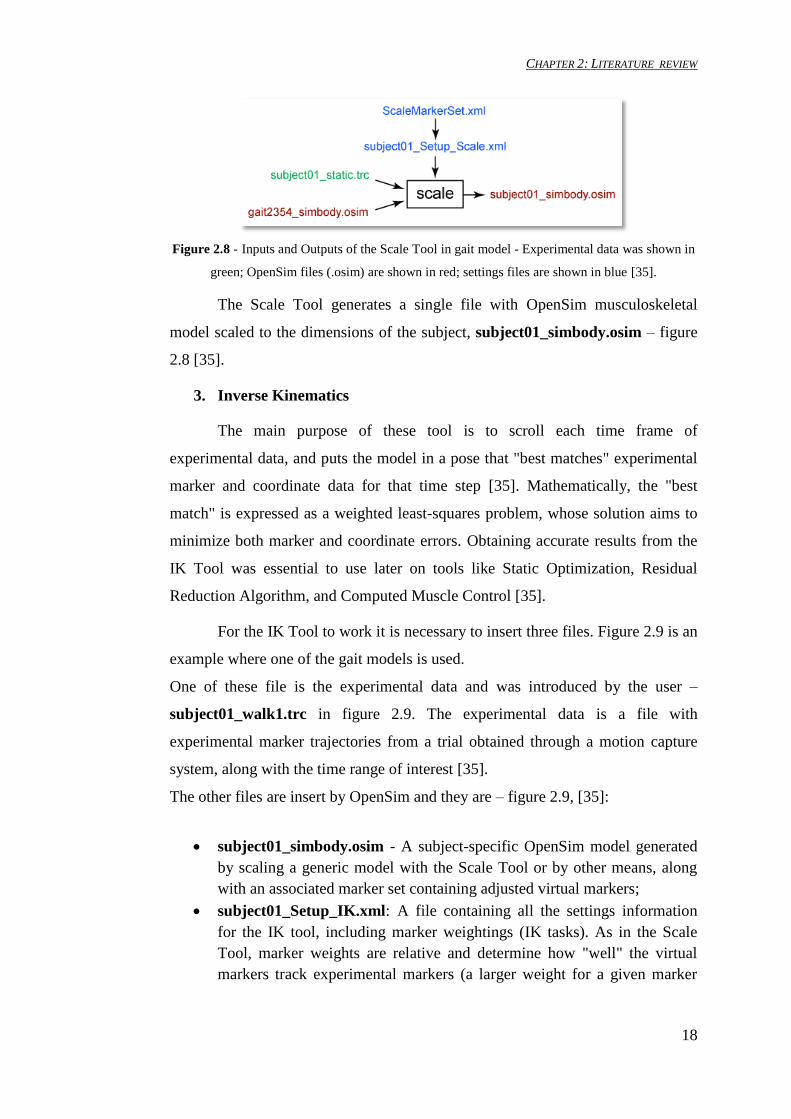
To make the Scale Tool to work it is necessary to have the input of four
files. Figure 2.8 is an example when is used one of gait models. One of these files
is the static experimental data and was introduced by the user,
subject01_static.trc in figure 2.8. The static experimental data is a file with
experimental marker trajectories of a static trial that has, usually, several seconds
of data with the subject posed in a known static position [35].
The other files are inputed by OpenSim and refer to the following:
subject01_Setup_Scale.xml - File is the setup file for the Scale
Tool;
ScaleMarkerSet.xml - Marker set for the Scale Tool;
gait2354_simbody.osim - OpenSim musculoskeletal model.
CHAPTER 2: LITERATURE REVIEW
18
Figure 2.8 - Inputs and Outputs of the Scale Tool in gait model - Experimental data was shown in
green; OpenSim files (.osim) are shown in red; settings files are shown in blue [35].
The Scale Tool generates a single file with OpenSim musculoskeletal
model scaled to the dimensions of the subject, subject01_simbody.osim – figure
2.8 [35].
3. Inverse Kinematics
The main purpose of these tool is to scroll each time frame of
experimental data, and puts the model in a pose that "best matches" experimental
marker and coordinate data for that time step [35]. Mathematically, the "best
match" is expressed as a weighted least-squares problem, whose solution aims to
minimize both marker and coordinate errors. Obtaining accurate results from the
IK Tool was essential to use later on tools like Static Optimization, Residual
Reduction Algorithm, and Computed Muscle Control [35].
For the IK Tool to work it is necessary to insert three files. Figure 2.9 is an
example where one of the gait models is used.
One of these file is the experimental data and was introduced by the user –
subject01_walk1.trc in figure 2.9. The experimental data is a file with
experimental marker trajectories from a trial obtained through a motion capture
system, along with the time range of interest [35].
The other files are insert by OpenSim and they are – figure 2.9, [35]:
subject01_simbody.osim - A subject-specific OpenSim model generated
by scaling a generic model with the Scale Tool or by other means, along
with an associated marker set containing adjusted virtual markers;
subject01_Setup_IK.xml: A file containing all the settings information
for the IK tool, including marker weightings (IK tasks). As in the Scale
Tool, marker weights are relative and determine how "well" the virtual
markers track experimental markers (a larger weight for a given marker

CHAPTER 2: LITERATURE REVIEW
19
will mean less error–the distance between the virtual and experimental
representations of a marker–for that marker).
The IK Tool generates a motion file containing the generalized coordinate
trajectories (joint angles and/or translations) – subject01_walk1_ik.mot in figure
2.9 [35].
Figure 2.9 - Inverse Kinematics (IK) Tool Overview. Inputs and Outputs of the IK Tool in
gait model. Experimental data are shown in green; OpenSim files (.osim) are shown in orange;
settings files are shown in blue and motion file generated are show in purple. Graph with angular
data of the motion file. Redrawn and adapted [36].

CHAPTER3: METHODOLOGY
20
Chapter 3
Methodology
In this chapter is described in detail the open-source interface for human
movement analysis. This application is an elaborated movement analysis reports
using the benefits of the biomechanical modeling from OpenSim. It is built
combining the advantages of web technologies with the Python programming
language, improving this way the usability, interaction, extensibility, allowing
some degree of necessary automation in clinical applications.
3.1. System requirements
Knowing what would be the application and who will be the users of the
interface, the first step was to establish which requisites are necessary for the
front-end and back-end. These requisites are presented in figure 3.1.
Figure 3.1 – Requirements for front-end and back-end of interface.
The next step, knowing the requirements, was to decide in which platform
would be design the web application user interface. It was chosen the HTML5.
This is the latest version of the HTML specification and also a generic term that
Requirements
Easy to use
Intuitive
Attractive
Interactive

CHAPTER3: METHODOLOGY
21
describes a set of related technologies that are used to make modern and rich web
content, to create user-friendly applications and to produce interactive, attractive
and intuitive environment natively within browsers, reasons that support the
choice [37]. The three most important technologies of HTML5 are the core
HTML5 specification, the CSS3, which is the means by which you specify the
presentation (the appearance and the formatting) of an HTML document, and the
JavaScript, that provides a comprehensive set of functions for user-interface event
handling, interaction logic, and browser-side computing [35, 36].
For the back-end of interface it was decided to used the Python
programming language. The main reasons that support the choice are that (1) the
Python was developed under an OSI-approved open source license, making it
freely usable and distributable, (2) was designed to be reusable, maintainable and
easy to understand, (3) contains a large collection of standard library, (4) the code
has, tipically a smaller size compared to the C++ or Java code, (5) run unchanged
on all major computer platforms and, (6) Python script uses a variety of
integration mechanisms that allows the communication with the other parts of an
application [40].
3.2. System Architecture
The interface was designed under a Model-View-Controller (MVC)
architecture and was introduced in an Apache web server.
The MVC approach was chosen because it has the advantage of
minimizing the coupling of the presentation from the processing and persistency
layers, allowing the split of the application into independent and interchangeable
modules which can be developed on different platforms, allowing the reusability.
This model divides the interface into three layers [39, 41];
Model - coordinates the application logic by evaluating the messages
received by the controller, executing the operations and producing results.
View - a front-end based on Web technologies that displays the user
interface and allows all the interaction;
Controller - where all the events triggered in the user interface are mapped
into operations;

CHAPTER3: METHODOLOGY
22
To introduce the interface in the server, it was used the program EasyPHP. The
EasyPHP is a WAMP (is acronym for the combination Window, Apache, MySQL
PHP - Perl – Python) package that includes the server-side scripting language
PHP (Hypertext Preprocessor), the web server Apache and the SQL (Structured
Query Language) server MySQL [42]. This package was chosen because it is a
Windows installer, which is the operating system of our interface. The only reason
to use Window OS is related to the use of OpenSim software, which only exists in
the Windows platform.
The communication between the client and the server is based on the
HyperText Transfer Protocol (HTTP) and the standart WebSocket.
The HTTP is the underlying protocol used by the World Wide Web which
defines how messages are formatted and transmitted, and what actions Web
servers and browsers should take in response to various commands [43].
The WebSocket is a naturally full-duplex, bidirectional, that operates through a
single TCP (Transmission Control Protocol) socket through the web. The
WebSocket is a web technology in the connectivity area of HTML5 [44]
The scheme of interface architecture is represented in figure 3.2.
Figure 3.2 - Interface architecture: HTTP - HyperText Transfer Protocol, wb – WebScocket.

CHAPTER3: METHODOLOGY
23
3.2.1. Model code
To the implementation of the model was used a high-performance back-end
in Python, which is responsible for the connection between the interface of
Movement System Diagnosis and the tools (Scale and IK) of OpenSim software,
as well as all the data processing. Below is a descriptive approach illustrated with
parts of Python code
The first function observed in the code is called getsettings. This function
will get different elements from the setup_scale and setup_Ik xml file and receive
the name of the setup_scale file upload by the user.
The setup_scale file is the setup file for the Scale Tool and contains all the
settings information for the Scale tool. The getsettings function gets multiple
elements from setup_scale file which is used and modified in the interface –
figure 3.3:
marker_file - TRC file (.trc) containing the time history of
experimental marker positions;
time_range - Time range over which the marker positions are
averaged;
output_motion_file - Name of the motion file (.mot) written after
marker relocation;
model_file - Model file (.osim) for the unscaled model
IKMarkerTask element, the name and weight attribute, figure 3.21, -
Task set used to specify weights used in the IK computation of the
static pose.

CHAPTER3: METHODOLOGY
24
Figure 3.3 - Search the elements of setup_scale file in Python.
The setup_IK file contains all the settings information for the IK tool. The
getsettings function gets three elements from the setup_IK file, which will be used
and modified in the interface – figure 3.4:
the marker_file - TRC file (.trc) containing the time history of
experimental marker positions;
time_range - Time range over which the IK problem is solved.
output_motion_file - Name of the motion file (.mot) to which the
results should be written;
Figure 3.4 - Search the elements of setup_IK file in Python.
All the elements collected by the getsettings function are sent in an array to
the setting function in the client – figure 3.5.
Figure 3. 5 - Elements are sending for setting function.
The next functions were written to receive the modifications made by the
user in the elements mentioned above.

CHAPTER3: METHODOLOGY
25
The function changesettingsScaleMarker receives changes made in the
weight elements by the user and sent through the IKMarker function of client, w
and replaces it in setup_scale file – figure 3.6.
Figure 3.6 - Function changesettingsScaleMarker in Python.
The changesettingsScale function received changes made by the
changesetting function of client, ds, in time_range, output_motion_file and
replaces in setup_scale file, figure 3.7 .
Figure 3.7 - Function changesettingsScale.

CHAPTER3: METHODOLOGY
26
The changesettingsIK function received changes made by the changesetting
function of client, dikt, in time_range and replaces it in setup_IK file – figure 3.8 .
Figure 3.8 - Function changesettingsIK.
The changeout function changes the output_motion_file element of
subject01_Setup_IK xml file, with the patient name and datetime placed in Patient
Clinical Data page – figure 3. 9 .
Figure 3.9- Function changeout.
The changemarkerScale – figure 3.10, and changemarkerIK – figure 3.11
functions change the markerfile element of the setup_scale (static file) and setup_IK
(dynamic file) files with the file name upload in static and dynamic file button by the
user.

CHAPTER3: METHODOLOGY
27
Figure 3. 10 - Function changemarkerScale.
Figure 3.11 - Function changemarkerIK.
After these element modifications – setup_scale and setup_IK files, it is
necessary to elaborate a function that allows running the two files. This function is
called process and receives the name setup_scale file (from the choice of the
marker file by the user) – figure 3.12.
Figure 3.12 – Function process.

CHAPTER3: METHODOLOGY
28
Afterwards the running of those two files, a file with data motion is created.
The anatomico function sends to the client (header function), the header of the
data file motion, so it can be possible to the user to choose the movements present
in their report – figure 3.13.
Figure 3.13 – Function anatomico.
Finally the dados function receives from the get_field function of client the
name of the motion files selected as well as the fields selected by the user. The
dados function then reads the motion file and sends to the client informations
about motion data, time data and header necessary to build the plot. If the motion
data is normative, then the data sent is the standard deviation ('u+s':
list(data[field]+5), 'u-s': list(data[field]-5) and the average data (‘u’:
list(data(field)). The data are sent to the client graph function – figure 3.14.
Figure 3. 14 – Function dados.
3.2.2. View
The HTML is the base technology, which controls the modulation of the web
page structure. In conjunction with this technology there are the Impress.js which
controls the style and layout of the web page. The Impress.js is based on the
power of CSS3 transformations and transitions in modern browsers and inspired
by the idea behind prezi.com. As the prezi, the visualization of impress.js was
made in slides. Finally the JavaScript delivers an ample set of functions for user-

CHAPTER3: METHODOLOGY
29
interface event handling, interaction logic, and browser-side computing.
Below there is a descriptive approach illustrated with parts of HTML and
Javacript code.
In the first slide, it can be seen the home page where are placed 4 buttons
named “Refresh page”, “New record”, “Report” and Contacts – figure 3.15.
Figure 3.15- Home page html code.
This page also has JavaScript library to manipulate data based documents,
D3.js – figure 3.16.
Figure 3.16 – D3.js html code.
The four buttons have an event called onclick. When the client clicks it starts
different functions or methods:
1. “Refresh page” button run the “window.location.reload()” method
and the interface is reloaded;
2. “New record” button start the pacient() function. This function has the
window.location.href=”#slide 3” property, which redirects the page to
slide 3 and inserts in it the title “Patient Clinical Data” – figure 3.17.

CHAPTER3: METHODOLOGY
30
Figure 3.17 - Function pacient.
3. “Report” button run the motfile() function – figure 3.18.
Figure 3.18 - Function motfile.
This function has the window.location.href=”#slide4” property which
redirects the page to slide 4. The next command is an event that allows to rename
the uploaded files. After, these names are used in the plot label.
4. “Contacts” button allows the user to contact Human Movement
Laboratory at the School of Health Care – Polytechnic Institute of
Setubal- Portugal;
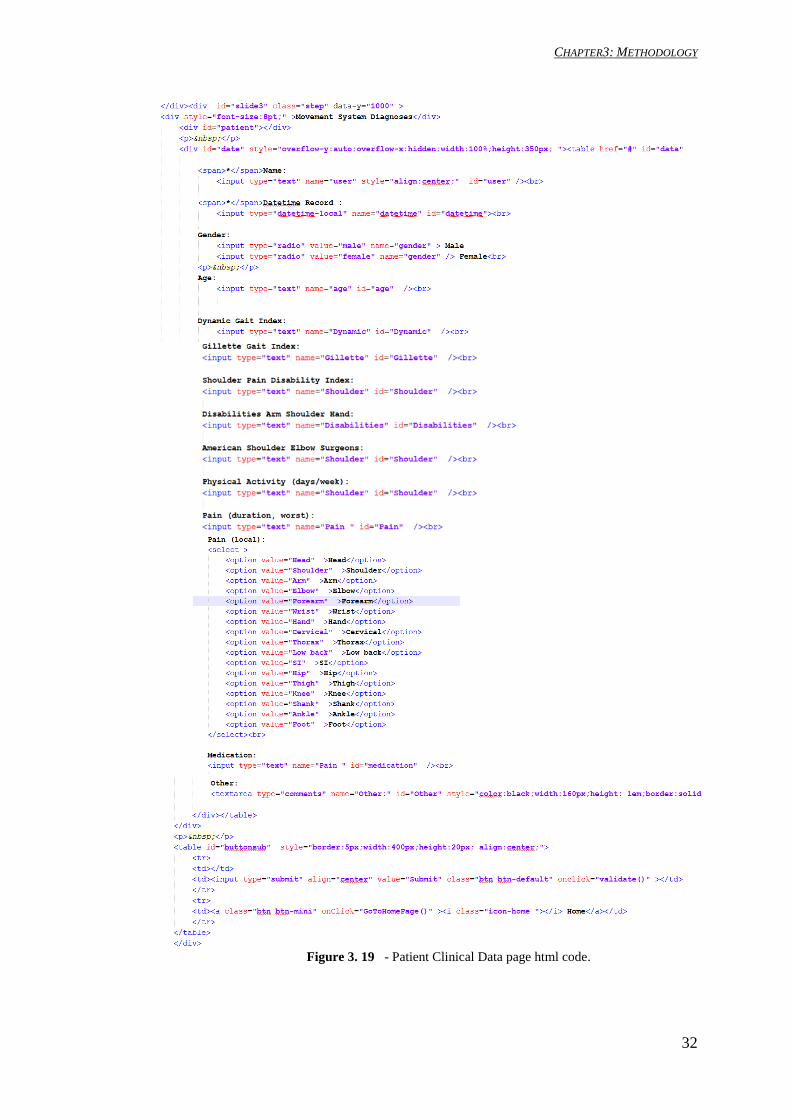
Thereafter, it loads Patient Clinical Data page. In this page are exhibited
several inputs where it is possible to write the patient information; a submit
button; and a home page button – figure 3.19. The required information about the
client it is essentially focused on its pathologies in the shoulder and gait, as well
as their age and gender. This information, in a future project, will be placed in a

CHAPTER3: METHODOLOGY
31
database and will be a way to have the patient´s information, enabling analogies
between the data and motion data generated by the interface.
The user name and datetime inputs are mandatory and are used to identify the
motion file generated by the interface.
The submit button has an event onclick and starts the validate() function. The
validate function makes the user name and datetime inputs mandatory – figure
3.20. When the user does not insert any information in the name or datetime input,
an alert box pops up in the page. If all the mandatory information is inserted it is
used the window.location.href=”#slide0” property for redirecting the page for
slide 0. This function uses HTML DOM (Document Object Model)
getElementById() method to return the element that has the ID attribute with the
specified value. The notEmpty function verifies if a value was written by the user
through the length of the entry. If the length of the entry equals zero, then it starts
the alert() method, which displays an alert box with a specified message.
CHAPTER3: METHODOLOGY
32
Figure 3. 19 - Patient Clinical Data page html code.

CHAPTER3: METHODOLOGY
33
Figure 3.20- Function Validate().
Next to this it loads the Upload files page.
The Upload files page allows client to make the scale and inverse
kinematics files uploads, as explained in chapter 2, so it can be possible to
generate the motion file. This page is exhibit with two drop-down list, two upload
files, one checkbox, one submit button and one home button. The code provided
to show each of these elements is described on figure 3.21.
Figure 3.21 - Upload files page.

CHAPTER3: METHODOLOGY
34
The first drop-down list is called Model and it allows the user to choose
which of the unscaled OpenSim models he wants to analyze the data – figure 3.22.
There are two options:
LowerLimb - corresponds to gait2354 model from OpenSim. The
value attribute that specifies this entry is the model file name:
gait2354_simbody.osim;
Shoulder - corresponds to shoulder model from OpenSim.
Figure 3.22 – Model drop-down list html code.
The second drop-down list called Marker file allows the user to choose the
preferred marker file to analyze the motion data – figure 3.23. This file contains a
set of markers used to scale the model. Scaling is done based on distances
between the model markers, compared to the same distances between the
corresponding experimental markers. There are two options:
LowerLimbDefault - corresponds to the file scale default from
Gait2354_Simbody model in OpenSim. The value attribute that
specifies this entry is the model file name:
subject01_Setup_Scale.xml;
Xsens - corresponds to file scale with the marker Gait model of
Xsens. The value attribute that specifies this entry is the model file
name: XSENSsubject01_Setup_Scale.xml.
Figure 3.23 – Marker file drop-down list html code.
The two upload files allow the user to choose – figure 3.24:

CHAPTER3: METHODOLOGY
35
Static File – In this upload file the user must choose the file with the
experimental marker trajectories in a static trial. The file must be in
.trc format;
Dynamic File - In this upload file the user must choose the file with
experimental data. The file must be in .trc format;
Figure 3.24 – Upload static and dynamic file html code.
The checkbox is checked by default– figure 3.25.
Figure 3.25- Checkbox and submit button html code.
When user checks apply homogeneous marker weights and click upload files
button, it loads Select Motion File page. When the user unchecks apply
homogeneous marker weights and click the upload files button it loads the

CHAPTER3: METHODOLOGY
36
Settings page. This is possible due to onsubmit event created by the Submit Button
(Upload Files). This event occurs when the form´s submit button was clicked. The
event executes check CheckBoxes function in Javascript – figure 3.25. The
checkCheckBoxes function uses HTML DOM getElementById() method for return
the element that has the ID attribute with the specified value. This function makes
the markerfile, stactic and dynamic file entries become mandatory. When the user
does not insert anything in the markerfile, file stactic and file dynamic inputs, an
alertbox pops up in the page. However, when the user inserts the mandatory
information the markerchecked() function is started. In this function it is also used
the notEmpy function to verify that a value was written by the user – figure 3.26.
Figure 3.26 - Function checkCheckBoxes().
The markerchecked() function receives the element that has the
homogeneousmarker ID with the checked or not checked value. The
homegeneousmarker ID corresponds to checkbox element.
If value is not check, it uses HTML DOM getElementById() method to
return the element that has the ID markerfile with the specified value. The
markerfile ID corresponds to the Drop-down list Marker file. The specified value
is sent through web socket to the getsettings function of the server.
However, if a value is check it starts the outfile, dynamic and motfile function
– figure 3.27.

CHAPTER3: METHODOLOGY
37
Figure 3.27- Function markerchecked.
Figure 3.28 - Function setting.

CHAPTER3: METHODOLOGY
38
Settings page allows the user to make changes to determined elements of
scale and IK files. This option allows the user to choose:
Scale file
Time Range - Can change Time range over which the average
marker-pair distances in the marker file (.trc) for measurement-based
scaling;
Output Scale Model – Can change name of the motion file (.mot)
written after marker relocation (optional);
Marker Task –Select one or all Markers Task and change weights;
Inverse Kinematics (IK)
Time Range - Time range over which the IK problem was solved.
To display the elements was chosen the jQuery UI. This choice is justified
because the jQuery UI is an accurate set of user interface interactions, effects,
widgets, and themes built on top of the jQuery JavaScript Library. In this case
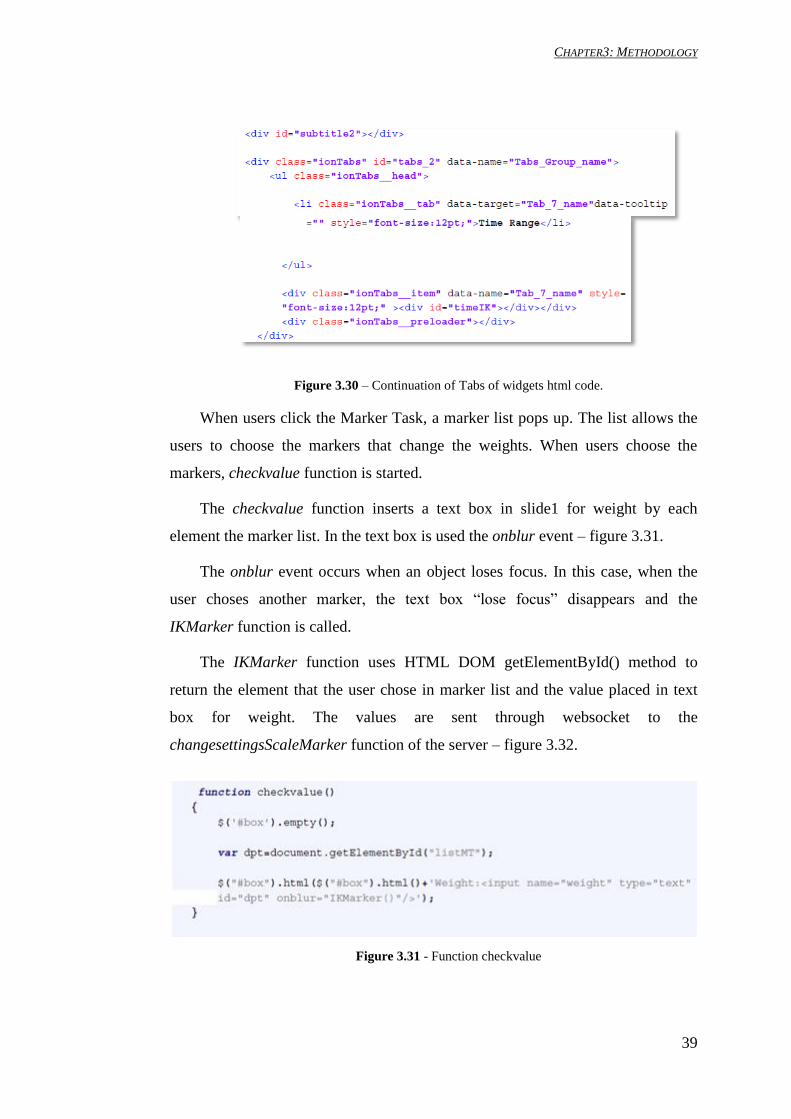
it was used the Tabs of widgets – figure 3.29 and figure 3.30.
Figure 3.29 -Tabs of widgets html code.
CHAPTER3: METHODOLOGY
39
Figure 3.30 – Continuation of Tabs of widgets html code.
When users click the Marker Task, a marker list pops up. The list allows the
users to choose the markers that change the weights. When users choose the
markers, checkvalue function is started.
The checkvalue function inserts a text box in slide1 for weight by each
element the marker list. In the text box is used the onblur event – figure 3.31.
The onblur event occurs when an object loses focus. In this case, when the
user choses another marker, the text box “lose focus” disappears and the
IKMarker function is called.
The IKMarker function uses HTML DOM getElementById() method to
return the element that the user chose in marker list and the value placed in text
box for weight. The values are sent through websocket to the
changesettingsScaleMarker function of the server – figure 3.32.
Figure 3.31 - Function checkvalue

CHAPTER3: METHODOLOGY
40
Figure 3.32 - Function IKMarker.
To validate the other information placed by the user, the page presents one
button with a right icon and other with a wrong icon – figure 3.33. When users
click one of the buttons, the settingsfile function is call – figure 3.34.
Figure 3.33- Button with right icon and button with wrong icon
Figure 3.34– Function settingsfile.
The settingsfile function starts four functions in javascript:
1. The changesetting function uses HTML DOM getElementById()
method to return the element that has the markerfile, time scale,
outinsert and markerfile ID with the specified values – figure 3.35.
The variables were placed in arrays and sent by websocket in a library

CHAPTER3: METHODOLOGY
41
format to changesettingsScale function, changesettingsIK function
and process function of the server.
Figure 3.35 - Function changesettings.
2. The outfile function uses HTML DOM getElementById() method to
return the element that has the markerfile, user and datetime ID with

CHAPTER3: METHODOLOGY
42
the specified values – figure 3.36. The value given by the datetime ID
uses the split() and the join() method for replace ‘ : ’ for ‘ – ‘. The
variable with a datetime name is a string with
“’outinsert_motion_file”: + specified value return user ID+ +
specified value return datetime ID+ and “.mot”. This variable is
placed in a matrix and sent by websocket in a library format for the
changeout function of the server.
Figure 3.36 – Function outfile.
3. The dynamic function uses HTML DOM getElementById() method
to return the element that has the modelfile, filestatic, filedynamic and
markerfile ID with the specified values – figure 3.37. The value given
by the modelfile, filestatic, filedynamic ID uses the
value.split('\\')[document.getElementById(' ').value.split('\\').length -
1] to remove fakepath and keep only the file name that the user chose.
The variables are placed in arrays and sent by websocket in a library
format to the changemarkerScale function, changemarkerIK function
and process function of the server.

CHAPTER3: METHODOLOGY
43
Figure 3.37 - Function dynamic.
In the Upload file page, slide 0, the client can choose the model, markerfile,
static file and dynamic file. This options are sent to the changemarkerScale and
changemarkerIK function of the server.
4. The motfile function initiates the Select Motion File page, inserts an
upload files button so the user can choose the generated motion files.
Afterwards appears a text boxes with the names of the chosen motion
files. This command allows the user to choose the name of the label
for that file in the graph – figure 3.38. The Select motion file page is
started.
Figure 3.38 – Function motfile.

CHAPTER3: METHODOLOGY
44
The Select motion file page allows the user to choose one or more motion file
that he wants to analyze and rename files that will be inserted in labels plot. When
the user wants to compare the data collected with the normative basis, needs to
upload the file from the collection and the normative file. The normative file bust
be renamed to " Norm".
The page presents three buttons: choose file, upload files and home – figure
3.39.
Figure 3.39 – Select Motion file page html code.
After the files have been renamed and the upload files button clicked, the
send function starts – figure 3.40.
Figure 3.40– Function send.
This function is used HTML DOM getElementById() method to return the
element that has the upload files ID with the specified values. The variables are
placed in arrays and sent by websocket in a library format for the anatomico
function of the server.
Towards, it was prepared the penultimate slide – Report Variables page –
figure 3.41.

CHAPTER3: METHODOLOGY
45
Figure 3.41- Html code of Report Variables page.
This page allows users to choose how many charts want in the report. Then,
they can choose the movements and insert them in the desired graphics. To choose
the number of graphics is exhibited a drop-down list numbered from one to ten.
This element is created through number function – figure 3.42. After choosing
the number of subplots, the information is sent for the subplots function and the
drop-down list is eliminated.

CHAPTER3: METHODOLOGY
46
Figure 3.42- Function number.
The subplots function receives an argument by number function and places
the elements in the Report Variables page – figure 3.43.
Figure 3.43- Function subplots.
The movements are inserted in drag elements and it is introduced a search
box to assist in the selection of movements. These functionalities are provided by
header function – figure 3.44.

CHAPTER3: METHODOLOGY
47
Figure 3.44 – Function header.
To represent the movements (elements placed by the subplots function) it
was once again chosen the jQuery UI. In this case it was used the Droppable of
interactions. These elements allows to choose the movements and inserts them in
the desired graphics.

CHAPTER3: METHODOLOGY
48
Then, to generate the report, the user has to click in the report button and the
last slide (Inverse Kinematics Report page) loads – figure 3.45.
Figure 3.45- Report button.
On the Inverse Kinematics page it can be found the graphs with the
movements chosen by the user as in the report. The user can then comment the
graphs, save in pdf or print the report – figure 3.46.
Figure 3.46- Html code of Inverse Kinematics page.
To generate the graphs it is necessary to start four help functions in javacript:
function draw_subplot, function get_field, function graph and function
plotAccordingToChoices. To draw the graphs it was used Flot, a pure JavaScript

CHAPTER3: METHODOLOGY
49
plotting library from Jquery, with focus on simple usage, attractive looks and
interactive features.
1. The draw-subplot function receives an argument the number function
corresponding to the number of graphics that the user choosed in the
drop-down list from the Report Variables page. This according
argument inserts boxes for the graphs and text boxes for the
comments – figure 3.47. Then, the DOM object (vars=$(“#subplot” +
i+” li”) concerning the movements names introduced in droppable
elements from Report Variables page, is placed in variable (vars). In
this variable, and if the items have space between the names, they will
be replaced by an underscore so they can be accepted by the server.
Afterwards, this variable is inserted as a key of the dictionary of plot
function and is sent for the get_field function. This function is also
responsible to introducing a print button and a save the report button.
Figure 3.47 – Function draw_suplot.
2. The get_field function receives an argument from the draw_subplot
function and it corresponds to the movements names introduced in

CHAPTER3: METHODOLOGY
50
droppable elements from the Report Variables page – figure 3.48.
Then, the DOM object (vars=$(‘#filemot’), concerning the motion
files names uploaded from the Upload Motion File page, is placed in
variable (files). After this, is used the HTML DOM getEle
mentById() method to return the element that has the rename file for
label ID with the specified values. Subsequently, is created a
dictionary where the keys are the name files and the rename files label
are the values. Then are sent by websocket in a library format for the
dados function of the server.
Figure 3.48– Function get_field.
3. The graph function receives four arguments from the dados function
of server – figure 3.49. The first argument corresponds to the
movements names introduced in the droppable elements from Report
Variables page. The second argument is the time data of motion files,
the third argument is the motion data from motion files with standard
deviation and the fourth argument is only the motion data of motion
files.
This function is used to organize data in arrays:
The array d is the junction between the time data and motion data;

CHAPTER3: METHODOLOGY
51
The array d4 is the junction between the time data and the upper
standard deviation of motion data;
The d5 is the junction between the time data less the standard
deviation of motion data.
Towards, these arrays are inserted in a dictionary of data function from
Flot library and the plotAccordingToChoices function is called – figure 3.49.
Figure 3.49 – Function graph.
The plotAccordingToChoices function aims to draw graphs with the data
from the user choice. This function starts by creating two new arrays data and
files. Then, are scrolled all the keys of the dictionary dict corresponding to the
motion file header received from the server – figure 3.51. This loop scrolls labels
to the graph lines chosen by the user in the Upload files page. If the legend
corresponding data of the legend does not have any match in the dictionary, it is
created a new array. This command allows the user to use the same data in
different graphs – figure 3.51. Then, movement data (Object) of the selected keys

CHAPTER3: METHODOLOGY
52
(motion file header and labels chosen by the user) are placed in the array file –
figure 3.51. If the label chosen by the user is equal to “Norm” then are placed
three lines on the graph. One line is placed in the middle of normative data and
the other two correspond to the standard deviation in the shadow. If not is just
placed one line corresponding to motion data collected – figure 3.50. Afterwards,
are chosen the settings for graph. In this case the numerical legend, axis yy's
graphics is set to introduce the values of the degrees of motion with exponential
basis through the toExponential function – figure 3.51.
Figure 3.50 – Function plotAccordingToChoices.

CHAPTER3: METHODOLOGY
53
Figure 3.51 – Continuation of function plotAccordingToChoices.
3.2.3. Controller
The management between the view and the model is made by the controller.
It was implemented in JavaScript (JS), using the jQuery.
The communication between the view and the model is made throw
WebSockets protocol, allowing a persistent connection between the client and the
server, allowing data to be sent both ways at any time.
Initially, on the client side, was created a WebSocket builder, located on port
1024 – figure 3.52. This protocol contains five main functions; onopen,
onmenssage, window.onbeforeunload, onclose and ConnectionMade.
The onopen function, is started when the WebSocket receives an open event,
and it can start exchanging messages. In the onmenssage function, messages
received by the server (Python) are checked. To alert when the HTML page was
closed, it is used the window.onbeforeunload function. When the browser is
closed the page starts the function onclose, ending the Python WebSocket
connection with the server. When connection is made, the ConnectionMade
function is started. This function reproduces the console.log event and sends
"ConnectionMade" message to the server – figure 3.53.
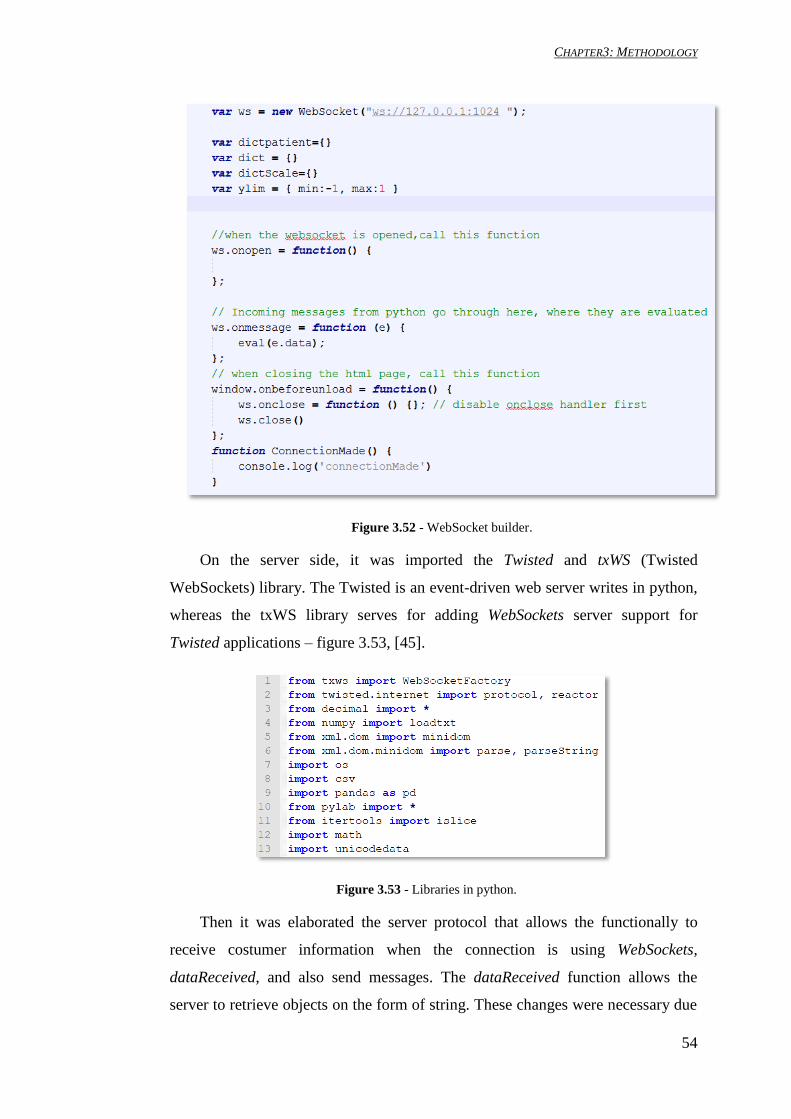
CHAPTER3: METHODOLOGY
54
Figure 3.52 - WebSocket builder.
On the server side, it was imported the Twisted and txWS (Twisted
WebSockets) library. The Twisted is an event-driven web server writes in python,
whereas the txWS library serves for adding WebSockets server support for
Twisted applications – figure 3.53, [45].
Figure 3.53 - Libraries in python.
Then it was elaborated the server protocol that allows the functionally to
receive costumer information when the connection is using WebSockets,
dataReceived, and also send messages. The dataReceived function allows the
server to retrieve objects on the form of string. These changes were necessary due
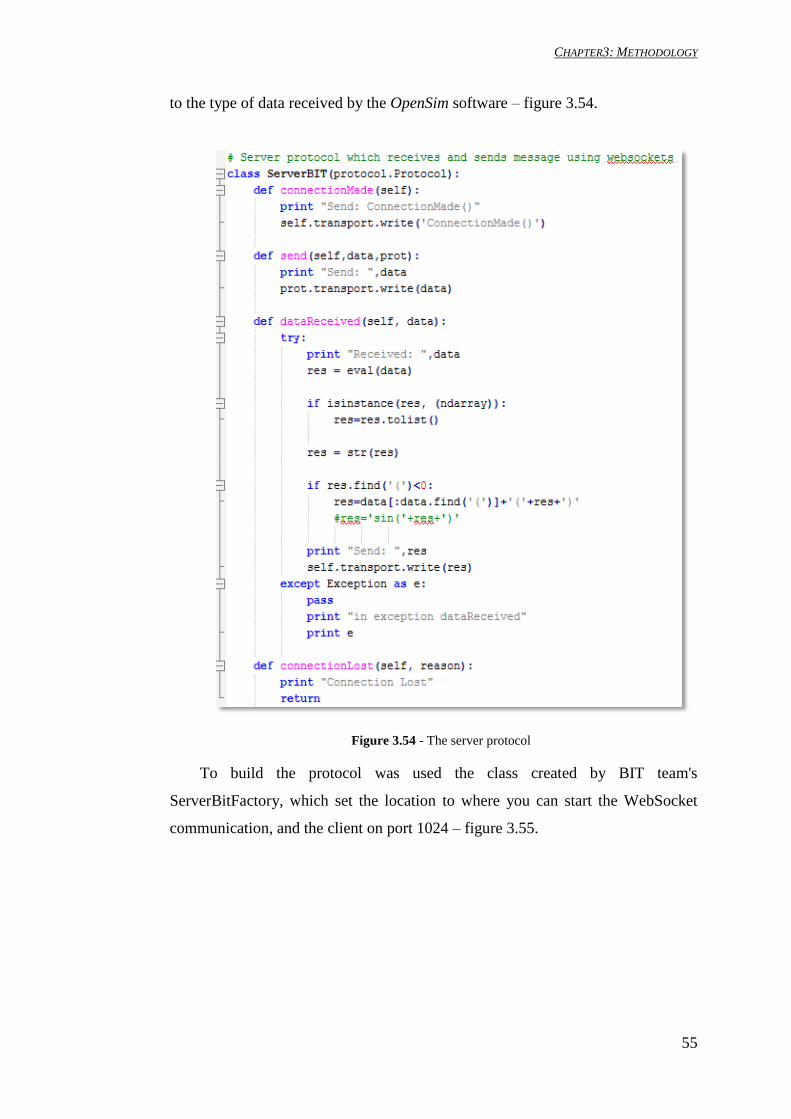
CHAPTER3: METHODOLOGY
55
to the type of data received by the OpenSim software – figure 3.54.
Figure 3.54 - The server protocol
To build the protocol was used the class created by BIT team's
ServerBitFactory, which set the location to where you can start the WebSocket
communication, and the client on port 1024 – figure 3.55.

CHAPTER3: METHODOLOGY
56
Figure 3.55- Class ServerBITFactory.
3.2.4. System Usability Scale
During this procedure the interface was evaluated in two main aspects:
usability and learnability. These two aspects measure the functionality,
operability, clarity and ease-of-use associated with the human-computer
interaction.
To measure usability (U) and learnability (L) was used the System Usability
Scale (SUS). According to Bangor et al. the SUS is not biased against certain
types of user interfaces or gender becoming a big hit among usability
professionals [26]. The SUS was developed in 1986 by Digital Equipment
Corporation (DEC) as a ten-item questionnaire giving a global assessment of
usability, meaning the subjective perception of interaction with a system[46] :
1. I think that I would like to use this system frequently (U) ;
2. I found the system unnecessarily complex (U);
3. I thought the system was easy to use (U) ;
4. I think that I would need the support of a technical person to be able to
use this system (L) ;
5. I found the various functions in this system were well integrated (U) ;
6. I thought there was too much inconsistency in this system (U);
7. I would imagine that most people would learn to use this system very
quickly (U);
8. I found the system very cumbersome to use (U) ;
9. I felt very confident using the system (U) ;

CHAPTER3: METHODOLOGY
57
10. I needed to learn a lot of things before I could get going with this
system (L).
Each question is a statement and a rating on a five-point scale from ”Strongly
Disagree” to ”Strongly Agree” – figure 3.56.
Figure 3.56 - The SUS response format.
According to Brooke each item contributes to the SUS scale with a range
from 0 to 4 [46]. For positively worded items (1, 3, 5, 7 and 9), the score
contribution is the scale position minus one. For negatively-worded items (2, 4, 6,
8 and 10), it is five minus the scale position. To get the overall SUS score, the
sum of the item score contributions was multiplied by 2.5. Thus, SUS scores
range from 0 to 100 in 2.5-point increments [42, 43].
However, to calculate the usability and learnability, we use the proposal of
Lewis and Sauro [48], and calculated usability (sum of the items 1, 2, 3, 5, 6, 7, 8,
and 9) and learnability (sum of the items 4 and 10) in addition to the total score of
SUS. To make the usability and learnability scores comparable with the overall
SUS value (ranging from 0 to 100), the summed score was multiplied by 3.125
and 12.5, respectively [44, 43] .
The target audience for this study was chosen from two groups, which are
representative of the potential end-user populations: a) Biomedical engineering
students; b) Clinicians and students of physiotherapy. A sample of thirty subjects
including twenty seven students from both the biomedical engineering and
physiotherapy under graduated courses in Polytechnic Institute of Setubal, and
three clinicians were used to assess usability and learnability on the interface.
None of the groups had previous knowledge with the system, and before the
experience, the individuals of the each groups had a 4 minutes explanation on the
interface features and way of using, specifically generate the motion file, choose
the variables for the report, and create the final report.

CHAPTER 4: RESULTS
58
Chapter 4 Results
Since the interface was designed under a MVC architecture the results are
going to be detailed by each of these layers, Model-View-Controller.
4.1.1. View
For the presentation of our interface it was used the impress.js [29]. The
visualization of impress.js is made in slides. Our interface presents seven slides in
total. These will be detailed below. Figure 4.1 shows the homepage of our
interface.
Figure 4.1 - Home page.
1. Homepage – Slide 1
This homepage exhibits 4 buttons, which are: Home, New record, Report,
Contacts and D3 – figure 4.2.

CHAPTER 4: RESULTS
59
Figure 4.2 – Options in homepage.
A. Home
This button enables the interface to refresh.
B. New record
This button allows the user to start a new record. The new record starts
with a Patient Clinical Data in another slide, slide 2.
2. Patient Clinical Data page – Slide2
Figure 4.3 illustrates the visualization window which is composed of
several inputs to insert the patient information; a submit button; and a
home page button:
•*Name (mandatory) - Place the name of the patient who is in motion
analysis;
•*Datatime (mandatory) – Place the datetime where occurred the motion
analysis;
•Gender;
•Age;
•Dynamic Gait Index;
•Functional Gait Index;

CHAPTER 4: RESULTS
60
•Gillette Gait Index;
•Shoulder Pain Disability Index;
•Disabilities Arm Shoulder Hand;
•American Shoulder Elbow Surgeons;
•Physical Activity;
•Pain;
•Medication;
•Other;
•Submit Button – After filling the Patient Clinical Data, click on the
submit button and go to Upload Files Page;
•Home Button – Go to home page and refresh the interface.
Figure 4.3 – Patient clinical and sociodemographic information.
After filling the Patient Clinical Data, the user should click on the submit
button and go to the Upload Files Page.
3. Upload File Page - Slide 3
In this slide the user can choose the Model, Marker, Static and Dynamic files
collected in motion analysis and select if the user wants to apply homogeneous
marker weights or unselect to modify the parameters in files. This page exhibits
two drop-down list, two buttons upload files, one checkbox, one submit button
and one home button – figure 4.4.

CHAPTER 4: RESULTS
61
Figure 4.4 - Upload Files page.
In the first drop-down list (Model) there are two options – figure 4.5:
LowerLimb - refers to the gait validated musculoskeletal model from
OpenSim [49];
Shoulder – refers to the shoulder validated musculoskeletal model
from OpenSim [50];
The user can choose the model according to the movement that the user is
intending.
Figure 4.5- Drop-down list (Model).
In the second drop-down list (Marker file) there are three options – figure

CHAPTER 4: RESULTS
62
4.6:
LowerLimbDefault – corresponds to file scale for gait from OpenSim;
this file has a location of virtual markers
Xsens - corresponds to the file scale for gait from Xsens MVN1 [51];
Shoulder – corresponds to the file scale for shoulder from OpenSim.
The user can choose the Marker file according to the equipment used for
experimental data collection.
Figure 4.6 - Drop-down list (Marker file).
The two upload files buttons, Static and Dynamic file, are mandatory and
must be in .trc format.
Afterwards, the checkbox has checked attribute by default – figure 4.7.
When the upload files button is clicked, calls the Select Motion File page. When
the user unchecks it and apply homogeneous marker weights and then click in the
upload files button, entries the Settings page. This was possible due to onsubmit
event created by the Submit Button (Upload Files). The user can then select or
unselect the apply homogeneous marker weights in a checkbox – figure 4.8.
1 Xsens MVN - is a full-body, camera-less inertial motion capture (MoCap) solution. It is a
flexible system that can be used indoors or outdoors (on-set). Xsens MVN gives you clean and
smooth data [51].

CHAPTER 4: RESULTS
63
Figure 4.8 – Select an Unselect apply homogeneous marker weights in a checkbox.
4. Settings page, slide 4
This page enables the user to change variables in Scale file and IK file.
Scale file:
Time Range – It can change the Time range over which the average
marker-pair distances in the marker file (.trc) for measurement-based
scaling;
Output Scale Model – It can change the name of the motion file
(.mot) written after the marker relocation (optional);
Marker Task –Select one or all Markers Task and change weights.
IK file:
Time Range - Time range over which the IK problem is solved.
To the display of the elements was choosed the jQuery UI – Tabs of widgets
– figure 4.9.

CHAPTER 4: RESULTS
64
Figure 4.9 – Tabs of widgets of jQuery UI to Settings page.
Afterwards, the user can click in the right or wrong button. If he clicks in the
right button, the interface modifies scale and IK files and then goes to the Select
Motion File page, generating a motion file, taking into account changes made to
files. If the the wrong button is clicked the interface applies homogeneous marker
weights and goes to the Select Motion File page, generating a motion file with
homogeneous marker weights. This last step is the same when the user selects
button to apply homogeneous marker weights.
5. Select Motion page, slide 5
The page presents three buttons: choose file, upload files and home. When
the user choses one or more motion file (.mot) appears a text box with the file
name and the user can rename files to be insert in the labels plot – figure 4.10.
When the user wants to compare the data collected with the normative basis,
it is necessary to upload the file from the collection and the normative file – figure
4.11. To the normative file it is necessary to change the name to "Norm".

CHAPTER 4: RESULTS
65
Figure 4.10 – Upload three files and rename files for labels plot.
Figure 4.11 – The user uploads the normative file and rename to "Norm".
After the Upload files button is clicked, the slide 6 appears.

CHAPTER 4: RESULTS
66
6. Select Report Variables page – Slide 6
In this page the user can choose:
Number of subplots to be putted in the report with a drop list
numerate to ten – figure 4.12.
Figure 4.12 – The user slide the cursor in “Choose number of subplots” appears a drop list
numerate to ten and choose the number of charts want in your report.
The list of movements was found in the motion file header and it was
automatically placed on the page. The movements were insert in drag elements
and is introduced a search box to assist in the selection of movements. The user
can select movements they want in the report and drag for subplot. To choose the
movements and insert them in the desired graphics, it was use jQuery UI [52] –
Droppable of interactions – figure 4.13.
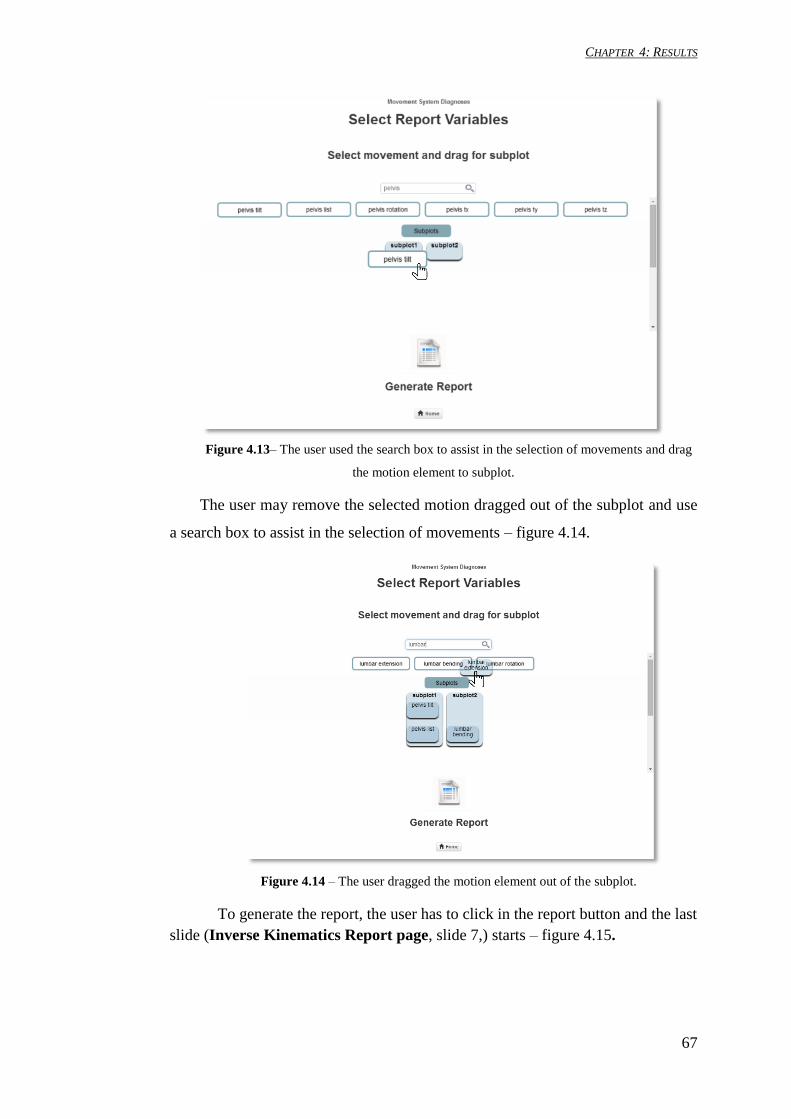
CHAPTER 4: RESULTS
67
Figure 4.13– The user used the search box to assist in the selection of movements and drag
the motion element to subplot.
The user may remove the selected motion dragged out of the subplot and use
a search box to assist in the selection of movements – figure 4.14.
Figure 4.14 – The user dragged the motion element out of the subplot.
To generate the report, the user has to click in the report button and the last
slide (Inverse Kinematics Report page, slide 7,) starts – figure 4.15.
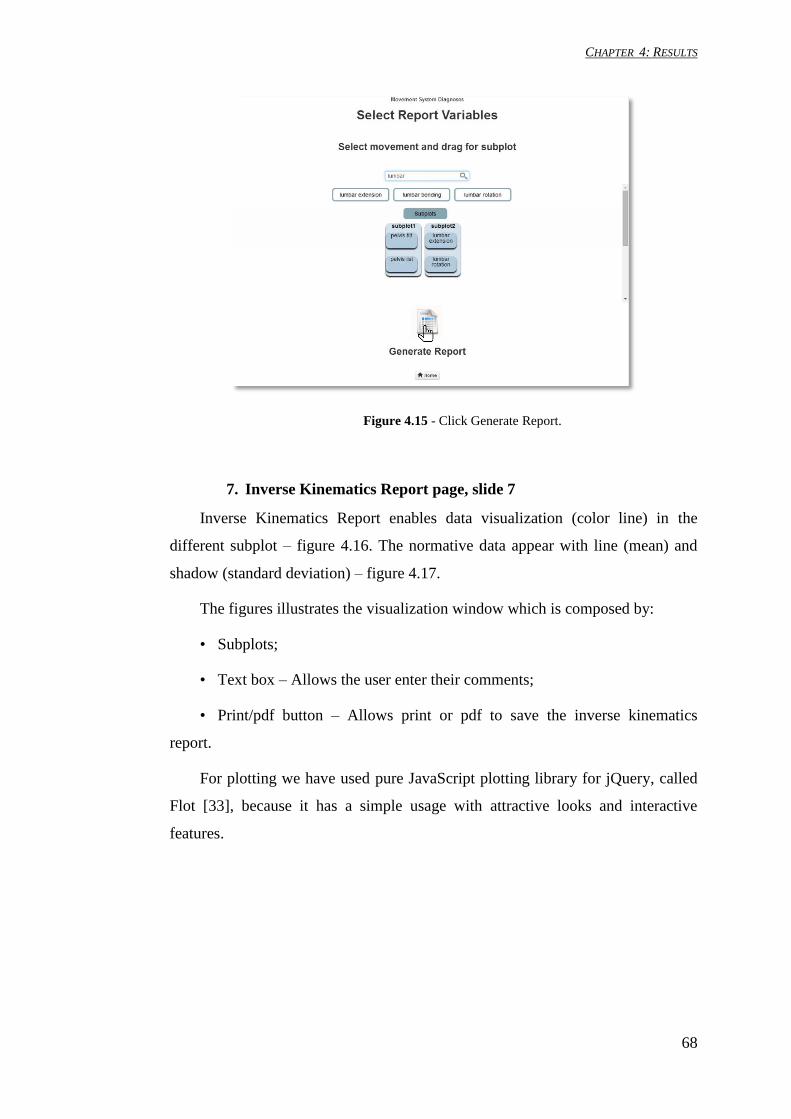
CHAPTER 4: RESULTS
68
Figure 4.15 - Click Generate Report.
7. Inverse Kinematics Report page, slide 7
Inverse Kinematics Report enables data visualization (color line) in the
different subplot – figure 4.16. The normative data appear with line (mean) and
shadow (standard deviation) – figure 4.17.
The figures illustrates the visualization window which is composed by:
• Subplots;
• Text box – Allows the user enter their comments;
• Print/pdf button – Allows print or pdf to save the inverse kinematics
report.
For plotting we have used pure JavaScript plotting library for jQuery, called
Flot [33], because it has a simple usage with attractive looks and interactive
features.

CHAPTER 4: RESULTS
69
Figure 4.16 - Inverse Kinematics Report.
Figure 4.17 - Inverse Kinematics Report with normative data and pathological data.
CHAPTER 4: RESULTS
70
C. Report
This option allows the user to go to the Select Motion File page and uploads
motion files already generated.
D. Contacts
This option allows the user to contact the Human Movement Laboratory at
the School of Health Care – Polytechnic Institute of Setubal- Portugal.
E. Data-Driven Documents (D3)
This option allows the user to interactively observe the variables found
through classification from the complementary information of biomechanical
modeling, patient clinical information, high quality normative kinematic gait and
shoulder data sets. The D3 is a JavaScript library for manipulating documents
based on data [34].
4.1.1.1. Controller
The controller commands the interface between the view and the model,
dealing with the incoming HTTP and WebSocket requests. WebSocket was
choosed because it enables to dissociate the logic operations from the
visualization with the actions between the user interface and the model. Python
commands or functions that correspond to the messages exchanged have been
implemented in the model. So, when a command is received through the model
input stream in Python, a function (”dataReceived()”) is started, and the message
received is evaluated and executed. The model can also send messages to the
client through the output stream, formatted in the same way, that is, with
messages corresponding to JavaScript functions, evaluated on the arrival. The
JSON notation is used in the arguments of the functions received in the controller.
This type of notation is a standard datainterchangeformat used in a large variety of
programming languages, and which is quite desirable, given that it is the native
data representation format in JavaScript.
For the implementation it was used the JavaScript (JS), along with jQuery.
JQuery is a JavaScript library that makes the JavaScript programming more

CHAPTER 4: RESULTS
71
simpler and faster including animations and handling user interface events [39]
[55]. Examples of this library usage have been previously reported.
4.1.1.2. Model
An high-performance back-end in Python as used to the implementation of
the model, which is responsible for the connection between the interface of
Movement System Diagnosis and the tools (Scale and IK) of OpenSim software,
as well as all the data processing.
The communication with the controller is made using the Twisted protocol
[45], an event-driven networking engine written in Python.
To better understand the message exchange between the model, view and
controller, figure 4.18 has an explanatory diagram. In (1) the upload button click
event, triggered in the user interface, will be detected by the controller, with the
function send() (2), which sends a message to the model using the WebSocket
protocol (3) (4), with the function anatomico(). In the model, the message is
evaluated as a Python command, and the anatomico() function is executed (3).
The result is a dictionary (JSON format), with information about the motion files
found in the current path (5). This dictionary is sent to the controller (4) for
function header(). Consequently, the message received from the model is firstly
evaluated in the controller (4) and then the function header() is executed (6). This
function calls the slide 6 and will create a motion list in the view module,
allowing the user to choose the movements he wants to analyze.

CHAPTER 4: RESULTS
72
Figure 4.18– Explanatory diagram with MVC Architecture of our interface.

CHAPTER 4: RESULTS
73
4.1.2. Usability and Learnability Assessment
Before the calculation of the SUS score, was calculated the mean and the
standard deviation of each ten-item of questionnaire for biomedical engineering
students and physiotherapy clinicians and students – table 4.1.
Table 4.1. - SUS Questionnaire: results of each question, in terms of mean, and standard deviation
(s). The rating is on a five point scale from “Strongly Disagree” to “Strongly Agree”.
After the calculation of the usability and learnability score, the data was
used to calculate the mean and the standard deviation. The final results of SUS
usability test are presented in table 3.2 for the physiotherapy clinicians and
students and in table 3.3 for biomedical engineering students.
Table 4.2 – Results of SUS usability test in terms of minimum, maximum, mean, and standard
deviation (s) of usability and learnability score (clinicians and students of physiotherapy).
Table 4.3 – Results of SUS usability test in terms of minimum, maximum , mean, and standard
deviation (s) of usability and learnability score (biomedical engineering students).

CHAPTER 5: DISCUSSION
74
Chapter 5 Discussion
Reviewing the main objective of this work we can conclude, given the
results, that we successfully achieved the aim of this work.
In the experimental results we can verify that the interface was built on the
advantages of combining web technologies with the Python programming
language, to improve the usability, interaction, extensibility, allowing some
degree of necessary automation in clinical applications, as expected in your
requisites. However, the interface has some limitations. One of them is the need to
install Python xy with Pandas and Twisted txws Libraries and also OpenSim 3.1
software. Other limitation is the Window as the only running operating system.
The reason for this fact relates to the use of OpenSim software, that only runs in
the Windows environment.
The communication between the view and model was made from
WebSockets protocol, allowing a persistent connection between the client and the
server. This type of communication proved to be the best solution for our
interface, allowing the achievement of the desired objectives.
The experimental results also be verify that the interface allows elaboration
of movement analysis reports using the benefits of the biomechanical modeling
from OpenSim. In this study we used the gait or shoulder movement to illustrate
and test the framework, but the interface is ready to receive any type of data. In
these reports the user can choose the number of graphics and the variables to be
observed. It is also possible to choose more than one variable for each graph and
the graph where the variables are present. Finally the report also allows to observe
the same variable, compare the experimental and normative data and can be
commented, printed, and saved in PDF.
Another added value found on the interface is the use of kinematic data with
two types of marker models - the standard model and the model used in Xsens
equipment - and the flexibility of the framework dealing with various types of
CHAPTER 5: DISCUSSION
75
data formats, .trc, .xml, .mot.
Regarding SUS results, in the table 3.1 the rating used in each question by the
biomedical engineering students and clinicians/ students of physiotherapy is
similar. From this fact we can draw the conclusion that the opinion about the
interface was very analogous between the two groups. Looking more carefully at
all the questions, we can observe the positively worded items (1, 3, 5, 7 and 9)
which the score contribution is the scale position minus one. Both groups deviate
from this value. In the group of clinicians/ students of physiotherapy in all
questions (1, 3, 5, 7 and 9), the mean approaches point 4, demonstrating how
much the group is in agreement with the sentences. The same trend can be
observed in the group of biomedical engineering students, where the questions 3
and 7 have the maximum scale position, 5.
In negatively-worded item (2, 4, 6, 8, 10) which the score contribution is the
scale position minus five, the group of clinicians/ students of physiotherapy in
questions 2, 4, 6 and 8, the mean approaches point 2 and in question 10 the mean
approaches 3. These values show that individuals in the group disagree with the
question posed. In the group of biomedical engineering students the same result is
shown for questions 2, 4 and 10. However in the questions 6 and 8 the mean
approaches for 1 proving the total disagree with the question posed.
From these results we conclude that the interface was extremely easy-to-use
and that the users are likely to recommend the interface to others. To support us in
these conclusions we made calculations of SUS total, usability and learnability
scores for both groups.
Table 3.2 shows the results of SUS total, usability and learnability scores for
clinicians/ students of physiotherapy. For the usability score the mean calculated
is 74,2 with 12,1 of standard deviation. However the learnability score has a lower
average, 67,9 but show a higher standard deviation, 18,4. The mean of SUS total
score is 72,9, but these values range from 0 to 100.
For the group of biomedical engineering students, table 3.3, the mean values
are higher. In usability analysis a mean of the 84,4 with 12,9 of standard deviation
is shown, in learnability, the mean is 78,6 with 13,9 of standard deviation. Finally,
the total SUS shows a 83,2 of mean and 12,6 for the standard deviation.

CHAPTER 5: DISCUSSION
76
We believe that these values can be higher in the group of biomedical
engineering students because the individuals are more used to dealing with these
type of technology. The other reason is the number of elements of the two groups.
As the number of biomedical engineering group members is the smallest, this may
influence the final results.
Yet these values have confirmed what we had stated previously. Mean values
scores, higher than 65 on a scale of 100, demonstrate that the interface is usefully,
clear, easy-to-use and learn for both groups.
Finally we cannot forget to mention the competencies acquired in the stage.
During the stage it was necessary to elaborate several tasks: support the processing of
kinematic data of the shoulder complex, work performed by students of the Master of
Physiotherapy, participation in collection and analysis of 3D kinematic data from the
upper limb, gait and golf and model clusters, brands and bases in the SolidWorks
software to use in the cinematic collection of the Laboratory. The designs will be
presented in the appendix I. However the major skills acquired were at the level of
programming and web technology design, having the need to develop a huge
learning curve to the achievement of aims.

CAPÍTULO 6: CONCLUSIONS AND FUTURE WORK
77
Chapter 6 Conclusions and future work 6.1. Conclusions
The CDSS helps clinicians dealing with medical data about patients and so to
make effective clinical decisions that will provide relevant clinical information to
improve patient care, allowing the evaluation of rehabilitation and consistent
building evidence for the effectiveness. However, the lacks of accurate and
tractable tools to help clinicians and others make decisions made quickly and
accurately moved us to this work. This report presents a HTML5 interface / CSS /
Javascript with dll's connection of the OpenSim software, offers clinicians the
opportunity to freely gain access to accurate patient movement and clinical.
The users can upload patient clinical information (e.g. gender, age, pain
and disability information, and others), determine how the selected
musculoskeletal model anthropometry should be modified so it best matches
patients characteristics and to what degree each model’s segment (markers)
should match the collected motion data during the inverse kinematics process.
Finally, the user is able to define: the report variables; if the report should
encapsulate results of one given trial, an inter-trials analysis or compare the
reconstructed motion with the match normative data set; if an impairment
classification result and its accuracy should be included; as well as annotations to
each plotted information.
This application demonstrates with elaborate gait or shoulder movement
analysis reports using benefits from the biomechanical modeling from OpenSim.
We built on the advantages of combining web technologies with the Python
programming language, to improve the usability, interaction, extensibility, and
with some degree of necessary automation in clinical applications. It was
designed under a Model-View-Controller (MVC) architecture in an Apache web
server.
The interface was tested with SUS in two groups, which are descriptive of the
potential end-user populations: a) Biomedical engineering students; b) Clinicians
and students of physiotherapy. In this test we evaluated the usability and

CAPÍTULO 6: CONCLUSIONS AND FUTURE WORK
78
learnability of the interface and have demonstrate the interface is useful, clear,
easy-to-use and learn and is likely it is to recommend the interface to others.
6.2. Future work
Limited by the timing and complexity of the goals we set ourselves, we
believe that there are several modifications that can be made, with the purpose of
improving the project, of which we highlight:
Establish templates for gait and shoulder to standardizing the reports;
Improve the User Interface make it more attractive and practical;
Integrate data mining and classification that will be receiving the
complementary information of the biomechanical modeling, patient
clinical information, high quality normative kinematic gait and
shoulder data sets;
6.3. Current Work Publications
Conference Papers
Antunes A, Filipe I, Cordeiro S, Rosa J, Carnide F, Matias R. Effectiveness of
three-dimensional kinematic biofeedback on the performance of scapula-focused
exercises. 2014. In Proceedings of the PhyCS 2014 – International Conference
on Physiological Computing Systems, Portugal.
Matias R, Antunes A, Filipe I, Cordeiro S, Rosa J, Carnide F. Immediate Changes
in Scapulothoracic Motor Control following 3D Real-time Kinematic Biofeedback
Retraining. 2014. In Proceedings of the WCB 2014 - 7th World Congress
of Biomechanics, USA.
Matias R, Rosa J, Silva H, Fred A, Veloso A. A tractable cloud-based framework
for human movement analysis and classification. In Proceedings of the 1st
Clinical Movement Analysis Conference. SIAMOC. ESMAC, Italy.

CAPÍTULO 6: CONCLUSIONS AND FUTURE WORK
79
Oral Presentation
Antunes A, Filipe I, Cordeiro S, Rosa J, Carnide F, Matias R. Effectiveness of
three-dimensional kinematic biofeedback on the performance of scapula-focused
exercises. 2014. PhyCS 2014 – International Conference on
Physiological Computing Systems, Portugal.
Matias R, Rosa J, Silva H, Fred A, Veloso A. An Open-source Web-based
Framework for Movement Impairment Classification. 2014. 12th International
Symposium on Computer Methods in Biomechanics and Biomedical Engineering,
The Netherlands.
Rosa J., Silva H., Matias R., A web-based framework using a Model-View-
Controller architecture for Human motion analysis. 2015. 4th Portuguese
BioEngineering Meeting Porto, Portugal, 26-28 February 2015.
Poster Presentation
Matias R, Rosa J, Silva H, Fred A, Veloso A. A tractable cloud-based framework
for human movement analysis and classification. 2014. 1st Clinical Movement
Analysis Conference. SIAMOC. ESMAC., Italy.
Matias R, Antunes A, Filipe I, Cordeiro S, Rosa J, Carnide F. Immediate Changes
in Scapulothoracic Motor Control following 3D Real-time Kinematic Biofeedback
Retraining. 2014. WCB 2014 - 7th World Congress of Biomechanics, USA.

REFERENCES
80
References
[1] D. Demner-Fushman, W. W. Chapman, and C. J. McDonald, “What can natural
language processing do for clinical decision support?,” J. Biomed. Inform., vol.
42, no. 5, pp. 760–72, Oct. 2009.
[2] A. R. Ahlan and B. I. Ahmad, “User Acceptance of Health Information
Technology (HIT) in Developing Countries: A Conceptual Model,” Procedia
Technol., vol. 16, pp. 1287–1296, 2014.
[3] E. S. Berner, Ed., Clinical Decision Support System, Second Edi. Health
Informatics Series, 2007.
[4] M. Khalifa, “Clinical Decision Support: Strategies for Success,” Procedia
Comput. Sci., vol. 37, pp. 422–427, 2014.
[5] Bilbomática, “Bridging challenges of clinical decision support systems with a
semantic approach. A case study on breast cancer.” [Online]. Available:
http://www.bilbomatica-idi.es/2013/05/bridging-challenges-of-
clinical.html?m=1. [Accessed: 10-Nov-2014].
[6] A. De and R. Algar, “Clinical Decision Support Systems in Biomedical
Informatics and their Limitations,” 2011.
[7] R. Matias, J. Rosa, H. Silva, A. Fred, and A. Veloso, “A tractable cloud-based
framework for human movement analysis and classification.,” 2014.
[8] M. A. Drake Richards, Vogl A, Gray´s Anatomy for Students, Second Edi.
Churchill Livingstone Elsevier, 2010.
[9] F. Moissenet, L. Chèze, and R. Dumas, “A 3D lower limb musculoskeletal model
for simultaneous estimation of musculo-tendon, joint contact, ligament and bone
forces during gait.,” J. Biomech., vol. 47, no. 1, pp. 50–8, Jan. 2014.
[10] K. Scott, J. Warrington, M. Smeltzer, and G. MacDougall, “Anatomy and
Physiology,” 2012. [Online]. Available:
http://lyceum.algonquincollege.com/lts/onlineCourses/anatomy/index.htm.
[Accessed: 20-Sep-2014].
[11] “The skeletal and muscular systems,” Pearson Education, 2014. [Online].
Available: http://www.pearsonschoolsandfecolleges.co.uk/. [Accessed: 20-Sep-
2014].
[12] D. Productions, “Sports Medicine Temple City HS.” [Online]. Available:
http://sportsmed.drkennethmartin.com/attach.htm. [Accessed: 21-Sep-2014].

REFERENCES
81
[13] “Muscles.” [Online]. Available:
http://users.rcn.com/jkimball.ma.ultranet/BiologyPages/M/Muscles.html.
[Accessed: 23-Sep-2014].
[14] S. L. Delp, F. C. Anderson, A. S. Arnold, P. Loan, A. Habib, C. T. John, E.
Guendelman, and D. G. Thelen, “OpenSim: open-source software to create and
analyze dynamic simulations of movement.,” IEEE Trans. Biomed. Eng., vol. 54,
no. 11, pp. 1940–50, Nov. 2007.
[15] V. Sholukha, B. Bonnechere, P. Salvia, F. Moiseev, M. Rooze, and S. Van Sint
Jan, “Model-based approach for human kinematics reconstruction from
markerless and marker-based motion analysis systems.,” J. Biomech., vol. 46, no.
14, pp. 2363–71, Sep. 2013.
[16] M. Clinic, “KINEMATIC ANALYSIS OF HUMAN MOVEMENT,” vol. 12, pp.
585–597, 1985.
[17] T. de M. L. M. Malaquias, “Development of a Three-Dimensional Multibody
Model of the Human Leg and Foot for Application to Movement Analysis
Biomedical Engineering,” Instituto Superior Técnico, 2013.
[18] K. Li, L. Zheng, S. Tashman, and X. Zhang, “The inaccuracy of surface-
measured model-derived tibiofemoral kinematics.,” J. Biomech., vol. 45, no. 15,
pp. 2719–23, Oct. 2012.
[19] A. Seth, M. Sherman, J. a. Reinbolt, and S. L. Delp, “OpenSim: a
musculoskeletal modeling and simulation framework for in silico investigations
and exchange,” Procedia IUTAM, vol. 2, pp. 212–232, Jan. 2011.
[20] R. R. Neptune, “Computer Modeling and Simulation of Human Movement -
Applications in Sport and Rehabilitation,” Phsical Medicine and Rehabilitation
Clinics of North America. pp. 417–431, 2000.
[21] L. Zheng, A. Ameet, R. Carey, C. Lippert, C. Harner, and X. Zhang, “PATIENT-
SPECIFIC MUSCULOSKELETAL MODELING FOR EVALUATING THE
EFFICACY OF MENISCUS TRANSPLANTATION,” Pittsburgh, PA, USA.
[22] V. Carboneemail, M. M. van der Krogt, H. F. J. M. Koopman, and N.
Verdonschot, “Sensitivity of subject-specific models to errors in musculo-skeletal
geometry,” J. Biomech., vol. 45, no. 14, pp. 2476–2480, 2012.
[23] T. T. Dao and M.-C. H. B. Tho, Biomechanics of the Musculoskeletal System -
Modeling of Data Uncertainty and Knowledge. ISTE, Wiley, 2014.
[24] N. Magnenat-Thalmann, O. Ratib, and H. F. Choi, 3D Multiscale Physiological
Human. Springer, 2014, pp. 168–172.
[25] L. Ren, Z. Qian, and L. Ren, “Biomechanics of Musculoskeletal System and Its
Biomimetic Implications: A Review,” J. Bionic Eng., vol. 11, no. 2, pp. 159–175,
Apr. 2014.

REFERENCES
82
[26] A. Technology, “Anybodytechnology.” [Online]. Available:
http://www.anybodytech.com/. [Accessed: 20-Aug-2014].
[27] Qualisys, “Visual3D Biomechanical analysis done right.” [Online]. Available:
http://www.qualisys.com/products/software/visual3d/. [Accessed: 20-Aug-2014].
[28] E. Y. S. Chao, R. S. Armiger, H. Yoshida, J. Lim, and N. Haraguchi, “Virtual
Interactive Musculoskeletal System (VIMS) in orthopaedic research, education
and clinical patient care.,” J. Orthop. Surg. Res., vol. 2, p. 2, Jan. 2007.
[29] E. Y. S. Chao, “Graphic based musculoskeletal model for biomechanical
analyses and animation,” MedicalEngineering&Physics, pp. 201–212, 2003.
[30] LIFEMODELER, “Life Modeler - Bringing Simulation to Life.” [Online].
Available: http://www.lifemodeler.com/. [Accessed: 20-Aug-2014].
[31] I. MusculoGraphics, “MusculoGraphics, Inc.” [Online]. Available:
http://www.musculographics.com/. [Accessed: 20-Aug-2014].
[32] BodyMech, “BodyMech: a Matlab based opensource package for 3D kinematic
analysis.” [Online]. Available: http://www.bodymech.nl/. [Accessed: 20-Aug-
2014].
[33] “OpenSimProject Overview.” [Online]. Available:
https://simtk.org/home/opensim. [Accessed: 20-Aug-2014].
[34] “Knee joint modeling using OpenSim software,” 2012.
[35] OpenSim, “Overview of the OpenSim Workflow.” [Online]. Available:
http://simtk-
confluence.stanford.edu:8080/display/OpenSim/Overview+of+the+OpenSim+W
orkflow. [Accessed: 10-Aug-2014].
[36] A. Araújo, “No Title.” [Online]. Available:
http://www2.uab.pt/departamentos/DCT/detaildocente.php?doc=35.
[37] L. Abreu, HTML5, 3a ed. Editora de Informática, Lda. FCA, 2012.
[38] A. Freeman, The Definitive Guide to HTML5. Apressus Series .Apress.
[39] A. P. Alves, H. Silva, A. Lourenço, and A. Fred, “SignalBIT A web-based
platform for real-time biosignal visualization and recording,” in Proc
International Conf. on Signal Processing and Multimedia Applications.
[40] M. Lutz, Learning Python, Third Edit. O’Reilly Media, Inc. O'Reilly, 2008.
[41] M. Silva, D. Gonçalves, T. Guerreiro, H. Silva, and J. Jorge, “A Web-Based
Application to Address Individual Interests of Children with Autism Spectrum
Disorders,” Procedia Comput. Sci., vol. 00, pp. 1–7, 2012.

REFERENCES
83
[42] EasyPHP, “Develop & Host.” [Online]. Available: http://www.easyphp.org/.
[Accessed: 12-Jun-2014].
[43] V. Beal, “HTTP - HyperText Transfer Protocol.” [Online]. Available:
http://www.webopedia.com/TERM/H/HTTP.html. [Accessed: 12-Aug-2014].
[44] V. Wang, F. Salim, and P. Moskovits, The Definitive Guide to HTML5
WebSocket. Apressus Series. Apress., 2012.
[45] “Twisted Matrix Labs.” [Online]. Available: http://twistedmatrix.com/trac/.
[Accessed: 28-Aug-2014].
[46] J. Brooke, “SUS - A quick and dirty usability scale.”
[47] E. Ras and V. Maquil, “Preliminary Results of a Usability Study in the Domain
of Technology-Based Assessment Using a Tangible Tabletop,” pp. 3–7, 2011.
[48] J. R. Lewis and J. Sauro, “The Factor Structure of the System Usability Scale,”
pp. 1–10.
[49] “Arnold et al. IEEE Trans Biomed Eng. 38:269-79, 2010.”
[50] R. Matias, A. Seth, and A. Veloso, “A MUSCULOSKELETAL MODEL OF
THE SHOULDER CAPABLE OF INFORMING CLINICAL DECISION-
MAKING,” vol. 39, no. 2, 2012.
[51] “Xsens.” [Online]. Available: http://www.xsens.com/products/xsens-mvn/.
[Accessed: 27-Aug-2014].
[52] “JQuery UI.” [Online]. Available: http://jqueryui.com/. [Accessed: 27-Aug-
2014].
[53] “Flot.” [Online]. Available: http://www.flotcharts.org/. [Accessed: 27-Aug-
2014].
[54] “Data-Driven Documents.” [Online]. Available: http://d3js.org/. [Accessed: 28-
Aug-2014].
[55] D. S. McFarland, JavaScript & jQuery: The Missing Manual, Second Edi.
O’Reilly Media, Inc. O'Reilly, 2012.

APPENDIX
A.1
Appendix I
2D drawings
in
SolidWorks

10
15
2
5
6
R5
Base 152:1
Escala
Tol.ISO2768m
Proj.Des.CopiouVerif.
Substitui:Substituido por:
- ESTSetúbal -Instituto
Politécnicode Setúbal

10
20
2
10
6
Base 202:1
Escala
Tol.ISO2768m
Proj.Des.CopiouVerif.
Substitui:Substituido por:
- ESTSetúbal -Instituto
Politécnicode Setúbal

R42
88,
36
68,01
30,97
R3
4,03
14
7
R2,50
88
20
R2,50
30 4
Cluster 90x701:2
Escala
Tol.ISO2768m
Proj.Des.CopiouVerif.
Substitui:Substituido por:
- ESTSetúbal -Instituto
Politécnicode Setúbal

R62
118
88,07
R3
13,45
31,27 13,45
8,5
0 3
0
R2,50
38,09
118
5,0
4
30 29
14,50
Cluster 1201:2
Escala
Tol.ISO2768m
Proj.Des.CopiouVerif.
Substitui:Substituido por:
- ESTSetúbal -Instituto
Politécnicode Setúbal

R76
95,85
148
6
37,40 10,52
30 28
R2,5
0
41,24
3,08 150 6
,80
R2,50
30 59 14,50
Cluster 1501:1
Escala
Tol.ISO2768m
Proj.Des.CopiouVerif.
Substitui:Substituido por:
- ESTSetúbal -Instituto
Politécnicode Setúbal

2
8,20
8,2
0
29
10,20
12,20
Caixa de proteção de sensores2:1
Escala
Tol.ISO2768m
Proj.Des.CopiouVerif.
Substitui:Substituido por:
- ESTSetúbal -Instituto
Politécnicode Setúbal

9,4
2 1
18
89,68
6
9,84 35
70
9,84
120
9,6
3 R
2,50
30 14,50
42,19
35
15,
50
Cluster Plano1:2
Escala
Tol.ISO2768m
Proj.Des.CopiouVerif.
Substitui:Substituido por:
- ESTSetúbal -Instituto
Politécnicode Setúbal

79,
02
89,38
6
10,69
35,01
30,05
75,38 R
2,50
30
58
R2,50
30 8,6
5
Cluster Sacro1:2
Escala
Tol.ISO2768m
Proj.Des.CopiouVerif.
Substitui:Substituido por:
- ESTSetúbal -Instituto
Politécnicode Setúbal

20
6,20
Marca 20mm2:1
Escala
Tol.ISO2768m
Proj.Des.CopiouVerif.
Substitui:Substituido por:
- ESTSetúbal -Instituto
Politécnicode Setúbal

9,
20
10,20
16,33
60,26
13,54
10,
20
46,90
Stylus1:1
Escala
Tol.ISO2768m
Proj.Des.CopiouVerif.
Substitui:Substituido por:
- ESTSetúbal -Instituto
Politécnicode Setúbal
Top Related