


Línguas
Páginas
Legal


UNIVERSIDADE DE LISBOA
FACULDADE DE CIÊNCIAS
DEPARTAMENTO DE BIOLOGIA VEGETAL
A global phylogeographic survey of Saccharomyces uvarum
Carla Isabel Gomes Gonçalves
MESTRADO EM MICROBIOLOGIA APLICADA
2011
A global phylogeographic survey of Saccharomyces uvarum
UNIVERSIDADE DE LISBOA
FACULDADE DE CIÊNCIAS
DEPARTAMENTO DE BIOLOGIA VEGETAL
A global phylogeographic survey of Saccharomyces uvarum
Dissertação orientada por Prof. Dr. José Paulo Sampaio (CREM,FCT-UNL)
e Profª. Drª. Margarida Barata (FCUL)
Carla Isabel Gomes Gonçalves
MESTRADO EM MICROBIOLOGIA APLICADA
2011

A global phylogeographic survey of Saccharomyces uvarum
A global phylogeographic survey of Saccharomyces uvarum
Carla Isabel Gomes Gonçalves
MASTER THESIS
2011
This thesis was fully performed at Centro de Recursos Microbiológicos (CREM), Departamento de Ciências da Vida in Faculty of Science and Technology of New University of Lisbon under the direct
supervision of Prof. Dr. José Paulo Sampaio.
Prof. Dr. Margarida Barata was the internal designated supervisor in the scope of the Master in Applied Microbiology of the Faculty of Sciences of the University of Lisbon.

A global phylogeographic survey of Saccharomyces uvarum
Acknowledgments
First, I would like to thank my supervisor Prof. Dr. José Paulo Sampaio for giving me
the opportunity to work with him, for putting so much effort and enthusiasm in this work, for
the detailed and careful reading of this thesis and especially for all the knowledge I acquire
while working with him.
I am also thankful to my host lab CREM (Centro de Recursos Microbiológicos) for
providing me all the conditions to perform my work.
I’d like to thank Prof. Dr. Rogério Tenreiro for being always available to answer my
question, especially the bureaucratical ones. I also want to thank Prof. Dr. Margarida Barata
for promptly responding to my questions and for the careful reading of this thesis.
I want to thank my lab colleagues for providing an healthy and amusing environment
in the lab. To Dr. Elisabete Valério who has been accompanying all my work for several
years being crucial to my integration in the team and in the lab, to Márcia Palma for all the
brainstorming moments and for all the friendship, to Marco Coelho for always have some
wise and helpful tip, and to Pedro Almeida for all the help in the assimilation of some
population genetics concepts.
I am also thankful to Prof. Dr. Paula Gonçalves for first integrate me in the lab team
as a research fellow and for all the wise tips during this work.
To my closest friends (which are too many to mention), for their patience, friendship
and support that were so important they can’t even imagine.
A special thanks to Pedro, for his optimistic spirit, for being always there for me and
for all the care.
My last words go to my family. To my parents, Luísa and Fernando, to my brother
Duarte and to my grandmother Beatriz: thank you for always believing in me and in my work,
for all the love and support and for all the patience. Without you this would have not been
possible.
i

A global phylogeographic survey of Saccharomyces uvarum
Resumo
As leveduras do género Saccharomyces têm sido consideradas objectos de estudo
interessantes em biologia evolutiva e genética populacional dada a sua distribuição ubíqua,
relevância como organismos modelo, disponibilidade de informação genómica para todas as
espécies e importância nas indústrias fermentativas (fermentação da cerveja e do vinho,
panificação, entre outras similares). No entanto, apesar da sua relevância como organismos
modelo em inúmeras áreas da Biologia, muitas questões relacionadas com a sua ecologia e
história evolutiva permanecem ainda sem resposta.
Tal como S. cerevisiae, frequentemente usada na fermentação do mosto de vinho e
do pão, S. uvarum é uma levedura importante na fermentação da cidra e de alguns tipos de
vinho produzidos a baixas temperaturas. Apesar da sua ligação a processos fermentativos
conduzidos pelo Homem, esta levedura é frequentemente encontrada na natureza nos mais
diversos substratos como cascas de árvores, cogumelos, solo e até insectos. Estudos
realizados em S. cerevisiae indicam que a divergência genética nesta espécie está ligada à
especialização ecológica. Para além disso, foram identificados eventos de domesticação
ligados ao vinho e ao saké, sendo que as estirpes associadas a estas fermentações
apresentam menor diversidade genética que as selvagens, para além de que derivam
filogeneticamente destas. Por outro lado, a espécie filogeneticamente mais próxima de S.
cerevisiae, S. paradoxus, é apenas isolada de ambientes naturais apresentando um padrão
filogeográfico acentuado sendo reconhecidas várias populações geográficas.
Tendo em conta que os padrões de diversidade genética de S. uvarum são ainda
desconhecidos, neste trabalho foram estudadas 50 estirpes provenientes de substratos e
regiões muito diversificadas com o objectivo de detectar indícios de domesticação e de
esclarecer os aspectos que afectam a estrutura populacional nesta espécie.
Foi realizada uma análise filogenética baseada na sequenciação parcial de três
genes nucleares tendo sido identificados três grupos filogenéticos principais. Dois dos
grupos corresponderam a duas regiões específicas: Australásia (clade C) e Patagónia (clade
B). Todos os restantes isolados, incluindo alguns isolados da Patagónia, constituíram um
grupo filogenético distinto (clade A) e bem separado do grupo da Australásia. A distribuição
das estirpes da Patagónia ao longo de dois dos ramos filogenéticos é espelho da grande
diversidade genética encontrada neste local. Quanto ao grupo das estirpes da Australásia, é
caracterizado por uma elevada divergência genética relativamente aos restantes grupos.
Esta divergência encontra correspondência a nível fenotípico e traduz-se também num
isolamento reprodutor parcial relativamente aos indivíduos dos outros grupos filogenéticos e
em evidências de diferenciação populacional. O mesmo não se verifica com as estirpes da
Patagónia (clade B) que apesar da sua aparente divergência na análise filogenética,
ii

A global phylogeographic survey of Saccharomyces uvarum
apresentam características fenotípicas semelhantes às de estirpes representativas do clade
A, inexistência de evidência de diferenciação populacional e ausência de isolamento
reprodutor.
No que diz respeito ao estudo da domesticação, não foi possível encontrar o padrão
observado em S. cerevisiae visto que quer estirpes isoladas de ambientes naturais quer
estirpes provenientes de cidra ou vinho se agrupam no mesmo ramo filogenético. Além
disso, a diversidade genética das estirpes domesticadas não é inferior à das estirpes
selvagens. Deste modo os resultados sugerem que o processo de domesticação que
ocorreu em S. cerevisiae não se verifica em S. uvarum.
É ainda de salientar que todas as estirpes provenientes do Hemisfério Sul foram
isoladas ou de Nothofagus ou Cyttaria, sendo este último um fungo ascomiceta que é
parasita obrigatório das árvores do género Nothofagus. Todas as espécies que constituem
estes dois géneros povoam apenas alguns locais do Hemisfério Sul sendo que a actual
distribuição está associada à separação do mega-continente Gondwana.
Para além dos genes nucleares, dois genes mitocondriais foram também
sequenciados para um conjunto de estirpes representativo dos grupos filogenéticos obtidos
com as sequências nucleares. Nesta análise, a população da Australásia surgiu como a
mais divergente relativamente a um grupo constituído pelas restantes populações de S.
uvarum e S. bayanus (a espécie filogeneticamente mais próxima de S. uvarum). Devido à
incongruência verificada entre as filogenias de genes nucleares e mitocondriais, e no sentido
de evidenciar possíveis fenómenos de recombinação, foi realizada uma análise baseada em
phylogenetic networks. Com esta análise foi possível evidenciar eventos de trocas génicas
entre as populações da Patagónia e do Hemisfério Norte, corroborando assim a ligação
entre as populações destes dois locais. Esta aparente ligação levou a questionar se o grupo
da Patagónia consiste numa população diferente do grupo do Hemisfério Norte, tendo-se
efectuado uma análise para detecção de estrutura populacional no programa Structure.
Nesta análise apenas se evidenciaram duas populações: uma correspondente às estirpes
da Australásia e outra reunindo as restantes estirpes. Quando o programa foi forçado a
considerar um número superior de populações a única partição encontrada consistiu na
adição de mais uma população, tendo as estirpes da Patagónia sido distribuídas por dois
clusters genéticos, sendo que um destes clusters é marcadamente dominante no Hemisfério
Norte. Estes resultados parecem sugerir a colonização do Hemisfério Norte a partir da
América do Sul.
Devido aos indícios sugeridos por estes resultados, foi realizada uma análise mais
detalhada a nível populacional. Recorreu-se ao uso de três regiões microsatélite que,
apresentando uma evolução mais rápida, podem ter relevância para estudos populacionais.
Considerando a variação do número de repetições nas regiões microsatélite, confirmou-se a
iii

A global phylogeographic survey of Saccharomyces uvarum
inexistência de estrutura populacional entre a Patagónia e o Hemisfério Norte, enquanto a
diferenciação da população da Australásia se manteve. Observou-se ainda a existência de
substituições nucleotídicas pontuais nas estirpes da Australásia e Patagónia, relativamente
às restantes, sendo que nas primeiras estas parecem estar fixas na população, algo que
pode sugerir a ancestralidade da mesma. Para além disso, tanto nas estirpes da Australásia
como nas da Patagónia foram encontrados alelos privados com elevada frequência na
população. Esta elevada frequência aliada a uma elevada diversidade genética no caso da
Patagónia, sugere uma existência antiga, tendo decorrido gerações suficientes para se
propagarem alelos únicos em grande parte da população. Outro dado interessante é a
existência de alelos privados característicos do Hemisfério Sul (Australásia e Patagónia).
Esta associação entre estes dois locais é corroborada pelos dados de diferenciação
populacional, que não sugerem uma separação tão clara destes dois grupos relativamente à
clara separação encontrada entre a Australásia e o Hemisfério Norte.
Considerando os resultados obtidos no decurso deste estudo, a hipótese de trabalho
para estudos futuros é a de que S. uvarum colonizou o Hemisfério Norte a partir de uma
população original residente a Sul, provavelmente na América do Sul. Por outro lado, a
ligação entre a Australásia e a Patagónia e a associação ao sistema Nothofagus – Cyttaria
remete para os processos de deriva continental associada à separação do Gondwana.
Trabalhos futuros, suportados em maior densidade de informação genética e em
amostragens populacionais mais completas, serão necessários para completar o estudo da
história evolutiva desta levedura, iniciado com este trabalho.
Palavras chave: Saccharomyces uvarum, cidra, filogeografia, genética populacional,
evolução
iv
A global phylogeographic survey of Saccharomyces uvarum
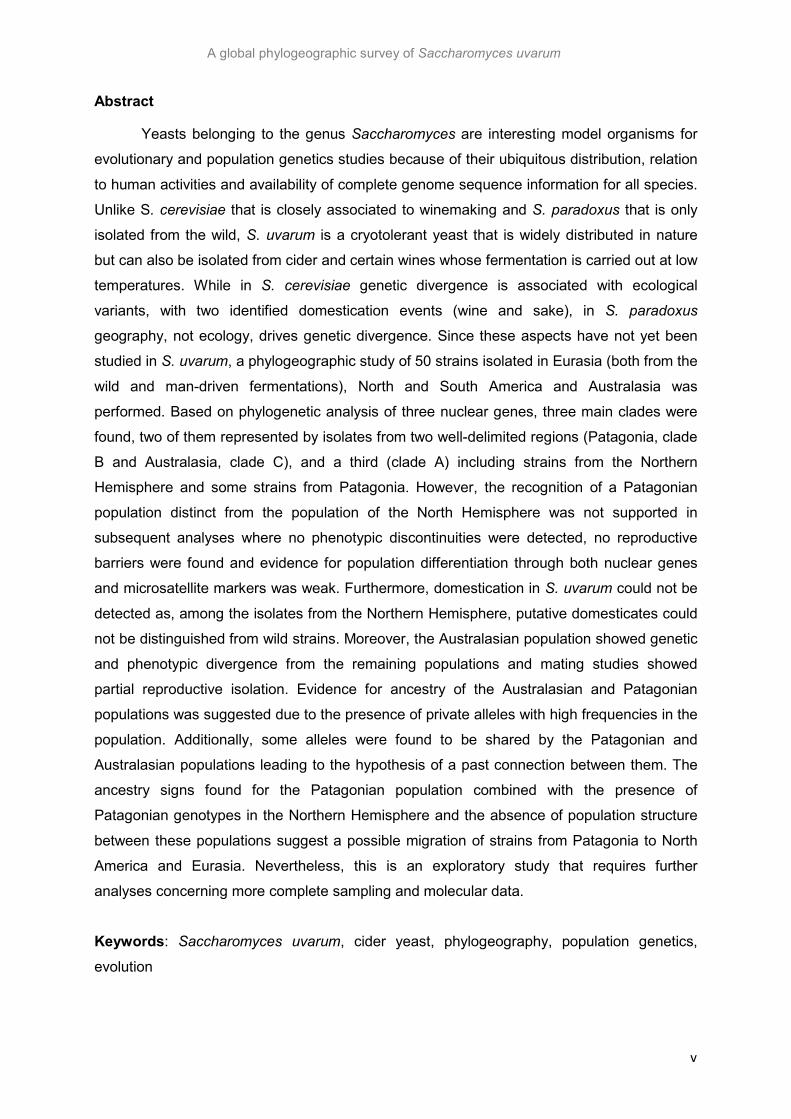
Abstract
Yeasts belonging to the genus Saccharomyces are interesting model organisms for
evolutionary and population genetics studies because of their ubiquitous distribution, relation
to human activities and availability of complete genome sequence information for all species.
Unlike S. cerevisiae that is closely associated to winemaking and S. paradoxus that is only
isolated from the wild, S. uvarum is a cryotolerant yeast that is widely distributed in nature
but can also be isolated from cider and certain wines whose fermentation is carried out at low
temperatures. While in S. cerevisiae genetic divergence is associated with ecological
variants, with two identified domestication events (wine and sake), in S. paradoxus
geography, not ecology, drives genetic divergence. Since these aspects have not yet been
studied in S. uvarum, a phylogeographic study of 50 strains isolated in Eurasia (both from the
wild and man-driven fermentations), North and South America and Australasia was
performed. Based on phylogenetic analysis of three nuclear genes, three main clades were
found, two of them represented by isolates from two well-delimited regions (Patagonia, clade
B and Australasia, clade C), and a third (clade A) including strains from the Northern
Hemisphere and some strains from Patagonia. However, the recognition of a Patagonian
population distinct from the population of the North Hemisphere was not supported in
subsequent analyses where no phenotypic discontinuities were detected, no reproductive
barriers were found and evidence for population differentiation through both nuclear genes
and microsatellite markers was weak. Furthermore, domestication in S. uvarum could not be
detected as, among the isolates from the Northern Hemisphere, putative domesticates could
not be distinguished from wild strains. Moreover, the Australasian population showed genetic
and phenotypic divergence from the remaining populations and mating studies showed
partial reproductive isolation. Evidence for ancestry of the Australasian and Patagonian
populations was suggested due to the presence of private alleles with high frequencies in the
population. Additionally, some alleles were found to be shared by the Patagonian and
Australasian populations leading to the hypothesis of a past connection between them. The
ancestry signs found for the Patagonian population combined with the presence of
Patagonian genotypes in the Northern Hemisphere and the absence of population structure
between these populations suggest a possible migration of strains from Patagonia to North
America and Eurasia. Nevertheless, this is an exploratory study that requires further
analyses concerning more complete sampling and molecular data.
Keywords: Saccharomyces uvarum, cider yeast, phylogeography, population genetics,
evolution
v

A global phylogeographic survey of Saccharomyces uvarum
Table of Contents
Table index vii
Figure index viii
Abbreviations ix
_________________________________________________________________________________________
1. Introduction 1
2. Materials and Methods 6 2.1 Yeast Strains 6
2.2 Phenotypic assays
2.2.1 Utilization of different carbon sources 6 2.2.2 Maximum growth temperatures 6 2.2.3 Specific growth rates 6
2.3 Mating tests 6
2.4 DNA sequencing 7
2.4.1 DNA extraction 7 2.4.2 PCR amplification and product purification 7
2.5 DNA sequencing 8
2.5.1 Phylogenetic trees 8 2.5.2 Phylogenetic networks 8 2.5.3 Molecular diversity and DNA divergence between populations 8 2.5.4 Population structure 8
2.6 Microsatellite analyses 9 2.6.1 Microsatellite amplification and typing 9 2.6.2 Statistical analysis 9
2.6.2.1 F-statistics and population distinctiveness 9 2.6.2.2 Population differentiation 9
3. Results and Discussion 11
3.1 Phylogenetic analyses 11 3.2 Reproductive isolation 17 3.3 Population differentiation 19 3.4 Inference of ancestry 23 3.5 An evolutionary model 24
4. Concluding remarks and future perspectives 25
5. References 26
Appendix I 30
vi
A global phylogeographic survey of Saccharomyces uvarum
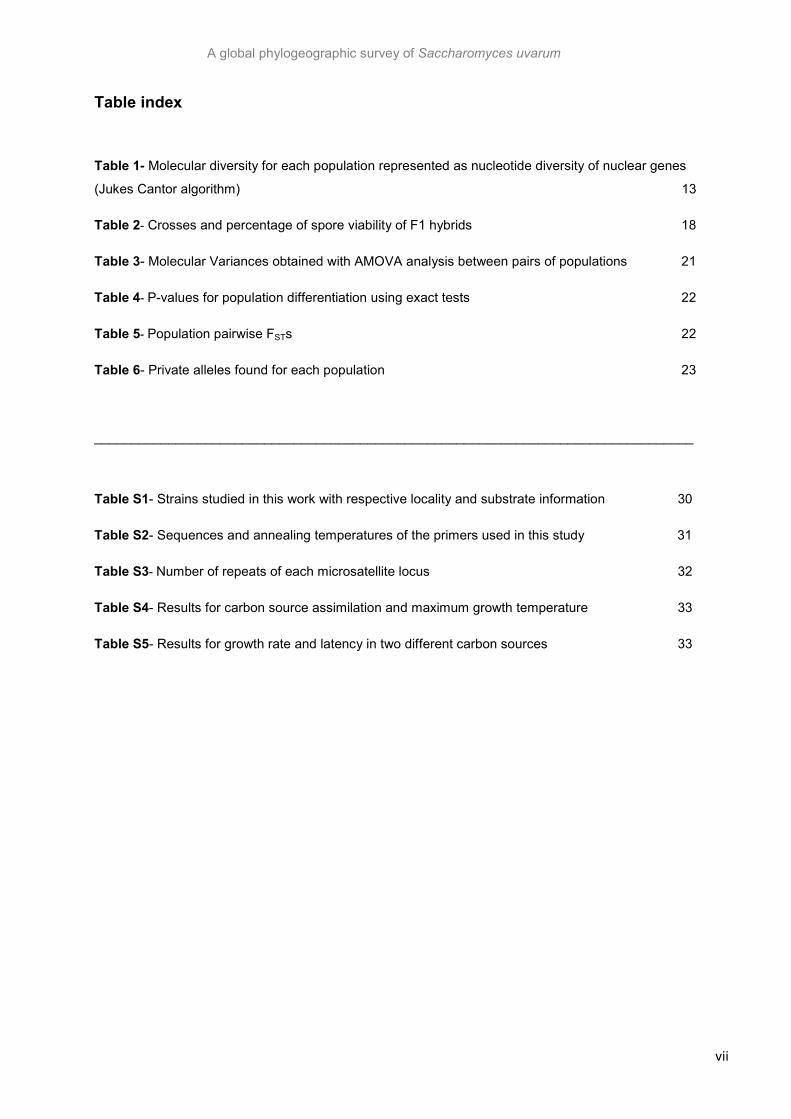
Table index
Table 1- Molecular diversity for each population represented as nucleotide diversity of nuclear genes
(Jukes Cantor algorithm) 13
Table 2- Crosses and percentage of spore viability of F1 hybrids 18
Table 3- Molecular Variances obtained with AMOVA analysis between pairs of populations 21
Table 4- P-values for population differentiation using exact tests 22
Table 5- Population pairwise FSTs 22
Table 6- Private alleles found for each population 23
_________________________________________________________________________________
Table S1- Strains studied in this work with respective locality and substrate information 30
Table S2- Sequences and annealing temperatures of the primers used in this study 31
Table S3- Number of repeats of each microsatellite locus 32
Table S4- Results for carbon source assimilation and maximum growth temperature 33
Table S5- Results for growth rate and latency in two different carbon sources 33
vii
A global phylogeographic survey of Saccharomyces uvarum
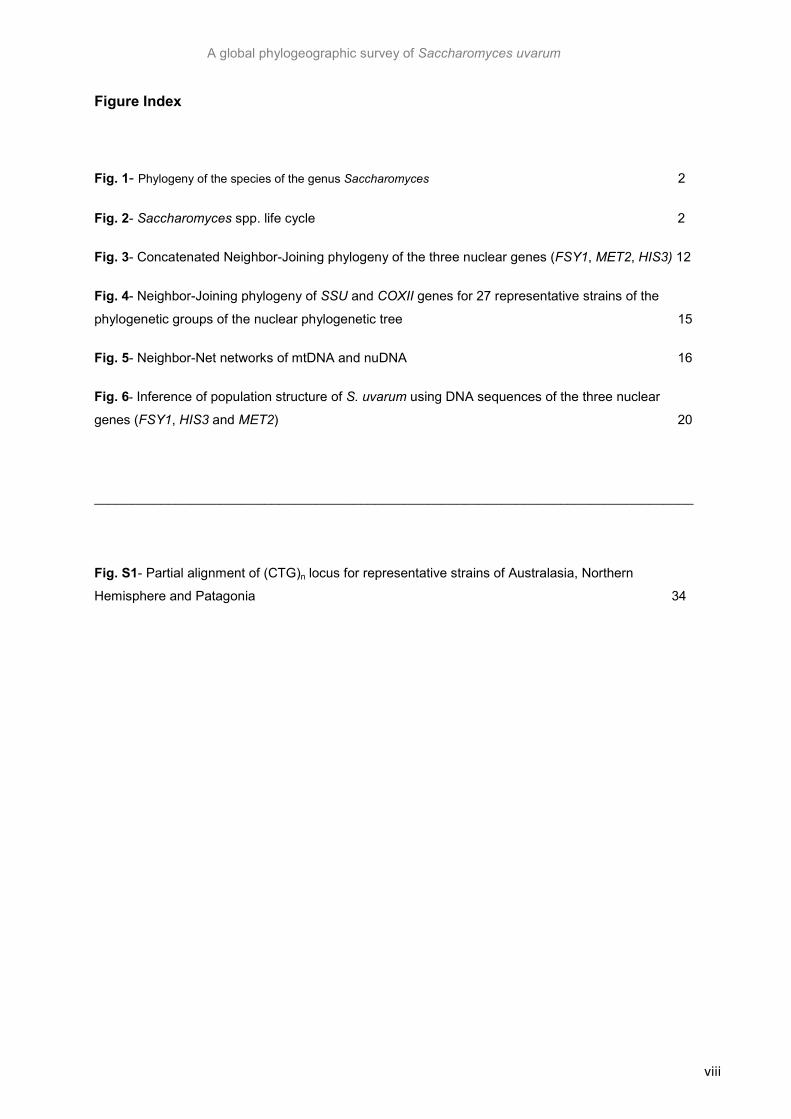
Figure Index
Fig. 1- Phylogeny of the species of the genus Saccharomyces 2
Fig. 2- Saccharomyces spp. life cycle 2
Fig. 3- Concatenated Neighbor-Joining phylogeny of the three nuclear genes (FSY1, MET2, HIS3) 12
Fig. 4- Neighbor-Joining phylogeny of SSU and COXII genes for 27 representative strains of the
phylogenetic groups of the nuclear phylogenetic tree 15
Fig. 5- Neighbor-Net networks of mtDNA and nuDNA 16
Fig. 6- Inference of population structure of S. uvarum using DNA sequences of the three nuclear
genes (FSY1, HIS3 and MET2) 20
_________________________________________________________________________________
Fig. S1- Partial alignment of (CTG)n locus for representative strains of Australasia, Northern
Hemisphere and Patagonia 34
viii

A global phylogeographic survey of Saccharomyces uvarum
Abbreviations
AMOVA Analysis of molecular variance
bp Base pairs
FST Fixation index (measure of population differentiation)
HWE Hardy-Weinberg equilibrium
k Populations
mtDNA Mitochondrial DNA
nuDNA Nuclear DNA
ODxnm Optical density at x wavelength (nm)
RFLP Restriction fragment length polymorphism
SDS Sodium dodecyl sulfate
SNP Single nucleotide polymorphism
TE Tris-EDTA
YM Yeast extract-Malt extract medium
YMA Yeast extract-Malt extract agar medium
YNB Yeast Nitrogen Base medium
YPD Yeast Extract Peptone Dextrose medium
w/v Weight per volume
∆K Ln (k) variation
ix

A global phylogeographic survey of Saccharomyces uvarum
_______________________________________________________________________________ 1
1. Introduction
One of the most important challenges of evolutionary biology is to understand the
evolutionary processes of living beings in the wild, and which
factors (e.g. geography, ecology) are interfering in these processes. The study of the
evolutionary history of plants and animals, although complex, is easier than the evolutionary
study of microbes. That is so not only because of their macroscopic size that allows a more
detailed analysis of the phenotypic diversity between individuals, but mainly because of the
availability of fossils that allow the tracking of their evolutionary history since the Proterozoic
Era. Microbes, like yeasts, have no fossil record, making it difficult to follow their evolutionary
course. Fortunately, recent methodological and molecular advances have provided several
tools to obtain and process molecular data, making it possible to test hypothesis about their
evolution.
Yeasts, especially those that belong to the genus Saccharomyces, are interesting
organisms for evolutionary studies. First, they are widely distributed around the globe making
it possible to perform population studies to understand their dynamics and, possibly, infer
their evolution through time. Secondly, it is important to note their close relation with human
activities like winemaking, cider fermentation, baking and brewing, among other human
related activities. This genus, formerly known as the Saccharomyces sensu stricto complex,
currently includes eight species (Naumov et al., 2000b; Kurtzman and Robnett, 2003) (Fig.
1): S. cerevisiae, the first yeast to be described (Rainieri et al., 2003) and mainly isolated
from fermentative processes (Mortimer, 2000); S. paradoxus, the closest species to S.
cerevisiae but exclusively associated with natural habitats (Johnson et al., 2004); S.
cariocanus (Naumov et al., 2000b), isolated in Brazil and closely related with S. paradoxus;;
S. mikatae isolated in Japan (Naumov et al., 2000b); S. kudriavzevii, found in decayed
leaves and soils in Japan and in oaks in Portugal (Sampaio and Gonçalves, 2008); S.
arboricolus, recently described and isolated from oak trees in China (Wang and Bai, 2008);
S. bayanus, associated with fermentations carried out at low temperatures; S. pastorianus, a
natural hybrid between S. cerevisiae and S. bayanus associated with anthropic environments
due to its ability to ferment at low temperatures (Libkind et al., 2011) and S. uvarum, the
closest relative of S. bayanus, which is not only isolated from low-temperature fermentations
of cider, wine and other beverages (Naumov et al., 2001) but also frequently isolated from
the wild (Sampaio and Gonçalves, 2008).

A global phylogeographic survey of Saccharomyces uvarum
_______________________________________________________________________________ 2
Fig. 1 – Phylogeny of the species of the genus Saccharomyces. The color
gradient represents the growth temperature preferences of species: warm tones code for higher temperature
preferences and cool tones code for lower temperature preferences (Image kindly provided by Marco Coelho).
Taking into account that species differentiation in this genus has always been difficult
(Rainieri et al., 2003), the nomenclature of S. bayanus and S. uvarum has been confusing
and controversial for decades and S. uvarum is not considered as a distinct species for many
biologists. Because of the high DNA-DNA reassociation values between the type strains of
these two species (Rosini et al., 1982) and the similarity of assimilation profiles of carbon
sources, S. uvarum was initially considered a synonym of S. bayanus (Naumov et al., 1996),
and later a variety (Naumov, 2000a). Because of the absence of a clear resolution of these
taxonomic issues, the first genome to be sequenced from this complex (strain CBS 7001)
was designated S. bayanus or S. bayanus var. uvarum instead of S. uvarum (Cliften et al.,
2006). Libkind et al. 2011 clarified this issue by genome sequencing and mating of strains of
S. bayanus and S. uvarum occurring in nature in Patagonia. The measurement of the degree
of fertility is possible because of the life cycle of Saccharomyces spp. (Fig. 2), where there is
no pre-zygotic barrier; therefore, all the species can mate with each other (Greig, 2009). The
reproductive isolation is post-zygotic which means that F1 hybrids divide normally by asexual
budding and form spores by sexual meiosis but the level of viability of these spores
decreases when inter species mating occurs (Liti et al., 2006).
Fig. 2 - Saccharomyces spp. life cycle. Reproduction is defined
by mating type genes (MAT). The presence of a MATa allele at
this locus gives a clone of mating-type a, and a MATα allele
gives a clone of mating type α. Only opposite mating types can
mate (Replanski et al., 2008).

A global phylogeographic survey of Saccharomyces uvarum
_______________________________________________________________________________ 3
Additionally to low spore viability of hybrids (7% of viable spores), Libkind et al.
(2011) found ~7% genome-wide sequence divergence between Patagonian S. bayanus and
S. uvarum strains, and observed niche differentiation in the wild. Other molecular studies by
Rainieri et al. (1999) and Pulvirenti et al. (2000), for instance, pointed to S. uvarum being a
homogeneous taxonomic group, distinct from S. bayanus. These studies led to proposals for
the reinstatement of S. uvarum as a separate species (Pulvirenti et al., 2000; Nguyen and
Gaillardin, 2005). S. uvarum, along with S. bayanus and S. pastorianus, is classified as a
cryotolerant yeast because it grows at temperatures lower than those preferred by S.
cerevisiae (Fig. 1), being therefore adapted to low-temperature fermentations during
winemaking (Naumov, 2000a) and cider production (Naumov et al., 2001). While non-
cryotolerant strains are not effective in cider, lager beer and white wine fermentation,
cryotolerant strains like those of S. uvarum are specialized in these processes. Furthermore,
S. uvarum can also contribute to alcoholic fermentation in mixed populations with S.
cerevisiae (Masneuf-Pomarède, 2010). In fact, it was even the predominant species, in
spontaneous fermentations of must obtained from grapes cultivated in vineyards in the North
of France (Massoutier et al., 1998; Naumov et al., 2001; Demuyter et al., 2004). S. uvarum
was also isolated from natural fermentations of botrytized grape must (Naumov et al., 2000b,
2001; Sipiczki et al., 2001; Antunovics et al., 2005) and identified in natural fermentations of
Recioto and Amarone wines (Tosi et al., 2009). In natural habitats, this yeast has been
sporadically isolated from insects (Mesophylax adopersus and Drosophila spp.), tree fluxes
of Ulmus and Carpinus, from Nothofagus bark, fruiting bodies of Cyttaria, and from
mushrooms (Naumov 2003, Naumov 2006). Expeditions to Patagonia and New Zealand in
2006 and 2009 respectively (Sampaio, J.P. and Libkind, D., unpublished), allowed the
collection of several strains of S. uvarum from Nothofagus trees and from fruiting bodies of
Cyttaria, an ascomycete fungus that is an obligate parasite of Nothofagus. When mature,
these fruiting bodies are rich in sugars, being a Saccharomyces habitat (Libkind et al., 2007).
They are exclusively associated with Nothofagus spp. and therefore occur solely in South
America (Argentina and Chile) and Australasia (Australia and New Zealand) (Libkind et al.,
2007; Peterson et al., 2010).
Since S. cerevisiae is associated with winemaking and other human activities, and its
closest relative S. paradoxus is only found in natural habitats, some authors hypothesized
about the possibility of S. cerevisiae being a domesticated species. Domestication is
therefore an important aspect to take into account in evolutionary studies of Saccharomyces
because it can shape the evolutionary course of a population and have a strong impact in
population dynamics (Johnson et al., 2004).
The selection and propagation of plants more suited to the human needs is done since the
pre-Neolithic in Syria where there is early evidence for conscious cultivation and trait
B

A global phylogeographic survey of Saccharomyces uvarum
_______________________________________________________________________________ 4
selection (Hillman et al., 2001). Wheat, for instance, was one of the first crops to be
domesticated more than 10,000 years ago. As a consequence, the traits that are known
nowadays in domesticates are markedly different from those present in wild populations
(Charmet, 2011). Given the well-established knowledge of plant and animal domestication,
one can wonder if microbes were also unwittingly domesticated.
Based on the analysis of DNA extracted from ancient wine containers and molecular
analysis of pottery jars found in China, it was found that yeasts have been associated with
fermented beverages since 7000 BC (Mortimer, 2000). The approach for the identification of
domestication processes in microorganisms is based on molecular analyses and is also
based on the assumption that domesticates have a lower level of diversity when compared to
wild stocks, which represent the ancestral lineages (Fay and Benavides, 2005). Molecular
data such as microsatellite polymorphisms and gene sequencing indicated that S. cerevisiae
comprises two types of populations: domesticated (associated with human environments)
and non-domesticated (strains isolated from the wild) (Fay and Benavides, 2005; Legras et
al., 2007). Furthermore, it was found that non-domesticated populations group according to
their geographic origin. This geographic association had been already observed for S.
paradoxus by Kuehne et al. (2007). In that study, 62 strains from several locations within two
continental regions (eastern North America and eastern Europe/western Asia) were studied
using nine unlinked nuclear loci that were sequenced. The authors were able to obtain two
well-defined clades, corresponding to two different populations: North American and
Eurasian. More recently, Liti et al. (2009) reinforced this geographical connection by whole
genome sequencing. Two more populations were introduced, dividing therefore S. paradoxus
in four populations: European, Far Eastern, American and Hawaiian. These studies
demonstrated that geography plays a major role in S. paradoxus diversity and counteracted
the idea that microbes, including eukaryotes, do not have biogeographies because
continuous large-scale dispersal sustains an uniform and global distribution (Finlay, 2002).
Taking into account the apparent habitat and substrate preference similarities
between S. uvarum, S. cerevisiae and S. paradoxus, and because much less is known about
S. uvarum, the present work aims to clarify the evolutionary history and the diversity of this
yeast. Therefore, a phylogeographic study was carried out in order to understand how spatial
and temporal dimensions interfered with the evolution of S. uvarum. Phylogeography is a
study that bridges many disciplines, incorporating different kinds of information from
phenotypes, population ecology and molecular and evolutionary genomics to geography,
climatology and ecological factors. This integration can provide valuable information on how
geographical, geologic and environmental factors are interfering with species ecology,
therefore shaping its evolution (Knowles, 2009). To achieve this, nuclear and mitochondrial
sequence data from 50 strains of S. uvarum (isolated from different regions and from both
A global phylogeographic survey of Saccharomyces uvarum
_______________________________________________________________________________ 5
wild and fermentative environments, Table S1 in Appendix I) were used in order to infer
genetic diversity and possible phylogenetic relationships. Additionally, in order to investigate
if genetic diversity is related with reproductive isolation, mating tests between and within the
different phylogenetic groups were performed. Furthermore, in order to clarify the partition of
populations, three microsatellite loci were also studied.

A global phylogeographic survey of Saccharomyces uvarum
_______________________________________________________________________________ 6
2. Material and Methods 2.1 Yeast strains
The strains used in this study and their origins are listed in Table S1. All yeasts were
grown on YPM solid medium (0.3% w/v yeast extract, 0.3% w/v malt extract, 0.3% w/v
bactopeptone, 1% w/v glucose and 1.5% w/v agar) for DNA isolation, carbon source
assimilation and maximum growth temperature assays.
2.2 Phenotypic assays
2.2.1 Utilization of different carbon sources Strains were grown in 5 mL of YNB liquid medium supplemented with 1% w/v of the
carbon source to be tested (glucose, fructose, melibiose, maltose and mannitol). Tubes were
incubated on a shaker (150 rpm) at 25ºC for several days. Growth was evaluated in terms of
turbidity.
2.2.2 Maximum growth temperature Strains were inoculated in 5 mL of YM liquid medium (0.3% w/v yeast extract, 0.3% w/v
malt extract, 0.3% w/v bactopeptone, 1% w/v glucose) and incubated at several
temperatures (28ºC-36ºC) for seven days. Growth was evaluated in terms of turbidity.
2.2.3 Specific growth rates
Strains were previously inoculated in YNB liquid medium with 2% w/v of glucose (pre-
inoculum). When the pre-inoculum reached OD640nm =2-2.5 (middle of the exponential growth
phase) it was transferred to a 500 mL Erlenmeyer flask with 100 mL of YNB liquid medium
supplemented with 2% w/v of carbon source (glucose or melibiose). These flasks were
incubated at three different temperatures (10ºC, 18ºC and 25ºC) and turbidy (OD640nm) was
measured at 2-6 hours intervals.
2.3 Mating tests
Strains were plated on sporulation medium (0.1% w/v glucose, 0.25% w/v yeast
extract, 1% w/v potassium acetate, 1.5% w/v agar) and incubated at 25ºC for 3 -5 days in
order to induce sporulation. Tetrads were recovered and incubated for 15 minutes in the
presence of lyticase (0.4 mg/mL) in order to weaken the cell wall. Crosses were performed
on YPD medium (1% w/v yeast extract, 2% w/v peptone, 2% w/v glucose, 2% w/v agar).
Tetrads were dissected and individual spores were crossed with a micromanipulator Zeiss-
Axio Scope.A1. Observations with a microscope were performed after 4-6h in order to detect
A global phylogeographic survey of Saccharomyces uvarum
_______________________________________________________________________________ 7
formation of zygotes. In order to measure the F1 fertility, spores from 50-60 tetrads (200-240
spores) were placed individually in YPD plates with the aid of a micromanipulator and the
plates were incubated for three days at 25ºC. The viable spores were those that formed a
visible colony. Hybrids were confirmed either by sequencing or RFLPs.
2.4 DNA sequencing
2.4.1 DNA extraction
Yeast cells were grown in YMA medium (YM with 1.5% w/v agar) for two days at 25ºC.
About 2 g of cells were harvested and washed with sterile distilled water and placed in a
microtube with microspheres overnight at -20 ºC. The resulting pellet was resuspended in
500 µl of lysis buffer (10 mM Tris-base, 1 mM EDTA, 100 mM NaCl, 2% w/v Triton X-100 and
1% w/v SDS), 250 µL of chloroform and 250 µL of phenol on TE buffer. This solution was
vortexed for 20 min and centrifuged for 20 min at 16000 g. The aqueous portion was
transferred to a new tube, a new phenol-chloroform extraction was performed and the DNA
was precipitated with 1 mL of 100% ethanol. The solution was incubated at -20ºC for 30 min,
centrifuged for 5 min at 16000 g and the resulting pellet was resuspended in 50 µL of TE
buffer with RNAse.
2.4.2 PCR amplification and product purification
A total of six unlinked genes were amplified. Four nuclear genes: EST2 (encodes for a
reverse transcriptase subunit of the telomerase holoenzyme), MET2 (encodes for a L-
homoserine-O-acetyltransferase, catalyzes the conversion of homoserine to O-acetyl
homoserine), HIS3 (encodes for a imidazoleglycerol-phosphate dehydratase that catalyzes
the sixth step in histidine biosynthesis), FSY1 (encodes for a specific fructose symporter) and
two mitochondrial genes: SSU1 (encodes for the small subunit ribosomal of RNA) and COXII
(encodes for the cytochrome c oxidase II). A volume of 2 µl of DNA was added to 48 µl PCR
reaction mix containing 0.2 mM dNTP, 1X Taq Buffer with 2 mM MgCl2, 0.2 µM of each
primer (sequences on Table S2) and 1U of DreamTaq. Reactions were run on a Biometra
TGradient thermocycler programmed as follows: an initial denaturation step at 95ºC for 5
min, followed by 40 cycles of denaturation at 95ºC for 1 min, annealing at 49ºC (HIS3 and
EST2) or 52ºC (FSY1 and SSU1) or 53ºC (COXII) or 57ºC (MET2) for 1 min and
polymerization at 72ºC for 1 min. The polymerization was completed by an additional 7 min
of incubation at 72ºC. PCR products were purified using the Ilustra GFX purification kit,
following the manufacturer’s instructions.
A global phylogeographic survey of Saccharomyces uvarum
_______________________________________________________________________________ 8
2.5 DNA sequence analyses
2.5.1 Phylognetic trees
The six genes (COXII, EST2, HIS3, FSY1, MET2 and SSU1) were sequenced by
STABVIDA (http://www.stabvida.com/frontpage/eng/index.php).
Sequence comparisons and alignments were obtained using BioEdit v. 7.053
(http://www.mbio.ncsu.edu/bioedit/bioedit.html). When necessary, manual corrections were
made. Phylogenetic trees were obtained using MEGA 5 (http://www.megasoftware.net/).
2.5.2 Phylogenetic networks
Split Networks were constructed using the algorithm Neighbour-Net available on
SplitsTree v4 (Huson and Bryant, 2006).
2.5.3 Molecular diversity and DNA divergence between populations
Molecular diversities between strains were calculated in DnaSP v.5.10.01 (Librado and
Rozas, 2009) using the Jukes and Cantor correction (Jukes and Cantor, 1969).
DNA divergence between populations was also calculated in DnaSP v.5.10.01 and was
estimated taking into account the average number of nucleotide substitutions per site
between populations (Dxy) using Nei’s equation (Nei, 1987).
2.5.4 Population structure
Inference of population structure was made using the program Structure 2.1, assuming
the admixture model, k=6 subpopulations and correlated allele frequencies with 1000000-
iteration burn in, and 500000 iterations of sampling. Additionally, 15 interactions per run were
performed. This software can be applied to most of the commonly-used genetic markers,
including microsatellites, RFLPs and SNPs in order to investigate population structure
(Pritchard et al., 2000). A model in which there are k populations (where k may be unknown)
is assumed, each of which is characterized by a set of allele frequencies at each locus. It is
assumed that within populations, loci are at Hardy-Weinberg Equilibrium, and linkage
equilibrium and no particular mutation process is assumed. In this study, an admixture model
was assumed which means that each individual could draw some fraction of its genome from
each of the k populations, meaning that they may have mixed ancestry.
Distruct 1.1 software (Rosenberg, 2004) was used to graphically display the results
produced by the genetic clustering obtained with Structure 2.1.

A global phylogeographic survey of Saccharomyces uvarum
_______________________________________________________________________________ 9
2.6 Microsatellite analyses
2.6.1 Microsatellite amplification and typing
The six primers for amplification of the three loci containing microsatellites were
designed by Masneuf-Pomarède et al. (2005). Microsatellites are short DNA sequence
stretches in which a motif of one to six bases is tandemly repeated. These sequences can
differ in repeat number among individuals of the same species, and based in some studies
that have been carried out in humans, Drosophila (Schlotterer and Harr, 2000) and mice
(Rubinsztein et al., 1995; Makova et al., 2000) it seems that its mutation rates can range
from 10–6 to 10–2 per generation being therefore significantly higher than base substitution
rates which can range from 10-9 to 10-6 (Moryiama and Gojobori, 1992; Strachan and Read,
1999; Xue et al., 2009). Their hypervariability and ubiquitous occurrence made
microsatellites one of the most popular choices for population genetic studies (Manel et al.,
2003) since they have the potential to answer ecological and evolutionary questions (Selkoe
and Toonen, 2006).
Amplification conditions were also adapted from Masneuf-Pomarède et al. (2005). Allelic
diversity of the microsatellite loci was first observed in 3% agarose gel and molecular typing
was performed by gel analysis on Gelcompare software. In order to confirm the number of
repeats, 20% of the representatives of each group obtained were sequenced. In locus where
low definition was obtained in the agarose gel, all the samples were sequenced.
2.6.2 Statistical Analysis
2.5.2.1 F-statistics and population distinctiveness
FSTAT (v. 2.9.3.2; Goudet, 2002) was used to examine Hardy-Weinberg Equilibrium and
to calculate private alleles. The Hardy–Weinberg principle states that
both allele and genotype frequencies in a population remain constant—that is, they are in
equilibrium—from generation to generation unless specific disturbing influences are
introduced. The testing for this parameter is commonly used as a quality control filter in for
markers with experimentally determined genotypes.
2.5.2.2 Population differentiation
Exact tests for population differentiation, molecular diversities, analysis of molecular
variance (AMOVA; 10 000 permutations) and pairwise FSTs were performed using Arlequin
3.5.1.2 (Excoffier et al., 1992; Laval, 2005). AMOVA is a statistical model for studying
molecular variation within a species and for estimating population differentiation directly from
molecular data and testing hypotheses about such differentiation (Excoffier et al., 1992). A
variety of molecular data such as direct sequence data may be analyzed using this method
(Excoffier et al., 1992). The basic principle assumed is an extension of Wright’s (1951) F-

A global phylogeographic survey of Saccharomyces uvarum
_______________________________________________________________________________ 10
statistics to include multiple hierarchical levels of population structure (Weir and Cockerham,
1973) and to account for evolutionary distances (usually sequence divergence) among
alleles (Excoffier et al., 1992). This analysis is widely used for quantifying the contribution of
various levels of population structure to patterns of genetic variation. The AMOVA
implementation in Arlequin uses permutation tests to evaluate the null hypotheses of no
population structure within groups and between groups. If the genetic variance is higher
within groups than between the same groups, one can say that the groups are not isolated
from each other, being therefore a continuous identity and not two distinct populations. On
the other hand, if the variance among groups is higher than within the groups, probably these
groups are well isolated and therefore two populations can be recognized.
The exact test for population differentiation takes into account genotype or haplotype
frequencies and is based in Markov chains (10.000 steps during the burnin and 100.000
steps after the burnin). The molecular diversity indices are calculated based on number of
different alleles.
One of the most used tools to access to population differentiation is the FST (fixation
index) parameter defined by Wright 1969 (Balloux and Lugon-Moulin, 2002). This parameter
represents a measure of the diversity of randomly chosen alleles within the same sub-
population relative to that found in the entire population. It is often expressed as the
proportion of genetic diversity due to allele frequency differences among populations. This
parameter varies from 0 to 1 where 0 indicates absence of differentiation and 1 indicates
complete differentiation (Raymond and Rousset, 1995).

A global phylogeographic survey of Saccharomyces uvarum
_______________________________________________________________________________ 11
3 Results and Discussion
3.1 Phylogenetic analyses
The phylogenetic analysis (Fig. 3) of the partial sequences of three nuclear genes
(FSY1, HIS3 and MET2) provided information about strain relationship within S. uvarum.
Three clades were formed, two of them corresponding to two specific geographic locations:
Patagonia (clade B) and Australasia (Tasmania and New Zealand, clade C). The remaining
strains grouped in a clade that included all the strains from the Northern Hemisphere and
also some strains isolated in Patagonia (clade A). It is important to note the lower divergence
between clade B (Patagonian group) and clade A (supported by a lower bootstrap value:
57%) when compared with the divergence found between clade A and clade C (Australasian
group), which was supported by a high bootstrap value (99%). Still regarding the
Australasian strains, it is possible to observe some genetic diversity between them (eight
variable sites, four of which are parsimony informative). Although this diversity is much lower
than the diversity found in the remaining populations (see Table 1) it is possible to
differentiate the strains from Tasmania that group together in a separate branch (dark blue
dots on phylogenetic tree in Fig. 3) from the strains collected in New Zealand (light blue
dots). The Patagonian population presents the highest level of diversity (32 variable sites, 23
of which are parsimony informative) being found both on clade A and B presenting almost
two times more nucleotide diversity (0.0041) than all the Northern Hemisphere strains (21
variable sites, 10 of which are parsimony informative) which present a nucleotide diversity of
0.0023 (Table 1). Therefore, two types of genotypic background were identified in Patagonia:
one is unique to this region (clade B) and the other which is also found in the Northern
Hemisphere (clade A).

A global phylogeographic survey of Saccharomyces uvarum
_______________________________________________________________________________ 12
A
B
A global phylogeographic survey of Saccharomyces uvarum
_______________________________________________________________________________ 13
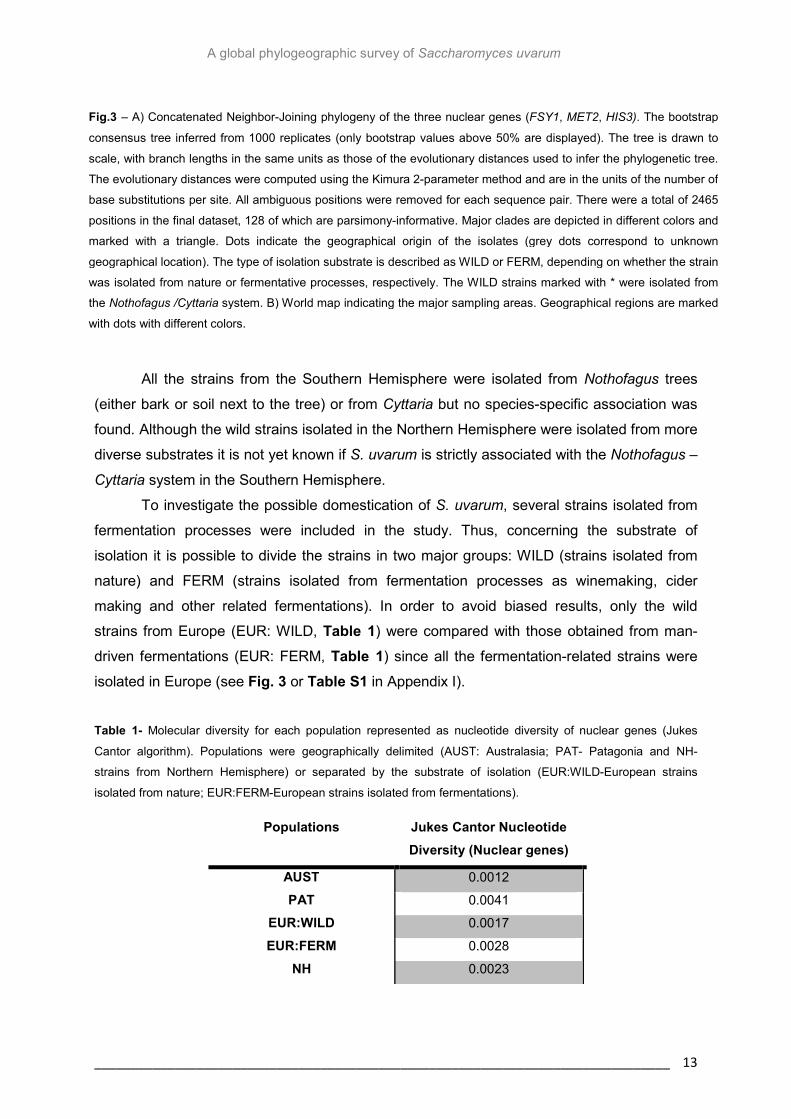
All the strains from the Southern Hemisphere were isolated from Nothofagus trees
(either bark or soil next to the tree) or from Cyttaria but no species-specific association was
found. Although the wild strains isolated in the Northern Hemisphere were isolated from more
diverse substrates it is not yet known if S. uvarum is strictly associated with the Nothofagus –
Cyttaria system in the Southern Hemisphere.
To investigate the possible domestication of S. uvarum, several strains isolated from
fermentation processes were included in the study. Thus, concerning the substrate of
isolation it is possible to divide the strains in two major groups: WILD (strains isolated from
nature) and FERM (strains isolated from fermentation processes as winemaking, cider
making and other related fermentations). In order to avoid biased results, only the wild
strains from Europe (EUR: WILD, Table 1) were compared with those obtained from man-
driven fermentations (EUR: FERM, Table 1) since all the fermentation-related strains were
isolated in Europe (see Fig. 3 or Table S1 in Appendix I).
Table 1- Molecular diversity for each population represented as nucleotide diversity of nuclear genes (Jukes
Cantor algorithm). Populations were geographically delimited (AUST: Australasia; PAT- Patagonia and NH-
strains from Northern Hemisphere) or separated by the substrate of isolation (EUR:WILD-European strains
isolated from nature; EUR:FERM-European strains isolated from fermentations).
Populations Jukes Cantor Nucleotide
Diversity (Nuclear genes)
AUST 0.0012
PAT 0.0041
EUR:WILD 0.0017
EUR:FERM 0.0028
NH 0.0023
Fig.3 – A) Concatenated Neighbor-Joining phylogeny of the three nuclear genes (FSY1, MET2, HIS3). The bootstrap
consensus tree inferred from 1000 replicates (only bootstrap values above 50% are displayed). The tree is drawn to
scale, with branch lengths in the same units as those of the evolutionary distances used to infer the phylogenetic tree.
The evolutionary distances were computed using the Kimura 2-parameter method and are in the units of the number of
base substitutions per site. All ambiguous positions were removed for each sequence pair. There were a total of 2465
positions in the final dataset, 128 of which are parsimony-informative. Major clades are depicted in different colors and
marked with a triangle. Dots indicate the geographical origin of the isolates (grey dots correspond to unknown
geographical location). The type of isolation substrate is described as WILD or FERM, depending on whether the strain
was isolated from nature or fermentative processes, respectively. The WILD strains marked with * were isolated from
the Nothofagus /Cyttaria system. B) World map indicating the major sampling areas. Geographical regions are marked
with dots with different colors.
A global phylogeographic survey of Saccharomyces uvarum
_______________________________________________________________________________ 14
Taking previous studies into consideration, domesticated strains are expected to have
low genetic diversity and to phylogenetically derive from “wild” stocks (Fay and Benavides,
2005). In the phylogenetic tree of Fig. 3 there is no clear relationship between the strains
isolated from fermentations (FERM) as they are distributed along clade A. Furthermore, it is
not possible to infer any ancestry of the European WILD group relatively to the FERM group.
Moreover, the genetic diversity of FERM strains is higher than that of WILD strains (Table 1),
which suggests that domesticated strains are absent in S. uvarum. It is important to note that
information has to be accurate in order that the results of such a study are meaningful. For
example, wild strains isolated from fermentations as contaminants will falsify the results.
Although these preliminary results require confirmation, they suggest some similarities with
what is known for S. paradoxus where geography, instead of ecology, plays the main role in
driving genetic diversity.
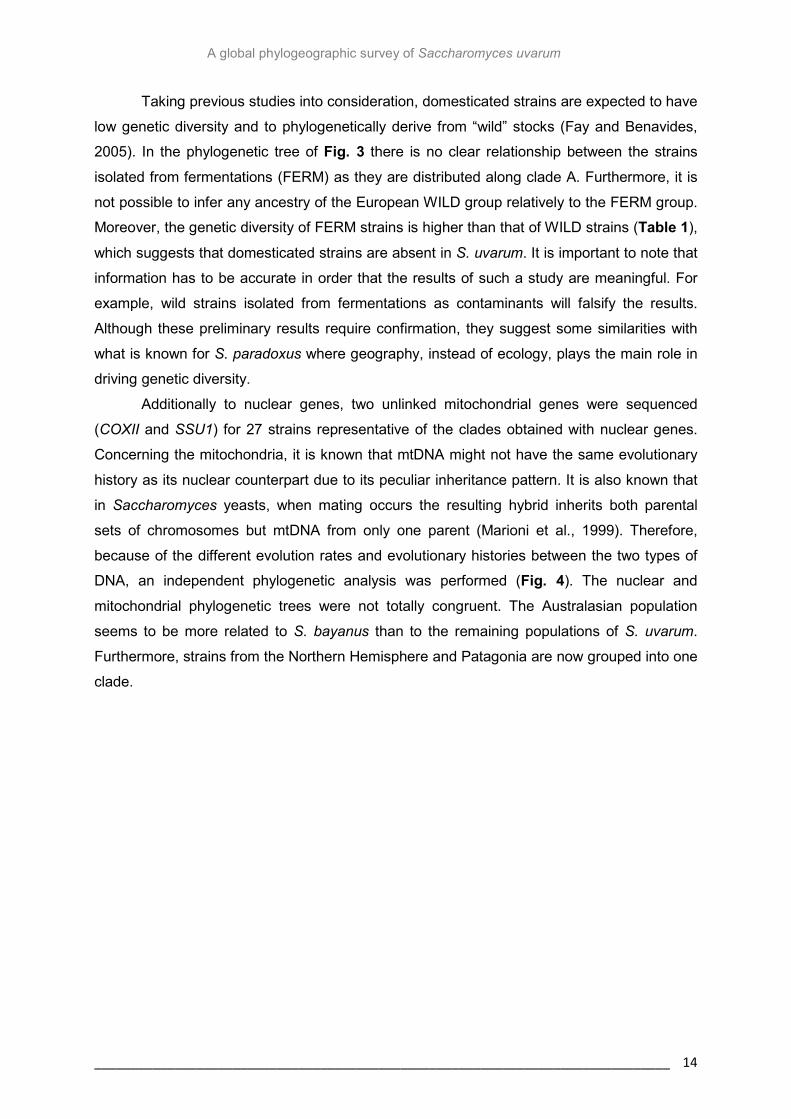
Additionally to nuclear genes, two unlinked mitochondrial genes were sequenced
(COXII and SSU1) for 27 strains representative of the clades obtained with nuclear genes.
Concerning the mitochondria, it is known that mtDNA might not have the same evolutionary
history as its nuclear counterpart due to its peculiar inheritance pattern. It is also known that
in Saccharomyces yeasts, when mating occurs the resulting hybrid inherits both parental
sets of chromosomes but mtDNA from only one parent (Marioni et al., 1999). Therefore,
because of the different evolution rates and evolutionary histories between the two types of
DNA, an independent phylogenetic analysis was performed (Fig. 4). The nuclear and
mitochondrial phylogenetic trees were not totally congruent. The Australasian population
seems to be more related to S. bayanus than to the remaining populations of S. uvarum.
Furthermore, strains from the Northern Hemisphere and Patagonia are now grouped into one
clade.
A global phylogeographic survey of Saccharomyces uvarum
_______________________________________________________________________________ 15
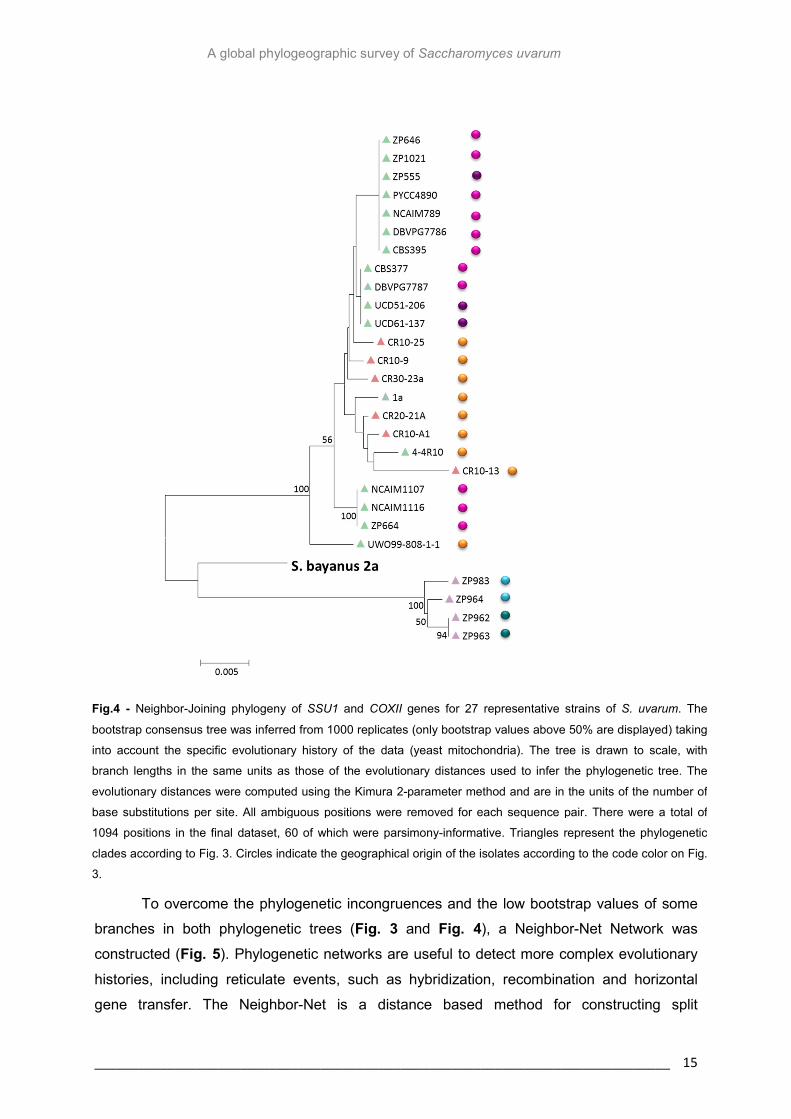
To overcome the phylogenetic incongruences and the low bootstrap values of some
branches in both phylogenetic trees (Fig. 3 and Fig. 4), a Neighbor-Net Network was
constructed (Fig. 5). Phylogenetic networks are useful to detect more complex evolutionary
histories, including reticulate events, such as hybridization, recombination and horizontal
gene transfer. The Neighbor-Net is a distance based method for constructing split
Fig.4 - Neighbor-Joining phylogeny of SSU1 and COXII genes for 27 representative strains of S. uvarum. The
bootstrap consensus tree was inferred from 1000 replicates (only bootstrap values above 50% are displayed) taking
into account the specific evolutionary history of the data (yeast mitochondria). The tree is drawn to scale, with
branch lengths in the same units as those of the evolutionary distances used to infer the phylogenetic tree. The
evolutionary distances were computed using the Kimura 2-parameter method and are in the units of the number of
base substitutions per site. All ambiguous positions were removed for each sequence pair. There were a total of
1094 positions in the final dataset, 60 of which were parsimony-informative. Triangles represent the phylogenetic
clades according to Fig. 3. Circles indicate the geographical origin of the isolates according to the code color on Fig.
3.

A global phylogeographic survey of Saccharomyces uvarum
_______________________________________________________________________________ 16
phylogenetic networks that is based on the Neighbor-Joining algorithm (Bryant and Moulton,
2003). The resulting networks of both mtDNA and nuDNA are displayed on Fig. 5, where
clearer phylogenetic relationships are shown. The interpretation of these results requires a
clarification of the assumptions behind the design of a split network. The parallel edges are
used to represent the splits computed from the data and each split is a divider of the taxa into
two subsets, being therefore a bipartition of the taxon set (which could be compared with the
partition obtained when a branch is removed from a phylogenetic tree). Its length is
proportional to the weight of the associated split, being analogous to the length of a branch in
a phylogenetic tree. It is often necessary that these networks contain nodes (that not always
represents ancestral individuals) so that the incompatible splits may be accommodated.
Therefore it is possible to find a number of parallel edges associated with each split (Huson
and Bryant, 2006). Split networks make an explicit representation of evolutionary history, as
the internal ‘‘nodes’’ represent ancestral species (but not all the nodes), nodes with a single
parent correspond to absence of reticulated events (represented by parallel lines in the
network) and nodes with more than two parents (represented by perpendicular lines in the
network) correspond to reticulate events such as recombination, hybridization or lateral gene
transfer (Huson and Bryant, 2006). Taking this into account, in the expanded images of Fig.
5 multiple reticulate events involving strains from Patagonia and Northern Hemisphere can
be observed. Furthermore, reticulate events between clade C (Australasian strains) and the
remaining strains were few which reinforces the evidence for strong isolation of the
Australasian population.
A global phylogeographic survey of Saccharomyces uvarum
_______________________________________________________________________________ 17
The divergence of the Australasian population is in agreement with the results of the
phenotypic tests (Table S4 and S5 in Appendix I). Specifically, there are no differences in
carbon source assimilation and growth temperatures between Patagonian and Northern
Hemisphere strains but the isolates from Australasia showed a lower maximum growth
temperature and a general inefficiency of growth in the majority of the carbon sources (Table
S4). Furthermore, the Australasian isolates displayed an expanded period of latency when
grown in melibiose or did not grow at all. As the fermentation of melibiose is one of the
distinctive features of S. uvarum (Naumov, 2000a), these results raised some doubts about
the identity of this population. To address this topic, mating tests involving Australasian
strains and strains from other geographical locations were performed in order to determine
the existence of post-zygotic isolation.
3.2 Reproductive isolation
The process of speciation occurs by two general mechanisms and it is central to
biological sciences in general and evolutionary studies, in particular. The first mechanism is
ecological speciation and it is defined as the evolution of reproductive isolation between
populations, or subdivisions of a single population, as a result of ecologically-based divergent
natural selection. Under this process, natural selection acts differently between
environments, driving the fixation of different alleles; each one advantageous in its own
environment (Schluter and Conte, 2009). The other mechanism is called mutation-order
speciation, where the populations diverge as they accumulate different sets of mutations
under similar selective pressures. Natural selection drives alleles to fixation in both
speciation mechanisms, but selection favors divergence only under ecological speciation
(Schluter and Conte, 2009).
Fig.5 – Neighbor-Net networks of nuDNA and mtDNA. a) nuclear DNA network constructed with FSY1, HIS3 and
MET2 sequences data; b) mtDNA network constructed with SSU and COXII sequence data. The circles in the map
represent the major clades according to Fig 3. Network details are shown in lined rectangles (expanded images).
The color codes for strain names on the expanded images refer to the geographical origin according to Fig. 3.

A global phylogeographic survey of Saccharomyces uvarum
_______________________________________________________________________________ 18
Therefore, the level of reproductive isolation can be used as a measure of biological
distance between populations and in the case of Saccharomyces yeasts it can even be
represented as a percentage of viable F1 hybrid spores, since there is no premating
reproductive isolation. What compromises the success of hybridization is the postmating
reproductive isolation which can cause hybrid sterility, causing a certain quantity of the
gametes produced by F1 progeny to be unviable (Greig, 2009). There were two major
questions that were addressed through this analysis. First, the degree of reproductive
isolation of the Australasian population was investigated and secondly reproductive isolation
between the Patagonian and the Northern Hemisphere populations was analyzed.
Table 2- Crosses and percentage of spore viability of F1 hybrids. Colored cells represent the phylogenetic group
to which each strain of S. uvarum belongs according to Fig. 3. Specific geographical location is displayed on the
cells (A- Australasia, P-Patagonia, E-Europe; F- Far East; N- North America). Sequence divergence of EST2
gene between the individuals was also calculated. The black cells represent the outgroup species (S. bayanus
2a). In order to make a comparison, results from previous works were also included (Sp- S. paradoxus; Sc- S.
cerevisiae).
Crosses Viable Spores (%)
No. of spores analyzed
Polymorphic Sites
Sequence divergencea
Su ZP964 x Su 4-4R10 A P 35.8 400 70 0.06926 Su ZP1021 x Su 4-4R10 E P 96.8 218 0 0.00000 Su ZP1021 x Su CR10-15 E P 96.7 212 15 0.01431 Su CR10-15 x Su 4-4R10 P P 97.2 204 15 0.01431 Su 4-4R10 x Sb 2a P B 7.3b 362b 99 0.09995 Su CR10-15 x Sb 2a P B 10.3 212 100 0.10103 Su ZP964 x Sb 2a A B 18.8 204 80 0.07970 Su ZP1021 x Sb 2a E B 15.6 218 99 0.09995 Sp N44 x Sp YPS125 F N 36.3c 424c 36 0.03503 Sp NBRC1804 X Sp YPS125 F N 32.1c 352c * * Sp N44 X Sp NBRC 1804 F F 86.8c 280c * * Sp CBS432 X Sp YPS125 E N 40.4c 416c * * Sc S288c X Sp CBS432 N E 0.67c 892c * *
a Nucleotide diversity of EST2 gene using the Jukes and Cantor correction. b Values taken from Libkind et al., 2011. c Values taken from Liti et al., 2006. *assay not performed in this study
Concerning the cross between strains from New Zealand (ZP 964, clade C) and
Patagonia (4-4R10, clade A), a total of two F1 hybrids were obtained and analyzed in terms
of spore viability. It was found that only 36% (Table 2) of the spores were viable, which
means that there is, indeed, partial reproductive isolation between strains from clade C
(Australasia) and strains from clade A. Liti et al. (2006) searched for a correlation between
reproductive isolation and sequence divergence in some Saccharomyces species, including
S. paradoxus and S. cerevisiae. In that study, inter and intra-species crosses were
performed and some correlation between reproductive isolation and sequences divergence

A global phylogeographic survey of Saccharomyces uvarum
_______________________________________________________________________________ 19
was found, as the highest spore viabilities were found when strains with less genetic
divergence were crossed (Table 2). In the case of S. paradoxus this is directly correlated
with geographical distance, therefore strains that from geographically closer populations
originate F1 hybrids with higher spore viabilities. For instance, values of 32.1-36.3 % of spore
viability of F1 hybrids were found for S. paradoxus populations from different continents.
Furthermore, concerning for inter-species crosses much lower values (7% S. uvarum x S.
bayanus and 0.67% S. cerevisiae x S. paradoxus) are typically obtained. Therefore, this type
of reproductive isolation found for the Australasian strain is not enough to consider this group
as a different species.
Additionally, phylogenetic distinct Patagonian strains were also crossed (Table 2),
giving rise to a highly viable progeny (97.2% of viable spores). Taking these results into
consideration, although the phylogenic analyses (Fig. 3) showed some differentiation of the
Patagonian group (clade B) and some sequence divergence was also found (Table 2), this
differentiation does not correlate to reproductive isolation. These results are consistent with
those obtained previously with the network analysis (Fig. 5) where evidence for genetic
contact between these two clades was found.
Another interesting observation is that there are different degrees of reproductive
isolation between S. uvarum and S. bayanus. When Patagonian strains of S. uvarum were
crossed with Patagonian strains of S. bayanus the percentage of spore viability of F1 hybrids
was lower (7% and 10%, Table 2) than that of crosses involving strains of S. uvarum from
other regions (19% for the Australasian strain and 16% for the cross involving European
strain). This might be related with reinforcement, a process by which natural selection
increases reproductive isolation between sympatric populations (Nosil et al., 2002; Servedio
and Noor, 2003).
3.3 Population Differentiation
A population can be considered as a group of individuals that is well separated from
other groups of individuals of the same species. Separation between populations may be
geographical or genetic (Xu, 2006). Through phylogenetic analyses it was found that the
Patagonian strains have two types of genotypic background and were grouped in A and B
clades (Fig. 3). However, network analysis did not support this separation and a connection
between clade A and clade B was suggested. Moreover, mating tests revealed no
reproductive isolation between strains from these two groups.
To investigate in more detail the relationship between the South American strains and
those from the Northern Hemisphere, sequence data from the three nuclear genes was
analyzed in Structure, a software that allows the inference of distinct populations and assign

A global phylogeographic survey of Saccharomyces uvarum
_______________________________________________________________________________ 20
each individual to the populations that were formed (Pritchard et al., 2000). Therefore, this
analysis could be useful to understand the structure of the populations of S. uvarum as well
as to identify migrant or admixed individuals. The most probable number of populations (k) is
determined based in Ln (k) variation where the k that presents the higher value of ∆k is the
one that most likely represents the number of existing populations (Fig. 6a). The Structure
analysis found evidence for two genetic clusters, one corresponding to the Eurasian, North
American and Patagonian isolates and the other corresponding to the Australasian isolates
(Fig. 6b). Therefore, this analysis rejected the hypothesis of a genetic separation between
Patagonia and the Northern Hemisphere. Since the identification of migrants or mosaic
individuals could be useful, a higher number of genetic clusters was subsequently explored.
When the program was forced to consider a higher number of clusters (3� � � 6), only three
clusters were identified (Fig. 6c).
Fig. 6- Inference of population structure of S. uvarum using DNA sequences of the three nuclear genes
(FSY1, HIS3 and MET2). a) Structure software ∆K plot representing the variation of Ln (k) in each k
test. The higher ∆K value corresponds to the most probable number of populations (k); b) Plot
displaying the two populations found by Structure software. Each color in the plots is associated with
the different clusters formed; c) Resulting plot for k� 3. Each color in the plots is associated with the
different clusters formed. Names of the strains and their geographical origin (color-coded according to
the map on Fig.3) are displayed.
0
2000
4000
6000
0 2 4 6k
∆K a
Geographical origin
100%
0%
50%
CR
10
-15
CR
10
-A1
CR
10
-E1
CR
10
-23
a
CR
10
-13
NC
AIM
11
16
RP
1-2
1
UW
O 8
08
-1-1
CR
10
-25
CR
10
-H1
CR
10
-21
a
3a
SR
10
-M3
4-4
R1
0
2-1
1a
ZP
85
3
ZP
85
3
ZP
10
21
RC
4-1
5
PJS
9
PJS
2 9
5
GM
14
M4
88
14
8.0
1
CB
S 7
00
1
NC
AIM
78
9
NC
AIM
86
8
NC
AIM
11
07
ZP
64
6
ZP
66
4
PY
CC
48
90
DB
VP
G 7
78
6
DB
VP
G 7
78
7
CB
S 4
26
CB
S 4
31
CB
S 3
95
CB
S 3
77
ZP
83
0
ZP
55
5
UC
D 5
1-2
06
UC
D 6
1-1
37
ZP
96
3
ZP
96
2
ZP
99
4
ZP
98
3
ZP
96
6
ZP
96
5
ZP
96
4
ZP
95
9
c
b

A global phylogeographic survey of Saccharomyces uvarum
_______________________________________________________________________________ 21
In this case, the Patagonian population was found to contain two clusters (represented by
green and yellow colors in Fig. 6c), with some strains having admixture genotypes. This
pattern naturally contributed to the high diversity of Patagonian strains. Strain CR10-H1
presents an apparent equal mixture of the two clusters. Two more Patagonian strains
present complex genotypes with different degrees of admixture (CR10-25 and UWO-808-1-
1). In the Northern Hemisphere, the yellow genotype is dominant. However two European
strains (NCAIM 1116 and RP1-21) present a minor contribution of the green cluster. This
indicates that these individuals might have a mixed ancestry, having inherited fractions of
their genome from Patagonian migrants.
The next step of the study involved microsatellite genotyping. Three microsatellite loci
were amplified, typed and sequenced (for approximately 70% of the strains). These
sequences can differ in repeat number among individuals of the same species and it seems
that mutation rates of microsatellites are significantly higher than substitution rates of coding
sequences (Masneuf-Pomarède et al., 2007). Therefore, their hypervariability and ubiquitous
occurrence made microsatellites one of the most popular choices for population genetic
studies (Manel et al., 2003). Several tests were performed taking into account the groups
previously defined (see Table 1). First, an AMOVA (Analysis of MOlecular VAriance) was
performed for each pair of groups using the software Arlequin. In Table 3 can be observed
that when Northern Hemisphere and Patagonian populations are considered, the variance is
higher within groups (68.87%) than among groups (31.13%) which points to an absence of
population structure between Patagonian (PAT) and Northern Hemisphere (NH) strains, as
already suggested. On the other hand, it can be seen that the Australasian (AUST)
population is isolated from the Northern Hemisphere (NH) group as 65% of the molecular
variance is explained by differences between groups and only 35% is explained by
differences within groups. Interestingly, the variance within the Australasian and Patagonian
populations was similar to the variance among these populations, which suggests that
genetic divergence was lower than that found between Australasian population and the
population of the Northern Hemisphere.
Table 3- Analysis of molecular variance for pairs of populations. Percentage of molecular variance explained by
differences among and within populations.
Pairs of Populations Variance Among Populations
Variance Within Populations
NH-PAT 31.13 % 68.87 % NH-AUST 64.80 % 35.20 % AUST-PAT 46.85 % 53.15 %

A global phylogeographic survey of Saccharomyces uvarum
_______________________________________________________________________________ 22
To consolidate population differentiation analysis, exact tests for population
differentiation were performed (Table 4). This analysis suggested that the Patagonian,
Australasian and Northern Hemisphere populations are differentiated.
Table 4 - P-values for population differentiation. Evidences for differentiation were found when p<0.005. Values
in bold are those that are more relevant for the study.
AUST PAT WILD FERM NH
AUST Differentiation Differentiation Differentiation Differentiation
PAT 0.0002±0.0001 Differentiation Differentiation Differentiation
WILD 0.0008±0.0003 0.0004±0.0001 No differentiation No differentiation
FERM 0.0028±0.0009 0.0030±0.0007 0.1482±0.0057 No differentiation
NH 0.0001±0.0001 0.0002±0.0001 0.9919±0.0012 0.9972±0.0002
Since differentiation between the Northern Hemisphere and Patagonian populations
had not been detected before, this particular aspect was analyzed with more detail.
Therefore, pairwise FSTs were calculated (Table 5). This analysis compares the diversity of
alleles in the subpopulation relatively to the entire population. The value of 0.495 obtained for
the comparison of Australasian and Patagonian populations suggests little differentiation
since a value of 0 means no differentiation and 1 means total differentiation. It can, therefore
be anticipated that these two groups are not well separated from each other. In addition, the
lack of differentiation between Patagonia and the Northern Hemisphere was confirmed
(FST=0.3301). Furthermore, a value of ~0.6 was obtained between NH and AUST, indicating
some population differentiation, which is congruent with all the previous results. Concerning
the comparison between wild strains (WILD) and fermentation-related strains (FERM), a
value of 0.1025 was obtained, confirming the lack of differentiation between the two groups.
Table 5 - Population pairwise FSTs. The (+) or (-) signals indicates whether the FST values are statistically
significant or not. Bolded values are those that are more relevant for the study.
AUST PAT WILD FERM NH
AUST 0.4949 0.6748 0.6223 0.5950
PAT + 0.3837 0.3153 0.3301
WILD + + 0.1025 0.0178
FERM + + - -0.0004
NH + + - -
A global phylogeographic survey of Saccharomyces uvarum
_______________________________________________________________________________ 23
It was not possible to infer population structure with microsatellite information in
Structure software since the data could not be stabilized due probably to the insufficient
number of loci studied.
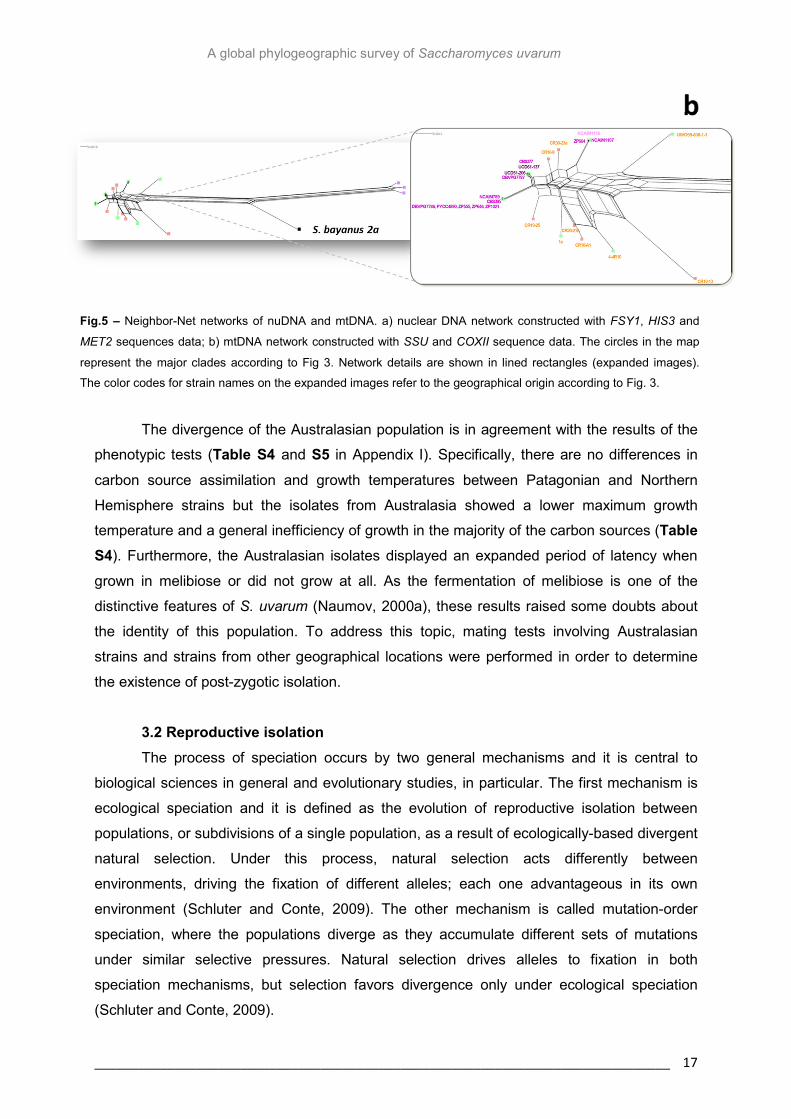
3.4 Inference of ancestry
In preliminary analyses it was found that the Australasian strains presented base
substitutions in microsatellite sequences that seemed to be fixed in the population (Fig. S1).
On the other hand, base substitutions were also identified in some strains from Patagonia,
although they were not found to be fixed in the population. These events were found much
less frequently in the Northern Hemisphere strains. The apparent fixation of these
substitutions raised the hypothesis of the ancestry of the Australasian population. And
therefore, additional analyses were carried out in order to explore this possibility. The
number of unique alleles in a population can be used as a measure of genetic distinctiveness
(Castric and Bernatchez, 2003) and can help to infer ancestry since ancestor genotypes tend
to have a higher number of private alleles with high frequency in the population, while low
frequencies could be indicative of incipient differentiation. It was found that (TA)5 was
completely fixed in the Australasian population suggesting that this population may be
ancestral and isolated. It was also found that the Patagonian population presented the
highest number of private alleles with high frequencies (>30%) (Table 6). Most of the private
alleles found in the Northern Hemisphere had low frequencies in the population (<30%)
which suggests a relatively recent origin. Moreover, when the Northern Hemisphere is
divided in four subpopulations (North America, Central Europe, Eastern Europe and Asia), no
private alleles are found in any of these populations (data not shown).
Table 6- Private alleles found in each population. Number (NA); probability of finding (p(NA)) ; and frequency in the
population (%) of private alleles.
Populations Locus NA p(NA) %
AUST (TA)5 1 0.20 100.0% (ATT)7 ; (ATT)8 2 0.33(3) 12.5% ; 12.5%
PAT (CTG)11 1 0.16(6) 30.8% (TA)6 1 0.20 69.2%
NH (TA)11 (CTG)7 ; (CTG)8
(TA)13
2 2 1
0.33(3)) 0.33(3) 0.16(6)
14.3% 4.8% ; 4.8%
33.3%
NH + PAT (CTG)9
(TA)11
(ATT)10 ; (ATT)10
1 1 2
0.16(6) 0.20
0.33(3)
35.1 % 22.6%
19.6% ; 50.2%
AUST + PAT (CTG)12 (ATT)9
1 1
0.16(6) 0.16(6)
61.9% 57.1%
A global phylogeographic survey of Saccharomyces uvarum
_______________________________________________________________________________ 24
It is important to notice that two alleles were found to be shared by the Patagonian
and Australasian populations and both are present in the majority of strains of each
population. This result, combined with the molecular variance analysis (Table 3) and the
results for population differentiation (Table 5), suggests that Patagonia and Australasia have
some genetic relatedness. Furthermore, several private alleles were found to be shared
between the Patagonian and Northern Hemisphere populations suggesting a genetic
relatedness that was already discussed.
3.5 An evolutionary hypothesis
Drawing evolutionary histories for microorganisms is complicated as inferences from
the past are limited to the study of existing genomes and phenomes. In this work several
approaches were used, ranging phylogeographic analyses to phenotypic characterizations
and population genetic analyses. The results obtained suggest that the highest molecular
diversity of S. uvarum is found in Patagonia. The Patagonian population seems to be related
to the population of the Northern Hemisphere due to the lack of population structure between
these two broad geographical locations, low level of molecular divergence, absence of
reproductive isolation and because genotypes found in Patagonia are also found in North
America and Eurasia. Additionally, evidence of ancestry was found in Patagonia due to the
existence of two private alleles with high frequencies (Table 6). This allows to put forward the
hypothesis of the migration from Patagonia to the Northern Hemisphere, and a bottleneck
effect associated with a loss of diversity during this migration.
It was also found that the Australasian population was homogenous but divergent
(Table 1) from to the remaining groups. Signs of ancestry were also found for this population
due to the existence of a unique and fixed allele. Additionally, evidence of contact with the
Patagonian population was found due to the presence of unique alleles common to this two
groups (Table 6), and due to the weak evidence for population structure in AMOVA and FST
analysis (Table 3 and Table 5). Therefore it seems possible that there was ancient contact
between the two populations, but that their subsequent isolation led to partial reproductive
isolation. Another aspect that links these two populations is the association with the
Nothofagus–Cyttaria system. These two genera are found solely in the Southern Hemisphere
and their present distribution is associated with the Gondwana break up (Li and Zhou, 2007;
Peterson et al., 2010). Although there is no evidence that S. uvarum is strictly associated
with Nothofagus in the Southern Hemisphere, this association found for the South American
and Australasian S. uvarum populations is noteworthy.

A global phylogeographic survey of Saccharomyces uvarum
_______________________________________________________________________________ 25
4 Concluding Remarks and Future Perspectives
The apparent habitat and substrate preference similarities between S. uvarum, S.
cerevisiae and S. paradoxus, and the lack of phylogenetic and population genetic information
for S. uvarum at a global scale, led us to set out an exploratory study in order to clarify the
natural history of this yeast. Unlike what was found for S. cerevisiae (Fay and Benavides,
2005; Legras et al., 2007), no ecological specialization was found in S. uvarum and no
evidence of domestication events could be obtained. Instead, it was found that genetic
divergence is more associated with the geography, similarly to what was found for S.
paradoxus. However, in the case of S. paradoxus the geographical specialization operates at
a continental scale (Liti et al., 2009) and partial reproductive isolation was found between
strains from North America and Europe (Liti et al., 2006). In the case of S. uvarum, the
geographical influence is solely found for the Australasian strains. Moreover, the
reproductive isolation found for the Australasian strain was comparable to that found for S.
paradoxus strains from different continents (Table 2).
It is important to note that the results presented here have to be viewed as
preliminary and exploratory because a deeper sampling is needed to cover adequately the
various regions that were considered. This would allow a more robust study of the
populations and gene flow between them, which is important for the understanding of the
possible migrations in S. uvarum. Concerning the results obtained with microsatellite data it
is important to refer that these analyses are highly influenced by sample size and number of
alleles studied. In fact, larger populations can present higher number of alleles and higher
molecular diversity (allelic richness). In the present study only three loci were analyzed,
therefore it would be recommendable to increase the number of microsatellite loci. Ideally,
complete genome data would of interest to conclusively overcome most of the uncertainties
of the work presented here. Nevertheless, this work represents the first attempt to study S.
uvarum at the population level at a continental scale, representing the initial step to clarify, at
a global scale, the natural history of this yeast.

A global phylogeographic survey of Saccharomyces uvarum
_______________________________________________________________________________ 26
5 References
Antunovics, Z., L. Irinyi, and M. Sipiczki. 2005. Combined application of methods to taxonomic identification of Saccharomyces strains in fermenting botrytized grape must. Journal of Applied Microbiology 98:971–979 Broquet, T., S. Angelone, J. Jaquiery, P. Joly, J.-P. Lena, T. Lengagne, S. Plenet, E. Luquet, and N. Perrin. 2010. Genetic Bottlenecks Driven by Population Disconnection. Conservation Biology 24(6): 1596-1605
Castric, V., and L. Bernatchez. 2003. The rise and fall of isolation by distance in the anadromous brook charr (Salvelinus fontinalis Mitchill). Genetics 163(3): 983-96. Charmet, G. 2011. Wheat domestication: Lessons for the future. Comptes Rendus Biologies. 334:212-220. Cliften, P. F., R. S. Fulton, R. K. Wilson, M. Johnston. 2006. After the duplication: gene loss and adaptation in Saccharomyces genomes. Genetics 172:863-872 Duenas M.,A. Irastorza, K. Fernandez, A. Bilbao, A. Huerta.1994. Microbial populations and malolactic fermentation of apple cider using traditional and modified methods. Journal of Food Science 59(5):1060-1064
Demuyter, C., M. Lollier, J. L. Legras, and C. Le Jeune. 2004. Predominance of Saccharomyces uvarum during spontaneous alcoholic fermentation, for three consecutive years, in an Alsatian winery. Journal of Applied Microbiology 97(6): 1140–1148
Excoffier, L., P. E. Smouse, J.M. Quattro. 1992. Analysis of molecular variance inferred from metric distances among DNA haplotypes: application to human mitochondrial DNA restriction data. Genetics 131: 479-491
Fay, J. C. and J. A Benavides. 2005. Evidence for domesticated and wild populations of Saccharomyces cerevisiae. PLOS Genetics 1: 66-71. Finlay, B. J. 2002. Global dispersal of free-living microbial eukaryote species. Science 296 (5570): 1061-1063 Jukes, T. H. and C. R. Cantor. 1969. Evolution of protein molecules. In Munro,H.N. (ed), Mammalian Protein Metabolism. Academic Press, New York, NY, pp. 21-132. Goudet, J.. 2002 Fstat 2.9.3.2. URL: http://www2.unil.ch/popgen/softwares/fstat.htm. Gregory, L. C., J. G. Meert, B. Bingen, M. K. Pandik, and T. H. Torsvik. 2009. Paleomagnetism and geochronology of the Malani Igneous Suite, Northwest India: Implications for the configuration of Rodinia and the assembly of Gondwana. Precambrian Research 170: 13-26 Greig, D. 2009. Reproductive isolation in Saccharomyces. Heredity 102: 39-44 Hennequin, C., A. Thierry, G. F. Richard, G. Lecointre, H. V. Nguyen, C. Gaillardin, and B. Dujon. 2001. Microsatellite typing as a new tool for identification of Saccharomyces cerevisiae strains. Journal of Clinical Microbiology 39: 551-559. Hillman, G., R. Hedges, A. Moore, S. Colledge, P. Pettitt. 2001. New evidence of Lateglacial cereal cultivation at Abu Hureyra on the Euphrates. Holocene 11 (4): 383–393.
Huson, D. H., and D. Bryant. 2006. Application of Phylogenetic Networks in Evolutionary Studies. Molecular Biology and Evolution, 23(2):254-267, 2006. Johnson L. J., V. Koufopanou, R. Goddard, R. Hetherington, M. Schäfer, and A. Burt. 2004. Population genetics of the wild yeast Saccharomyces paradoxus. Genetics 166: 43-52
A global phylogeographic survey of Saccharomyces uvarum
_______________________________________________________________________________ 27
Kuehne, H. A., H. A. Murphy, C. A. Francis, and P.D Sniegowski. 2007. Allopatric divergence, secondary contact, and genetic isolation in wild yeast populations. Current biology 17: 407-411. Kimberly, A., K. A. Selkoe and R. J. Toonen. 2006. Microsatellites for ecologists: a practical guide to using and evaluating microsatellite markers. Ecology Letters 9: 615–629 Knowles, L. L. 2009. Statistical Phylogeography. Annu. Rev. Ecol. Evol. Syst. 40: 593-612
Kurtzman, C. P., and C. J. Robnett. 2003. Phylogenetic relationships among yeasts of the “Saccharomyces complex” determined from multigene sequence analyses. FEMS Yeast Res. 3:417–432. Legras, J., D. Merdinoglu, J. Counuet and F. Karst. 2007. Bread, Beer and wine: Saccharomyces cerevisiae diversity reflects human history. Molecular Ecology 16: 2091-2102. Li, H.M., and Z.K. Zhou. 2007. Fossil nothofagaceous leaves from the Eocene of western Antarctica and their bearing on the origin, dispersal and systematics of Nothofagus. Science in China 50(10): 1525-1535
Libkind, D., A. Ruffini, M. van Broock, L. Alves, and J.P. Sampaio. 2007. Biogeography, host specificity and molecular phylogeny of the basidiomycetous yeast Phaffia rhodozyma and its sexual state Xanthophyllomyces dendrorhous. Appl Environm Microbiol 73:1120-1125.
Libkind D., C. T. Hittinger, E. Valério, C. Gonçalves, J. Dover, M. Johnston, P. Gonçalves, J. P. Sampaio. 2011. Microbe domestication and the identification of the wild genetic stock of lager-brewing yeast. PNAS 108(35): 14539-14544
Librado, P., and J. Rozas. 2009. DnaSP v5: A software for comprehensive analysis of DNA polymorphism data. Bioinformatics 25: 1451-1452
Liti, G., D. B. H. Barton, and E.J. Lois. 2006. Sequence diversity, reproductive isolation and species concepts in Saccharomyces. Genetics 174: 839-850 Liti, G., D. M. Carter, A. M. Moses, J. Warringer, L. Parts, S. A. James, R. P. Davey, I. N. Roberts, A. Burt, V. Koufopanou, I. J. Tsai, C. M. Bergman, D. Bensasson, M. J. T. O’Kelly, A. van Oudenaarden, D. B. H. Barton, E. Bailes, A. N. Nguyen Ba, M. Jones, M.l A. Quail, I. Goodhead, S. Sims, F. Smith, A. Blomberg, R. Durbin, and E. J. Louis. 2009. Population genomics of domestic and wild yeasts. Nature 458: 337-341 Makova, K.D., A. Nekrutenko, R. J. Baker. 2000. Evolution of microsatellite alleles in four species of mice (genus Apodemus). Journal of Molecular Evolution 51: 166–172
Manel, S., M. K. Schwartz, G. Luikart, and P. Taberlet. 2003. Landscape genetics: combining landscape ecology and population genetics. TRENDS in Ecology and Evolution 18(4): 189-197 Marioni, G., M. Manuel, R. F. Petersen, J. Hvidtfeldt, P. Sulo, and J. Piskur. 1999. Horizontal Transfer of Genetic Material among Saccharomyces Yeasts. Journal of Bacteriology 181(20): 6488-6496.
Masneuf-Pomarède, I., C. L. E. Jeune, P. Durrens P, M. Lollier, M. Aigle and D. Dubourdieu. 2007. Molecular typing of wine yeast Saccharomyces bayanus var. uvarum using microsatellite markers. Systematic and Applied Microbiology 30: 75-82. Massoutier, C., H. Alexandre, M. Feuillat, C. Charpentier. 1998. Isolation and characterization of cryotolerant Saccharomyces strains. Vitis 37: 55-59 Moriyama, E. N., and T. Gojobori. 1992. Rates of Synonymous Substitution and Base Composition of Nuclear Genes in Drosophila. Genetics 130(4): 855-864

A global phylogeographic survey of Saccharomyces uvarum
_______________________________________________________________________________ 28
Morrissey, W. F., B. Davenport, A. Querol, and A. D. W. Dobson. 2004. The role of indigenous yeasts in traditional Irish cider fermentations. Journal of Applied Microbiology 97: 647–655 Mortimer, R. K. 2000. Evolution and Variation of the Yeast (Saccharomyces) Genome. Genome Research 10: 403-409
Naumov, G. I. 1996. Genetic identification of biological species in the Saccharomyces sensu stricto complex. Journal of Industrial Microbiology & Biotechnology 17 (3-4): 295-302 Naumov, G.I. 2000a. Saccharomyces bayanus var. uvarum comb. Nov., a new variety established by genetic analysis. Microbiology 69: 338-342 Naumov, G. I., S.A. James, E. S. Naumova, E. J. Louis, and I. N. Roberts. 2000b. Three new species in the Saccharomyces sensu strict complex: Saccharomyces cariocanus, Saccharomyces kudriavzevii and Saccharomyces mikatae. International Journal of Systematic and Evolutionary Microbiology: 1931–1942. Naumov, G.I., D. O. Gazdiev, and E. S. Naumova. 2003. The Finding of the Yeast Species Saccharomyces bayanus in Far East Asia. Microbiology 72 (6): 738-743 Naumov, G. I., H. V. Nguyen, A. Michel, M. Aigle, and C. Gaillardin. 2001. Genetic identification of Saccharomyces bayanus var. uvarum, a cider fermenting yeast. International journal of food microbiology 65:163-171. Nei, M. 1987. Molecular Evolutionary Genetics. Columbia University Press, New York, NY. Nguyen, H.V., C. Gaillardin. 2005. Evolutionary relationships between the former species Saccharomyces uvarum and the hybrids S. bayanus and S. pastorianus; reinstatement of Saccharomyces uvarum (Beijerinck) as a distinct species. FEMS Yeast Research 5: 471-483
Nosil, P., B. J. Crespi, C. P. Sandoval. 2002 Reproductive isolation driven by the combined effects of ecological adaptation and reinforcement. Nature 417: 440–443 Peterson, K. R., D. H. Pfister, and A. D. Bell. 2010. Cophylogeny and biogeography of the fungal parasite Cyttaria and its host Nothofagus, southern beech. Mycologia 102(6): 1417:1425
Pritchard, J. K., M. Stephens, and P. Donelly. 2000. Inference of Population Structure Using Multilocus Genotype Data. Genetics 55: 945-959
Pulvirenti, A., H. Nguyen, C. Caggia, P. Giudici, S. Rainieri, and C. Zambonelli. 2000. Saccharomyces uvarum, a proper species within Saccharomyces sensu stricto. Microbiology Letters: 191-196 Rainieri, S., C. Zambonelli, J. E. Hallsworth, A. Pulvirenti, and P. Giudici. 1999. Saccharomyces uvarum, a distinct group within Saccharomyces sensu stricto. FEMS Microbiology Letters: 177-185. Rainieri, S., C. Zambonelli, and Y. Kaneko. 2003. Saccharomyces sensu strict: Systematics, genetic diversity and evolution. Journal of bioscience and bioengineering 96(1):1-9.
Rainieri S., Y. Kodama, Y. Nakao, A. Pulvirenti, and P. Giudici. 2008. The inheritance of mtDNA in larger brewing strains. FEMS Yeast Research 8:586-596 Raymond, M. and F. Rousset. 1995. An exact test for population differentiation. Evolution 49(6): 1280-1283 Replanski, T., V. Koufopanou, D. Greig, and G. Bell. 2008. Saccharomyces sensu stricto as a model system for evolution and ecology. Trends in Ecology and Evolution 23 (9): 494-501 Rosenberg, N. A. 2004. DISTRUCT: a program for the graphical display of population structure. Molecular Ecology Notes 4: 137 – 138

A global phylogeographic survey of Saccharomyces uvarum
_______________________________________________________________________________ 29
Rosini, G., F. Frederici, A. E. Vaughan, A. Martini .1982. Systematics of the species of the yeast genus Saccharomyces associated with fermentation industry. Appl. Microbiol. Biotechnol. 15: 188-193 Rubinsztein, D. C. , A. W., L. J., S. Goodburn, S. Jain, S. H. Li, R. L. Margolis, C. A. Ross, M. A. Fergusonsmith. 1995. Microsatellite evolution—evidence for directionality and variation in rate between species. Nature Genetics 10: 337–343
Sampaio, J. P. and P. Gonçalves. 2008. Natural populations of Saccharomyces kudriavzevii in Portugal are associated with oak bark and are sympatric with S. cerevisiae and S. paradoxus. Applied and environmental microbiology 74 (7): 2144-2152 Schlotterer, C., and B. Harr. 2000. Drosophila virilis has long and highly polymorphic microsatellites. Mol. Biol. Evol. 17: 1641–1646 Schluter, D., and G. L. Conte. 2009. Genetics and ecological speciation. PNAS 106(1): 9955–9962
Servedio, M. R., and M. A. F. Noor. 2003. The role of reinforcement in speciation: Theory and data. Annu Rev Ecol Syst 34: 339–364. Sicard, D. and J. L. Legras. 2011. Bread, beer and wine: Yeast domestication in the Saccharomyces sensu stricto complex. Comptes Rendus Biologies 334: 229-236. Sipiczki, M., P. Romano, G. Lipani, I. Miklos, and Z. Antunovics. 2001. Analysis of yeasts derived from natural fermentation in a Tokaj winery. Antonie van Leeuwenhoek 79: 97–105. Strachan T, Read AP. 1999. Instability of the human genome: mutation and DNA repair in Human Molecular Genetics 2nd edition. New York: Wiley-Liss, Chapter 9
Swaffield, C. H., J. A. Scott, and B. Jarvis. 1997. Observations on the microbial ecology of traditional alcoholic cider storage vats. Food Microbiology , 14: 353–361
Talarek, N., E. J. Louis, C. Cullin, and M. Aigle. 2004. Developing methods and strains for genetic studies in the Saccharomyces bayanus var. uvarum species. Yeast 21:1195–1203 Tosi, E., M. Azzolini, F. Guzzo, G. Zapparoli. 2009. Evidence of different fermentation behaviours of two indigenous strains of Saccharomyces cerevisiae and Saccharomyces uvarum isolated from Amarone wine. Journal of Applied Microbiology 107(1): 210–218 Vuilleumier, S., J. M. Yearsley, N. Perrin. 2008. The Fixation of Locally Beneficial Alleles in a Metapopulation. Genetics 178: 467–475
Xu, J. 2006. Fundamentals of fungal molecular population genetic analyses. Current Issues in Molecular Biology 8(2): 75-89
Xue,Y., W. Qiuju, Q. Long, B. L. Ng, H. Swerdlow, J. Burton, C. Skuce, R. Taylor, Z. Abdellah, Y. Zhao, Asan, D. G. MacArthur, M. A. Quail, N. P. Carter, H. Yang, and C. Tyler-Smith. 2009. Human Y Chromosome Base-Substitution Mutation Rate Measured by Direct Sequencing in a Deep-Rooting Pedigree. Current Biology 19: 1453–1457 Wang, S.-A., and F.-Y. Bai. 2008. Saccharomyces arboricolus sp. nov., a yeast species from tree bark. IJSEM 58(2): 510-514.
Weir, B. S., and C. C. Cockerham. 1973. Estimating F-statistics for the analysis of population structure. Evolution 38(6): 1358-1370
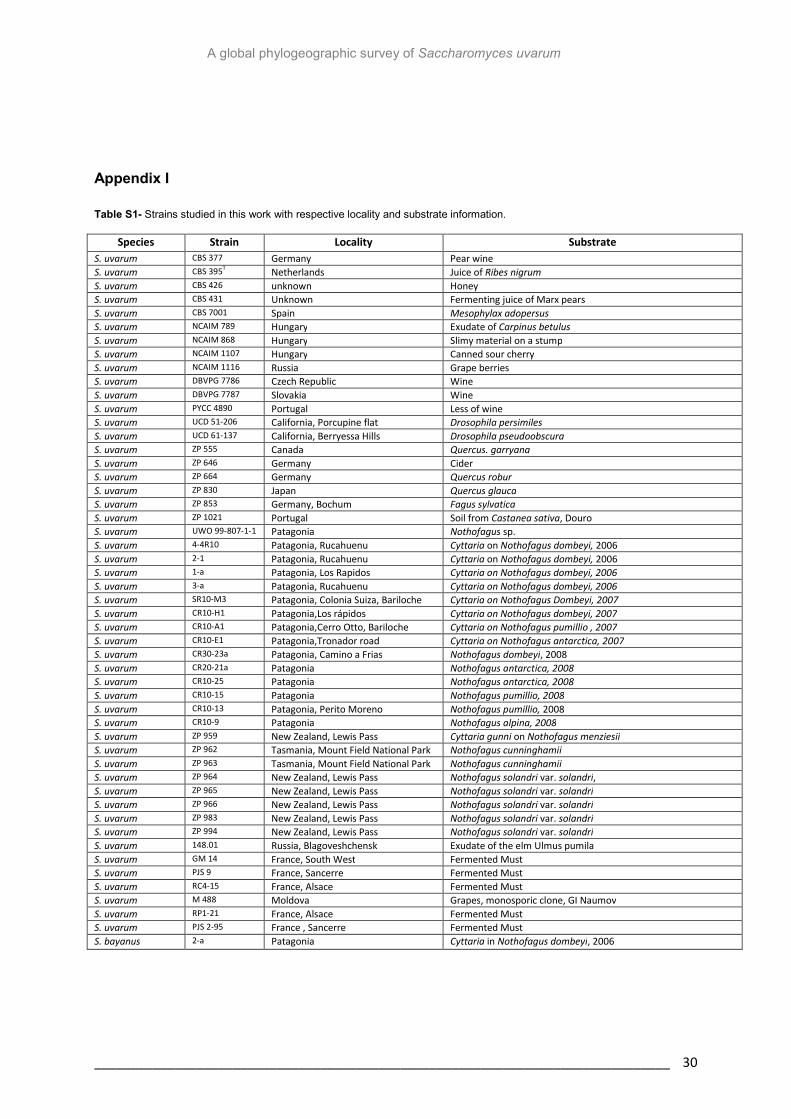
A global phylogeographic survey of Saccharomyces uvarum
_______________________________________________________________________________ 30
Appendix I
Table S1- Strains studied in this work with respective locality and substrate information.
Species Strain Locality Substrate
S. uvarum CBS 377 Germany Pear wine
S. uvarum CBS 395T Netherlands Juice of Ribes nigrum
S. uvarum CBS 426 unknown Honey
S. uvarum CBS 431 Unknown Fermenting juice of Marx pears
S. uvarum CBS 7001 Spain Mesophylax adopersus
S. uvarum NCAIM 789 Hungary Exudate of Carpinus betulus
S. uvarum NCAIM 868 Hungary Slimy material on a stump
S. uvarum NCAIM 1107 Hungary Canned sour cherry
S. uvarum NCAIM 1116 Russia Grape berries
S. uvarum DBVPG 7786 Czech Republic Wine
S. uvarum DBVPG 7787 Slovakia Wine
S. uvarum PYCC 4890 Portugal Less of wine
S. uvarum UCD 51-206 California, Porcupine flat Drosophila persimiles
S. uvarum UCD 61-137 California, Berryessa Hills Drosophila pseudoobscura
S. uvarum ZP 555 Canada Quercus. garryana
S. uvarum ZP 646 Germany Cider
S. uvarum ZP 664 Germany Quercus robur
S. uvarum ZP 830 Japan Quercus glauca
S. uvarum ZP 853 Germany, Bochum Fagus sylvatica
S. uvarum ZP 1021 Portugal Soil from Castanea sativa, Douro
S. uvarum UWO 99-807-1-1 Patagonia Nothofagus sp.
S. uvarum 4-4R10 Patagonia, Rucahuenu Cyttaria on Nothofagus dombeyi, 2006
S. uvarum 2-1 Patagonia, Rucahuenu Cyttaria on Nothofagus dombeyi, 2006
S. uvarum 1-a Patagonia, Los Rapidos Cyttaria on Nothofagus dombeyi, 2006
S. uvarum 3-a Patagonia, Rucahuenu Cyttaria on Nothofagus dombeyi, 2006
S. uvarum SR10-M3 Patagonia, Colonia Suiza, Bariloche Cyttaria on Nothofagus Dombeyi, 2007
S. uvarum CR10-H1 Patagonia,Los rápidos Cyttaria on Nothofagus dombeyi, 2007
S. uvarum CR10-A1 Patagonia,Cerro Otto, Bariloche Cyttaria on Nothofagus pumillio , 2007
S. uvarum CR10-E1 Patagonia,Tronador road Cyttaria on Nothofagus antarctica, 2007
S. uvarum CR30-23a Patagonia, Camino a Frias Nothofagus dombeyi, 2008
S. uvarum CR20-21a Patagonia Nothofagus antarctica, 2008
S. uvarum CR10-25 Patagonia Nothofagus antarctica, 2008
S. uvarum CR10-15 Patagonia Nothofagus pumillio, 2008
S. uvarum CR10-13 Patagonia, Perito Moreno Nothofagus pumillio, 2008
S. uvarum CR10-9 Patagonia Nothofagus alpina, 2008
S. uvarum ZP 959 New Zealand, Lewis Pass Cyttaria gunni on Nothofagus menziesii
S. uvarum ZP 962 Tasmania, Mount Field National Park Nothofagus cunninghamii
S. uvarum ZP 963 Tasmania, Mount Field National Park Nothofagus cunninghamii
S. uvarum ZP 964 New Zealand, Lewis Pass Nothofagus solandri var. solandri,
S. uvarum ZP 965 New Zealand, Lewis Pass Nothofagus solandri var. solandri
S. uvarum ZP 966 New Zealand, Lewis Pass Nothofagus solandri var. solandri
S. uvarum ZP 983 New Zealand, Lewis Pass Nothofagus solandri var. solandri
S. uvarum ZP 994 New Zealand, Lewis Pass Nothofagus solandri var. solandri
S. uvarum 148.01 Russia, Blagoveshchensk Exudate of the elm Ulmus pumila
S. uvarum GM 14 France, South West Fermented Must
S. uvarum PJS 9 France, Sancerre Fermented Must
S. uvarum RC4-15 France, Alsace Fermented Must
S. uvarum M 488 Moldova Grapes, monosporic clone, GI Naumov
S. uvarum RP1-21 France, Alsace Fermented Must
S. uvarum PJS 2-95 France , Sancerre Fermented Must
S. bayanus 2-a Patagonia Cyttaria in Nothofagus dombeyi, 2006

A global phylogeographic survey of Saccharomyces uvarum
_______________________________________________________________________________ 31
Table S2- Sequences and annealing temperatures of the primers used in this study. For the ones which were not
design in the study the reference is shown.
Gene Primer Sequence (5’ to 3’) Ta Reference
MET2
MET2-cerF CGAAAACGCTCCAAGAGCTGG 57ºC
Sampaio and Gonçalves, AEM
2008 MET2-cerR GACCACGATATGCACCAGGCAG
HIS3
SuHIS3-F ATGTCAGAGCAAAAGGCCCTA 49ºC
Rainieri et al., AEM 2006 SuHIS3-R CATGAGAACACCCTTTGTGGA
FSY1
FSY-230F GGATCYTCRACAAGCGTTTCTC 52ºC
Designed in this work FSY-1650R AAGGCAAACAYGTAAAGCAAAG
EST2
EST2uva-80F AATATGGTCAATTCAATGGC 49ºC
Designed in this work EST2uva-1265R TAACTGTTGTGGTTTCTACA
COXII
COXIIuva-F CAGCAACACCAAATCAAGAAG 53ºC
Designed in this work
COXIIuva-R CATATTAGCATGGCCAGT
SSU1
SSUuva-1F CGAAAGATTGATCCAGTTAC 52ºC
Designed in this work
SSUuva-680R ATGCTCCACTGCTTAAGTC
(TA)n
(TA)n_F GTATGCATCACTATTTTTCG
52ªC Masneuf-Pomarède et.
al.,SAM 2007
(TA)n_R AATTTGGTAATTTGAATGTG
(CTG)n
(CTG)n_F GGACACTAGAGTTCGTCTCG
52ªC Masneuf-Pomarède et.
al.,SAM 2007
(CTG)n_R GCCACCACTATCAGTTCG
(ATT)n
(ATT)n_F TGCCCTTCTTATTCTTGT
46ªC Masneuf-Pomarède et.
al.,SAM 2007
(ATT)nR GAAAATATCAACGCATTAAA
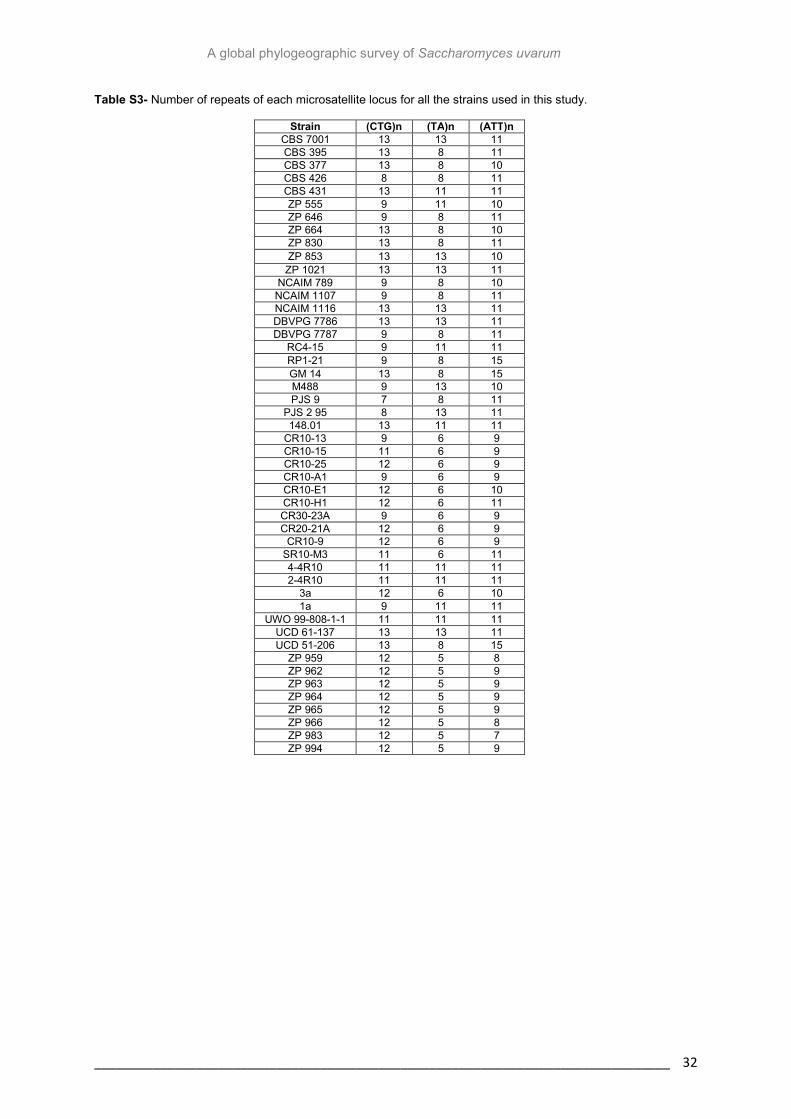
A global phylogeographic survey of Saccharomyces uvarum
_______________________________________________________________________________ 32
Table S3- Number of repeats of each microsatellite locus for all the strains used in this study.
Strain (CTG)n (TA)n (ATT)n CBS 7001 13 13 11 CBS 395 13 8 11 CBS 377 13 8 10 CBS 426 8 8 11 CBS 431 13 11 11 ZP 555 9 11 10 ZP 646 9 8 11 ZP 664 13 8 10 ZP 830 13 8 11 ZP 853 13 13 10 ZP 1021 13 13 11
NCAIM 789 9 8 10 NCAIM 1107 9 8 11 NCAIM 1116 13 13 11 DBVPG 7786 13 13 11 DBVPG 7787 9 8 11
RC4-15 9 11 11 RP1-21 9 8 15 GM 14 13 8 15 M488 9 13 10 PJS 9 7 8 11
PJS 2 95 8 13 11 148.01 13 11 11
CR10-13 9 6 9 CR10-15 11 6 9 CR10-25 12 6 9 CR10-A1 9 6 9 CR10-E1 12 6 10 CR10-H1 12 6 11 CR30-23A 9 6 9 CR20-21A 12 6 9
CR10-9 12 6 9 SR10-M3 11 6 11 4-4R10 11 11 11 2-4R10 11 11 11
3a 12 6 10 1a 9 11 11
UWO 99-808-1-1 11 11 11 UCD 61-137 13 13 11 UCD 51-206 13 8 15
ZP 959 12 5 8 ZP 962 12 5 9 ZP 963 12 5 9 ZP 964 12 5 9 ZP 965 12 5 9 ZP 966 12 5 8 ZP 983 12 5 7 ZP 994 12 5 9

A global phylogeographic survey of Saccharomyces uvarum
_______________________________________________________________________________ 33
Table S4- Results for carbon source assimilation (Mel.- Melibiose; Gluc.- Glucose; Malt.- Maltose.; Man.-
Mannitol; Fruct.- Fructose and Galact.- Galactose) and maximum grouth temperature (MGT). Geographical
origins of the strains are also displayed (AUST- Australasia; EUR- Europe; A- Asia; NA- North America; PAT-
Patagonia). Growth was evaluated in terms of turbidity ( - no growth; + growth; D delayed growth; D* signs of
growth appeared 15 days after inoculation).
Strains Mel. Gluc. Malt. Man. Fruct. Galact. MGT
AU
ST ZP 959 D* + D* - + + 32ºC
ZP 962 D* + - D + + 31ºC ZP 964 D* + D* D + + 31ºC ZP 965 D* + D* D + + 32ºC ZP 983 D* + D* - + + 32ºC
EU
R
ZP 1021 + + + - + + 35ºC DBVPG 7786 + + + - + + 35ºC
ZP 853 + + + - + + 35ºC ZP 646 D + + D + + 35ºC
NCAIM 868 D + + D + + 35ºC NCAIM 1107 + + D D + + 35ºC
A
ZP 830 + + + D + + 35ºC
NA UCD 51-206 + + D - + + 35ºC
ZP 555 + + + D + + 35ºC
PA
T CR10-13 + + + - + + 35ºC
CR30-23a + + + D + + 35ºC 4-4R10 + + + D + + 35ºC
Table S5 - Results for growth rate and latency in two different carbon sources (Glucose and Melibiose).
The test was performed using one strain from Patagonia (4-4R10) and one from Australasia (ZP 964).
Carbon Source Temperature Strains Growth Rate (h-1) Doubling Time (h) Latency (h)
Glucose
25ºC ZP 964 0.240 2.9 5
4-4R10 0.270 2.5 5
18ºC ZP 964 0.150 4.6 8.5
4-4R10 0.170 3.9 8.5
10ºC ZP 964 0.036 9.8 13>X>27.5
4-4R10 0.037 9.4 13>X>27.5
Melibiose
25ºC ZP 964 0.064 11.4 25
4-4R10 0.114 6.3 5
18ºC ZP 964 0.048 13.7 25
4-4R10 0.091 9.7 5
10ºC ZP 964 0.018 36.6 40
4-4R10 0.044 15.2 5
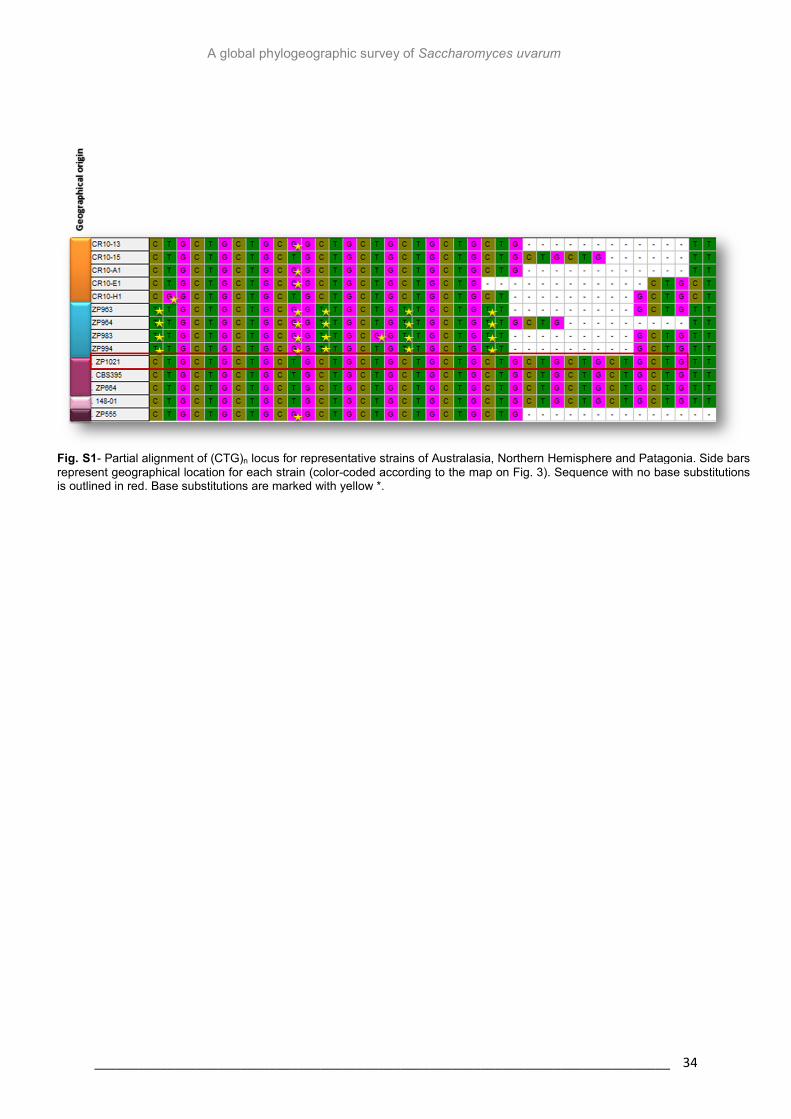
A global phylogeographic survey of Saccharomyces uvarum
_______________________________________________________________________________ 34
Fig. S1- Partial alignment of (CTG)n locus for representative strains of Australasia, Northern Hemisphere and Patagonia. Side bars represent geographical location for each strain (color-coded according to the map on Fig. 3). Sequence with no base substitutions is outlined in red. Base substitutions are marked with yellow *.
Top Related