AS ASSEMBLÉIAS DE DEUS NO BRASIL Joanyr de Oliveira IMPRIMIR.pdf

UNIVERSIDADE FEDERAL DO RIO GRANDE PÓS-GRADUAÇÃO EM OCEANOGRAFIA BIOLÓGICA
Variações na estrutura das assembléias de peixes ao longo de um amplo gradiente estuarino-límnico do complexo Lagunar
Patos-Mirim
PRISCILA MARTINS DE MOURA
Dissertação apresentada ao Programa de Pós-graduação em Oceanografia Biológica da Universidade Federal do Rio Grande, como requisito parcial à obtenção do título de MESTRE.
Orientador: Prof. Dr. Alexandre Miranda Garcia
RIO GRANDE Março 2011
II
AGRADECIMENTOS
A minha família, pelo apoio, carinho e estrutura.
Ao meu orientador Prof. Dr. Alexandre Miranda Garcia pela confiança, por seus
ensinamentos e pela paciência.
Aos membros da banca Prof. Dra. Ana Cristina Petry, Prof. Dr. Daniel Loebmann,
Prof. Dr. João Paes Vieira pelas correções e considerações para o aprimoramento desse
trabalho.
Um grande agradecimento ao Prof. Dr. João Paes Vieira por me receber no
laboratório de Ictiologia, pelo apoio e sugestões ao longo do trabalho.
A técnica do laboratório de Oceanografia Geológica (LOG) Neusa Neubert Teixeira
pelas análises sedimentológicas.
A Coordenação de aperfeiçoamento de pessoal de nível superior (CAPES) pela
bolsa de mestrado.
As minhas queridas amigas e colegas de laboratório Sônia Huckembeck, Valéria
Lemos e Débora Troca.
Aos colegas Fabiano Corrêa, Gianfranco Ceni, Marlucy Claudino, Leonardo
Moraes, Ana Cecília Mai, Rodrigo Bastos, Vinícius Condini, pela inestimável ajuda no
decorrer do trabalho.
A toda equipe do laboratório de Ictiologia.

III
ÍNDICE
RESUMO ................................ ................................ ................................ .......................... 1
ABSTRACT ................................ ................................ ................................ ...................... 2
I. INTRODUÇÃO ................................ ................................ ................................ ............. 3
II. MATERIAL E MÉTODOS ................................ ................................ ......................... 6
III. RESULTADOS ................................ ................................ ................................ ........... 9
IV. CONSIDERAÇÕES FINAIS ................................ ................................ ..................... 13
V. LITERATURA CITADA ................................ ................................ .......................... 14
VI. APÊNDICE: MANUSCRITO: formatado para o periódico Estuarine, Coastal and
Shelf Science ................................ ................................ ................................ ................... 19

1
RESUMO
A presente dissertação é composta de um capítulo (em Português) sintetizando os
principais resultados obtidos, os quais são apresentados na forma de um manuscrito (em
inglês) no apêndice. O principal objetivo foi analisar o padrão de distribuição das
assembléias de peixes e a influência de algumas variáveis ambientais na abundância
relativa das espécies dominantes ao longo de um amplo eixo espacial (~300 km),
englobando o estuário da Lagoa dos Patos, canal São Gonçalo e Lagoa Mirim. No total,
sete locais foram amostrados mensalmente entre 03/2004 e 02/2005 com uma rede de
arrasto em zonas rasas (< 2 m). Foram capturadas 63 espécies e 45.929 indivíduos. As
análises de escalonamento multidimensional (MDS) evidenciaram a presença de dois
grupos principais espacialmente distintos: um formado pelas amostras do estuário e outro
formado pelo Canal São Gonçalo e Lagoa Mirim. Os peixes foram agrupados em guildas
ecológicas e, através da análise de composição e abundância relativa, verificou-se uma
marcada substituição dessas guildas entre a zona estuarina (estuário e norte do canal) e
zona límnica (sul do canal e Lagoa Mirim). Essa substituição foi mais pronunciada em
termos de abundância do que em termos de frequência de ocorrência, sendo que a
segregação entre as guildas foi intensificada pela presença de uma barragem-eclusa,
posicionada na porção mediana do gradiente. Variáveis físico-químicas (e.g., salinidade e
transparência da água) e outras relacionadas às características estruturais dos habitats (e.g.,
declividade e percentual de silte e argila no sedimento) foram os principais fatores, dentre
os investigados, que melhor explicaram a variabilidade na abundância e distribuição da
ictiofauna ao longo do gradiente.
Palavras-chave: Ecótono, gradiente de salinidade, assembléias de peixes, estuário da
Lagoa dos Patos, canal São Gonçalo, Lagoa Mirim.
2
ABSTRACT
This dissertation is comprised of a chapter (in Portuguese) summarizing our main findings,
which are shown in a manuscript (in English) in the annex. Our main goal was to analyze
the distribution pattern of fish assemblages and the influence of some environmental
variables on the relative abundance of dominant species along a broad spatial axes (~300
km), including the Patos Lagoon estuary, São Gonçalo channel and Mirim Lake. A total of
seven sites were sampled monthly between 03/2004 and 02/2005 with a beach seine in
shallow areas (<2 m). A total of 63 fish species and 45.929 individuals were caught. The
multidimensional scaling (MDS) analyses revealed two main groups spatially distinct: one
formed by the estuarine samples and other by freshwater samples from the channel and the
Mirim. Fish species were grouped into ecological guilds and the analyses of their
composition and relative abundance revealed a marked substitution of ecological guilds
between the estuarine zone (estuary and northern portion of the channel) and the limnetic
zone (southern portion of the channel and Mirim). This substitution was more pronounced
in terms of abundance than in terms of frequency of occurrence. Guilds segregation was
intensified by the presence of a dam lock positioned in the middle portion of the gradient.
Physico-chemical variables (e.g., salinity and water transparency) and others related to the
structural characteristics of habitats (e.g., slope and percentage of silt and clay in the
sediment) were the main factors, among those investigated, that better explained the
variability in the distribution and abundance of fish fauna along the gradient.
Keywords: ecotone, salinity gradient, fish assemblages, Patos Lagoon estuary, São
Gonçalo channel, Mirim Lake.
3
I. INTRODUÇÃO
Os estuários são zonas de transição entre ecossistemas marinhos e de água doce,
representando talvez o mais óbvio ecótono na ecologia aquática. As áreas transicionais
(ecótonos), são regiões de grande dinamismo e de uma heterogeneidade constante (Attrill
& Rundle, 2002). Nas últimas décadas vários estudos vêm investigando o padrão de
distribuição longitudinal das assembléias de peixes ao longo dessas áreas transicionais
(Winemiller & Leslie, 1992; Araújo, 1996; Martino & Able, 2003; Akin et al., 2005;
Sanchez-Botero et al., 2008; Castro et al., 2009; García et al., 2010; Macedo-Soares et al.,
2010; Câmara, 2010). Em larga escala (km) o padrão de distribuição de peixes parece
resultar primariamente de respostas ao ambiente físico. Provavelmente variáveis abióticas
agem como um filtro fisiológico, desempenhando um papel vital na estruturação da
comunidade (Remmert, 1983; Martino & Able, 2003). Consequentemente, o gradiente
ambiental em estuários é muito forte, com algumas espécies restritas a uma área particular,
resultando em um marcado padrão de zonação (Raffaelli et al., 1991). De fato, as espécies
de peixes dessas regiões podem ser consideradas como indicadores de heterogeneidade ao
longo do gradiente ambiental (Kremen, 1992; Mônaco et al., 1992; Bulger et al., 1993).
Na porção sul da planície costeira do Rio Grande do Sul, que se estende até o norte
do Uruguai, encontra-se o complexo Lagunar Patos – Mirim formado pela confluência do
estuário da Lagoa dos Patos e Lagoa Mirim. Esses dois sistemas são interligados por um
canal natural, denominado de São Gonçalo. A ictiofauna desse complexo lagunar possui
elevada diversidade de espécies com ciclos de vida variados, que, muitas vezes, inclui o
deslocamento entre o ambiente marinho, estuarino e límnico (Chao et al., 1985; Malabarba,
1989). Algumas espécies são limitadas a um determinado ambiente por apresentar estreita
tolerância fisiológica à salinidade, enquanto outras com ampla tolerância podem estar
restritas a certos locais por outros fatores físicos (e.g. profundidade) ou bióticos (e.g.,
4
predação). A distribuição da salinidade ao longo do complexo lagunar Patos-Mirim
depende principalmente das relações entre descarga fluvial e ação dos ventos (Möller &
Fernandes, 2010). Em condições de vazante e predomínio de ventos do quadrante Norte, o
estuário da Lagoa dos Patos recebe o aporte de água doce dos rios da parte Norte da
planície costeira do Rio Grande do Sul e dos rios afluentes da Lagoa Mirim. Assim
representa um escoadouro natural da bacia hidrográfica para o oceano através dos molhes
da barra de Rio Grande. Já em condições de estiagem e predomínio de ventos do quadrante
Sul, a cunha salina pode se estender dezenas de quilômetros à montante das duas lagoas.
Em 1977, com o intuito de prevenir a salinização das extensas lavouras de arroz
nas margens da Lagoa Mirim, foi construída uma barragem-eclusa no canal São Gonçalo.
Assim, a cunha salina ficou impedida de penetrar na parte sul do Canal São Gonçalo e na
Lagoa Mirim, tornando esta região um ambiente límnico permanente e mais estável devido
a ausência da intrusão da água do mar. Burns et al. (2006) apresentaram as primeiras
evidências sugerindo que a barragem-eclusa acarretou uma descontinuidade na distribuição
de juvenis de peixes marinhos e estuarinos entre a porção norte, que possui conexão livre
com o estuário, e a porção sul do Canal, restrito à água doce. Uma análise mais
aprofundada dessa questão (Burns, 2010) demonstrou que a barragem-eclusa provocou a
perda de habitat para as espécies marinhas e estuarinas, e o concomitante aumento de
habitat para as espécies de água doce na porção sul do canal e na região da Lagoa Mirim.
No complexo lagunar Patos-Mirim, Raseira (2003) investigou os padrões de
distribuição dos peixes ao longo de uma ampla escala espacial (km) englobando o
gradiente marinho-estuarino-límnico. Analisando a assembléia de peixes desde o mar até a
zona límnica da Lagoa dos Patos, o autor descreve uma mudança gradual na ocorrência das
principais espécies, com uma substituição gradativa das espécies marinhas por espécies de
água doce à medida que se avança em direção ao norte da Lagoa dos Patos. Também foi
5
observado um aumento gradativo no comprimento total (mm) dos indivíduos desde o mar
até a zona pré-límnica. Dos fatores abióticos analisados por Raseira (2003), a salinidade foi
a que melhor explicou e influenciou a estruturação das assembléias de peixes ao longo do
eixo longitudinal. Outros fatores, como por exemplo, tipo de habitat, granulometria do
sedimento, temperatura, declividade e abundância de alimento também exerceram
influência, o que levou o autor a sugerir que o efeito sinérgico desses fatores, aliados à
bioecologia das espécies, determinam a distribuição dos peixes nessa região. Porém, a
análise de Raseira (2003) foi restrita à Lagoa dos Patos. Até o presente momento, não há
informações sobre os fatores que controlam a distribuição dos peixes ao longo do gradiente
estuarino-límnico formado pelo estuário da Lagoa dos Patos e a Lagoa Mirim.
Nesse contexto, o presente trabalho investiga os padrões e os fatores abióticos que
regulam a distribuição dos peixes de zonas rasas (< 2 m) ao longo de um amplo gradiente
estuarino-límnico (~300 km) formado pela confluência de duas importantes lagunas: a
Lagoa dos Patos, considerada a maior lagoa costeira do tipo “estrangulada” do mundo
(sensu Kjerfve, 1986), e a Lagoa Mirim, a segunda maior lagoa do Brasil. As principais
questões abordadas são (1) Quais as mudanças na estrutura das assembléias de peixes em
termos de composição específica, abundância relativa, estrutura de tamanho e diversidade
ao longo do gradiente estuarino-límnico? (2) Qual a importância relativa dos fatores
ambientais (e.g., salinidade) e das características estruturais do habitat (e.g., granulometria
do sedimento) na estruturação dos atributos das assembléias de peixes ao longo do
gradiente? (3) De que modo as guildas de espécies (e.g. estuarino residentes, marinhas,
dulcícolas) se distribuem ao longo do gradiente e que fatores abióticos controlam sua
distribuição? Além de preencher uma lacuna de conhecimento sobre a distribuição da
ictiofauna em um dos maiores complexos lagunares do sul da América do Sul, o presente
6
trabalho contribui para o entendimento da dinâmica e dos fatores que influenciam a
diversidade de peixes em áreas de ecótono estuarino-límnico da região Neotropical.
II. MATERIAL E MÉTODOS
Os dados foram obtidos junto ao banco de dados do laboratório de Ictiologia do
sítio 8 (estuário da Lagoa dos Patos) do Programa de Pesquisas Ecológicas de Longa
Duração (PELD), que realizou amostragens mensais entre março de 2004 a fevereiro de
2005 em sete locais ao longo do estuário da Lagoa dos Patos (E1-E2), Canal São Gonçalo
(C1 norte - C2 sul) e a Lagoa Mirim (L1-L2-L3). Essas estações de coleta estão
distribuídas num eixo espacial de aproximadamente 326 km ao longo do Complexo
Lagunar Patos-Mirim (CLPM) (Fig. 1, apêndice). Em cada localidade os peixes foram
coletados através de cinco arrastos com uma rede de arrasto de praia (modelo trawl – 9 m
de largura e 2,4 m de altura, malha 13 mm nas asas e 5 mm no saco) em zonas marginais
de pouca profundidade (< 2 m). Após coletados, os peixes foram fixados em formol 10% e,
posteriormente, identificados no nível de espécie, e tiveram seu comprimento total (CT) e
peso mensurados.
Concomitante com a amostragem dos peixes, a salinidade, temperatura,
transparência da água e a profundidade máxima dos arrastos foi registrada em cada
localidade durante as saídas de campo. Visando obter uma caracterização relativa da
heterogeneidade e complexidade estrutural do habitat, cada uma das sete localidades de
amostragem foi caracterizada em relação à granulometria do substrato (grosseiros e finos),
porcentagem de matéria orgânica e a declividade da praia (baixa, média e alta). Essa
caracterização foi realizada com periodicidade sazonal entre 2009 e 2010.
A composição de espécies e padrão de dominância foram analisados a partir da
frequência de ocorrência (FO%) e da abundância relativa (CPUE%) (Garcia et al., 2004).
7
As espécies com FO% maior ou igual a média de FO% de todas as espécies foram
consideradas como frequentes, sendo pouco frequentes aquelas com FO% menor que o
FO% médio. O mesmo procedimento foi empregado para a CPUE%. Finalmente, com base
nesses critérios, as espécies foram classificadas em quatro grupos em relação a sua
abundância e frequência de ocorrência: 1. abundante e frequente, 2. abundante e pouco
frequente, 3. pouco abundante e frequente e 4. pouco abundante e pouco frequente (Garcia
et al., 2004). Foram consideradas dominantes as espécies classificadas nas categorias 1, 2 e
3 em pelo menos uma das localidades amostradas.
A técnica de escalonamento multidimensional (MDS) foi empregada para avaliar a
similaridade na composição das espécies entre as estações de coleta tendo como base uma
matriz de presença/ausência, e outra matriz com a abundância relativa das espécies
dominantes. Em algumas das análises da abundância, as espécies de peixes foram
agrupadas nas seguintes guildas ecológicas: (a) estuarino residente; (b) estuarino
dependente; (c) visitantes marinhos; (d) água doce secundário; (e) água doce primário.
Essas guildas foram baseadas e adaptadas de Garcia et al. (2001) e Garcia et al. (2003b)
que propuseram uma versão simplificada das guildas ecológicas da ictiofauna do estuário
da Lagoa dos Patos, originalmente propostas por Chao et al. (1985) e Vieira et al. (1998).
No entanto, ao contrário dos trabalhos anteriores que tiveram como foco apenas o estuário,
o presente trabalho engloba um amplo gradiente estuarino-límnico que contempla
populações estuarinas e outras populações de água doce para a mesma espécie. Assim, as
espécies Platanichthys platana e Jenynsia multidentata que possuem populações no
ambiente estuarino e límnico foram classificadas na guilda de água doce secundária, e não
como estuarino residentes, como apontado por Garcia et al. (2001, 2003b).
A distribuição da abundância e do tamanho (comprimento total, CT, mm) das
espécies foi analisada conjuntamente numa única representação gráfica, plotando-se a
8
Captura por Unidade de Esforço (CPUE, número médio de indivíduos por arrasto) por
classes de comprimento (CT, mm) (Garcia et al., 2001; Vieira, 2006). Este procedimento
permitiu avaliar quais as unidades de tamanho (por exemplo, juvenis ou adultos) que foram
capturadas em maior abundância para cada espécie em diferentes locais e estações do ano,
possibilitando assim a inferência dos padrões de recrutamento destas espécies (Vieira,
1991; Geracitano, 1998). O teste de Kolmogorov-Smirnov foi utilizado para comparar a
similaridade no formato das distribuições nas classes de tamanho das assembléias do
estuário da Lagoa dos Patos, Canal São Gonçalo e Lagoa Mirim (Zar, 1996).
A diversidade foi analisada separadamente em dois componentes: riqueza
observada de espécies (S) e equitatividade. A equitatividade, ou seja, a proporção na qual a
abundância está distribuída entre as espécies, foi calculada através do índice de Hill (1973)
modificado (E5). As possíveis diferenças sazonais entre os sete locais de amostragem na
riqueza observada de espécies (S) e na equitatividade (E5) foram examinadas através de
ANOVA. As estações do ano foram consideradas a partir do agrupamento dos seguintes
meses: Verão (Janeiro, Fevereiro, Março), Outono (Abril, Maio, Junho), Inverno (Julho,
Agosto, Setembro) e Primavera (Outubro, Novembro, Dezembro).
Foi utilizada ANOVA de duas vias para testar diferenças significativas entre as
variáveis ambientais [log10 (Salinidade+1), temperatura da água e profundidade] por áreas
e meses do ano. A transparência da água (disco de Secchi) não atendeu os pressupostos da
ANOVA, então as comparações foram feitas através do teste não paramétrico de Kruskal-
Wallis (Sokal & Rohlf, 1995; Conover, 1999).
A análise de correspondência canônica (ACC) foi utilizada para verificar as
relações entre a complexidade estrutural dos habitats (percentual de sedimento fino,
percentual de sedimento grosseiro, matéria orgânica, declividade e profundidade dos
arrastos), os fatores abióticos (salinidade, temperatura da água e transparência da água) e a
9
distribuição e abundância dos peixes dominantes (31 espécies). As variáveis ambientais
foram padronizadas e a abundância dos peixes foi expressa como log10 (CPUE +1). Foi
utilizado o procedimento “Forward selection” da ACC para selecionar quais variáveis
abióticas tiveram uma contribuição significativa (p=0,05) na explicabilidade das variações
observadas na matriz de espécies. O teste de permutação de Monte Carlo (com 9999
permutações) foi utilizado para testar a significância (p < 0,05) dos eixos da ACC (ter
Braak & Verdonschot, 1995).
III. RESULTADOS
Foram capturadas 63 espécies de peixes compreendidos em 11 ordens e 25 famílias,
totalizando 45.929 indivíduos. Do total de 63 espécies, 31 foram consideradas dominantes
e 10 espécies representaram 86,61% das capturas em número, sendo elas: Mugil liza,
Cyanocharax alburnus, Brevoortia pectinata, Mugil curema, Odontesthes mirinensis,
Cheirodon ibicuhiensis, Odontesthes argentinensis, Platanichthys platana, Astyanax
fasciatus e Lycengraulis grossidens (Tabela 1, apêndice).
As análises de escalonamento (MDS) com as matrizes de composição de espécies
(presença/ausência) e abundância (CPUE%) das espécies dominantes resultaram em
padrões semelhantes. Ambos evidenciaram a presença de dois grupos principais, um
formado pelas amostras do estuário (E1 e E2) e o segundo de água doce formado pela
região do Canal (C1, C2) e Lagoa Mirim (L1, L2, L3) (Fig. 3, apêndice). De acordo com a
análise de similaridade de porcentagens (SIMPER) da contribuição das espécies, o grupo
formado pelas amostras do estuário apresentou similaridade média de 28,45%, sendo que
as espécies com maior contribuição para esse grupo foram M. liza, M. curema, B. pectinata
e O. argentinensis. Já o grupo de água doce apresentou similaridade média de 19,57% com
10
C. alburnus, O. mirinensis, A. fasciatus, P. platana, C. ibicuhiensis e Bryconamericus
iheringii tendo a maior contribuição na similaridade desse grupo.
Em relação à composição e abundância das guildas, foi possível observar que a
maioria das espécies (N=28) foi oriunda da guilda de água doce primário. Já o número de
espécies de visitantes marinhos, água doce secundário, estuarinos dependentes e estuarinos
residentes foram de 12, 11, 7 e 5 espécies, respectivamente (Tabela 1, apêndice).
Ocorreu uma marcada substituição das guildas ecológicas entre a zona estuarina
(estuário e porção norte do canal) e límnica (porção sul do canal e lagoa Mirim) que
coincidiu com a diminuição da salinidade ao longo do gradiente. Essa substituição foi mais
pronunciada em termos de abundância do que em termos de frequência de ocorrência (Fig.
4, apêndice). A guilda visitante marinho ficou restrita à zona estuarina, que possui conexão
livre com o estuário. Em termos de abundância percentual, os estuarinos dependentes
dominaram com média de 85% a região do estuário, água doce primário dominou 80% da
região do canal, e água doce primário juntamente com água doce secundário, dominaram a
ictiofauna da lagoa de água doce com 51% e 45%, respectivamente.
A composição de tamanho no estuário foi diferente daquela observada no canal (K-
S teste; D = 0,425; p < 0,0002) e na lagoa Mirim (K-S teste; D = 0,319; p < 0,012), porém,
não houve diferença na distribuição de tamanho entre canal e lagoa Mirim (K-S teste; D =
0,234; p > 0,130). No estuário, a distribuição foi unimodal (moda na classe de 25-30 mm
de comprimento total), com amplitude de distribuição entre 5 e 130 mm CT. Já no canal e
na lagoa Mirim, a distribuição foi bimodal (30-40 e 95-105 mm CT) e ocorreu maior
amplitude na distribuição, especialmente no canal (10 a 235 mm) (Fig. 5, apêndice).
Na região estuarina as tainhas (M. liza e M. curema) foram as mais abundantes em
quase todas as classes de tamanho amostradas, sendo especialmente abundantes entre 25 e
105 mm CT. O peixe-rei (O. argentinensis) apresentou maior amplitude de tamanhos
11
variando de 15 até 130 mm CT, enquanto a corvina (M. furnieri) foi mais abundante nas
classes maiores (CT > 110 mm). Já na região do canal os lambaris foram numericamente
dominantes, com C. alburnus dominando as classes de tamanho de 10 a 65 mm CT e A.
fasciatus entre as classes 70 até 110 mm CT. Indivíduos de maior tamanho (entre 150 e
235 mm), como C. punctata, C. voga e G. brasiliensis, ocorreram em baixa abundância
(Fig. 5, apêndice).
Na região da lagoa Mirim, os tamanhos menores foram dominados por P. platana e
J. multidentata, enquanto as classes de maior tamanho (90-185 mm CT) foram dominadas
por A. fasciatus e C. voga. O peixe-rei O. mirinenses foi a espécie com maior amplitude de
tamanho nas capturas nessa região, ocorrendo desde 20 a 180 mm CT, com moda nas
classes 70 e 75 mm CT (Fig. 5, apêndice).
Os resultados da ANOVA foram distintos em relação à variabilidade na riqueza de
espécies e na equitatividade entre os locais de amostragem e as estações do ano (Tabela 2,
apêndice). Para a riqueza houve interação entre as localidades do estudo e sazonalidade (p
< 0,01). De uma maneira geral, as localidades do canal (C1 e C2) apresentaram médias
significativamente superiores às demais localidades do estudo (p<0,000) e o inverno
apresentou médias significativamente inferiores ao verão e primavera (p < 0,032) (Fig. 6,
apêndice). Já a equitatividade apresentou diferenças significativas apenas em relação aos
locais de coleta. A localidade C1 apresentou menor equitatividade em relação a E2 e L3,
mas não diferindo significativamente em relação as demais localidades (teste de Tukey; p
> 0,05).
O primeiro eixo da ACC apresentou autovalor de 0,661, sendo responsável por
59,3% da variância total. Em combinação com o segundo eixo, que apresentou autovalor
de 0,251, ambos modelaram 81,8% da variância explicada pela ACC. A inércia total dos
dados foi de 2,995, sendo que 37% (1,115) pode ser explicada pela análise (Tabela 3,
12
apêndice). A relação entre as espécies dominantes e as variáveis ambientais representadas
por esses dois eixos foi estatisticamente significante (p < 0,05) de acordo com o teste de
permutação de Monte Carlo. A profundidade e o percentual de sedimento grosseiro (areia
fina, média e grossa) não tiveram uma contribuição significativa na modelagem dos dados
(FS teste; p > 0,05) e, portanto, foram excluídos da análise.
De modo geral, a salinidade e a declividade foram as variáveis que mais
influenciaram a distribuição das espécies nesse estudo, seguidas por transparência da água
e percentual de sedimento fino (Fig. 7a, apêndice). As amostras da região estuarina foram
associadas com maiores valores de transparência da água e salinidade, enquanto que a
região do canal apresentou valores intermediários para essas variáveis e uma menor
associação com salinidade. Por outro lado, as amostras obtidas no canal foram
correlacionadas com maior declividade e maior contribuição percentual de sedimento fino
e matéria orgânica no sedimento. Já a região da lagoa Mirim esteve associada à baixa
declividade e uma menor contribuição percentual dos finos e matéria orgânica no
sedimento.
As espécies das guildas estuarinos dependentes e estuarinos residentes, que foram
abundantes no estuário, estiveram relacionadas aos maiores valores de salinidade no
gradiente, enquanto as espécies de água doce primária e secundária ficaram posicionadas
no extremo oposto desse gradiente. O peixe-rei, O. argentinenses, foi a espécie que
apresentou maior correlação com águas transparentes. Geophagus brasiliensis e
Crenicichla punctata tiveram forte relação com a declividade, enquanto Loricariichthys
anus, Oligosarcus jenynsii, Charax stenopterus, Cheirodon ibicuhiensis e Hyphessobrycon
luetkenii com os grãos finos do sedimento (Fig. 7b, apêndice).
13
IV. CONSIDERAÇÕES FINAIS
Nossos resultados apontaram uma marcada zonação das assembléias de peixes ao
longo do complexo lagunar Patos-Mirim, a qual pode ser observada em diferentes níveis de
organização (i.e., espécies e guildas). Uma porção significativa (37%) da variabilidade
espaço-temporal da ictiofauna ao longo dessa zonação pode ser explicada por fatores
ambientais com marcada variabilidade temporal (e.g., salinidade, transparência) e outros de
caráter mais conservativo, associados a estrutura do habitat (e.g., granulometria do
substrato e declividade). Fatores antrópicos, como a presença de uma barragem-eclusa,
contribui para tornar a segregação e zonação da ictiofauna mais abrupta na porção mediana
do gradiente estuarino-límnico. A região de maior abundância e riqueza de espécies ao
longo do gradiente ocorreu no canal natural (São Gonçalo) que conecta a zona mixohalina
da Lagoa dos Patos com as águas doces da Lagoa Mirim. Esse padrão parece ter sido o
resultado de fatores atuando concomitantemente no eixo longitudinal e batimétrico do
gradiente, os quais promoveram a confluência das guildas de espécies de origem estuarina
e água doce, bem como aquelas oriundas da zona litorânea e limnética. É importante
destacar que os padrões revelados no presente trabalho poderão sofrer profundas
modificações no futuro, já que alterações nas forçantes físicas (e.g., anomalias de chuva e
da descarga continental associados às fases do fenômeno El Nino Oscilação Sul), que
controlam as trocas de água ao longo do gradiente estudado (Grimm et al., 1998) são
esperadas num cenário de aquecimento global (Schroeder & Castello, 2010). Como já
demonstrado em trabalhos anteriores (Garcia et al., 2001; Garcia et al., 2003a; Garcia et
al., 2004), a abundância e a diversidade da ictiofauna dessa região é bastante sensível à
variabilidade e intensidade dessas forçantes físicas e, portanto, o padrão de zonação
descrito no presente trabalho poderá ter sua configuração substancialmente alterada no
futuro próximo.
14
V. LITERATURA CITADA
Akin, S., Buhan, E., Winemiller, K.O., Yimaz, H., 2005. Fish assemblage structure of
Koycegiz Lagoon-Estuary, Turkey: Spatial and temporal distribution patterns in
relation to environmental variation. Estuarine Coastal and Shelf Science 64, 671-684.
Araújo, F.G., 1996. Composição e estrutura da comunidade de peixes do médio e baixo rio
Paraíba do Sul, RJ. Revista Brasileira de Biologia 56, 111-126.
Attrill, M.J., Rundle, S.D., 2002. Ecotone or ecocline: Ecological boundaries in estuaries.
Estuarine Coastal and Shelf Science 55, 929-936.
Bulger, A.J., Hayden, B.P., Monaco, M.E., Nelson, D.M., McCormick-Ray, M.G., 1993.
Biologically-based estuarine salinity zones derived from a multivariate-analysis.
Estuaries 16, 311-322.
Burns, M.D.M., Garcia, A.M., Vieira, J.P., Bemvenuti, M.A., Marques, D.M.L.M.,
Condini, V., 2006. Evidence of habitat fragmentation affecting fish movement between
the Patos and Mirim coastal lagoons in southern Brazil. Neotropical Ichthyology 4, 69-
72.
Burns, M.D.M., 2010. Consequências da barragem eclusa do canal São Gonçalo para a
ictiofauna do sistema Patos - Mirim, Pós-graduação em Oceanografia biológica.
Universidade Federal do Rio Grande, Rio Grande, p. 143.
Câmara, E.M., 2010. Gradientes ambientais e a ictiofauna litorânea de ecossistemas
costeiros: os efeitos de aberturas da barra arenosa em lagoas do sudeste brasileiro, RJ.
Universidade Federal do Rio de Janeiro, Rio de Janeiro.
Castro, M.G., De Astarloa, J.M.D., Cousseau, M.B., Figueroa, D.E., Delpiani, S.M.,
Bruno, D.O., Guzzoni, J.M., Blasina, G.E., Antoni, M.Y.D., 2009. Fish composition in
a south-western Atlantic temperate coastal lagoon: spatial - temporal variation and
15
relationships with environmental variables. Journal of the Marine Biological
Association of the United Kingdom 89, 593-604.
Chao, L.H., Pereira, L.E., Vieira, J.P., 1985. Estuarine fish community of the dos Patos
Lagoon, Brazil. A baseline study. in: Yanez-Arancibia, A. (Ed.), Fish community
ecology in estuaries and coastal lagoons: Towards an ecosystem integration, pp. 429–
445.
Conover, W.J., 1999. Practical Nonparametric Statistics, 3 ed. Wiley.
Garcia, A.M., Vieira, J.P., Winemiller, K.O., 2001. Dynamics of the shallow-water fish
assemblage of the Patos Lagoon estuary (Brazil) during cold and warm ENSO
episodes. Journal of Fish Biology 59, 1218-1238.
Garcia, A.M., Raseira, M.B., Vieira, J.P., Winemiller, K.O., Grimm, A.M., 2003a.
Spatiotemporal variation in shallow-water freshwater fish distribution and abundance in
a large subtropical coastal lagoon. Environmental Biology of Fishes 68, 215-228.
Garcia, A.M., Vieira, J.P., Winemiller, K.O., 2003b. Effects of 1997-1998 El Niño on the
dynamics of the shallow-water fish assemblage of the Patos Lagoon Estuary (Brazil).
Estuarine Coastal and Shelf Science 57, 489-500.
Garcia, A.M., Vieira, J.P., Winemiller, K.O., Grimm, A.M., 2004. Comparison of 1982–
1983 and 1997–1998 El Niño effects on the shallow-water fish assemblage of the Patos
Lagoon estuary (Brazil). Estuaries 27, 905–914.
García, M.L., Jaureguizar, A.J., Protogino, L.C., 2010. From fresh water to the slope: fish
community ecology in the Rio de la Plata and the sea beyond. Latin American Journal
of Aquatic Research 38, 81-94.
Geracitano, L.A., 1998. Caracterização de unidades funcionais ontogenéticas a partir das
capturas por unidade de esforço por classe de comprimento (CPUE-CC), e sua
16
aplicação para Micropogonias furnieri no estuário da Lagoa dos Patos, Brasil.
Dissertação de Mestrado. Universidade Federal do Rio Grande, Rio Grande, p. 104p.
Grimm, A.M., Ferraz, S.E.T., Gomes, J., 1998. Precipitation anomalies in southern Brazil
associated with El Nino and La Nina events. Journal of Climate. 11, 2863-2880.
Hill, M.O., 1973. Diversity and Evenness - unifying notation and its consequences.
Ecology 54, 427-432.
Kjerfve, B., 1986. Comparative oceanography of coastal lagoons., in: Wolfe, D.A. (Ed.),
Estuarine Variability. Academic Press, New York, pp. 63-81.
Kremen, C., 1992. Assessing the indicators properties of species assemblages for natural
areas monitoring. Ecological Applications 2, 203-217.
Macedo-Soares, P.H.M.D., Petry, A.C., Farjalla, V.F., Caramaschi, E.P., 2010.
Hydrological connectivity in coastal inland systems: lessons from a Neotropical fish
metacommunity. Ecology of Freshwater Fish 19, 7-18.
Malabarba, L.R., 1989. Histórico sistemático e lista comentada das espécies de peixes de
água doce do sistema da Laguna dos Patos, Rio Grande do sul, Brasil, Comun. Mus.
Ciênc. Tecnol. , PUCRS, Sér. Zool ed, 107-179 pp.
Martino, E.J., Able, K.W., 2003. Fish assemblages across the marine to low salinity
transition zone of a temperate estuary. Estuarine Coastal and Shelf Science 56, 969-
987.
Möler, O., Fernandes, E., 2010. Hidrologia e hidrodinâmica, in: Seeliger, U., Odebrecht, C.
(Eds.), O estuário da Lagoa dos Patos: um século de transformações. FURG, Rio
Grande, pp. 17-27.
Mônaco, M.E., Lowery, T.A., Emmett, R.L., 1992. Assemblage of US west coast estuaries
based on the distribution of fishes. Journal of Biogeography 19, 251–267.
17
Raffaelli, D., Karakassis, I., Galloway, A., 1991. Zonation schemes on sandy shores: a
Multivariate Approach. Journal of Experimental Marine Biology and Ecology 148,
241-253.
Raseira, M.B., 2003. Análise espaço-temporal da associação de peixes das zonas rasas da
Lagoa dos Patos e região costeira adjacente, Pós Graduação em Oceanografia
Biológica. Universidade Federal do Rio Grande, Rio Grande, p. 113.
Remmert, H., 1983. Studies and thoughts about the zonation along the rocky shores of the
Baltic. Zoologica 22, 121–125.
Sanchez-Botero, J.I., Caramaschi, E.P., Garcez, D.S., 2008. Spatiotemporal variation in
fish assemblage in a coastal lagoon without direct contact with the sea (southeastern
Brazil). Journal of Coastal Research 24, 225-238.
Schroeder, F.A., Castello, J.P., 2010. An essay on the potential effects of climate change
on fisheries in Patos Lagoon, Brazil. Pan-American Journal of Aquatic Sciences 5,
320-330.
Sokal, R.R., Rohlf, F.J., 1995. Biometry: the principles and practice of statistics in
biological research, 3 ed, New York, 887 pp.
ter Braak, C.J.F., Verdonschot, P.F.M., 1995. Canonical correspondence analysis and
related multivariate methods in aquatic ecology. Aquatic Sciences 57, 255-289.
Vieira, J.P., 1991. Ecology of estuarine fish assemblage in Patos Lagoon Brasil (32°S), and
York River USA (37°N) with review of zoogeography of fishes in western Atlantic
warm-temperate and tropical estuaries. College of Willian and Mary Virginia, USA, p.
171.
Vieira, J.P., Castello, J.P., Pereira, L.E., 1998. Ictiofauna, in: Seelinger, U., Odebrecht, C.,
Castello, J.P. (Eds.), Os Ecossistemas Costeiro e Marinho do Extremo Sul do Brasil.
Ecosciencia, Rio Grande, pp. 60-63.
18
Vieira, J.P., 2006. Ecological analogies between estuarine bottom trawl fish assemblage
from Patos lagoon, Rio Grande do Sul, Brazil and York River, Virginia, USA. Revista
Brasileira de Zoologia 23, 234-247.
Winemiller, K.O., Leslie, M.A., 1992. Fish assemblages across a complex, tropical fresh-
water marine ecotone. Environmental Biology of Fishes 34, 29-50.
Zar, J.H., 1996. Biostatistical analysis. Upper Saddle River: Prentice Hall.
19
VI. APÊNDICE: MANUSCRITO: submetido para o periódico Estuarine, Coastal and
Shelf Science
FISH ASSEMBLAGE STRUCTURE ACROSS A LARGE SUBTROPICAL
ESTUARINE/FRESHWATER GRADIENT
Priscila M. Moura, João. P. Vieira, Alexandre M. Garcia
Universidade Federal do Rio Grande. Instituto de Oceanografia. Laboratório de Ictiologia.
Programa de pós-graduação em Oceanografia Biológica. Avenida Itália km 8. CEP 96201-
900, Rio Grande/RS, Brasil
Keywords: ecotone, salinity gradient, fish assemblages, Patos-Mirim Lagoon Complex

20
ABSTRACT
There is a growing interest in understand which ecological processes controls the
distribution of fish species across aquatic ecotones. Estuaries represent an excellent
opportunity for such studies because they harbor a diverse fish fauna originating from the
marine and freshwater environments. The present study investigates the distributional
patterns of shallow-water fish and the abiotic factors that influence these distributions
along a broad salinity gradient (~300 km) in the Neotropics. This gradient is formed by the
confluence of two important bodies of water: Patos Lagoon, the largest "choked" coastal
lagoon in the world, and Mirim Lake, the second largest lake in Brazil. Fishes were
sampled monthly during 1-yr with a beach seine net in seven sampling sites along the
gradient. Specimens were identified and had their size (total length, mm) and weight (g)
measured. Physicochemical parameters and habitat features were also recorded at each site.
A total of 63 species and 45,929 individuals were caught and, subsequently, classified in
estuarine dependent, estuarine resident, primary- and secondary-freshwater guilds. There
was a strong longitudinal zonation of the fish assemblages along the estuarine-limnic
gradient, which was revealed at distinct levels of organization (i.e., species and guilds).
Approximately 37% of the spatiotemporal variability of the ichthyofauna along the
gradient was explained by environmental factors with strong temporal variability (e.g.,
salinity and transparency) and other factors associated with habitat structure (e.g., substrate
granulometry and slope). Anthropogenic influences, such as the presence of a dam lock,
also contribute to the segregation and fish zonation. The highest abundance and species
richness along the gradient occurred in the natural channel linking both aquatic systems.
This pattern could be explained by abiotic factors acting along the longitudinal and
bathymetric axes of the gradient, promoting the confluence of guilds of estuarine and
freshwater species as well as guilds of species from the littoral and limnetic zones.
21
1. INTRODUCTION
Estuaries represent an excellent opportunity for studies about ecological frontiers in
aquatic systems because they are regions where marine and freshwater meet and exchange
physical properties and biological components. These transitional communities containing
freshwater and estuarine taxa provide an opportunity to study immigration and emigration
patterns and processes, and are dominated by species with extreme physiological
tolerances (Rundle et al., 1998). Several factors may influence the distribution of fish
species in these environments, including biotic (e.g., competition and predation) and
abiotic factors (e.g., salinity, temperature, turbidity, dissolved oxygen, and depth) (Day et
al., 1989), which in some cases, can have synergic effects (Rowe and Dunson, 1995). In
estuarine environments, variation in salinity is recognized as the primary environmental
factor influencing species’ distributional patterns (Vega-Cendejas and Santillana, 2004).
Abiotic factors may define community structure, whereas biotic interactions may
refine species’ distributional patterns within that structure (Sanders, 1968; Menge and
Olson, 1990). Abiotic variables probably act as physiological filters, playing a vital role in
the structuring of the community (Remmert, 1983; Martino and Able, 2003).
Consequently, the environmental gradient in an estuary is very strong, with some species
restricted to particular areas, resulting in a marked zonation pattern (Rafaelli et al., 1991).
Certain fish species from these areas may be considered as indicators of heterogeneity
along the environmental gradient (Kremen, 1992; Mônaco et al., 1992; Bulger et al., 1993).
The relative proportions of freshwater and marine fish species that use coastal and
estuarine zones may differ among zoogeographic regions (Blaber, 2000; Barletta et al.,
2003, 2005), influencing the diversity of fish assemblages along the salinity gradient.
However, little is known about the distribution of freshwater and marine estuarine fish in
the estuarine-limnic ecotone or about the factors that govern its dynamics (Winemiller and
22
Leslie, 1992; Araújo, 1996; García et al., 2010; Macedo-Soares et al., 2010). For example,
studies along the salinity gradient in North Temperate coastal zones have found that
marine species contribute more to the total species diversity along the gradient than
freshwater species (Martino and Able, 2003; Jung and Houde, 2003; Akin et al., 2005).
The inverse pattern would be expected in the Neotropical region, whose rivers, streams,
and ponds are home to the largest freshwater fish fauna in the world (Buckup et al. 2007;
Helfman et al., 2009). Therefore, it is reasonable to suppose that the composition and
diversity of estuarine fish communities in the Neotropics would be more strongly
influenced by freshwater fish than those in the North Temperate zone.
The present study investigates the distributional patterns of shallow-water fish and
the abiotic factors that influence these distributions along a broad estuarine-limnic gradient
(~300 km) in the Neotropics. This gradient is formed by the confluence of two important
bodies of water: Patos Lagoon, which is considered the largest "choked" coastal lagoon
(sensu Kjerfve, 1986) in the world, and Mirim Lake, the second largest lake in Brazil. The
primary questions addressed in this study are (1) how does the structure of the fish
assemblage change in terms of specific composition, relative abundance, size, and diversity
along the gradient? (2) What is the relative importance of various environmental factors
(e.g., salinity, temperature, and water transparency) and structural characteristics of the
habitat (substrate granulometry and organic matter content, slope, and depth) in structuring
fish assemblages along the gradient? (3) How are the species guilds (e.g., estuarine
resident, marine, and freshwater) distributed along the gradient, and which of them
influence diversity most strongly? In addition to filling a knowledge gap about the
distribution of the ichthyofauna in one of the largest lagoon complexes in South America,
the present study contributes to our understanding of the abiotic factors that influence fish
diversity in estuarine-limnic ecotones in the Neotropical region.
23
2. MATERIAL AND METHODS
2.1. Study and sampling area
Situated in extreme southern Brazil, the Patos-Mirim lagoon complex (PMLC) is formed
by the confluence of two large aquatic systems: the Patos Lagoon (10,360 km2) and Mirim
Lake (3,750 km2), with a drainage basin of 263,876 km2 (Seeliger et al., 1997). They are
connected by a natural channel called São Gonçalo, which is 76 km long. In 1977, a dam
lock was built in this channel to avoid the inflow of salt water during the dry period into
part of the channel and Mirim Lake. This structure ensures a freshwater reserve for human
consumption and for farm irrigation (CLM, 1970). Our study area encompasses the
shallow-water regions (< 2 m) along the PMLC, with sampling stations in the estuarine
zone of Patos Lagoon (E1-E2), São Gonçalo Channel (C1-C2), and Mirim Lake (L1-L2-
L3). These study regions are hereafter referred as estuary, channel and freshwater lake,
respectively. In total, there were seven sampling sites along a spatial axis of approximately
326 km (Fig. 1).
Every month between March 2004 and February 2005, fish were collected using a
beach seine net (9 m wide by 2.4 m high; 13-mm mesh) with a pocket of 5-mm mesh in its
rear portion (Fig. 1C). In each of the seven sampling sites, five samples were obtained.
Following collection, the fish were fixed in 10% formaldehyde and subsequently identified
at the species level and measured for total length (TL) in millimeters (mm) and weight in
grams (g). If the number of a given species was greater than 50, only the first 50 were
counted and individually measured; the rest were simply counted and added to the total.
Finally, the total number of individuals in each sample was weighed (g). Species were
identified according to Figueiredo and Menezes (1978, 1980), Menezes and Figueiredo
(1980), Reis et al. (2003), Benvenuti and Moresco (2005), and Buckup et al. (2007). At
the same time as the fish were collected, salinity and temperature were measured using a
24
YSI multiparameter probe, the water transparency was measured (in cm) using a Secchi
disk, and the maximum depth (cm) was recorded at each site.
To characterize the structural heterogeneity and complexity of the habitat, we
measured the substrate granulometry and beach slope of each of the seven sampling sites.
This characterization was conducted seasonally between 2009 and 2010. For the
granulometry analysis, 60 g sediment samples were collected using a 50-mm diameter
PVC pipe at each site. The sediment samples were transported in coolers on ice and
preserved in a freezer in the laboratory. The organic matter content of the sediment was
determined by burning 5 g of the material in a muffle furnace at 550°C for 8 h. The amount
of organic matter present in each sample was estimated as the difference between the initial
mass and final mass.
For the granulometry analysis, the samples were dried in an oven at 60°C and then
quartered and weighed. A total of 50 g from each sample was sifted using the Wentworth
method (1/2 phi) to separate the coarse sediments (fine, medium and coarse sand) from the
finer sediment fractions (silt and clay, which were separated from each other). Based on
the simple percentages (%) from each sieve, the coarse fraction of the sediment was
considered as the total percentage of fine, medium and coarse sand, and the fine fraction
was considered as the sum of the percentages of silt and clay. Together, the two
classifications added up to 100% in each sample.
The slope at each site was obtained from a topographic profile measured using a
centimeter-scale ruler. Depth measurements were taken every 5 m from the swash zone to
the maximum depth of collection at each site. Slopes were classified as low (0), medium
(1), or high (2).
2.2 Data analysis
2.2.1. Species composition, abundance, and dominance patterns
25
The species composition and patterns of dominance were analyzed based on the
frequency of occurrence (%F) and relative abundance (catch per unit effort; %CPUE) of
each species (Garcia et al., 2004). Species with %F values equal to or greater than the
average value of all species were considered frequent. Species with %F values smaller than
the average value were considered to be infrequent. The same procedure was employed for
the %CPUE values, resulting in abundant (%CPUE ≥ average %CPUE) and non-abundant
species (%CPUE< average %CPUE). Finally, based on these criterions, the species were
placed into four groups: 1. abundant and frequent, 2. abundant and infrequent, 3. non-
abundant and frequent and 4. non-abundant and infrequent (Garcia et al., 2004). This
classification was used to identify the dominant species. Thus, we considered as dominant
those species that were classified in categories 1, 2, and 3 in at least one of the sites (see
Table 1). These criteria resulted in the identification of 31 dominant species, which were
used in subsequent analysis (see below).
The MDS (non-metric multidimensional scaling) ordination technique was used to
evaluate the similarity in species composition from a presence/absence matrix including all
of the species and another matrix including the relative abundance of the dominant species.
The relative-abundance data were square-root transformed, and the similarity matrix was
calculated using the Bray-Curtis algorithm in the PRIMER statistical software package
version 6.1.9 (Clarke and Gorley, 2006).
In some of the abundance analyses, the fish species were grouped into the following
ecological guilds: (a) estuarine resident, fish that occur throughout the year and reproduce
in the estuary; (b) estuarine dependent, marine- or freshwater-spawning fish that occur in
large numbers in the estuary at certain times of the year; (c) marine vagrant, fish coming
from the marine environment that rarely occur in the estuary; (d) secondary freshwater,
fish that are restricted to freshwater and occasionally occur in the estuary; and (e) primary

26
freshwater, inhabitants of the limnic and fluvial environments that rarely occur in the
estuary. These guilds were adapted from Garcia et al. (2001, 2003b), who have proposed a
simplified version of the classification originally proposed by Chao et al. (1985) and Vieira
et al. (1998) for the fish guilds of the Patos Lagoon estuary. However, while these previous
studies (Garcia et al., 2001; Garcia et al., 2003b) have focused only on the estuarine
environment, the present study sampled a broad estuarine-limnic gradient that
encompassed both estuarine populations and other freshwater populations of the same
species. Therefore, the species Platanichthys platana and Jenynsia multidentata, which
have populations in both the estuarine and the limnic environment, were classified in the
secondary-freshwater guild and not as estuarine residents, as previously classified by
Garcia et al. (2001, 2003b).
2.2.2. Size and diversity structure
The abundance and size (TL) distribution of species were analyzed jointly in a
single graphical representation, plotting the catch per unit effort [(individuals per haul; data
transformed by Log10 (CPUE + 1)] versus the total length classes (CPUE-CC) (Garcia et
al., 2001, Vieira, 2006). This procedure enabled us to evaluate which size classes (for
example, juvenile or adult) were caught in greater abundance for each species at different
sites and under different conditions and thus to infer the recruitment patterns of each
species (Vieira, 1991; Geracitano, 1998). The Kolmogorov-Smirnov test was used to
compare the shapes of the size-class distributions for the estuary, channel, and freshwater
lake assemblages (Zar, 1996).
Two components of diversity were analyzed separately: observed species richness
(S) and evenness. The evenness (i.e., the distribution of the total abundance among the
species) was calculated by the modified (E5) Hill index (1973):
27
, where D is the Simpson Index and H’ is the Shannon Index. This
index assumes its maximum value when all the species in a sample are equally abundant
and decreases toward zero as the difference in relative abundance between the species
increases (Ludwig and Reynolds, 1988).
The possible differences in the observed species richness (S) and evenness (E5)
between seasons and sampling sites were examined using a two-way ANOVA. The
assumptions of homogeneity of the variance and normality were evaluated using Cochran’s
test and the Kolmogorov-Smirnov test, respectively (Sokal and Rohlf, 1995). The post-hoc
Tukey test was employed to determine which averages were significantly different from
each other. The seasons of the year were defined as follows: summer (January, February,
and March), autumn (April, May, and June), winter (July, August, and September) and
spring (October, November, and December).
2.2.3. Relationships between species and abiotic factors
A two-way ANOVA was used to test for significant differences in environmental
variables [log10 (Salinity+1)], water temperature, and depth) between months and sampling
sites. The water transparency (Secchi disk) data did not meet the ANOVA assumptions, so
comparisons were made using the Kruskal-Wallis non-parametric test (Sokal and Rohlf,
1995; Conover, 1999).
Canonical correspondence analysis (CCA) was used to evaluate the relationships
among the structural complexity of the habitats (percentage of fine sediment, percentage of
coarse sediment, organic matter, slope, and depth of the haul), the abiotic factors (salinity,
water temperature, and water transparency) and the distribution and abundance of the
dominant fish species (31 species).

28
In the CCA module, the unimodal method was used with biplot scaling, focusing on
the inter-specific distance scale. The environmental variables were standardized, and fish
abundance was expressed as log10 (CPUE + 1). The forward selection procedure was used
to select which abiotic variables contributed significantly (α = 0.05) to explaining the
observed variation in the species matrix. For the variables that were significantly correlated
with each axis, a series of permutations were performed to determine which variables best
explained the variation in the fish assemblage. The Monte Carlo permutation test (with
9999 permutations) was used to test the significance (p < 0.05) of the contribution of each
variable to each of the CCA axes (ter Braak and Verdonschot, 1995).
3. RESULTS
3.1. Environmental Variation
The salinity varied from zero to 28.8. Values above zero occurred only in the
estuary (E1 and E2) and in the northern portion of the channel (C1), which is downstream
of the São Gonçalo’s dam lock and has a free connection with the estuarine region of Patos
Lagoon. With respect to seasonal variation, salinity was higher during the summer months
(January and February) than during October (p < 0.0079) (Fig. 2a). The water temperature
varied from 10°C (July) to 31.2°C (January) and differed significantly among the months
of the year (p < 0.0001), with high values in the summer and low values in the winter.
There were no significant differences among sites (p > 0.07) (Fig. 2b). The water
transparency (Secchi disk) ranged between 8 and 100 cm. There were no significant
differences among months (p < 0.6643); however, the estuary (E1 = 62.45) and the channel
(C1 = 27 and C2 = 27.5) differed significantly (p < 0.005) in average water transparency
(Fig. 2c). The depth at the sampling sites varied from 10 to 130 cm, with no significant
differences among months (p < 0.082). The average depth values were significantly higher
29
(p < 0.0001) at the channel sites (~99 cm) than at the other collection sites (~50 cm) (Fig.
2d).
3.2. Species composition and abundance
A total of 63 fish species, representing 11 orders and 25 families, and 45,929
individuals were collected, excluding those identified only to the level of the family
Clupeidae and the genus Odontesthes spp.. Of these 63 species, 31 were considered
dominant (Table 1), and 10 species represented 86.61% of the total number of individuals:
Mugil liza, Cyanocharax alburnus, Brevoortia pectinata, Mugil curema, Odontesthes
mirinensis, Cheirodon ibicuhiensis, Odontesthes argentinensis, Platanichthys platana,
Astyanax fasciatus, and Lycengraulis grossidens.
The non-metric multidimensional analyses (MDS) based on the species
composition (presence/absence) and abundance (%CPUE) of dominant species matrices
resulted in similar patterns. Both supported two main groups, one formed by the estuary
samples (E1 and E2) and one formed by freshwater sites from the channel region (C1 and
C2) and freshwater lake (L1, L2,L3) (Fig. 3). The only exception was the occurrence of a
single channel sample (C1) in the estuary group; this sample came from the sampling site
at the northern end of the channel, which is located downstream the São Gonçalo’s dam
lock and has a free connection with the estuarine region of Patos Lagoon. This sample was
collected in February and showed a typically estuarine ichthyofauna due to the inflow of
saline water into the channel during January and February 2005. Aside this only exception
within the freshwater group, the samples formed two subgroups, one consisting of the
channel samples and the other consisting of the freshwater lake samples (Fig. 3).
According to the percentage similarity analysis (SIMPER), the group of estuary
samples presented an average similarity of 28.45% in species composition, and the species
that contributed most to this group were M. liza, M. curema, B. pectinata, and O.
30
argentinensis. The freshwater group formed by the channel and freshwater lake regions
showed an average similarity of 19.57%, with C. alburnus, O. mirinensis, A. fasciatus, P.
platana, C. ibicuhiensis, and Bryconamericus iheringii contributing most to the species
similarity among samples.
With respect to the composition and abundance of guilds, we observed that most of
the species (N = 28) belonged to the primary-freshwater guild. The numbers of marine
vagrant, secondary freshwater, estuarine dependent, and estuarine resident species were 12,
11, 7, and 5 species, respectively (Table 1).
A strong substitution of ecological guilds occurred between the estuarine zone
(estuary and northern portion of the channel) and the limnetic zone (southern portion of the
channel and freshwater lake) (Fig. 4), coinciding with the decrease in salinity along the
gradient (Fig. 2a). This substitution was more pronounced in terms of abundance (Fig. 4b)
than in terms of frequency of occurrence (Fig. 4a). The marine vagrant guild was restricted
to the estuarine zone, which has a free connection with the estuary. In terms of abundance
percentage, the estuarine dependent guild was dominant in the estuary region (with an
average of 85%), the primary freshwater guild was dominant in the channel region (80%),
and the primary- and secondary-freshwater guilds were dominant in the freshwater lake
region (51% and 45%, respectively).
3.3. Size and diversity structure
The size distribution observed in the estuary differed from those observed in the
channel (K-S test; D = 0.425; p < 0.0002) and in the freshwater lake (K-S test; D = 0.319;
p < 0.012). However, the size distribution did not differ between the channel and the
freshwater lake (K-S test; D = 0.234; p > 0.130). In the estuary, the distribution was
unimodal (with the mode in the 25-30 mm total length class), with a distributional
amplitude between 5 and 130 mm TL. In the channel and in the freshwater lake, the
31
distribution was bimodal (30-40 and 95-105 mm TL) and had a larger amplitude,
especially in the channel (10-235 mm) (Fig. 5).
In the estuarine region, two mullet species (M. liza and M. curema) were the most
abundant in almost all of the sampled size classes, especially between 25 and 105 mm TL.
Odonthestes argentinensis showed the largest amplitude of sizes, varying from 15 to 130
mm TL, while M. furnieri was more abundant in the larger classes (TL > 110 mm). In the
channel region, O. argentinensis were numerically dominant, with C. alburnus dominating
the 10 to 65 mm TL size classes and A. fasciatus dominating the 70 to 110 mm TL classes.
Larger individuals (between 150 and 235 mm), such as Crenicichla punctata, C. voga, and
G. brasiliensis, occurred in low abundance.
In the freshwater lake region, the smaller size classes were dominated by P. platana
and J. multidentata, whereas the larger size classes (90-185 mm TL) were dominated by A.
fasciatus and C. voga. Odonthestes mirinensis exhibited the largest size amplitude among
the species from that region, ranging from 20 to 180 mm TL with the mode in the 70 and
75 mm TL classes.
Table 2 shows the ANOVA results concerning the variation in observed species
richness and evenness among collection sites and seasons of the year. For species richness,
there was a significant interaction between the study sites and seasonal conditions (p <
0.01) (Table 2). In general, species richness was significantly higher on average at the
channel sites (C1 and C2) than at the other sites (p < 0.00001) and significantly lower on
average during the winter than during the summer and spring (p < 0.0318) (Fig. 6).
Evenness differed significantly only among collection sites. The site C1 exhibited lower
evenness compared to E2 and L3 but did not differ significantly from the other sites
(Tukey test; p > 0.05).
3.4. Relationships among species and abiotic factors
32
The results of the canonical correspondence analysis (CCA) are shown in Table 3.
The first CCA axis had an eigenvalue of 0.661 and was responsible for 59.3% of the total
variance. The second axis had an eigenvalue of 0.251, and the first and second axes
combined accounted for 81.8% of the variance explained by the CCA. The total inertia of
data was 2.995, of which 37% (1.115) could be explained by the analysis. The
relationships between the dominant species and the environmental variables represented by
these two axes were statistically significant (p < 0.05) according to the Monte Carlo
permutation test. The depth and the percentage of coarse sediment did not contribute
significantly to the model (FS test; p > 0.05) and were therefore excluded from the
analysis.
In general, salinity and slope had the strongest influence on species’ distributions,
followed by water transparency and fine sediment percentage. The samples from the
estuarine region exhibited higher water transparency and salinity values, whereas those
from the channel region had intermediate values of those variables and a weaker
association with salinity. On the other hand, the samples from the channel were associated
with higher slopes and larger percentages of fine sediment and organic matter. The
freshwater lake region was associated with lower slopes and smaller percentages of fine
sediment and organic matter in the sediment (Fig. 7).
Species belonging to the estuarine dependent and estuarine resident guilds, which
were abundant in the estuary, were associated with higher values along the salinity
gradient, whereas primary- and secondary-freshwater species were found at the opposite
far end of this gradient. Odonthestes argentinensis exhibited the strongest correlation with
water transparency. The distributions of G. brasiliensis and C. punctata were closely
related to slope, and those of Loricariichthys anus, Oligosarcus jenynsii, Charax
33
stenopterus, Cheirodon ibicuhiensis, and Hyphessobrycon luetkenii were closely related to
fine-grained sediment.
4. DISCUSSION
4.1. Spatial distribution and zonation of species
Fish assemblages along a ~326 km estuarine-limnic gradient in the Patos-Mirim
Lagoon Complex show a marked longitudinal zonation pattern, forming two main groups:
one dominated by estuarine and marine species and the other dominated by freshwater
species. Most species that occur in the Patos Lagoon estuary are of marine origin and they
use the estuarine habitats in similar manner to marine-related fishes found in most estuaries
worldwide (Day et al., 1989; Vieira and Musick, 1993, 1994). Its ichthyofauna is
dominated by small juvenile individuals, which find an abundance of shelter and food in its
shallow waters (< 2m) (Chao et al., 1985). In spite of the fact that few species can
withstand the variable salinity of the estuarine environment (Day et al., 1989), Patos
Lagoon estuary contains a diverse (~167 species) and abundant fish fauna associated with
its high primary and secondary productivity (Seeliger et al., 1997; Vieira et al., 2010).
Some marine species, such as mullets (genus Mugil) and the whitemouth croaker (M.
furnieri), use the estuary as a growth area for juveniles. Other species use the estuary more
sporadically, when the adults enter the region with saline inflows, probably in search of
food (Vieira and Castello, 1997).
In contrast with the unimodal size class distribution and the dominance of juveniles
(mode: 25-30mm) found in the fish assemblage of the estuary, the freshwater species that
are abundant in the channel and freshwater lake regions show larger size amplitudes. This
difference in general size amplitude among the estuary and freshwater assemblages might
be explained by the fact that both juvenile and adult forms of most of the studied fish
species complete their entire life cycles in the limnic regions upstream the dam lock. In

34
contrast, there is a numerical prevalence of immature, juvenile forms in the estuarine area
of Patos Lagoon, because adults of several species from the estuarine dependent and
marine vagrant guilds did not occur in the estuary year round. For instance, adult
individuals of estuarine dependent species (e.g., M. liza, M. furnieri, O. argentinensis)
leave the estuary during their reproductive migration towards the sea, whereas marine
vagrant species (e.g., Eucinostomus melanopterus, Anchoa marinii) only occur in the
estuary eventually during prolonged salinity intrusions (Chao et al., 1985, Vieira et al.,
2010).
As preliminary pointed out by Burns et al. (2006), the dam lock in the São Gonçalo
channel makes it difficult for fish to move between the estuary and the freshwater lake,
creating an abrupt separation in the species composition between the two systems. Our
analysis shows that species guild substitution along the gradient is gradual in terms of
frequency of occurrence, but becomes abrupt if considered in terms of abundance data,
especially among the sampling sites downstream and upstream the dam lock.
It seems reasonable to hypothesize that in the absence of a dam lock, the abundance
of the ecological guilds would shift gradually along the estuarine-limnic ecotone, like we
observed for the frequency of occurrence analysis. This gradual shift would result from
differential species-level responses to physicochemical parameters (e.g., salinity, pH,
dissolved oxygen), habitat selection (e.g., type of substrate, bathymetry) and to biotic
constraints (e.g., predation, competition) along the gradient. Other studies of species’
distributions across broad estuarine-limnic gradients that are not interrupted by dams seem
to corroborate the hypothesis that fish abundance shifts gradually. For example, when
analyzing fish assemblages across a gradient from the adjacent marine area to the limnetic
zone of Patos Lagoon, Raseira (2003) observed that marine species are gradually replaced
by freshwater species. Likewise, García et al. (2010) have studied the La Plata River along
35
a broad environmental gradient extending from a limnic region to the continental slope and
observed that marine species gradually replace the freshwater ichthyofauna along the
gradient, with no conspicuous transitional area (ecotone). Therefore, comparing the results
of the present study to those performed in regions without dam locks (e.g., Raseira, 2003;
García et al., 2010) suggests that the São Gonçalo channel dam lock creates an abrupt
transition in the distribution of fish abundance along the estuarine-limnic ecotone between
the Patos Lagoon estuary and Mirim Lake.
4.2. Diversity variation along the gradient
The highest species richness occurred in the channel region, especially at the
northern sampling site, which has a free connection with the estuarine area of Patos
Lagoon. This site is subject to the sporadic inflow of saltwater during some seasons of the
year, usually in warmer months. Hence, the northern reaches of the natural channel can
harbor both freshwater and marine fish species during favorable brackish conditions,
resulting in higher species richness in this transitional region of the studied gradient. Prior
works in other systems also suggest that transitional zones (ecotones) stand out within
aquatic gradients because they shelter greater number of species. For example, Sosa-Lópes
et al. (2007) have studied species’ distributions along a salinity gradient in Terminos
Lagoon (Mexico) and have observed higher species richness in low salinity areas (5-10‰).
In an ocean-estuarine transition zone in New Jersey (USA), Martino and Able (2003) have
also found higher diversity in the ocean/bay interfaces and between the intermediate
salinity areas in the Mullica River. Similarly, Akin et al. (2005) have found higher fish
abundance in the transitional region between freshwater and saltwater in the Koycegiz
Lagoon estuary (Turkey).
Another factor that may have contributed to higher species richness in the natural
channel area (São Gonçalo) is the local slope. Whereas the natural channel region shows a
36
pronounced depth profile, the estuary and freshwater lake sampling sites are characterized
by vast shallow areas (< 2 m) (Seeliger et al. 1997). Therefore, unlike the estuary and the
freshwater lake, the natural channel region has a very narrow shoreline (< 2m) that is close
connect to the deeper zones (> 3 m) of the channel. Usually, fish faunas of littoral and
limnetic zones show distinct species compositions (Lowe-McConnell, 1999; Garcia et al.,
2006; Souza et al., 2008). For example, in lakes adjacent to the present study area, Garcia
et al. (2006) have observed that smaller species (e.g., Cyanocharax alburnus, Jenynsia
multidentata, Bryconamericus iheringii) predominate in the littoral zone and larger species
(e.g., Cyphocharax voga, Astyanax fasciatus, Oligosarcus jenynsii, Odontesthes
mirinensis) predominate in the limnetic zone. Thus, the closer proximity between these
zones in the natural channel probably favored the collection of species from both regions.
Therefore, the higher abundance and species richness in the natural channel seemed to be
result of a combination of factors related to longitudinal zonation (i.e., the confluence of
guilds with different degrees of salinity tolerance originated from marine/estuarine and
limnic environments) and bathymetry (i.e., the confluence of littoral and limnetic
taxocenoses due to a steeper slope).
4.3. Relationships between species and abiotic factors
According to the direct gradient analysis (CCA), 37% of the spatial and temporal
variability of the fish assemblages along the gradient can be explained by the biotic
variables considered in the present study. This percentage is somewhat higher than those
obtained in other studies of marine-freshwater gradients using the same technique (CCA).
For example, Martino and Able (2003) have reported that five environmental variables
explain 29.9% of the total variation of species in an ocean-estuarine ecotone in New Jersey
(USA). Using the same number of variables, Akin et al. (2005) have accounted for 26.6%
of the variation of species in the Koycegiz Lagoon estuary in Turkey. As in the present
37
study, those authors studied the changes in the ichthyofauna along a broad spatial scale and
with similar salinity variations [0.1-32 in Martino and Able (2003), 5-40 in Akin et al.
(2005) and 0-28 in the present study].
In general, salinity, slope, substrate granulometry (percentage of fine sediment),
and water transparency were the factors that best explain the variability in the abundance
of dominant fish species in the study area. With a few exceptions, the salinity gradient
segregated fish guilds into two groups: the estuarine dependent, estuarine resident and
marine vagrant species, which were associated with the brackish estuarine waters, and the
primary- and secondary-freshwater species, which were restricted to the limnic region.
Previous studies have highlighted the predominant role of salinity in structuring estuarine
fish assemblages (Martino and Able, 2003; Akin et al., 2005). However, the marked
segregation of guilds along the salinity gradient in the present study is probably
strengthened by the presence of the dam lock in the middle portion of the gradient, which
partially impairs the free movement of water and fish between the estuary and the limnic
region upstream.
In contrast with the role of salinity, which has been systematically incorporated in
direct gradient analyses in previous studies (Martino and Able, 2003, Akin et al., 2005),
little is known about the role of factors such as sediment granulometry in structuring fish
assemblages along marine-freshwater ecotones. Our results show that this factor could play
an important role in structuring the fish assemblages in these regions. For example, the
abundance of many species from the primary- and secondary-freshwater guilds is strongly
connected to the predominance of fine sediment (silt and clay) and to higher percentages of
organic matter in the substrate. It seems reasonable to suppose that these substrate
characteristics reflect favorable conditions for spawning, counter-shading, and/or foraging,
especially for fish with benthonic habits. In fact, the dominant species in those guilds that
38
exhibit morpho-anatomical characteristics associated with feeding on benthonic prey (e.g.,
Loricariichthys anus, Geophagus brasiliensis, Gymnogeophagus gymnogenys, Corydoras
paleatus, and Rineloricaria longicauda) are more abundant in the portion of the gradient
with higher percentages of fine particles and organic matter in the substrate.
Despite the relatively high percentage of the variation explained in the CCA (37%),
much of the temporal and spatial variation in the abundance of species is not explained in
the present study. As highlighted by other authors (Martino and Able, 2003; Akin et al.,
2005), this unexplained variation might be due to other environmental factors (e.g.,
dissolved oxygen and pH) or other factors reflecting the structural complexity of the
habitat (e.g., the presence of aquatic macrophytes) that were not accounted for in the
present study. In addition to physical and chemical factors, it is important to highlight the
role of biotic interactions (e.g., competition and predation) in the structuring of fish
communities (Menge and Olson, 1990). As suggested by Martino and Able (2003), broad-
scale patterns in the structure of estuarine fish assemblages are primarily due to the
responses of individual species to the dominant environmental gradient, whereas small-
scale patterns seem to result from biotic interactions, such as predator avoidance,
competition, and habitat selection.
In summary, our results revealed a strong zonation in fish assemblages of the Patos-
Mirim Lagoon complex. This zonation can be observed at different levels of organization
(i.e., species and guilds). A large portion (37%) of the spatial and temporal variability of
the ichthyofauna along the estuarine-limnic gradient can be explained by environmental
factors with strong temporal variability (e.g., salinity and water transparency) and by more
stable factors associated with the structure of the habitat (e.g., sediment granulometry and
depth profile). Anthropogenic factors, such as the presence of a dam lock, also contribute
to the segregation and zonation of the ichthyofauna. The highest abundance and species
39
richness along the estuarine-limnic gradient occur in the natural channel (São Gonçalo)
that connects the mixohaline zone of Patos Lagoon with the freshwater of Mirim Lake.
This pattern seems to be the result of factors that act concomitantly along the longitudinal
and bathymetric axes of the gradient, promoting the confluence of guilds of estuarine and
freshwater species as well as guilds of species that originate in the littoral and limnetic
zones. It is important to highlight that the patterns revealed here might be substantially
altered in the future due to changes in the physical forcing mechanisms (e.g., rain
anomalies and variations in the continental discharge associated with ENSO phases) that
can control the water exchange along the studied gradient (Grimm et al., 1998). Such
changes are expected under a global warming scenario (Schroeder and Castello, 2010). As
shown in previous studies (Garcia et al., 2001, Garcia et al., 2003a, Garcia et al., 2004), the
abundance and diversity of the ichthyofauna in this region are highly sensitive to the
variability and intensity of these physical forcing mechanisms. Therefore, the zonation
pattern described here may be substantially altered in the near future.

40
REFERENCES
Akin, S., Buhan, E., Winemiller, K.O., Yimaz, H., 2005. Fish assemblage structure of
Koycegiz Lagoon-Estuary, Turkey: Spatial and temporal distribution patterns in relation to
environmental variation. Estuarine Coastal and Shelf Science 64, 671-684.
Araújo, F.G., 1996. Composição e estrutura da comunidade de peixes do médio e baixo rio
Paraíba do Sul, RJ. Revista Brasileira de Biologia 56, 111-126. (in Portuguese)
Barletta, M., Barletta-Bergan, A., Saint-Paul, U., Hubold, G., 2003. Seasonal changes in
density, biomass, and diversity of estuarine fishes in tidal mangrove creeks of the lower
Caete Estuary (northern Brazilian coast, east Amazon). Marine Ecology-Progress Series
256, 217-228.
Barletta, M., Barletta-Bergan, A., Saint-Paul, U., Hubold, G., 2005. The role of salinity in
structuring the fish assemblages in a tropical estuary. Journal of Fish Biology 66, 45-72.
Bemvenuti, M.A., Moresco, A., 2005. Peixes: áreas de banhado e lagoas costeiras do extremo
sul do Brasil. ABRH, Porto Alegre, 63 pp. (in Portuguese)
Blaber, S.J.M., 2000. Tropical estuarine fishes: ecology, exploitation and conservation. The
Blackwell Science, Oxford, 372 pp.
Buckup, P.A., Menezes, N.A., Ghazzi, M.S., 2007. Catálogo das espécies de peixes de água
doce do Brasil. Rio de Janeiro, Museu Nacional da Universidade Federal do Rio de
Janeiro, 195 pp. (in Portuguese)
Bulger, A.J., Hayden, B.P., Monaco, M.E., Nelson, D.M., McCormickray, M.G., 1993.
Biologically-based estuarine salinity zones derived from a multivariate-analysis. Estuaries
16, 311-322.
41
Burns, M.D.M., Garcia, A.M., Vieira, J.P., Bemvenuti, M.A., Marques, D.M.L.M., Condini,
V., 2006. Evidence of habitat fragmentation affecting fish movement between the Patos
and Mirim coastal lagoons in southern Brazil. Neotropical Ichthyology 4, 69-72.
Chao, L.H., Pereira, L.E., Vieira, J.P., 1985. Estuarine fish community of the dos Patos
Lagoon, Brazil. A baseline study., in: Yanez-Arancibia, A. (Ed.), Fish community ecology
in estuaries and coastal lagoons: Towards an ecosystem integration, pp. 429–445.
Clarke, K.R., Gorley, R.N., 2006. PRIMER v6: User Manual/Tutorial. Plymouth, UK,
PRIMER-E, 190 pp.
CLM, 1970. Comissão da Lagoa Mirim. Barragem do São Gonçalo: estudo preliminar de
viabilidade, 46 pp. (in Portuguese)
Conover, W.J., 1999. Practical nonparametric statistics, 3 ed. Wiley.
Day, J.W.J., Hall, C.A.S., Kemp, W.M., Yañez-Arancibia, A., 1989. Estuarine ecology,
Wiley, New York, 558 pp.
Figueiredo, J.L., Menezes, N.A., 1978. Manual de peixes marinhos do sudeste do Brasil. II
Teleostei (1). Museu de Zoologia. Universidae de São Paulo, São Paulo, 110 pp. (in
Portuguese)
Figueiredo, J.L., Menezes, N.A., 1980. Manual de peixes marinhos do sudeste do Brasil. III
Teleostei (2). Museu de Zoologia. Universidade de São Paulo, São Paulo, 90 pp. (in
Portuguese)
Garcia, A.M., Vieira, J.P., Winemiller, K.O., 2001. Dynamics of the shallow-water fish
assemblage of the Patos Lagoon estuary (Brazil) during cold and warm ENSO episodes.
Journal of Fish Biology 59, 1218-1238.
42
Garcia, A.M., Raseira, M.B., Vieira, J.P., Winemiller, K.O., Grimm, A.M., 2003a.
Spatiotemporal variation in shallow-water freshwater fish distribution and abundance in a
large subtropical coastal lagoon. Environmental Biology of Fishes 68, 215-228.
Garcia, A.M., Vieira, J.P., Winemiller, K.O., 2003b. Effects of 1997-1998 El Nino on the
dynamics of the shallow-water fish assemblage of the Patos Lagoon Estuary (Brazil).
Estuarine Coastal and Shelf Science 57, 489-500.
Garcia, A.M., Vieira, J.P., Winemiller, K.O., Grimm, A.M., 2004. Comparison of 1982–1983
and 1997–1998 El Nin˜o Effects on the Shallow-water Fish Assemblage of the Patos
Lagoon Estuary (Brazil). Estuaries 27, 905–914.
Garcia, A.M., Bemvenuti, M.A., Vieira, J.P., Marques, D.M.L.M., Burns, M.D.M., Moresco,
A., Condini, M.V.L., 2006. Checklist comparison and dominance patterns of the fish fauna
at Taim Wetland, South Brazil. Neotropical Ichthyology 4, 261-268.
García, M.L., Jaureguizar, A.J., Protogino, L.C., 2010. From fresh water to the slope: fish
community ecology in the Rio de la Plata and the sea beyond. Latin American Journal of
Aquatic Research 38, 81-94.
Geracitano, L.A., 1998. Caracterização de unidades funcionais ontogenéticas a partir das
capturas por unidade de esforço por classe de comprimento (CPUE-CC), e sua aplicação
para Micropogonias furnieri no estuário da Lagoa dos Patos, Brasil. Universidade Federal
do Rio Grande, Rio Grande, p. 104. Unplublished. (in Portuguese)
Grimm, A.M., Ferraz, S.E.T., Gomes, J., 1998. Precipitation anomalies in southern Brazil
associated with El Nino and La Nina events. Journal of Climate 11, 2863-2880.
Helfman, G.S., Collette, B.B., Facey, D.E., Bowen, B.W., 2009. THE DIVERSITY OF
FISHES: Biology, Evolution, and Ecology. Wiley-Blackwell, 736 pp.
Hill, M.O., 1973. Diversity and Evenness - unifying notation and its consequences. Ecology
54, 427-432.

43
Jung, S., Houde, E.D., 2003. Spatial and temporal variabilities of pelagic fish community
structure and distribution in Chesapeake Bay, USA. Estuarine Coastal and Shelf Science
58, 335-351.
Kjerfve, B., 1986. Comparative oceanography of coastal lagoons., in: Wolfe, D.A. (Ed.),
Estuarine Variability. Academic Press, New York, pp. 63-81.
Kremen, C., 1992. Assessing the indicator properties of species assemblages for natural areas
monitoring. Ecological Applications 2, 203-217.
Lowe-McConnell, R.H., 1999. Estudos ecológicos de comunidades de peixes tropicais
(A.E.A.M. Vazzoler, A.A. Agostinho & P.T.M. Cunningham, trad.). Editora da
Universidade de São Paulo, São Paulo. (in Portuguese)
Ludwig, J.A., Reynolds, J.F., 1988. Statistical ecology: a Primer on methods and computing.
John Wiley & Sons, New York, 337 pp.
Macedo-Soares, P.H.M.D., Petry, A.C., Farjalla, V.F., Caramaschi, E.P., 2010. Hydrological
connectivity in coastal inland systems: lessons from a Neotropical fish metacommunity.
Ecology of Freshwater Fish 19, 7-18.
Martino, E.J., Able, K.W., 2003. Fish assemblages across the marine to low salinity transition
zone of a temperate estuary. Estuarine Coastal and Shelf Science 56, 969-987.
Menezes, N.A., Figueiredo, J.L., 1980. Manual de peixes marinhos do sudeste do Brasil. IV.
Teleostei (3). Museu de Zoologia. Universidade de São Paulo, São Paulo, 96 pp. (in
Portuguese
Menge, B.A., Olson, A.M., 1990. Role of scale and environmental-factors in regulation of
community structure. Trends in Ecology & Evolution 5, 52-57.
Mônaco, M.E., Lowery, T.A., Emmett, R.L., 1992. Assemblage of US west coast estuaries
based on the distribution of fishes. Journal of Biogeography 19, 251–267.
44
Raffaelli, D., Karakassis, I., Galloway, A., 1991. Zonation schemes on sandy shores - a
multivariate approach. Journal of Experimental Marine Biology and Ecology 148, 241-
253.
Raseira, M.B., 2003. Análise espaço-temporal da associação de peixes das zonas rasas da
Lagoa dos Patos e região costeira adjacente, Pós Graduação em Oceanografia Biológica,
Dissertação de mestrado, Universidade Federal do Rio Grande, Rio Grande, p. 113.
Unpublished. (in Portuguese)
Reis, R.E., Kullander, S.O., Ferraris, C.J., 2003. Check list of the freshwater fishes of South
and Central America. EDIPUC, Porto Alegre, 742 pp.
Remmert, H., 1983. Studies and thoughts about the zonation along the rocky shores of the
Baltic. Zoologica 22, 121–125.
Rowe, C.L., Dunson, W.A., 1995. Individual and interactive effects of salinity and initial fish
density on a salt marsh assemblage. Marine ecology progress series 128, 271-278.
Rundle, S.D., Attrill, M.J., Arshad, A., 1998. Seasonality in macroinvertebrate community
composition across a neglected ecological boundary, the freshwater-estuarine transition
zone. Aquatic Ecology 32, 211-216.
Sanders, H.L., 1968. Marine benthic diversity - a comparative study. American Naturalist 102,
243-282.
Schroeder, F.d.A., Castello, J.P., 2010. An essay on the potential effects of climate change on
fisheries in Patos Lagoon, Brazil. Pan-American Journal of Aquatic Sciences 5, 320-330.
Seeliger, U., Odebrecht, C., Castello, J., 1997. Subtropical convergence environments: the
coast and sea in the Southwestern Atlantic. Springer Verlag, New York, 306 pp.
Sokal, R.R., Rohlf, F.J., 1995. Biometry: the principles and practice of statistics in biological
research, 3 ed, New York, 887 pp.
45
Sosa-López, A., Mouillot, D., Ramos-Miranda, J., Flores-Hernandez, D., Chi, T.D., 2007. Fish
species richness decreases with salinity in tropical coastal lagoons. Journal of
Biogeography 34, 52-61.
Souza, U.P., Costa, R.C., Martins, I.A., Fransozo, A., 2008. Associações entre as biomassas de
peixes Sciaenidae (Teleostei: Perciformes) e de camarões Penaeoidea (Decapoda:
Dendrobranchiata) no litoral norte do Estado de São Paulo. Biota Neotropica 8, 83-92. (in
Portuguese)
ter Braak, C.J.F., Verdonschot, P.F.M., 1995. Canonical correspondence analysis and related
multivariate methods in aquatic ecology. Aquatic Sciences 57, 255-289.
Vega-Cendejas, M., Santillana, M.H., 2004. Fish community structure and dynamics in a
coastal hypersaline lagoon: Rio Lagartos, Yucatan, Mexico. Estuarine Coastal and Shelf
Science 60, 285–299.
Vieira, J.P., 1991. Ecology of estuarine fish assemblage in Patos Lagoon, Brasil (32°S), and
York River, USA (37°N), with review of zoogeography of fishes in western Atlantic
warm-temperate and tropical estuaries. PhD dissertation, College of Willian and Mary in
Virginia, USA, p. 171.
Vieira, J.P., Musick, J.A., 1993. Latitudinal patterns in diversity of fishes in warn-temperate
and tropical estuarine waters of the western Atlantic. Atlântica 15, 115-133.
Vieira, J.P., Musick, J.A., 1994. Fish faunal composition in warm-temperate and tropical
estuaries of western Atlantic. Atlântica 16, 31-53.
Vieira, J.P., Castello, J.P., 1997. Fish fauna, in: Seelinger, U., Odebrecht, C., Castello, J.P.
(Eds.), Subtropical convergence marine ecosystem. The coast and the sea in the warm
temperate southwestern Atlantic. Spring Verlag, Heidelberg, New York.
46
Vieira, J.P., Castello, J.P., Pereira, L.E., 1998. Ictiofauna, in: Seelinger, U., Odebrecht, C.,
Castello, J.P. (Eds.), Os Ecosistemas Costeiro e Marinho do Extremo Sul do Brasil.
Ecosciencia, Rio Grande, pp. 60-68. (in Portuguese)
Vieira, J.P., 2006. Ecological analogies between estuarine bottom trawl fish assemblage from
Patos lagoon, Rio Grande do Sul, Brazil and York River, Virginia, USA. Revista Brasileira
de Zoologia 23, 234-247.
Vieira, J.P., Garcia, A.M., Moraes, L., 2010. A assembléia de peixes, in: Seelinger, U.,
Odebrecht, C. (Eds.), O Estuário da Lagoa dos Patos. Um século de transformações.
FURG, Rio Grande, pp. 79-88. (in Portuguese)
Winemiller, K.O., Leslie, M.A., 1992. Fish assemblages across a complex, tropical fresh-water
marine ecotone. Environmental Biology of Fishes 34, 29-50.
Zar, J.H., 1996. Biostatistical analysis. Upper Saddle River: Prentice Hall.
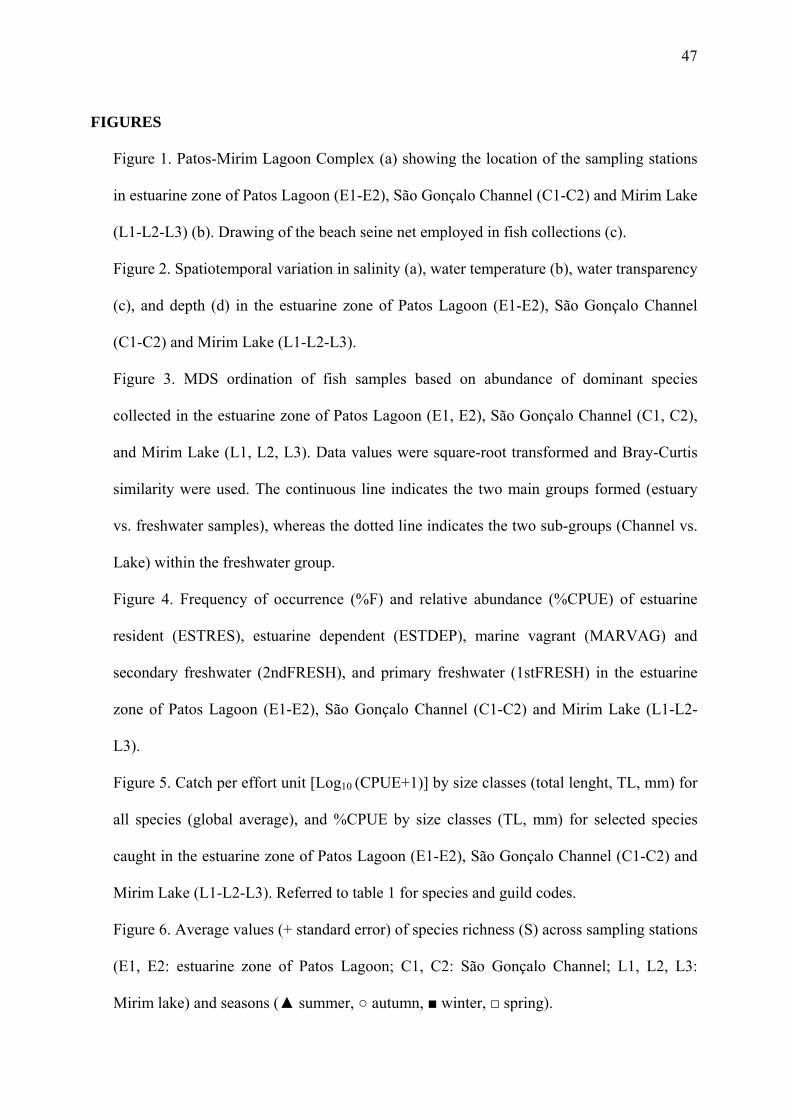
47
FIGURES
Figure 1. Patos-Mirim Lagoon Complex (a) showing the location of the sampling stations
in estuarine zone of Patos Lagoon (E1-E2), São Gonçalo Channel (C1-C2) and Mirim Lake
(L1-L2-L3) (b). Drawing of the beach seine net employed in fish collections (c).
Figure 2. Spatiotemporal variation in salinity (a), water temperature (b), water transparency
(c), and depth (d) in the estuarine zone of Patos Lagoon (E1-E2), São Gonçalo Channel
(C1-C2) and Mirim Lake (L1-L2-L3).
Figure 3. MDS ordination of fish samples based on abundance of dominant species
collected in the estuarine zone of Patos Lagoon (E1, E2), São Gonçalo Channel (C1, C2),
and Mirim Lake (L1, L2, L3). Data values were square-root transformed and Bray-Curtis
similarity were used. The continuous line indicates the two main groups formed (estuary
vs. freshwater samples), whereas the dotted line indicates the two sub-groups (Channel vs.
Lake) within the freshwater group.
Figure 4. Frequency of occurrence (%F) and relative abundance (%CPUE) of estuarine
resident (ESTRES), estuarine dependent (ESTDEP), marine vagrant (MARVAG) and
secondary freshwater (2ndFRESH), and primary freshwater (1stFRESH) in the estuarine
zone of Patos Lagoon (E1-E2), São Gonçalo Channel (C1-C2) and Mirim Lake (L1-L2-
L3).
Figure 5. Catch per effort unit [Log10 (CPUE+1)] by size classes (total lenght, TL, mm) for
all species (global average), and %CPUE by size classes (TL, mm) for selected species
caught in the estuarine zone of Patos Lagoon (E1-E2), São Gonçalo Channel (C1-C2) and
Mirim Lake (L1-L2-L3). Referred to table 1 for species and guild codes.
Figure 6. Average values (+ standard error) of species richness (S) across sampling stations
(E1, E2: estuarine zone of Patos Lagoon; C1, C2: São Gonçalo Channel; L1, L2, L3:
Mirim lake) and seasons (▲ summer, ○ autumn, ■ winter, □ spring).

48
Figure 7. CCA ordination plot. (a) sample sites ( estuarine zone of Patos Lagoon, São
Gonçalo Channel, Mirim Lake) and environmental variables (% fine granulometry, %
organic matter, slope, salinity, water temperature, and water transparency). Each point
represents a single sample station and date (five beach seine hauls at the location for a
given month). (b) Association of fish species with each axis is represented by its score
(plotted) and correlation between environmental variables and axes are represented by the
length and angle of arrows. Refereed to table 1 for species and guild codes.
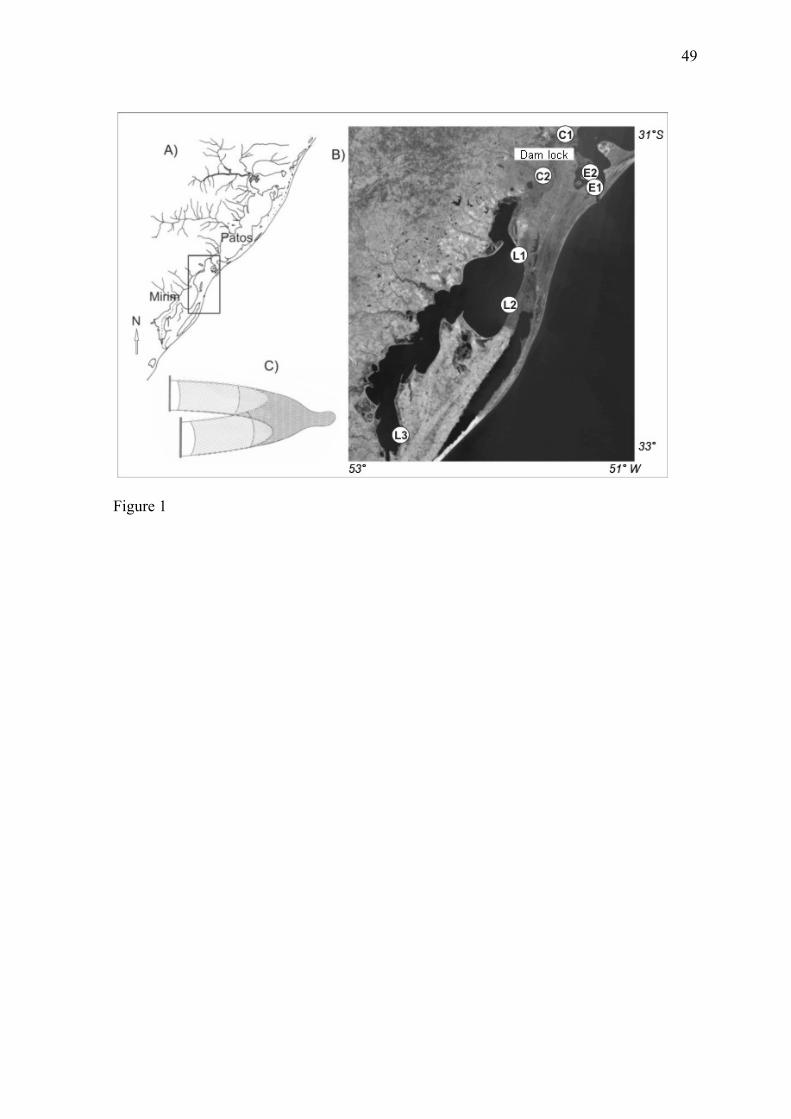
49
Figure 1
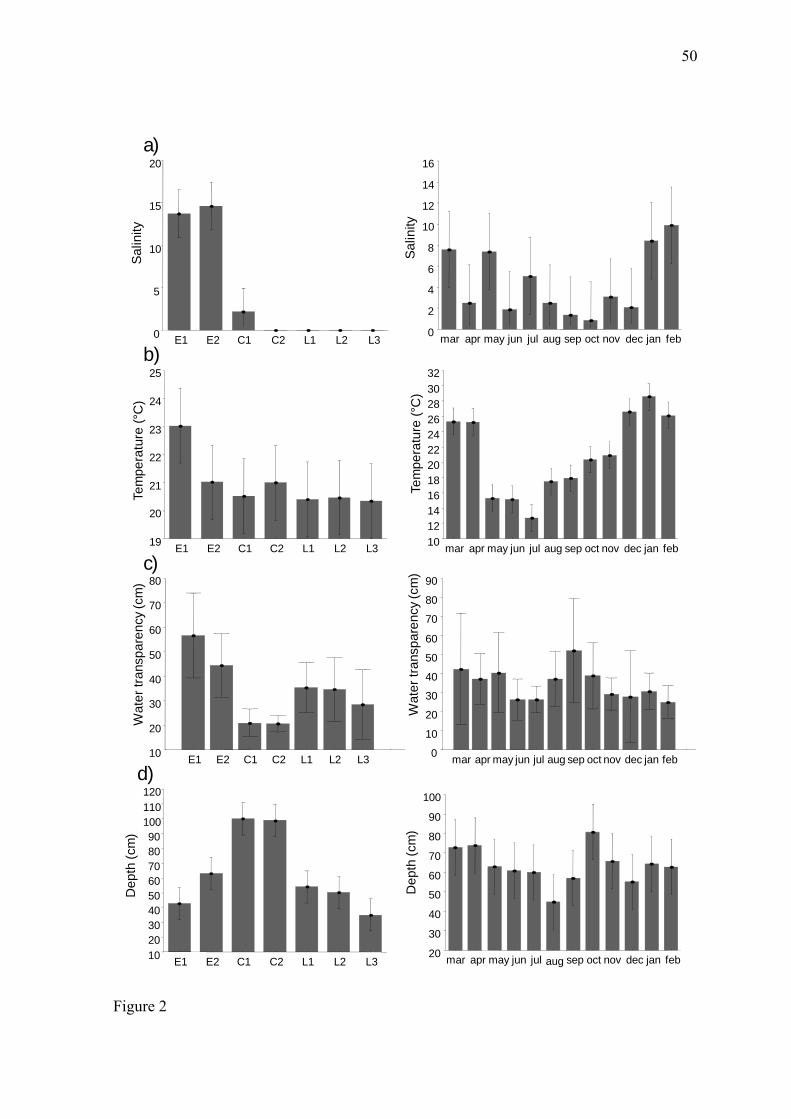
50
a)
b)
c)
d)
E1 E2 C1 C2 L1 L2 L30
5
10
15
20
Salin
ity
mar apr may jun jul aug sep oct nov dec jan feb0
2
4
6
8
10
12
14
16
Salin
ity
E1 E2 C1 C2 L1 L2 L319
20
21
22
23
24
25
Tem
pera
ture
(°C
)
E1 E2 C1 C2 L1 L2 L310
20
30
40
50
60
70
80
Wat
er tr
ansp
aren
cy (c
m)
E1 E2 C1 C2 L1 L2 L3102030405060708090
100110120
Dep
th (c
m)
mar apr may jun jul aug sep oct nov dec jan feb101214161820222426283032
Tem
pera
ture
(°C
)
mar apr may jun jul aug sep oct nov dec jan feb0
10
20
30
40
50
60
70
80
90
Wat
er tr
ansp
aren
cy (c
m)
mar apr may jun jul aug sep oct nov dec jan feb20
30
40
50
60
70
80
90
100
Dep
th (c
m)
Figure 2
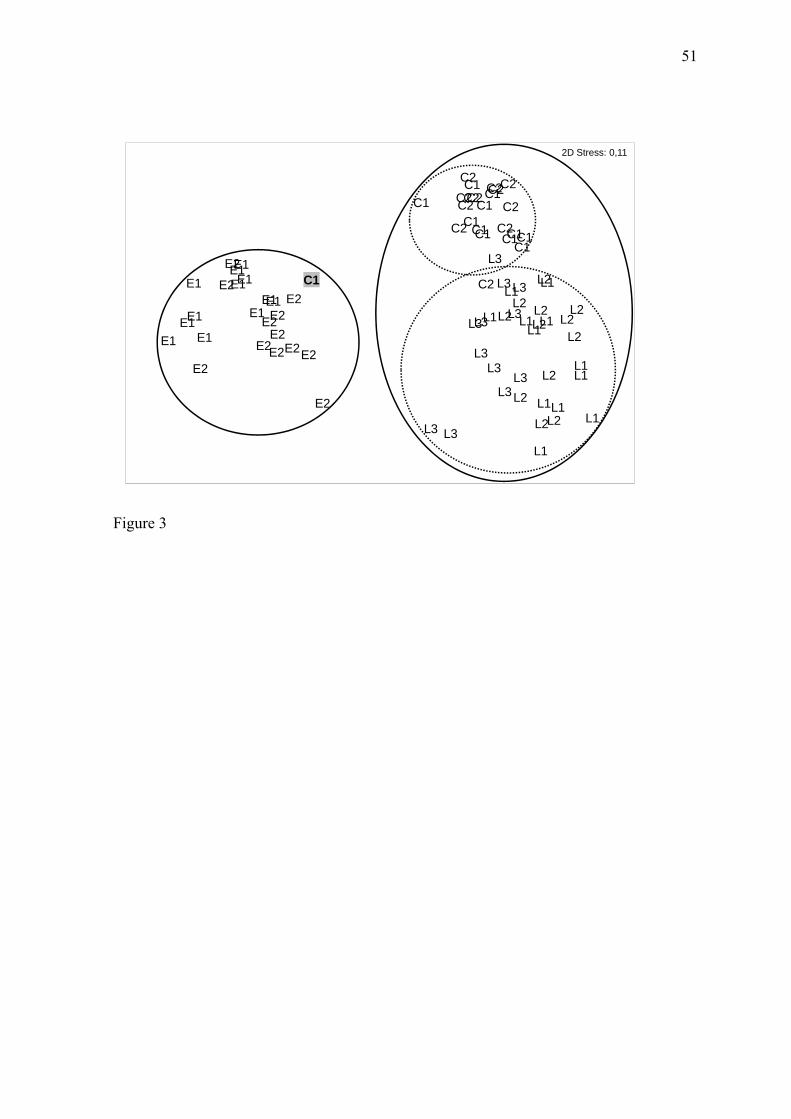
51
E1E1
E1
E1E1
E1
E1
E1E1E1E1
E1
E2
E2E2
E2
E2
E2
E2
E2
E2
E2
E2
E2
C1C1
C1
C1C1C1C1
C1C1C1
C1
C1
C2C2 C2
C2
C2
C2C2C2
C2
C2C2C2
L1
L1
L1L1L1
L1
L1
L1
L1
L1
L1L1L2
L2
L2
L2L2
L2L2
L2
L2L2
L2
L2L3
L3
L3
L3
L3L3
L3
L3
L3
L3
L3
L3
2D Stress: 0,11
Figure 3
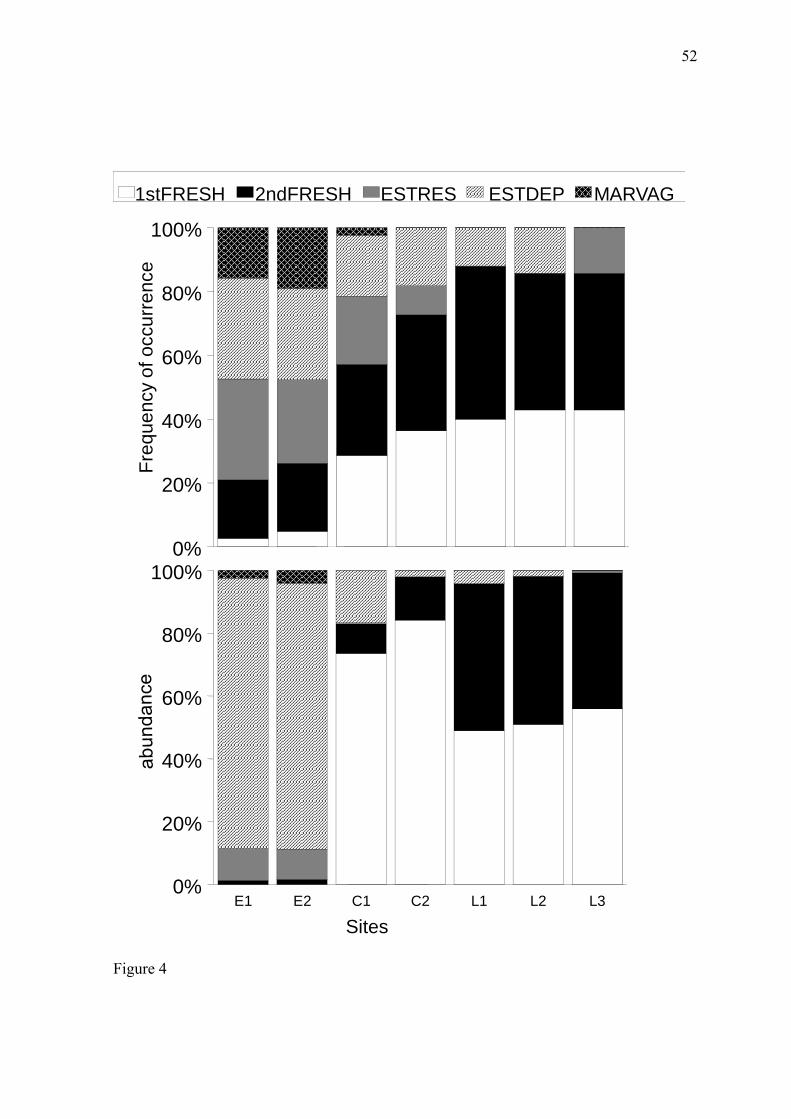
52
E1 E2 C1 C2 L1 L2 L30%
20%
40%
60%
80%
100%0%
20%
40%
60%
80%
100%
1stFRESH 2ndFRESH ESTRES ESTDEP MARVAG
Sites
Freq
uenc
y of
occ
urre
nce
Figure 4
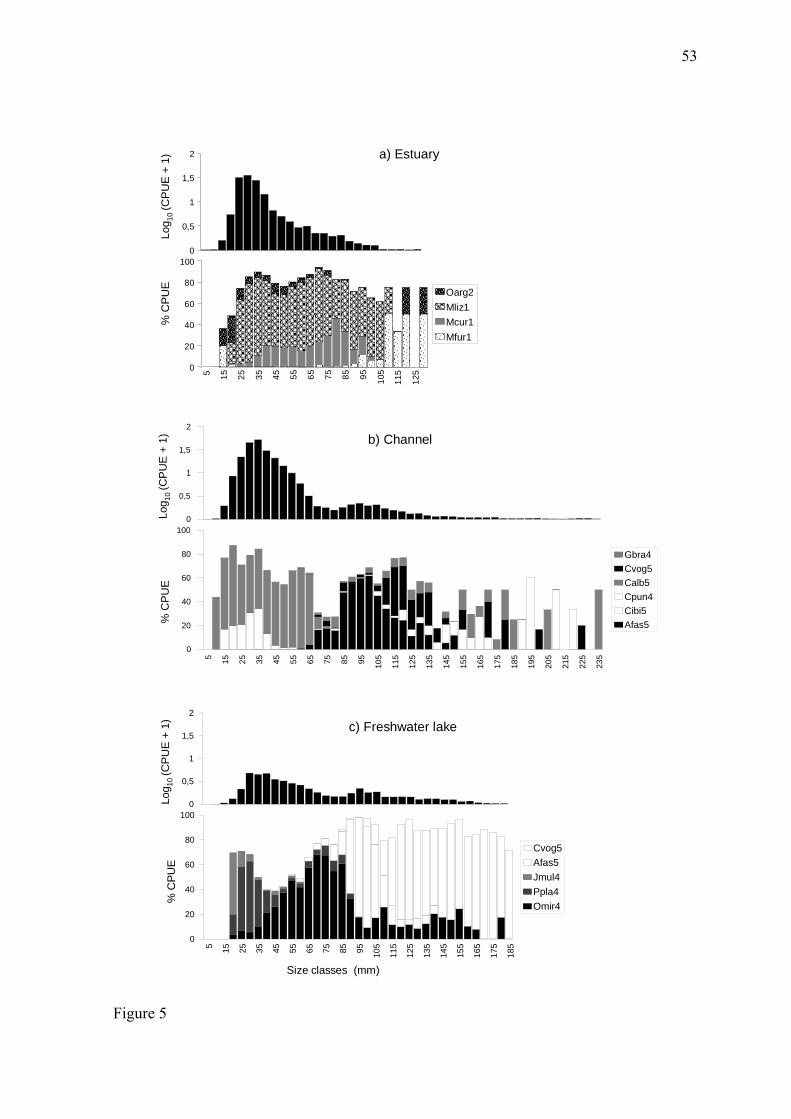
53
Size classes (mm)
Log 1
0 (C
PU
E +
1)
% C
PUE
Log 10
(CP
UE
+ 1
)Lo
g 10
(CPU
E +
1)%
CPU
E%
CPU
E
5 15 25 35 4 5 5 5 6 5 7 5 85 95 105
1 15
125
1 35
145
155
165
175
185
0
20
40
60
80
100
Omir4Ppla4Jmul4Afas5Cvog5
0
0,5
1
1,5
2
c) Freshwater lake
5 15 25 3 5 45 55 65 75 85 95 105
115
125
135
145
155
165
1 75
185
195
205
215
225
235
0
20
40
60
80
100
Afas5Cibi5Cpun4Calb5Cvog5Gbra4
0
0,5
1
1,5
2
b) Channel
5 15 25 35 45 55 65 75 85 95 105
115
1250
20
40
60
80
100
Mfur1Mcur1Mliz1Oarg2
0
0,5
1
1,5
2 a) Estuary
Figure 5

54
E1 E2 C1 C2 L1 L2 L3
Sites
0
5
10
15
20
25
30R
ichn
ess
- S Summer Autumn Winter Spring
Figure 6
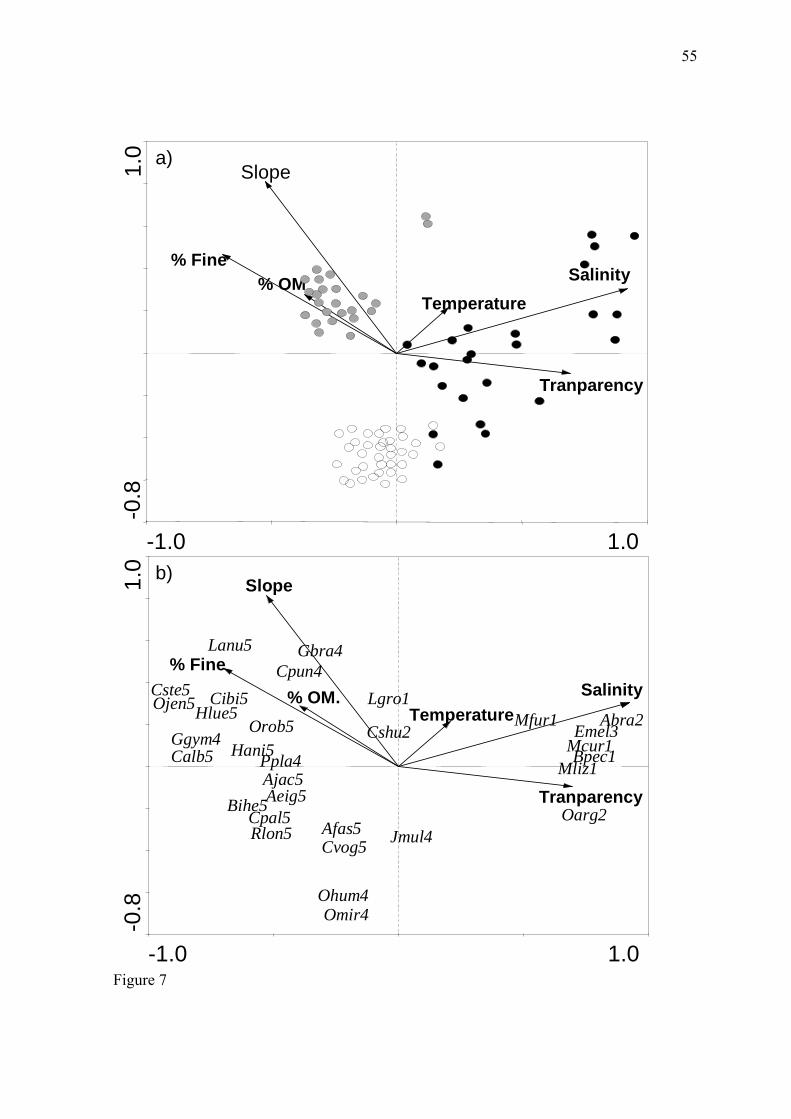
55
% OM
-1.0 1.0
-0.8
1.0
Tranparency
TemperatureSalinity
Slope
% Fine
-1.0 1.0
-0.8
1.0
Aeig5
Afas5
Ajac5
Abra2
Bpec1
Bihe5
Cste5 Cibi5
Cpal5
Cpun4
Cshu2Calb5
Cvog5
Emel3
Gbra4
Ggym4 Hani5
Hlue5
Jmul4
Lanu5
Lgro1Mfur1
Mcur1Mliz1
Oarg2
Ohum4Omir4
Ojen5Orob5
Ppla4
Rlon5
Tranparency
TemperatureSalinity
Slope
% Fine
% OM.
a)
b)
Figure 7
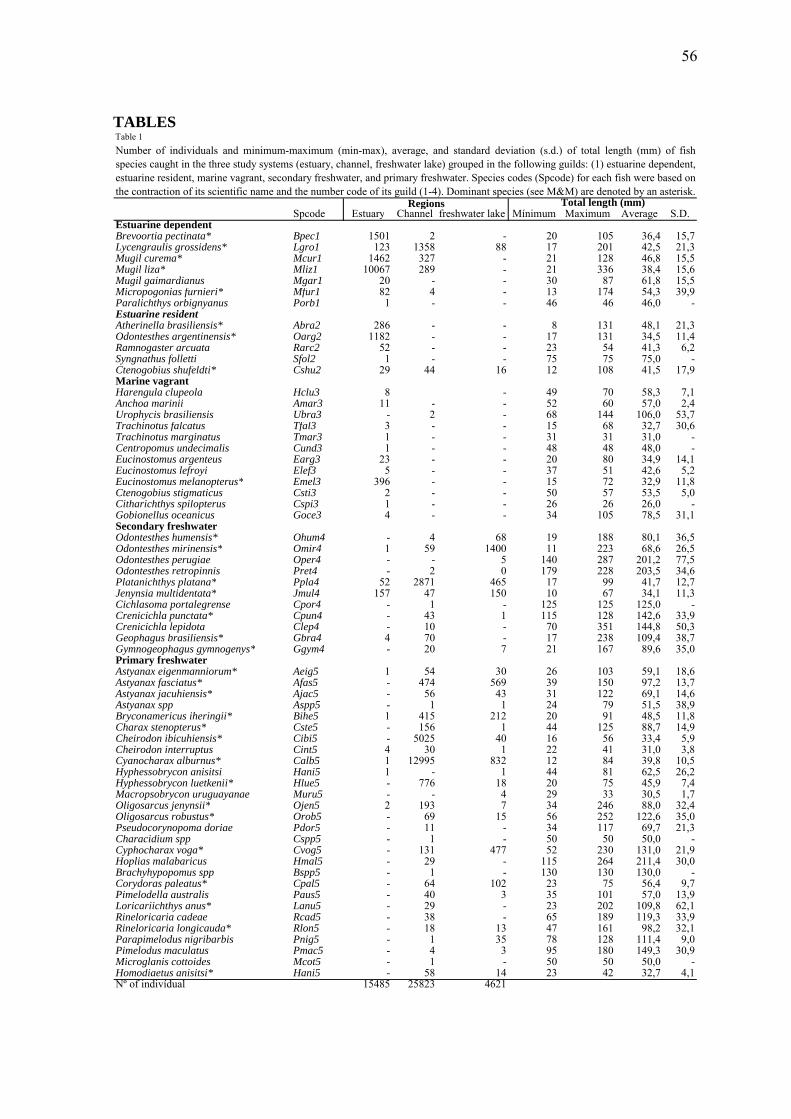
56
TABLES Table 1
Spcode Estuary Channel freshwater lake Mínimum Maximum Average S.D.Estuarine dependentBrevoortia pectinata* Bpec1 1501 2 - 20 105 36,4 15,7Lycengraulis grossidens* Lgro1 123 1358 88 17 201 42,5 21,3Mugil curema* Mcur1 1462 327 - 21 128 46,8 15,5Mugil liza* Mliz1 10067 289 - 21 336 38,4 15,6Mugil gaimardianus Mgar1 20 - - 30 87 61,8 15,5Micropogonias furnieri* Mfur1 82 4 - 13 174 54,3 39,9Paralichthys orbignyanus Porb1 1 - - 46 46 46,0 -Estuarine residentAtherinella brasiliensis* Abra2 286 - - 8 131 48,1 21,3Odontesthes argentinensis* Oarg2 1182 - - 17 131 34,5 11,4Ramnogaster arcuata Rarc2 52 - - 23 54 41,3 6,2Syngnathus folletti Sfol2 1 - - 75 75 75,0 -Ctenogobius shufeldti* Cshu2 29 44 16 12 108 41,5 17,9Marine vagrantHarengula clupeola Hclu3 8 - 49 70 58,3 7,1Anchoa marinii Amar3 11 - - 52 60 57,0 2,4Urophycis brasiliensis Ubra3 - 2 - 68 144 106,0 53,7Trachinotus falcatus Tfal3 3 - - 15 68 32,7 30,6Trachinotus marginatus Tmar3 1 - - 31 31 31,0 -Centropomus undecimalis Cund3 1 - - 48 48 48,0 -Eucinostomus argenteus Earg3 23 - - 20 80 34,9 14,1Eucinostomus lefroyi Elef3 5 - - 37 51 42,6 5,2Eucinostomus melanopterus* Emel3 396 - - 15 72 32,9 11,8Ctenogobius stigmaticus Csti3 2 - - 50 57 53,5 5,0Citharichthys spilopterus Cspi3 1 - - 26 26 26,0 -Gobionellus oceanicus Goce3 4 - - 34 105 78,5 31,1Secondary freshwater Odontesthes humensis* Ohum4 - 4 68 19 188 80,1 36,5Odontesthes mirinensis* Omir4 1 59 1400 11 223 68,6 26,5Odontesthes perugiae Oper4 - - 5 140 287 201,2 77,5Odontesthes retropinnis Pret4 - 2 0 179 228 203,5 34,6Platanichthys platana* Ppla4 52 2871 465 17 99 41,7 12,7Jenynsia multidentata* Jmul4 157 47 150 10 67 34,1 11,3Cichlasoma portalegrense Cpor4 - 1 - 125 125 125,0 -Crenicichla punctata* Cpun4 - 43 1 115 128 142,6 33,9Crenicichla lepidota Clep4 - 10 - 70 351 144,8 50,3Geophagus brasiliensis* Gbra4 4 70 - 17 238 109,4 38,7Gymnogeophagus gymnogenys* Ggym4 - 20 7 21 167 89,6 35,0Primary freshwaterAstyanax eigenmanniorum* Aeig5 1 54 30 26 103 59,1 18,6Astyanax fasciatus* Afas5 - 474 569 39 150 97,2 13,7Astyanax jacuhiensis* Ajac5 - 56 43 31 122 69,1 14,6Astyanax spp Aspp5 - 1 1 24 79 51,5 38,9Bryconamericus iheringii* Bihe5 1 415 212 20 91 48,5 11,8Charax stenopterus* Cste5 - 156 1 44 125 88,7 14,9Cheirodon ibicuhiensis* Cibi5 - 5025 40 16 56 33,4 5,9Cheirodon interruptus Cint5 4 30 1 22 41 31,0 3,8Cyanocharax alburnus* Calb5 1 12995 832 12 84 39,8 10,5Hyphessobrycon anisitsi Hani5 1 - 1 44 81 62,5 26,2Hyphessobrycon luetkenii* Hlue5 - 776 18 20 75 45,9 7,4Macropsobrycon uruguayanae Muru5 - - 4 29 33 30,5 1,7Oligosarcus jenynsii* Ojen5 2 193 7 34 246 88,0 32,4Oligosarcus robustus* Orob5 - 69 15 56 252 122,6 35,0Pseudocorynopoma doriae Pdor5 - 11 - 34 117 69,7 21,3Characidium spp Cspp5 - 1 - 50 50 50,0 -Cyphocharax voga* Cvog5 - 131 477 52 230 131,0 21,9Hoplias malabaricus Hmal5 - 29 - 115 264 211,4 30,0Brachyhypopomus spp Bspp5 - 1 - 130 130 130,0 -Corydoras paleatus* Cpal5 - 64 102 23 75 56,4 9,7Pimelodella australis Paus5 - 40 3 35 101 57,0 13,9Loricariichthys anus* Lanu5 - 29 - 23 202 109,8 62,1Rineloricaria cadeae Rcad5 - 38 - 65 189 119,3 33,9Rineloricaria longicauda* Rlon5 - 18 13 47 161 98,2 32,1Parapimelodus nigribarbis Pnig5 - 1 35 78 128 111,4 9,0Pimelodus maculatus Pmac5 - 4 3 95 180 149,3 30,9Microglanis cottoides Mcot5 - 1 - 50 50 50,0 -Homodiaetus anisitsi* Hani5 - 58 14 23 42 32,7 4,1Nº of indivídual 15485 25823 4621
Number of individuals and minimum-maximum (min-max), average, and standard deviation (s.d.) of total length (mm) of fishspecies caught in the three study systems (estuary, channel, freshwater lake) grouped in the following guilds: (1) estuarine dependent,estuarine resident, marine vagrant, secondary freshwater, and primary freshwater. Species codes (Spcode) for each fish were based onthe contraction of its scientific name and the number code of its guild (1-4). Dominant species (see M&M) are denoted by an asterisk.
Total length (mm)Regions
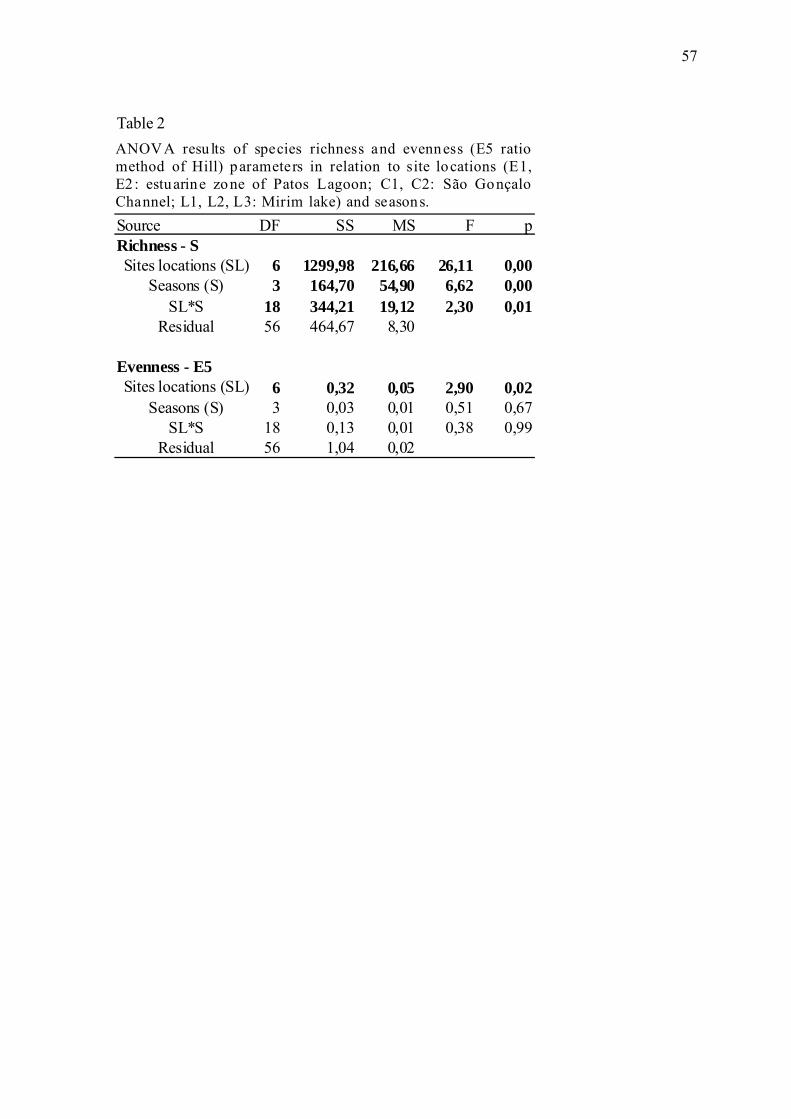
57
Table 2
Source DF SS MS F pRichness - SSites locations (SL) 6 1299,98 216,66 26,11 0,00
Seasons (S) 3 164,70 54,90 6,62 0,00SL*S 18 344,21 19,12 2,30 0,01
Residual 56 464,67 8,30
Evenness - E5Sites locations (SL) 6 0,32 0,05 2,90 0,02
Seasons (S) 3 0,03 0,01 0,51 0,67SL*S 18 0,13 0,01 0,38 0,99
Residual 56 1,04 0,02
ANOV A resu lts of species richness and evenness (E5 ratio method of Hill) parameters in relation to site locations (E1, E2 : estuarine zone of Patos Lagoon; C1, C2: São GonçaloChannel; L1, L2, L3: Mirim lake) and seasons.
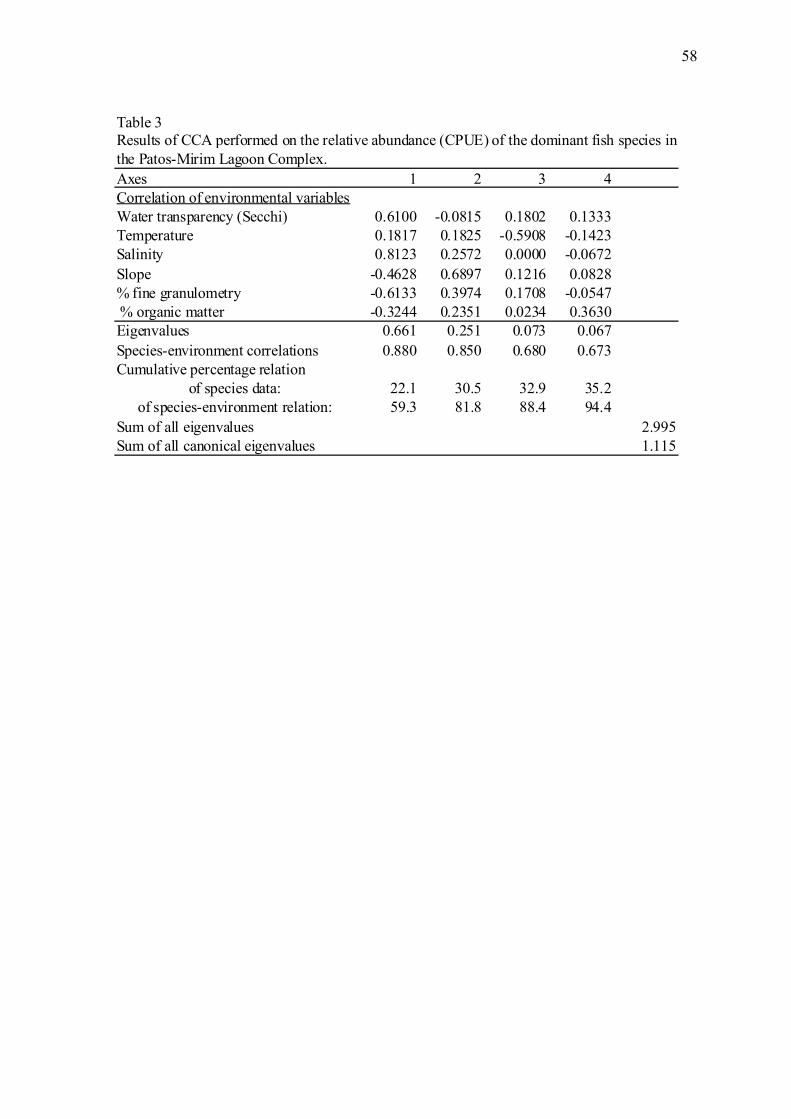
58
Table 3
Axes 1 2 3 4Correlation of environmental variablesWater transparency (Secchi) 0.6100 -0.0815 0.1802 0.1333Temperature 0.1817 0.1825 -0.5908 -0.1423Salinity 0.8123 0.2572 0.0000 -0.0672Slope -0.4628 0.6897 0.1216 0.0828% fine granulometry -0.6133 0.3974 0.1708 -0.0547 % organic matter -0.3244 0.2351 0.0234 0.3630Eigenvalues 0.661 0.251 0.073 0.067Species-environment correlations 0.880 0.850 0.680 0.673Cumulative percentage relation
of species data: 22.1 30.5 32.9 35.2of species-environment relation: 59.3 81.8 88.4 94.4
Sum of all eigenvalues 2.995Sum of all canonical eigenvalues 1.115
Results of CCA performed on the relative abundance (CPUE) of the dominant fish species inthe Patos-Mirim Lagoon Complex.