UNIVERSIDADE FEDERAL DE MINAS GERAIS FACULDADE … 156.pdf · More recent data from ANPEI...
25
UNIVERSIDADE FEDERAL DE MINAS GERAIS FACULDADE DE CIÊNCIAS ECONÔMICAS CENTRO DE DESENVOLVIMENTO E PLANEJAMENTO REGIONAL TEXTO PARA DISCUSSÃO N 156 LESS-DEVELOPED COUNTRIES AND INNOVATION IN HEALTH: NOTES AND DATA ABOUT THE BRAZILIAN CASE Eduardo da Motta e Albuquerque * José Eduardo Cassiolato δ CEDEPLAR/FACE/UFMG BELO HORIZONTE 2001 * Centro de Desenvolvimento e Planejamento Regional-UFMG E-mail: [email protected] δ IE-Universidade Federal do Rio de Janeiro
Transcript of UNIVERSIDADE FEDERAL DE MINAS GERAIS FACULDADE … 156.pdf · More recent data from ANPEI...
UNIVERSIDADE FEDERAL DE MINAS GERAIS
FACULDADE DE CIÊNCIAS ECONÔMICAS
CENTRO DE DESENVOLVIMENTO E PLANEJAMENTO REGIONAL
TEXTO PARA DISCUSSÃO N°° 156
LESS-DEVELOPED COUNTRIES AND INNOVATION IN HEALTH: NOTES AND
DATA ABOUT THE BRAZILIAN CASE
Eduardo da Motta e Albuquerque ∗
José Eduardo Cassiolatoδ
CEDEPLAR/FACE/UFMG
BELO HORIZONTE
2001
∗ Centro de Desenvolvimento e Planejamento Regional-UFMG
E-mail: [email protected]
δ IE-Universidade Federal do Rio de Janeiro
Eduardo da Motta e Albuquerque (*)
José Eduardo Cassiolato (**)
LESS-DEVELOPED COUNTRIES AND INNOVATION IN HEALTH:
notes and data about the Brazilian case(***)
ABSTRACT
This communication discusses the specificity of health innovation in a less-
developed country, investigating the Brazilian case.
To evaluate the specificity of the Brazilian system, this communication presents
data about employment, expenditures, industrial firms in health-related industrial
sectors, scientific resources, and diffusion of medical equipment.
This communication concludes summarising the main characteristics of the
Health Innovation System in Brazil.
RÉSUMÉ
Cette communication discute la spécificité de l’innovation dans le domaine de la
santé aux pays moins developpés à travers de une investigation du cas brésilien.
Pour montrer la spécificité du système brésilien, cette communication presente
des informations sur l’emploi, les dépenses, les firmes industrielles du secteur industriel
de la santé, les ressources scientifiques et la diffusion du équipement médical.
En conclusion la communication fait un résumé des principales caractéristiques
du système d’innovation de la santé au Brésil.
(*) CEDEPLAR-UFMG(**) IE-UFRJ(***) Paper prepared for the 2ème Colloque des Economistes Français de la Santé, Paris,1-2 February 2001
3
I- INTRODUCTION
This communication discusses the specificity of health innovation in a less-
developed country, investigating the Brazilian case.
According to the World Bank (1999) income ranking, Brazil is classified as a
country with upper middle income (8th GNP and 72nd GNP per capita). According to the
World Health Organisation (2000), Brazil is classified as the 125th country in terms of
overall health system performance.
This communication presents an initial investigation about the Brazilian health
innovation system. This sectoral system of innovation is an intersection between the
welfare system and the innovation system (Albuquerque & Cassiolato, 2000). In the
Brazilian case there is an overlapping of an uneven and incomplete welfare system
(WHO, 2000) and an immature system of innovation (Albuquerque, 1999).
The objective of this communication is to evaluate the Brazilian health
innovation system using data and statistical information recently collected.
II- THE SPECIFICITY OF THE HEALTH INNOVATION SYSTEM IN
DEVELOPED COUNTRIES
The theoretical possibility of division of a National System of Innovation (NSI)
into its constitutive sectors (Breschi & Malerba, 1997) introduces the investigation
about the Health Innovation System.
Rosenberg, Gelijns & Dawkins (1995) and Hicks & Katz (1996) are studies that
introduced this line of research, and provided the main points of this section.
The Health Innovation System, in countries like United States (with a mature
system of innovation), has distinctive features vis-à-vis others sectoral subsystems of
innovation.
A survey of the literature points seven key distinctive characteristics of a Health
Innovation System.
First, there is the close intertwining of science and technology in medical
technology. Nelson (1995, p. 220) evaluates that “the advent of modern biotechnology
certainly has exacerbated the intertwining problem, but the intertwining has been there
for a long time”. Klevorick et alli (1995) indicate that the health-related industrial
sectors are highly “science-based”.
4
Second, the interdisciplinary nature of the research that supports medical
innovation. Gelijns & Rosenberg (1995, p. 4) put forward that “the successful
development of a particular technology frequently requires close co-operation among a
growing number of individuals with diverse but relevant professional backgrounds. In
the case of pharmaceutics and biology, for example, the development of a drug may
require co-operation among organic chemists, molecular biologists, immunologists,
material scientists, toxicologists, chemical engineers, clinicians and so on. In the case of
medical devices, the interdisciplinary nature of innovation appears even more obvious”.
Third, the strong involvement of the public sector in financing research in the
health sector (Bond & Glynn, 1995).
Fourth, the relevance of interactions between health sector’s firms and
institutions, specially for medical device innovation. Gelijns & Rosenberg (1995, p. 5)
show the role of the “crossing of institutional boundaries”, concluding that “medical
innovation depends heavily on interactions between universities, particularly academic
medical centres, and industrial firms”.
Fifth, the strong user-producer links for innovation and improvements in the
health sector. Hospitals and physicians play key roles in these user-producer interactions
(for example, Spetz, 1995).
Sixth, there are several patterns of technological progress within the health
sector. These patterns differentiate sectors strongly dependent upon university research
(biotechnology) from sectors dependent upon interactions among different industries
and health professionals (medical device).
Finally, the health sector may be seen as an intersection between the innovation
system and the welfare system. Hospitals, for example, might be simultaneously part of
the welfare system and part of the innovation system (Hicks & Katz, 1996). This
distinctive feature is very important, as it indicates how innovations and improvements
in the health sector may have significant impacts upon the people’s welfare.
Figure I summarises the Health Innovation System’s institutions and the
interactions among them.
This summary about the Health Innovation System in developed countries
presents a benchmark for the investigation of the health sector in less-developed
countries.
5
III- INSTITUTIONS AND DATA ABOUT THE BRAZILIAN HEALTH SYSTEM OF
INNOVATION
The main features of the Brazilian Health Innovation System reflect the
immaturity of the Brazilian NSI. On the one hand, the weaknesses of the Brazilian NSI
might impair the evolution of the Health Innovation System. But, on the other hand,
probably, there might be room for sectoral industrial and public policies taking
advantage of “windows of opportunity”.
This communication suggests that the Brazilian Health Innovation System is less
articulated than the system displayed at Figure I. There are four reasons for this.
First, the institutions of the Brazilian Health Innovation System are not as
developed or strong as in developed countries.
Second, it lacks firms in health-related industrial sectors, or the established firms
in these sectors are not dynamic and innovative.
Third, the interactions among firms, institutions and physicians are not as
developed as in mature NSIs.
Fourth, as an intermediate system of innovation, there are potentialities to be
exploited.
This sections is divided into five subsections, investigating each of the
constitutive dimensions of the Brazilian Health Innovation System, using available
statistical data.
III.1- HEALTH SECTOR: GENERAL DATA, PROFESSIONALS AND
EXPENDITURES
According to the World Bank (1993), Brazilian expenditures with health are
4,2% of GDP. Table I shows data for developed countries (United States tops the list
with 13,3% of GDP) and Brazil. The public sector involvement with health expenditures
(33,3%) is similar to the average of countries with high “index of human development”
(PNUD, 1996).
The size of the Brazilian health sector (measured by formal employees),
according to Girardi (1998) is shown in Table II. Girardi defines the “health macro-
sector” aggregating employees from all health-related activities: industrial sectors of
pharmaceutics and medical devices, the commercialisation of these products (wholesale
and retail trade), health insurance, sanitation, services of medical and health care, health
professionals in education and R&D, and health professionals in other activities. Table
6
II shows that the health sector has 2,457,969 formal employees (10.31% of formal jobs
in the Brazilian economy). The health services alone have 1,779,178 formal employees
(7.47% of formal jobs).
These professionals are unevenly distributed. For example, the state of São
Paulo has 3.5 physicians per 1,000 inhabitants, while the state of Amazonas has only
1.3 physicians per 1,000 inhabitants (IBGE, 2000a). This inequality of resources and
access can be found also at local level: certainly, the richest strata have more access to
high quality services than the poorest strata.
Table III indicates the role public and private sectors in the provision of medical
care. The public sector, through the Sistema Único de Saúde (SUS) provides universal
coverage. It is important to stress that SUS provides both simple services for the poor
and high-quality and complex medical procedures for poor and rich citizens. Table IV
shows how the public sector (state and universities) delivers 60% of ambulatory
services (expenditures as a proxy) and 39% of hospital services.
Finally, Table V shows the epidemiological profile of Latin American and
Caribbean countries vis-à-vis developed and Sub-Saharian countries (World Bank,
1993).1 The Brazilian epidemiological profile is similar to the Latin American and
Caribbean countries, possibly with a greater share of non-communicable diseases and a
smaller share of communicable diseases than Latin American and Caribbean countries.
Brazil has a distinctive feature in this regard, as it mixes characteristics shared with
more developed countries (the importance of non-communicable diseases) and
characteristics shared with less-developed countries (the persistence of communicable
diseases).
This uneven epidemiological profile presents specific demands for the health
innovation system.
III.2- INDUSTRIAL FIRMS OF THE HEALTH SECTOR AND THEIR
INNOVATIVE ACTIVITIES
III.2.a- GENERAL DATA: EMPLOYMENT, REVENUES
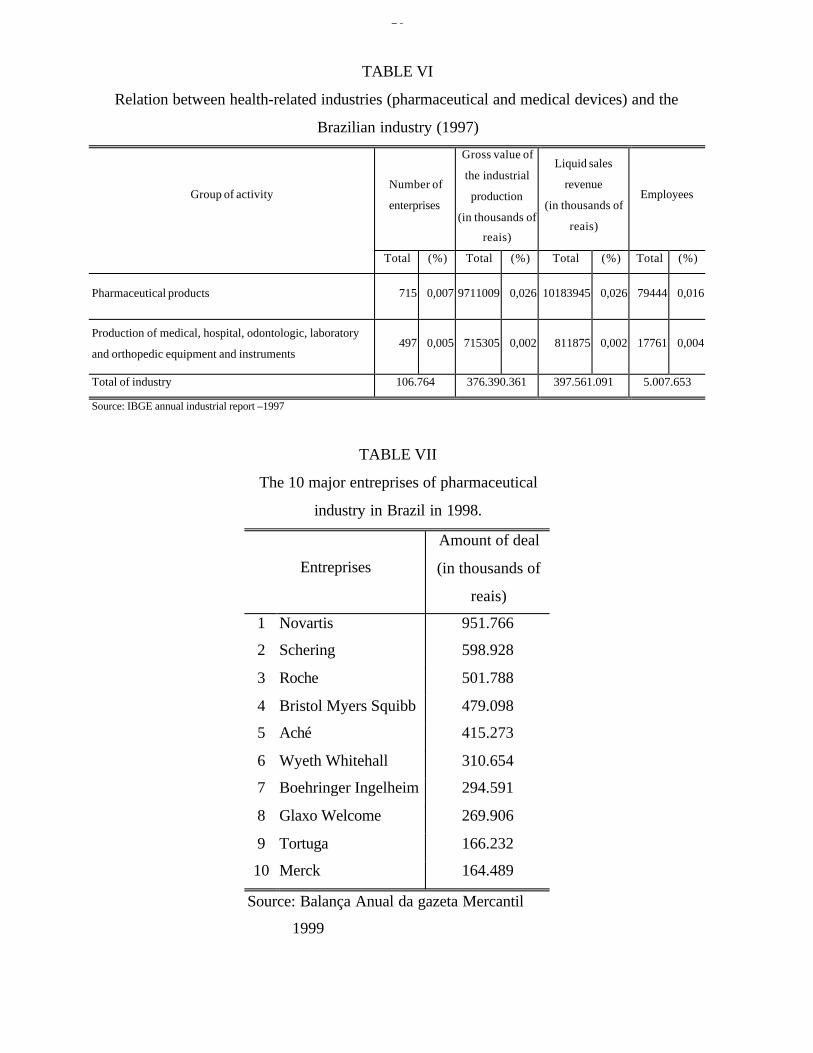
Table VI shows data for pharmaceutical products and medical and dentistry
devices.
1 The data for Brazil is not available.
7
The pharmaceutical sector (three-digit classification) has 715 firms (out of
107,764 manufacturing firms – 0.7%), produces 2.6% of the industrial product, and
employs 1.6% of the industrial employment (IBGE, 2000b). This sector is less
concentrated than the Brazilian high-tech industry average: the concentration ratio (CR)
for the four leading firms (CR4) is 21.0%, and the CR12 is 41.7%, while the figure for
the Brazilian high-tech industry is CR4 = 62.6%. The mark-up (ratio between net
revenues and direct costs) is 2.5 (one of the highest in the Brazilian manufacturing,
which has the average value of 1.7). The leading firms are shown in Table VII. It is
important to highlight the role of foreign-owned firms in this list.
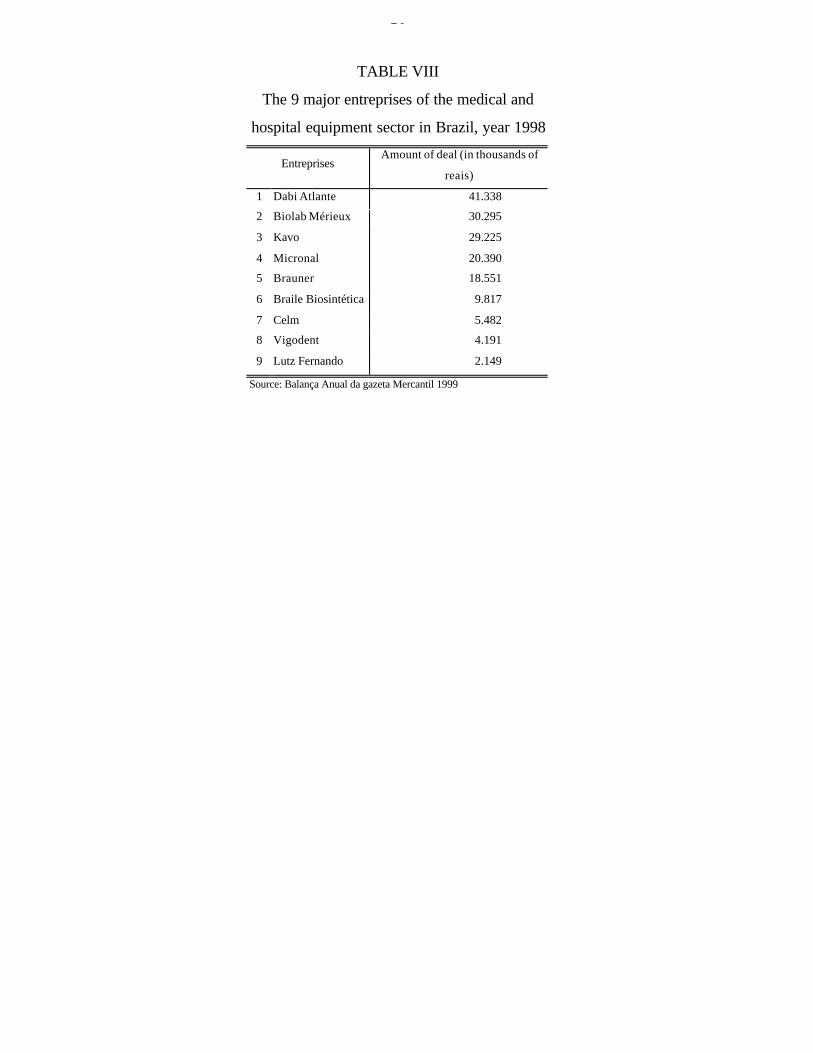
The medical and dentistry devices industry has 497 firms (0.5%), with 0.2% of
industrial product, 0.2% of manufacturing net revenue and 0.4% of employment. The
CR4 is 31.2%, and the CR12 is 47.3%. The mark-up is also high: 2.3. The leading firms
are at Table VIII.
III.2.b- R&D EXPENDITURES
There are no reliable figures for R&D private expenditures in the Brazilian
industry (this year the IBGE is programming a special inquiry about industrial R&D).
Estimates from the Ministry of Science and Technology indicates that the private sector
has 20 to 30% of the country’s R&D. The literature reports little commitment of the
private sector with innovative efforts (Matesco, 1994).
The literature reports the leading role of the pharmaceutical sector in R&D
investments in developed countries (Scherer & Ross, 1990). However, in Brazil,
according to an Industrial Census (IBGE, 1985), the pharmaceutical sector invested in
R&D less than the national (low) average: 0.43% and 0.53%, respectively, of net
revenues. More recent data from ANPEI (Andreassi, 1997) show that the
pharmaceutical firms invest less than the national average in R&D.
Data from ANPEI show that the medical device industry invests 5,5% of its
sales in R&D.
III.2.c- EVALUATING THE INTERNALISATION OF TECHNOLOGICAL
ACTIVITIES BY TRANSNATIONAL CORPORATIONS
Given the importance of foreign-owned firms in health-related industries, this
subsection presents a tentative analysis of the contributions of transnational corporations
for local innovative activities.

8
Biazzi & Albuquerque (2001) use patent statistics to calculate an index of
“relative internalisation of technological activities” (RITA). The steps to calculate this
index are as follows.
Using data provided by the INPI, a database is organized, with 57,640 resident
patents and 54,480 non-resident patents applied between 1988 and 1996. This new
database provides a comparison between non-resident patents applied by one
transnational headquarters and the resident patents applied by its subsidiaries. The unity
of analysis is the transnational corporation. A few steps are necessary for this
comparison. First, information provided by the Guia Interinvest 1998 enables the
identification of the link between a transnational and its subsidiaries. Second, the
database is searched to gather the non-resident patents applied by the headquarters and
the resident patents applied by their subsidiaries. Third, the index RITA is calculated,
dividing the subsidiaries’ resident patents by the transnational’s non-resident patents.
The intuition behind this index has two-side(s). On one hand, the index RITA
captures both the relevance of the Brazilian market for the multinational and its
technological capability. If a multinational firm considers the Brazilian market
important and if this multinational has a huge technological capability (with a big patent
portfolio), it is supposed that this corporation applies a great number of non-resident
patents at the INPI. On the other hand, if the subsidiaries perform significant
technological activities in the host country, it has a significant number of resident
patents.
Therefore, this index compares two magnitudes and permits a comparative
analysis: the resident patents of the subsidiaries indicate the technological effort made in
the host country, and the non-resident patents indicate the potential contribution of the
transnational to the host country. The RITA index, comparing the two magnitudes, hints
whether or not the transnational is internalising all its potential technological capability.
The relative dimension of this index must be stressed.
Investigating the technological activities of the 500 biggest global corporations
(Fortune 500, 1998) and of the 100 most transnationalised corporations (UNCTAD,
1998), the RITA index for the firms operating in Brazil (respectively 152 and 69 global
corporations with non-resident patents applied in the INPI) was 0.064 and 0.072
(Albuquerque, 2000b). These findings, at the firm level, are compatible with the overall
figures for resident and non-resident patents (WIPO, 1999): the non-developed
9
economies show a greater disparity between these two data sets, contrasting with more
even figures for the developed countries.
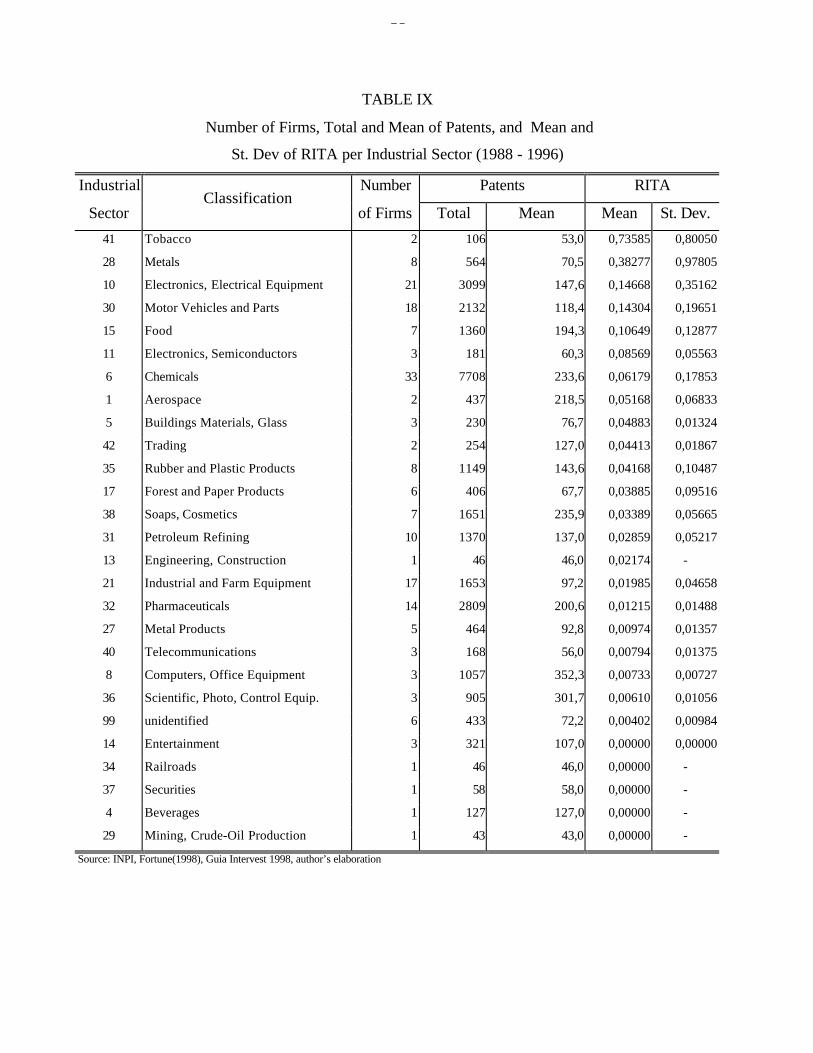
Table IX shows the values of RITA for 27 sectors (according to Fortune’s 500
classification). The RITA index for the pharmaceutical sector (0.01215) is less than the
national average for non-financial firms (0.064). These figures suggest that the actual
contribution of transnational corporations of the pharmaceutical sector is less than their
potential contribution (measured by their non-resident patents).
III.2.d- SCIENTIFIC RESOURCES
Brazil produced in 1994 0.74% of the world scientific papers (according to the
Institute for Scientific Information) and 0.06% of the patents granted by the USPTO.
This imbalance suggests that the productive sector is wasting opportunities created by
the existing scientific infrastructure. This waste of opportunities is a common
characteristic of other immature systems of innovation (Albuquerque, 1999).
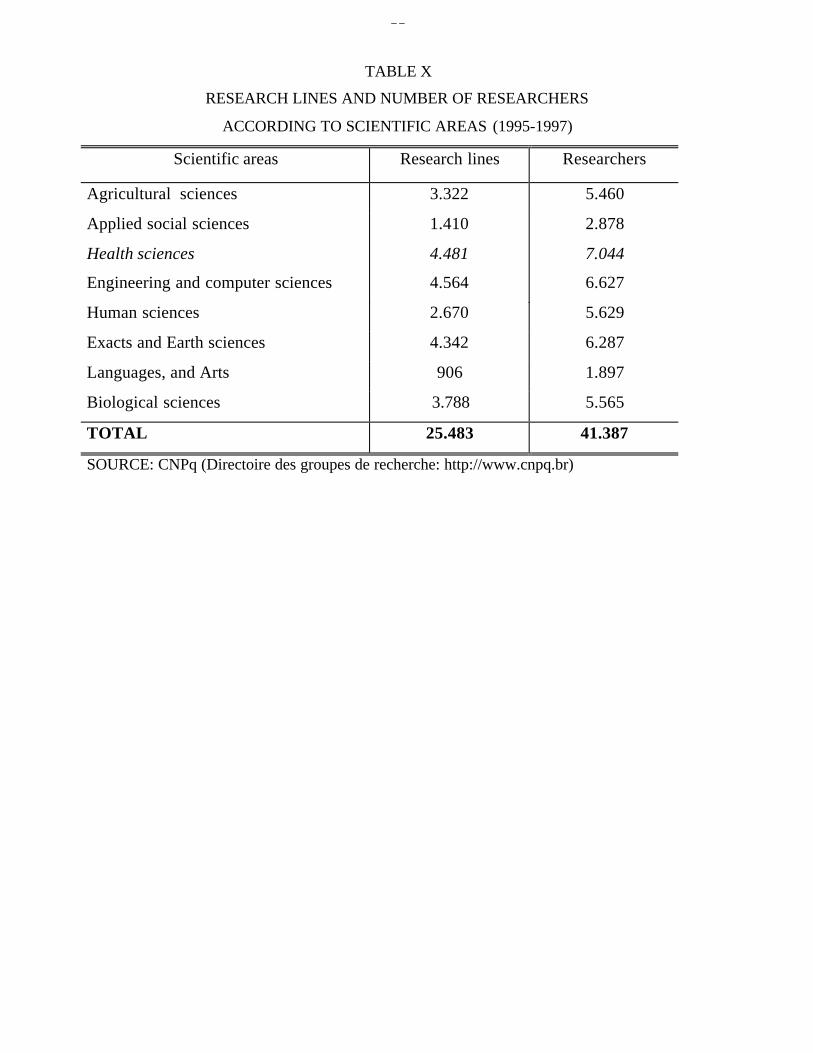
Table X shows the distribution of researchers by scientific areas, according to
the Conselho Nacional de Pesquisa (CNPq). These preliminary data refer to researchers
mainly in universities and research institutes. Health Sciences rank first among the
scientific areas, with 7,044 researchers out of 41,387. Adding the 5,565 researchers in
Biological Sciences, the health-related disciplines have 30.47% of the Brazilian
researchers.
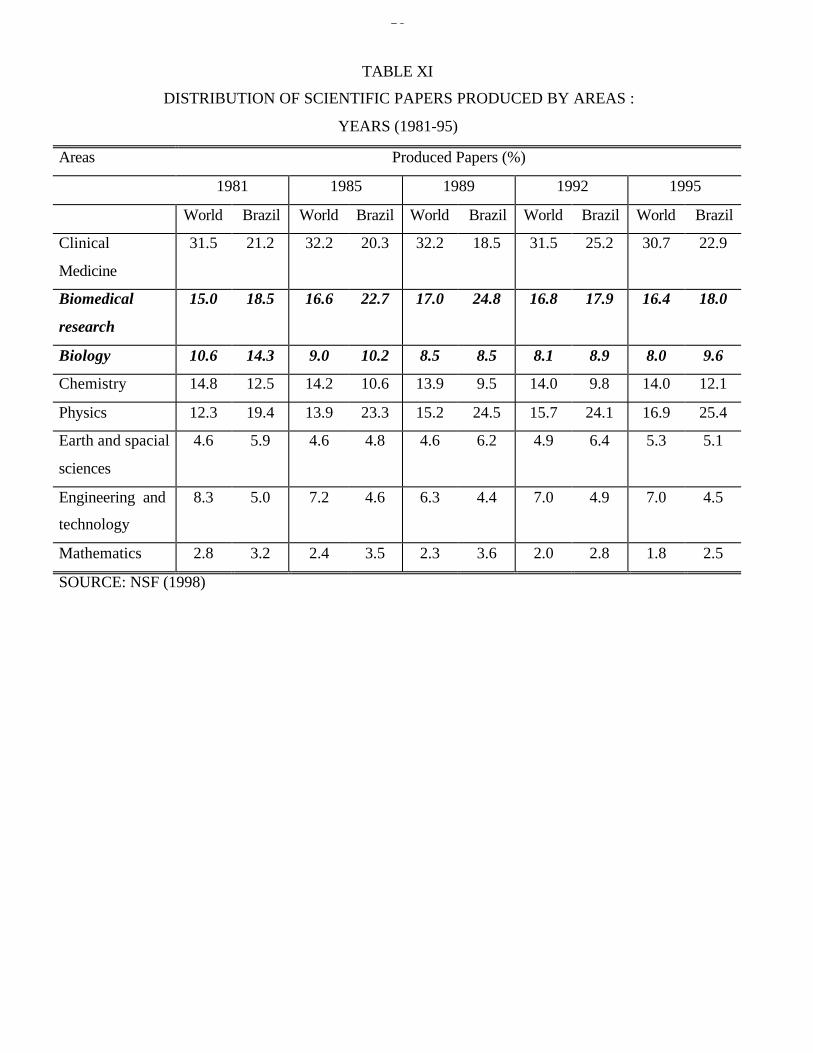
Table XI shows the distribution of scientific papers produced by Brazilian
scientists according to their scientific areas. This table indicates the relative
specialisation of Brazilian science vis-à-vis the World’s averages. In Clinical Medicine,
the Brazilian share is less than the World share (respectively 22.9% and 30.7%, for
1995). In Biomedical research (18.0%) and in Biology (9.6%) the Brazilian shares are
slightly bigger than the World share for these disciplines (respectively 16.4% and 8.0%,
for 1995).
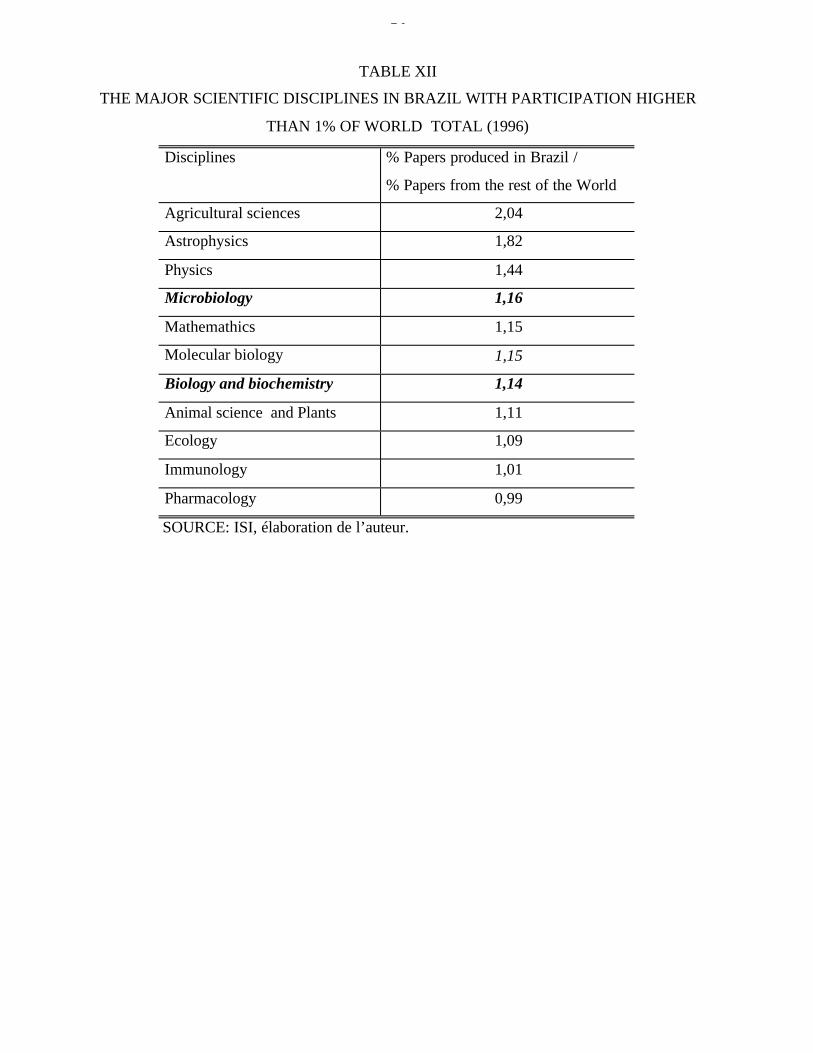
Table XII shows data, at a more desaggregated level, of scientific disciplines
with more than 0.98% of the World papers. Agricultural sciences, Physics and
Astrophysics top the list, but there are several disciplines health-related: Microbiology
(1.16%), Molecular Biology (1.15%), Biology and Biochemistry (1.14%), Animal
Science and Plants (1.11%), Immunology (1.01%), and Pharmacology (0.99%).

10
Table XIII shows data, at an even more desaggregated level, of scientific
subdisciplines with more than 0.74% of the World papers. Six subdisciplines of Clinical
Medicine and three of Biomedical Research reach this share.
These data suggest that the Brazilian scientific infrastructure has a relative
specialisation in disciplines health-related. This relative specialisation could be useful
for the maturing of the Brazilian Health Innovation System.
This scientific infrastructure has a double role to play.
First, it is key for the “absorptive capability” of the innovation system. Recent
achievements like the sequencing of the Xylella fastidiosa gene indicates that the
Brazilian scientific community in the Health sector is able to be up-to-date with the
international community (Nature, 2000). This achievement is very important for future
developments in Biotechnological fields, that might spill-over towards industrial firms.
Second, local capabilities are necessary for the research of diseases that are not
top priority in the agenda of developed countries’ firms and institutions: Chagas disease,
leishmaniasis, etc.
It seems that the Brazilian scientific infrastructure in health-related disciplines
can play this double role.
III.2.e- DIFFUSION OF MEDICAL INNOVATION THROUGHOUT THE
HEALTH SECTOR
According to Pan-American Health Organisation (PAHO, 1998) Brazil
represents 1.7% of the World consumption of medical and hospital equipment (US$ 2.0
billion).
PAHO (1998) estimates that resident firms supply 60% of this equipment. The
role of imports is important, specially for more complex and high-tech equipment. A
case-study of one philanthropic hospital (Santa Casa of Belo Horizonte) shows the
relevance of imports from companies like Hewlett Packard (monitoring systems,
pressure transducers, echocardiographs), Dräger (anaesthetic equipment), Siemens (X-
rays) etc (Albuquerque & Cassiolato, 2000).
The diffusion of high-tech innovations generated abroad seems to be fast.
According to the IBGE (2000a), in 1999 Brazil had 1,555 computed tomography (CT)
scanners, and 289 magnetic resonance imaging (MRI) devices. The pattern of
distribution of these resources are uneven: São Paulo has 1.47 CT scanners per 100,000
inhabitants, while Amazonas has 0.3 CT scanners per 100,000 inhabitants.
11
III.3- INITIAL EVALUATION OF THE DATA PRESENTED
Taking as reference Figure I, the data presented in this section suggest that
Brazil has all components of a Health Innovation System. However, these components
are not completely developed (few firms in health-related sectors, medical care
institutions with limitations, health expenditures are less than the developed countries’
average etc). This incomplete development of the main components of a Health
Innovation System determines an additional problem with the interactions and
technological flows throughout the system. Furthermore, weak interactions impair the
dynamics of positive feedbacks among the institutions of the system.
But, it should be kept in mind, there are “islands of efficiency and welfare”
within the Brazilian Health Innovation System. This is a problem (social inequalities
and their consequences) but could be a promise, as the more advanced
components/regions would pull the less advanced ones.
IV- CONCLUSION: THE MAIN CHARACTERISTICS OF THE HEALTH
INNOVATION SYSTEM IN BRAZIL
This communication presents initial results from an ongoing research. The data
gathered indicates few distinctive and special characteristics of the present state of
development of the Brazilian Health Innovation System:
a) less resources (public and private) devoted to health R&D vis-à-vis the
developed countries;
b) lack of dynamic and innovative local firms in the industries related to the
health systems;
c) strong presence of transnational corporations in the medical device and
pharmaceutical industries, and a weak commitment of their subsidiaries with
local R&D;
d) the important role of imports of medical equipment;
e) a passive and unorganised absorption of new technologies from abroad,
resulting in a waste of resources from the health system;
f) an important initial accumulation of scientific resources in the health-related
disciplines, that could be useful to improve the absorptive capability of the
Brazilian system;
12
g) the scientific infrastructure available could be better used by the productive
sector, as a source of public knowledge that supports innovation;
h) weakness in the interactions among the scientific infrastructure, the firms
and the health system;
i) weakness of the regulatory institutions;
j) the resources accumulated by the scientific infrastructure might be important
for taking advantage of “windows of opportunity” in the sector and for the
institutional building leading to an active and organised process of
technological transfer from abroad.
These points are a starting point. They summarise few major differences
between the dynamics of innovation in health in developed countries, as described by
the literature (Rosenberg et alli, 1995; Weisbrod, 1991; Hicks & Katz, 1996), and in
less-developed countries, taking the Brazilian case as an example.
Given the huge welfare impacts of improvements in the health innovation
system, its formation and development should be a top priority for policy makers.
V- REFERENCES
ALBUQUERQUE, E. (1999) National systems of innovation and non-OECD countries:notes about a tentative typology. Revista de Economia Política, v. 19, n. 4, pp. 35-52.
ALBUQUERQUE, E.; CASSIOLATO, J. E. (2000) As especificidades do sistema deinovação do setor saúde: uma resenha da literatura como introdução a umadiscussão sobre o caso brasileiro. São Paulo: FeSBE (Estudos FeSBE I).
ANDREASSI, T. (1997) Expenditures in technological innovation: a study in Braziliancompanies. Brighton: SPRU (mimeo).
BIAZZI, E.; ALBUQUERQUE, E. (2001) Transnational corporations and patentingactivities: data description and statistical tests about the relative internalisation oftechnological activities. DRUID Academy Winter Conference, January 18-20,2001, Copenhagen, Denmark (www.business.auc.dk/druid/conference/winter2001)
BOND, E.; GLYNN, S. (1995) Recent trends in support for biomedical research anddevelopment. In: ROSENBERG, N.; GELIJNS, A.; DAWKINS, H. Sources ofmedical technology: universities and industry (Medical innovation at thecrossroads, v. 5). Washington: National Academy.
BRESCHI, S.; MALERBA, F. (1997) Sectoral innovation systems: technologicalregimes, schumpeterian dynamics, and spatial boundaries. In: EDQUIST, C. (ed.).Systems of Innovation: technologies, institutions and organizations. London: Pinter,pp. 130-156.
GELIJNS, A.; ROSENBERG, N. (1995) The changing nature of medical technologydevelopment. In: ROSENBERG, N.; GELIJNS, A.; DAWKINS, H. Sources of
13
medical technology: universities and industry (Medical innovation at thecrossroads, v. 5). Washington: National Academy.
GIRARDI, S. (1999) Aspectos do(s) Mercado(s) deTrabalho em Saúde no Brasil-Estrutura, Dinâmica, Conexões: NESCON-UFMG: Belo Horizonte
HICKS, D.; KATZ, J. (1996) Hospitals: the hidden research system. Science and PublicPolicy, v. 23, n. 5, pp. 297-304, Oct.
IBGE (2000a) Estatísticas da Saúde: Assistência Médico-sanitária. Rio de Janeiro:IBGE.
IBGE (2000b) Pesquisa Industrial Anual Rio de Janeiro: IBGE.
KLEVORICK, A.; LEVIN, R.; NELSON, R.; WINTER, S (1995). On the sources andsignificance of inter-industry differences in technological opportunities. ResearchPolicy, v. 24, p. 185-205.
MURRAY, C. J. (ed.); LOPEZ, A. (1996) The global burden of disease : acomprehensive assessment of mortality and disability from diseases, injuries, andrisk factors in 1990 and projected. Harvard: Harvard School of Public Health.
NATIONAL SCIENCE FOUNDATION (1998). Science and Engineering Indicators1998. Washington: National Science Foundation. (http://www.nsf.gov)
NATURE (2000) n. 1792, 13/07/2000, www.nature.com.
NELSON, R. (1995) The intertwining of public and proprietary in medical technology.In: ROSENBERG, N.; GELIJNS, A.; DAWKINS, H. Sources of medicaltechnology: universities and industry (Medical innovation at the crossroads, v. 5).Washington: National Academy.
PAN-AMERICAN HEALTH ORGANIZATION (1998) Health in the Americas.(http://www.paho.org)
PNUD (1996) Relatório do desenvolvimento humano. Lisboa: Tricontinental.
ROSENBERG, N.; GELIJNS, A.; DAWKINS, H. (1995) Sources of medicaltechnology: universities and industry (Medical innovation at the crossroads, v. 5).Washington: National Academy.
WEISBROD, B. (1991) The health care quadrilemma: an essay on technologicalchange, insurance, quality of care, and cost containment. Journal of EconomicLiterature, v. 29, n. 2, pp. 523-552.
WORLD BANK (1993) World Development Report 1993: Investing in Health. Oxford:Oxford University.
WORLD BANK (2000) World Development Report 1999-2000: Entering the 21st
Century. Oxford: Oxford University.
WORLD HEALTH ORGANIZATION (2000) The World Health Report: Healthsystems: improving performance. Geneva: WHO (http://www.who.org).

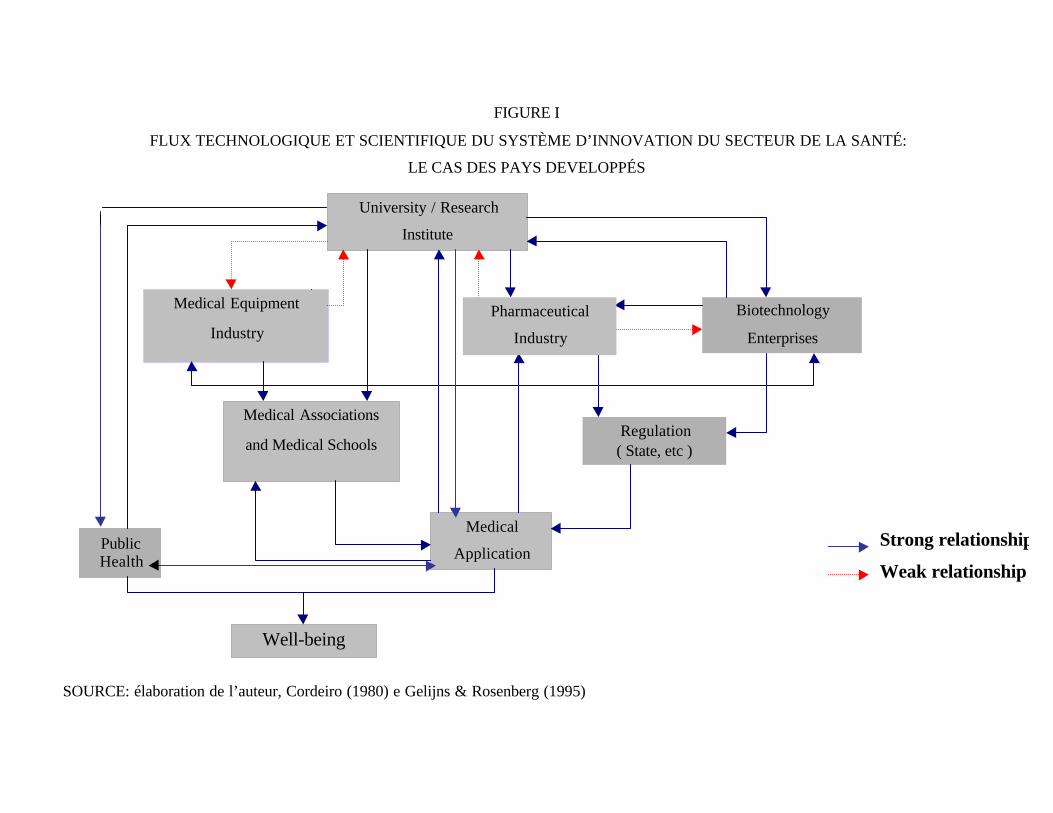
FIGURE I
FLUX TECHNOLOGIQUE ET SCIENTIFIQUE DU SYSTÈME D’INNOVATION DU SECTEUR DE LA SANTÉ:
LE CAS DES PAYS DEVELOPPÉS
SOURCE: élaboration de l’auteur, Cordeiro (1980) e Gelijns & Rosenberg (1995)
University / Research
Institute
PublicHealth
Well-being
Medical
Application
Biotechnology
Enterprises
Regulation( State, etc )
Medical Equipment
Industry
Medical Associations
and Medical Schools
Pharmaceutical
Industry
Strong relationship
Weak relationship

TABLE I
EXPENDITURE ON HEALTH,RELATIVE PARTICIPATION OF PRIVATE AND PUBLIC SECTOR
PAYMENTS TOTALEXPENDITURE
(% of GNP)
PRIVATEEXPENDITURE
(% of totalexpenditure)
PUBLICEXPENDITURE
(% of GNP)
United States 13,3 56,1 5,84Canada 9,9 27,8 7,15Sweden 8,8 22,0 6,87United Kingdom 6,6 16,7 5,49Germany 9,1 12,3 7,98France 9,1 26,1 6,72Netherlands 8,7 26,9 6,35Averange for countries with highl’IDH
6,0 34,4 3,94
Brazil 4,2 (*) 33,3 (*) 2,80SOURCE: PNUD (1996), (*) World Bank (1993)
TABLE II
MACRO-SECTEUR DE LA SANTÉ AU BRÉSIL (31/12/97)
NUMÉRO D’ÉTABLISSEMENTS ET EMPLOIS
DANS DES SECTEURS D’ACTIVITÉS SÉLECTIONNÉS EN LE
Number of
establishments
Number of employs %
Health services 1.779.178 7,47
Privates 979.319 4,11
Publics Not available 799.859 3,36
Health macro-sector 142.709 2.457.969 10,31
Education 32.968 3,57
Service sector 629.973 91.956 31,18
Public Administration 12.955 5.452.215 22,88
Total 1.844.388 23.830.312 100,00
* This macro-sector is composed of industrial activities that produce medicaments, pharmaco-
quemicals, medical and surgical equipments and instruments; activities of negotiating this
products; health social securty, activities of public sanitation, health professional on educational
activities, R&D and health professionals on others activities.
Source: Rais-Caged, Girardi (1998, p. 8)

17
TABLE III
BRAZILIAN HEALTH SYSTEM: NUMBER OF INDIVIDUAL THAT UTILIZED THE
HEALTH SERVICES ACCORDING TO THE TYPE OF SYSTEM AND PROVIDER.
(1998)
SYSTEM PROVIDER NUMBER OF
INDIVIDUALS
(millions)
PARTICIPATION
(%)
Public SUS 115,0 73,7
Private Personal assurance 9,0 5,8
Cooperatives 10,0 6,4
Group medicine 17,3 11,1
Health social security 4,7 3,0
TOTAL 156,0 100,0
SOURCE: Gazeta Mercantil (18/05/1998)
TABLE IV
AMBULATORIAL AND HOSPITAL EXPENDITURES OF SUS ACCORDING TO THE
NATURE OF PROVIDER (1996)
Nature Ambulatorial expenditures (%) Hospital expenditures (%)
Public 50 15
Universital 10 24
Private philanthropic 17 25
Private lucrative 23 36
Total 100 100
SOURCE: Oliveira Jr. (1998, p.73)

18
TABLE V
DISTRIBUTION OF LOST AVAI BY CAUSE AND DEMOGRAPHIC REGION (1990)
CAUSE
LATINAMERICA
ANDCARIBE
SUB-SAHARIAN
AFRICA
DEVELPEDECONOMIES WORLD
Population (millions) 444 510 798 5267
Communicable diseases 42,2 71,3 9,7 45,8
Tuberculosis 2,5 4,7 0,2 3,4
Sexual diseases et HIV 6,6 8,8 3,4 3,8
Diarrhoea 5,7 10,4 0,3 7,3
Child infections with possibleimmunisation
1,6 9,6 0,1 5,0
Malaria 0,4 10,8 - 2,6
Worm diseases 2,5 1,8 - 1,8
Respiratory infections 6,2 10,8 2,6 9,0
Maternal causes 1,7 2,7 0,6 2,2
Perinatal causes 9,1 7,1 2,2 7,3
Others 5,8 4,6 0,5 3,5
Non-communicable diseases 42,8 19,4 78,4 42,2
Cancer 5,2 1,5 19,1 5,8
Nutricional deficiencies 4,6 2,8 1,7 3,9
Neuro-psychiatric diseases 8,0 3,3 15,0 6,8
Brain stroke 2,6 1,5 5,3 3,2
Cardiac ischmia 2,7 0,4 10,0 3,1
Pulmonary obstruction 0,7 0,2 1,7 1,3
Others 19,1 9,7 25,6 18,0
Traumas 15,0 9,3 11,9 11,9
Cars accidents 5,7 1,3 3,5 2,3
Intentional 4,3 4,2 4,0 3,7
others 5,0 3,9 4,3 5,9
Total 100,0 100,0 100,0 100,0
Millions of AVAI 103 293 94 1362
Equivalent in child mortality(millions)
3,2 9,0 2,9 42,0
AVAI per thousands ofinhabitants
233 575 117 259
Note: -, less than 0,05%SOURCE: World Bank, 1993
19
TABLE VI
Relation between health-related industries (pharmaceutical and medical devices) and the
Brazilian industry (1997)
Group of activityNumber of
enterprises
Gross value of
the industrial
production
(in thousands of
reais)
Liquid sales
revenue
(in thousands of
reais)
Employees
Total (%) Total (%) Total (%) Total (%)
Pharmaceutical products 715 0,007 9711009 0,026 10183945 0,026 79444 0,016
Production of medical, hospital, odontologic, laboratory
and orthopedic equipment and instruments497 0,005 715305 0,002 811875 0,002 17761 0,004
Total of industry 106.764 376.390.361 397.561.091 5.007.653
Source: IBGE annual industrial report –1997
TABLE VII
The 10 major entreprises of pharmaceutical
industry in Brazil in 1998.
Entreprises
Amount of deal
(in thousands of
reais)
1 Novartis 951.766
2 Schering 598.928
3 Roche 501.788
4 Bristol Myers Squibb 479.098
5 Aché 415.273
6 Wyeth Whitehall 310.654
7 Boehringer Ingelheim 294.591
8 Glaxo Welcome 269.906
9 Tortuga 166.232
10 Merck 164.489
Source: Balança Anual da gazeta Mercantil
1999
20
TABLE VIII
The 9 major entreprises of the medical and
hospital equipment sector in Brazil, year 1998
EntreprisesAmount of deal (in thousands of
reais)
1 Dabi Atlante 41.338
2 Biolab Mérieux 30.295
3 Kavo 29.225
4 Micronal 20.390
5 Brauner 18.551
6 Braile Biosintética 9.817
7 Celm 5.482
8 Vigodent 4.191
9 Lutz Fernando 2.149
Source: Balança Anual da gazeta Mercantil 1999
21
TABLE IX
Number of Firms, Total and Mean of Patents, and Mean and
St. Dev of RITA per Industrial Sector (1988 - 1996)
Patents RITAIndustrial
SectorClassification
Number
of Firms Total Mean Mean St. Dev.
41 Tobacco 2 106 53,0 0,73585 0,80050
28 Metals 8 564 70,5 0,38277 0,97805
10 Electronics, Electrical Equipment 21 3099 147,6 0,14668 0,35162
30 Motor Vehicles and Parts 18 2132 118,4 0,14304 0,19651
15 Food 7 1360 194,3 0,10649 0,12877
11 Electronics, Semiconductors 3 181 60,3 0,08569 0,05563
6 Chemicals 33 7708 233,6 0,06179 0,17853
1 Aerospace 2 437 218,5 0,05168 0,06833
5 Buildings Materials, Glass 3 230 76,7 0,04883 0,01324
42 Trading 2 254 127,0 0,04413 0,01867
35 Rubber and Plastic Products 8 1149 143,6 0,04168 0,10487
17 Forest and Paper Products 6 406 67,7 0,03885 0,09516
38 Soaps, Cosmetics 7 1651 235,9 0,03389 0,05665
31 Petroleum Refining 10 1370 137,0 0,02859 0,05217
13 Engineering, Construction 1 46 46,0 0,02174 -
21 Industrial and Farm Equipment 17 1653 97,2 0,01985 0,04658
32 Pharmaceuticals 14 2809 200,6 0,01215 0,01488
27 Metal Products 5 464 92,8 0,00974 0,01357
40 Telecommunications 3 168 56,0 0,00794 0,01375
8 Computers, Office Equipment 3 1057 352,3 0,00733 0,00727
36 Scientific, Photo, Control Equip. 3 905 301,7 0,00610 0,01056
99 unidentified 6 433 72,2 0,00402 0,00984
14 Entertainment 3 321 107,0 0,00000 0,00000
34 Railroads 1 46 46,0 0,00000 -
37 Securities 1 58 58,0 0,00000 -
4 Beverages 1 127 127,0 0,00000 -
29 Mining, Crude-Oil Production 1 43 43,0 0,00000 -
Source: INPI, Fortune(1998), Guia Intervest 1998, author’s elaboration
22
TABLE X
RESEARCH LINES AND NUMBER OF RESEARCHERS
ACCORDING TO SCIENTIFIC AREAS (1995-1997)
Scientific areas Research lines Researchers
Agricultural sciences 3.322 5.460
Applied social sciences 1.410 2.878
Health sciences 4.481 7.044
Engineering and computer sciences 4.564 6.627
Human sciences 2.670 5.629
Exacts and Earth sciences 4.342 6.287
Languages, and Arts 906 1.897
Biological sciences 3.788 5.565
TOTAL 25.483 41.387
SOURCE: CNPq (Directoire des groupes de recherche: http://www.cnpq.br)
23
TABLE XI
DISTRIBUTION OF SCIENTIFIC PAPERS PRODUCED BY AREAS :
YEARS (1981-95)
Areas Produced Papers (%)
1981 1985 1989 1992 1995
World Brazil World Brazil World Brazil World Brazil World Brazil
Clinical
Medicine
31.5 21.2 32.2 20.3 32.2 18.5 31.5 25.2 30.7 22.9
Biomedical
research
15.0 18.5 16.6 22.7 17.0 24.8 16.8 17.9 16.4 18.0
Biology 10.6 14.3 9.0 10.2 8.5 8.5 8.1 8.9 8.0 9.6
Chemistry 14.8 12.5 14.2 10.6 13.9 9.5 14.0 9.8 14.0 12.1
Physics 12.3 19.4 13.9 23.3 15.2 24.5 15.7 24.1 16.9 25.4
Earth and spacial
sciences
4.6 5.9 4.6 4.8 4.6 6.2 4.9 6.4 5.3 5.1
Engineering and
technology
8.3 5.0 7.2 4.6 6.3 4.4 7.0 4.9 7.0 4.5
Mathematics 2.8 3.2 2.4 3.5 2.3 3.6 2.0 2.8 1.8 2.5
SOURCE: NSF (1998)
24
TABLE XII
THE MAJOR SCIENTIFIC DISCIPLINES IN BRAZIL WITH PARTICIPATION HIGHER
THAN 1% OF WORLD TOTAL (1996)
Disciplines % Papers produced in Brazil /
% Papers from the rest of the World
Agricultural sciences 2,04
Astrophysics 1,82
Physics 1,44
Microbiology 1,16
Mathemathics 1,15
Molecular biology 1,15
Biology and biochemistry 1,14
Animal science and Plants 1,11
Ecology 1,09
Immunology 1,01
Pharmacology 0,99
SOURCE: ISI, élaboration de l’auteur.

25
TABLE XIII
CLINICAL MEDICINE AND BIOMEDICAL RESEARCH: DISCIPLINES WITH A
PARTICIPATION HIGHER THAN 0,62% OF THE WORLD PRODUCTION (%)
(1992-1996)
Clinical Medicine Years Participation (%)
General medical research 92-96 2,5
Environment and public health 92-96 1,16
Oral and medical surgery 92-96 1,06
Clinical immunology and contagious diseases 92-96 0,86
Pharmacology and toxicology 92-96 0,86
Immunology 92-96 0,78
Biomedical research
Molecular biology and genetics 92-96 1,44
Applied biotechnology and microbiology 92-96 1,36
Microbiology 92-96 1,06
Physiology 92-96 0,67
SOURCE: ISI, élaboration de l’auteur.