Universidade de Lisboa Faculdade de Ciências...
41
Universidade de Lisboa Faculdade de Ciências Departamento de Biologia Animal BAT SPECIES VULNERABILITY TO FOREST FRAGMENTATION IN THE CENTRAL AMAZON Fábio Zanella Farneda Dissertação MESTRADO EM BIOLOGIA DA CONSERVAÇÃO 2013
Transcript of Universidade de Lisboa Faculdade de Ciências...
Universidade de Lisboa
Faculdade de Ciências
Departamento de Biologia Animal
BAT SPECIES VULNERABILITY TO FOREST
FRAGMENTATION IN THE CENTRAL AMAZON
Fábio Zanella Farneda
Dissertação
MESTRADO EM BIOLOGIA DA CONSERVAÇÃO
2013
Universidade de Lisboa
Faculdade de Ciências
Departamento de Biologia Animal
BAT SPECIES VULNERABILITY TO FOREST
FRAGMENTATION IN THE CENTRAL AMAZON
Fábio Zanella Farneda
Orientadores
Dr. Christoph Friedrich Johannes Meyer
Dr. Paulo Estefano Dineli Bobrowiec
2013

“Nossas preciosas matas desaparecem, vítimas do fogo e do machado, da
ignorância e do egoísmo...
...Virá então o dia em que a ultrajada natureza se enche vingada de
tantos crimes”
UM SOPRO DE DESTRUIÇÃO: PENSAMENTO POLÍTICO E CRÍTICA AMBIENTAL
NO BRASIL ESCRAVISTA, José Bonifácio, 1825.
iii
Agradecimentos
Esta pesquisa foi financiada pela Fundação para a Ciência e a Tecnologia (FCT) através
do projeto “Temporal dynamics of the impacts of forest fragmentation on Neotropical
bat assemblages”.
Sou imensamente grato ao meu orientador Christoph Meyer pela oportunidade de
trabalhar no projeto. Obrigado pela enorme paciência, confiança, ajuda com a
estatística, pelo inestimável apoio, pelas revisões e sugestões da tese e por todo o tempo
despendido em me atender.
Ao Jorge Palmeirim, a quem muito admiro profissionalmente, sou extremamente grato
pela indicação ao projeto, confiança e pelo apoio.
Ao Paulo Bobrowiec pelo apoio, pelas revisões e sugestões da tese. E por permitir o uso
de sua sala particular de trabalho como meu espaço de estudo e dormitório.
Agradeço ao Instituto Nacional de Pesquisas da Amazônia (INPA) e à coordenação do
Projeto Dinâmica Biológica de Fragmentos Florestais (PDBFF): José Camargo pela
atenção e ajuda com muitos tipos de entrave, Ary Ferreira por tratar dos mais diversos
contratempos em campo, Rosely Hipólito pela atenção e favores sempre atendidos,
Mirtes Bernardes pelas conversas e o café de todo dia, Luiz de Queiroz e Josimar
Menezes por serem nossos motoristas.
Aos amigos e colegas Rodrigo Marciente, Adrià López-Baucells, Alaércio dos Reis,
Roberta da Silva, Ricardo Rocha, Douglas Pinheiro, Madalena Boto e Gilberto
Fernandez pelo auxílio nas atividades de campo e/ou discussões que contribuíram para
o melhoramento deste trabalho. Novamente um obrigado ao Rodrigo pela ajuda com o
ImageJ, ao Adrià pelas conversas e ajuda com a matemática das fórmulas, ao Ricardo
pelas sugestões, ao Gilberto e à Madalena pelos momentos de filosofia e descontração
que fizeram passar mais agradavelmente as horas na mata.
Aos amigos de meus momentos difíceis: Reinaldo von Mühlen e Luci Stempkosky.
Obrigado pelo incentivo, por socorrer minhas indecisões e por todos os conselhos
cheios de sabedoria que muito me ajudaram a superar os obstáculos (que não foram
poucos nem fáceis!).
Agradeço ao Marlon Zortéa, por ter-me apresentado o curso de mestrado em Biologia
da Conservação da Universidade de Lisboa.

iv
À Karla Gomes pela ajuda com meu visto de estudos. E à Sónia e à Rosa Pina por terem
sido meu “guia de sobrevivência em Lisboa” logo que aqui cheguei. Sei que estou em
débitos!
À minha praticamente segunda mãe, Maria Helena Gamito, por ter-me “adotado” em
Portugal, pelas conversas, pela atenção e preocupação que teve comigo.
Ao Pedro Rufino e à Paula Carvalho, e à Patrícia Lopes e ao Pedro Gamito por me
hospedarem em suas casas durante alguns dias que tive que passar por Lisboa nesta
segunda etapa em terras lusitanas.
Um enorme obrigado ao Manuel Eduardo dos Santos por igualmente permitir minha
estadia em sua casa nestes últimos (e decisivos!) meses. Obrigado pelo convívio e
ambiente que muito ajudou a terminar este trabalho.
À minha família por tudo. Maristela, Celso Luiz, Denise, Lica. A presença de vocês ao
meu lado foi fundamental para eu estar agora escrevendo os agradecimentos. Agradeço
à minha nonna Libera Farneda pelas orações e a todos os demais parentes, amigos e
conhecidos que me enviaram pensamentos positivos.
Agradeço, muito especialmente, à Zulmira Helena Gamito, minha companheira de todos
os momentos. Obrigado por tornar minha vida mais suave e alegre, pela paciência,
atenção, amizade, pelo incentivo, carinho e amor incondicional! Sou sempre grato por
ter ao meu lado uma conservacionista cheia de planos!
E à “natureza”.

v
Table of contents
Agradecimentos ............................................................................................................. iii
List of figures ................................................................................................................. vi
List of tables .................................................................................................................. vii
Abstract ........................................................................................................................... 1
Resumo ............................................................................................................................ 2
Introduction .................................................................................................................... 3
Material and Methods .................................................................................................... 5
Study area and experimental design ............................................................................. 5
Bat sampling ................................................................................................................. 6
Species traits ................................................................................................................. 7
Data analysis ................................................................................................................. 9
Trait correlates of fragmentation sensitivity ............................................................. 9
Trait-environment relationships .............................................................................. 10
Results ............................................................................................................................ 11
Trait correlates of fragmentation sensitivity ............................................................... 11
Trait-environment relationships .................................................................................. 12
Discussion ...................................................................................................................... 16
Conclusions ................................................................................................................... 20
References...................................................................................................................... 20
Supplementary material .............................................................................................. 27
vi
List of figures
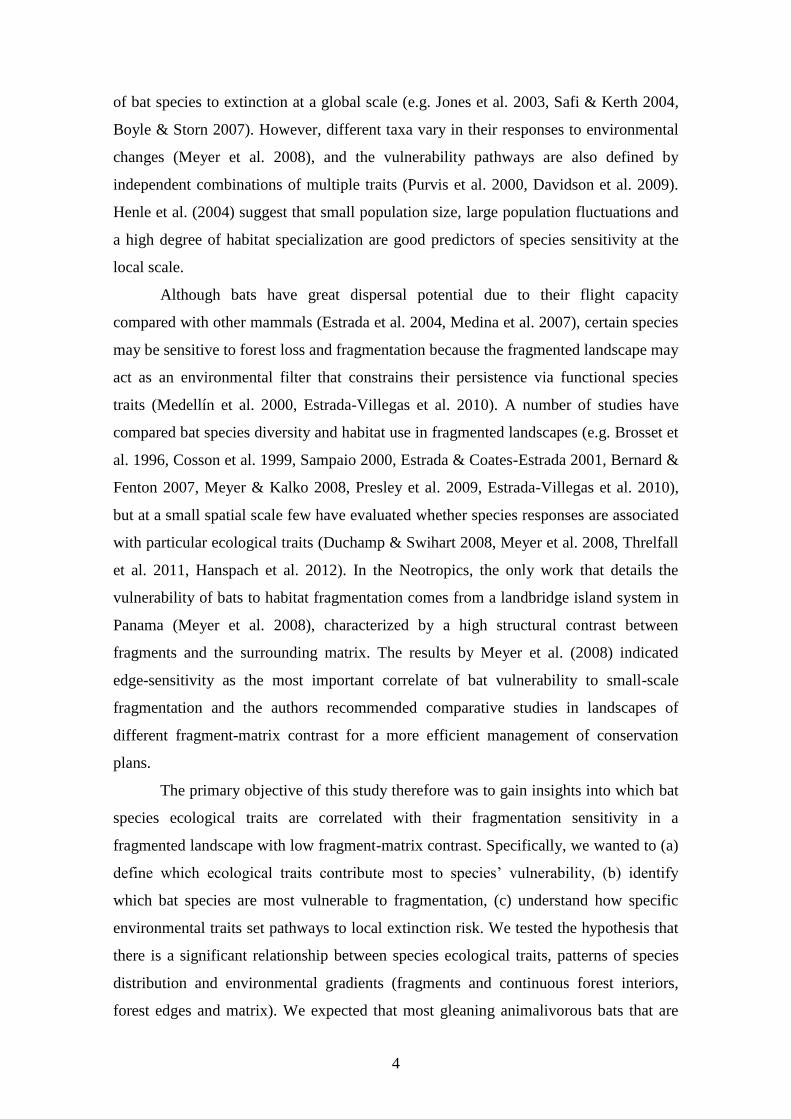
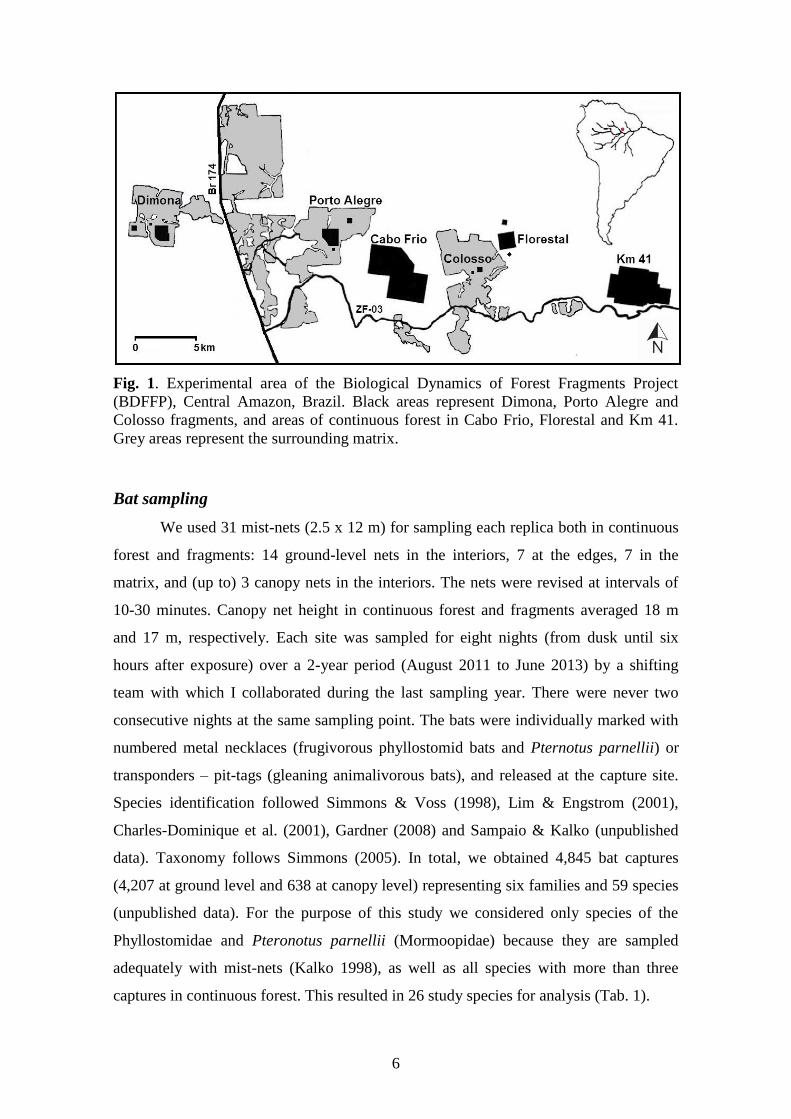
Fig. 1. Experimental area of the Biological Dynamics of Forest Fragments Project
(BDFFP), Central Amazon, Brazil. Black areas represent Dimona, Porto Alegre and
Colosso fragments, and areas of continuous forest in Cabo Frio, Florestal and Km 41.
Grey areas represent the surrounding matrix .................................................................... 6
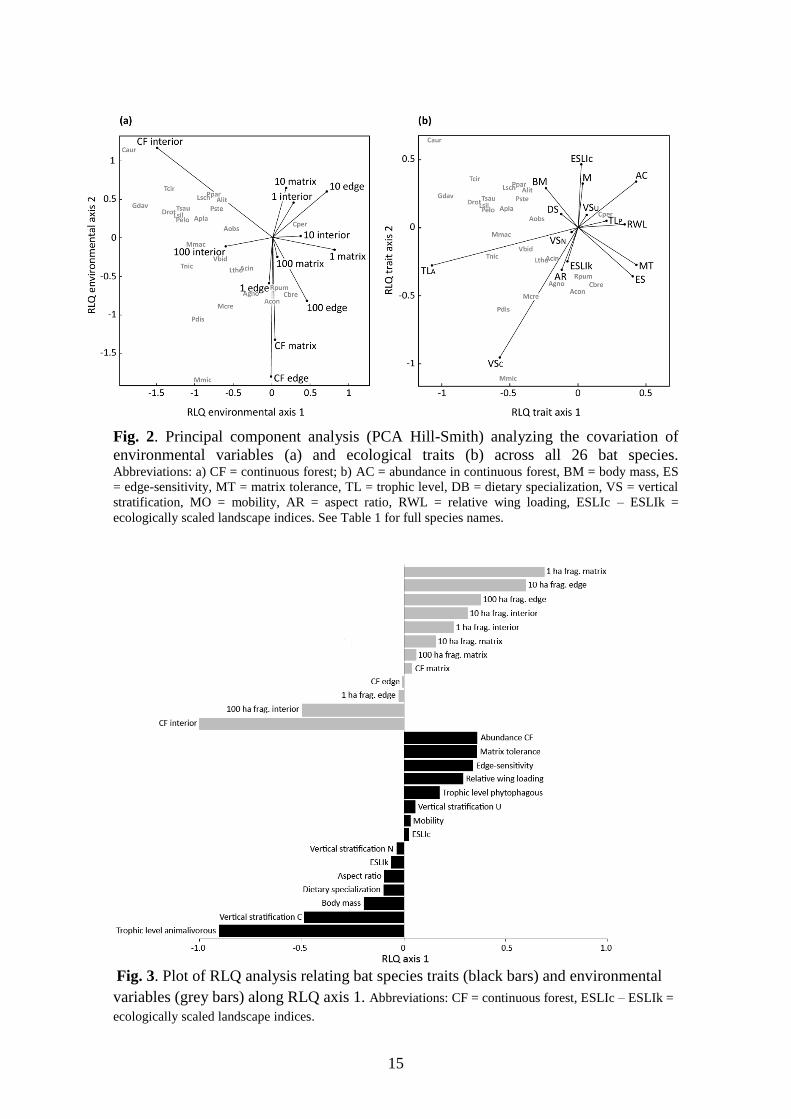
Fig. 2. Principal component analysis (PCA Hill-Smith) analyzing the covariation of
environmental variables (a) and ecological traits (b) across all 26 bat species.
Abbreviations: a) CF = continuous forest; b) AC = abundance in continuous forest, BM = body mass, ES
= edge-sensitivity, MT = matrix tolerance, TL = trophic level, DB = dietary specialization, VS = vertical
stratification, MO = mobility, AR = aspect ratio, RWL = relative wing loading, ESLIc – ESLIk =
ecologically scaled landscape indices. See Table 1 for full species names ....................................... 15
Fig. 3. Plot of RLQ analysis relating bat species traits (black bars) and environmental
variables (grey bars) along RLQ axis 1. Abbreviations: CF = continuous forest, ESLIc – ESLIk =
ecologically scaled landscape indices ...................................................................................... 15
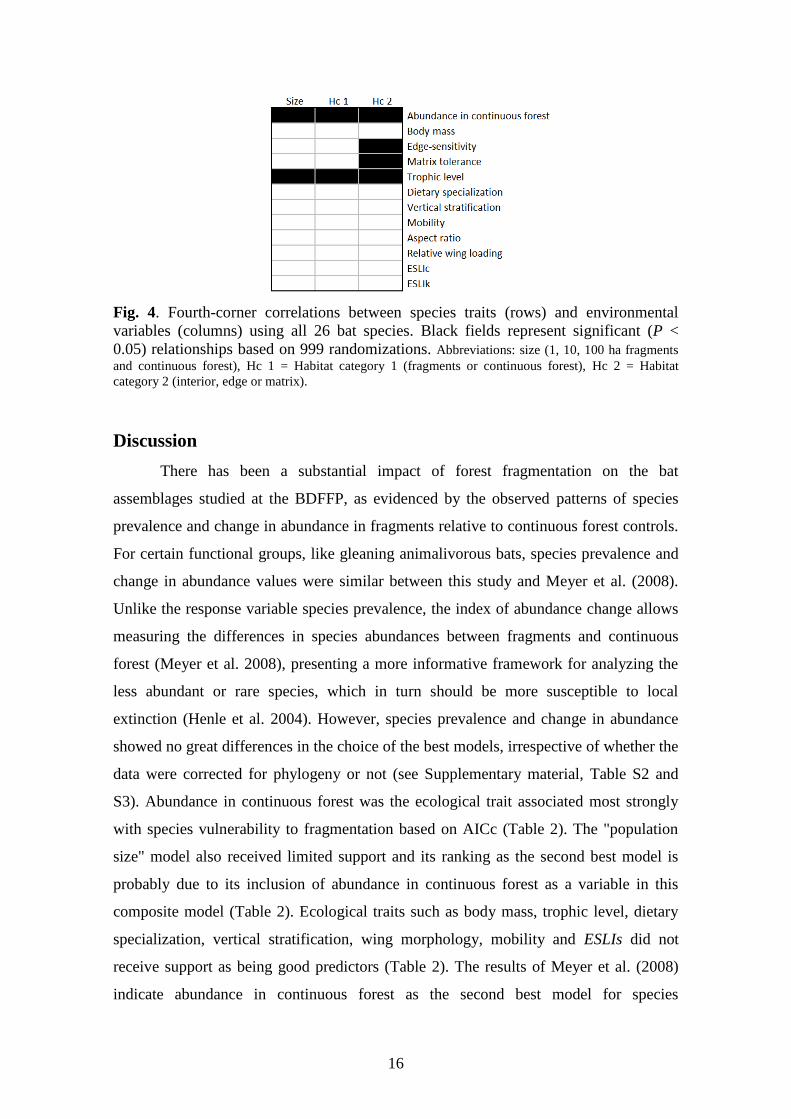
Fig. 4. Fourth-corner correlations between species traits (rows) and environmental
variables (columns) using all 26 bat species. Black fields represent significant (P <
0.05) relationships based on 999 randomizations. Abbreviations: size (1, 10, 100 ha fragments
and continuous forest), Hc 1 = Habitat category 1 (fragments or continuous forest), Hc 2 = Habitat
category 2 (interior, edge or matrix) ........................................................................................ 16
Figure S1 Plot used to group species into three mobility categories: low, intermediate
and high .......................................................................................................................... 33
vii
List of tables
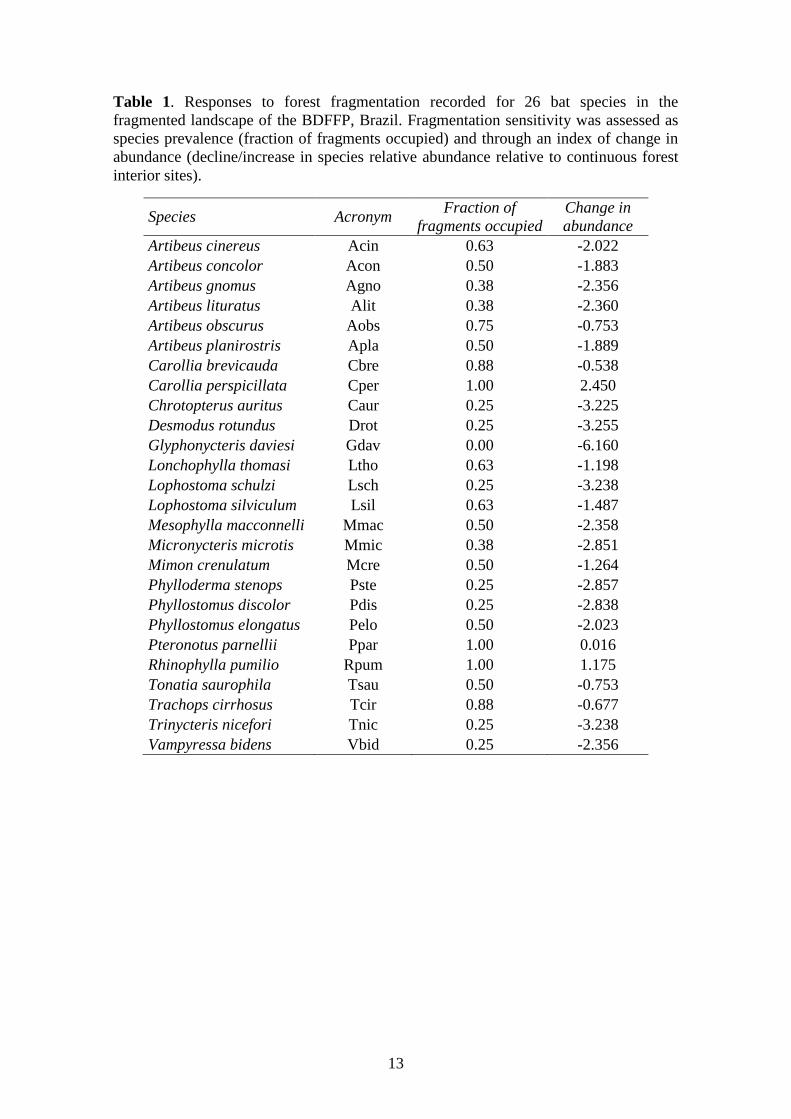
Table 1. Responses to forest fragmentation recorded for 26 bat species in the
fragmented landscape of the BDFFP, Brazil. Fragmentation sensitivity was assessed as
species prevalence (fraction of fragments occupied) and through an index of change in
abundance (decline/increase in species relative abundance relative to continuous forest
interior sites). .................................................................................................................. 13
Table 2. The two best-supported models from the set of candidate GLMs for the two
measures of fragmentation sensitivity. Sample-size adjusted AIC (AICc), Akaike
differences (Δi), Akaike weights (wi), and bootstrap selection frequencies (πi), as well as
model-averaged parameter estimates (θ) and unconditional standard errors (SE) are
presented. Traits included in the population size model were: AC – abundance in
continuous forest; BM – body mass; TL – trophic level. Percentage deviance explained
(% dev.) is given for each response variable. ................................................................. 14
Table 3. Results from RLQ analysis using environmental variables and species traits. a)
Eigenvalues (and % of total co-inertia) for the first two axes. Ordinations of tables R
(principal components analysis – PCA Hill-Smith), L (correspondence analysis – CA)
and Q (principal components analysis – PCA Hill-Smith). b) Summary of RLQ
analysis: eigenvalues and percentage of total co-inertia accounted for by the first two
RLQ axes, covariance and correlation (and % variance) with the correspondence
analysis of the L matrix, and projected variance (and % variance) with the R and Q
matrices. .......................................................................................................................... 14
Table S1 Values of each explanatory variable used to assess bat species sensitivity to
forest fragmentation at the BDFFP, Brazil. AC = abundance in continuous forest
(bats/mnh), BM = body mass, ES = edge-sensitivity, MT = matrix tolerance, TL =
trophic level, DB = dietary specialization, VS = vertical stratification, MO = mobility,
AR = aspect ratio, WL = wing loading, RWL = relative wing loading, ESLIc – ESLIk =
ecologically scaled landscape indices............................................................................. 28
Table S2 AIC model selection results based on analyses with phylogenetic correction.
........................................................................................................................................ 31
Table S3 AIC model selection results based on analyses without phylogenetic
correction ........................................................................................................................ 32
1
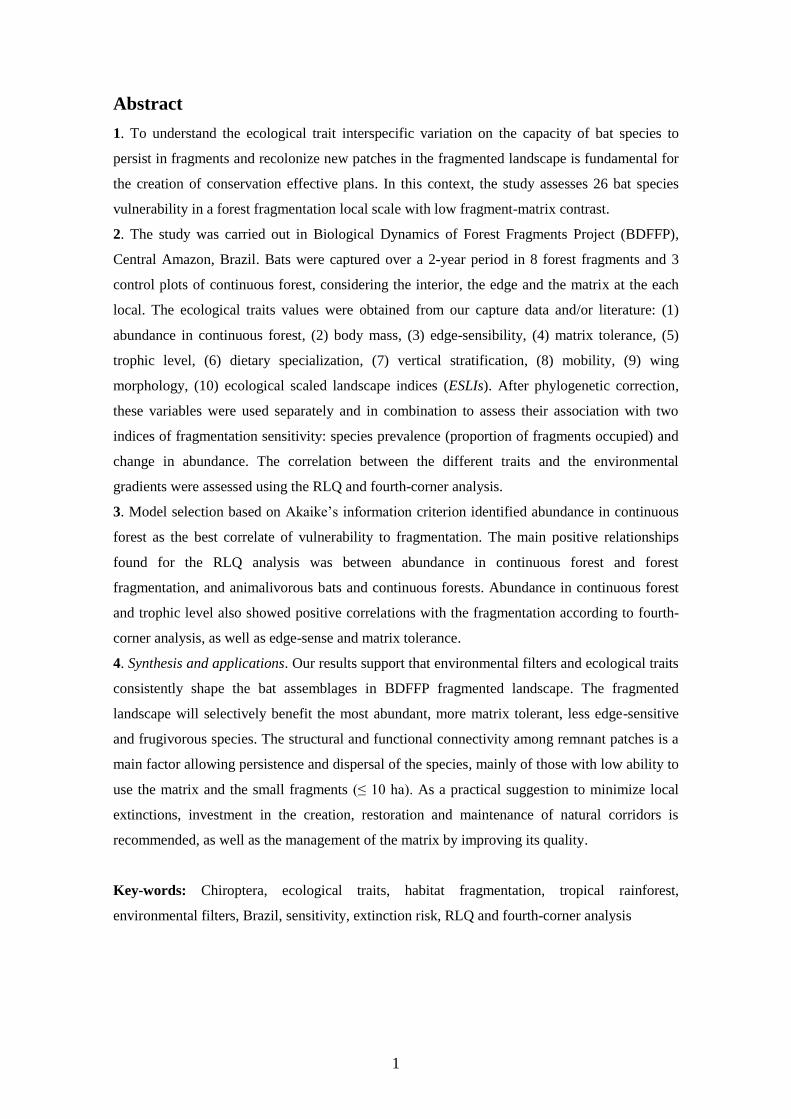
Abstract
1. To understand the ecological trait interspecific variation on the capacity of bat species to
persist in fragments and recolonize new patches in the fragmented landscape is fundamental for
the creation of conservation effective plans. In this context, the study assesses 26 bat species
vulnerability in a forest fragmentation local scale with low fragment-matrix contrast.
2. The study was carried out in Biological Dynamics of Forest Fragments Project (BDFFP),
Central Amazon, Brazil. Bats were captured over a 2-year period in 8 forest fragments and 3
control plots of continuous forest, considering the interior, the edge and the matrix at the each
local. The ecological traits values were obtained from our capture data and/or literature: (1)
abundance in continuous forest, (2) body mass, (3) edge-sensibility, (4) matrix tolerance, (5)
trophic level, (6) dietary specialization, (7) vertical stratification, (8) mobility, (9) wing
morphology, (10) ecological scaled landscape indices (ESLIs). After phylogenetic correction,
these variables were used separately and in combination to assess their association with two
indices of fragmentation sensitivity: species prevalence (proportion of fragments occupied) and
change in abundance. The correlation between the different traits and the environmental
gradients were assessed using the RLQ and fourth-corner analysis.
3. Model selection based on Akaike’s information criterion identified abundance in continuous
forest as the best correlate of vulnerability to fragmentation. The main positive relationships
found for the RLQ analysis was between abundance in continuous forest and forest
fragmentation, and animalivorous bats and continuous forests. Abundance in continuous forest
and trophic level also showed positive correlations with the fragmentation according to fourth-
corner analysis, as well as edge-sense and matrix tolerance.
4. Synthesis and applications. Our results support that environmental filters and ecological traits
consistently shape the bat assemblages in BDFFP fragmented landscape. The fragmented
landscape will selectively benefit the most abundant, more matrix tolerant, less edge-sensitive
and frugivorous species. The structural and functional connectivity among remnant patches is a
main factor allowing persistence and dispersal of the species, mainly of those with low ability to
use the matrix and the small fragments (≤ 10 ha). As a practical suggestion to minimize local
extinctions, investment in the creation, restoration and maintenance of natural corridors is
recommended, as well as the management of the matrix by improving its quality.
Key-words: Chiroptera, ecological traits, habitat fragmentation, tropical rainforest,
environmental filters, Brazil, sensitivity, extinction risk, RLQ and fourth-corner analysis

2
Resumo
1. Entender a variação interespecífica das características ecológicas sobre a capacidade das
espécies de morcegos de persistir em fragmentos e recolonizar novas áreas na paisagem
fragmentada é fundamental para a criação de planos efetivos de conservação. Neste contexto, o
estudo avalia a vulnerabilidade de 26 espécies de morcegos em uma escala local de
fragmentação florestal com baixo contraste entre fragmentos-matriz.
2. O estudo foi conduzido nas áreas do Projeto Dinâmica Biológica de Fragmentos Florestais
(PDBFF), Amazônia Central, Brasil. Os morcegos foram capturados ao longo de 2 anos em 8
fragmentos florestais e 3 áreas controle de floresta contínua, considerando o interior, a borda e a
matriz de cada local. Os valores das variáveis ecológicas foram obtidos de nossos dados de
captura e/ou de literatura: (1) abundância em floresta contínua, (2) tamanho corporal, (3)
sensibilidade ao efeito de borda, (4) tolerância à matriz, (5) nível trófico, (6) especialização da
dieta, (7) estratificação vertical, (8) mobilidade, (9) morfologia de asa, (10) índices de
conectividade funcional (ESLIs). Após uma correção filogenética, as variáveis foram usadas
separadamente e em combinação para avaliar sua associação com dois índices de sensibilidade à
fragmentação: prevalência das espécies (proporção de fragmentos ocupados) e variação na
abundância. As correlações entre diferentes características e gradientes ambientais foram
avaliadas utilizando as análises RLQ e fourth-corner.
3. O critério de informação de Akaike identificou abundância em floresta contínua como o
melhor modelo para explicar a vulnerabilidade à fragmentação. As principais relações positivas
encontradas pela análise RLQ foram entre abundância em floresta contínua e fragmentação
florestal, e morcegos animalívoros e florestas contínuas. Abundância em floresta contínua e
nível trófico também apresentaram correlações positivas com a fragmentação pela análise
fourth-corner, bem como sensibilidade ao efeito de borda e tolerância à matriz.
4. Síntese e predições. Nossos resultados confirmam que os filtros ambientais e as variáveis
ecológicas moldam as comunidades de morcegos na paisagem fragmentada do PDBFF. A
paisagem fragmentada vem seletivamente beneficiar as espécies mais abundantes, mais
tolerantes à matriz, menos sensíveis aos efeitos de borda e frugívoras. A conectividade
estrutural e funcional entre fragmentos remanescentes é o principal fator para a persistência e
dispersão das espécies, principalmente daquelas com baixa capacidade de usar a matriz e os
pequenos fragmentos (≤ 10 ha). Como sugestão prática para minimizar as extinções locais, é
recomendando o investimento na criação, restauração e manutenção de corredores naturais, bem
como uma gestão da matriz que melhore sua qualidade.
Palavras-chave: Chiroptera, características ecológicas, fragmentação de habitat, floresta
tropical, filtros ambientais, Brasil, sensibilidade, risco de extinção, análises RLQ e fourth-corner
3
Introduction
The rainforests of the world are in decline due to various and increasing
anthropogenic pressures (Corlett & Primack 2008, Hansen et al. 2008, Bradshaw et al.
2009). Concerning the Amazon rainforest, such scenario is due to the gradual loss of
vast forest areas to livestock and agricultural activities, urban expansion, illegal logging,
mining and dam construction (Gascon et al. 2001, Fearnside 2003, Kirby et al. 2006,
DeFries et al. 2010, Macedo et al. 2012). The Brazilian Amazon lost about 33 million
ha of forest in the last 20 years (Instituto Nacional de Pesquisas Espaciais 2013). Forest
loss and fragmentation pose serious risks to the conservation of biodiversity (Laurance
2007, Morris 2010), and one of the biggest and urgent current challenges of
conservation biology is to understand how these anthropogenic drivers of environmental
change contribute to local species extinction risk, which allows the establishment of
effective management and conservation plans.
A recent study predicts an increase of more than 80% in vertebrate species
extinction rates associated with habitat loss in the Brazilian Amazon by 2050, and
suggests that locally will lose an average of nine vertebrate species and have a further
16 committed to extinction (Wearn et al. 2012). This can potentially be catastrophic for
ecosystem stability due the loss of functional groups that, by providing a specific
ecosystem service or function, may have a cascading effect of species extinctions
(Grelle 2005).
In the Amazon, bats are a good model group to assess how forest fragmentation
influences the structure of their ecologically diverse communities (e.g. Sampaio 2000,
Bernard & Fenton 2003, Bobrowiec & Gribel 2010). Besides their high species
richness, bats are important seed dispersers, pollinators, prey, and regulators of animal
populations (Kunz & Fenton 2003, Kunz et al. 2011), and their reduction or local
extinction may significantly influence the dynamics of tropical ecosystems. For this
reason, they have also been considered good bioindicators of habitat alteration (Fenton
et al. 1992, Jones et al. 2009).
Species adaptation to fragmented landscapes depends on their biological traits
(physiological requirements, morphological adaptations, life histories), ecological traits
(environmental preferences and associated behaviors) and strategies of resource use
(Davies et al. 2000, Cardillo et al. 2008). Traits such as wing morphology, mobility,
diet, body size and geographic range have usually been used to assess the vulnerability
4
of bat species to extinction at a global scale (e.g. Jones et al. 2003, Safi & Kerth 2004,
Boyle & Storn 2007). However, different taxa vary in their responses to environmental
changes (Meyer et al. 2008), and the vulnerability pathways are also defined by
independent combinations of multiple traits (Purvis et al. 2000, Davidson et al. 2009).
Henle et al. (2004) suggest that small population size, large population fluctuations and
a high degree of habitat specialization are good predictors of species sensitivity at the
local scale.
Although bats have great dispersal potential due to their flight capacity
compared with other mammals (Estrada et al. 2004, Medina et al. 2007), certain species
may be sensitive to forest loss and fragmentation because the fragmented landscape may
act as an environmental filter that constrains their persistence via functional species
traits (Medellín et al. 2000, Estrada-Villegas et al. 2010). A number of studies have
compared bat species diversity and habitat use in fragmented landscapes (e.g. Brosset et
al. 1996, Cosson et al. 1999, Sampaio 2000, Estrada & Coates-Estrada 2001, Bernard &
Fenton 2007, Meyer & Kalko 2008, Presley et al. 2009, Estrada-Villegas et al. 2010),
but at a small spatial scale few have evaluated whether species responses are associated
with particular ecological traits (Duchamp & Swihart 2008, Meyer et al. 2008, Threlfall
et al. 2011, Hanspach et al. 2012). In the Neotropics, the only work that details the
vulnerability of bats to habitat fragmentation comes from a landbridge island system in
Panama (Meyer et al. 2008), characterized by a high structural contrast between
fragments and the surrounding matrix. The results by Meyer et al. (2008) indicated
edge-sensitivity as the most important correlate of bat vulnerability to small-scale
fragmentation and the authors recommended comparative studies in landscapes of
different fragment-matrix contrast for a more efficient management of conservation
plans.
The primary objective of this study therefore was to gain insights into which bat
species ecological traits are correlated with their fragmentation sensitivity in a
fragmented landscape with low fragment-matrix contrast. Specifically, we wanted to (a)
define which ecological traits contribute most to species’ vulnerability, (b) identify
which bat species are most vulnerable to fragmentation, (c) understand how specific
environmental traits set pathways to local extinction risk. We tested the hypothesis that
there is a significant relationship between species ecological traits, patterns of species
distribution and environmental gradients (fragments and continuous forest interiors,
forest edges and matrix). We expected that most gleaning animalivorous bats that are
5
more habitat specialized, rare, heavier, top predators, and less mobile are more
vulnerable to forest fragmentation. We compare our findings with the results found by
Meyer et al. (2008) through the use of ten ecological traits as predictors of species
responses to habitat fragmentation.
Material and Methods
Study area and experimental design
The study was carried out at the Biological Dynamics of Forest Fragments
Project (BDFFP) located ca. 80 km north of Manaus, Central Amazon, Brazil (Fig. 1),
an area which spans ~1000 km2 (2°25´S-59°50’W) (Lovejoy & Bierregaard 1990). The
area is characterized by a mosaic of unflooded (terra firme) Amazonian rainforest,
secondary forest and primary forest fragments. The climate is monsoon – Am (Köppen)
(Peel et al. 2007). Mean annual temperature is 26 ºC (range 19-39 ºC) (Oliveira & Mori
1999) and mean annual rainfall ranges from 1.900-3.500 mm. The rainy season lasts
from October-May (Laurance 2001). The topography is relatively flat (80-160 m
elevation), intersected by small streams (Laurance et al. 2011). The dominant soil type
is yellow latosols, which are well-drained and nutrient-poor (Laurance et al. 1999). The
primary forest canopy is 30-37 m tall, with emergent trees to 55 m (Laurance et al.
2011). Fruiting usually occurs during the rainy season (Rankin-de Merona et al. 1992).
In the early 1980s, 11 fragments were isolated from continuous forest by distances of
80-650 m by clearing and burning the surrounding forest. Since then, each fragment was
re-isolated on 3-4 occasions, most recently between 1999 and 2001 (Laurance et al.
2011). The matrix is characterized by secondary growth in various successional stages
and is dominated mainly by Vismia spp. (areas that were cleared and burned) and
Cecropia spp. (areas that were cleared without fire) (Mesquita et al. 1999).
The study included eight forest fragments (three of 1 ha, three of 10 ha, two of
100 ha – distributed in Dimona, Porto Alegre and Colosso camps) and nine control plots
in three areas of continuous forest (Cabo Frio, Florestal and Km 41 camps) (Fig. 1).
Sampling was conducted in the interiors and at the edges of all 8 fragments as well as at
8 sites located 100 m from the fragment border into the adjacent matrix. The same
sampling scheme was applied for the continuous forest sites using 9 sampling points in
the interior, 3 at the edge and 3 in the matrix.
6
Fig. 1. Experimental area of the Biological Dynamics of Forest Fragments Project
(BDFFP), Central Amazon, Brazil. Black areas represent Dimona, Porto Alegre and
Colosso fragments, and areas of continuous forest in Cabo Frio, Florestal and Km 41.
Grey areas represent the surrounding matrix.
Bat sampling
We used 31 mist-nets (2.5 x 12 m) for sampling each replica both in continuous
forest and fragments: 14 ground-level nets in the interiors, 7 at the edges, 7 in the
matrix, and (up to) 3 canopy nets in the interiors. The nets were revised at intervals of
10-30 minutes. Canopy net height in continuous forest and fragments averaged 18 m
and 17 m, respectively. Each site was sampled for eight nights (from dusk until six
hours after exposure) over a 2-year period (August 2011 to June 2013) by a shifting
team with which I collaborated during the last sampling year. There were never two
consecutive nights at the same sampling point. The bats were individually marked with
numbered metal necklaces (frugivorous phyllostomid bats and Pternotus parnellii) or
transponders – pit-tags (gleaning animalivorous bats), and released at the capture site.
Species identification followed Simmons & Voss (1998), Lim & Engstrom (2001),
Charles-Dominique et al. (2001), Gardner (2008) and Sampaio & Kalko (unpublished
data). Taxonomy follows Simmons (2005). In total, we obtained 4,845 bat captures
(4,207 at ground level and 638 at canopy level) representing six families and 59 species
(unpublished data). For the purpose of this study we considered only species of the
Phyllostomidae and Pteronotus parnellii (Mormoopidae) because they are sampled
adequately with mist-nets (Kalko 1998), as well as all species with more than three
captures in continuous forest. This resulted in 26 study species for analysis (Tab. 1).
7
Species traits
We examined the relationships between measures of species sensitivity to
fragmentation and the following traits (compare Meyer et al. 2008): abundance in
continuous forest, body mass, edge-sensitivity, matrix tolerance, trophic level, dietary
specialization, vertical stratification, mobility, wing morphology and ecologically scaled
landscape indices (ESLIs) (see Table S1 in Supplementary material).
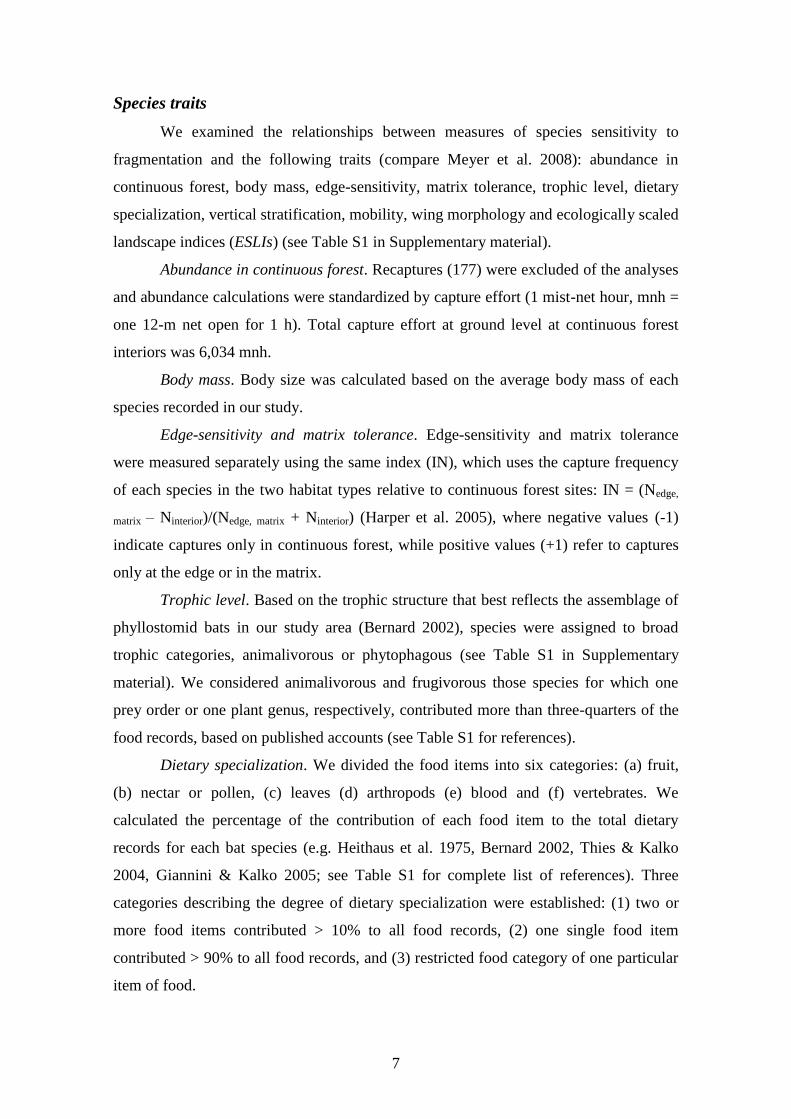
Abundance in continuous forest. Recaptures (177) were excluded of the analyses
and abundance calculations were standardized by capture effort (1 mist-net hour, mnh =
one 12-m net open for 1 h). Total capture effort at ground level at continuous forest
interiors was 6,034 mnh.
Body mass. Body size was calculated based on the average body mass of each
species recorded in our study.
Edge-sensitivity and matrix tolerance. Edge-sensitivity and matrix tolerance
were measured separately using the same index (IN), which uses the capture frequency
of each species in the two habitat types relative to continuous forest sites: IN = (Nedge,
matrix – Ninterior)/(Nedge, matrix + Ninterior) (Harper et al. 2005), where negative values (-1)
indicate captures only in continuous forest, while positive values (+1) refer to captures
only at the edge or in the matrix.
Trophic level. Based on the trophic structure that best reflects the assemblage of
phyllostomid bats in our study area (Bernard 2002), species were assigned to broad
trophic categories, animalivorous or phytophagous (see Table S1 in Supplementary
material). We considered animalivorous and frugivorous those species for which one
prey order or one plant genus, respectively, contributed more than three-quarters of the
food records, based on published accounts (see Table S1 for references).
Dietary specialization. We divided the food items into six categories: (a) fruit,
(b) nectar or pollen, (c) leaves (d) arthropods (e) blood and (f) vertebrates. We
calculated the percentage of the contribution of each food item to the total dietary
records for each bat species (e.g. Heithaus et al. 1975, Bernard 2002, Thies & Kalko
2004, Giannini & Kalko 2005; see Table S1 for complete list of references). Three
categories describing the degree of dietary specialization were established: (1) two or
more food items contributed > 10% to all food records, (2) one single food item
contributed > 90% to all food records, and (3) restricted food category of one particular
item of food.
8
Vertical stratification. The use of the vertical forest niche of each species was
measured through the proportion of captures in ground nets vs. canopy nets. The canopy
net captures were counted from c. 6 m upwards (sub-canopy level). The calculations
were based on abundance/capture effort (mnh). The species were assigned to three
categories of vertical stratification: (U) understory species, < 33% of all captures in
canopy nets; (N) opportunistic species without preference, 33-66% of all captures in
canopy nets, (C) species with canopy preference, > 66% of all captures in canopy nets.
Mobility. Mobility patterns were determined through mark-recapture data
obtained during our study (by calculating the distance between marking and recapture
site) and/or based on the literature – where preference was given to radio-tracking
studies for best representing species’ home ranges (e.g. Bernard & Fenton 2003,
Albrecht et al. 2007, Henry & Kalko 2007; see Table S1 for complete list of references).
For 9 species for which no information on mobility was available, mean and maximum
distances were predicted by linear regression on body mass (F1,15 = 5.38, P = 0.034, r2 =
0.26; F1,15 = 5.06, P = 0.039, r2 = 0.25, respectively). The species were then grouped
into three categories of mobility according to mean and maximum recapture distances:
low, intermediate and high (see Supplementary material, Figure S1).
Wing morphology. Different measures describing wing morphology, aspect ratio
(wing span2/wing area), wing loading (total body mass*gravitational acceleration/wing
area) and relative wing loading (wing loading/body mass*9.810.33
) (Norberg & Rayner
1987, Norberg 1998) were calculated by averaging measurement values of up to five
individuals of each bat species recorded in our study. Measurements were made based
on digital photographs and analyzed with the program ImageJ 1.47. As recommended
by Norberg & Rayner (1987), the head was excluded from calculations of wing area.
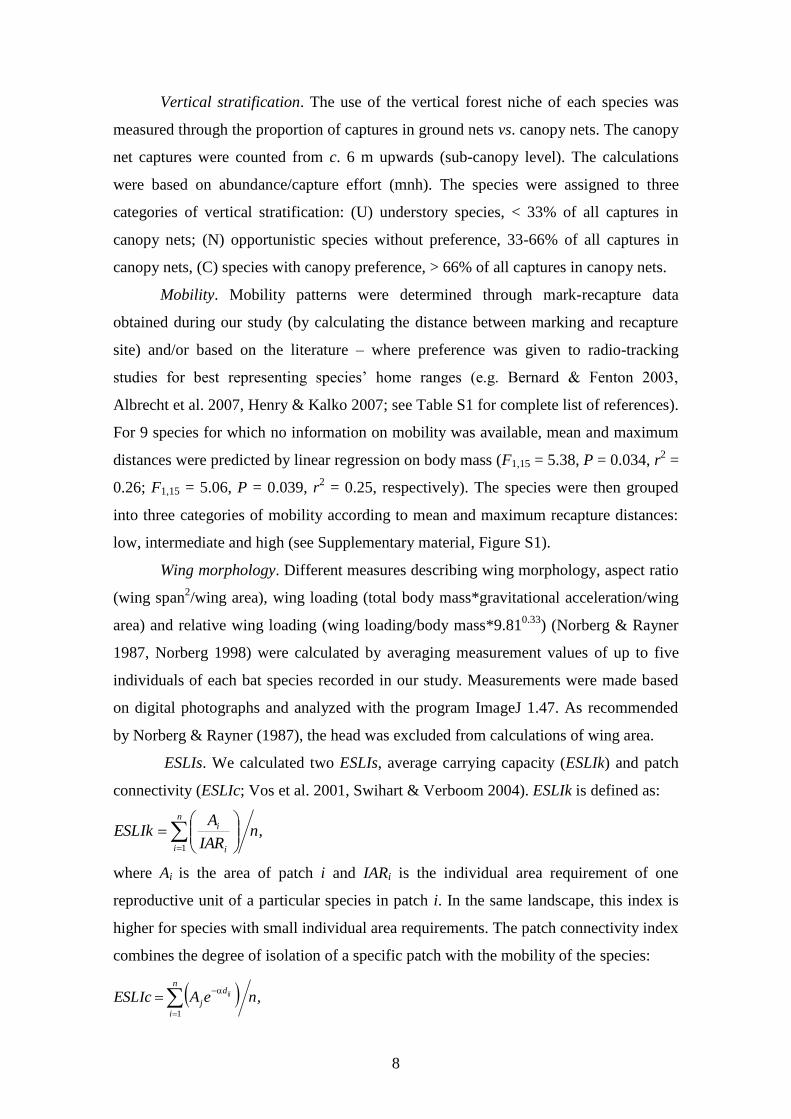
ESLIs. We calculated two ESLIs, average carrying capacity (ESLIk) and patch
connectivity (ESLIc; Vos et al. 2001, Swihart & Verboom 2004). ESLIk is defined as:
where Ai is the area of patch i and IARi is the individual area requirement of one
reproductive unit of a particular species in patch i. In the same landscape, this index is
higher for species with small individual area requirements. The patch connectivity index
combines the degree of isolation of a specific patch with the mobility of the species:
n
i i
i ,nIAR
AESLIk
1
,neAESLIcn
i
d
jij
1
9
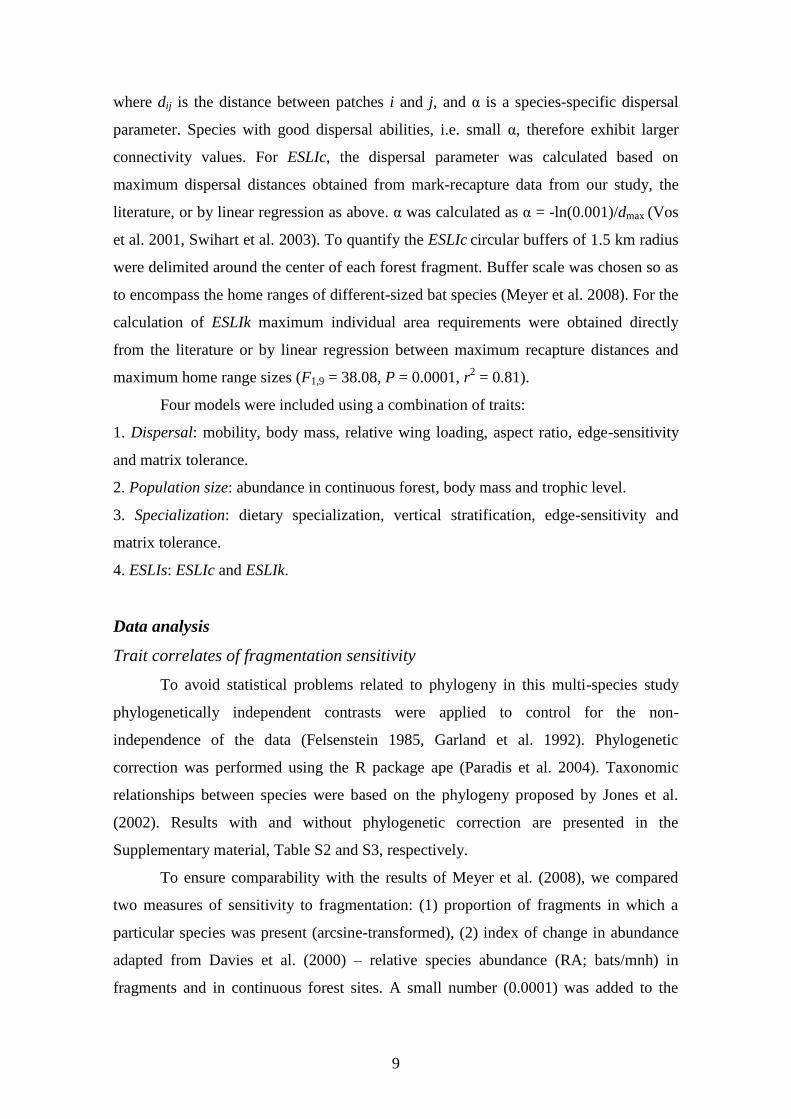
where dij is the distance between patches i and j, and α is a species-specific dispersal
parameter. Species with good dispersal abilities, i.e. small α, therefore exhibit larger
connectivity values. For ESLIc, the dispersal parameter was calculated based on
maximum dispersal distances obtained from mark-recapture data from our study, the
literature, or by linear regression as above. α was calculated as α = -ln(0.001)/dmax (Vos
et al. 2001, Swihart et al. 2003). To quantify the ESLIc circular buffers of 1.5 km radius
were delimited around the center of each forest fragment. Buffer scale was chosen so as
to encompass the home ranges of different-sized bat species (Meyer et al. 2008). For the
calculation of ESLIk maximum individual area requirements were obtained directly
from the literature or by linear regression between maximum recapture distances and
maximum home range sizes (F1,9 = 38.08, P = 0.0001, r2 = 0.81).
Four models were included using a combination of traits:
1. Dispersal: mobility, body mass, relative wing loading, aspect ratio, edge-sensitivity
and matrix tolerance.
2. Population size: abundance in continuous forest, body mass and trophic level.
3. Specialization: dietary specialization, vertical stratification, edge-sensitivity and
matrix tolerance.
4. ESLIs: ESLIc and ESLIk.
Data analysis
Trait correlates of fragmentation sensitivity
To avoid statistical problems related to phylogeny in this multi-species study
phylogenetically independent contrasts were applied to control for the non-
independence of the data (Felsenstein 1985, Garland et al. 1992). Phylogenetic
correction was performed using the R package ape (Paradis et al. 2004). Taxonomic
relationships between species were based on the phylogeny proposed by Jones et al.
(2002). Results with and without phylogenetic correction are presented in the
Supplementary material, Table S2 and S3, respectively.
To ensure comparability with the results of Meyer et al. (2008), we compared
two measures of sensitivity to fragmentation: (1) proportion of fragments in which a
particular species was present (arcsine-transformed), (2) index of change in abundance
adapted from Davies et al. (2000) – relative species abundance (RA; bats/mnh) in
fragments and in continuous forest sites. A small number (0.0001) was added to the

10
relative abundance of each species as Glyphonycteris daviesi was not captured in
fragments: y = loge (RAfragments + 0.0001/RAcontinuous forest + 0.0001).
Logarithmic transformations were performed on body mass, abundance in
continuous forest and ESLIs. Both response variables followed a normal probability
distribution (Shapiro–Wilk test, P > 0.05) after phylogenetic correction, and were
modeled using generalized linear models (GLMs) assuming a Gaussian distribution.
Regressions for all models were forced through the origin (Garland et al. 1992). For
each response variable, goodness-of-fit was examined based on the global model as
percentage of explained deviance (Crawley 2005). The selection of the best model was
made using the Akaike information criterion (AIC) corrected for small-sample size
(AICc). Delta values Δi < 2 and high values of Akaike weights (wi) (i.e. closest to one)
identified the models that received the strongest support. Model selection frequencies
(πi), which based on bootstrapping (10,000 resamples) of the original data give the
proportion of times each model was the one best supported from the candidate set, were
further calculated to assess model selection uncertainty (Burnham & Anderson 2002).
We also computed weighted estimates of regression coefficients and unconditional
standard errors for the best-supported model in the confidence set:
where wi is the Akaike weight of model i, and θ+
j,i is the estimator of the regression
coefficient if ecological trait j is included in model i (Burnham & Anderson 2002). The
analyses were performed using the R package AICcmodavg (Mazerolle 2013).
Trait-environment relationships
The relationships between species ecological traits (only individual traits were
considered) and environmental variables were tested by RLQ (Dolédec et al. 1996) and
fourth-corner analysis (Legendre et al. 1997, Dray & Legendre 2008). These are two
complementary multivariate analyses linking data from three tables: R, L and Q. The R
table comprises the environmental variables (39 sites x 3 variables) and here considered
forest size (1, 10, 100 ha fragments and continuous forest), habitat category 1
(fragments or continuous forest) and habitat category 2 (interior, edge or matrix). The L
table comprised species abundances (39 sites x 26 species) and the Q table all ecological
traits (26 species x 13 traits). RLQ analysis maximizes the covariance between sites and
species based on environmental variables and ecological traits (Dolédec et al. 1996).
The L species table was analyzed by correspondence analysis (CA) and the R and Q
,wR
i
i,jij
1

11
tables by Hill-Smith principal components analysis (PCA) for mixed quantitative and
qualitative data (Hill & Smith 1976), using the CA site and species scores, respectively,
as row weights, thus allowing R and Q to be linked to the L table. We compared the
variance explained (%) by the first two RLQ axes with those of the separate ordinations.
Significance was tested using 999 permutations. We then applied fourth-corner analysis,
which quantifies and tests the relationships between environmental variables and
species ecological traits. The result is a matrix of correlation between ecological and
environmental variables with community composition. We used a combination of model
2 – which links the matrices L and Q and tests the null hypothesis that communities of
species are not dependent on the environmental variables of the sites where they are
found, with model 4 – which links matrices L and R and tests the null hypothesis that
the distribution of species between sites with favorable conditions does not depend on
the species’ ecological traits (Legendre et al. 1997, Dray & Legendre 2008).
Significance of the relationship between species ecological traits and environmental
variables was assessed based on 999 permutations through the fourthcorner2 function,
which offers a multivariate statistic (equal to the sum of eigenvalues of RLQ analysis)
and measures the link between two variables by a square correlation coefficient (two
quantitative variables), a Chi2/sum (L) (two qualitative variables) and a correlation ratio
(one quantitative and one qualitative variable). RLQ and fourth-corner analysis were
performed with the package ade4 (Dray & Dufour 2007) in R v.3.0.1 (R Development
Core Team 2013).
Results
Trait correlates of fragmentation sensitivity
Abundance in continuous forest received overriding support as the best model
explaining species’ sensitivity to forest fragmentation for both response variables:
species prevalence (wi 0.93) and index of change in abundance (wi 0.89) (Tab. 2). The
composite “population size” model was ranked second (ΔAICc 5.14, wi 0.07 – species
prevalence; ΔAICc 4.25, wi 0.11 – index of change in abundance), but based on Akaike
weights was more than eight times less likely than the best ranking model. No other
models in the candidate set were supported (ΔAICc ≥ 23) (Tab. 2; Supplementary
material, Table S2). Bootstrap selection frequencies confirmed the strong evidence for a
correlation between fragmentation sensitivity and abundance in continuous forest:
12
55.9% of all cases (πi = 0.559) species prevalence and 62.6% (πi = 0.626) change in
abundance (Tab. 2). The regression coefficient indicated a positive association between
species prevalence (θ = 0.16) and change in abundance (θ = 0.95) with abundance in
continuous forest.
Trait-environment relationships
The RLQ analysis included all 26 bat species and showed a significant
relationship between species traits and environmental variables (P = 0.001). RLQ axis 1
accounted for 83.6% of the total co-inertia (i.e. link between the traits and
environmental variables) compared with 8.6% for the second axis (Tab. 3). This
represented 71.7% of the correlation expressed in the CA of species composition (table
L), and 81.6% and 93.3% of the variance expressed in the Hill-Smith PCA of the
environmental variables (table R) and ecological traits (table Q), respectively (Tab. 3).
The PCA plot of environmental variables and of the RLQ axis 1 shows opposite trends
between intact forest sites and fragmented habitats (Fig. 2a and 3). Continuous forest
interior sites and 100 ha fragment interiors showed greater species richness, indicating
that species richness increases with habitat integrity (Fig. 2a). Animalivores, canopy
foragers and large species were associated with continuous forest and 100 ha fragment
interiors. In comparison, high abundance in continuous forest, high matrix tolerance,
low edge-sensitivity, high relative wing loading and a plant diet were associated
positively with smaller fragments, edge and matrix habitats (Fig. 2 and 3). Aspect ratio,
dietary specialization, ESLIs, mobility, and an understory or opportunistic foraging
habit were traits not strongly correlated with the environmental variables (Fig. 3). Based
on the fourth-corner analysis, we found a significant relationship (P < 0.05) between
abundance in continuous forest and trophic level with the three environmental variables
size (1, 10, 100 ha fragments and continuous forest), habitat category 1 (fragments or
continuous forest), and habitat category 2 (interior, edge or matrix). Edge-sensitivity
and matrix tolerance were positively correlated with habitat category 2 (Fig. 4).
13
Table 1. Responses to forest fragmentation recorded for 26 bat species in the
fragmented landscape of the BDFFP, Brazil. Fragmentation sensitivity was assessed as
species prevalence (fraction of fragments occupied) and through an index of change in
abundance (decline/increase in species relative abundance relative to continuous forest
interior sites).
Species Acronym Fraction of
fragments occupied
Change in
abundance
Artibeus cinereus Acin 0.63 -2.022
Artibeus concolor Acon 0.50 -1.883
Artibeus gnomus Agno 0.38 -2.356
Artibeus lituratus Alit 0.38 -2.360
Artibeus obscurus Aobs 0.75 -0.753
Artibeus planirostris Apla 0.50 -1.889
Carollia brevicauda Cbre 0.88 -0.538
Carollia perspicillata Cper 1.00 2.450
Chrotopterus auritus Caur 0.25 -3.225
Desmodus rotundus Drot 0.25 -3.255
Glyphonycteris daviesi Gdav 0.00 -6.160
Lonchophylla thomasi Ltho 0.63 -1.198
Lophostoma schulzi Lsch 0.25 -3.238
Lophostoma silviculum Lsil 0.63 -1.487
Mesophylla macconnelli Mmac 0.50 -2.358
Micronycteris microtis Mmic 0.38 -2.851
Mimon crenulatum Mcre 0.50 -1.264
Phylloderma stenops Pste 0.25 -2.857
Phyllostomus discolor Pdis 0.25 -2.838
Phyllostomus elongatus Pelo 0.50 -2.023
Pteronotus parnellii Ppar 1.00 0.016
Rhinophylla pumilio Rpum 1.00 1.175
Tonatia saurophila Tsau 0.50 -0.753
Trachops cirrhosus Tcir 0.88 -0.677
Trinycteris nicefori Tnic 0.25 -3.238
Vampyressa bidens Vbid 0.25 -2.356

14
Table 2. The two best-supported models from the set of candidate GLMs for the two
measures of fragmentation sensitivity. Sample-size adjusted AIC (AICc), Akaike
differences (Δi), Akaike weights (wi), and bootstrap selection frequencies (πi), as well as
model-averaged parameter estimates (θ) and unconditional standard errors (SE) are
presented. Traits included in the population size model were: AC – abundance in
continuous forest; BM – body mass; TL – trophic level. Percentage deviance explained
(% dev.) is given for each response variable.
Response variable Model AICc Δi wi πi θ SE
Species prevalence Abundance in continuous forest (AC) -34.12 0.00 0.93 0.626 0.16 0.02
(% dev. = 75.9) Population size (AC + BM + TL) -28.99 5.14 0.07 0.194
Other models
> 23 0.00
Change in abundance Abundance in continuous forest (AC) 50.71 0.00 0.89 0.559 0.95 0.14
(% dev. = 82.3) Population size (AC + BM + TL) 54.96 4.25 0.11 0.215
Other models
> 25 0.00
Table 3. Results from RLQ analysis using environmental variables and species traits. a)
Eigenvalues (and % of total co-inertia) for the first two axes. Ordinations of tables R
(principal components analysis – PCA Hill-Smith), L (correspondence analysis – CA)
and Q (principal components analysis – PCA Hill-Smith). b) Summary of RLQ
analysis: eigenvalues and percentage of total co-inertia accounted for by the first two
RLQ axes, covariance and correlation (and % variance) with the correspondence
analysis of the L matrix, and projected variance (and % variance) with the R and Q
matrices.
Axis 1 (%) Axis 2 (%)
a)
R table PCA (Hill-Smith) 3 (20.00) 2 (13.33)
L table CA 0.15 (25.53) 0.08 (13.52)
Q table PCA (Hill-Smith) 3.81 (29.34) 3.26 (25.09)
b)
RLQ axis eigenvalues 0.69 (83.60) 0.07 (8.64)
Covariance 0.83 0.26
Correlation: L 0.28 (71.75) 0.13 (48.61)
Projected variance R 1.56 (81.60) 1.19 (4.16)
Projected variance Q 1.88 (93.35) 1.61 (6.20)
15
Fig. 2. Principal component analysis (PCA Hill-Smith) analyzing the covariation of
environmental variables (a) and ecological traits (b) across all 26 bat species. Abbreviations: a) CF = continuous forest; b) AC = abundance in continuous forest, BM = body mass, ES
= edge-sensitivity, MT = matrix tolerance, TL = trophic level, DB = dietary specialization, VS = vertical
stratification, MO = mobility, AR = aspect ratio, RWL = relative wing loading, ESLIc – ESLIk =
ecologically scaled landscape indices. See Table 1 for full species names.
Fig. 3. Plot of RLQ analysis relating bat species traits (black bars) and environmental
variables (grey bars) along RLQ axis 1. Abbreviations: CF = continuous forest, ESLIc – ESLIk =
ecologically scaled landscape indices.
16
Fig. 4. Fourth-corner correlations between species traits (rows) and environmental
variables (columns) using all 26 bat species. Black fields represent significant (P <
0.05) relationships based on 999 randomizations. Abbreviations: size (1, 10, 100 ha fragments
and continuous forest), Hc 1 = Habitat category 1 (fragments or continuous forest), Hc 2 = Habitat
category 2 (interior, edge or matrix).
Discussion
There has been a substantial impact of forest fragmentation on the bat
assemblages studied at the BDFFP, as evidenced by the observed patterns of species
prevalence and change in abundance in fragments relative to continuous forest controls.
For certain functional groups, like gleaning animalivorous bats, species prevalence and
change in abundance values were similar between this study and Meyer et al. (2008).
Unlike the response variable species prevalence, the index of abundance change allows
measuring the differences in species abundances between fragments and continuous
forest (Meyer et al. 2008), presenting a more informative framework for analyzing the
less abundant or rare species, which in turn should be more susceptible to local
extinction (Henle et al. 2004). However, species prevalence and change in abundance
showed no great differences in the choice of the best models, irrespective of whether the
data were corrected for phylogeny or not (see Supplementary material, Table S2 and
S3). Abundance in continuous forest was the ecological trait associated most strongly
with species vulnerability to fragmentation based on AICc (Table 2). The "population
size" model also received limited support and its ranking as the second best model is
probably due to its inclusion of abundance in continuous forest as a variable in this
composite model (Table 2). Ecological traits such as body mass, trophic level, dietary
specialization, vertical stratification, wing morphology, mobility and ESLIs did not
receive support as being good predictors (Table 2). The results of Meyer et al. (2008)
indicate abundance in continuous forest as the second best model for species

17
prevalence, but the regression coefficient values were low compared with the best
model in their study: edge-sensitivity.
Abundance in continuous forest, high trophic level, edge-sensitivity and matrix
tolerance received support as good predictors of species sensitivity based on the RLQ
and fourth-corner analysis (Table 3 and 4). The most abundant species such as Carollia
perspicillata, Carollia brevicauda and Rhinophylla pumilio apparently benefited from
fragmentation since they were recorded in a greater number of habitats, and thus can be
assumed to be less affected by demographic and environmental stochasticity (Lande et
al. 2003). Such results refute the arguments of Tilman et al. (1994) that abundant
species tend to be good competitors and poor dispersers, which would make them more
susceptible to extinction in fragmented landscapes, and agree with McCarthy et al.
(1997) in that poor competitors and rare species are more vulnerable to habitat loss.
Species that occur at low population densities in continuous forest present greater
difficulties in maintaining viable populations in small fragments (< 100 ha) and in the
secondary forest matrix, being driven to extinction faster.
Abundance in continuous forest and animalivorous bats showed positive
correlations with the structure and area of vegetation (Fig. 4), being the first positively
related with the fragment interior-edge-matrix gradient, and the second with continuous
forest interiors and 100 ha fragments, respectively (Fig. 2 and 3). Most species were
strongly associated with continuous forest interior sites and 100 ha fragments (i.e., with
greater forest integrity) (Fig. 2a), thus reflecting the fact that the intensity of
fragmentation effects was correlated with abundance in continuous forest. Probably the
lower prey abundances (e.g. small mammals, large arthropods) and roost availability at
edges, as well as in the matrix and small fragment interiors (≤ 10 ha) in the BDFFP
landscape (e.g. Gascon et al. 1999, Bobrowiec & Gribel 2010, Vasconcelos & Bruna
2012) make gleaning animalivorous bats highly dependent on continuous forest and
more vulnerable to fragmentation (Medellín et al. 2000, Meyer et al. 2008).
Environmental filters supposedly are less intense in continuous forest sites compared
with edge and matrix habitats, where have more microhabitats due to vertical
stratification (Jabot et al. 2008, Mayfield et al. 2009).
In spite of the low fragment-matrix contrast of the BDFFP landscape, edge-
sensitivity and matrix tolerance were associated with forest fragmentation (Fig. 2 and 3)
and with the fragment interior-edge-matrix-gradient (habitat category 2) (Fig. 4).
Species with lower edge-sensitivity also have a higher matrix tolerance, since edge and
18
matrix tolerance showed a significant, positive correlation (Pearson r = 0.44, P = 0.02).
These results demonstrate that the low contrast matrix filtering apparently takes place
for certain forest-interior species. Jantzen & Fenton (2013) found that the activity of
some insectivorous bat species in mixed deciduous-coniferous forest in Canada
increases after 40 m into the forest, and Delaval & Charles-Dominique (2006)
concluded that edge effects on frugivorous and nectarivorous bat communities in a
neotropical primary forest in French Guiana may occur up to 3 km into the forest.
Meyer et al. (2008) suggested that the high contrast between fragments and the matrix
in a landbridge island system explains the strong association between edge-sensitivity
and bat species vulnerability. In another study, Bobrowiec & Gribel (2010) at the
BDFFP observed that matrix tolerance for some phyllostomid bat species was directly
related to food preferences – Vismia spp., Cecropia spp. and Solanum spp. fruit plants.
Although species at higher trophic levels tend to be larger, and larger species
tend to be more vulnerable to fragmentation (e.g. Purvis et al. 2000, Henle et al. 2004),
the importance of body mass as predictor has been found to differ between studies. Our
study and Meyer et al. (2008), for example, found no strong association between body
mass and vulnerability. By contrast, Threlfall et al. (2011) found an association of
insectivorous bat species of greater body mass and open areas in an urban landscape,
and Hanspach et al. (2012) found that sites with dense tree cover were associated with
smaller species in a mosaic of forest and agriculture, both in Australia.
In the Neotropics many frugivorous and nectarivorous bat species adjust their
diet according to seasonal or local availability (Fleming 1986, Kunz & Ingalls 1994,
Ramos-Pereira et al. 2010a), and are often strongly associated with plants of disturbed
habitats, as the BDFFP matrix (Muscarella & Fleming 2007, Bobrowiec & Gribel
2010). Our results corroborate the findings of Safi & Kerth (2004) and Meyer et al.
(2008), who found no relationship between species most at risk of extinction and a
narrow dietary niche. In contrast, Duchamp & Swihart (2008) found a positive
relationship of forest cover with species characterized by a broad dietary niche in an
agriculturally-dominated, fragmented landscape in the USA.
Specialization in terms of their vertical foraging niche may render some bat
species vulnerable if a particular food item in a particular forest stratum declines as a
consequence of fragmentation (Bernard 2001, Kalko & Handley 2001). However, based
on our analysis, we cannot assert that the species occupying higher forest strata are
more vulnerable to fragmentation (Fig. 3). The majority of gleaning animalivorous bats
19
are generally associated with lower forest strata (Bernard 2001, Ramos-Pereira et al.
2010b, Rex et al. 2011). On the other hand, the height of capture may not reflect
foraging height, since there is often no clear distinction between many canopy and
understory species (Bernard 2001, Kalko & Handley 2001, Ramos-Pereira et al. 2010b,
Rex et al. 2011, Silva 2012).
Mobility was not a strong correlate of fragmentation sensitivity based on the
analyses (Fig. 3 and 4), which may be a result of: i) increased fragment connectivity in
response to the forest regenerating around the fragments, ii) low rate of recaptures, iii)
general lack of published studies on mobility patterns and home ranges. It is
recommended that future bat studies in the Amazon use radio-telemetry, which allows
assessing the movement, foraging patterns, roost use and minimum home ranges, once
the local landscape matrix is represented by large areas that, hypothetically, can reduce
the resources and interfere with species’ movement and habitat use. Mobility or
mobility-related traits received some support in Meyer et al. (2008), as ESLIs in the case
of the index of abundance change were the second best model, receiving still reasonably
high bootstrap frequencies. Due to a lack of data, the home range sizes (ESLIk) and
maximum dispersal distances (ESLIc) for many species had to be predicted by
regression. This may have resulted in a large variation in precision of the measures
among species. The low fragment-matrix contrast of the BDFFP landscape did not
prove the utility of the ESLIs.
In relation to wing morphology, aspect ratio was not an important predictor, and
relative wing loading, which takes into account the relative size of the bat, was
positively associated with forest fragmentation (Fig. 3), but both variables were not
significant in the fourth-corner analysis (Fig. 4). Threlfall et al. (2011) found an
association of insectivorous bat species with greater wing loading and open areas, and
Duchamp & Swihart (2008) found a positive relationship of forest cover with species
characterized by high wing-tip shape index in a fragmented landscape. In general, wing
morphology appears to have greater predictive power of the risk of extinction for open-
space aerial insectivorous bat species (Jones et al. 2003, Safi & Kerth 2004, Threlfall et
al. 2011, Duchamp & Swihart, 2008), however, not for strongly forest-dependent bats,
as was the case here and in Meyer et al. (2008).
20
Conclusions
Our study in a system of low structural contrast between fragments and the
intervening matrix indicates four main species traits related to bat species vulnerability
to fragmentation at the local scale: abundance in continuous forest, trophic level, edge-
sensitivity and matrix tolerance. Our results support that environmental filters and
ecological traits consistently shape the bat assemblages in the BDFFP fragmented
landscape, suggesting that environmental variables particularly related to habitat-
categories, will selectively benefit the most abundant, more matrix tolerant, less edge-
sensitive and frugivorous species in this fragmented landscape. The degree of contrast
between fragments and the matrix and temporal heterogeneity of secondary vegetation
(i.e. quality and type of the matrix) are crucial for the maintenance of viable bat
populations in small fragments (≤ 10 ha) (e.g. Cosson et al. 1999, Estrada & Coates-
Estrada 2002, Bernard & Fenton 2003, Faria 2006, Meyer & Kalko 2008, Bobrowiec &
Gribel 2010). Our results suggest that species with greater ability to use the matrix (i.e.
most frugivorous phyllostomid bats) are also the ones that occupy the small fragments
(≤ 10 ha). This insight provides an applied tool for landscape management where the
structural and functional connectivity among remnant patches is a main factor for
persistence and dispersal of the species, in particular for the moderately sensitive. As a
practical suggestion to minimize local extinctions, investment in the creation,
restoration and maintenance of natural corridors in fragmented landscapes is
recommended, as well as the management of the matrix by improving its quality, since
the matrix functions as a buffer zone to edge effects, increasing the effective interior
area of fragments (Mesquita et al. 1999, Antongiovanni & Metzger 2005).
References
Albrecht, L., Meyer, C.F.J. & Kalko, E.K.V. (2007) Differential mobility in two small
phyllostomid bats, Artibeus watsoni and Micronycteris microtis, in a fragmented
Neotropical landscape. Acta Theriologica, 52, 141-149.
Antongiovanni, M. & Metzger, J.P. (2005) Influence of matrix habitats on the
occurrence of insectivorous bird species in Amazonian forest fragments. Biological
Conservation, 122, 441-451.
Bernard, E. (2001) Vertical stratification of bat communities in primary forests of
Central Amazon, Brazil. Journal of Tropical Ecology, 17, 115-126.
Bernard, E. (2002) Diet, activity and reproduction of bat species (Mammalia,
Chiroptera) in Central Amazonia, Brazil. Zoologia, 19, 173-188.
21
Bernard, E. & Fenton, M.B. (2003) Bat mobility and roosts in a fragmented landscape
in Central Amazonia, Brazil. Biotropica, 35, 262-277.
Bernard, E. & Fenton, M.B. (2007) Bats in a fragmented landscape: species
composition, diversity and habitat interactions in savannas of Santarém, Central
Amazonia, Brazil. Biological Conservation, 134, 332-343.
Bobrowiec, P.E.D. & Gribel, R. (2010) Effects of different secondary vegetation types
on bat community composition in Central Amazonia, Brazil. Animal Conservation,
13, 204-216.
Boyle, J.G. & Storn, J.J. (2007) The perils of picky eating: dietary breadth is related to
extinction risk in insectivorous bats. Plos One, 2, e672.
Bradshaw, C.J.A., Sodhi, N.S. & Brook, B.W. (2009) Tropical turmoil: a biodiversity
tragedy in progress. Frontiers in Ecology and the Environment, 7, 79-87.
Brosset, A., Charles-Dominique P., Cockle, A., Cosson, J.F. & Masson, D. (1996) Bat
communities and deforestation in French Guiana. Canadian Journal of Zoology, 74,
1974-1982.
Burnham, K.P. & Anderson, D.R. (2002) Model Selection and Inference: a Practical
Information-Theoretic Approach. Springer, New York.
Cardillo, M., Mace, G.M., Gittleman, J.L., Jones, K.E., Bielby, J. & Purvis, A. (2008)
The predictability of extinction: biological and external correlates of decline in
mammals. Proceedings of the Royal Society B: Biological Sciences, 275, 1441-1448.
Charles-Dominique, P., Brosset, A. & Jouard, S. (2001) Les chauves-souris de Guyane.
Patrimoines Naturels, 49, 1-150.
Corlett, R.T. & Primack, R.B. (2008) Tropical rainforest conservation: a global
perspective. Tropical Forest Community Ecology (eds W.P. Carson & S.A.
Schnitzer). Oxford, UK: Wiley-Blackwell.
Cosson, J., Pons, J. & Masson, D. (1999) Effects of forest fragmentation on frugivorous
and nectarivorus bats in French Guiana. Journal of Tropical Ecology, 15, 515-534.
Crawley, M.J. (2005) Statistics: an Introduction Using R. John Wiley, New York.
Davidson, A.D., Hamilton, M.J., Boyer, A.G., Brown, J.H. & Ceballos, G. (2009)
Multiple ecological pathways to extinction. PNAS, 106, 10702-10705,
Davies, K.F., Margules, C.R. & Lawrence, J.F. (2000) Which traits of species predict
population declines in experimental forest fragments? Ecology, 81, 1450-1461.
DeFries, R.S., Rudel, T., Uriarte, M. & Hansen, M. (2010) Deforestation driven by
urban population growth and agricultural trade in the twenty-first century. Nature
Geoscience, 3, 178-181.
Delaval, M. & Charles-Dominique, P. (2006) Edge effects on frugivorous and
nectarivorous bat communities in a neotropical primary forest in French Guiana.
Revue d'Ecologie la Terre et la Vie, 61, 343-352.
Dolédec, S., Chessel, D., Ter Braak, C.J.F. & Champely, S. (1996) Matching species
traits to environmental variables: a new three-table ordination methods.
Environmental and Ecological Statistics, 3, 143-166.
Dray, S. & Dufour, A.B. (2007) The ade4 package: implementing the duality diagram
for ecologists. Journal of Statistical Software, 22, 1-20.

22
Dray, E. & Legendre, P. (2008) Testing the species traits-environmental relationships:
the fourth-corner problem revisited. Ecology, 89, 3400-3412.
Duchamp, J.E. & Swihart, R.K. (2008) Shifts in bat community structure related to
evolved traits and features of human-altered landscapes. Landscape Ecology, 23, 849-
860.
Estrada, A. & Coates-Estrada, R. (2001) Bats species richness in live and corridors of
residual rain forest vegetation at Los Tuxtlas, Mexico. Ecography, 24, 94-102.
Estrada, A., Jiménez, C., Rivera, A. & Fuentes, E. (2004) General bat activity measured
with an ultrasound detector in a fragmented tropical landscape in Los Tuxtlas,
Mexico. Animal Biodiversity and Conservation, 27, 5-13.
Estrada-Villegas, S., Meyer, C.F.J. & Kalko, E.K.V. (2010) Effects of tropical forest
fragmentation on aerial insectivorous bats in a land-bridge island system. Biological
Conservation, 143, 597-608.
Faria, D. (2006) Phyllostomid bats of a fragmented landscape in the north-eastern
Atlantic forest. Journal of Tropical Ecology, 22, 531-542
Fearnside, P.M. (2003) A Floresta Amazônica nas Mudanças Globais. Manaus: INPA.
Felsestein, J. (1985) Phylogenies and the comparative method. American Naturalist,
125, 1-15.
Fenton, M.B., Acharya, L., Audet, D., Hickey, M.B.C., Merriman, C., Obrist, M.K. &
Syme, D.M. (1992) Phyllostomid bats (Chiroptera: Phyllostomidae) as indicators of
habitat disruption in the neotropics. Biotropica, 24, 440-446.
Fleming, T.H. (1986) Opportunism versus specialization: the evolution of feeding
strategies in frugivorous bats. Frugivores and seed dispersal (eds A. Estrada & T.H.
Fleming), pp. 105-118. Dr. W. Junk Publishers, Dordrecht.
Gardner, A.L. (2008) Mammals of South America, Vol. 1: Marsupials, Xenarthrans,
Shrews and Bats. The University of Chicago Press, Chicago and London.
Garland, T. Jr, Harvey, P.H. & Ives, A.R. (1992) Procedures for the analysis of
comparative data using phylogenetically independent contrasts. Systematic Biology,
41, 18-32.
Gascon, C., Lovejoy, T.E., Bierregaard, R.O., Malcolm, J.R., Stouffer, P.C.,
Vasconcelos, H.L., Laurance, W.F., Zimmerman, B., Tocher, M., Borges, S. (1999)
Matrix habitat and species richness in tropical forest remnants. Biological
Conservation, 91, 223-229.
Gascon, C., Bierregaard, R.O., Laurance, W.F. & Rankin-de Merona, J. (2001)
Deforestation and forest fragmentation in the Amazon. Lessons from Amazonia:
ecology and conservation of a fragmented forest (eds R.O. Bierregaard, C. Gascon,
T.E. Lovejoy & R. Mesquita), pp. 22-30. New Haven: Yale University Press.
Giannini, N.P. & Kalko, E.K.V. (2005) The guild structure of animalivorous leaf-nosed
bats of Barro Colorado Island, Panama, revisited. Acta Chiropterologica, 7, 131-146.
Grelle, C.E.V. (2005) Predicting extinction of mammals in the Brazilian Amazon. Oryx,
39, 347-350.
23
Hansen, M.C., Stehman, S.V., Potapov, P.V., Loveland, T.R., Townshend, J.R.,
DeFries, R.S., Pittman, K.W., Arunarwati, B., Stolle, F., Steininger, M.K., Carroll, M.
& DiMiceli, C. (2008) Humid tropical forest clearing from 2000 to 2005 quantified
by using multitemporal and multiresolution remotely sensed data. PNAS, 105, 9439-
9444.
Hanspach, J., Fischer, J., Ikin, K., Stott, J. & Law, B.S. (2012) Using trait-based
filtering as a predictive framework for conservation: a case study of bats on farms in
southeastern Australia. Journal of Applied Ecology, 49, 842-850.
Harper, K.A., MacDonald, S.E., Burton, P.E., Chen, J., Brosofske, K.D., Saunders,
S.C., Euskirchen, E.S., Roberts, D., Maiteh, M.S. & Esseen, P.-A. (2005) Edge
influence on forest structure and composition in fragmented landscapes. Conservation
Biology, 19, 768-782.
Heithaus, E.R., Fleming, T.H. & Opler, P.A. (1975) Foraging patterns and resource
utilization in seven species of bats in a seasonal tropical forest. Ecology, 56, 841-854.
Henle, K., Davies, K.F., Kleyer, M., Margules, C. & Settele, J. (2004) Predictors of
species sensitivity to fragmentation. Biodiversity and Conservation, 13, 207-251.
Henry, M. & Kalko, E.K.V. (2007) Foraging strategy and breeding constraints of
Rhinophylla pumilio (Phyllostomidae) in the Amazon lowlands. Journal of
Mammalogy, 88, 81-93.
Hill, M.O. & Smith, A.J.E. (1976) Principal component analysis of taxonomic data with
multi-state discrete characters. Taxon, 25, 249-255.
Instituto Nacional de Pesquisas Espaciais [INPE]. (2013) Deforestation estimates for
the brazilian Amazon. São José dos Campos, Brazil.
Jabot, F., Etienne, R.S. & Chave, J. (2008) Reconciling neutral community models and
environmental filtering: theory and an empirical test. Oikos, 117, 1308-1320.
Jantzen, M.K. & Fenton, M.B. (2013) The depth of edge influence among insectivorous
bats at forest-field interfaces. Canadian Journal of Zoology, 91, 287-292.
Jones, G., Jacobs, D.S., Kunz, T.H., Willig, M.R. & Racey, P.A. (2009) Carpe noctem:
the importance of bats as bioindicators. Endangered Species Research, 8, 93-115.
Jones, K.E., Purvis, A. & Gittleman, J.L. (2003) Biological correlates of extinction risk
in bats. The American Naturalist, 161, 601-614.
Jones, K.E., Purvis, A., MacLarnon, A., Bininda-Emonds, O.R.P. & Simmons, N.B.
(2002) A phylogenetic supertree of the bats (Mammalia: Chiroptera). Biological
Reviews of the Cambridge Philosophical Society, 77, 223-259.
Kalko, E.K.V. (1998) Organisation and diversity of tropical bat communities through
space and time. Zoology, 101, 281-297.
Kalko, E.K.V. & Handley, C.O. Jr (2001) Neotropical bats in the canopy: diversity,
community structure, and implications for conservation. Plant Ecology, 153, 319-
333.
Kirby, K.R., Laurance, W.F., Albernaz, A.L.K.M., Schroth, G., Fearnside, P.M.,
Bergen, S., Venticinque, E.M. & Costa, C.D. (2006) The future of deforestation in the
Brazilian Amazon. Futures, 38, 432-453.

24
Kunz, T.H. & Fenton, M.B. (2003) Bat ecology. Chicago: The University of Chicago
Press.
Kunz, T.H. & Ingalls, K.A. (1994) Folivory in bats: an adaptation derived from
frugivory. Functional Ecology, 8, 665-668.
Kunz, T.H., Torrez, E.B., Bauer, D., Lobova, T. & Fleming, T.H. (2011) Ecosystem
services provided by bats. Annals of the New York Academy of Sciences. 1-38p.
Lande, R., Engen, S. & Sæther, B-E. (2003) Stochastic population dynamics in ecology
and conservation. Oxford University Press.
Laurance, W.F. (2001) The hyper-diverse flora of the central Amazon: an overview.
Lessons from Amazonia: ecology and conservation of a fragmented forest (eds R.O.
Bierregaard, C. Gascon, T.E. Lovejoy & R. Mesquita), pp. 47-53. New Haven: Yale
University Press.
Laurance, W.F. (2007) Have we overstated the tropical biodiversity crisis? Trends in
Ecology and Evolution, 22, 65-70.
Laurance, W.F., Camargo, J., Luizão, R., Laurance, S., Pimm, S., Bruna, E., Stouffer,
P., Williamson, G., Benitez-Malvido, J., Vasconcelos, H., Van Houtan, K., Zartman,
C., Boyle, S., Didham, R., Andrade, A. & Lovejoy, T.E. (2011) The fate of
Amazonian forest fragments: a 32-year investigation. Biological Conservation, 144,
56-67.
Laurance, W.F., Fearside, P.M., Laurance, S.G., Delamônica, P., Lovejoy, T.E.,
Rankin-de Merona, J.M., Chambers, J.Q. & Gascon, C. (1999) Relationship between
soils and amazon forest biomass: a landscape-scale study. Forest Ecology and
Management, 118, 127-138.
Legendre, P., Galzin, R. & Harmelin-Vivien, M.L. (1997) Relating behavior to habitat:
solutions to the fourth-corner problem. Ecology, 78, 547-562.
Lim, B.K. & Engstrom, M.D. (2001) Species diversity of bats (Mammalia: Chiroptera)
in Iwokrama Forest, Guyana, and the Guianan subregion: implications for
conservation. Biodiversity and Conservation, 10, 613-657.
Lovejoy, T.E. & Bierregaard, R.O. (1990) Central amazonian forests and the minimum
critical size of ecosystems project. Four Neotropical Rainforests (ed A.H. Gentry).
Yale University Press, New Haven.
Macedo, M.N., DeFries, R.S., Morton, D.C., Stickler, C.M., Galford, G.L. &
Shimabukuro, Y.E. (2012) Decoupling of deforestation and soy production in the
southern Amazon during the late 2000s. PNAS, 109, 1341–1346.
Mayfield, M.M., Boni, M.F. & Ackerly, D.D. (2009) Traits, habitats, and clades:
identifying traits of potential importance to environmental filtering. The American
Naturalist, 174, 1-22.
Mazerolle, M.J. (2013) AICcmodavg: model selection and multimodel inference based
on (Q)AIC(c). R package version 3.0.1.
McCarthy, M.A., Lindenmayer, D.B. & Drechsler, M. (1997) Extinction debts and risks
faced by abundant species. Conservation Biology, 11, 221-226.
Medellín, R.A., Equihua, M. & Amin, M.A. (2000) Bat diversity and abundance as
indicators of disturbance in neotropical rainforests. Conservation Biology, 14, 1666-
1675.

25
Medina, A., Harvey, C.A., Sanchez, D., Vilchez, S. & Hernandez, B. (2007) Bat
diversity and movement in a Neotropical agricultural landscape. Biotropica, 39, 120-
128.
Mesquita, R.C.G., Delamônica, P. & Laurance, W.F. (1999) Effect of surrounding
vegetation on edge-related tree mortality in Amazonian forest fragments. Biological
Conservation, 91, 129-134.
Meyer, C.F.J., Fründ, J., Lizano, W.P. & Kalko, E.K.V. (2008) Ecological correlates of
vulnerability to fragmentation in Neotropical bats. Journal of Applied Ecology, 45,
381-391.
Meyer, C.F.J. & Kalko, E.K.V. (2008) Assemblage-level responses of phyllostomid
bats to tropical forest fragmentation: land-bridge islands as a model system. Journal
of Biogeography, 35, 1711-1726.
Morris, R.J. (2010) Anthropogenic impacts on tropical forest biodiversity: a network
structure and ecosystem functioning perspective. Philosophical Transactions of the
Royal Society, 365, 3709-3718.
Muscarella, R. & Fleming, T. H. (2007) The role of frugivorous bats in forest sucession.
Biological Reviews, 82, 573-590.
Norberg, U.M. (1998) Morphological adaptations for flight in bats. Bat Biology and
Conservation (eds T.H. Kunz & P.A. Racey), pp. 93-108. Smithsonian Institution
Press, Washington, DC.
Norberg, U.M. & Rayner, J.M.V. (1987) Ecological morphology and flight in bats
(Mammalia; Chiroptera): wing adaptations, flight performance, foraging strategy and
echolocation. Philosophical Transactions of the Royal Society London, Series B, 316,
335-427.
Oliveira, A.A. & Mori, S.A. (1999) A Central Amazonian terra firme forest. I. High tree
species richness on poor soils. Biodiversity and Conservation, 8, 1219-1244.
Paradis, E., Claude, J. & Strimmer, K. (2004) APE: analyses of phylogenetics and
evolution in R language. Bioinformatics, 20, 289-290.
Peel, M.C., Finlayson, B.L. & McMahon, T.A. (2007) Updated world map of the
Köppen-Geiger climate classification. Hydrology and Earth System Sciences, 11,
1633-1644.
Presley, S.J., Willig, M.R., Castro-Arellano, I. & Weaver, S.C. (2009) Effects of habitat
conversion on temporal activity patterns of phyllostomid bats in lowland Amazonian
rainforest. Journal of Mammalogy, 90, 210-221.
Purvis, A., Gittleman, J.L., Cowlishaw, G. & Mace, G.M. (2000) Predicting extinction
risk in declining species. Proceedings of the Royal Society London, Series B, 267,
1947-1952.
R Development Core Team (2013) R: a Language and Environment for Statistical
Computing. R Foundation for Statistical Computing, Vienna, Austria. Available at:
http://www.R-project.org, accessed June 2013.
Ramos-Pereira, M.J., Marques J.T. & Palmeirim J.M. (2010a) Ecological responses of
frugivorous bats to seasonal fluctuation in fruit availability in Amazonian
forests. Biotropica, 42, 680-687.
26
Ramos-Pereira, M.J., Marques, J.T. & Palmeirim, J.M. (2010b) Vertical stratification of
bat assemblages in flooded and unflooded Amazonian forests. Current Zoology, 56,
469-478.
Rankin-de Merona, J.M., Prance, G.T., Hutchings, R.W., Silva, F.M., Rodrigues, W.A.
& Uehling M.E. (1992) Preliminary results of large scale tree inventory of upland
rain forest in the central Amazon. Acta Amazonica, 22, 493-534.
Rex, K., Michener, R., Kunz, T.H. & Voigt, C.C. (2011) Vertical stratification of
Neotropical leaf-nosed bats (Phyllostomidae: Chiroptera) revealed by stable carbon
isotopes. Journal of Tropical Ecology, 27, 211-222.
Safi, K. & Kerth, G. (2004) Acomparative analysis of specialization and extinction risk
in temperate-zone bats. Conservation Biology, 18, 1293-1303.
Sampaio, E.M. 2000. Effects of forest fragmentation on the diversity and abundance
patterns of Central Amazonian bats. PhD thesis. Tübingen University, Germany.
Silva, I.M.S. (2012) Estratificação vertical e efeito da fragmentação numa comunidade
de morcegos (Chiroptera, Mammalia) na Amazónia Central. Master thesis,
Universidade de Lisboa, Portugal.
Simmons, N.B. (2005) Order Chiroptera. Mammal Species of the World: a Taxonomic
and Geographic Reference (eds D.E. Wilson & D.M. Reeder), pp. 312-529. Johns
Hopkins University Press, Baltimore, MD.
Simmons, N.B. & Voss, R.S. (1998) The mammals of Paracou, French Guiana: a
neotropical lowdland rainforest fauna. part 1. Bats. Bulletin of the American Museum
of Natural History, 237, 1-219.
Swihart, R.K., Atwood, T.C., Goheen, J.E., Scheiman, D.M., Munroe, K.E. & Gehring,
T.M. (2003) Patch occupancy of North American mammals: is patchiness in the eye
of the beholder? Journal of Biogeography, 30, 1259-1279.
Swihart, R.K. & Verboom, J. (2004) Using ecologically scaled landscape indices to
assess biodiversity consequences of land-use decisions. Conserving Biodiversity in
Agricultural Landscapes: Model-Based Planning Tools (eds R.K. Swihart & J.E.
Moore), pp. 81–101. Purdue University Press, West Lafayette.
Thies, W. & Kalko, E.K.V. (2004) Phenology of Neotropical pepper plants (Piperaceae)
and their association with their main dispersers, two short-tailed fruit bats, Carollia
perspicillata and C. castanea (Phyllostomidae). Oikos, 104, 362-376.
Threlfall, C., Law, B., Penman, T. & Banks, P.B. (2011) Ecological processes in urban
landscapes: mechanisms influencing the distribution and activity of insectivorous
bats. Ecography, 34, 814-826.
Tilman, D., May, R.M., Lehman, C.L. & Nowak, M.A. (1994) Habitat destruction and
the extinction debt. Nature, 371, 65-66.
Vasconcelos, H.L. & Bruna, E.M. (2012) Arthropod responses to the experimental
isolation of Amazonian forest fragments. Zoologia, 29, 515-530.
Vos, C.C., Verboom, J., Opdam, P.F.M. & ter Braak, C.J.F. (2001) Toward ecologically
scaled landscape indices. The American Naturalist, 183, 24-41.
Wearn, O.R., Reuman, D.C. & Ewers, R.M. (2012) Extinction debt and windows of
conservation opportunity in the Brazilian Amazon. Science, 337, 228-232.

27
Supplementary material
Table S1 Explanatory variables used in modeling fragmentation sensitivity.
Table S2 AIC model selection results based on analyses with phylogenetic correction.
Table S3 AIC model selection results based on analyses without phylogenetic correction.
Figure S1 Plot used to group species into three mobility categories.
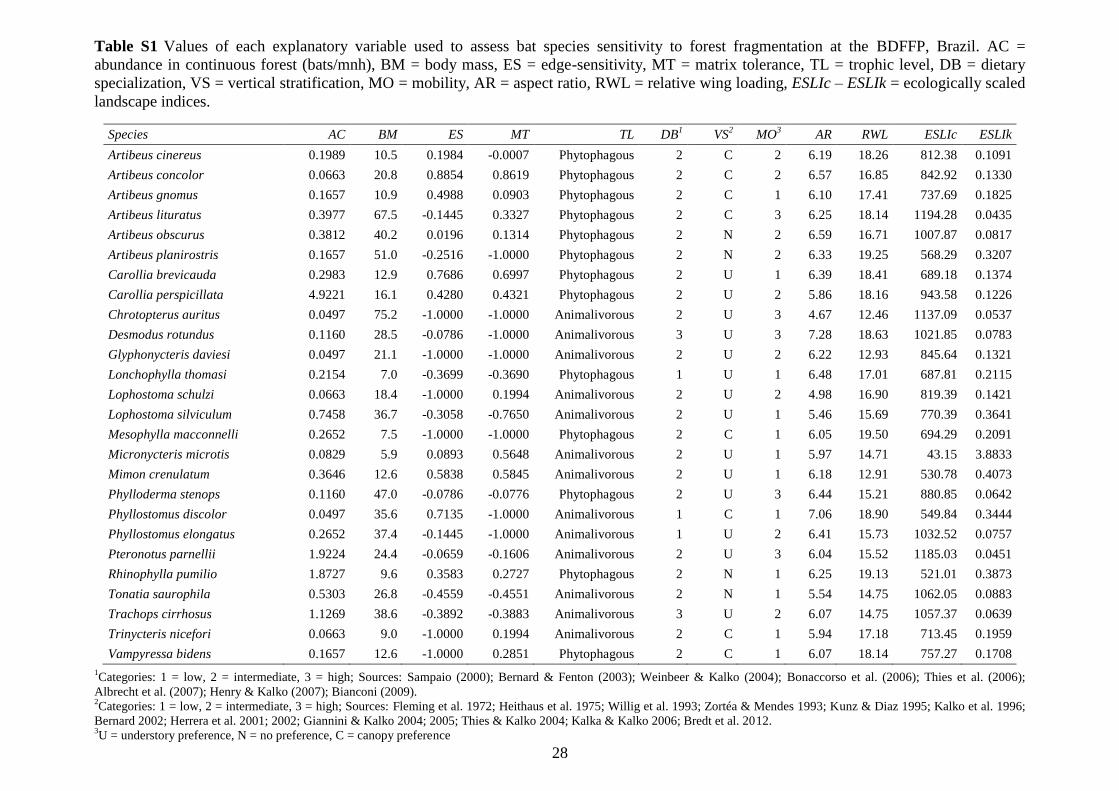
28
Table S1 Values of each explanatory variable used to assess bat species sensitivity to forest fragmentation at the BDFFP, Brazil. AC =
abundance in continuous forest (bats/mnh), BM = body mass, ES = edge-sensitivity, MT = matrix tolerance, TL = trophic level, DB = dietary
specialization, VS = vertical stratification, MO = mobility, AR = aspect ratio, RWL = relative wing loading, ESLIc – ESLIk = ecologically scaled
landscape indices.
Species AC BM ES MT TL DB1 VS
2 MO
3 AR RWL ESLIc ESLIk
Artibeus cinereus 0.1989 10.5 0.1984 -0.0007 Phytophagous 2 C 2 6.19 18.26 812.38 0.1091
Artibeus concolor 0.0663 20.8 0.8854 0.8619 Phytophagous 2 C 2 6.57 16.85 842.92 0.1330
Artibeus gnomus 0.1657 10.9 0.4988 0.0903 Phytophagous 2 C 1 6.10 17.41 737.69 0.1825
Artibeus lituratus 0.3977 67.5 -0.1445 0.3327 Phytophagous 2 C 3 6.25 18.14 1194.28 0.0435
Artibeus obscurus 0.3812 40.2 0.0196 0.1314 Phytophagous 2 N 2 6.59 16.71 1007.87 0.0817
Artibeus planirostris 0.1657 51.0 -0.2516 -1.0000 Phytophagous 2 N 2 6.33 19.25 568.29 0.3207
Carollia brevicauda 0.2983 12.9 0.7686 0.6997 Phytophagous 2 U 1 6.39 18.41 689.18 0.1374
Carollia perspicillata 4.9221 16.1 0.4280 0.4321 Phytophagous 2 U 2 5.86 18.16 943.58 0.1226
Chrotopterus auritus 0.0497 75.2 -1.0000 -1.0000 Animalivorous 2 U 3 4.67 12.46 1137.09 0.0537
Desmodus rotundus 0.1160 28.5 -0.0786 -1.0000 Animalivorous 3 U 3 7.28 18.63 1021.85 0.0783
Glyphonycteris daviesi 0.0497 21.1 -1.0000 -1.0000 Animalivorous 2 U 2 6.22 12.93 845.64 0.1321
Lonchophylla thomasi 0.2154 7.0 -0.3699 -0.3690 Phytophagous 1 U 1 6.48 17.01 687.81 0.2115
Lophostoma schulzi 0.0663 18.4 -1.0000 0.1994 Animalivorous 2 U 2 4.98 16.90 819.39 0.1421
Lophostoma silviculum 0.7458 36.7 -0.3058 -0.7650 Animalivorous 2 U 1 5.46 15.69 770.39 0.3641
Mesophylla macconnelli 0.2652 7.5 -1.0000 -1.0000 Phytophagous 2 C 1 6.05 19.50 694.29 0.2091
Micronycteris microtis 0.0829 5.9 0.0893 0.5648 Animalivorous 2 U 1 5.97 14.71 43.15 3.8833
Mimon crenulatum 0.3646 12.6 0.5838 0.5845 Animalivorous 2 U 1 6.18 12.91 530.78 0.4073
Phylloderma stenops 0.1160 47.0 -0.0786 -0.0776 Phytophagous 2 U 3 6.44 15.21 880.85 0.0642
Phyllostomus discolor 0.0497 35.6 0.7135 -1.0000 Animalivorous 1 C 1 7.06 18.90 549.84 0.3444
Phyllostomus elongatus 0.2652 37.4 -0.1445 -1.0000 Animalivorous 1 U 2 6.41 15.73 1032.52 0.0757
Pteronotus parnellii 1.9224 24.4 -0.0659 -0.1606 Animalivorous 2 U 3 6.04 15.52 1185.03 0.0451
Rhinophylla pumilio 1.8727 9.6 0.3583 0.2727 Phytophagous 2 N 1 6.25 19.13 521.01 0.3873
Tonatia saurophila 0.5303 26.8 -0.4559 -0.4551 Animalivorous 2 N 1 5.54 14.75 1062.05 0.0883
Trachops cirrhosus 1.1269 38.6 -0.3892 -0.3883 Animalivorous 3 U 2 6.07 14.75 1057.37 0.0639
Trinycteris nicefori 0.0663 9.0 -1.0000 0.1994 Animalivorous 2 C 1 5.94 17.18 713.45 0.1959
Vampyressa bidens 0.1657 12.6 -1.0000 0.2851 Phytophagous 2 C 1 6.07 18.14 757.27 0.1708
1Categories: 1 = low, 2 = intermediate, 3 = high; Sources: Sampaio (2000); Bernard & Fenton (2003); Weinbeer & Kalko (2004); Bonaccorso et al. (2006); Thies et al. (2006);
Albrecht et al. (2007); Henry & Kalko (2007); Bianconi (2009). 2Categories: 1 = low, 2 = intermediate, 3 = high; Sources: Fleming et al. 1972; Heithaus et al. 1975; Willig et al. 1993; Zortéa & Mendes 1993; Kunz & Diaz 1995; Kalko et al. 1996;
Bernard 2002; Herrera et al. 2001; 2002; Giannini & Kalko 2004; 2005; Thies & Kalko 2004; Kalka & Kalko 2006; Bredt et al. 2012. 3U = understory preference, N = no preference, C = canopy preference
29
References to Table S1
Albrecht, L., Meyer, C.F.J. & Kalko, E.K.V. (2007) Differential mobility in two small
phyllostomid bats, Artibeus watsoni and Micronycteris microtis, in a fragmented
Neotropical landscape. Acta Theriologica, 52, 141-149.
Bernard, E. (2002) Diet, activity and reproduction of bat species (Mammalia,
Chiroptera) in Central Amazonia, Brazil. Zoologia, 19, 173-188.
Bernard, E. & Fenton, M.B. (2003) Bat mobility and roosts in a fragmented landscape
in Central Amazonia, Brazil. Biotropica, 35, 262-277.
Bianconi, G.V. (2009) Morcegos frugívoros no uso do hábitat fragmentado e seu
potencial para a recuperação de áreas degradadas: subsídios para uma nova
ferramenta voltada à conservação. PhD thesis. Universidade Estadual Paulista “Júlio
de Mesquita Filho”, Brazil.
Bonaccorso, F.J., Winkelmann, J.R., Shin, D., Agrawal, C.I., Aslami, N., Bonne, C.,
Hsu, A., Jekielek, P.E., Knox, A.K., Kopach, S.J., Jennings, T.D., Lasky, J.R.,
Menesale, S.A., Richards, J.H., Rutland, J.A., Sessa, A.K., Zhaurova, L. & Kunz,
T.H. (2006) Evidence for exploitative competition: Comparative foraging behavior
and roosting ecology of short-tailed fruit bats (Phyllostomidae). Biotropica, 39, 249-
256.
Bredt, A., Uieda W. & Pedro W.A. (2012) Plantas e morcegos: na recuperação de
áreas degradadas e na paisagem urbana. Brasília: Rede de Sementes do Cerrado.
273p.
Fleming, T.H., Hooper, E.T. & Wilson, D.E. (1972) Three Central American bat
communities: Structure, reproductive cycles, and movement patterns. Ecology, 53,
555-569.
Giannini, N.P. & Kalko, E.K.V. (2004) Trophic structure in a large assemblage of
phyllostomid bats in Panama. Oikos, 105, 209-220.
Giannini, N.P. & Kalko, E.K.V. (2005) The guild structure of animalivorous leaf-nosed
bats of Barro Colorado Island, Panama, revisited. Acta Chiropterologica, 7, 131-146.
Heithaus, E.R., Fleming, T.H. & Opler, P.A. (1975) Foraging patterns and resource
utilization in seven species of bats in a seasonal tropical forest. Ecology, 56, 841-854.
Henry, M. & Kalko, E.K.V. (2007) Foraging strategy and breeding constraints of
Rhinophylla pumilio (Phyllostomidae) in the Amazon lowlands. Journal of
Mammalogy, 88, 81-93.
Herrera, L.G., Gutierrez, E., Hobson, K.A., Altube, B., Diaz, W.G. & Sanchez-Cordero,
V. (2002) Sources of assimilated protein in five species of New World frugivorous
bats. Oecologia, 133, 280- 287.
Herrera, M.L.G., Hobson, K.A., Mirón, M.L., Ramírez, P.N., Méndez, C.G. & Sánchez-
Cordero, V. (2001) Sources of protein in two species of phytophagous bats in a
seasonal dry forest: Evidence from stable-isotope analysis. Journal of Mammalogy,
82, 352-361.
Kalka, M. & Kalko, E.K.V. (2006) Gleaning bats as underestimated predators of
herbivorous insects: diet of Micronycteris microtis (Phyllostomidae) in Panama.
Journal of Tropical Ecology, 22, 1-10.
30
Kalko, E.K.V., Handley, C.O. Jr. & Handley, D. (1996) Organization, diversity and
long-term dynamics of a Neotropical bat community. Long-Term Studies in
Vertebrate Communities (eds M.L. Cody & J. Smallwood), pp. 503-553. Academic
Press, Los Angeles.
Kunz, T.H. & Diaz, C.A. (1995) Folivory in fruit-eating bats, with new evidence from
Artibeus jamaicensis (Chiroptera: Phyllostomidae). Biotropica, 27, 106-120.
Sampaio E. M. (2000) Effects of forest fragmentation on the diversity and abundance
patterns of Central Amazonian bats. PhD thesis. Tübingen University, Germany.
Thies, W. & Kalko, E.K.V. (2004) Phenology of Neotropical pepper plants (Piperaceae)
and their association with their main dispersers, two short-tailed fruit bats, Carollia
perspicillata and C. castanea (Phyllostomidae). Oikos, 104, 362-376.
Thies, W., Kalko, E.K.V. & Schnitzler, H.U. (2006) Influence of environment and
resource availability on activity patterns of Carollia castanea (Phyllostomidae) in
Panama. Journal of Mammalogy, 87, 331-338
Weinbeer, M. & E.K.V. Kalko. (2004) Morphological characteristics predict alternate
foraging strategy and microhabitat selection in the Orange-bellied Bat,
Lampronycteris brachyotis. Journal of Mammalogy, 85, 1116-1123.
Willig, M.R., Camilo, G.R. & Noble, S.J. (1993) Dietary overlap in frugivorous and
insectivorous bats from edaphic Cerrado habitats of Brazil. Journal of Mammalogy,
74, 117-128.
Zortéa, M. & Mendes, S.L. (1993) Folivory in the big fruit-eating bat, Artibeus lituratus
(Chiroptera: Phyllostomidae) in eastern Brazil. Journal of Tropical Ecology, 9, 117-
120.
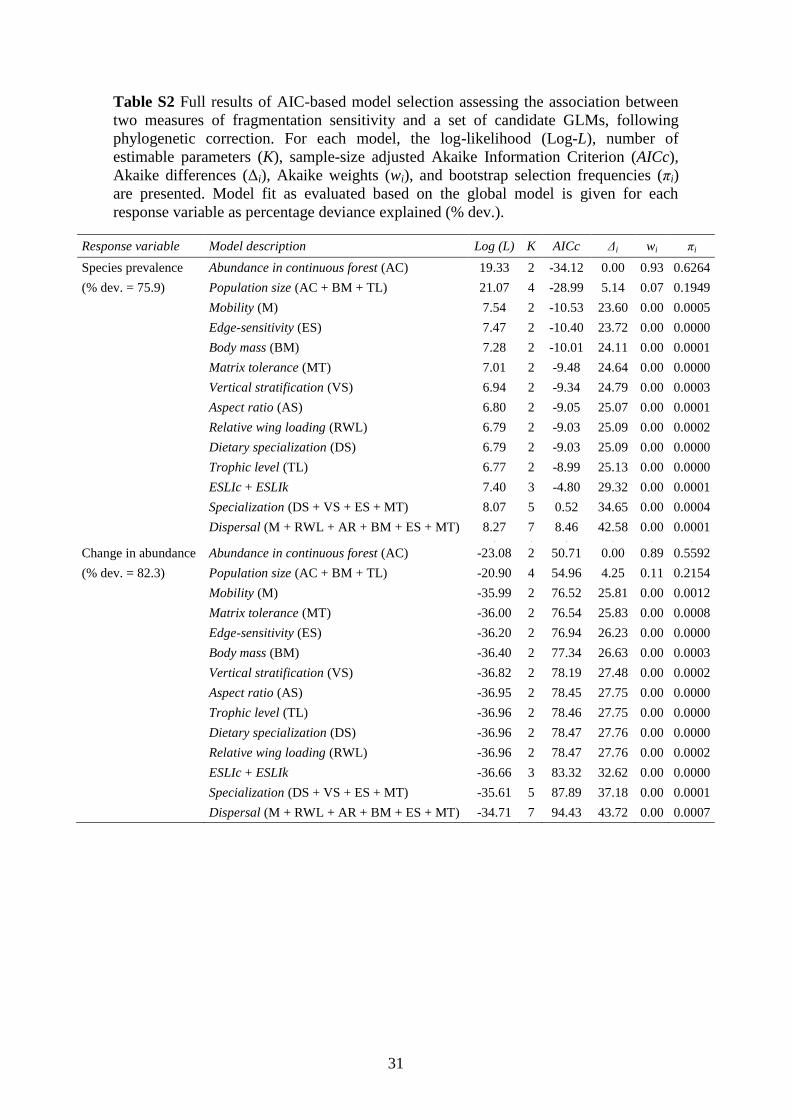
31
Table S2 Full results of AIC-based model selection assessing the association between
two measures of fragmentation sensitivity and a set of candidate GLMs, following
phylogenetic correction. For each model, the log-likelihood (Log-L), number of
estimable parameters (K), sample-size adjusted Akaike Information Criterion (AICc),
Akaike differences (Δi), Akaike weights (wi), and bootstrap selection frequencies (πi)
are presented. Model fit as evaluated based on the global model is given for each
response variable as percentage deviance explained (% dev.).
Response variable Model description Log (L) K AICc Δi wi πi
Species prevalence Abundance in continuous forest (AC) 19.33 2 -34.12 0.00 0.93 0.6264
(% dev. = 75.9) Population size (AC + BM + TL) 21.07 4 -28.99 5.14 0.07 0.1949
Mobility (M) 7.54 2 -10.53 23.60 0.00 0.0005
Edge-sensitivity (ES) 7.47 2 -10.40 23.72 0.00 0.0000
Body mass (BM) 7.28 2 -10.01 24.11 0.00 0.0001
Matrix tolerance (MT) 7.01 2 -9.48 24.64 0.00 0.0000
Vertical stratification (VS) 6.94 2 -9.34 24.79 0.00 0.0003
Aspect ratio (AS) 6.80 2 -9.05 25.07 0.00 0.0001
Relative wing loading (RWL) 6.79 2 -9.03 25.09 0.00 0.0002
Dietary specialization (DS) 6.79 2 -9.03 25.09 0.00 0.0000
Trophic level (TL) 6.77 2 -8.99 25.13 0.00 0.0000
ESLIc + ESLIk 7.40 3 -4.80 29.32 0.00 0.0001
Specialization (DS + VS + ES + MT) 8.07 5 0.52 34.65 0.00 0.0004
Dispersal (M + RWL + AR + BM + ES + MT) 8.27 7 8.46 42.58 0.00 0.0001
. . . . . .
Change in abundance Abundance in continuous forest (AC) -23.08 2 50.71 0.00 0.89 0.5592
(% dev. = 82.3) Population size (AC + BM + TL) -20.90 4 54.96 4.25 0.11 0.2154
Mobility (M) -35.99 2 76.52 25.81 0.00 0.0012
Matrix tolerance (MT) -36.00 2 76.54 25.83 0.00 0.0008
Edge-sensitivity (ES) -36.20 2 76.94 26.23 0.00 0.0000
Body mass (BM) -36.40 2 77.34 26.63 0.00 0.0003
Vertical stratification (VS) -36.82 2 78.19 27.48 0.00 0.0002
Aspect ratio (AS) -36.95 2 78.45 27.75 0.00 0.0000
Trophic level (TL) -36.96 2 78.46 27.75 0.00 0.0000
Dietary specialization (DS) -36.96 2 78.47 27.76 0.00 0.0000
Relative wing loading (RWL) -36.96 2 78.47 27.76 0.00 0.0002
ESLIc + ESLIk -36.66 3 83.32 32.62 0.00 0.0000
Specialization (DS + VS + ES + MT) -35.61 5 87.89 37.18 0.00 0.0001
Dispersal (M + RWL + AR + BM + ES + MT) -34.71 7 94.43 43.72 0.00 0.0007
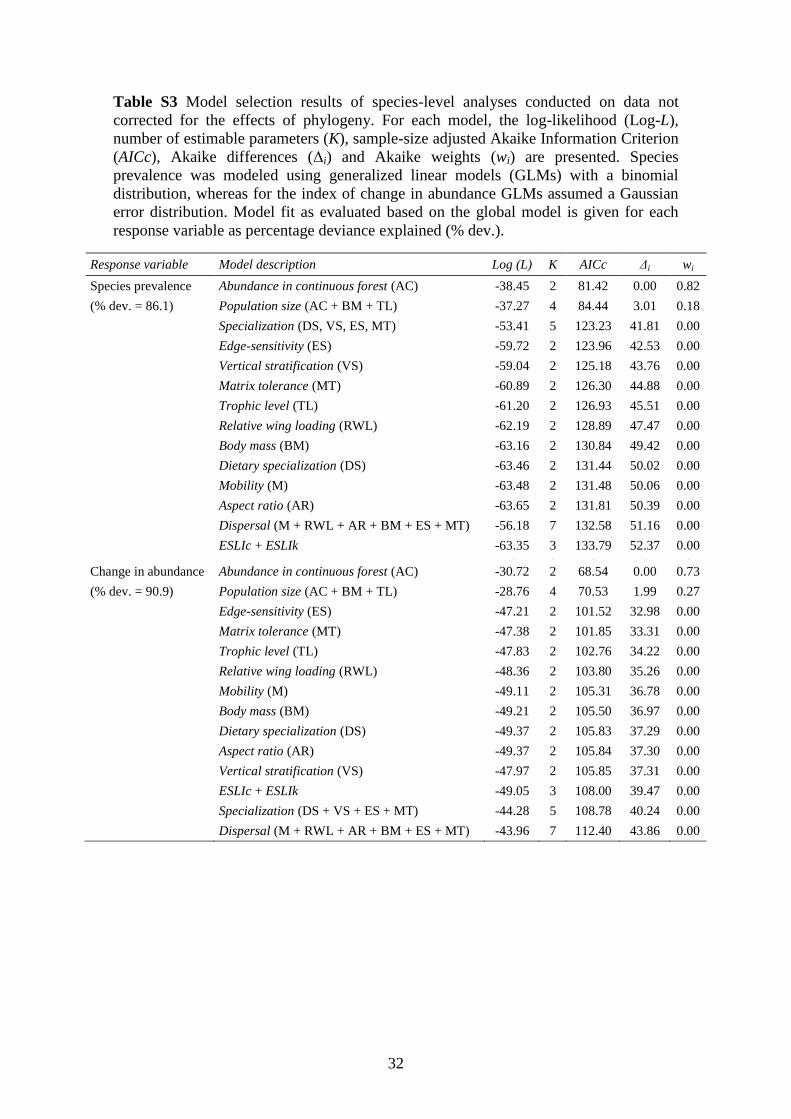
32
Table S3 Model selection results of species-level analyses conducted on data not
corrected for the effects of phylogeny. For each model, the log-likelihood (Log-L),
number of estimable parameters (K), sample-size adjusted Akaike Information Criterion
(AICc), Akaike differences (Δi) and Akaike weights (wi) are presented. Species
prevalence was modeled using generalized linear models (GLMs) with a binomial
distribution, whereas for the index of change in abundance GLMs assumed a Gaussian
error distribution. Model fit as evaluated based on the global model is given for each
response variable as percentage deviance explained (% dev.).
Response variable Model description Log (L) K AICc Δi wi
Species prevalence Abundance in continuous forest (AC) -38.45 2 81.42 0.00 0.82
(% dev. = 86.1) Population size (AC + BM + TL) -37.27 4 84.44 3.01 0.18
Specialization (DS, VS, ES, MT) -53.41 5 123.23 41.81 0.00
Edge-sensitivity (ES) -59.72 2 123.96 42.53 0.00
Vertical stratification (VS) -59.04 2 125.18 43.76 0.00
Matrix tolerance (MT) -60.89 2 126.30 44.88 0.00
Trophic level (TL) -61.20 2 126.93 45.51 0.00
Relative wing loading (RWL) -62.19 2 128.89 47.47 0.00
Body mass (BM) -63.16 2 130.84 49.42 0.00
Dietary specialization (DS) -63.46 2 131.44 50.02 0.00
Mobility (M) -63.48 2 131.48 50.06 0.00
Aspect ratio (AR) -63.65 2 131.81 50.39 0.00
Dispersal (M + RWL + AR + BM + ES + MT) -56.18 7 132.58 51.16 0.00
ESLIc + ESLIk -63.35 3 133.79 52.37 0.00
. . . . .
Change in abundance Abundance in continuous forest (AC) -30.72 2 68.54 0.00 0.73
(% dev. = 90.9) Population size (AC + BM + TL) -28.76 4 70.53 1.99 0.27
Edge-sensitivity (ES) -47.21 2 101.52 32.98 0.00
Matrix tolerance (MT) -47.38 2 101.85 33.31 0.00
Trophic level (TL) -47.83 2 102.76 34.22 0.00
Relative wing loading (RWL) -48.36 2 103.80 35.26 0.00
Mobility (M) -49.11 2 105.31 36.78 0.00
Body mass (BM) -49.21 2 105.50 36.97 0.00
Dietary specialization (DS) -49.37 2 105.83 37.29 0.00
Aspect ratio (AR) -49.37 2 105.84 37.30 0.00
Vertical stratification (VS) -47.97 2 105.85 37.31 0.00
ESLIc + ESLIk -49.05 3 108.00 39.47 0.00
Specialization (DS + VS + ES + MT) -44.28 5 108.78 40.24 0.00
Dispersal (M + RWL + AR + BM + ES + MT) -43.96 7 112.40 43.86 0.00
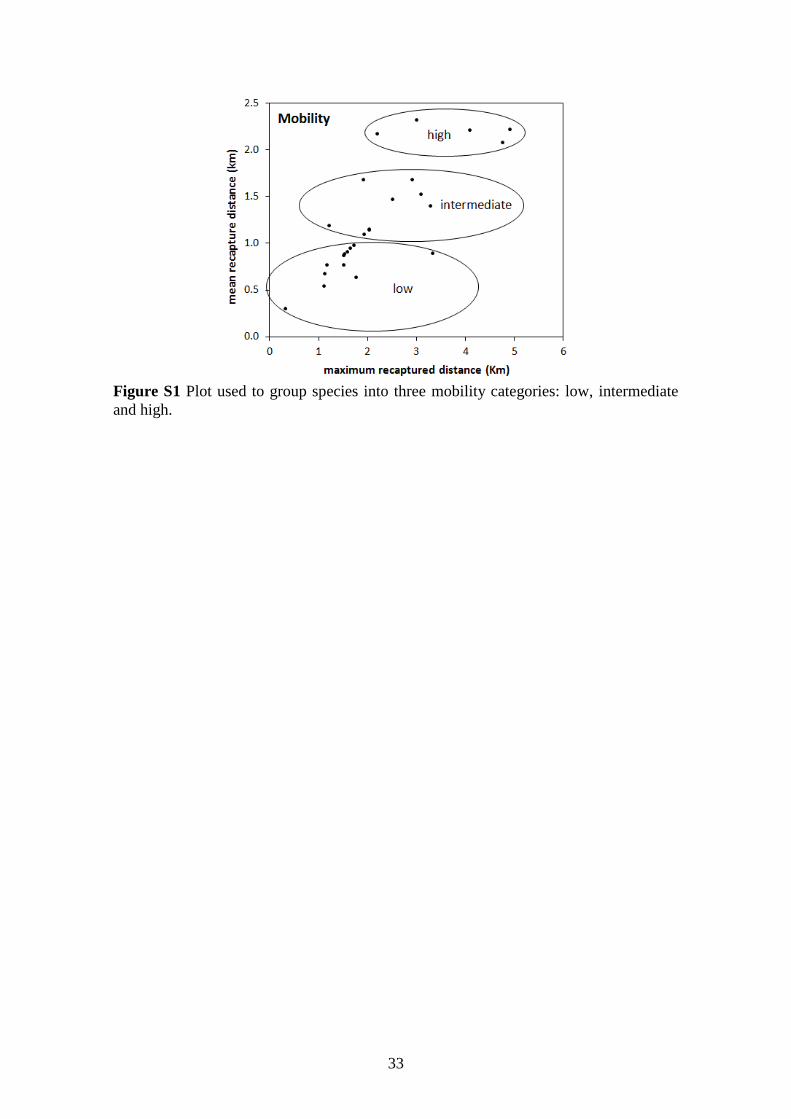
33
Figure S1 Plot used to group species into three mobility categories: low, intermediate
and high.