UNIVERSIDADE DE LISBOA - COnnecting REpositories · Realizou-se ainda um teste de robustez ao...
132
UNIVERSIDADE DE LISBOA FACULDADE DE CIÊNCIAS DEPARTAMENTO DE BIOLOGIA ANIMAL COMPARATIVE ANALYSIS OF THE EFFICACY OF MULTIMETRIC INDICES BASED ON FISH COMMUNITIES IN ORDER TO ASSESS THE ECOLOGICAL QUALITY OF COASTAL WATERS Sofia Nunes Henriques Margarido Pires MESTRADO EM ECOLOGIA E GESTÃO AMBIENTAL 2007
Transcript of UNIVERSIDADE DE LISBOA - COnnecting REpositories · Realizou-se ainda um teste de robustez ao...

UNIVERSIDADE DE LISBOA FACULDADE DE CIÊNCIAS
DEPARTAMENTO DE BIOLOGIA ANIMAL
COMPARATIVE ANALYSIS OF THE EFFICACY OF
MULTIMETRIC INDICES BASED ON FISH COMMUNITIES IN
ORDER TO ASSESS THE ECOLOGICAL QUALITY OF
COASTAL WATERS
Sofia Nunes Henriques Margarido Pires
MESTRADO EM ECOLOGIA E GESTÃO AMBIENTAL
2007


UNIVERSIDADE DE LISBOA FACULDADE DE CIÊNCIAS
DEPARTAMENTO DE BIOLOGIA ANIMAL
COMPARATIVE ANALYSIS OF THE EFFICACY OF
MULTIMETRIC INDICES BASED ON FISH COMMUNITIES IN
ORDER TO ASSESS THE ECOLOGICAL QUALITY OF
COASTAL WATERS
Dissertação orientada pelos: Professor Doutor Henrique Cabral
Professora Doutora Maria José Costa
Sofia Nunes Henriques Margarido Pires
MESTRADO EM ECOLOGIA E GESTÃO AMBIENTAL
2007


i
Acknowledgments
To all people that in some way contributed to this work I express my sincere gratitude,
especially to:
Professor Doutor Henrique Cabral, for all his support, supervision and friendship, for believing
in me and for all his enthusiasm during this work even at the moments of bigger difficulties.
Professora Doutora Maria José Costa, for having acceptance to guide this thesis and for the
opportunity to join the marine zoology team at the Centro de Oceanografia, FCUL.
To all people of the laboratory, for turning the work moments more grateful, especially the
pauses, for all support, care and contributions, which helped me to achieve this challenge…
To Inês Cardoso, for all advices, support, and very interesting discussions of the results and
above all for her friendship that helped me to always be “on top of the wave”…
To Joana Marques, for her company in coffees and work afternoons in CCB, for the “Tortas de
Azeitão”, for all articles that she send me from New Zealand and above all for her friendship…
To Miguel Pais, for his unconditional support in all moments of this thesis development, since
the long fulfilling of matrices to the revision of the manuscript passing by all discussions of the
problems found, for his friendship and his fantastic humour that helped me to smile in the hard
moments… and now… let’s go diving?
All friends, for making me simile in my worst days ….

ii
To Quim, for his friendship and patience and helped me with the revisions of the English of the
thesis…
To my dog Gastas, to whom thanks can not be missed, even being an old fool, every day and
nights he made me company while I wrote the thesis.
To Diogo, for his love, care, patience, for having endured my bad-temperate in the worst days
and for providing me everyday with a smile in my face which is essential in order to keep one’s
head over her shoulders.
My Family, for their unconditional support, love and care, because each one, in its own way,
even the little ones, is a little responsible for what I am today and to succeed in achieving this
challenge… Especial to my mother, for believing in me every day of my life and for helping me
to make the dream of studying the sea animals come true…
iii
Resumo
Nas últimas décadas o meio marinho tem sofrido uma crescente degradação em consequência
do aumento das actividades antropogénicas, sendo um meio complexo que alberga um grande
número que ecossistemas particulares com funções ecológicas vitais para além de suportar um
grande número de recursos de elevado potencial económico. Torna-se assim evidente a
necessidade de o recuperar e conservar por forma a assegurar a sua utilização sustentável.
Apesar de existirem políticas a nível regional e europeu que se referem em parte ao meio
marinho não tem existido uma boa articulação entre elas e como consequência a sua
implementação não tem sido eficiente. Apenas em 2005 é proposta a Directiva “Estratégia para
o Meio Marinho” que pretende, através de um quadro de gestão global entre os vários estados
membros, promover a utilização sustentável dos mares e conservar os seus ecossistemas
marinhos dando prioridade à consecução de um “bom estado ecológico” até 2021 bem como à
continuação da sua protecção prevenindo uma subsequente deterioração. No âmbito desta
directiva, os peixes deverão ser utilizados como indicadores biológicos na monitorização e
avaliação do estado ecológico. Tendo em conta que a avaliação do estado das comunidades de
peixes no meio marinho tem incidido primeiramente sobre o impacto da pesca não existindo
nenhum índice multimétrico aplicado a estas comunidades específicas, o presente trabalho teve
como objectivos: avaliar a eficácia dos índices existentes na avaliação do estado ecológico; criar
um índice que promova a avaliação das comunidades de peixes marinhos tendo em
consideração as suas particularidades.
Neste contexto, foram adaptados cinco índices aplicados a comunidades de peixes estuarinos ao
meio marinho, o “Community Degradation Index” (CDI), o “Biological Health Index” (BHI), o
“Estuarine Biotic Integrity Index” (EBI), o “Estuarine Fish Community Index” (EFCI) e o
“Transitional Fish Classification Index” (TFCI). A adaptação dos índices CDI e BHI foi
realizada através do ajustamento dos conceitos iniciais dos seus segmentos biológicos, enquanto
que para os índices EBI, EFCI e TFCI as suas métricas foram ajustadas através da substituição
dos grupos funcionais estuarinos pelos equivalentes grupos funcionais marinhos por forma aos

iv
índices não perderem a sua integridade. Cada um dos índices adaptados foi aplicado a zonas
arenosas subtidais, zonas rochosas subtidais e a zonas rochosas intertidais da costa Portuguesa.
Para cada um foi calculada uma situação de referência (“comunidade saudável”) com base no
conjunto de dados das zonas avaliadas e de acordo com o tipo de substrato, ajustando também o
sistema de valores e a escala ecológica de cada um deles de forma a tornar os índices
comparáveis. Considerando a discrepância dos estados ecológicos obtidos na avaliação das
mesmas zonas com os vários índices e os padrões de estados ecológicos obtidos de acordo com
o tipo de substrato, podemos concluir que os índices não foram coerentes entre si e que não são
representativos das comunidades típicas de cada um destes substratos. No geral, com os índices
CDI e BHI obtiveram-se sempre os estados ecológicos mais baixos demonstrando que uma
simples medida de semelhança ou dissemelhança entre o número de espécies observada e o
potencial de referência não é suficiente para avaliar o estado ecológico das comunidades de
peixes marinhos. Relativamente aos restantes índices, verificou-se que o TFCI foi o mais
exigente uma vez que se obtiveram estados ecológicos mais baixos do que com o EBI e o EFCI.
Este facto deve-se à maior capacidade discriminatória do seu sistema de valores. Foi verificada
a existência de um padrão de estados ecológicos baixos para as zonas arenosas mais profundas
(20-100m), um padrão de estados ecológicos para as zonas de areia de menores profundidades
(0-30m) e para as zonas rochosas subtidais, e um padrão de estados ecológicos elevados para as
zonas rochosas intertidais. A análise das métricas responsáveis por estes padrões sugere que a
avaliação das comunidades de peixes do meio marinho deve ser feita de acordo com o tipo de
substrato e profundidade devido às diferenças entre as suas comunidades típicas e ainda que os
índices estão totalmente desajustados às comunidades do substrato rochoso intertidal. Os
resultados a cima mencionados demonstram que os índices estuarinos, mesmo que adaptados,
não servem para avaliar as comunidades de peixes marinhos.
Neste sentido, foi desenvolvido o “Marine Fish Community Index” (MFCI) onde as suas
métricas foram divididas por tipologias de acordo com a profundidade e o tipo de substrato:
substrato rochoso subtidal, substrato móvel pouco profundo, substrato móvel intermédio e
substrato móvel profundo. Para cada uma das tipologias foram seleccionadas as métricas

v
consideradas como representativas das respectivas comunidades com base no seu significado
biológico, estudos anteriores, análise de redundância entre elas (correlação de “Pearson”) e uma
análise “Drivers-Pressures-State-Impacts-Response” (DPSIR) de forma a garantir que as
principais pressões antropogénicas são possíveis de medir com o MFCI. Além disso, as várias
métricas foram separadas em quatro atributos considerados como representativos da estrutura e
função das comunidades de peixes marinhos: Diversidade e Composição, Abundância, Função
de Viveiro e Integridade Trófica. O sistema de valores adoptado foi semelhante ao do índice
TFCI pela sua capacidade discriminatória. A situação de referência foi calculada com base no
conjunto de dados disponíveis, onde para cada uma das tipologias de substrato móvel o número
máximo observado para cada métrica foi dividido em quintis e cada um dos intervalos obtidos
passou a corresponder aos limites dos valores possíveis. Para a tipologia substrato rochoso
subtidal o estudo “Arrábida 1999” foi considerado como representativo da sua comunidade
típica de rocha, com excepção das métricas relativas ao número de espécies que atingem os 90%
de abundância e ao rácio número espécies comerciais/número espécies não comerciais que
foram calculadas com a metodologia apresentada para as tipologias do substrato móvel.
O índice foi aplicado a diversas zonas da costa Portuguesa de acordo com a sua tipologia. Em
algumas zonas das tipologias de substrato móvel intermédio e profundo obtiveram-se valores
baixos com as métricas medidas em proporção de indivíduos dos atributos função de viveiro e
integridade trófica. A análise destes resultados sugere que a presença de espécies gregárias
nestas zonas determina o valore obtido com estas métricas, tendo sido propostas três hipóteses
para solucionar o problema encontrado, que deverão ser testadas no futuro: (1) remover estas
espécies gregárias do cálculo destas métricas; (2) substituir as métricas simples por métricas
compostas que ponderem em número e abundância as espécies destes atributos; (3) incluir
arrastos pelágicos no plano de amostragem de forma a ser possível calcular correctamente as
proporções entre os vários grupos funcionais destas tipologias.
Realizou-se ainda um teste de robustez ao índice para verificar o efeito individual de cada uma
das métricas no estado ecológico final do índice, recalculando o seu valore final através da
remoção de uma métrica de cada vez. Considerando o número de subidas e descidas de estado

vi
ecológico obtidas com este teste e tendo em conta que as zonas onde se verificaram estas
alterações se encontravam no limite entre dois estados ecológicos considerou-se que o índice foi
robusto face ao efeito individual de cada métrica. Apesar de ser necessário um bom plano de
monitorização para resolver as métricas problemáticas, calcular aquelas em que os dados não
estavam disponíveis para serem testadas e calcular/validar a situação de referência de cada
tipologia, verificou-se que o MFCI foi eficiente na avaliação dos vários estados ecológicos, uma
vez que não se obteve nenhum padrão de estados ecológicos dependente da tipologia avaliada,
tal como acontecia com os índices estuarinos adaptados, variando apenas consoante a
representatividade do plano de amostragem das zonas. Assim, no presente trabalho, foi pela
primeira vez proposta uma abordagem à avaliação do estado ecológico das comunidades de
peixes do meio marinho que poderá ser útil não só na aplicação de estratégias europeias como é
o caso da “Estratégia para o Meio Marinho” mas também noutros contextos que visem a
conservação e recuperação do ambiente marinho.
Palavras-chave: Directiva “Estratégia para o Meio Marinho”; Avaliação da qualidade
ecológica; Índices Multimétricos; Comunidades de Peixes Marinhos; Portugal
vii
Summary
Due to the increase of the anthropogenic pressures on the marine environment, the assessment
of ecological status has become an essential tool to recover and protect it (e.g. European Marine
Strategy Directive) emphasising the need for an efficient ecological index applied to this
environment. Since none of the fish-based multimetric indices was developed to the marine
environment, the present study had two main goals: to evaluate the efficacy of the existing
indices and the development of an efficient multimetric index to promote the assessment of the
ecological quality of the marine fish communities.
Five estuarine indices were adapted to marine waters through the simple replacement of the
functional estuarine groups for the marine ones and tested in fifteen zones of the Portuguese
coast divided according to their substrate. Analysis of individual metrics suggests lack of
representativeness and consideration for the particularities of each substrate’s typical fish
communities. These results strengthened the need of a new multimetric index development by
type of substrate and depth.
Recurring to a Drivers-Pressures-Impacts-Responses approach and previous studies, a set of
metrics was selected and their redundancy was tested through multiple correlation matrices.
Based on these results and ecological meaning of each metric, the Marine Fish Community
Index (MFCI) was developed and divided in four typologies. Although, in the future, a good
monitoring plan is need in order to solve some metric problems and to validate the reference
values, the results of the MFCI application and it robustness test showed that this approach by
typology is efficient to assess the ecological status. Therefore, a new index to assess the
ecological status was successfully developed and can be applied on the evaluation of the quality
of the marine environment.
Keywords: European Marine Strategy Directive (MSD); Ecological Quality Assessment;
Multimetric Indices; Marine Fish Communities; Portugal

INDEX
Acknowledgments………………………………………………………………….................. i
Resumo………………………………………………………………………………………….. iii
Summary………………………………………………………………………………………... vii
CHAPTER 1
General Introduction………………………………………………………………................ 1
References…………………………………………………………………………………………... 5
CHAPTER 2
Efficacy of adapted estuarine fish-based multimetric indices as tools for
evaluating ecological status of the marine environment
Abstract……………………………………………………………………………………………. 9
Introduction……………………………………………………………………………………....... 10
Material and Methods…………………………………………………………………………….. 13
Data Sets…………………………………………………………………………………... 13
Adaptation of the CDI and BHI………………………………………………………… 15
Adaptation of the EBI, EFCI and TFCI………………………………………................. 16
Metrics……………………………………………………………………………. 16
Reference limits…………………………………………………………................ 18
Score System and Ecological Scale……………………………………………... 22
Evaluation of adapted indices…………………………………………………………... 23
Statistical Analysis………………………………………………………………………... 24
Results……………………………………………………………………………………………... 24
Discussion………………………………………………………………………………………… 31
Final Considerations…………………………………………………………………….................. 40
References…………………………………………………………………………………………... 41

CHAPTER 3
Development of a fish-based multimetric index to assess the ecological
quality of marine habitats: the Marine Fish Community Index
Abstract……………………………………………………………………………………………. 48
Introduction……………………………………………………………………………………….. 49
Material and Methods…………………………………………………………………………….. 52
Typologies of the study area and data sets…………………………………….................. 52
Drivers-Pressures-State-Impacts-Responses (DPSIR) Analysis………………………. 56
Metric Selection…………………………………………………………………................. 56
Compiling and testing the candidate metrics…………………………................ 56
Combining metrics into the MFCI……………………………………………... 60
Diversity and Composition Attribute………………………………….. 60
Abundance Attribute…………………………………………………… 62
Nursery Function Attribute…………………………………………….. 64
Trophic Integrity Attribute……………………………………………... 65
Reference Situation, Score System and Ecological Scale of the MFCI………………... 66
Evaluation and Robustness of the MFCI……………………………………………….. 71
Results……………………………………………………………………………………………... 71
Discussion………………………………………………………………………………………… 78
Final Considerations…………………………………………………………………….................. 82
References…………………………………………………………………………………………... 83
CHAPTER 4
General Discussion and Final Remarks……………………………………………... 92
References…………………………………………………………………………………………... 94
APPENDIX………………………………………………………………………………… 96

Chapter 1


Chapter 1 General Introduction
1
General Introduction
The marine environmental is indispensable to life itself and its a great contributor to economic
prosperity and quality of life in the planet (COM, 2005a). The seas and oceans represent 71% of
the Earth’s surface and contain about 90% of it biosphere (COM, 2005a). The marine
ecosystems play an essential role in the climatic regulation, prevention of the erosion,
accumulation and distribution of solar energy, absorption of the carbon dioxide and
maintenance of the biological control (Costanza et al., 1998; Beaumont et al., 2007) besides
supporting innumerable resources with high economic potential (e.g. some estimates indicated
that 40% of the European GDP is provided by the maritime exploration) (COM, 2006).
Actually, there is no doubt that anthropogenic activities produce significant perturbations on the
marine ecosystems (Costanza et al., 1998; Diaz et al., 2004; COM, 2005a,c; COM, 2006;
Beaumont et al., 2007), which include water pollution provided from variable sources (e.g.
agriculture and urban wastes), tourism, fishing, organic compounds, dredging activities,
aquaculture, maritime transports and biological pollution among others (Islam and Tanaka,
2004). Due to the increasing impacts of these activities in the last decades the need for quality
assessment and monitoring of marine systems has become increasingly important (Deegan et
al., 1997; Whitfield and Elliot, 2002, Reiss and Kröncke, 2005).
In Europe, a large number of policies referring in part to marine environment exist (e.g. Habitats
and Birds Directives, Water Framework Directive, Common Fisheries Policy), however, none
of them are an integrated policy for protection of all European seas (Borja, 2006; COM, 2005a).
For example, the Water Framework Directive (WFD), that was the first European policy to
require a commitment to assess the ecological status of water bodies (ground, inland surface,
estuarine and marine waters) based on biological indicators (EU, 2000), only covers the narrow
band of coastal waters extending one mile on the seaward side from the nearest point of the
baseline from which the breadth of territorial waters is measured (Article 2.7; EU,2000),
corresponding to 19.8% of the European coastal zone, being therefore insufficient to assure a

Chapter 1 General Introduction
2
good management of all their marine ecosystems (Borja, 2006; Mee et al., 2007). On the other
hand, at a regional level, it has been verified some lack of articulation between the strategies or
conventions (e.g. OSPAR in the North Eastern Atlantic, the Helsinki Convention in the Baltic,
the Barcelona Convention in the Mediterranean, the Bucharest Convention in the Black Sea)
and consequently their implementation has not been very efficient for the whole marine
environments (Borja, 2006; Mee et al., 2007).
Only in October 2005, the European Marine Strategy Directive (MSD) was proposed to the
Council and European Parliament with the main goal to “promote the sustainable use of the seas
and conserve marine ecosystems” (COM, 2005b,c), giving priority to the attainment of a “Good
ecological status” such as prevention of a subsequent deterioration (COM 2005b,c; Borja 2006).
This strategy also pretend to fill the implementation failures verified in previous strategies,
promoting the articulation and coordination between the regional and the EU approaches (COM
2005a,b; Borja, 2006).
In this sense, each Member State must develop by 2016, a measure plan for its waters
accordingly to their marine eco-region (North-East Atlantic Ocean in the case of Portugal), that
must have in consideration the global principals and objectives of the MSD and where the
conducting lines to achieve or maintain a “good ecological status” are define (COM 2005b,c).
To prepare this measure plan to entry in operation at least by 2018, each Member State must do,
until the fourth to sixth year after the date of entry into force, an initial assessment of the current
environmental status of the marine waters concerned and respective environmental impacts of
the anthropogenic activities, a determination of “good ecological status”, to establish a set of
environmental targets and a monitoring programme in order to achieve a “good ecological
status” by 2021 (COM, 2005 b,c). To assess the ecological status, the structure and community
parameters of many biological elements have to be analysed, including: plankton, zooplankton,
invertebrate fauna, fish, mammals and seabird populations (Annex II of MDS) (COM, 2005b).
In the scope of this work fish will be the biological indicator analyzed.

Chapter 1 General Introduction
3
As biological indicators, fishes present countless advantages including; their presence in most of
the aquatic systems, with exception of highly polluted; easiness in it identification compared
with other biological groups (e.g. invertebrates); some of their samples can be processed
through non-destructive methods; their extensive life-history and environmental response
information available; their communities usually include a range of species representative of a
variety of trophic levels and thus reflect effects at all levels within the food web; their
communities contain many functional guilds and so will reflect all components of the
ecosystem; the fishes are both sedentary and mobile and thus will reflect the stressor within one
area and also gives us the “border” of these effects; they can show external anatomical
pathologies when subject to chemical pollution; they have high economic value such that is
more simple to the general public to understand the problems on the fish communities than
other biological groups (societal coasts of environmental degradation) (Karr, 1981; EPA, 2000a;
Whitfield and Elliot, 2002; Harrison and Whitfield, 2004).
Despite out-weighed for the advantages, some limitations exist in the use of fishes as indicators,
such as the selective and seasonality nature of samples, sometimes a large sample effort is
required to be representative of the community, being mobile they can move away from
disturbance and finally they have a relative tolerance to chemical pollution (e.g. heavy metals)
(EPA, 2000a; Whitfield & Elliott, 2002; Harrison and Whitfield, 2004). However, the use of
fish in the assessment of water quality has been successful in a large number of aquatic systems
(e.g. Karr, 1981; Ramm, 1988; Cooper et al., 1994; Deegan et al., 1997; Roth et al., 1998;
Quinn et al., 1999; Mercado-Silva et al., 2002; Trebitz et al., 2003; Harrison and Whitfield,
2004; Breine et al., 2007; Coates et al., 2007).
Initially, the ecological indicators were only based on species parameters or metrics of the same
community (e.g. diversity, species richness), nevertheless, many of these indicators,
individually, can not be representative of all impacts neither of community function (Niemi &

Chapter 1 General Introduction
4
McDonald 2004). Nowadays, the multimetric indices are recognized as a robust and flexible
tool comparing with univariated evaluation, once that they result of the combination of various
categories of metrics and intend to reflect different environmental conditions (impacts), in fact,
they have been successfully applied in different ecosystems with various biological elements
(Harrison & Whitfield, 2004; Hering et al., 2006).
James Karr (1981) developed the first fish-based multimetric index applied to the rivers; the
Index of Biotic Integrity (IBI). Ever since, as the result of its application to different regions,
many versions of IBI have been created (e.g. Roth et al., 1998; Mercado-Silva et al., 2002;
Trebitz et al., 2003). The general methodology used in the development of this index still
maintains: community characterization with the most significant metrics, index application and
comparison of the results with a reference situation (non-impacted community) through the
score attribution to each metric (score system) and then the final score index with an ecological
quality scale comparison. So, a multimetric index gives us a measure of deviation between
normal and expected condition of communities. Actually, beyond the indices applied to rivers
and streams (IBI) many fish-based indices have been developed to estuaries (e.g. Ramm, 1988;
Cooper et al., 1994; Deegan et al., 1997; Quinn et al., 1999; Paul, 2003; Harrison and
Whitfield, 2004; Breine et al., 2007; Coates et al., 2007), but no one was created to assess the
ecological status of the marine waters (Diaz et al., 2004).
In general, the main difficulties of the ecological indices application, in particular the
multimetric ones, is focused on the establishment of reference conditions and in the lack of
generalized methodologies that allow a comprehensive and comparative application (EPA,
2000b). It is also intuitive the need to associate anthropogenic pressures with the ecological
status obtained in order to delineate adequate management plans, which aim to minimize these
impacts and the sustainable use of resources (EPA, 2000b; Niemi et al., 2004).

Chapter 1 General Introduction
5
To successfully establish the relation pressure-impacts, it becomes essential to understand the
answer of the different metrics in the presence of natural and anthropogenic variations and in
face of the available data, to choose the adequate metrics at the end and to understand and apply
coherently the indices. In this sense and in the MSD context, an ideal index must have three
main characteristics: sensitiveness (effective response to low environmental variations),
discriminatory ability (identification of the problem source) and broad applicability (susceptible
for being used in other regions).
For the above-mentioned, it was clear that the ecological indices are an essential tool in
conservation and sustainable management of the marine environment contexts, being necessary
more studies relative to its development and application. The present study aims to test the
existing indices and development an efficient multimetric index, based on demersal fish
communities and their ecological response to anthropogenic pressures, to promote the
assessment of the ecological quality of coastal waters.
References Beaumont, M.J., Austen, M.C., Atkins, J.P., Burdon, D., Degraer, S., Dentinho, T.P., Derous,
S., Holm, P., Horton, T., Van Ierland, E., Marboe, A.H., Starkey, D.J., Tomnsend, M.,
Zarzyoki, T., 2007. Identification, definition and quantification of goods and services
provide by marine biodiversity: implications for the ecosystem approach. Marine
Pollution Bulletin 54, 253-265.
Borja, A., 2006. The new European Marine Strategy Directive: Difficulties, opportunities, and
challenges. Marine Pollution Bulletin 52, 239-242.
Breine, J.J., Maes, J., Quataert, P., Van den Bergh, E. Simoens, I., Van Thuyne, G., Belpaire,
C., 2007. A fish-based assessment tool for the ecological quality of the Brackish Schelde
estuary in Flanders (Belgium). Hydrobiologia 575, 141-159.
Chapter 1 General Introduction
6
Coates, S., Waugh, A., Anwar, A., Robson, M., 2007. Efficacy of a multi-metric fish index as
an analysis tool for transitional fish component of the Water Framework Directive.
Marine Pollution Bulletin 55, 225-240.
COM, 2005a. Communication from the Commission to the Council and the European
Parliament. Thematic Strategy on the Protection and Conservation of the Marine
Environment. COM (2005)504 final, SEC(2005)1290. 9pp.
COM, 2005b. Proposal for a Directive of the European Parliament and of the Council,
establishing a Framework for Community Action in the field of Marine Environmental
Policy. COM(2005)505 final, SEC(2005)1290. 31pp.
COM, 2005c. Commission Staff Working Document. Annex to the Communication from the
Commission to the Council and the European Parliament. Thematic Strategy on the
Protection and Conservation of the Marine Environment, and Proposal for a Directive of
the European Parliament and of the Council, establishing a Framework for Community
Action in the field of Marine Environmental Policy. COM(2005)504 and 505 final,
SEC(2005)1290. 79pp.
COM, 2006. EU Marine Strategy - The story behind the strategy. European communities
<http://europa.eu.int/comm/environment/water/marine.htm>, 31pp.
Costanza, R., Andrade, F., Antunes, P., Van den Belt, M., Boesch, D.F., Boersma, P.D.,
Catarino, F., Hanna, S.S., Limburg, K., Low, B., Molitor, M., Pereira, J.G., Rayner, S.,
Santos, R., Wilson, J., Young, M., 1998. A Economia Ecológica e a Governação
Sustentável dos Oceanos. In Constanza, P. & Andrade, F. (eds) A Economia Ecológica e a
Governação Sustentável dos Oceanos, FLAD-IMAR- LPN. 11-40 pp, Portugal.
Cooper, J. A. G., Ramm, A. E. L., Harrison, T. D., 1994. The Estuarine Health Index: a new
approach to scientific information transfer. Ocean and Coastal Management 25, 103-141.
Deegan, L. A., Finn, J.T., Ayvazian, S.G., Ryder-Kieffer, C.A., Buonaccorsi, J., 1997.
Development and validation of an Estuarine Biotic Integrity Index. Estuaries 20, 601-617.
Diaz, R.J., Solan, M., Valente, R.M., 2004. A review of approaches for classifying benthic
habitats and evaluating habitat quality. Journal of Environmental Management 73, 165-
181.

Chapter 1 General Introduction
7
EPA, 2000a. Estuarine and Coastal Marine Waters: Bioassessment and Biocriteria Technical
Guidance. United States Environmental Protection Agency, EPA-822-B-00-024,
Washington, 300pp.
EPA, 2000b. Evaluation Guidelines for Ecological indicators. United States Environmental
Protection Agency, EPA-620-R-99-005. Washington, 45pp.
EU, 2000. Directive 2000/60/EC of the European Parliament and of the Council of 23 October
2000 establishing a framework for community action in the field of water policy. Official
Journal L 327, 1–73pp.
Harrison, T.D., Whitfield, A.K., 2004. A multi-metric fish index to assess the environmental
condition of estuaries. Journal of Fish Biology 65, 683-710.
Hering, D., Feld, C. K., Moog, O., Ofenböck, T., 2006. Cook book for the development of a
multimetric index for biological condition of aquatic ecosystems: experiences from
European AQEM and STAR projects and related initiatives. Hydrobiologia 566, 311-324.
Islam., Md. S., Tanaka, M., 2004. Impacts of pollution on coastal and marine ecosystems
including coastal and marine fisheries and approach for management: a review and
synthesis. Marine Pollution Bulletin 48, 624-649.
Karr, J.R., 1981. Assessment of Biotic Integrity using Fish Communities. Fisheries 6, 21-27.
Mee, L.D., Jefferson, R.L., Laffoley, D.A., Elliott, M. How good is good? Human values and
Europe´s proposed Marine Strategy Directive. Marine Pollution Bulletin (2007),
doi:10.1016/j.marpolbul.2007.09.038.
Mercado-Silva, N., Lyons, J.D., Maldonado, G.S., Medina, M., 2002. Validation of a fish-based
index of biotic integrity for streams and rivers of central México. Fish Biology and
Fisheries 12, 179-191.
Niemi, G.J. & McDonald M.E., 2004. Application of Ecological Indicators. Annual Review of
Ecology, Evolution, and Systematics 35, 89-111.

Chapter 1 General Introduction
8
Niemi, G., Wardrop, D., Brooks, R., Anderson, S., Brady, V., Paerl, H. Rakocisnki, C.,
Brouwer, M., Levinson, B., McDonald, M., 2004. Rationale for a new generation of
indicators for coastal waters. Environmental Health Perspectives 11, 979-986.
Paul, J. F., 2003. Developing and applying an index of environmental integrity for the US Mid-
Atlantic region. Journal of Environmental Management 67, 175-185.
Quinn, N.W., Breen, C.M., Whitfield, A.K., Hearne, J.W., 1999. An Index for the management
of South African estuaries for juvenile fish recruitment from the marine environment.
Fisheries Management and Ecology 6, 421-436.
Ramm, A. E. L., 1988. The community degradation index: a new method for assessing the
deterioration of aquatic habitats. Water Research 22, 293-301.
Reiss, H., Kröncke, I., 2005. Seasonal variability of benthic indices: An approach to test the
applicability of different indices for ecosystem quality assessment. Marine Pollution
Bulletin 50, 1490-1499.
Roth, N.E., Southerland, M.T., Chaillou, J.C., Klauda, R.J., Kazyak, P.F., Stranko, S.A.,
Weisberg, S.B., Hall, L.W., Morgan II, R.P., 1988. Maryland biological stream survey:
Development of a fish index of biotic integrity. Environmental Management and
Assessment 51, 89-106.
Trebitz, A.S., Hill, B.H., Mccormick, F.H., 2003. Sensitivity of indices of biotic integrity to
simulated fish assemblage changes. Environmental Management 32, 499-515.
Whitfield, A.K., Elliott, M., 2002. Fishes as indicators of environmental and ecological changes
within estuaries: a review of progress and some suggestions for the future. Journal of fish
biology 6, 229-250.

Chapter 2


Chapter 2 Efficacy of adapted estuarine fish-based multimetric indices as tools for
evaluating ecological status of the marine environment
9
Efficacy of adapted estuarine fish-based multimetric indices as tools
for evaluating ecological status of the marine environment
Sofia Henriques 1, Miguel Pais 1, Maria José Costa 1,2, Henrique Cabral 1,2
1 Universidade de Lisboa, Faculdade de Ciências, Centro de Oceanografia, Campo Grande, 1749-016 Lisboa.
Portugal.
2 Departamento de Biologia Animal, Universidade de Lisboa, Faculdade de Ciências, Campo Grande, 1746-016
Lisboa. Portugal.
Abstract
The assessment of ecological status of marine fish communities required by the European
Marine Strategy Directive (MSD) emphasises the need for fish-based ecological indices in
marine waters. In this study we adapt five estuarine multimetric indices to the marine
environment and apply them in three types of substrates, analysing the metrics responsible for
the obtained patterns of ecological status. The results show inefficiency of the Community
Degradation Index (CDI) and the Biological Health Index (BHI) in ecological status assessment
and disagreement between the Estuarine Biotic Integrity Index (EBI), the Estuarine Fish
Community Index (EFCI) and the Transitional Fish Classification Index (TFCI). Analysis of
individual metrics suggests lack of representativeness and consideration for the particularities of
each substrate’s typical fish communities. None of the tested indices were efficient on the
marine environment, urging the need for new marine indices that account for differences
between types of substrate and depth.
Keywords: European Marine Strategy Directive (MSD); Multimetric Indices; Ecological
Quality Assessment; Fish Community Structure; Marine Habitats; Coastal Waters; Portugal.

Chapter 2 Efficacy of adapted estuarine fish-based multimetric indices as tools for
evaluating ecological status of the marine environment
10
1. Introduction
In the last decades the marine environment has been enduring increased degradation. Being a
complex system, it includes a great number of specific ecosystems with vital ecological functions,
becoming obvious the need to recover and preserve it (Costanza et al., 1998; COM 2006;
Beaumont et al., 2007). In this sense, the European Marine Strategy Directive (MSD) was
presented in October of 2005. This directive intends to promote, through a global management,
the sustained use of the seas, to preserve the marine ecosystems in order to achieve a “good
ecological status” until 2021, and to maintain protection and prevent future deterioration (COM
2005a; Borja 2006). To evaluate ecological status and trace monitoring plans and adequate
measures for each geographical area, several biological indicators must be used (Annex II of
MSD), namely abundance, distribution and structure (age/size) of fish communities (COM
2005b).
Presently, there aren’t any multimetric indices applied to marine waters using exclusively fish as
biological indicators (Diaz et al., 2004). Therefore, in the scope of this work, existing estuarine
indices will be adapted and tested in the marine environment, because of the higher similarity
between fish community structures, comparatively with freshwater.
Although several estuarine indices have been developed through time (Ramm, 1988; Cooper et
al., 1994; Deegan et al., 1997; Quinn et al., 1999; Paul 2003; Harrison and Whitfield, 2004;
Breine et al., 2007; Coates et al., 2007), only a few can be adapted to the marine environment,
namely the “Community Degradation Index” (CDI; Ramm, 1998), the “Biological Health Index”
(BHI; Cooper et al., 1994), the “Estuarine Biotic Integrity Index” (EBI; Deegan et al., 1997),
the“Estuarine Fish Community Index” (EFCI; Harrison and Whitfield, 2004) and the
“Transitional Fish Classification Index” (TFCI; Coates et al., 2007).

Chapter 2 Efficacy of adapted estuarine fish-based multimetric indices as tools for
evaluating ecological status of the marine environment
11
Both the CDI and the BHI measure the degree of degradation between the potential community
(reference) and the real one (observed), the first using a measure of dissimilarity and the latter a
measure of similarity. Being based only on presence/absence data and not taking into account the
relative proportions of the various species present, these indices do not provide information about
the origin of the possible ecological problem affecting the fish community. Although, they have
the advantage of combining health and importance of each specific location in a single and easy
to use index (Whitfield and Elliott, 2002).
The remaining indices (EBI, EFCI and TFCI) reflect the relation between anthropogenic changes
in the ecosystem and the ecological status of estuarine fish communities. These indices use
metrics that correspond to various attributes considered as representative of the main
anthropogenic changes on fish communities (e.g. diversity, composition, abundance, nursery
function and trophic integrity). The most broadly used methodology for the development and
application of multimetric indices consists in the characterization of the composition, trophic and
functional structure of the fish communities, according to the most significative and non-
correlated metrics (test and selection of metrics), application and comparison of results for each
metric with the reference situation (non-impacted community), evaluation of the final score and
comparison with an ecological quality scale (check the discrepancy from expected results)
(Deegan et al., 1997; Quinn et al., 1999; Paul 2003; Harrison and Whitfield 2004; Hering et al.,
2006; Breine et al., 2007; Coates et al., 2007).
The main difficulty presented by some authors in the application of several indices is the
definition of reference values (Deegan et al., 1997; Coates et al., 2007). Ideally, the reference
condition must be assessed based on undisturbed or low-impact sites. In alternative, historical
data, models and expert judgement may be used to represent theoretical reference conditions
(Harrison and Whitfield, 2004; Mangialajo et al., 2007). Among several specific limitations

Chapter 2 Efficacy of adapted estuarine fish-based multimetric indices as tools for
evaluating ecological status of the marine environment
12
concerning the application of indices to the marine environment, stands out the difficulty in
obtaining a direct answer concerning the source of pressure and the effect it produces in the
environment, due to the fact that this environment is liable to be exposed to multiple stressors,
natural and anthropogenic, that, allied to the temporal and spatial variation, make the diagnosis of
the relative importance of each one in the marine environment very difficult (Niemi et al., 2004).
In spite of these difficulties, multimetric evaluation has been recognized not only as being a more
reliable and flexible tool than univariated evaluation (Harrison & Whitfield 2004; Reiss and
Kröncke, 2005; Hering et al., 2006), but also as one that makes the communication between
researchers, managers, stakeholders and policymakers easier (Ramm, 1988; EPA, 2000; Breine et
al., 2007).
In the last years, most of the studies concerning the adaptation, validation and applicability of
indices are only referred to transitional and freshwater systems (e.g. Roth et al., 1998; Mercado-
silva et al., 2002; Trebitz et al., 2003; Gabriels et al., 2005; Breine et al., 2007). So far, indices
applied to coastal waters only used benthic invertebrates and algae as biological indicators (e.g.
Borja et. al., 2000; Chenery and Mudge, 2005; Muniz et al. 2005; Reiss and Krönche, 2005;
Mangialajo et al., 2007; Pinedo et al., 2007; Romero et al., 2007).
From the above mentioned, the need for specific studies relative to anthropogenic effects and
efficiency tests of ecological evaluation tools becomes evident, so that, in a sustainable
management point of view, the ecological quality of the water can be correctly evaluated. With
this in mind, the present work aims to test ecological evaluation tools for coastal waters using
demersal fish communities and to verify their efficacy in the determination of ecological status in
different substrates of the marine environment.

Chapter 2 Efficacy of adapted estuarine fish-based multimetric indices as tools for
evaluating ecological status of the marine environment
13
Table 1. Specific characteristics and references of the sites used to test the application of the indices.
2. Material and Methods
2.1 Data Sets
To analyse the performance of the indices in the evaluation of ecological status 15 studies were
chosen, 5 from sandy subtidal zones, 5 from rocky subtidal zones and the remaining 5 from rocky
intertidal zones (Table 1).
The choice of the studies was based on habitat characteristics (type of substrate), sampling
method used, geographical localization and depth of each area, to make the comparison of the
ecological status possible, resulting in the application of the adapted indices at each substrate.
Each substrate is represented by studies held in the north, centre and south areas of the
Portuguese coast, with at least one year of sampling, in order to minimize the effect of seasonality
on the ecological evaluation.
Site Acronym Depth (m) Substrate Reference
Caminha-Ovar Sand- zone 1 20-100 Sand Dinis and Marecos, 1984; INIP, 1981; INIP, 1982.
S. Pedro de Muel-Cercal Sand- zone 2 20-100 Sand Dinis and Marecos, 1984; INIP, 1981; INIP, 1982.
Lagos- Vila Real de Stº António Sand- zone 3 20-100 Sand Dinis and Marecos, 1984; INIP, 1981; INIP, 1982.
Tejo estuary (adjacent zone) Sand- Tejo 0-30 Sand Prista et al., 2003 Algarve Sand- Algarve 0-30 Sand Abreu, 2005 Berlengas islands Rock- Berlengas 0-25 Rock Almeida, 1996 Praia da Luz Rock- Algarve 0-5 Rock Faria and Almada, 2006 Sines Rock- Sines 0-20 Rock Almada et al., 2004 Ria Formosa Rock- Ria Formosa 0-20 Rock Almeida, 1997 Arrábida- Espichel Rock- Arrábida 0-20 Rock Almada et al., 2002 Amoreira Intertidal- Amoreia - Intertidal rock Faria, 2000 Avencas Intertidal- Avencas - Intertidal rock Faria, 2000 Santa Cruz Intertidal- StCruz - Intertidal rock Faria, 2000 Gelfa Intertidal- Gelfa - Intertidal rock Faria, 2000
Cabo Raso Intertidal- Cabo Raso - Intertidal rock Paiva, 2002

Chapter 2 Efficacy of adapted estuarine fish-based multimetric indices as tools for
evaluating ecological status of the marine environment
14
All the sampling methods of the chosen studies are standard ones for the each substrate type:
collection of individuals from pools on the rocky intertidal, visual census on the rocky subtidal
areas and bottom trawl on the sandy subtidal areas. This excluded the potential effect that using
different sampling methods on the same substrate may have on ecological evaluation.
Each species was characterized according to its feeding guild (invertivore, macrocarnivore,
piscivore, omnivore, zooplanktivore, herbivore), functional guild (demersal, pelagic, reef-
associated, bathydemersal and benthopelagic), qualitative abundance, main substrate for
reproduction (spawning) and development (nursery) and residence or dependence on each of the
analysed substrates using information retrieved from the literature and consolidated using expert
judgement (Appendix I). Furthermore, the existence of protected, commercially threatened and
exotic or introduced species was verified.
The concepts of the several trophic guilds were adapted from Elliot et al. (2007). Species were
considered “invertivore” when they feed predominantly on non-planktonic invertebrates while
zooplankton feeders (e.g. species that feed on planktonic crustaceans, hydroids and fish
eggs/larvae) were considered “zooplanktivore”. “Herbivore” species feed predominantly on
macroalgae, macrophytes, phytoplankton and microphytobenthos and “omnivore” species feed on
detritus, filamentous algae, macrophytes, epifauna and infauna. Species that feed on
macroinvertebrates and vertebrates (mostly fish) were considered “macrocarnivores” and the
species that feed almost exclusively on fish were included on the “piscivore” guild. Functional
guilds were classified according to FishBase online database (Froese and Pauly, 2007) with
concepts adapted from Holthus and Maragos (1995).

Chapter 2 Efficacy of adapted estuarine fish-based multimetric indices as tools for
evaluating ecological status of the marine environment
15
Considering that the original data was presented in different measure units, the data from each
study was standardised by calculating the proportion of the abundance of each species in order to
enable comparison between samples.
2.2 Adaptation of the CDI and BHI
For the calculation of the “Community Degradation Index” (CDI; Ramm, 1998) and “Biological
Health Index” (BHI; Cooper et al., 1994), their original metrics were used, adjusting only the
initial concepts of the various biological segments.
Originally, the final values of each of these indices corresponded to a measure of dissimilarity
(CDI) or similarity (BHI) between the number of observed species (O) and a richness factor
(P/Pmax), where P corresponds to the potential number of species of the biological segment in
study (specific estuarine area) and Pmax to the potential number of species of all biological
segments (whole estuary). Adjusting the concepts of each of the segments to the marine
environment and once there is no evident separation between areas of the same substrate in this
environment, Pmax was adapted to the maximum number of species observed in each of the
substrates (subtidal sandy, subtidal rocky and intertidal rocky areas) and P (optimal potential) to
constitute 80% of that maximum potential. This optimal potential was calculated by reducing the
inherent variability or “noise” of the maximum potential, with the removal of 20% of the total
potential richness, which corresponds to the mean percentage of rare and uncommon captured
species that occurred in a total of 88 studies collected for the Portuguese coast. In this way, the
optimal potential value is related to the number of species with higher capture probability, above
which we can consider an increase in ecological quality that includes an increasing number of
rare and uncommon species, until the maximum potential for that substrate is reached.
Chapter 2 Efficacy of adapted estuarine fish-based multimetric indices as tools for
evaluating ecological status of the marine environment
16
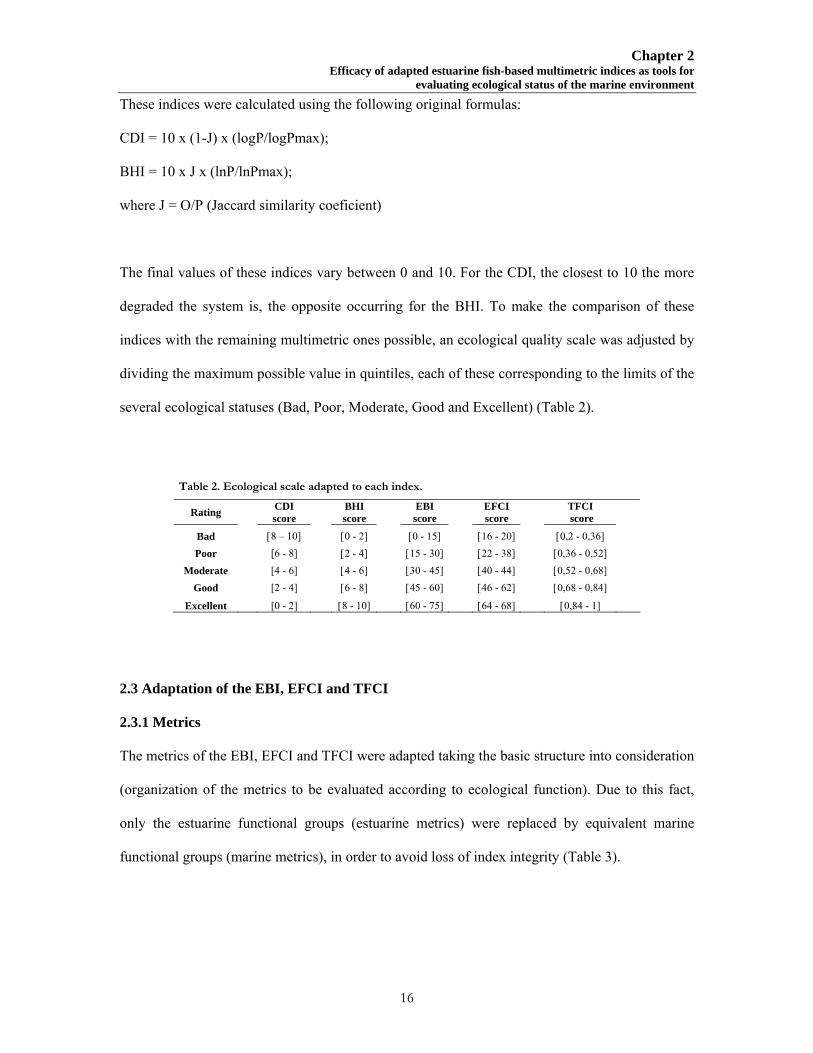
Table 2. Ecological scale adapted to each index.
These indices were calculated using the following original formulas:
CDI = 10 x (1-J) x (logP/logPmax);
BHI = 10 x J x (lnP/lnPmax);
where J = O/P (Jaccard similarity coeficient)
The final values of these indices vary between 0 and 10. For the CDI, the closest to 10 the more
degraded the system is, the opposite occurring for the BHI. To make the comparison of these
indices with the remaining multimetric ones possible, an ecological quality scale was adjusted by
dividing the maximum possible value in quintiles, each of these corresponding to the limits of the
several ecological statuses (Bad, Poor, Moderate, Good and Excellent) (Table 2).
Rating CDI score
BHI score
EBI score
EFCI score
TFCI score
Bad [8 – 10] [0 - 2] [0 - 15] [16 - 20] [0,2 - 0,36] Poor [6 - 8] [2 - 4] [15 - 30] [22 - 38] [0,36 - 0,52]
Moderate [4 - 6] [4 - 6] [30 - 45] [40 - 44] [0,52 - 0,68] Good [2 - 4] [6 - 8] [45 - 60] [46 - 62] [0,68 - 0,84]
Excellent [0 - 2] [8 - 10] [60 - 75] [64 - 68] [0,84 - 1]
2.3 Adaptation of the EBI, EFCI and TFCI
2.3.1 Metrics
The metrics of the EBI, EFCI and TFCI were adapted taking the basic structure into consideration
(organization of the metrics to be evaluated according to ecological function). Due to this fact,
only the estuarine functional groups (estuarine metrics) were replaced by equivalent marine
functional groups (marine metrics), in order to avoid loss of index integrity (Table 3).

Chapter 2 Efficacy of adapted estuarine fish-based multimetric indices as tools for
evaluating ecological status of the marine environment
17
Table 3: Estuarine metrics of each original index and the correspondent adapted marine metrics. An abbreviation of the attribute that each metric represents is also indicated (DC-species diversity and composition, A-species abundance; NF-nursery function; TI-trophic integrity; O-other).
Attribute Estuarine metrics Marine metrics Indices
DC Total number of taxa Total number of taxa EFCI; EBI; TFCI DC Rare or threatened species Commercially threatened species EFCI DC Exotic or introduced species Exotic or introduced species EFCI DC Species composition (% Bray-Curtis similarity) Species composition (% Bray-Curtis similarity) EFCI A Relative abundance (% Bray-Curtis similarity) Relative abundance (% Bray-Curtis similarity) EFCI; TFCI A Number of species that make up 90% of abundance Number of species that make up 90% of abundance EFCI; EBI; TFCI NF Number of estuarine resident taxa Number of resident taxa in that substrate EFCI; EBI; TFCI NF Number of estuarine-dependent marine taxa Number of dependent taxa in that substrate excluding resident taxa EFCI; TFCI NF Relative abundance of estuarine resident taxa Relative abundance of resident taxa in that substrate EFCI NF Relative abundance of estuarine-dependent marine taxa Relative abundance of dependent taxa in that substrate excluding resident taxa EFCI TI Number of benthic invertebrate feeding taxa Number of invertivore taxa EFCI; TFCI TI Number of piscivore taxa Number of piscivore and macrocarnivore taxa EFCI; TFCI TI Relative abundance of benthic invertebrate feeding taxa Relative abundance of invertivore taxa EFCI TI Relative abundance of piscivore taxa Relative abundance of piscivore and macrocarnivore taxa EFCI A Abundance in number (ln(n+1)) Abundance in number (ln(n+1)) EBI NF Number of nursery species Number of nursery species (in that subatrate) EBI NF Number of estuarine spawners Number of spawning species (in that substrate) excluding resident taxa EBI O Proportion of benthic-associated species Proportion of benthic-associated species EBI O Proportion of disease or abnormal species Proportion of disease or abnormal species EBI TI Feeding guild composition (number) Feeding guild composition (number) TFCI TI Functional guild composition (number) Functional guild composition (number) TFCI DC Presence of "indicator species" Presence of "indicator species" TFCI

Chapter 2 Efficacy of adapted estuarine fish-based multimetric indices as tools for
evaluating ecological status of the marine environment
18
For some of the metrics it was not possible to obtain a direct equivalence between estuarine and
marine metrics because of the particularities of the marine environment and their fish
communities. Therefore, for these cases, the marine metrics chosen as equivalent were based on
the initial concept that each author used to measure ecological status.
The metric “rare or threatened species” of the EFCI was selected by Harrison and Whitfield
(2004) because it is an additional measure of the conservation value of the ecosystem, once that
these species are fragile and tend to decrease with an increase in anthropogenic stress. As the
marine environment is very broad and with undefined frontiers, the presence or absence of rare or
threatened species cannot be assessed as a direct function of ecological status. For this reason,
this metric was replaced by the presence or absence of “commercially threatened species” as a
measure of the effect of fishing, as this is the main anthropogenic impact directly affecting the
structure of marine fish communities in Portugal.
The metrics, in number of species and abundance, relative to piscivore species of the EFCI and
TFCI, did not have a direct equivalence as well, considering that marine fish communities have
only a few exclusively piscivore species. Therefore, we considered both the macrocarnivore and
piscivore species, keeping the initial meaning of these metrics: a measure of the top carnivores in
the trophic network (Harrison and Whitfield, 2004; Coates et al., 2007).
2.3.2 Reference Limits
For each index a reference situation was calculated for each type of substrate (sandy, rocky and
rocky intertidal) due to the differences between the typical communities of each substrate (Tables
4, 5 and 6).

Chapter 2 Efficacy of adapted estuarine fish-based multimetric indices as tools for
evaluating ecological status of the marine environment
19
Table 4: Scoring system for the EBI metrics and respective reference values by type of substrate.
EBI metrics Sandy Substrate Rocky Substrate Intertidal rocky substrate
10 5 0 10 5 0 10 5 0
Total number of taxa 40 20
40 20 7 4
Number of species that make up 90% of the abundance 10 5 14 7 4 1 Abundance ( number of individuals) 11 7 9 5 9 7 Number of nursery species (in that substrate) 30 20 40 20 7 4 Number of spawning species (in that substrate) 10 5 20 10 3 1 Number of resident species in that substrate 25 15 25 15 7 4 Proportion of benthic-associated species 0,5 0,2 0,5
0,2 0,8
0,2
Proportion of disease or abnormal species --- --- 0,01 --- --- 0,01 --- --- 0,01

Chapter 2 Efficacy of adapted estuarine fish-based multimetric indices as tools for
evaluating ecological status of the marine environment
20
Table 5: Scoring system for the EFCI metrics and respective reference values by type of substrate.
EFCI metrics Sandy Substrate Rocky Substrate Intertidal Rocky Substrate
5 3 1 5 3 1 5 3 1
Total number of taxa 40 20 40 20 7 4
Commercially threatened species Presence Absence --- Presence Absence --- Presence Absence ---
Exotic or introduced species --- Absence Presence --- Absence Presence --- Absence Presence
Species composition (%Bray-Curtis similarity) 80% similarity 50% similarity 80% similarity 50% similarity 80% similarity 50% similarity
Relative abundance (%Bray-Curtis similarity) 60% similarity 40% similarity 60% similarity 40% similarity 60% similarity 40% similarity
Number of species that make up 90% of the abundance 10 5 14 7 4 2
Number of resident taxa in that substrate 25 15 25 15 7 4
Number of dependent taxa in that substrate 6 2 10 4 2 ----
Relative abundance of resident taxa in that substrate 25-75% ≥ 10% and < 25%
or > 75% and ≤ 90%
<10 or >90% 25-75% ≥ 10% and < 25%
or > 75% and ≤ 90%
<10 ou >90%
>75% 10-75% <10
Relative abundance of dependent taxa in that substrate
>1% <1% ---- 25-75% ≥ 10% and < 25%
or > 75% and ≤ 90%
<10 ou >90%
>0% 0% ----
Number of invertivore taxa 15 5 15 5 4 2
Number of piscivore/macrocarnivore taxa 25 15 15 5 1 ----
Relative abundance of invertivore taxa 0,5 0,3 0,5 0,3 0,02 ----
Relative abundance of piscivore/macrocarnivore taxa 0,5 0,3 0,1 0,05 0,002 ----

Chapter 2 Efficacy of adapted estuarine fish-based multimetric indices as tools for
evaluating ecological status of the marine environment
21
Table 6: Scoring system for the TFCI metrics and respective reference values by type of substrate.
TFCI metrics Sandy Substrate Rocky Substrate Intertidal Rocky Substrate
1 2 3 4 5 1 2 3 4 5 1 2 3 4 5
Species composition (%Bray-Curtis similarity ) 0% 20% 40% 60% 80% 0% 20% 40% 60% 80% 0% 20% 40% 60% 80% Presence of "indicator species" --- --- 0 --- 1 --- --- 0 --- 1 --- --- 0 --- 1 Relative abundance (%Bray-Curtis similarity ) 0% 20% 40% 60% 80% 0% 20% 40% 60% 80% 0% 20% 40% 60% 80% Number of taxa that make up 90% of the abundance 0 3 6 8 11 0 6 13 19 26 0 1 2 3 4 Number of resident taxa in that substrate 0 14 28 43 57 0 10 20 31 41 0 2 4 6 8 Number of dependent taxa in that substrate 0 4 8 12 16 0 6 12 18 24 0 1 2 2 3 Funcional guild composition 0 1 1 2 3 0 1 1 2 3 0 0 0 1 >1 Number of invertivore taxa 0 8 16 25 33 0 7 14 20 27 0 1 2 4 5
Number of piscivore and macrocarnivore taxa 0 13 26 39 52 0 7 14 20 27 0 1 2 4 5
Feeding guild composition 1 2 3 4 5 1 2 3 4 5 1 --- 2 --- 3

Chapter 2 Efficacy of adapted estuarine fish-based multimetric indices as tools for
evaluating ecological status of the marine environment
22
Since no historical data exist for the evaluated sites, neither a great number of studies using the same
sampling method and physico-chemical data available to know which are the unimpacted sites, the
reference limits of each metric were calculated from the metric values of the 15 studies complemented
with expert judgement, except for the metrics “relative abundance” of the EFCI and “species
composition” of the EFCI and TFCI that employ the Bray-Curtis similarity index. The reference to
calculate the similarity percentage of these metrics was defined based on a broader set of studies (69
including the 15 assessed studies), selected by substrate type and considering the sampling method
used.
Independently of the aforementioned methods, only the potential occurrence of typical species of each
substrate was considered, meaning that the rare, uncommon and occasional species were not taken
into account, once that the capture probability of these species is very low. This way, if non-typical
species are captured in the samples, it only increases the score value of each metric and therefore the
final value of the index.
Although this methodology does not guarantee that the reference limits are real, the ecological results
obtained with these reference limits can be compared, considering that the same principles were used
in their calculation for all indices, that the sampling methods were representative of each substrate and
that the goal of this study is to compare the efficiency of each index in the assessment of ecological
status.
2.3.3 Score System and Ecological Scale
The metric score system of the EFCI and TFCI, according to the adapted reference limits, are similar to
the ones initially proposed by the authors (Harrison and Whitfield, 2004; Coates et al., 2007) (Tables 5
and 6). In order to obtain the final ecological scale with the EFCI we only adapted the terminology of
the various ecological statuses, therefore the ecological status “Very Poor”, “Poor”, “Moderate”,

Chapter 2 Efficacy of adapted estuarine fish-based multimetric indices as tools for
evaluating ecological status of the marine environment
23
“Good” and “Very Good” correspond respectively to “Bad”, “Poor”, “Moderate”, “Good” and
“Excellent”, keeping the value gaps of the EFCI (Table 2).
The final value of the TFCI is given as a “Relative Score” (RS) that varies between 0 and 1. The RS is
calculated by dividing the total sum of scores of the 10 metrics by the highest possible score.
However, the authors of this index did not give any ecological quality scale adapted to these RS
values, thus, keeping the guidelines of adaptation formally used with the CDI and the BHI, we divided
the maximum final RS value in quintiles, each one corresponding to the limits of the ecological
statuses (Bad, Poor, Moderate, Good and Excellent) (Table 2).
Once the score system of the EBI was originally tested to separate only low-quality sites from
medium-quality ones due to the absence of high-quality (reference) sites (Deegan et al., 1997), it had
to be adapted to make the comparison between its results and the remaining indices possible. Based
upon the principles of the original EBI, with a value of 0 for metrics with low quality and 5 for
metrics with medium quality, a score of 10 was added for metrics with good quality (Table 4). The
authors still defined that, if the final EBI value was less or equal to 25 out of a maximum of 40
(meaning that at least 3 out of the 8 metrics failed), the site was classified as “low quality” (Deegan et
al., 1997), thus, the ecological scale for the final value of the adapted EBI had to be altered. Following
the same principle of the remaining indices, the highest possible value of the adapted EBI (75) was
divided in quintiles, each one corresponding to an ecological status (Bad, Poor, Moderate, Good and
Excellent) (Table 2).
2.4 Evaluation of adapted indices
For each study the values of the various metrics were calculated based on the principles used by authors
of the EBI, EFCI and TFCI (Deegan et al., 1997; Harrison and Whitfield, 2004; Coates et al., 2007),
except for the metric “proportion of disease or abnormal species” of the EBI, due to lack of data and for
Chapter 2 Efficacy of adapted estuarine fish-based multimetric indices as tools for
evaluating ecological status of the marine environment
24
the “exotic or introduced species” of the EFCI, as there are no species in this category for Portuguese
marine waters. In order to avoid the negative influence of these metrics on the final index value, we
attributed an intermediate score for all zones assessed, so these metrics were excluded from the
analysis.
According to the adapted reference values, a score was given to the remaining metrics and the CDI
and BHI potentials (P and Pmax) were also calculated following the same method. The final values of
each index were then estimated and the values obtained were compared with the respective ecological
scale. The metrics responsible for the ecological status obtained were analysed using histograms
representing the metric scores of each study, by index.
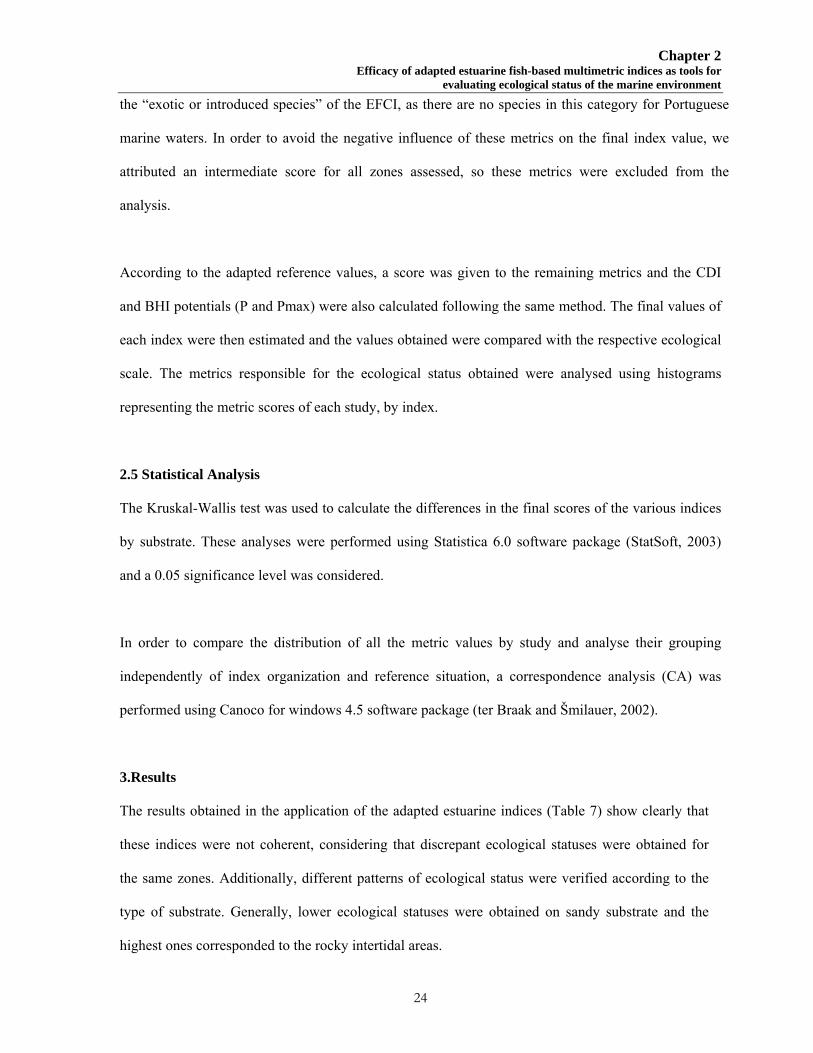
2.5 Statistical Analysis
The Kruskal-Wallis test was used to calculate the differences in the final scores of the various indices
by substrate. These analyses were performed using Statistica 6.0 software package (StatSoft, 2003)
and a 0.05 significance level was considered.
In order to compare the distribution of all the metric values by study and analyse their grouping
independently of index organization and reference situation, a correspondence analysis (CA) was
performed using Canoco for windows 4.5 software package (ter Braak and Šmilauer, 2002).
3.Results
The results obtained in the application of the adapted estuarine indices (Table 7) show clearly that
these indices were not coherent, considering that discrepant ecological statuses were obtained for
the same zones. Additionally, different patterns of ecological status were verified according to the
type of substrate. Generally, lower ecological statuses were obtained on sandy substrate and the
highest ones corresponded to the rocky intertidal areas.

Chapter 2 Efficacy of adapted estuarine fish-based multimetric indices as tools for
evaluating ecological status of the marine environment
25
Table 7: Ecological status obtained with each index for all evaluated zones (A- sandy zones; B- rocky zones; C- intertidal rocky zones). Every final index value is in brackets. The ecological status indicated by * were close to the upper status and the ones that are indicated by ** were close to the lower ecological status.
Among the sandy substrate zones evaluated (Table 7a) the highest values were obtained for
“Algarve 2005”, where none of the indices showed values below Moderate. The lowest ecological
status corresponded to the deep sandy zones 1, 2 and 3 (20-100m). In this substrate the CDI and the
BHI agreed, although these indices showed the lowest ecological statuses. Among the remaining
indices, the most demanding one (with lower ecological statuses) was the TFCI, followed by the
FCI and the EBI. The metrics responsible for lower ecological statuses for the TFCI (Figure 1) were
the “relative abundance”, the “number of species that make up 90% of abundance” and the “number
of invertivore taxa”, while for the EFCI (Figure 2) were the “species composition” and the “relative
abundance”, and at last for the EBI (Figure 3) were the “number of resident taxa in that substrate”,
the “number of nursery species (in that substrate)”, the “number of species that make up 90% of
abundance” and the “proportion of benthic-associated species”. We also verified that for this
substrate the metrics corresponding to the “number of dependent taxa in that substrate excluding
A Index Sand- zone1 Sand- zone 2 Sand- zone 3 Sand- Tejo Sand- Algarve CDI Poor (7,56) Poor (6,80) Poor (7,10) Poor (7,08) Moderate (5,28) BHI Poor (2,00) ** Poor (2,77) Poor (2,56) Poor (2,49) Moderate (4,29) EBI Poor (20) Good (45) ** Good (50) Good (55) Excelent (70) EFCI Poor (38) Good (46) ** Moderate (44) Good (48) Good (56)
TFCI Poor (0,48) Moderate (0,63) Moderate (0,56) Moderate (0,58) Good (0,71)
B Index Rock- Berlengas Rock- Algarve Rock- Sines Rock- Ria Formosa Rock- Arrábida CDI Good (3,87) ** Poor (7,13) Moderate (5,35) Poor (7,86) ** Excelent (1,90) BHI Moderate (5,64) Poor (2,40) Moderate (4,18) ** Bad (1,67) * Good (7,63) EBI Excelent (65) Moderate (30) ** Good (55) Bad (10) Excelent (65) EFCI Good (54) Moderate (44) Good (56) ** Poor (38) Excelent (64) **
TFCI Good (0,71) Poor (0,48) Moderate (0,67) Poor (0,46) Excelent (0,83)
C Index Intertdal- Amoreira Intertidal- Avencas Intertidal- StCruz Intertidal- Gelfa Intertidal- Cabo Raso
CDI Good (3,77) ** Excelent (1,95) ** Good (3,77) ** Excelent (1,34) Excelent (0,73) BHI Moderate (5,47) Good (7,30) Moderate (5,47) Good (7,90) * Excelent (8,51) EBI Good (55) Excelent (65) Good (55) Excelent (75) Excelent (65) EFCI Good (50) Good (62) Good (52) Excelent (64) ** Excelent (66)
TFCI Good (0,73) Excelent (0,88) Good (0,69) ** Excelent (0,88) Excelent (0,90)

Chapter 2 Efficacy of adapted estuarine fish-based multimetric indices as tools for
evaluating ecological status of the marine environment
26
resident taxa” and to the “functional guild composition” of the TFCI (Figure 1) and the metric
“commercially threatened species” of the EFCI (Figure 2) did not contribute for the separation of
ecological status, since they always retrieved the same score value.
Unlike the observed on sandy substrate, the BHI was more demanding than the CDI on the rocky
substrate; in four out of five studies evaluated with the BHI, the ecological statuses obtained were
one step lower than with the CDI (Table 7b). With the exception of “Ria Formosa” and similarly to
the sandy zones, the most demanding index was the TFCI, followed by the EFCI and the EBI. The
“Bad” ecological status obtained with the EBI for “Ria Formosa” is due to the fact that only two of
the eight metrics had intermediate scores and the other ones scored low (Figure 3). For this
substrate, the metrics responsible for the lowest ecological status obtained with the TFCI (Figure 1)
were the “number of species that make up 90% of abundance”, the “number of resident taxa in that
substrate” and the “number of piscivore and macrocarnivore taxa”, with the EFCI (Figure 2) were
the “number of resident taxa in that substrate” and the “species composition”, finally with the EBI
(Figure 3) were the metric “number of species that make up 90% of abundance”, the “number of
nursery species (in that substrate)” and the “number of resident taxa in that substrate”. We also
verified that the metrics “presence of indicator species” and “functional guild composition” of the
TFCI and once again the metric “commercially threatened species” of the EFCI did not contribute to
the separation of ecological status.

Chapter 2 Efficacy of adapted estuarine fish-based multimetric indices as tools for
evaluating ecological status of the marine environment
27
Figure 1. Scores obtained with each metric of the TFCI on all evaluated zones. The TFCI score system varies between 1 and 5.

Chapter 2 Efficacy of adapted estuarine fish-based multimetric indices as tools for
evaluating ecological status of the marine environment
28
Figure 2. Scores obtained with each metric of the EFCI on all evaluated zones. The possible scores for each metric are 1, 3 or 5.

Chapter 2 Efficacy of adapted estuarine fish-based multimetric indices as tools for
evaluating ecological status of the marine environment
29
Figure 3. Scores obtained with each metric of the EBI on all evaluated zones. The possible scores for each metric are 0, 5 or 10.

Chapter 2 Efficacy of adapted estuarine fish-based multimetric indices as tools for
evaluating ecological status of the marine environment
30
On the intertidal rocky substrate, the BHI was more demanding than the CDI (Table 7c). In
general, except for the BHI and the “Avencas” zone with the EFCI, the ecological statuses
obtained were all coherent between them. However, many of the evaluated metrics did not
contribute for the separation of ecological status, namely the “presence of indicator species” of
the TFCI, the “total number of taxa”, the “number of resident taxa in that substrate” and the
“proportion of benthic-associated species” of the EBI and the “total number of taxa”, the
“relative abundance”, the “number of resident taxa in that substrate” and the “relative
abundance of resident taxa in that substrate” of the EFCI. The metrics that contributed for the
lower ecological status were the “number of spawning species (in that substrate)” of the EBI
and the “number of piscivore and macrocarnivore taxa” of the TFCI.
The results obtained with the Kruskal-Wallis test showed significant differences between the
averaged final scores for the three substrates with the CDI (H= 7.594; p< 0.05), the BHI (H=
6.512; p<0.05) and the TFCI (H=6.776;p<0.05).
The bidimentional plot of the CA representing the evaluated zones according to their affinity in
metric values is represented in figure 4. The cumulative percentage of variation explained by the
two first axes was 71.5%. It is possible to identify three main groups corresponding to the
intertidal zones (group 1), deep sandy zones (group 2) and shallow sandy and rocky subtidal
zones (group 3).
Figure 4. Correspondence analysis ordination diagram of zones according to metric values. The first two ordination axes represent 71.5% of the total variance. The eigenvalues of axis 1 and axis 2 are 0.072 and 0.034, respectively. Legend: S- sandy zones, R- rocky zones, I- intertidal rocky zones.

Chapter 2 Efficacy of adapted estuarine fish-based multimetric indices as tools for
evaluating ecological status of the marine environment
31
4. Discussion
Considering the expected results (ecological status equal or higher than “Moderate”) and
accounting for the lack of coherence in the evaluation of the same zones, the CDI and the BHI
were not capable of assessing the ecological status, compared to the remaining indices. This
result can be explained not only by the simplicity of these indices, as they are only based on
presence/absence data, but also by the strong influence of sample size in the determination of
species richness estimates, which affects the computation of the Jaccard coefficient. Although
these indices have been applied to rivers and estuary systems with the goal of ranking their
segments according to biological health (BHI) or degradation (CDI) and its contribution to the
region as a whole (Harrison et al., 2000; Whitfield and Elliott, 2002; Vasconcelos et al., 2007),
they do not provide sufficient information, since the species guilds being affected are not
identified. Therefore, when used isolated, they are not suitable to trace adequate measure plans
with the aim of recovering fish communities. In this sense, we can conclude that a simple
measure of similarity or dissimilarity between the total number of observed species and its
reference potential does not allow the evaluation of the ecological status of fish communities in
the marine environment.
Among the remaining indices (EBI, EFCI and TFCI), the different patterns obtained on the
ecological statuses for the three substrates suggest the existence of significant differences in the
structure of the fish communities assessed. This result is supported by the ordination analysis
that was performed, where we can distinguish three guilds gathered in accordance to the global
value of all calculated metrics. This way, the existence of three different patterns for the
ecological status was expected; one for deep sandy zones (sand-zone 1, 2 and 3), another for
shallow sandy and subtidal rocky zones and the last one for the intertidal rocky zones.
These results agree with other studies that characterize the structure of marine fish communities,
where the authors verified that depth and type of substrate are, in general, the main factors
responsible for habitat complexity (e.g. Lara and González, 1998; Demestre et al., 2000; Pihl

Chapter 2 Efficacy of adapted estuarine fish-based multimetric indices as tools for
evaluating ecological status of the marine environment
32
and Wennhage, 2002; Letourneur et al., 2003; Prista et al. 2003), These factors are related with
the degree of exposure to predators expressed by the quantity of shelter provided by the habitat,
the food regime available expressed by the likelihood of occurrence of prey and competitors, the
habitat characteristics that maximise reproductive potential among others, that constrains
species abundance (García-Charton and Pérez-Ruzafa, 2001; Rice, 2005). In fact, the habitat-
community relationship is a balance between the flexibility and adaptation of each species and
the resources provided by the habitat, therefore being essential to understand this relationship in
order to properly interpret the final ecological status.
For deep sandy zones (sand-zone 1, 2 and 3) an ecological status equal or greater than “Good”
was expected, as these are wide areas where the most significant impacts over fish communities
are due to fisheries (Gomes et al. 2001). The lower ecological status pattern observed for these
zones is mainly a consequence of the metrics that represent species abundance (“relative
abundance” and “proportion of benthic-associated species”) and species diversity (“species
composition” and “number of species that make up 90% of abundance”) (figures 1,2 and 3). The
low or intermediate scores of this metrics can be explained by the dominance and capture of few
species in each of the assessed zones. In a total of 29 species caught in zone 1, the pelagic
species Trachurus trachurus (Linnaeus, 1758), Sardina pilchardus (Walbaum, 1792) and
Sprattus sprattus (Linnaeus, 1758) represent about 86% of the total abundance of the sample
and together with the demersal species Merluccius merluccius (Linnaeus, 1758) constitute
approximately 92% of the abundance. As observed, this sample was dominated by pelagic
species, which was the main cause for the low score of the metric “proportion of benthic-
associated species”. Zone 2 is dominated by the pelagic species Macroramphosus scolopax
(Linnaeus, 1758) and Macroramphosus gracilis (Lowe, 1839) that make up 98% of the total
abundance of the sample with 40 represented species, once more the supremacy of these pelagic
species negatively affected the score for the “proportion of benthic-associated species”. In a
total of 37 captured species in zone 3, the demersal species Capros aper (Linnaeus, 1758) and
the pelagic species T. trachurus and S. pilchardus represent roughly 94% of the abundance of

Chapter 2 Efficacy of adapted estuarine fish-based multimetric indices as tools for
evaluating ecological status of the marine environment
33
the total sample, in this case the high abundance of the species C. aper (50%) rises the score of
the metric “proportion of benthic-associated species”. However, this was not due to the
existence of many demersal species, but to the fact that only a single gregarious species was
captured.
In terms of abundance, the deep sandy substrate is dominated by pelagic or demersal gregarious
species (e.g. Clupeidae, Carangidae, Gadidae, Scombridae, Centracanthidae), although a high
number of demersal non-gregarious species also exist, but with low abundance (e.g. Soleidae,
Scophthalmidae, Pleuronectidae, Bothidae, Rajidae, Trachinidae) (Pais et al., unpublished data).
Labropoulou and Papacostatinou (2004) showed that species diversity, richness and evenness
decreased with depth, whereas dominance increased and concluded that the cause of these facts
is the homogeneity (low complexity) of the sandy substrate, which increases with depth and
provides a decreasing number of resources. All these facts not only explain the dominance of
few species in the sample, but also the low and intermediate scores obtained for these deep
zones with the metric “number of resident taxa in that substrate”, since only the species that live
over sand were considered as residents and the reference value estimated for this metric
incorporated the data from shallower sandy zones, which include many resident species due to a
larger availability of nourishment given the closeness to subtidal rocky areas (Henriques et al.,
1999; Prista et al., 2003).
The data analysed for deep sand suggest the existence of a strong relationship between the
number of resident species and the number of invertivore species, given that more than 70% of
the invertivore species captured in the three zones were resident. Therefore, we expected a
decrease on the score of the metric “number of invertivore taxa” as a function of the metric
“number of resident taxa in that substrate” with depth, which can be related to the availability of
a more specific nourishment for these species (benthic invertebrates) in comparison with
shallow zones close to subtidal rocky areas that have a more diverse nourishment.

Chapter 2 Efficacy of adapted estuarine fish-based multimetric indices as tools for
evaluating ecological status of the marine environment
34
Given these results we can conclude that, if the sample is dominated by few species, all the
abundance-related metrics will reflect their ecology. In the future, in order to evaluate demersal
communities of deep sand, metrics that ponder in number and abundance the characteristics of
the community structure must be tested in order to eliminate the effect of dominance of some
species in the ecological evaluation. If necessary, gregarious pelagic species can be excluded
from the analysis, since they do not depend directly on the bottom and so do not reflect its
ecological quality. We can also conclude that the reference limits of each metric must be
estimated based only on the typical communities of deep sandy zones.
For the remaining shallow sandy zones the ecological results obtained agree with the expected,
meaning that for the “sand-Tejo” zone a “Moderate” status was expected given its closeness to
the heavily impacted Tejo estuary, while for the “sand-Algarve” zone a “Good” status was
expected as it is a coastal zone with high ecological potential, despite having significant impacts
due to tourism and sewage discharges. In spite of these results, the indices did not show
coherence between them. In these zones “intermediate” or “high” scores were obtained for all
metrics, except for the “relative abundance (% Bray-Curtis similarity)” and “species
composition (% Bray-Curtis similarity)” with the EFCI and the TFCI (Tables 5 and 6). The
results of these zones still suggest the dominance (90% of the abundance) of several demersal
resident species (between 10 to 13 species), which is once more probably related with the
closeness of these habitats to the subtidal rocky areas that provide larger resource availability.
This way, it is expected that the samples belonging to shallow sandy zones include a low
number and abundance of gregarious species and a greater number of demersal resident species
with more balanced abundances. These facts can explain the low score obtained for the above
mentioned metrics, since deep sandy zones (down to 100m) were taken into account for the
estimation of the reference values, which leads to low similarity values, considering that
communities dominated by demersal species with balanced abundances are being compared
with reference values that also have into account the raised abundances of gregarious species. In

Chapter 2 Efficacy of adapted estuarine fish-based multimetric indices as tools for
evaluating ecological status of the marine environment
35
this manner, we can conclude that the reference values estimated for shallow sandy substrate
must only consider the samples held in this depth.
Many species, depending on their life cycle, have different mechanisms to maximize their
recruitment, e.g. nearshore larval retention or offshore dispersive mechanisms (Borges et al.,
2007) and distribution of juveniles with depth (Letourneur et al., 2003), often leading to the
habitats employed by adults to spawn and for the larvae/juveniles to develop not coinciding
with the preferential habitat used by adults to feed and get refuge. For example, Borges et al.
(2007) found some shelf-dwelling species in larval nearshore assemblages (e.g. clupeids,
carangids and engraulids) on the coast of Arrábida. In this context, we consider that a simple
measure of resident taxa and dependent taxa of a particular substrate (with the EFCI and the
TFCI) cannot efficiently reflect the nursery function and we suggest that this attribute should
instead be evaluated with specific metrics like the “number of spawning species” and the
“number of nursery species” used by the EBI.
With the results obtained for sandy substrate, independently of depth, we verified that pelagic
species are poorly represented, therefore we suggest that pelagic trawls must be used in the
future to characterise the pelagic fish communities and proceed to their ecological evaluation.
On the studied rocky zones, the results obtained for Ria Formosa (between “Poor” and “Bad”)
are clearly underrated. Although this zone has significant impacts due to tourism and fisheries,
it has a high ecological potential and therefore a “Good” ecological status was expected. These
results can be explained by the low number of captured species (16) and show the importance of
a representative sampling for ecological evaluation.
The ecological quality results obtained for the “Algarve” zone are also underrated and in
agreement with the correspondence analysis, where it shows some affinity with the intertidal
zones. This occurs because the data for this study were collected on intertidal areas during high-

Chapter 2 Efficacy of adapted estuarine fish-based multimetric indices as tools for
evaluating ecological status of the marine environment
36
tide, where a large proportion of intertidal resident species were found (Faria and Almada,
2006). Therefore, the lower ecological statuses obtained for this zone are due to the fact that we
are comparing a low number of opportunistic and resident species that visit the intertidal
platform during high tide with reference values based on the larger diversity characteristic of
subtidal zones.
The ecological status results obtained with these indices for the remaining rocky zones are close
to the expected, “Good” to “excellent” for “Arrábida” and “Berlengas”, since they are low
impacted and have a high biodiversity and “Moderate” to “Good” for “Sines”, which is an
industrialized zone. However, the indices were discrepant when evaluating the same zones
(Table 7b), which means that some attributes (diversity, abundance, nursery function, trophic
integrity) are not representing correctly the rocky fish community.
On the north-eastern Atlantic, the temperate reef fish communities are characterised by the
higher abundance of species belonging to the families Labridae, Sparidae, Gobiidae, Blenniidae
and Serranidae, though also including a number of other families with lower abundances (e.g.
Carangidae, Syngnathidae, Mugilidae, Phycidae, Gobiesocidae, Callionymidae, Scorpaenidae,
Soleidae, Triglidae) (Almada et al., 1999; Henriques et al., 1999). The large majority of these
species are benthivore and rarely herbivore and planktonivore (Almada et al., 1999), in fact the
analysed data for each zone show a prevalence of invertivore, macrocarnivore and omnivore
species and only 3 herbivore species: Sarpa salpa (Linnaeus, 1758), Parablennius pilicornis
(Cuvier, 1829), Parablennius sanguinolentus (Pallas, 1814) and a few zooplanktivore species of
the families Gobiesocidae and Syngnathidae. This suggests that the characterisation of trophic
integrity that is measured using metrics related only to invertivore and macrocarnivore/piscivore
taxa with the EFCI and the TFCI (Table 5 and 6), must also have in consideration the omnivore
taxa (e.g. blennids, some labrids and gobiids) since they are a diverse and abundant guild on this
substrate (between 15-40% in each sample).
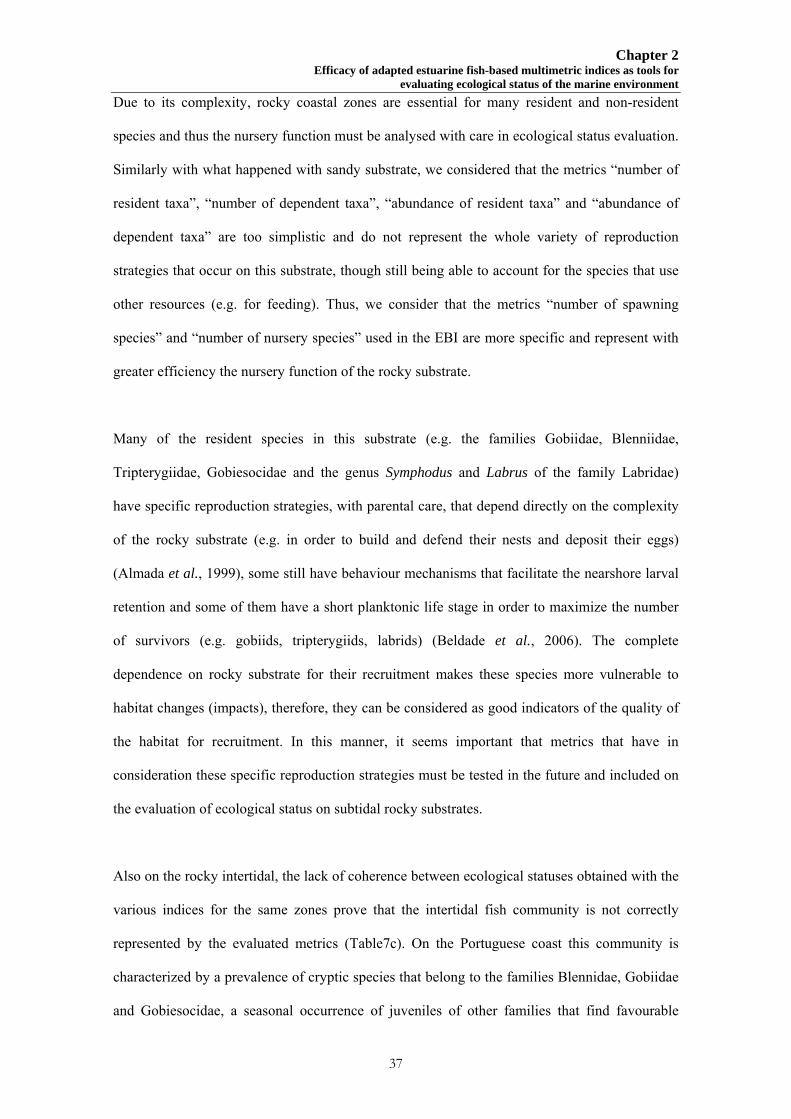
Chapter 2 Efficacy of adapted estuarine fish-based multimetric indices as tools for
evaluating ecological status of the marine environment
37
Due to its complexity, rocky coastal zones are essential for many resident and non-resident
species and thus the nursery function must be analysed with care in ecological status evaluation.
Similarly with what happened with sandy substrate, we considered that the metrics “number of
resident taxa”, “number of dependent taxa”, “abundance of resident taxa” and “abundance of
dependent taxa” are too simplistic and do not represent the whole variety of reproduction
strategies that occur on this substrate, though still being able to account for the species that use
other resources (e.g. for feeding). Thus, we consider that the metrics “number of spawning
species” and “number of nursery species” used in the EBI are more specific and represent with
greater efficiency the nursery function of the rocky substrate.
Many of the resident species in this substrate (e.g. the families Gobiidae, Blenniidae,
Tripterygiidae, Gobiesocidae and the genus Symphodus and Labrus of the family Labridae)
have specific reproduction strategies, with parental care, that depend directly on the complexity
of the rocky substrate (e.g. in order to build and defend their nests and deposit their eggs)
(Almada et al., 1999), some still have behaviour mechanisms that facilitate the nearshore larval
retention and some of them have a short planktonic life stage in order to maximize the number
of survivors (e.g. gobiids, tripterygiids, labrids) (Beldade et al., 2006). The complete
dependence on rocky substrate for their recruitment makes these species more vulnerable to
habitat changes (impacts), therefore, they can be considered as good indicators of the quality of
the habitat for recruitment. In this manner, it seems important that metrics that have in
consideration these specific reproduction strategies must be tested in the future and included on
the evaluation of ecological status on subtidal rocky substrates.
Also on the rocky intertidal, the lack of coherence between ecological statuses obtained with the
various indices for the same zones prove that the intertidal fish community is not correctly
represented by the evaluated metrics (Table7c). On the Portuguese coast this community is
characterized by a prevalence of cryptic species that belong to the families Blennidae, Gobiidae
and Gobiesocidae, a seasonal occurrence of juveniles of other families that find favourable

Chapter 2 Efficacy of adapted estuarine fish-based multimetric indices as tools for
evaluating ecological status of the marine environment
38
conditions for their development (e.g. Sparidae, Labridae, Cottidae and Lotidae) and an
occasional appearance of opportunistic species in the pools (Faria, 2000). All of the metrics
referring to diversity (“total number of taxa”, “species composition (% Bray-Curtis
similarity)”), abundance (“number of species that make up 90% of abundance”, “relative
abundance (% Bray-Curtis similarity) and the metric “proportion of benthic-associated species”
(Tables 4, 5 and 6), only reflect the ecology of resident species. Moreover, the trophic function
attribute, which only measures the invertivore and macrocarnivore/piscivore taxa, does not have
into account the resident species since the majority of these species are omnivore (blenniids and
Gobius cobitis Pallas, 1814).
As with the rocky substrate, the nursery function is not being correctly evaluated on all indices
because it does not take into consideration the resident species that have specific reproduction
strategies with total dependence on the substrate (e.g. Coryphoblennius galerita (Linnaeus,
1758), Lipophrys pholis (Linnaeus, 1758), Lepadogaster lepadogaster (Bonnaterre, 1788) and
Gobius paganellus Linnaeus, 1758).
Some authors argued that size, topography and biotic cover of a pool may provide a limited
number of favourable sites that condition the size class and the type of species that can live in
intertidal zones (Macpherson, 1994; Almada and Faria 2004). These facts underline the
dependence of the ecological potential of each intertidal zone on each of the above mentioned
factors. Our results reflect this problem in ecological quality evaluation, since the intertidal
zones with the lowest ecological status (Amoreira and Santa Cruz, see table 7c) correspond to
the most hydrodynamic ones (Cláudia Faria, pers. comm.). The dependence of stability and
resilience of intertidal fish and the occurrence of opportunistic and occasional species on
limiting factors related to the complexity of pools means that it will probably be impossible to
estimate a global reference situation for the intertidal rocky substrate.

Chapter 2 Efficacy of adapted estuarine fish-based multimetric indices as tools for
evaluating ecological status of the marine environment
39
Because of all presented reasons, the low representativeness of the metrics and the inadequate
reference condition, we can conclude that the analysed indices were totally ineffective on the
ecological quality evaluation of this substrate.
The concepts of the metrics “feeding guild composition”, “functional guild composition” and
“presence of indicator species” of the TFCI and the “commercially threatened species” and
“exotic or introduced species” of the EFCI, must be reviewed, as they did not contribute to the
separation of ecological status on none of the substrates (Table 4, 5 and 6). The first two metrics
have little ecological meaning since the presence of a single individual of a species is enough to
consider its feeding or functional guild represented, not taking into account their proportions.
With respect to the “commercially threatened species”, the presence of one of them is enough to
attribute a maximum score for this metric, not being representative of the ecological status of
substrate. The metric “presence of indicator species” is originally calculated for the estuaries
based on the conservation status of disturbance-sensitive species (Coates et al., 2007), but in the
Portuguese case only a few marine species have this status, namely Alosa alosa (Linnaeus,
1758) and Alosa fallax (Lacépède, 1803). Due to this, the metric “exotic or introduced species”
must be removed from the indices that assess the ecological status of Portuguese marine waters.
If we analyse the scores of metrics that are common in the indices (e.g. “total number of taxa”,
“number of taxa that make up 90% of abundance”, “number of resident taxa”, “number of
dependent taxa”, “number of invertivore taxa”, “number of piscivore and macrocarnivore taxa”)
and as the reference values have been calculated with the same methodology, we easily
understand that the score system of the TFCI is more demanding. So, if it is possible to attribute
one of five score values to each metric (TFCI) instead of three (BHI and EFCI), a higher
discrimination of ecological status is achieved.

Chapter 2 Efficacy of adapted estuarine fish-based multimetric indices as tools for
evaluating ecological status of the marine environment
40
5. Final Considerations This work shows that none of the existing indices is efficient in the evaluation of ecological
status of marine fish communities, since they are neither representative nor have in
consideration the particularities of typical fish communities of each substrate. In the future, the
relationship between the metrics must be tested and reviewed in order to eliminate redundant
metrics and include only the metrics that characterize typical communities of the various
substrates, with the aim of creating new indices for the evaluation of ecological status on the
marine environment. We suggest that the reference values for each metric should be estimated
according to substrate and depth and that the new indices should include metrics that reflect the
main impacts affecting marine fish communities (e.g. fishing), in order to facilitate the
interpretation and identification of the problem and thus intervene correctly on the impact
sources.
Independently of the method used, the definition of reference limits is a very sensitive issue,
since the obtained ecological status, often used to develop sustainable management plans,
depends highly on these values. This way, we suggest that any reference situation should be
exhaustively tested and that the results should be compared with the expected ones.
The methodology used in this work can be used to support the comparison of indices that
employ the same biological indicators, in order to choose the index that better adjusts to a
particular place or to adjust the metrics to its typical community with the objective of increasing
the degree of confidence of the ecological status obtained.
Considering the difficulties found in the application of these indices it is clear that these should
be merely regarded as tools for ecological status evaluation and thus their application does not
disregard a cautious ecological interpretation of the final index value in order to correctly assess
the underlying ecological problems.

Chapter 2 Efficacy of adapted estuarine fish-based multimetric indices as tools for
evaluating ecological status of the marine environment
41
6. References
Abreu, S., 2005. Caracterização da ictiofauna associada a substratos móveis costeiros ao largo
do Algarve Central. University of Algarve, Thesis. 65pp, Portugal.
Almada, V.C., Gonçalves, E.J., Henriques, M., 1999.Ecology and behaviour of reef fishes in the
temperate north-eastern Atlantic and adjacent waters. In: Almada, V.C., Oliveira, R.F.,
Gonçalves, E.J. (Eds.) Behaviour and conservation of littoral fishes. Instituto Superior de
Psicologia Aplicada (ISPA). 33-61 pp, Portugal.
Almada, V., Gonçalves, E., Henriques, M., 2002. Inventariação e ecologia da ictiofauna do
substrato rochoso da costa Arrábida/Espichel. Instituto Superior de Psicologia Aplicada
and Instituto da Conservação da Natureza, Technical report. 264pp, Portugal.
Almada, V., Faria, C., 2004. Temporal variation of rocky intertidal resident fish assemblages –
patterns and possible mechanisms with a note on sampling protocols. Reviews in Fish
Biology and Fisheries 14, 239-250.
Almada, V., Henriques, M., Gonçalves, E., Garcia, J. Henriques, S., 2004. Caracterização da
situação de referência e avaliação de impactes para a central térmica de ciclo combinado
proposta para a área de Sines. Estudo de Impacto Ambiental, Componente de Biologia
Marinha. Hidroprojecto, Technical report. 34pp, Portugal.
Almeida, A.J., 1996. Structure and spatial variability of the rocky fish fauna in the protected
marine “Reserva Natural da Berlenga” (Portugal). Arquivo Museu Bocage (nova série) 2,
633-642.
Almeida, O., 1997. Estudo comparativo das comunidades ictiológicas de um redife artificial e
um recife natural vizinho na costa sul algarvia. University of Algarve, Thesis. 40pp,
Portugal.
Beaumont, M.J., Austen, M.C., Atkins, J.P., Burdon, D., Degraer, S., Dentinho, T.P., Derous,
S., Holm, P., Horton, T., Van Ierland, E., Marboe, A.H., Starkey, D.J., Tomnsend, M.,
Zarzyoki, T., 2007. Identification, definition and quantification of goods and services
provide by marine biodiversity: implications for the ecosystem approach. Marine
Pollution Bulletin 54, 253-265.

Chapter 2 Efficacy of adapted estuarine fish-based multimetric indices as tools for
evaluating ecological status of the marine environment
42
Beldade, R., Borges, R., Gonçalves, E., 2006. Depth distribution of nearshore temperate fish
larval assemblages near rocky substrates. Journal of Plankton Research 28, 1003-1013.
Borja, A., Franco, J., Pérez, V., 2000. A Marine Biotic Index to establish the ecological quality
of soft-bottom benthos within European estuarine and coastal environments. Marine
Pollution Bulletin 40, 1100-1114.
Borja, A., 2006. The new European Marine Strategy Directive: Difficulties, opportunities, and
challenges. Marine Pollution Bulletin 52, 239-242.
Borges, R., Ben-Hamadou, R. R., Chícharo M.A., Ré P., Gonçalves, E.J., 2007. Horizontal
spatial patterns of distribution of very-nearshore larval fish assemblages at a temperate
rocky shore. Estuarine, Coastal and Shelf Science 71, 412-428.
Breine, J.J., Maes, J., Quataert, P., Van den Bergh, E. Simoens, I., Van Thuyne, G., Belpaire,
C., 2007. A fish-based assessment tool for the ecological quality of the Brackish Schelde
estuary in Flanders (Belgium). Hydrobiologia 575, 141-159.
Chenery, A.M., Mudge, S. M., 2005. Detecting anthropogenic stress in an ecosystem: 3.
mesoscale variability and biotic indices. Environmental Forensics 6, 371-384.
Coates, S., Waugh, A., Anwar, A.., Robson., M., 2007. Efficacy of a multi-metric fish index as
an analysis tool for the transitional fish component of the Water Framework Directive.
Marine Pollution Bulletin 55, 225-240.
COM, 2005a. Communication from the Commission to the Council and the European
Parliament. Thematic Strategy on the Protection and Conservation of the Marine
Environment. COM (2005), 504 final, SEC(2005), 1290. 9 pp.
COM, 2005b. Proposal for a Directive of the European Parliament and of the Council,
establishing a Framework for Community Action in the field of Marine Environmental
Policy. COM (2005), 505 final, SEC (2005), 1290. 31 pp.
COM, 2006. EU Marine Strategy-The story behind the strategy. European communities
<http://europa.eu.int/comm/environment/water/marine.htm>. 31pp.

Chapter 2 Efficacy of adapted estuarine fish-based multimetric indices as tools for
evaluating ecological status of the marine environment
43
Cooper, J. A. G., Ramm, A. E. L., Harrison, T. D., 1994. The Estuarine Health Index: a new
approach to scientific information transfer. Ocean and Coastal Management 25, 103–141.
Costanza, R., Andrade, F., Antunes, P., Van den Belt, M., Boesch, D.F., Boersma, P.D.,
Catarino, F., Hanna, S.S., Limburg, K., Low, B., Molitor, M., Pereira, J.G., Rayner, S.,
Santos, R., Wilson, J., Young, M., 1998. A Economia Ecológica e a Governação
Sustentável dos Oceanos. In Constanza, P. & Andrade, F. (eds) A Economia Ecológica e
a Governação Sustentável dos Oceanos, FLAD-IMAR- LPN. 11-40 pp, Portugal.
Deegan, L. A., Finn, J.T., Ayvazian, S.G., Ryder-Kieffer, C.A., Buonaccorsi, J., 1997.
Development and validation of an Estuarine Biotic Integrity Index. Estuaries 20, 601-617.
Demestre, M. Sánchez, P., Albelló, P., 2000. Demersal fish assemblages and habitat
characteristics on the continental shelf and upper slope of the north-western
Mediterranean. Journal of the Marine Biological Association of the United Kingdom 80,
981-988.
Diaz, R.J., Solan, M., Valente, R.M., 2004. A review of approaches for classifying benthic
habitats and evaluating habitat quality. Journal of Environmental Management 73, 165-
181.
Dinis, M.H., Marecos, M.L., 1984. Estudo dos recursos demersais da costa portuguesa.
Relatório da 5ªcampanha, N/E «noruega» Outubro 1980 cruzeiro 020221080. INIP,
Technical report. 96p, Portugal.
Elliott, M., Whitfield, A.K., Potter, I.C., Blaber, S.J.M., Cyrus, D.P., Nordlie, F.G., Harrison,
T.D., 2007. The guild approach to categorizing estuarine fish assemblages: a global
review. Fish and Fisheries 8, 241-268.
EPA, 2000. Evaluation Guidelines for Ecological indicators. United States Environmental
Protection Agency, EPA-620-R-99-005. 45pp, Washington.
Faria, C., 2000. Biologia da reprodução e ecologia das comunidades de peixes residentes nas
plataformas rochosas intertidais: Lipophrys pholis (Blenniidae), Coryphoblennius galerita
(Blenniidae), Gobius cobitis (Gobiidae) e Gobius paganellus (Gobiidae). Instituto
Superior de Psicologia Aplicada (ISPA), Phd thesis. 293pp, Portugal.

Chapter 2 Efficacy of adapted estuarine fish-based multimetric indices as tools for
evaluating ecological status of the marine environment
44
Faria, C., Almada, V., 2006. Patterns of spatial distribution and behaviour of fish on a rocky
intertidal platform at high tide. Marine Ecology Progress Series 316, 155-164.
Froese, R. & Pauly, D. (eds.) 2007. FishBase. World Wide Web electronic publication.
www.fishbase.org (version 08/2007)
Gabriels, W., Goethals, P.L.M., De Pauw, N., 2005. Implications of taxonomic modifications
and alien species on biological water quality assessment as exemplified by Belgian Biotic
Index method. Hydrobiologia 542, 137-150.
García-Charton, J.A., Pérez-Ruzafa, Á., 2001. Spatial pattern and the habitat structure of a
Mediterranean rocky reef fish local assemblage. Marine Biology 138, 917-934.
Gomes, M.C., Serrão, E., Borges M.F., 2001. Spatial patterns of groundfish assemblages on the
continental shelf of Portugal. ICES Journal of Marine Science 58, 633-641.
Harrison, T. D., Cooper, J. A. G. & Ramm, A. E. L., 2000. Geomorphology, ichthyofauna,
water quality and aesthetics of South African estuaries. Department of Environmental
Affairs & Tourism, State of the Environment Series, Report No. 2. 185pp.
Harrison, T.D., Whitfield, A.K., 2004. A multi-metric fish index to assess the environmental
condition of estuaries. Journal of Fish Biology 65, 683-710.
Henriques, M., Gonçalves, E.J., Almada, V.C., 1999. The conservation of littoral fish
communities: a case study at Arrábida coast (Portugal). In: Almada, V.C., Oliveira, R.F.,
Gonçalves, E.J. (Eds.) Behaviour and conservation of littoral fishes. Instituto Superior de
Psicologia Aplicada (ISPA), 473-519 pp. Lisbon, Portugal.
Hering, D., Feld, C. K., Moog, O., Ofenböck, T., 2006. Cook book for the development of a
multimetric index for biological condition of aquatic ecosystems: experiences from
European AQEM and STAR projects and related initiatives. Hydrobiologia 566, 311-324.
Holthus, P.F. & Maragos, J.E. 1995. Marine ecosystem classification for the tropical island
Pacific, p. 239-278. In Maragos, J.E., Peterson, M.N.A., Eldredge, L.G., Bardach J.E. &
Takeuchi, H.F. (eds.) Marine and coastal biodiversity in the tropical island Pacific region.
Vol. 1. Species Management and Information Management Priorities. East-West Center,
Honolulu, Hawaii. 424 pp.

Chapter 2 Efficacy of adapted estuarine fish-based multimetric indices as tools for
evaluating ecological status of the marine environment
45
INIP, 1981. Relatório do cruzeiro «tipo demersal» 020130380, realizado a bordo do navio
«Noruega» de 5 a 17 de Março de 1980. INIP, Technical report. 116p, Portugal.
INIP, 1982. Estudo dos recursos demersais da costa continental portuguesa. 3ª campanha-
(N/020160580), N/E «Noruega» Maio/Junho 1980. INIP, Technical report. 116p,
Portugal.
Lara, E. N., González, E.A., 1998. The relationship between reef fish community structure and
environmental variables in the southern Mexican Caribbean. Journal of Fish Biology 53,
209-221.
Labropoulou, M., Papacostatinou, C., 2004. Community structure and diversity of demersal fish
assemblages: the role of fishery. Scientia Marina 68, 215-226.
Letourneur, Y., ruitton, S., Sartoretto, S., 2003. Environmental and benthic factors structuring
the spatial distribution of a summer infralittoral fish assemblage in the north-western
Mediterranean Sea. Journal of the Marine Biological Association of the United Kingdom
83, 193-204.
Macpherson, E., 1994. Substrate utilization in a Mediterranean littoral fish community. Marine
Ecology Progress Series 114, 211-218.
Mangialajo, L., Ruggieri, N., Asnaghi, V., Chiantore, M., Povero, P., Cattaneo-Vietti, R., 2007.
Ecological status in the Ligurian Sea: The effect of coastline urbanisation and the
importance of proper reference sites. Marine Pollution Bulletin 55, 30-41.
Mercado-Silva, N., Lyons, J.D., Maldonado, G.S., Medina, M., 2002. Validation of a fish-based
index of biotic integrity for streams and rivers of central México. Fish Biology and
Fisheries 12, 179-191.
Muniz, P., Venturini, N. Pires-Vanin, A.M.S., Tommasi, L.R., Borja, Á., 2005. Testing the
applicability of a Marine Biotic Index (AMBI) to assessing the ecological quality of soft-
bottom benthic communities, in the South America Atlantic region. Marine Pollution
Bulletin 50, 624-637.

Chapter 2 Efficacy of adapted estuarine fish-based multimetric indices as tools for
evaluating ecological status of the marine environment
46
Niemi, G., Wardrop, D., Brooks, R., Anderson, S., Brady, V., Paerl, H. Rakocisnki, C.,
Brouwer, M., Levinson, B., McDonald, M., 2004. Rationale for a new generation of
indicators for coastal waters. Environmental Health Perspectives 11, 979-986.
Paiva, J., 2002. Aspectos da ecologia da ictiofauna intertidal. University of Lisbon, Thesis.
142pp, Portugal.
Paul, J. F., 2003. Developing and applying an index of environmental integrity for the US Mid-
Atlantic region. Journal of Environmental Management 67, 175-185.
Pihl, L., Wennhage, H., 2002. Structure of fish assemblages on rocky and soft bottom shores on
the Swedish west coast. Journal of Fish Biology 61, 148-166.
Pinedo, S., García, M., Satta, M.P., de Torres, M., Ballesteros, E., 2007. Rocky-shore
communities as indicators of water quality: A case study in the Northwestern
Mediterranean. Marine Pollution Bulletin 55, 126-135.
Prista, N., Vasconcelos, R., Costa, M.J., Cabral, H. N., 2003. The demersal fish assemblage of
the coastal area adjacent to the Tagus estuary (Portugal): relationships with environmental
conditions. Oceanologica Acta 26, 525-536.
Quinn, N.W., Breen, C.M., Whitfield, A.K., Hearne, J.W., 1999. An Index for the management
of South African estuaries for juvenile fish recruitment from the marine environment.
Fisheries Management and Ecology 6, 421-436.
Ramm, A. E. L., 1988. The community degradation index: a new method for assessing the
deterioration of aquatic habitats. Water Research 22, 293–301.
Reiss, H., Kröncke, I., 2005. Seasonal variability of benthic indices: An approach to test the
applicability of different indices for ecosystem quality assessment. Marine Pollution
Bulletin 50, 1490-1499.
Rice, J.C., 2005. Understanding fish habitat ecology to achieve conservation. Journal of Fish
Biology 67, 1-22.

Chapter 2 Efficacy of adapted estuarine fish-based multimetric indices as tools for
evaluating ecological status of the marine environment
47
Romero, J., Martínez-Crego, B., Alcoverro, T., Pérez, M., 2007. A multivariate index based on
seagrass Posidonia oceanica (POMI) to assess ecological status of coastal waters under
the water framework directive (WFD). Marine Pollution Bulletin 55, 196-204.
Roth, N.E., Southerland, M.T., Chaillou, J.C., Klauda, R.J., Kazyak, P.F., Stranko, S.A.,
Weisberg, S.B., Hall, L.W., Morgan II, R.P., 1988. Maryland biological stream survey:
Development of a fish index of biotic integrity. Environmental Management and
Assessment 51, 89-106.
StatSoft, 2003. STATISTICA (data analysis software system), version 6, www.statsoft.com.
Ter Braak, C.J.F., Šmilauer, P., 2002. CANOCO reference manual and ConoDraw for
Windows user’s guide: software for Canonical Community Ordination (version 4.5).
Microcomputer power, Ithaca NY, 500 pp. USA.
Trebitz, A.S., Hill, B.H., Mccormick, F.H., 2003. Sensitivity of indices of biotic integrity to
simulated fish assemblage changes. Environmental Management 32, 499-515.
Vasconcelos, R.P., Reis-Santos, P., Fonseca, V., Maia, A., Ruano, M., França, S., Vinagre, C.,
Costa, M.J., Cabral, H., 2007. Assessing anthropogenic pressures on estuarine fish
nurseries along the Portuguese coast: a multi-metric index and conceptual approach.
Science of the Total Environmental (in press).
Whitfield, A.K., Elliott, M., 2002. Fishes as indicators of environmental and ecological changes
within estuaries: a review of progress and some suggestions for the future. Journal of fish
biology 6, 229-250.


Chapter 3


Chapter 3 Development of a fish-based multimetric index to assess the ecological quality of marine habitats
-the Marine Fish Community Index-
48
Development of a fish-based multimetric index to assess the ecological
quality of marine habitats: the Marine Fish Community Index
Sofia Henriques 1, Miguel Pessanha Pais 1, Maria José Costa 1,2, Henrique Cabral 1,2
1 Universidade de Lisboa, Faculdade de Ciências, Centro de Oceanografia, Campo Grande, 1749-016 Lisboa.
Portugal.
2 Departamento de Biologia Animal, Universidade de Lisboa, Faculdade de Ciências, Campo Grande, 1746-016
Lisboa. Portugal.
Abstract
In this paper the Marine Fish Community Index (MFCI) for the assessment of ecological status
of marine environment is proposed. The MFCI was divided into 4 typologies: rocky subtidal;
shallow soft-bottom; intermediate soft-bottom and deep soft-bottom. Based on the typical
community associated to each typology and the DPSIR analysis performed, a set of metrics
were selected and tested through a multiple correlation matrix (Pearson’s coefficient) and the
core ones included in the index. A reference situation was calculated by typology based on the
available data. The MFCI was applied in all typologies and the scores obtained with each metric
were analyzed. In order to test the robustness of the MFCI the final ecological value of each
zone was recalculated by removing successively one metric at a time. The MFCI showed a
sensitive and robust response in the ecological status assessment. Since it incorporates both
functional and structural community information and is a strong communication tool, the MFCI
can be useful in the context of Marine Strategy Directive as well as other contexts of
conservation and sustainable management of the marine environment.
Keywords: Marine Fish Community Index (MFCI); European Marine Strategy Directive
(MDS); Multimetric Index; Fish Communities; Ecological Quality Assessment; Marine
Assemblages; Portugal.

Chapter 3 Development of a fish-based multimetric index to assess the ecological quality of marine habitats
-the Marine Fish Community Index-
49
1. Introduction
The assessment of the ecological status of the marine fish communities is required by the
European Marine Strategy Directive (MSD) which pretends to achieve a “good ecological
status” of the marine waters until 2021 (COM, 2005 a,b,c). Although many indices using
exclusively fish as biological indicators have been developed (e.g. Karr, 1981; Ramm, 1988;
Cooper et al., 1994; Deegan et al., 1997; Roth et al., 1998; Quinn et al., 1999; Mercado-Silva et
al., 2002; Trebitz et al., 2003; Harrison and Whitfield, 2004; Breine et al., 2007; Coates et al.,
2007) none of them was initially designed to assess the quality of marine waters (Diaz et al.,
2004) and when applied to this environment they show total inefficacy on ecological quality
evaluation since they are neither representative nor have in consideration the particularities of
marine fish communities (Henriques et al., submitted).
In fact, until now the assessment of the marine environment has had a clear focus on the impacts
of fishing on exploited fish species (single-species approaches) (e.g. Rice, 2000; Badcock et al.,
2005; Methratta and Link, 2006) and more recently on an ecosystem-based approach but with
fisheries management purposes (e.g. Bianchi et al., 2000; Rice, 2000; Rochet and Trenkel,
2003; Badcock et al., 2005; Greenstreet and Rogers, 2006). In the context of these two
approaches, metrics based on size, biomass, composition of exploited guilds or species and
species richness have been often employed (Methratta and Link, 2006), consequently, they are
chosen in order to respond primarily to the pressure of fishing activity and tend to have low
responsiveness to other causes of change (Rochet and Trenkel, 2003; Piet and Jennings, 2005).
Thus, in an ecological vision, these metrics by themselves are not representative of all
anthropogenic pressures neither of the biological integrity of the marine fish communities and a
new ecological approach based on multimetric indices to assess the ecological status of these
communities becomes indispensable.
The typical procedure of data analysis during the development of the multimetric indices
involves the following steps: metric selection (estimation and evaluation), combination of

Chapter 3 Development of a fish-based multimetric index to assess the ecological quality of marine habitats
-the Marine Fish Community Index-
50
metrics into a multimetric index, definition of reference values and determination of the scoring
system and finally establishment of class boundaries for the ecological status scale (e.g. Karr,
1981; Deegan et al., 1997; Roth et al., 1998; EPA, 2000; Harrison and Whitfield, 2004; Hering
et al., 2006).
Metric selection is an essential step that needs a careful analysis in order to guarantee that the
entire structure and functions of the community are represented (ecological relevance) and are
sensitive enough to provide a response that can be discriminated from natural variation
(sensitivity to stressors) (EPA, 2000). The choice of candidate metrics to be included in the
index is the first procedure of the metric selection, afterwards, they must be tested in order to
select a set of robust measures (core metrics) by excluding the ones that are unsuitable and
redundant (EPA, 2000; Hering et al., 2006). In most of the studies, the metrics are selected from
expert knowledge, literature or previous studies and, in some cases, appeal to statistical
procedures, but only a few authors make a posteriori tests of sensitivity, redundancy and
consistency (Rice, 2003; Roset et al., 2007).
Although redundancy is not often tested, when it is a correlation index, many times in
combination with sensitivity analysis like ANOVA and/or discriminant analysis, is usually
employed (Roset et al., 2007). Ideally, after having selected the metrics (not-redundant), only
those that show an impact-response change across a stressor gradient, are interpretable and do
not have diffused natural variation are selected for the final index (second step of the index
development procedure) (EPA, 2000; Hering et al., 2006). Moreover, all attributes considered
as characteristics of the community and the impacts to which it is subjected have to be covered
in the final index (Henring et al., 2006).
Presently, the methods to define the number of metrics to be included in the final index have not
been frequently used (Roset et al., 2007), in this procedure some questions must be analysed
with some detail: Should we keep the number of metrics constant for each attribute? Which

Chapter 3 Development of a fish-based multimetric index to assess the ecological quality of marine habitats
-the Marine Fish Community Index-
51
weight in the final index must we accredit to each one? The implications of the answers to these
questions on the applicability of the index and their ecological meaning have to be tested. Roth
et al. (1998, 2000) proposed an interactive method based on successive addition of metrics and
test of classification efficiency of the final score of the Index of Biotic Integrity (IBI; for rivers).
Like metric selection, the definition of reference values (the third step of the index
development) is a very sensitive issue since the obtained ecological status depends highly of
these values (Henriques et al., submitted). An ideal reference situation of the community is
derived from the same site at the same time of the year and using comparable methods, in a
period of undisturbed conditions. However, most environments have been subject to
anthropogenic pressures and previous data from that time are not available (historical data
approach) (Coates et al., 2007). In the last years, several approaches to establishing reference
conditions have been used, most of them based on expert judgement (ecological principles and
knowledge about the system analysed), mathematical models, least impacted sites selected
through available data in conjunction with other indicators (e.g. chemical and physical
evaluation) and, only when the previous methods are not possible, based on the available
biological dataset (EPA, 2000; Harrison and Whitfield, 2004).
After the definition of this reference situation, the deviation between each metric and the
respective reference values is necessary (score system) in order to aggregate all metric
information in the final index value (final score). Normally, this final value is compared with an
ecological scale through a simple correspondence with an ecological category (fourth step of
index development), this procedure can be very useful to simplify the communication with
managers and decision makers (Ramm, 1988; EPA, 2000; Harrison and Whitfield, 2004; Breine
et al., 2007; Coates et al., 2007).

Chapter 3 Development of a fish-based multimetric index to assess the ecological quality of marine habitats
-the Marine Fish Community Index-
52
Following these principles, the aim of the present work is to develop a new multimetric index,
through the analyses of demersal fish communities in order to assess the ecological status of the
subtidal marine habitats, which could be used in the MSD and other management purposes.
2. Material and methods
2.1 Typologies of the study area and data sets
Since substrate type and depth are the main factors responsible for habitat complexity and
consequently for the structure of different demersal marine communities (e.g. Lara and
González, 1998; Demestre et al., 2000; Pihl and Wennhage, 2002;Letourneur et al., 2003; Prista
et al. 2003; Pais et al., submitted), the MFCI was separated into 4 typologies according to Pais
et al. (submitted): rocky subtidal (RS- permanently submerged rocky reefs down to a depth of
30m), shallow soft-bottom (SS- sandy or muddy substrate down to 20 m deep), intermediate
soft-bottom (IS- sandy or muddy substrate 20 to 100 m deep) and deep soft-bottom (DS- sandy
or muddy substrate 100 to 200 m deep).
For each typology a set of studies from the Portuguese coast was compiled (8 for RS, 2 for SS, 9
for IS and 9 for DS) taking into account the sampling method used and the geographical area
(Table 1). To make the ecological status comparison resulting of the MFCI application possible
and in order to minimize the seasonality and the effect of different sampling methods used in
the index, only the studies with the same method (standard method used for the assessment of
each typology) and with at least one year of sampling effort were selected.
The database used in the present study to calculate the candidate metrics for the MFCI are
represented in Appendix I, the ecological parameters that characterized each species were
adapted from Henriques et al. (submitted) and Pais et al. (submitted) and some information was
complemented with the available literature.

Chapter 3 Development of a fish-based multimetric index to assess the ecological quality of marine habitats
-the Marine Fish Community Index-
53
Table 1. Specific characteristics and references of the sites used to test the application of the MFCI.
Considering that the original data was presented in different measure units, the data from each
study was standardised by calculating the proportion of the abundance of each species in order
to enable comparison between samples.
Zone Acronym Typology Reference
Berlengas islands RS Berlengas 1992 Rocky subtidal Almeida, A., 1996 Berlengas islands RS Berlengas 1993 Rocky subtidal Henriques, P., 1993 Berlengas islands RS Berlengas 2004 Rocky subtidal Maranhão et al. 2006 Berlengas islands RS Berlengas 2005 Rocky subtidal Maranhão et al. 2006 Praia da Luz Rock Algarve 2005 Rocky subtidal Faria and Almada, 2006 Sines Rock Sines 2004 Rocky subtidal Almada et al. 2004 Ria Formosa Rock Ria Formosa 1997 Rocky subtidal Almeida, O., 1997 Arrábida RS Arrábida 1999 Rocky subtidal Almada et al., 2002 Tejo estuary (adjacent zone) SS Tejo 2001 Shallow soft-bottom Prista et al., 2003 Algarve SS Algarve 2005 Shallow soft-bottom Abreu, S., 2005 Caminha - Ovar IS zone1 1979 Intermediate soft-bottom INIP, 1980; INIP 1981a. Ovar - Norte de S. Pedro de Muel IS zone2 1979 Intermediate soft-bottom INIP, 1980; INIP 1981a. S. Pedro de Muel - Cercal IS zone3 1979 Intermediate soft-bottom INIP, 1980; INIP 1981a. Lagos- vila real de S. António IS zone5 1979 Intermediate soft-bottom INIP, 1980; INIP 1981a.
Caminha - Ovar IS zone1 1980 Intermediate soft-bottom Dinis and Marecos, 1984; INIP, 1981b; INIP, 1982.
Ovar - Norte de S. Pedro de Muel IS zone2 1980 Intermediate soft-bottom Dinis and Marecos, 1984; INIP, 1981b; INIP, 1982.
S. Pedro de Muel - Cercal IS zone3 1980 Intermediate soft-bottom Dinis and Marecos, 1984; INIP, 1981b; INIP, 1982.
Cercal- Lagos IS zone4 1980 Intermediate soft-bottom Dinis and Marecos, 1984; INIP, 1981b; INIP, 1982.
Lagos- vila real de S. António IS zone5 1980 Intermediate soft-bottom Dinis and Marecos, 1984; INIP, 1981b; INIP, 1982.
Caminha - Ovar DS zone1 1979 Deep soft-bottom INIP, 1980; INIP 1981a. Ovar - Norte de S. Pedro de Muel DS zone2 1979 Deep soft-bottom INIP, 1980; INIP 1981a. S. Pedro de Muel - Cercal DS zone3 1979 Deep soft-bottom INIP, 1980; INIP 1981a. Lagos- vila real de S. António DS zone5 1979 Deep soft-bottom INIP, 1980; INIP 1981a.
Caminha - Ovar DS zone1 1980 Deep soft-bottom Dinis and Marecos, 1984; INIP, 1981b; INIP, 1982.
Ovar - Norte de S. Pedro de Muel DS zone2 1980 Deep soft-bottom Dinis and Marecos, 1984; INIP, 1981b; INIP, 1982.
S. Pedro de Muel - Cercal DS zone3 1980 Deep soft-bottom Dinis and Marecos, 1984; INIP, 1981b; INIP, 1982.
Cercal- Lagos DS zone4 1980 Deep soft-bottom Dinis and Marecos, 1984; INIP, 1981b; INIP, 1982.
Lagos- vila real de S. António DS zone5 1980 Deep soft-bottom Dinis and Marecos, 1984; INIP, 1981b; INIP, 1982.

Drivers Pressures State Impacts Responses Reference
Population Runoff waters;
Sewage discharges.
Toxic contamination;
Degradation of water/sediment quality;
Habitat loss;
Eutrophication;
Diversity;
Dominance;
Biomass;
Abundance;
Occurrence of massive death;
Reproductive inhibition or failure;
Trophic structure;
Treatment of sewage;
Gathering and treatment of runoff waters;
Assess the water quality;
Implement environmental monitoring plans.
Guidetti et al., 2002
Smith et al., 1999
Islam and Tanaka, 2004
Fishing Selective catch;
Overfishing;
Bycatch;
Ghost- fishing;
Destructive fishing methods.
Selective mortality;
Substrate destruction.
Diversity;
Dominance;
Biomass;
Mean size;
Mean thophic level;
Trophic structure;
Reproductive inhibition or failure;
Age structure;
Abundance;
Proportion of demersal and benthic
species.
Implement environmental monitoring plans (relating stock
assessment to policy development);
Revision of fisheries acts ( legal fishing nets, daily boat limit,
minimum legal length,closed catch seasons, number of fishing
licenses, etc.);
Intensify the control of fishing activities;
Network of Marine Protected Areas (MPAs);
Sport fishing regulation;
Critical habitat protection.
Goñi, 1998
Rochet and trenkel, 2003
Islam and Tanaka, 2004
Yemane et al., 2005
Piet and Jennings, 2005
Greenstreet and Rogers, 2005
Dredging activity Contaminants and sediments
suspention;
Sediments removing.
Toxic contamination;
Degradation of water/sediment quality;
Biological pollution;
Substrate destruction;
Bathymetric alteration;
Increased in turbidity;
Diversity (benthic species);
Dominance(oportunistic species);
Abundance (benthic species);
Ocurrence of massive death;
Ocurrence of exotic species
(macroinvertebrate);
Genetic variability;
Proportion of demersal and benthic
species;
Trophic structure;
Use adequate methodologies and equipment to dredge;
Minimize the duration of dredging operations;
Assess the sediments quality;
Implement environmental monitoring plans;
Select a dumping site and disposal technique that promote
dispersal and assimilation of the dragged;
Take account of important activities for aquatic organisms
(e.g. Spawning periods and nursery areas).
Newell et al., 1998
Table 2. Drivers-Pressures-State-Impacts-Responses (DPSIR) analysis. Drivers- main socio-economic driving human activities; Pressures- consequences of the human activities in the environment; State- environment changes due to pressures force; Impacts- potential alterations in the fish communities due to the increasing of the state; Responses- Human actions which can revert or minimize the initial pressures on the marine environment.

Drivers Pressures State Impacts Responses Reference Port activity Ballast waters;
Boats pressure.
Toxic contamination;
Degradation of water/sediment quality;
Biological pollution;
Noise pertubance;
Diversity;
Dominance;
Abundance;
Occurrence of massive death;
Occurrence of exotic species;
Genetic variability;
Behaviour;
Reproductive dysfunction;
Trophic structure.
Minimize the dredging operations.
Minimize the cleaning ships operations to the strict necessary ones;
Regular maintenance of the main engine, generators and boilers;
Strict inspection of ships;
Control and management of ships ballast water and Sediments;
Reduction of cruising speed where appropriate (emissions control);
Hull and propeller cleaning;
Newell et al., 1998
Cupta et al., 2005
Peris-Mora et al., 2005
Agriculture Ferterlizer;
Biocides.
Eutrophication;
Degradation of water/sediment quality;
Toxic contamination.
Diversity;
Dominance;
Abundance;
Occurrence of massive death;
reproductive inhibition or failure;
Trophic structure.
Gathering and treatment of runoff waters;
Assess the water quality;
Implement environmental monitoring plans;
Composition control of the fertilizer and biocides;
Islam and Tanaka, 2004
Lalumera et al., 2004
Read and Fernandes, 2003
Aquaculture Effluent discharges;
Individuals leak;
Exotic Species;
Pathological vectors.
Eutrophication;
Degradation of water/sediment quality;
Toxic contamination;
Habitat loss;
Biological pollution.
Trophic structure;
Dominance;
Abundance;
Occurrence of massive death;
Reproductive inhibition or failure;
Genetic variability;
Diversity.
Keep fish densities at moderate levels to reduce disease risk and
need for antibiotics;
Pump air through the water to speed up decomposition;
Release pond water into water body with adequate dilution and
dispersal capability;
Dilute pond water prior to release;
Use local wild species rather than introduced species as seed stock;
Implement environmental monitoring plans;
Revision of aquaculture legislation.
Islam and Tanaka, 2004
Industry Industrial effluents
discharges.
Toxic contamination;
Degradation of Water/sediment quality;
Habitat loss;
Eutrophication.
Diversity;
Dominance;
Biomass;
Abundance;
Occurrence of massive death;
Reproductive inhibition or failure;
Trophic structure.
Industrial effluents treatment;
Assess the water quality;
Implement environmental monitoring plans.
Khalaf and Kochzius, 2002
Islam and Tanaka, 2004
Table 2. (cont.)

Chapter 3 Development of a fish-based multimetric index to assess the ecological quality of marine habitats
-the Marine Fish Community Index-
56
2.2 Drivers-Pressures-State-Impacts-Responses (DPSIR) Analysis
The DPSIR approach not only provides a good communication tool between researches,
stakeholders, decision makers, among others (Elliott, 2002; Svarstad et al., in press), but also a
global mechanism for assessment and management of environmental problems (Elliott, 2002;
Borja et al., 2006) with regards to sustainable development. Therefore, in order to ensure that
the main anthropogenic pressures affecting the marine environment are covered in the index and
to guarantee that an appropriate programme of measures to increase the ecological status can be
designed based on this index, a DPSIR analysis was performed (Table 2).
Each step of DPSIR analysis was adapted for the marine waters following the “preservationist
principals” described by Svarstad et al. (in press): “Drivers” were considered as the main socio-
economic driving human activities, which create/exert “Pressures” on the marine environment
and consequently the “State” of the environment changes. Since the index is referent to the fish
communities, the analysis of “Impact” is relative to the potential alteration on fish community
parameters due to the increase of the “State” changes. Finally, the “Responses” are referred to
human actions that can help to revert or minimize the initial pressures and, as a result,
contribute to the improvement of the ecological status.
2.3 Metric selection
2.3.1 Compiling and testing the candidate metrics
In the development of the index described here, a number of candidate metrics were selected
(Table 3) based on previous indices applied to estuaries (Deegan et al., 1997; Harrison and
Whitfield, 2004; Coates et al., 2007), studies of marine fish community indicators of
environmental change due to a specific impact (Guidetti et al., 2002; Khalaf and Kochzius,
2002; Rochet and Trenkel, 2003; Labropoulou and Papaconstantinou, 2005; Piet and Jennings,
2005; Yemane, 2005; Greenstreet and Rogers, 2006), studies of adapted estuarine indices to
marine habitats (Henriques et al., submitted), marine fish assemblage typology characteristics

Chapter 3 Development of a fish-based multimetric index to assess the ecological quality of marine habitats
-the Marine Fish Community Index-
57
(Pais et al., submitted) and the DPSIR analysis described above (Table 2). The full list of
candidate metrics was divided into 4 major attributes, “diversity and composition”,
“abundance”, “nursery function” and “trophic integrity”, considered as the most affected by
anthropogenic pressures and representative of the community structure and function.
With the exception of metrics “Total number of species”, “Total abundance”, “Number of
species that make up 90% of the abundance” and “Number or rare and uncommon species /total
number of species”, the candidate metrics were tested with both composition (in number of
species) and relative frequency data (total frequency of specific species) (Table 3). The
preferential usage of ecological guilds as indicators of community change is due to the fact that
guilds tend to suffer smaller natural variations and respond more predictably to stress, while
individual species suffer more interference from habitat characteristics and make the
interpretation of impacts more difficult (Elliott et al., 2007; Pais et al., submitted).
With the aim of testing the redundancy of candidate metrics in order to select the core ones for
the index, a multiple correlation matrix was calculated per typology. Since all metrics did not
reject the null hypothesis of normality in the Kolmogorov-Smirnov test (p>0.05), the parametric
Pearson’s correlation coefficient was used. Since this coefficient does not depend on the
measurement units used (the relation between two metrics is compared through a linear
regression), redundancy tests between metrics with different measure units (e.g. in proportion
and in number of species) are possible. All analyses were performed using Statistica 6.0
software package (StatSoft, 2003) and a 0.05 significance level was considered. When two
metrics show a strong correlation between them (Pearson’s r>0.8), they were considered as
redundant.

Chapter 3 Development of a fish-based multimetric index to assess the ecological quality of marine habitats
-the Marine Fish Community Index-
58
Table 3. List of the candidate metrics tested to be included in the MFCI.
Attribute Candidate metrics Total number of species Number of species that make up 90% of abundance (excluding gregarious species in soft-bottom typologies) Pelagic to demersal ratio (in proportion and in number of species) Number of resident species Number of dependent species Number of benthic-associated species Number of pelagic species Number of non-commercial species in community (low or no commercial value) Total Abundance (ln (n+1)) Number of commercial species in community (middle or high commercial value) Number of low and very-low resilience species Number of rare or uncommon species
Diversity and composition
Number of rare or uncommon species/ total number of species Proportion of resident species Proportion of dependent species Proportion of benthic-associated species Proportion of pelagic species Proportion of non-commercial species in community (low or no commercial value) Total Abundance (ln (n+1)) Proportion of commercial species in community (middle or high commercial value) Proportion of low and very-low resilience species Proportion of rare or uncommon species
Abundance
Commercial/non-commercial ratio (in proportion of species) Proportion of nursery species Proportion of spawning species Number of nursery species Number of spawning species Number of spawning species excluding cryptic, Symphodus spp. and Labrus spp. species (RS typology) Number of cryptic, Symphodus spp. and Labrus spp. species (RS typology) Proportion of spawning species excluding cryptic, Symphodus spp. and Labrus spp. species (RS typology)
Nursery function
Proportion of cryptic, Symphodus spp. and Labrus spp. species (RS typology) Proportion of invertivore species Proportion of piscivore and macrocarnivore species Proportion of zooplanktivore species Proportion of omnivore species Number of invertivore species Number of piscivore and macrocarnivore species Number of zooplanktivore species
Trophic integrity
Number of omnivore species

Attribute Rocky subtidal Shallow Soft-bottom Intermediate Soft-bottom Deep Soft-bottom Diversity and composition
“Total number of species”
“Number of rare or uncommon species/ total
number of species”
“Total number of species”
“Number of rare or uncommon species/
total number of species”
“Total number of species”
“Number of rare or uncommon species / total
number of species”
“Pelagic / demersal ratio (in number of
species)”
“Total number of species”
“Number of rare or uncommon species/
total number of species”
“Pelagic/demersal ratio (in number of
species)”
Abundance
“Total Abundance”
“Number of species that make up 90% of the
abundance”
“Proportion of resident species”
“Commercial/non-commercial ratio (in
proportion of species)”
“Total Abundance (Ln (n+1))”
“Number of species that make up 90% of
abundance excluding gregarious species”
“Proportion of low and very-low resilience
species”
“Proportion of benthic-associated species “
“Proportion of individuals over the
maturity size”
“ABC curves”
“Total Abundance (Ln (n+1))”
“Number of species that make up 90% of
abundance excluding gregarious species”
“Proportion of low and very-low resilience
species”
“Proportion of individuals over the maturity
size”
“ABC curves”
“Total Abundance (Ln (n+1))”
“Number of species that make up 90% of
abundance excluding gregarious species”
“Proportion of low and very-low
resilience species”
“Proportion of individuals over the
maturity size”
“ABC curves”
Nursery Function
“Proportion of spawning species excluding
cryptic, Symphodus spp. and Labrus spp.
species”
“Proportion of cryptic, Symphodus spp. and
Labrus spp. species”
“Number of species with juveniles present”
or “Proportion of juvenile”
“Proportion of spawning species”
“Number of species with juveniles
present” or “Proportion of juveniles”
“Proportion of spawning species”
“Number of species with juveniles present” or
“Proportion of juveniles”
“Proportion of spawning species”
“Number of species with juveniles
present” or “Proportion of juveniles”
Trophic Integrity
“Proportion of invertivore species”
“Proportion of omnivore species”
“Proportion of piscivore and macrocarnivore
species”
“Proportion of piscivore and
macrocarnivore species”
“Proportion of invertivore species”
“Proportion of zooplanktivore species”
“Proportion of zooplanktivore species”
“Proportion of invertivore species”
“Proportion of piscivore and macrocarnivore
species”
“Proportion of piscivore and
macrocarnivore species”
“Proportion of invertivore species”
Table 4. Selected metrics for the MFCI divided by the correspondent typology.

Chapter 3 Development of a fish-based multimetric index to assess the ecological quality of marine habitats
-the Marine Fish Community Index-
60
2.3.2 Combining Metrics into the MFCI
The choice of the core metrics of each typology (Table 4) was made following two main
principals: (1) all attributes should be represented by the most informative metrics considering
the specific characteristics of each typology and (2) the selection of the most informative
metrics must be based on their ecological meaning, response to “state” of environmental change
and the redundancy relation between them (excluding the redundant metrics).
In this manner, one metric is selected if it is the most representative of the structure or function
(attribute) of the typical community, or if it is a good indicator of community state in order to
primarily answer to impacts over it, even if an interpretable correlation with other metrics was
verified. For example, if the trophic composition of a community is represented by more than
one feeding guild, it is expected that their proportions change according to one another.
However, the ecological information obtained with the use of metrics that represent all guilds is
more sensitive to environmental changes, since all possible affected trophic levels are included
in the index. The problem of correlation can be resolved with an adequate establishment of
reference limits for each one and through a cautious interpretation of the final ecological result.
In addition, abundance proportions are more sensitive to low environmental changes than the
number of species, since a decrease in abundance and biomass is the first “response parameter”
of a fish community in the presence of an impact (Keough and Quinn, 1991; Harrison and
Whitfield, 2004; Pais et al., submitted). In this way, as often as possible, metrics based on
proportions were incorporated in the final MFCI.
2.3.2.1 Diversity and composition attribute
In this attribute, the metrics “Total number of species” and “Number of rare or uncommon
species/total number of species” have been included in all typologies.

Chapter 3 Development of a fish-based multimetric index to assess the ecological quality of marine habitats
-the Marine Fish Community Index-
61
The “Total number of species” was chosen as a simple measure of diversity and it is expected
that a decrease in the score value with the increase of anthropogenic pressures occur. The
diversity is affected by all impacts over the marine environment as we can see in the DPSIR
analysis (Table 2).
Since the capture of rare or uncommon species (usually sensitive) is extremely dependent of the
sampling effort (Keough and Quinn, 1991), its evaluation is made through a ratio that ponders
its presence (in number of species) with the total number of species captured in order to
minimize the effect of sampling. For example, it is different to capture 3 rare/uncommon species
in a total of 30 species or in a total of 10 species. In this way, the metric “number of rare or
uncommon species/total number of species” was selected as an additional measure of the
conservation value of the system evaluated, so the presence of this species increased the global
ecological value of the index, since their decrease or even local extinction is expected with the
increase of anthropogenic pressures (Keough and Quinn, 1991; Harrison and Whitfield, 2004).
The metric “Pelagic/demersal ratio (in number of species)” was only included in the index for
soft-bottom zones deeper than 25m (IS and DS typologies), due to the low representation of
pelagic species in the rocky subtidal (RS) typology, since most of the species on these zones are
demersal or reef-associated and in the shallow soft-bottom typology (SS), mainly composed of
benthic-associated species (demersal or benthopelagic) (Henriques et al., submitted; Pais et al.,
submitted). Since most pelagic species exhibit gregarious behaviour (Henriques et al.,
submitted; Pais et al., submitted), this ratio was measured in number of species instead of
proportions, for the large number of pelagic individuals not to mask the fewer number of
demersal individuals, thus making their comparison and definition of reference values easier.

Chapter 3 Development of a fish-based multimetric index to assess the ecological quality of marine habitats
-the Marine Fish Community Index-
62
2.3.2.2 Abundance Attribute
The relative abundance has been considered as a good indicator of community integrity, because
the increasing stress in the environment mainly produces a decline in abundance (Keough and
Quinn, 1991; Harrison and Whitfield, 2004; Coates et al., 2007). Moreover, abundance and
dominance are affected by all pressures identified in the marine environment (see DPSIR
analysis; Table 2).
In this context the metric “Total abundance” was incorporated into the index and since
gregarious species have a strong influence in the total abundance, this metric (measured in
number of individuals) was log-transformed (ln(n+1)) and calculated for the SS, IS and DS
typologies, while for the RS, this metric was included without transformation. For the same
reason, in the case of SS, IS and DS typologies, dominance was expressed through the “number
of species that make up 90% of the abundance excluding gregarious species”. This metric was
incorporated in the index, since in a “healthy” community a high number of species with
balanced abundances is expected (Coates et al., 2007) and in the presence of anthropogenic
pressures the dominance effect of some opportunistic or tolerant species can appear as a
consequence of the decrease in inter-specific competition (Roth et al., 1998).
The metrics “Proportion of resident species” and “Proportion of benthic-associated species”
were included as additional measures of community “health” in RS and SS respectively,
because they correspond to the most “persistent” species on these typologies (Pais et al.,
submitted) thus being the most affected by local perturbations. Moreover, some opportunistic
species can find favourable conditions in the stressed environment, and its abundance can be
unintentionally measured by other metrics, so these two metrics can be considered as an
excellent indicator in the correspondent typologies.

Chapter 3 Development of a fish-based multimetric index to assess the ecological quality of marine habitats
-the Marine Fish Community Index-
63
As the resilience is the capacity to recover from changes in the environment (Holling, 1973),
degraded systems are generally expected to yield fewer species with low or very-low resilience
than less impacted systems, therefore, the metric “Proportion of low and very-low resilience
species” is a good indicator of the sensibility of the system. With exception of the RS typology
because of their low representativeness, this metric was included in all soft-bottom typologies
(SS, IS and DS).
The remaining metrics of this attribute have the aim to respond primarily to the impacts of
fishing, the main activity affecting marine fish communities (Gomes et al., 2001).
The RS typology is typically sampled with visual census methods and so biomass data is not
available, in this way the metric “Commercial/non-commercial ratio (in proportion of
individuals)” was used as indicator of fishing impact over the community. With an increase of
fishing pressure, a dominance of non-commercial species is expected due to the decrease of
inter-specific competition (Rochet and Trenkel, 2003). This ratio was proposed in order to get
more information about community balance and because their metrics are extremely redundant.
Since Abundance and Biomass Curves (ABC) have been successfully applied to assess the
effect of fishing (e.g. Jouffre and Inejih, 2005; Labropoulou and Papaconstantinou, 2005;
Yemane et al., 2005), a metric based on this method was selected for the soft-bottom typologies
(SS, IS and DS). This method is based on established r- and K- selection theory (Yamane et al.,
2005). In undisturbed states, the community is supposed to be dominated by K-selected species
and consequently the biomass curve lies above the abundance curve (Yamane et al., 2005).
With an increase of fishing pressure over large species with slow-growing and late maturity (K-
selection) that fail to reach the maturity size, a successive increase in the abundance of r-
selected species (fast growth, small size, opportunistic) is expected. As a consequence, the
abundance and biomass curves are closer for moderately disturbed sites and in a heavily

Chapter 3 Development of a fish-based multimetric index to assess the ecological quality of marine habitats
-the Marine Fish Community Index-
64
disturbed site the biomass curve will be below the abundance curve (Yamane et al., 2005).
Based on the same principles of established r- and K- selection theory, the metric “Proportion of
species over the maturity size” was added to the index for the same typologies in order to
strengthen the detection of the fishing effect over their communities since the loss of
reproduction capacity leads to stock depletion and consequently to the extinction of species (at
least locally) (Shin et al., 2005).
2.3.2.3 Nursery function attribute
In order to safeguard the sustainable exploration of fish resources and its biological integrity, a
cautious attention must be given to the quality of the environment and the state of the
communities concerning the reproductive success. In this context, a simple measure of the
proportion of potential species capable to reproduce in the system assessed was included in all
typologies, so only species that depend on the substrate to spawn were considered as “spawning
species” of the typology where they are included.
In rocky subtidal areas (RS), the cryptic species (e.g. the families Gobiidae, Blenniidae,
Tripterygiidae, Gobiesocidae) and the species of the genus Symphodus and Labrus of the family
Labridae are completely dependent on rocky substrate for the recruitment to occur (Almada et
al., 1999). For that reason, these species are more vulnerable to habitat changes (impacts), thus
being considered as good indicators of the quality of the habitat for recruitment (Henriques et
al., submitted). In this manner, the metrics “Proportion of spawning species excluding cryptic,
Symphodus spp. and Labrus spp. species” and “Proportion of cryptic, Symphodus spp. and
Labrus spp. species” were incorporated into the MFCI in order to assure the assessment of these
particular indicators as well as the remaining spawning species. For the soft-bottom typology,
the metric “Proportion of spawning species” was selected for the same purpose.

Chapter 3 Development of a fish-based multimetric index to assess the ecological quality of marine habitats
-the Marine Fish Community Index-
65
Data with information about the juveniles of the various typologies were not available.
However, the metrics “Proportion of juveniles” and “Number of species with juveniles present”
must be tested and one of them should be included in the MFCI as a measure of the ecological
conditions of the system to support a successful development of juveniles (i.e. nursery
function). Since with visual census methods used in the RS typology the size of each individual
is very difficult to obtain without a high degree of subjectivity, and considering that its
assessment would complicate the monitoring programme, this last metric gives an indirect
measure of the proportion of adults (individuals above the maturity size) in this systems.
2.3.2.4 Trophic integrity attribute
A healthy typology should contain fish species that represent all their characteristic feeding
guilds, since with increasing anthropogenic pressure, a disturbance in balance or removal of
some guilds is expected, depending of the driving force of the impact over the food web,
normally with repercussions in the integrity of the system (Khalaf and Kochzius, 2002).
According to Henriques et al. (submitted) and Pais et al. (submitted), the main feeding guilds of
the RS typology are the invertivore, omnivore, piscivore and macrocarnivore species while for
the soft-bottom typologies the characteristic guilds are the piscivores, macrocarnivores,
invertivore and zooplanktivore species, the latter being absent in the DS typology. In order to
detect alterations in the food web, metrics that are representative of the main feeding guilds (in
proportion of individuals) of each typology were incorporated into the index. Frequently, the
alteration in one feeding guild has a specific impact associated (e.g. eutrophication, substrate
destruction, sediment quality, among others) (e.g. Guidetti et al., 2002; Khalaf and Kochzus,
2002; Rochet and Trenkel, 2003) and all pressures identified can instigate changes on the food
web (Table 2). As the feeding guilds of fish communities cover a broad range of the higher
trophic levels in the marine food web, they can give indirect information about the ecological

Chapter 3 Development of a fish-based multimetric index to assess the ecological quality of marine habitats
-the Marine Fish Community Index-
66
status of lower trophic levels, represented by other biological groups (Karr, 1981; Harrison and
Whitfield 2004).
2.3.3 Reference Situation, Score System and Ecological Quality Scale of the MFCI
Due to the community and metric differences between the typologies a reference situation was
calculated for each of them (Table 5 a,b,c,d) (Henriques et al., submitted). Reference conditions
were only calculated for metrics with available data, thus the metric “ABC curves” and the
“Proportion of individuals over the maturity size” of the soft-bottom typologies, the metric
“total abundance” of the RS typology and the metric “Number of species with juveniles present
or proportion of juveniles” of all typologies were excluded from the analysis of the ecological
status obtained with the MFCI.
Once that there was no historical data available for the evaluated sites, neither a large number of
studies using the same sampling method nor physico-chemical data to know which are the
unimpacted sites of the soft-bottom typologies, a reference situation was estimated based on the
biological data available as an alternative methodology (EPA, 2000; Harrison and Whitfield,
2004). Assuming that some minimally disturbed sites are included, the reference limits were
calculated without pre-selection of any reference sites (Harrison and Whitfield, 2004). For these
metrics with available data, the highest value of each one was divided into quintiles, each
interval corresponding to the range of the respective score (Table 5 b,c,d), with the exception of
metrics relative to the trophic integrity attribute. Since redundant relations between these
metrics exist, their reference values must vary according to each other in order to minimize the
redundancy effect. However, because of the scarcity of available studies for these typologies, no
clear pattern between these metrics was found and so the reference limits proposed were based
on expert judgement (Table 5 b,c,d).

Chapter 3 Development of a fish-based multimetric index to assess the ecological quality of marine habitats
-the Marine Fish Community Index-
67
Table 5a. Score System of the MFCI and respective values for the Rocky subtidal typology. All intervals are closed on the left.
Table 5b. Score System of the MFCI and respective values for the Shallow soft-bottom typology. All intervals are closed on the left.
MFCI metrics – Shallow soft-bottom typology 1 2 3 4 5
Total number of species 0 13 25 38 50 Number of rare or uncommon species/ total number of species 0 0,05 0,10 0,14 0,19 Total abundance (Ln (n+1)) 0 1,66 3,32 4,99 6,65 Number of species that make up 90% of abundance excluding gregarious species 0 3 5 8 10
Proportion of low and very-low resilience species 0 0,03 0,06 0,09 0,12 Proportion of benthic-associated species 0 0,20 0,39 0,59 0,79 Proportion of spawning species 0 0,17 0,34 0,50 0,67 Proportion of piscivore and macrocarnivore species 0-10% and 90-100% 10-20% and 80-90% 20-30% and 70-80% 30-40% and 60-70% 40-60% Proportion of invertivore species 0-10% and 90-100% 10-20% and 80-90% 20-30% and 70-80% 30-40% and 60-70% 40-60% Proportion of zooplanktivore species >50% and <3% 0,03 0,06 0,09 0,13
MFCI metrics – Rocky subtidal typology 1 2 3 4 5
Total number of species 0 7 23 38 54 Number of rare or uncommon species/ total number of species 0 0,03 0,07 0,11 0,14 Number of species that make up 90% of abundance 0 6 9 12 15 Commercial/non-commercial ratio (in proportion of species) 0 0,18 0,34 0,54 0,82 Proportion of resident species 0 0,10 0,19 0,29 0,38 Proportion of spawning species excluding cryptic, Symphodus spp. and Labrus spp. species 0 0,60 0,70 0,80 0,90
Proportion of cryptic, Symphodus spp. and Labrus spp. species 0 0,05 0,06 0,07 0,08 Proportion of invertivore species 0 0,22 0,33 0,44 0,55 Proportion of omnivore species 0 0,30 0,25 0,20 0,15 Proportion of piscivore and macrocarnivore species 0 0,05 0,10 0,15 0,20

Chapter 3 Development of a fish-based multimetric index to assess the ecological quality of marine habitats
-the Marine Fish Community Index-
68
Table 5d. Score System of the MFCI and respective values for the Deep soft-bottom typology. All intervals are closed on the left.
Table 5c. Score System of the MFCI and respective values for the Intermediate soft-bottom typology. All intervals are closed on the left.
MFCI metrics- Intermediate soft-bottom typology 1 2 3 4 5
Total number of species 0 9 19 29 38 Pelagic / demersal ratio (in number of species) 0 0,08 0,16 0,24 0,32 Number of rare or uncommon species/ total number of species 0 0,04 0,08 0,11 0,15 Total abundance (Ln (n+1)) 0 2,9 5,8 8,7 11,6 Number of species that make up 90% of abundance excluding gregarious species 0 2 4 7 9
Proportion of low and very-low resilience species 0 0,10 0,20 0,30 0,40 Proportion of spawning species 0 0,10 0,20 0,30 0,40 Proportion of zooplanktivore species >50% and <3% 0,03 0,06 0,09 0,13 Proportion of invertivore species 0-10% and 90-100% 10-20% and 80-90% 20-30% and 70-80% 30-40% and 60-70% 40-60% Proportion of piscivore and macrocarnivore species 0-10% and 90-100% 10-20% and 80-90% 20-30% and 70-80% 30-40% and 60-70% 40-60%
MFCI metrics- Deep soft-bottom typology 1 2 3 4 5
Total number of species 0 9 18 26 35 Number of rare or uncommon species/ total number of species 0 0,05 0,10 0,14 0,19 Pelagic/demersal ratio (in number of species) 0 0,08 0,15 0,23 0,30 Total abundance (Ln (n+1)) 0 3,21 6,40 9,62 12,80 Number of species that make up 90% of abundance excluding gregarious species 0 3 6 10 13
Proportion of low and very-low resilience species 0 0,17 0,35 0,53 0,71 Proportion of spawning species 0 0,13 0,26 0,39 0,50 Proportion of piscivore and macrocarnivore species 0-10% and 90-100% 10-20% and 80-90% 20-30% and 70-80% 30-40% and 60-70% 40-60% Proportion of invertivore species 0-10% and 90-100% 10-20% and 80-90% 20-30% and 70-80% 30-40% and 60-70% 40-60%

Chapter 3 Development of a fish-based multimetric index to assess the ecological quality of marine habitats
-the Marine Fish Community Index-
69
Due to habitat diversity, coastline orientation and biogeographic position, the Arrábida area
sustains rocky fish assemblages with high biodiversity (Henriques et al., 1999). In this area, the
sampling effort was high, with cryptic and non-cryptic transepts surveyed during several years
(Almada et al., 2002), leading to the establishment of the management plan of the Arrábida
Marine Protected Area in 2005. For all these reasons, this survey consisted of the most
representative sample of a typical community of the RS typology. Due to this fact, except for
the metrics “Number of rare and uncommon species/total number of species”, “Number of
species that make up 90% of the abundance” and “Commercial/non-commercial ratio (in
proportion of species)”, the highest scoring limit for each metric was calculated based on the
Arrábida area. Since a dominance of Coris julis (Linnaeus, 1758) was observed in this area and
the study was made before the establishment of the MPA, in a period of high fishing activity,
the reference for the remaining metrics was calculated based on all studies. Again, these
reference values were divided into quintiles, each one corresponding to a limit of the intervals
that define the five possible scores (Table 5 a).
Independently of the aforementioned methods, only the potential of typical species of each
substrate was considered, meaning that the rare, uncommon and occasional species were not
taken into account, once that the capture probability of these species is very low. This way, if
non-typical species are captured in the samples, it only increases the score value of each metric
and therefore the final value of the index (Henriques et al., submitted).
Although the methodology used does not guarantee that the reference limits are real,
considering that the same principles were employed in their calculation (per typology) and that
the goal of this study was to compare the robustness of the ecological status calculated with the
MFCI, the ecological results obtained with these reference limits can be compared.

Chapter 3 Development of a fish-based multimetric index to assess the ecological quality of marine habitats
-the Marine Fish Community Index-
70
Table 6. Score system of the “composed metric of nursery function” for Rocky subtidal typology.
The score system with five possible score values for each metric was initially used by Coates et
al., (2007). A previous work of Henriques et al. (submitted) showed that this system produces
higher discrimination between ecological status than the score systems more frequently used
(usually with 3 possible scores to each metric) and so the MFCI was proposed with a score
system based on 5 scores (Table 5 a,b,c,d). To avoid the metrics “Proportion of spawning
species excluding cryptic, Symphodus spp. and Labrus spp. species” and “Proportion of cryptic,
Symphodus spp. and Labrus spp. species” of the RS typology having double weight in the final
score of the MFCI and once that they are redundant, a pondered score was attributed, thus
giving the weight of a single metric to the result. Firstly, an individual score was calculated for
each metric according to the respective reference value and than, depending on the individual
score of each metric, a final score is attributed to the pondered metric according to Table 6.
After the attribution of one score to each metric, the final value of the index was calculated
following the principals that Coates et al. (2007) proposed, in which the final relative score (RS)
is the result of the score observed (sum of the scores of all metrics) divided by the maximum
possible score. Finally, in order to obtain a qualitative ecological status (important for
management proposes) this RS was compared with an ecological quality scale (Table 7).
Proportion of spawning species excluding cryptic, Symphodus spp. and Labrus spp. species
1 2 3 4 5
1 1 1 1 2 2
2 1 2 2 3 3
3 2 3 3 4 4
4 2 3 4 4 5
Prop
ortio
n of
cry
ptic
, Sy
mph
odus
spp.
and
Lab
rus
spp.
spec
ies
5 3 3 4 5 5

Chapter 3 Development of a fish-based multimetric index to assess the ecological quality of marine habitats
-the Marine Fish Community Index-
71
Table 7. Ecological Quality Scale of the MFCI
2.3.4 Evaluation and Robustness of the MFCI
The MFCI was applied to all studies compiled for each typology. Each ecological status was
analysed based on the score results of the correspondent metrics. After that, and in order to
verify the robustness of the index in presence of the individual effect of each metric, a final
index value with the correspondent ecological status was calculated by successively removing
one metric at a time. Finally, each of these ecological statuses was compared to the result of the
complete index and the number of changes on ecological status (ascents and descents) were
analysed.
3. Results
The ecological statuses obtained in the application of the MFCI and respective metrics by
typology are presented in the tables 8, 9, 10 and 11. In general, all zones were classified
between “moderate” and “excellent” status, with exception of the “IS zone 3 1980”, the “IS
zone 4 1980” and the “DS zone 1 1979”, that were classified with a “poor” ecological status.
In the RS typology, only the “RS Arrábida 1999” was classified as “excellent”, an expected
result since reference values were calculated based on this zone, which only has scores below 3
MFCI- final SCORE
Ecological Status Minimum value Maximum value
Bad 0,2 0,36
Poor 0,36 0,52
Moderate 0,52 0,68
Good 0,68 0,84
Excellent 0,84 1

Chapter 3 Development of a fish-based multimetric index to assess the ecological quality of marine habitats
-the Marine Fish Community Index-
72
for the metrics “Commercial/non-commercial ratio” and “Number of species that make up 90%
of the abundance” (Table 8). The relative score obtained for the zones “RS Berlengas 1992” and
“RS Berlengas 1993” are very close to the limit between “good” and “moderate” status of the
ecological quality scale. In general, the zones with “moderate” statuses have low scores for the
metrics relative to the “Diversity and composition” and “Trophic integrity” attributes, except for
“RS Ria Formosa 1997” that also has a low score for the composed metric of nursery function.
Moreover, the zones classified as a “good” status have, in its majority, intermediate or high
scores (Table 8).
The two zones of the SS typology were classified with “good” and “excellent” ecological status
(Table 9) and both had low scores for the metric “Proportion of zooplanktivore species”.
Because for this typology only two available studies were compiled and the reference values
were only calculated based on these zones, they will be excluded from the index evaluation
analysis.
The relative scores of the “IS zone 5 1979” and the “IS zone 5 1980” zones are near to the limit
between “Good” and “excellent” status, while the “IS zone 4 1980”, classified with a “poor”
status, is near to the “moderate” limit. The zones with “poor” ecological status (“IS zone 3
1980” and “IS zone 4 1980”) and the “IS zone 2 1980” with “moderate status”, have lower
scores for all metrics of “trophic integrity” attribute, for the “proportion of low and very-low
resilience species” and “proportion of spawning species” metrics (Table 10). The zone “IS zone
5 1980” was the only one classified with an “excellent” status in this typology and only had a
low score relative to the “proportion of zooplanktivore species” (Table 10).

Chapter 3 Development of a fish-based multimetric index to assess the ecological quality of marine habitats
-the Marine Fish Community Index-
73
Table 8. Scores obtained with each metric of the MFCI for the Rocky Subtidal Typology. The possible score of each metric varies between 1 and 5. The Ecological status obtained is represented in the last row and the final index value that was compared with the ecological scale is represented by the relative score.
Metrics
RS Berlengas
1992
RS Berlengas
1993
RS Berlengas
2004
RS Berlengas
2005
RS Algarve
2005
RS Sines 2004
RS Ria Formosa
1997
RS Arrábida
1999 Total number of species 5 3 4 4 3 4 2 5 Number of rare or uncommon species/ total number of species 4 3 5 2 1 4 1 4
Number of species that make up 90% of abundance 5 5 5 5 2 5 1 3 Commercial/non-commercial ratio (in proportion of species) 5 5 5 5 5 1 5 3 Proportion of resident species 2 4 5 5 4 5 5 5 Proportion of spawning species excluding cryptic, Symphodus spp. and Labrus spp. species 5 3 2 4 3 1 5 5
Proportion of cryptic, Symphodus spp. Labrus spp. species 5 5 5 5 5 5 1 5 Composed metric of nursery function 5 4 3 5 4 2 2 5 Proportion of invertivore species 2 2 2 2 4 4 5 5 Proportion of omnivore species 1 1 1 1 1 4 5 5 Proportion of piscivore and macrocarnivore species 2 3 5 5 3 4 2 5
Total of scores 31 30 35 34 27 33 28 40
Relative score 0,68 0,66 0,77 0,75 0,60 0,73 0,62 0,88
Ecological quality Good Moderate Good Good Moderate Good Moderate Excellent

Chapter 3 Development of a fish-based multimetric index to assess the ecological quality of marine habitats
-the Marine Fish Community Index-
74
Table 9. Scores obtained with each metric of the MFCI for the Shallow soft-bottom Typology. The possible score of each metric varies between 1 and 5. The Ecological status obtained for each evaluated zone is represented in the last row and the final index value that was compared with the ecological scale is represented by the relative score.
Metrics SS Tejo 2001 SS Algarve 2005
Total number of species 3 5 Number of rare or uncommon species/ total number of species 2 5
Total abundance (Ln (n+1)) 5 5 Number of species that make up 90% of abundance excluding gregarious species 3 5
Proportion of low and very-low resilience species 5 2 Proportion of benthic-associated species 5 5 Proportion of spawning species 5 5 Proportion of piscivore and macrocarnivore species 4 5 Proportion of invertivore species 5 5 Proportion of zooplanktivore species 2 1
Total of scores 39 43 Relative score 0,78 0,86
Ecological quality Good Excellent

Chapter 3 Development of a fish-based multimetric index to assess the ecological quality of marine habitats
-the Marine Fish Community Index-
75
Table 10. Scores obtained with each metric of the MFCI for the Intermediate soft-bottom Typology. The possible score of each metric varies between 1 and 5. The Ecological status obtained for each evaluated zone is represented in the last row and the final index value that was compared with the ecological scale is represented by the relative score.
Metrics IS zone1
1979 IS zone2
1979 IS zone3
1979 IS zone5
1979 IS zone1
1980 IS zone2
1980 IS zone3
1980 IS zone4
1980 IS zone5
1980 Total number of species 4 4 5 5 4 3 5 4 4 Pelagic / demersal ratio (in number of species) 5 3 4 4 4 4 3 4 3 Number of rare or uncommon species / total number of species 4 3 5 5 2 3 2 3 3 Total abundance (Ln (n+1)) 4 3 4 5 4 3 5 5 5 Number of species that make up 90% of abundance excluding gregarious species 4 4 4 5 4 3 3 3 5
Proportion of low and very-low resilience species 5 4 1 4 5 5 1 1 5 Proportion of spawning species 3 4 4 2 2 2 1 1 5 Proportion of zooplanktivore species 5 5 1 1 5 5 1 1 2 Proportion of invertivore species 1 1 4 5 1 1 1 1 5 Proportion of piscivore and macrocarnivore species 5 5 4 5 5 2 1 1 5
Total of scores 40 36 36 41 36 31 23 24 42
Relative score 0,80 0,72 0,72 0,82 0,72 0,62 0,46 0,48 0,84
Ecological quality Good Good Good Good Good Moderate Poor Poor Excellent

Chapter 3 Development of a fish-based multimetric index to assess the ecological quality of marine habitats
-the Marine Fish Community Index-
76
Table 11. Scores obtained with each metric of the MFCI for the Deep soft-bottom Typology. The possible score of each metric varies between 1 and 5. The Ecological status obtained for each evaluated zone is represented in the last row and the final index value that was compared with the ecological scale is represented by the relative score.
Metrics DS zone1
1979 DS zone2
1979 DS zone3
1979 DS zone5
1979 DS zone1
1980 DS zone2
1980 DS zone3
1980 DS zone4
1980 DS zone5
1980 Total number of species 3 5 5 5 5 5 5 5 3 Number of rare or uncommon species/ total number of species 4 4 5 4 2 4 4 3 2 Pelagic/demersal ratio (in number of species) 3 4 4 5 5 3 4 4 5 Total abundance (Ln (n+1)) 3 4 5 3 3 5 5 5 3 Number of species that make up 90% of abundance excluding gregarious species 2 3 4 5 3 3 5 4 2
Proportion of low and very-low resilience species 1 2 1 5 5 1 1 1 4 Proportion of spawning species 1 1 1 2 2 1 1 1 5 Proportion of piscivore and macrocarnivore species 1 5 1 1 2 1 1 1 2 Proportion of invertivore species 1 5 1 1 1 1 1 1 2
Total of scores 19 33 27 31 28 24 27 25 28 Relative score 0,42 0,73 0,60 0,68 0,62 0,53 0,60 0,56 0,62
Ecological quality Poor Good Moderate Good Moderate Moderate Moderate Moderate Moderate

Chapter 3 Development of a fish-based multimetric index to assess the ecological quality of marine habitats
-the Marine Fish Community Index-
77
Table 12. Ecological status obtained with the robustness test of the MFCI. The ecological status marked with a * went up one level and the ones marked with a ** went down one level in the ecological quality scale.
MFCI ecological status IS zone4 1980 IS zone5 1980 DS zone5 1979 DS zone2 1980 RS Berlengas 1992 RS Berlengas 1993
With all original metrics Poor Excellent Good Moderate Good Moderate Without "Total number of species" metric Poor Excellent Moderate** Poor** Moderate** Good* Without "Pelagic/Demersal ratio (in number of species)" metric Poor Excellent Moderate** Moderate --- --- Without "Number of rare or uncommon species/ total number of species" metric Poor Excellent Good Poor** Good Good*
Without "Total abundance (Ln(n+1))" metric Poor Good** Good Poor** --- --- Without "Number of species that make up 90% of abundance" metric Poor Good** Moderate** Moderate Moderate** Moderate Without "Proportion of low and very-low resilience species" metric Moderate* Good** Moderate** Moderate --- --- Without "Proportion of spawning species" metric Moderate* Good** Good Moderate --- --- Without "Proportion of invertivore species" metric Moderate* Good** Good Moderate Good Good* Without "Proportion of piscivore and macrocarnivore species" metric Moderate* Good** Good Moderate Good Good* Without "Proportion of zooplanktivore species" metric Moderate* Excellent --- --- --- --- Without "Commercial/non-commercial ratio (in proportion of species)" metric --- --- --- --- Moderate** Moderate
Without "Proportion of resident species" metric --- --- --- --- Good Moderate Without "Composed metric of nursery function" metric --- --- --- --- Moderate** Moderate Without "Proportion of omnivore species" metric --- --- --- --- Good Good*

Chapter 3 Development of a fish-based multimetric index to assess the ecological quality of marine habitats
-the Marine Fish Community Index-
78
In the DS typology all zones were classified as “moderate”, except for the “DS zone 2 1979”
and the “DS zone 5 1979”, which obtained a “good” ecological status and the zone “DS zone 1
1979” a “poor” ecological status. The “moderate” and “poor” zones have lower scores on the
metrics measured in proportion (metrics of the “trophic integrity” attribute, “proportion of low
and very-low resilience species” and “proportion of spawning species”) (Table 11). The “DS
zone 5 1979” zone with a “good” status and the “DS zone 2 1980” with a “moderate” status are
both near the limit of the ecological status immediately below.
The MFCI shows a robust response in presence of the individual effect of each metric for all
typologies, considering the low number of ascents and descents observed in the final ecological
status. The zones where changes of ecological status were observed are represented in the table
12.
4. Discussion
On the present work, the MFCI was successfully applied in the 4 typologies, once no ecological
status pattern was obtained depending on the typology evaluated, similarly to the obtained by
Henriques et al. (submitted), who identified different patterns of ecological status according to
the type of substrate of the marine environment with various adapted estuarine indices. Through
the analysis of the metrics responsible for these patterns, the authors conclude that the indices
were not representative of the particularities of the typical fish community of each substrate. In
fact, the different ecological status values obtained with the MFCI only varied in accordance
with the representativeness of the sampling plan, strengthening the successful application of
MFCI on the different typologies.
For the zones “RS Berlengas 1993”, “RS Algarve 2005” and “RS Ria Formosa 1997”, the
“moderate” statuses obtained are due to the low scores obtained for the metrics included on the
“diversity and composition” and “trophic integrity” attributes as a consequence of the low
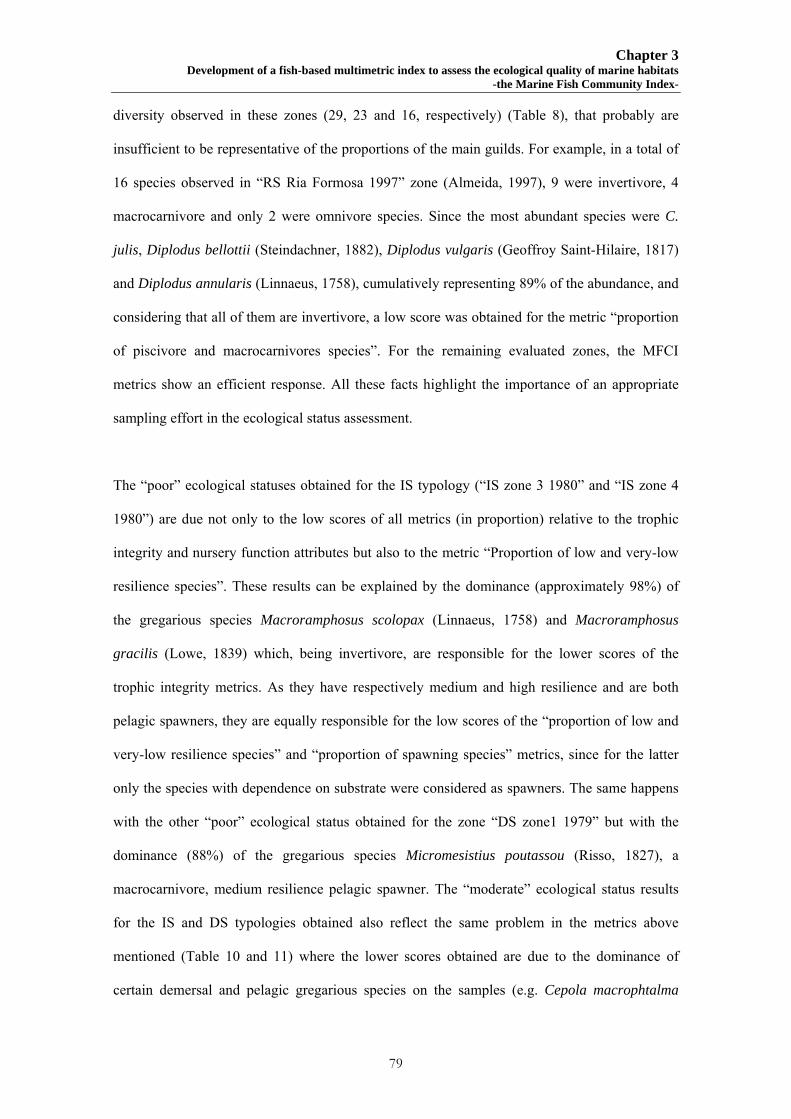
Chapter 3 Development of a fish-based multimetric index to assess the ecological quality of marine habitats
-the Marine Fish Community Index-
79
diversity observed in these zones (29, 23 and 16, respectively) (Table 8), that probably are
insufficient to be representative of the proportions of the main guilds. For example, in a total of
16 species observed in “RS Ria Formosa 1997” zone (Almeida, 1997), 9 were invertivore, 4
macrocarnivore and only 2 were omnivore species. Since the most abundant species were C.
julis, Diplodus bellottii (Steindachner, 1882), Diplodus vulgaris (Geoffroy Saint-Hilaire, 1817)
and Diplodus annularis (Linnaeus, 1758), cumulatively representing 89% of the abundance, and
considering that all of them are invertivore, a low score was obtained for the metric “proportion
of piscivore and macrocarnivores species”. For the remaining evaluated zones, the MFCI
metrics show an efficient response. All these facts highlight the importance of an appropriate
sampling effort in the ecological status assessment.
The “poor” ecological statuses obtained for the IS typology (“IS zone 3 1980” and “IS zone 4
1980”) are due not only to the low scores of all metrics (in proportion) relative to the trophic
integrity and nursery function attributes but also to the metric “Proportion of low and very-low
resilience species”. These results can be explained by the dominance (approximately 98%) of
the gregarious species Macroramphosus scolopax (Linnaeus, 1758) and Macroramphosus
gracilis (Lowe, 1839) which, being invertivore, are responsible for the lower scores of the
trophic integrity metrics. As they have respectively medium and high resilience and are both
pelagic spawners, they are equally responsible for the low scores of the “proportion of low and
very-low resilience species” and “proportion of spawning species” metrics, since for the latter
only the species with dependence on substrate were considered as spawners. The same happens
with the other “poor” ecological status obtained for the zone “DS zone1 1979” but with the
dominance (88%) of the gregarious species Micromesistius poutassou (Risso, 1827), a
macrocarnivore, medium resilience pelagic spawner. The “moderate” ecological status results
for the IS and DS typologies obtained also reflect the same problem in the metrics above
mentioned (Table 10 and 11) where the lower scores obtained are due to the dominance of
certain demersal and pelagic gregarious species on the samples (e.g. Cepola macrophtalma
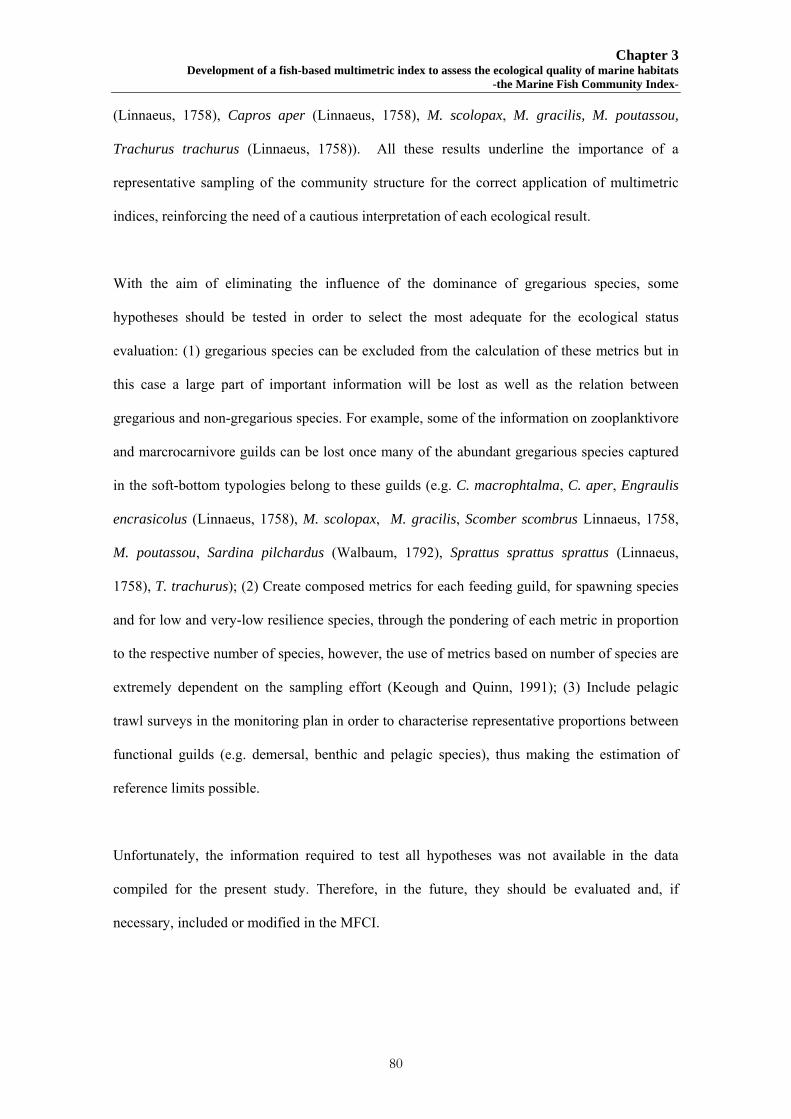
Chapter 3 Development of a fish-based multimetric index to assess the ecological quality of marine habitats
-the Marine Fish Community Index-
80
(Linnaeus, 1758), Capros aper (Linnaeus, 1758), M. scolopax, M. gracilis, M. poutassou,
Trachurus trachurus (Linnaeus, 1758)). All these results underline the importance of a
representative sampling of the community structure for the correct application of multimetric
indices, reinforcing the need of a cautious interpretation of each ecological result.
With the aim of eliminating the influence of the dominance of gregarious species, some
hypotheses should be tested in order to select the most adequate for the ecological status
evaluation: (1) gregarious species can be excluded from the calculation of these metrics but in
this case a large part of important information will be lost as well as the relation between
gregarious and non-gregarious species. For example, some of the information on zooplanktivore
and marcrocarnivore guilds can be lost once many of the abundant gregarious species captured
in the soft-bottom typologies belong to these guilds (e.g. C. macrophtalma, C. aper, Engraulis
encrasicolus (Linnaeus, 1758), M. scolopax, M. gracilis, Scomber scombrus Linnaeus, 1758,
M. poutassou, Sardina pilchardus (Walbaum, 1792), Sprattus sprattus sprattus (Linnaeus,
1758), T. trachurus); (2) Create composed metrics for each feeding guild, for spawning species
and for low and very-low resilience species, through the pondering of each metric in proportion
to the respective number of species, however, the use of metrics based on number of species are
extremely dependent on the sampling effort (Keough and Quinn, 1991); (3) Include pelagic
trawl surveys in the monitoring plan in order to characterise representative proportions between
functional guilds (e.g. demersal, benthic and pelagic species), thus making the estimation of
reference limits possible.
Unfortunately, the information required to test all hypotheses was not available in the data
compiled for the present study. Therefore, in the future, they should be evaluated and, if
necessary, included or modified in the MFCI.

Chapter 3 Development of a fish-based multimetric index to assess the ecological quality of marine habitats
-the Marine Fish Community Index-
81
In many zones with the same gregarious species represented but with more balanced
abundances (zones as “good” and “excellent” ecological status classified in IS typology), the
MFCI shows an efficient response to these problematic metrics. In this manner, the results
suggest that the reference values were totally misadjusted to the DS typology, as a consequence
of the fact that no clear pattern was found concerning the metrics of the “Trophic integrity”
attribute in the reference limits established.
Despite these results, the MFCI shows a robust response in the presence of the individual effect
of each metric for all typologies (Table 12), considering that, when a metric was removed from
the index, the final ecological status tended to be conservative. Moreover, only the zones with
relative scores near the upper or lower limit of their status in the ecological quality scale
changed status when some of the metrics were removed. In general, as it was expected, when
the metrics with lower scores were removed from the zones near the upper limit, the overall
status increased to the above level on the scale. This happened with “RS Berlengas 1993” and
“IS zone 4 1980” since, as the metrics with scores of 1 or 2 were removed, the overall status
went up to “good” and “moderate” respectively. The opposite happened when metrics with
score 4 or 5 were removed from “IS zone 5 1980”, “DS zone 5 1979”, “DS zone 2 1980” and
“RS Berlengas 1992”, that are near the lower limit and went down one ecological quality status.
Hence it becomes obvious that there is a need to assess the final index value carefully when it is
close to the limits of the ecological scale, once only one change in metric values is enough to
alter the ecological status.
Furthermore, in the context of the MSD it is different to obtain a “moderate” or a “good”
ecological status, since the plan of measures required in order to achieve a “good” status and the
success of this plan depends of the defined ecological status scale. The methodology used in this
study to test the robustness of the index can be used as a complementary analysis to identify

Chapter 3 Development of a fish-based multimetric index to assess the ecological quality of marine habitats
-the Marine Fish Community Index-
82
these cases as well as to associate a degree of confidence to each ecological status obtained,
which can be important to follow the progress of the measure plan in the context of the MSD.
5. Final considerations
Although there is a need to perform more tests in order to validate the reference values, solve
the hypothesis of the problematic metrics of soft-bottom typologies and test the response of the
MFCI in the presence of stress gradients, the current study shows that the MFCI is an efficient
tool to assess the ecological status of the demersal marine fish communities, taking into account
that every problem found can be solved with adequate sampling methods and reference limits.
The MFCI metrics are representative of the typical communities of each typology and sensitive
to all the main impacts over the marine environment, as observed in the DPSIR analysis
Moreover, the MFCI had a robust answer in the presence of the individual effect of the metrics
and was capable to distinguish ecological statuses between different zones including those with
sampling effort problems.
This work also showed the influence of the sampling effort and highlighted the importance of
representative sampling methods to be used in the application of multimetric indices. In the
future, the MFCI metrics must be tested for each typology with data colleted using the same
sampling method, with the same sampling effort and covering all seasons in order to define
reference values and design the best monitoring plan to assess the ecological status of marine
fish communities. In addition, the use of data collected with different sampling efforts and
methods and the effect of seasonality should be carefully analysed in order to opt for the most
balanced monitoring plan that ponders their cost with the efficacy of the index response.
Data on biomass and abundance of adults and juveniles must be incorporated into soft-bottom
samples as well as abundance data of juveniles for rocky subtidal samples in order to test the

Chapter 3 Development of a fish-based multimetric index to assess the ecological quality of marine habitats
-the Marine Fish Community Index-
83
metrics “ABC curves”, “Number of species with juveniles present” or “Proportion of juveniles”
and “Proportion of individuals over the maturity size” of the MFCI according to the respective
typology.
The MFCI developed here incorporates both functional and structural information about marine
fish communities, including abundance and size structure required in the Annex II of the MSD
(COM, 2005b), besides giving information about the typical community from each specific
typology. Therefore, the MFCI fulfils all the parameters required by the MSD and for that
reason it can be used in the implementation of this Directive.
Since the MFCI provides an efficient communication tool between researchers and decision
makers, stakeholders and/or local communities, by converting ecological information into a
simple ecological status that can be easily associated with the source of the problems affecting
the fish community, it is useful not only in the context of MSD but also in other contexts with
proposes such as conservation and sustainable management of the marine environment.
6. References
Abreu, S., 2005. Caracterização da ictiofauna associada a substratos móveis costeiros ao largo
do Algarve Central. Thesis. University of Algarve. 65pp.
Almada, V.C., Henriques, M., Gonçalves, E.J., 1999. Ecology and behaviour of reef fishes in
the temperate north-eastern Atlantic and adjacent waters. In: Almada, V.C., Oliveira,
R.F., Gonçalves, E.J. (Eds.), Behaviour and Conservation of Littoral Fishes. ISPA,
Lisbon, pp. 33-68.
Almada, V., Gonçalves, E., Henriques, M. 2002. Inventariação e ecologia da ictiofauna do
substrato rochoso da costa Arrábida/Espichel. Instuto Superior de Psicologia Aplicada
and Instituto da Conservação da Natureza. Technical report. 264pp.

Chapter 3 Development of a fish-based multimetric index to assess the ecological quality of marine habitats
-the Marine Fish Community Index-
84
Almada, V., Henriques, M., Gonçalves, E., Garcia, J., Henriques, S., 2004. Caracterização da
Situação de Referência e Avaliação de Impactes para a Central Térmica de Ciclo
Combinado proposta para a área de Sines. Estudo de Impacte Ambiental,
Componente de Biologia Marinha. Hidroprojecto. Portugal. Technical report. 34pp.
Almeida, A.J., 1996. Structure and spatial variability of the rocky fish fauna in the protected
marine "Reserva Natural da Berlenga" (Portugal). Arquivos do Museu Bocage - Nova
Série 2 (35), 633-642.
Almeida, O. 1997. Estudo comparativo das comunidades ictiológicas de um redife artificial e
um recife natural vizinho na costa sul algarvia. Thesis. University of Algarve. 40pp.
Badcock, E.A., Pikitch, E.K., McAllister, M.K., Apostolaki, P., Santora, P., 2005. A perspective
on the use of spatialized indicators for ecosystem-based fishery management through
spatial zoning. ICES Journal of Marine Science 62, 469-476.
Bianchi, G., Gislason, H., Graham, L., Hill, L., Jin, X., Koranteng, K., Manickchand-Heileman,
S., Payá, I., Sainsbury, K., Sanchez, F., Zwanenburg, K., 2000. Impact of fishing on
size and diversity of demersal fish communities. ICES Journal of Marine Science 57,
558-571.
Borja, A., 2006. The new European Marine Strategy Directive: Difficulties, opportunities, and
challenges. Marine Pollution Bulletin 52, 239-242
Borja, A., Galparsoro, I., Solaun, O., Muxika, I., Tello, E.M., Uriarte, A., Valencia, V., 2006.
The European Water Framework Directive and the DPSIR, a methodological
approach to assess the risk of failing to achieve good ecological status. Estuarine,
Coastal and Shelf Science 66, 84-96.
Breine, J.J., Maes, J., Quataert, P., Van den Bergh, E. Simoens, I., Van Thuyne, G., Belpaire,
C., 2007. A fish-based assessment tool for the ecological quality of the Brackish
Schelde estuary in Flanders (Belgium). Hydrobiologia 575, 141-159.
Coates, S., Waugh, A., Anwar, A., Robson, M., 2007. Efficacy of a multi-metric fish index as
an analysis tool for transitional fish component of the Water Framework Directive.
Marine Pollution Bulletin 55, 225-240.

Chapter 3 Development of a fish-based multimetric index to assess the ecological quality of marine habitats
-the Marine Fish Community Index-
85
COM, 2005a. Communication from the Commission to the Council and the European
Parliament. Thematic Strategy on the Protection and Conservation of the Marine
Environment. COM (2005)504 final, SEC(2005)1290. 9pp.
COM, 2005b. Proposal for a Directive of the European Parliament and of the Council,
establishing a Framework for Community Action in the field of Marine
Environmental Policy. COM(2005)505 final, SEC(2005)1290. 31pp.
COM, 2005c. Commission Staff Working Document. Annex to the Communication from the
Commission to the Council and the European Parliament. Thematic Strategy on the
Protection and Conservation of the Marine Environment, and Proposal for a Directive
of the European Parliament and of the Council, establishing a Framework for
Community Action in the field of Marine Environmental Policy. COM(2005)504 and
505 final, SEC(2005)1290. 79pp.
Cooper, J. A. G., Ramm, A. E. L., Harrison, T. D., 1994. The Estuarine Health Index: a new
approach to scientific information transfer. Ocean and Coastal Management 25, 103-
141.
Deegan, L. A., Finn, J.T., Ayvazian, S.G., Ryder-Kieffer, C.A., Buonaccorsi, J., 1997.
Development and validation of an Estuarine Biotic Integrity Index. Estuaries 20, 601-
617.
Demestre, M. Sánchez, P., Albelló, P., 2000. Demersal fish assemblages and habitat
characteristics on the continental shelf and upper slope of the north-western
Mediterranean. Journal of the Marine Biological Association of the United Kingdom
80, 981-988.
Diaz, R.J., Solan, M., Valente, R.M., 2004. A review of approaches for classifying benthic
habitats and evaluating habitat quality. Journal of Environmental Management 73,
165-181.
Dinis, M.H., Marecos, M.L., 1984. Estudo dos recursos demersais da costa portuguesa.
Relatório da 5ªcampanha, N/E «noruega» Outubro 1980 cruzeiro 020221080. INIP,
Technical report.

Chapter 3 Development of a fish-based multimetric index to assess the ecological quality of marine habitats
-the Marine Fish Community Index-
86
Elliott, M. 2002. The role of the DPSIR approach and conceptual models in the marine
environment management: an example for offshore wind power. Marine Pollution
Bulletin 44, iii-vii.
Elliott, M., Whitfield, A.K., Potter, I.C., Blaber, S.J.M., Cyrus, D.P., Nordlie, F.G., Harrison,
T.D., 2007. The guild approach to categorizing estuarine fish assemblages: a global
review. Fish and Fisheries 8, 241-268.
EPA, 2000. Evaluation Guidelines for Ecological indicators. United States Environmental
Protection Agency, EPA-620-R-99-005. Washington, 45pp.
Faria, C., Almada, V.C., 2006. Patterns of spatial distribution and behaviour of fish on a rocky
intertidal platform at high tide. Marine Ecology Progress Series 316, 155–164.
Gomes, M.C., Serrão, E., Borges M.F., 2001. Spatial patterns of groundfish assemblages on the
continental shelf of Portugal. ICES Journal of Marine Science 58, 633-641.
Goñi, R., 1998. Ecosystem effects of marine fisheries: an overview. Ocean & Coastal
Management 40, 37-64.
Greenstreet, S.P.R., Rogers, S.I., 2006. Indicators of the health of the North Sea fish
community: identifying reference levels for an ecosystem approach to management.
ICES Journal of Marine Science 63, 573-593.
Guidetti, P., Fanelli, G., Frashetti, S., Terlizzi, A., Boero, F., 2002. Coastal fish indicate human-
induced changes in the Mediterranean littoral. Marine Environmental Research 53,
77-94.
Gupta, A.K., Gupta, S.K:, Patil, S.R., 2005. Environmental management plan for port and
harbour projects. Clean Techn Environ Policy 7, 133-141.
Harrison, T.D., Whitfield, A.K., 2004. A multi-metric fish index to assess the environmental
condition of estuaries. Journal of Fish Biology 65, 683-710.

Chapter 3 Development of a fish-based multimetric index to assess the ecological quality of marine habitats
-the Marine Fish Community Index-
87
Henriques, P., 1993. Estrutura e variabilidade da comunidade ictiológica do Carreiro da
Fortaleza (Berlenga) e bio-etologia da reprodução de Parablennius pilicornis Cuvier
1829 (Pisces: Blenniidae). Thesis, University of Lisbon, 39pp.
Henriques, S., Pais, P.M., Costa, M.J., Cabral, H., Efficacy of adapted estuarine fish-based
multimetric indices as tools for evaluating ecological status of the marine
environment. Marine Pollution Bulletin (submitted).
Hering, D., Feld, C. K., Moog, O., Ofenböck, T., 2006. Cook book for the development of a
multimetric index for biological condition of aquatic ecosystems: experiences from
European AQEM and STAR projects and related initiatives. Hydrobiologia 566, 311-
324.
Hollings, C.S., 1973. Resilience and Stability of ecological systems. Annual Review of Ecology
and Systematics 4, 1-23.
INIP, 1980. Estudo dos Recursos Demersais da Costa Continental Portuguesa. 1ª Cruzeiro
N/790604, N/E "Noruega". Junho 1979. INIP , Lisboa 1980. Technical Report.
INIP, 1981a. Estudo dos Recursos Demersais da Costa Continental Portuguesa. Relatório da 2ª
Campanha "Noruega". Outubro/Novembro 1979. Relatório do Instituto Nacional de
Investigação das Pescas nº 2. Technical Report.
INIP, 1981b. Relatório do Cruzeiro tipo "Demersal" 020130380 Realizado a bordo do Navio
"Noruega" entre 5 e 17 de Março de 1980. Relatório do Instituto Nacional de
Investigação das Pescas nº 4. Technical Report.
INIP, 1982. Estudo dos Recursos Demersais da Costa Continental Portuguesa. Relatório da 3ª
Campanha N/02016058 "Noruega". Maio/Junho 1980. Relatório do Instituto Nacional
de Investigação das Pescas nº 13. Technical Report.
Islam., Md. S., Tanaka, M., 2004. Impacts of pollution on coastal and marine ecosystems
including coastal and marine fisheries and approach for management: a review and
synthesis. Marine Pollution Bulletin 48, 624-649.

Chapter 3 Development of a fish-based multimetric index to assess the ecological quality of marine habitats
-the Marine Fish Community Index-
88
Jouffre. D., Inejih, C.A., 2005. Assessing the impact of fihesries an demersal fish assemblages
of the Mauritanian continental shells, 1987-1999, using dominance curves. ICES
Journal of Marine Science 62, 380-383.
Karr, J.R., 1981. Assessment of Biotic Integrity using Fish Communities. Fisheries 6, 21-27.
Khalaf, M.A., Kochzius, M., 2002. Changes in trophic community structure of shore fishes at an
industrial site in the Gulf of Aqaba, Red Sea. Marine Ecology Progress Series 239,
287-299.
Keough, M.J., Quinn, G.P., 1991. Causality and the Choise of Measurements for Detecting
Human Impacts in Marine Environments. Aust. J. Mar. Freshwater Res. 42, 539-554.
Labroupoulou, M., Papaconstantinou, C., 2005. Effect of fishing on community structure of
demersal fish assemblages. Belg. J. Zool., 135, 191-197.
Lalumera, G.M., Calamari, D., Galli, P., Castiglioni, S., Crosa, G., Fanelli, R., 2004.
Preliminary investigation on the environmental occurrence and effects of antibiotics
used in aquaculture in Italy. Chemosphere 54, 661-668.
Lara, E. N., González, E.A., 1998. The relationship between reef fish community structure and
environmental variables in the southern Mexican Caribbean. Journal of Fish Biology
53, 209-221.
Letourneur, Y., ruitton, S., Sartoretto, S., 2003. Environmental and benthic factors structuring
the spatial distribution of a summer infralittoral fish assemblage in the north-western
Mediterranean Sea. Journal of the Marine Biological Association of the United
Kingdom 83, 193-204.
Maranhão, P., Franco, J., Castanheira, F., Castro, N., Rodrigues, N., 2006. Peixes da Reserva
Natural das Berlengas (Portugal). XIV Simpósio Ibérico de Estúdios de Biología
Marina, 12-15 September, Barcelona, Spain.
Metharatta, E.T., Link, J.S., 2006. Evaluation of quantitative indicators for marine fish
communities. Ecological Indicators 6, 575-588.

Chapter 3 Development of a fish-based multimetric index to assess the ecological quality of marine habitats
-the Marine Fish Community Index-
89
Mercado-Silva, N., Lyons, J.D., Maldonado, G.S., Medina, M., 2002. Validation of a fish-based
index of biotic integrity for streams and rivers of central México. Fish Biology and
Fisheries 12, 179-191.
Newell, R.C., Seiderer, L.J., Hitchcock, D.R., 1998. The impact of dredging works in coastal
waters: a review of the sensitivity to disturbance and subsequent recovery of
biological resources on the Sea Bed. Oceanography and Marine Biology: an Annual
Review 36, 127-178.
Pais, M.P., Henriques, S., Costa, M.J., Cabral, H. Typology definition for marine fish
assemblages in the context of the European Marine Strategy Directive: the Portuguese
continental shelf. Marine Environmental Research (submitted).
Peris-Mora, E., Diez Orejas, J.M., Subirats, A., Ibáñez, S., Alvarez, P., 2005. development of a
system indicator for sustainable port management. Marine pollution Bulletin 50,
1649-1660.
Piet, G.J., Jennings, S., 2005. Response of potential fish community indicators to fishing. ICES
Journal of Marine Science 62, 214-225.
Pihl, L., Wennhage, H., 2002. Structure of fish assemblages on rocky and soft bottom shores on
the Swedish west coast. Journal of Fish Biology 61, 148-166.
Prista, N., Vasconcelos, R., Costa, M.J., Cabral, H. N., 2003. The demersal fish assemblage of
the coastal area adjacent to the Tagus estuary (Portugal): relationships with
environmental conditions. Oceanologica Acta 26, 525-536.
Quinn, N.W., Breen, C.M., Whitfield, A.K., Hearne, J.W., 1999. An Index for the management
of South African estuaries for juvenile fish recruitment from the marine environment.
Fisheries Management and Ecology 6, 421-436.
Ramm, A. E. L., 1988. The community degradation index: a new method for assessing the
deterioration of aquatic habitats. Water Research 22, 293-301.
Read, P., Fernandes, T., 2003. Management of environmental impacts of marine aquaculture in
Europe. Aquaculture 226, 139-163.

Chapter 3 Development of a fish-based multimetric index to assess the ecological quality of marine habitats
-the Marine Fish Community Index-
90
Rice, J.C., 2000. Evaluating fishery impacts using metrics of community structure. ICES
Journal of Marine Science 57, 682-688.
Rice, J.C., 2003. Environmental health indicators. Ocean & Coastal Management 46, 235-259.
Rochet, M., Trenkel, V.M., 2003. Which community indicators can measure the impact of
fishing? A review and proposals. Canadian Journal of Fisheries and Aquatic Sciences
60, 86-99.
Roset, N., Greenouillet, G., Goffaux, D., Pont, D., Kestemont, P., 2007. A review of existing
fish assemblage indicators and methodologies. Fisheries Management and Ecology
14, 393-405.
Roth, N.E., Southerland, M.T., Chaillou, J.C., Klauda, R.J., Kazyak, P.F., Stranko, S.A.,
Weisberg, S.B., Hall, L.W., Morgan II, R.P., 1988. Maryland biological stream
survey: Development of a fish index of biotic integrity. Environmental Management
and Assessment 51, 89-106.
Shin, Y., Rochet, M., Jennings, S., Field, J.G., Gislason, H., 2005. Using size-based indicators
to evaluate the ecosystem effects of fishing. ICES Journal of Marine Science 62, 384-
396.
Smith A.K., Ajani, P.A., Roberts, D.E., 1999. Spatial and temporal variation in fish assemblages
exposed to sewage and implications for management. Marine Environmental
Research 47, 241-260.
StatSoft, 2003. STATISTICA (data analysis software system), version 6, www.statsoft.com.
Svarstad, H., Petersen, L.K., Rothman, D., Siepel, H., Wätzold, F. Discursive biases of the
environmental research framework DPSIR. Land Used Policy (2007),
doi:10.1016/j.landusepol.2007.03.005.
Trebitz, A.S., Hill, B.H., Mccormick, F.H., 2003. Sensitivity of indices of biotic integrity to
simulated fish assemblage changes. Environmental Management 32, 499-515.

Chapter 3 Development of a fish-based multimetric index to assess the ecological quality of marine habitats
-the Marine Fish Community Index-
91
Yemane, D., Field., J.G., Leslie, R.W., 2005. Exploring the effects of fishing on fish
assemblages using Abundance Biomass Comparison (ABC) curves. ICES Journal of
Marine Science 62, 374-379.

Chapter 4


Chapter 4 General Discussion and Final Remarks
92
General Discussion and Final Remarks
Due to marine ecosystems degradation, the assessment of the ecological status has been
recognised as an essential part of the systems management in order to ensure the sustainable
used of the marine resources (Reiss and Kröncke, 2005). However, until now, the frequent
ecosystem approaches in the marine environment are focused on the impacts of fishing activities
(Methratta and Link, 2006) and the existing multimetric indices to assess the ecological status
are only applied to freshwater and estuarine fish communities (Diaz et al., 2004). Moreover, the
assessment of ecological status of marine fish communities required by the European Marine
Strategy Directive (MSD) urge the development of an efficient fish-based ecological index
(COM, a,b).
For the first time, in the present study, an approach to assess the ecological status of marine fish
communities is proposed through the development of a new multimetric index: the Marine Fish
Community Index (MFCI).
The MFCI is divided in four typologies and their metrics are adjusted for the respective typical
community since the type of substrate and depth are the main factors responsible for the
complexity of the marine habitats and consequently for the structure and function of their
communities (e.g. Demestre et al., 2000; Pihl and Wennhage, 2002). The results of the MFCI
application and its robustness test showed that this approach by typology is efficient to assess
the ecological status of the marine communities. However, the response of some MFCI metrics,
measured as proportion of individuals in the soft-bottom typologies, showed a strong influence
of the gregarious species due to the lack of representativeness of the sampling methods and
consequently from the reference situation. Moreover, the ecological results obtained in the
rocky substrate typology highlighted the importance of the sampling effort in the ecological
status assessment. To apply the MFCI in the future, a good monitoring plan must be tested and
applied in all typologies in order to solve, not only the problems related with some metrics

Chapter 4 General Discussion and Final Remarks
93
application, but also to test the remain ones that, unfortunately, laked the data required for their
calculation.
Since no historical data of non-impacted communities is available for the fish communities of
the Portuguese coast, the definition of the real reference limits can only be possible recurring to
a representative monitoring plan. We suggest the evaluation of some zones in each typology
with other biological and physic-chemical indicators to define their ecological status and the
respective reference situation for, in the future, the MFCI to be applied in other zones as a tool
to assess the ecological status.
A good monitoring plan is also important in the MSD implementation since each member state
must do an initial assessment of the current ecological status and respective environmental
impacts of the marine waters concerned, to define what is a “good” state in order to establish a
set of environmental targets to become possible the development of a measure plan until 2016
with the aim to achieve or maintain a “good ecological status” by 2021 (COM, a,b). All these
steps involve a particular precaution since the implications of a bad definition of it can drive to
the failure of the MSD implementation.
In the future, the monitoring plan that will be used in MSD implementation need to be
calibrated with the MFCI and also must have in consideration the sampling effort, sampling
methods and the seasonal stations of the sampling for taking them into account in the reference
situation. Only with this articulation, the assessment of the ecological status of marine waters
can be possible as well as the definition of the “good ecological status” of the marine fish
communities. The definition of what is a fish community in “good ecological status” is
particularity sensible since the establishment of the environmental targets to successfully
achieve a “good ecological status” by 2021 depends on it (COM, a,b).

Chapter 4 General Discussion and Final Remarks
94
To achieve an effective increase of the quality of marine waters, the pressures source must be
identified to assure the establishment of efficient measures to minimize the impacts. As
exclusive metrics for each impact are impossible to obtain since none of the pressures rise a
single impact on the fish community (Niemi et al., 2004), the identification of the pressure
source is only possible through the identification of the all pressures on the assessed zone that in
association with the response measured by the metrics can predict which ones are responsible
for the ecological status obtained. This procedure allied with a large set of data to identify the
natural variation is useful for the discrimination ability of the index.
Since a DPSIR analysis was taken into account in the selection of the MFCI metrics, the main
anthropogenic pressures on fish communities are possible to measure. In addition, the
separation of the MFCI in typologies and their respective metrics measured in guilds, turns this
index applicable in other regions, hence following the same principals used in their
development, the metrics can be easily adapt or substituted by the ones that represent the typical
fish community to be evaluated. In this manner and considering that one of the aims of the MSD
is to promote the articulation and coordination between the regional and EU approaches (COM,
2005a,b; Borja, 2006), the MFCI can be a very useful tool in the MSD implementation as well
as other contexts of conservation and sustainable management of the marine environment.
References
Borja, A., 2006. The new European Marine Strategy Directive: Difficulties, opportunities, and
challenges. Marine Pollution Bulletin 52, 239-242.
COM, 2005a. Proposal for a Directive of the European Parliament and of the Council,
establishing a Framework for Community Action in the field of Marine Environmental
Policy. COM(2005)505 final, SEC(2005)1290. 31pp.
COM, 2005b. Commission Staff Working Document. Annex to the Communication from the
Commission to the Council and the European Parliament. Thematic Strategy on the
Protection and Conservation of the Marine Environment, and Proposal for a Directive

Chapter 4 General Discussion and Final Remarks
95
of the European Parliament and of the Council, establishing a Framework for
Community Action in the field of Marine Environmental Policy. COM(2005)504 and
505 final, SEC(2005)1290. 79pp.
Demestre, M. Sánchez, P., Albelló, P., 2000. Demersal fish assemblages and habitat
characteristics on the continental shelf and upper slope of the north-western
Mediterranean. Journal of the Marine Biological Association of the United Kingdom
80, 981-988.
Diaz, R.J., Solan, M., Valente, R.M., 2004. A review of approaches for classifying benthic
habitats and evaluating habitat quality. Journal of Environmental Management 73, 165-
181
Metharatta, E.T., Link, J.S., 2006. Evaluation of quantitative indicators for marine fish
communities. Ecological Indicators 6, 575-588.
Niemi, G., Wardrop, D., Brooks, R., Anderson, S., Brady, V., Paerl, H. Rakocisnki, C.,
Brouwer, M., Levinson, B., McDonald, M., 2004. Rationale for a new generation of
indicators for coastal waters. Environmental Health Perspectives 11, 979-986.
Pihl, L., Wennhage, H., 2002. Structure of fish assemblages on rocky and soft bottom shores on
the Swedish west coast. Journal of Fish Biology 61, 148-166.
Reiss, H., Kröncke, I., 2005. Seasonal variability of benthic indices: An approach to test the
applicability of different indices for ecosystem quality assessment. Marine Pollution
Bulletin 50, 1490-1499.

Appendix

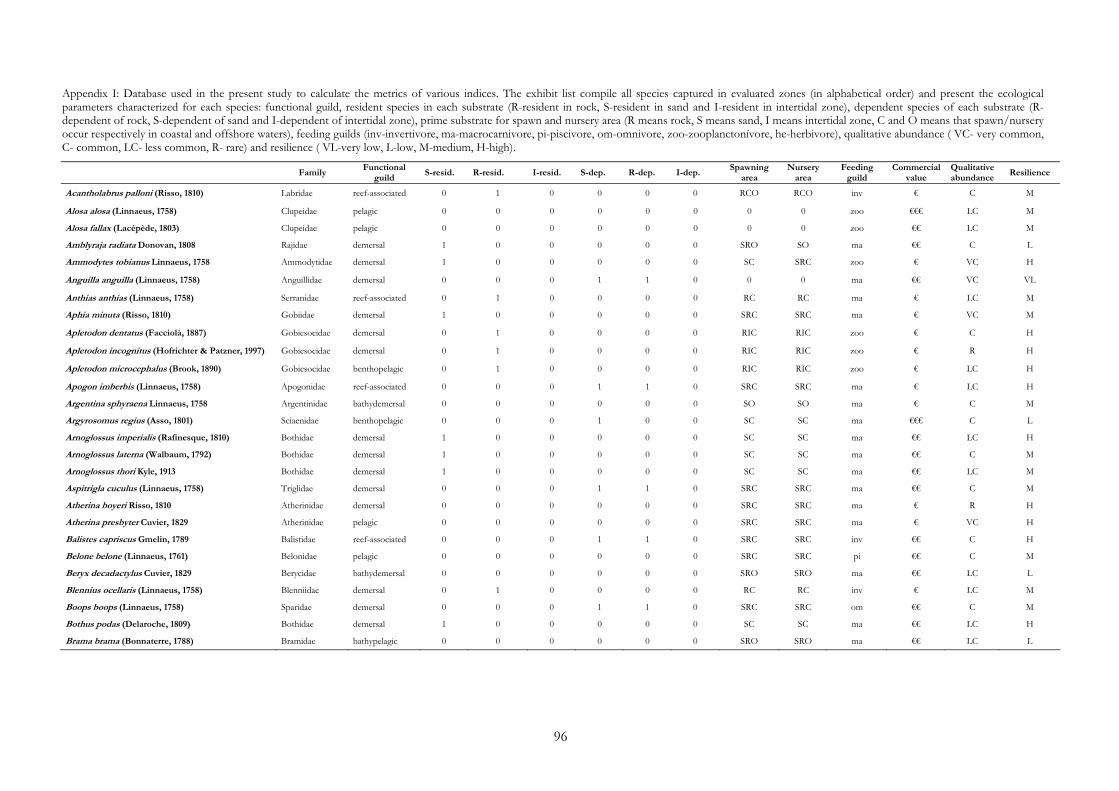
96
Appendix I: Database used in the present study to calculate the metrics of various indices. The exhibit list compile all species captured in evaluated zones (in alphabetical order) and present the ecological parameters characterized for each species: functional guild, resident species in each substrate (R-resident in rock, S-resident in sand and I-resident in intertidal zone), dependent species of each substrate (R-dependent of rock, S-dependent of sand and I-dependent of intertidal zone), prime substrate for spawn and nursery area (R means rock, S means sand, I means intertidal zone, C and O means that spawn/nursery occur respectively in coastal and offshore waters), feeding guilds (inv-invertivore, ma-macrocarnivore, pi-piscivore, om-omnivore, zoo-zooplanctonívore, he-herbivore), qualitative abundance ( VC- very common, C- common, LC- less common, R- rare) and resilience ( VL-very low, L-low, M-medium, H-high).
Family Functional
guild S-resid. R-resid. I-resid. S-dep. R-dep. I-dep.
Spawning area
Nursery area
Feeding guild
Commercial value
Qualitative abundance
Resilience
Acantholabrus palloni (Risso, 1810) Labridae reef-associated 0 1 0 0 0 0 RCO RCO inv € C M
Alosa alosa (Linnaeus, 1758) Clupeidae pelagic 0 0 0 0 0 0 0 0 zoo €€€ LC M
Alosa fallax (Lacépède, 1803) Clupeidae pelagic 0 0 0 0 0 0 0 0 zoo €€ LC M
Amblyraja radiata Donovan, 1808 Rajidae demersal 1 0 0 0 0 0 SRO SO ma €€ C L
Ammodytes tobianus Linnaeus, 1758 Ammodytidae demersal 1 0 0 0 0 0 SC SRC zoo € VC H
Anguilla anguilla (Linnaeus, 1758) Anguillidae demersal 0 0 0 1 1 0 0 0 ma €€ VC VL
Anthias anthias (Linnaeus, 1758) Serranidae reef-associated 0 1 0 0 0 0 RC RC ma € LC M
Aphia minuta (Risso, 1810) Gobiidae demersal 1 0 0 0 0 0 SRC SRC ma € VC M
Apletodon dentatus (Facciolà, 1887) Gobiesocidae demersal 0 1 0 0 0 0 RIC RIC zoo € C H
Apletodon incognitus (Hofrichter & Patzner, 1997) Gobiesocidae demersal 0 1 0 0 0 0 RIC RIC zoo € R H
Apletodon microcephalus (Brook, 1890) Gobiesocidae benthopelagic 0 1 0 0 0 0 RIC RIC zoo € LC H
Apogon imberbis (Linnaeus, 1758) Apogonidae reef-associated 0 0 0 1 1 0 SRC SRC ma € LC H
Argentina sphyraena Linnaeus, 1758 Argentinidae bathydemersal 0 0 0 0 0 0 SO SO ma € C M
Argyrosomus regius (Asso, 1801) Sciaenidae benthopelagic 0 0 0 1 0 0 SC SC ma €€€ C L
Arnoglossus imperialis (Rafinesque, 1810) Bothidae demersal 1 0 0 0 0 0 SC SC ma €€ LC H
Arnoglossus laterna (Walbaum, 1792) Bothidae demersal 1 0 0 0 0 0 SC SC ma €€ C M
Arnoglossus thori Kyle, 1913 Bothidae demersal 1 0 0 0 0 0 SC SC ma €€ LC M
Aspitrigla cuculus (Linnaeus, 1758) Triglidae demersal 0 0 0 1 1 0 SRC SRC ma €€ C M
Atherina boyeri Risso, 1810 Atherinidae demersal 0 0 0 0 0 0 SRC SRC ma € R H
Atherina presbyter Cuvier, 1829 Atherinidae pelagic 0 0 0 0 0 0 SRC SRC ma € VC H
Balistes capriscus Gmelin, 1789 Balistidae reef-associated 0 0 0 1 1 0 SRC SRC inv €€ C H
Belone belone (Linnaeus, 1761) Belonidae pelagic 0 0 0 0 0 0 SRC SRC pi €€ C M
Beryx decadactylus Cuvier, 1829 Berycidae bathydemersal 0 0 0 0 0 0 SRO SRO ma €€ LC L
Blennius ocellaris (Linnaeus, 1758) Blenniidae demersal 0 1 0 0 0 0 RC RC inv € LC M
Boops boops (Linnaeus, 1758) Sparidae demersal 0 0 0 1 1 0 SRC SRC om €€ C M
Bothus podas (Delaroche, 1809) Bothidae demersal 1 0 0 0 0 0 SC SC ma €€ LC H
Brama brama (Bonnaterre, 1788) Bramidae bathypelagic 0 0 0 0 0 0 SRO SRO ma €€ LC L

97
Appendix I (cont.)
Family Functional
guild S-resid. R-resid. I-resid. S-dep. R-dep. I-dep.
Spawning area
Nursery area
Feeding guild
Commercial value
Qualitative abundance
Resilience
Buenia jeffreysii (Günther, 1867) Gobiidae reef-associated 0 0 0 1 1 0 RC RC inv €€ R H
Buglossidium luteum (Risso, 1810) Soleidae demersal 1 0 0 0 0 0 SC SC inv €€ C M
Callanthias ruber (Rafinesque, 1810) Callanthiidae demersal 0 0 0 0 0 0 SRO SRO ma € R M
Callionymus lyra Linnaeus, 1758 Callionymidae demersal 1 0 0 0 1 0 SRO SRO inv € C M
Callionymus maculatus Rafinesque, 1810 Callionymidae demersal 0 0 0 0 0 0 SRO SRO inv € LC H
Callionymus reticulatus Valenciennes, 1837 Callionymidae demersal 1 0 0 0 1 0 SRO SRO inv € LC H
Callionymus risso Lesueur, 1814 Callionymidae demersal 1 0 0 0 1 0 SRO SRO inv € LC H
Capros aper (Linnaeus, 1758) Caproidae demersal 1 0 0 0 0 0 SRO SRO inv € C H
Carcharhinus plumbeus (Nardo, 1827) Carcharhinidae reef-associated 0 0 0 1 1 0 SRO SRO ma €€ R VL
Centrolabrus exoletus (Linnaeus, 1758) Labridae reef-associated 0 1 0 0 0 0 RC RC inv € VC H
Cepola macrophtalma (Linnaeus, 1758) Cepolidae demersal 0 0 0 0 0 0 SRCO SRCO zoo € C M
Chelidonichthys lastoviza (Bonnaterre, 1788) Triglidae demersal 1 0 0 0 1 0 SRC SRC inv €€ C M
Chelidonichthys lucernus (Linnaeus, 1758) Triglidae demersal 1 0 0 0 1 0 SRC SRC ma €€ C L
Chelidonichthys obscurus (Bloch & Schneider, 1801) Triglidae demersal 1 0 0 0 1 0 SRC SRC ma €€ C M
Chelon labrosus (Risso, 1827) Mugilidae demersal 0 0 0 0 0 0 SRC SRC om €€ VC M
Chromis chromis (Linnaeus, 1758) Pomacentridae reef-associated 0 1 0 0 0 0 RC RC inv € C M
Ciliata mustela (Linnaeus, 1758) Lotidae demersal 0 0 0 1 1 1 SC SC inv € LC H
Citharus linguatula (Linnaeus, 1758) Citharidae demersal 1 0 0 0 0 0 SO SC ma €€€ C M
Clinitrachus argentatus (Risso, 1810) Clinidae demersal 0 1 0 0 0 0 RC RC inv € R M
Conger conger (Linnaeus, 1758) Congridae demersal 0 0 0 0 1 0 SRC SRC ma €€ C VL
Coris julis (Linnaeus, 1758) Labridae reef-associated 0 1 0 0 0 0 RC RC inv € VC M
Coryphoblennius galerita (Linnaeus, 1758) Blenniidae demersal 0 1 1 0 0 0 RCI RCI om € VC H
Ctenolabrus rupestris (Linnaeus, 1758) Labridae reef-associated 0 1 0 0 0 0 RC RC ma € VC M
Cubiceps gracilis (Lowe, 1843) Nomeidae pelagic 0 0 0 0 0 0 SRC SRC ma € C M
Dasyatis pastinaca (Linnaeus, 1758) Dasyatidae demersal 1 0 0 0 0 0 SRCO SRCO ma €€ C VL
Deania calcea (Lowe, 1839) Centrophoridae bathydemersal 0 0 0 0 0 0 SRO SRO ma €€ R VL
Deltentosteus quadrimaculatus (Valenciennes, 1837) Gobiidae demersal 1 0 0 0 0 0 RC RC inv € C H
Dentex dentex (Linnaeus, 1758) Sparidae benthopelagic 0 0 0 0 1 0 SRC RC ma €€€ C M
Dentex macrophthalmus (Bloch, 1791) Sparidae benthopelagic 0 0 0 0 1 0 SRC RC ma €€€ C M
Dentex maroccanus (Valenciennes, 1830) Sparidae benthopelagic 0 0 0 0 1 0 SRC RC ma €€€ LC M
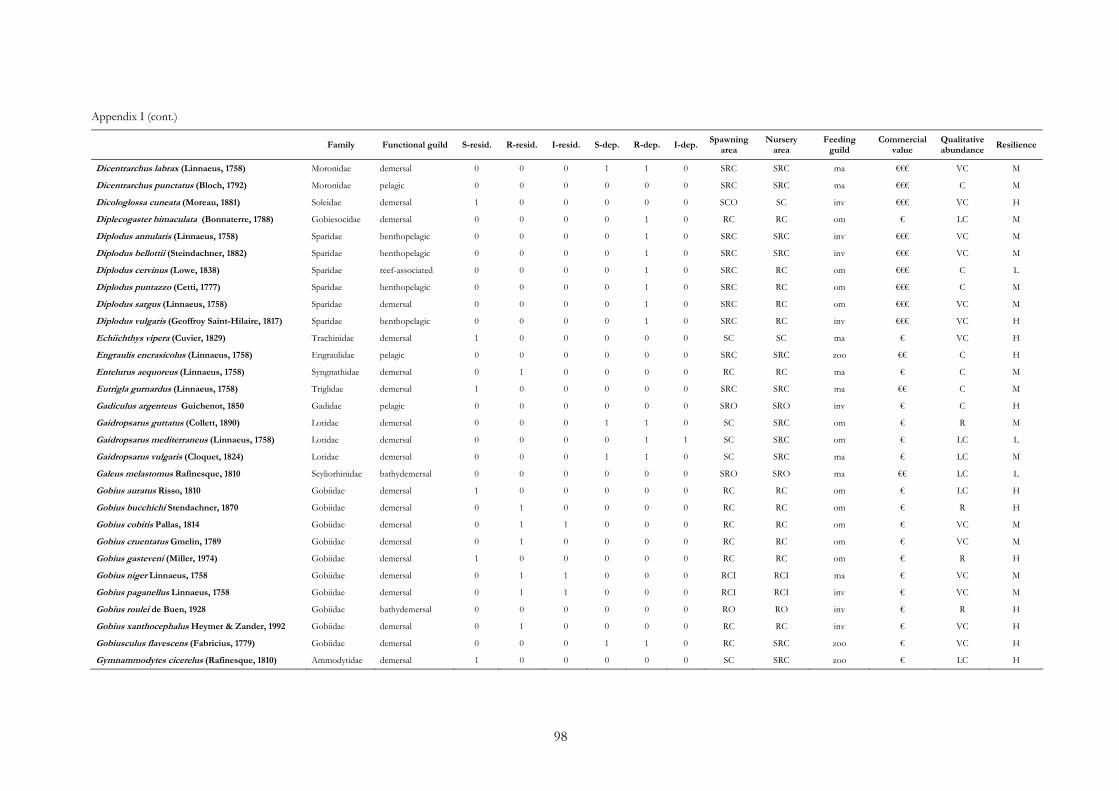
98
Appendix I (cont.) Family Functional guild S-resid. R-resid. I-resid. S-dep. R-dep. I-dep.
Spawning area
Nursery area
Feeding guild
Commercial value
Qualitative abundance
Resilience
Dicentrarchus labrax (Linnaeus, 1758) Moronidae demersal 0 0 0 1 1 0 SRC SRC ma €€€ VC M
Dicentrarchus punctatus (Bloch, 1792) Moronidae pelagic 0 0 0 0 0 0 SRC SRC ma €€€ C M
Dicologlossa cuneata (Moreau, 1881) Soleidae demersal 1 0 0 0 0 0 SCO SC inv €€€ VC H
Diplecogaster bimaculata (Bonnaterre, 1788) Gobiesocidae demersal 0 0 0 0 1 0 RC RC om € LC M
Diplodus annularis (Linnaeus, 1758) Sparidae benthopelagic 0 0 0 0 1 0 SRC SRC inv €€€ VC M
Diplodus bellottii (Steindachner, 1882) Sparidae benthopelagic 0 0 0 0 1 0 SRC SRC inv €€€ VC M
Diplodus cervinus (Lowe, 1838) Sparidae reef-associated 0 0 0 0 1 0 SRC RC om €€€ C L
Diplodus puntazzo (Cetti, 1777) Sparidae benthopelagic 0 0 0 0 1 0 SRC RC om €€€ C M
Diplodus sargus (Linnaeus, 1758) Sparidae demersal 0 0 0 0 1 0 SRC RC om €€€ VC M
Diplodus vulgaris (Geoffroy Saint-Hilaire, 1817) Sparidae benthopelagic 0 0 0 0 1 0 SRC RC inv €€€ VC H
Echiichthys vipera (Cuvier, 1829) Trachinidae demersal 1 0 0 0 0 0 SC SC ma € VC H
Engraulis encrasicolus (Linnaeus, 1758) Engraulidae pelagic 0 0 0 0 0 0 SRC SRC zoo €€ C H
Entelurus aequoreus (Linnaeus, 1758) Syngnathidae demersal 0 1 0 0 0 0 RC RC ma € C M
Eutrigla gurnardus (Linnaeus, 1758) Triglidae demersal 1 0 0 0 0 0 SRC SRC ma €€ C M
Gadiculus argenteus Guichenot, 1850 Gadidae pelagic 0 0 0 0 0 0 SRO SRO inv € C H
Gaidropsarus guttatus (Collett, 1890) Lotidae demersal 0 0 0 1 1 0 SC SRC om € R M
Gaidropsarus mediterraneus (Linnaeus, 1758) Lotidae demersal 0 0 0 0 1 1 SC SRC om € LC L
Gaidropsarus vulgaris (Cloquet, 1824) Lotidae demersal 0 0 0 1 1 0 SC SRC ma € LC M
Galeus melastomus Rafinesque, 1810 Scyliorhinidae bathydemersal 0 0 0 0 0 0 SRO SRO ma €€ LC L
Gobius auratus Risso, 1810 Gobiidae demersal 1 0 0 0 0 0 RC RC om € LC H
Gobius bucchichi Stendachner, 1870 Gobiidae demersal 0 1 0 0 0 0 RC RC om € R H
Gobius cobitis Pallas, 1814 Gobiidae demersal 0 1 1 0 0 0 RC RC om € VC M
Gobius cruentatus Gmelin, 1789 Gobiidae demersal 0 1 0 0 0 0 RC RC om € VC M
Gobius gasteveni (Miller, 1974) Gobiidae demersal 1 0 0 0 0 0 RC RC om € R H
Gobius niger Linnaeus, 1758 Gobiidae demersal 0 1 1 0 0 0 RCI RCI ma € VC M
Gobius paganellus Linnaeus, 1758 Gobiidae demersal 0 1 1 0 0 0 RCI RCI inv € VC M
Gobius roulei de Buen, 1928 Gobiidae bathydemersal 0 0 0 0 0 0 RO RO inv € R H
Gobius xanthocephalus Heymer & Zander, 1992 Gobiidae demersal 0 1 0 0 0 0 RC RC inv € VC H
Gobiusculus flavescens (Fabricius, 1779) Gobiidae demersal 0 0 0 1 1 0 RC SRC zoo € VC H
Gymnammodytes cicerelus (Rafinesque, 1810) Ammodytidae demersal 1 0 0 0 0 0 SC SRC zoo € LC H

99
Appendix I (cont.)
Family Functional guild S-resid. R-resid. I-resid. S-dep. R-dep. I-dep. Spawning
area Nursery
area Feeding
guild Commercial
value Qualitative abundance
Resilience
Gymnammodytes semisquamatus (Jourdain, 1879) Ammodytidae demersal 0 0 0 1 1 0 SC SRC zoo € LC M
Halobatrachus didactylus (Bloch & Schneider, 1801) Batrachoididae demersal 1 0 0 0 0 0 SC SC ma €€ VC L
Helicolenus dactylopterus (Delaroche, 1809) Sebestidae bathydemersal 0 0 0 0 0 0 SO SRO ma €€€ C VL
Hippocampus guttulatus Cuvier, 1829 Syngnathidae demersal 0 1 0 0 0 0 RC RC zoo € LC M
Hippocampus hippocampus (Linnaeus, 1758) Syngnathidae demersal 0 1 0 0 0 0 RC RC zoo € LC H
Hyperoplus lanceolatus (Le sauvage, 1824) Ammodytidae demersal 0 0 0 0 0 0 SC SRC ma € C M
Isurus oxyrinchus Rafinesque, 1810 Lamnidae reef-associated 0 0 0 0 0 0 SRCO SRCO ma €€€ LC VL
Labrus bergylta (Ascanius, 1767) Labridae reef-associated 0 1 0 0 0 0 RC RC om € VC L
Labrus merula Linnaeus, 1758 Labridae reef-associated 0 1 0 0 0 0 RC RC inv € VC M
Labrus mixtus Linnaeus, 1758 Labridae reef-associated 0 1 0 0 0 0 RC RC ma € C L
Labrus viridis Linnaeus, 1758 Labridae reef-associated 0 1 0 0 0 0 RC RC ma € C L
Lebetus guilleti (Le Danois, 1913) Gobiidae reef-associated 0 1 0 0 0 0 RC RC inv € LC H
Lebetus scorpioides (Collett, 1874) Gobiidae reef-associated 1 1 0 0 0 0 RC RC inv € R H
Lepadogaster candollei Risso, 1810 Gobiesocidae demersal 0 1 0 0 0 0 RC RC inv € C M
Lepadogaster lepadogaster (Bonnaterre, 1788) Gobiesocidae demersal 0 1 1 0 0 0 RCI RCI inv € C M
Lepadogaster purpurea (Bonnaterre, 1788) Gobiesocidae demersal 0 1 1 0 0 0 RCI RCI inv € LC M
Lepidopus caudatus (Euphrasen, 1788) Trichiuridae bathydemersal 0 0 0 0 0 0 SRO SRO ma €€€ C M
Lepidorhombus boscii (Risso, 1810) Scophthalmidae demersal 1 0 0 0 0 0 SCO SC ma €€€ LC M
Lepidorhombus whiffiagonis (Walbaum, 1792) Scophthalmidae bathydemersal 1 0 0 0 0 0 SO SO ma €€€ C L
Lepidotrigla cavillone (Lacepède, 1801) Triglidae demersal 1 0 0 0 0 0 SRCO SRC inv €€ C H
Lepidotrigla dieuzeidei Blanc & Hureau, 1973 Triglidae demersal 1 0 0 0 0 0 SRCO SRC inv €€ LC H
Lepomis gibbosus (Linnaeus, 1758) Centrarchidae benthopelagic 0 0 0 0 0 0 0 0 ma €€ R M
Lesueurigobius sanzi (de Buen, 1918) Gobiidae demersal 0 0 0 0 0 0 SO SO inv € R H
Leucoraja fullonica (Linnaeus, 1758) Rajidae bathydemersal 1 0 0 0 0 0 SO SO ma €€ R L
Leucoraja naevus (Müller & Henle, 1841) Rajidae demersal 1 0 0 0 0 0 SO SO ma €€ LC L
Lichia amia (Linnaeus, 1758) Carangidae pelagic 0 0 0 0 0 0 SRC SRC ma €€ LC M
Lipophrys canevae (Vinciguerra, 1880) Blenniidae demersal 0 1 1 0 0 0 RCI RCI om € LC H
Lipophrys pholis (Linnaeus, 1758) Blenniidae demersal 0 1 1 0 0 0 RCI RCI om € VC M
Lithognathus mormyrus (Linnaeus, 1758) Sparidae demersal 1 0 0 0 0 0 SRC SRC inv €€€ C M

100
Appendix I (cont.)
Family Functional
guild S-resid. R-resid. I-resid. S-dep. R-dep. I-dep.
Spawning area
Nursery area
Feeding guild
Commercial value
Qualitative abundance Resilience
Liza aurata (Risso, 1810) Mugilidae pelagic 0 0 0 0 0 0 SRC SRC om €€ VC M
Liza ramada (Risso, 1810) Mugilidae pelagic 0 0 0 0 0 0 SRC SRC om €€ VC L
Liza saliens (Risso, 1810) Mugilidae pelagic 0 0 0 0 0 0 SRC SRC om €€ C M
Lophius piscatorius Linnaeus, 1758 Lophiidae bathydemersal 1 0 0 0 0 0 SCO SCO ma €€€ C L
Macroramphosus gracilis (Lowe, 1839) Centriscidae pelagic 0 0 0 0 0 0 SRCO SRCO inv € R H
Macroramphosus scolopax (Linnaeus, 1758) Centriscidae pelagic 0 0 0 0 0 0 SRCO SRCO inv € VC M
Malacocephalus laevis (Lowe, 1843) Macrouridae bathydemersal 0 0 0 0 0 0 SRO SRO ma € R L
Maurolicus muelleri (Gmelin, 1789) Sternoptychidae bathypelagic 0 0 0 0 0 0 SRO SRO inv € LC M
Merlangius merlangus (Linnaeus, 1758) Gadidae benthopelagic 0 0 0 1 1 0 SRCO SRCO ma €€ R M
Merluccius merluccius (Linnaeus, 1758) Merlucciidae demersal 1 0 0 0 0 0 SCO SC ma €€€ C L
Microchirus azevia (Brito Capello, 1867) Soleidae demersal 1 0 0 0 0 0 SC SC inv €€ C H
Microchirus boscanion (Chabanaud, 1926) Soleidae demersal 1 0 0 0 0 0 SC SC inv € R H
Microchirus ocellatus (Linnaeus, 1758) Soleidae demersal 1 0 0 0 0 0 SC SC inv € R H
Microchirus variegatus (Donovan, 1808) Soleidae demersal 1 0 0 0 0 0 SCO SC inv €€ C M
Micromesistius poutassou (Risso, 1827) Gadidae pelagic 0 0 0 0 0 0 SRCO SRCO ma €€ VC M
Micropterus salmoides (Lacepède, 1802) Centrarchidae benthopelagic 0 0 0 0 0 0 0 0 ma €€ R L
Mola mola (Linnaeus, 1758) Molidae pelagic 0 0 0 0 0 0 SRCO SRCO om €€ C L
Molva molva (Linnaeus, 1758) Lotidae demersal 0 0 0 0 0 0 SRO SRO ma €€ LC L
Monochirus hispidus Rafinesque, 1814 Soleidae demersal 1 0 0 0 0 0 SC SC inv €€ C H
Mugil cephalus Linnaeus, 1758 Mugilidae benthopelagic 0 0 0 1 1 0 SRC SRC ma €€ VC M
Mullus barbatus Linnaeus, 1758 Mullidae demersal 1 0 0 0 0 0 SRC SRC inv €€€ VC M
Mullus surmuletus Linnaeus, 1758 Mullidae demersal 1 0 0 0 0 0 SRC SRC ma €€€ VC M
Muraena helena (Linnaeus, 1758) Muraenidae reef-associated 0 1 0 0 0 0 RC RC ma €€ LC M
Mustelus mustelus (Linnaeus, 1758) Triakidae demersal 0 0 0 0 0 0 SRCO SRCO ma €€ C VL
Myliobatis aquila (Linnaeus, 1758) Myliobatidae benthopelagic 1 0 0 0 0 0 SC SCO ma €€ LC VL
Nerophis lumbriciformis (Jenyns, 1835) Syngnathidae demersal 0 1 0 0 0 1 RCI RCI ma € C M
Nerophis ophidion (Linnaeus, 1758) Syngnathidae demersal 0 1 0 0 0 1 RCI RCI ma € C H
Oblada melanura (Linnaeus, 1758) Sparidae benthopelagic 0 0 0 0 1 0 SRC RC om €€ C M
Ophisurus serpens (Linnaeus, 1758) Ophichthidae reef-associated 1 0 0 0 0 0 SO SO ma € C VL

101
Appendix I (cont.)
Family Functional guild S-resid. R-resid. I-resid. S-dep. R-dep. I-dep. Spawning area
Nursery area
Feeding guild
Commercial value
Qualitative abundance
Resilience
Oxynotus centrina (Linnaeus, 1758) Dalatiidae bathydemersal 0 0 0 0 0 0 SRO SRO inv €€ R VL
Pagellus acarne (Risso, 1827) Sparidae benthopelagic 0 0 0 0 1 0 SRC RC ma €€€ C M
Pagellus bellottii Steinsachner, 1882 Sparidae benthopelagic 0 0 0 0 1 0 SRC RC ma €€ R M
Pagellus bogaraveo (Brünnich, 1768) Sparidae benthopelagic 0 0 0 0 1 0 SRC RC ma €€€ C L
Pagellus erythrinus (Linnaeus, 1758) Sparidae benthopelagic 0 0 0 0 1 0 SRC RC ma €€€ C M
Pagrus auriga Valenciennes, 1843 Sparidae benthopelagic 0 0 0 0 1 0 SRC RC inv €€ C VL
Pagrus caeruleostictus (Valenciennes, 1830) Sparidae benthopelagic 0 0 0 0 1 0 SRC RC ma €€€ C M
Pagrus pagrus (Linnaeus, 1758) Sparidae benthopelagic 0 0 0 0 1 0 SRC RC ma €€€ C M
Parablennius gattorugine (Linnaeus, 1758) Blenniidae demersal 0 1 1 0 0 0 RC RC om € VC H
Parablennius incognitus (Bath, 1968) Blenniidae demersal 0 1 0 0 0 0 RC RC om € LC H
Parablennius pilicornis (Cuvier, 1829) Blenniidae demersal 0 1 1 0 0 0 RC RC he € VC H
Parablennius rouxi (Cocco, 1833) Blenniidae demersal 1 1 0 0 0 0 RC RC om € C H
Parablennius ruber (Valenciennes, 1836) Blenniidae demersal 0 1 0 0 0 0 RC RC om € R H
Parablennius sanguinolentus (Pallas, 1814) Blenniidae demersal 0 1 1 0 0 0 RC RC he € LC M
Paralipophrys trigloides (Valenciennes, 1836) Blenniidae demersal 0 1 1 0 0 0 RCI RCI om € VC H
Phycis phycis (Linnaeus, 1766) Phycidae benthopelagic 0 0 0 1 1 0 SRC SRC inv €€ C M
Platichthys flesus (Linnaeus, 1758) Pleuronectidae demersal 1 0 0 0 0 0 SCO SC ma €€€ C M
Plectorhinchus mediterraneus (Guichenot, 1850) Haemulidae demersal 1 0 0 0 0 0 SRCO SRCO inv €€ R M
Pleuronectes platessa Linnaeus, 1758 Pleuronectidae demersal 1 0 0 0 0 0 SC SC inv €€€ R L
Pollachius pollachius (Linnaeus, 1758) Gadidae benthopelagic 0 0 0 0 0 0 SRCO SRCO inv €€ C M
Pomadasys incisus (Bowdich, 1825) Haemulidae demersal 0 0 0 1 1 0 SRC SRC inv €€ LC M
Pomatomus saltatrix (Linnaeus, 1766) Pomatomidae pelagic 0 0 0 0 0 0 SRCO SRCO ma € LC M
Pomatoschistus knerii (Steindachner, 1861) Gobiidae demersal 0 0 0 1 1 0 SRC SRC inv € R H
Pomatoschistus lozanoi (de Buen, 1923) Gobiidae demersal 0 0 0 1 1 0 SRC SRC inv € C H
Pomatoschistus marmoratus (Risso, 1810) Gobiidae demersal 1 0 0 0 0 0 SRC SRC inv € C H
Pomatoschistus microps (Krøyer 1838) Gobiidae demersal 0 0 0 1 0 0 SRC SRC inv € C H
Pomatoschistus minutus (Pallas, 1770) Gobiidae demersal 0 0 0 1 0 0 SRC SRC inv € VC H
Pomatoschistus pictus (Malm, 1865) Gobiidae demersal 1 0 0 0 0 0 SRC SRC inv € VC H
Pseudocaranx dentex (Bloch & Schneider, 1801) Carangidae reef-associated 0 0 0 1 1 0 SRC SRC inv €€ C M

102
Appendix I (cont.)
Family Functional guild S-resid. R-resid. I-resid. S-dep. R-dep. I-dep. Spawning areaNursery
area Feeding
guild Commercial
value Qualitative abundance
Resilience
Raja brachyura Lafont, 1873 Rajidae demersal 1 0 0 0 0 0 SRCO SCO ma €€ C L
Raja clavata Linnaeus, 1758 Rajidae demersal 1 0 0 0 0 0 SRCO SCO ma €€ C L
Raja microocellata Montagu, 1818 Rajidae demersal 1 0 0 0 0 0 SRCO SCO pi €€ C L
Raja miraletus Linnaeus, 1758 Rajidae demersal 1 0 0 0 0 0 SRCO SCO ma €€ C L
Raja montagui Fowler, 1910 Rajidae demersal 1 0 0 0 0 0 SRCO SCO inv €€ C L
Raja undulata Lacepède, 1802 Rajidae demersal 1 0 0 0 0 0 SRCO SCO ma €€ C L
Raniceps raninus (Linnaeus, 1758) Gadidae demersal 0 0 0 0 1 0 SRC SRC ma € LC M
Sarda sarda (Bloch, 1793) Scombridae pelagic 0 0 0 0 0 0 SRCO SRCO ma €€ LC M
Sardina pilchardus (Walbaum, 1792) Clupeidae pelagic 0 0 0 0 0 0 SRCO SRCO zoo €€ VC M
Sardinella aurita Valenciennes, 1847 Clupeidae reef-associated 0 0 0 0 0 0 SRCO SRCO zoo €€ C H
Sarpa salpa (Linnaeus, 1758) Sparidae benthopelagic 0 1 0 0 0 0 SRC RC he €€ VC M
Scomber japonicus Houttuyn, 1782 Scombridae pelagic 0 0 0 0 0 0 SRC SRC ma €€ VC M
Scomber scombrus Linnaeus, 1758 Scombridae pelagic 0 0 0 0 0 0 SRCO SRCO ma €€ VC M
Scophthalmus maximus (Linnaeus, 1758) Scophthalmidae demersal 1 0 0 0 0 0 SCO SC ma €€€ C M
Scophthalmus rhombus (Linnaeus, 1758) Scophthalmidae demersal 1 0 0 0 0 0 SCO SC ma €€€ VC M
Scorpaena notata Rafinesque, 1810 Scorpaenidae demersal 0 1 0 0 0 0 RC RC ma € VC M
Scorpaena porcus Linnaeus, 1758 Scorpaenidae demersal 0 1 0 0 0 0 RC RC ma € VC M
Scorpaena scrofa Linnaeus, 1758 Scorpaenidae demersal 0 0 0 1 1 0 SRC SRC ma € VC H
Scyliorhinus canicula (Linnaeus, 1758) Scyliorhinidae demersal 1 0 0 0 1 0 SRC SRC ma €€ VC L
Scyliorhinus stellaris (Linnaeus, 1758) Scyliorhinidae reef-associated 1 0 0 0 1 0 SRC SRC ma €€ LC L
Seriola dumerili (Risso, 1810) Carangidae reef-associated 0 0 0 0 0 0 SRCO SRCO ma €€ LC M
Serranus atricauda (Günther, 1874) Serranidae demersal 0 1 0 0 0 0 SRC RC ma € LC L
Serranus cabrilla (Linnaeus, 1758) Serranidae demersal 0 1 0 0 0 0 SRC RC ma € VC M
Serranus hepatus (Linnaeus, 1758) Serranidae demersal 0 1 0 0 0 0 SRC RC ma € VC M
Serranus scriba (Linnaeus, 1758) Serranidae demersal 0 1 0 0 0 0 SRC RC ma € C M
Solea lascaris (Risso, 1810) Soleidae demersal 1 0 0 0 0 0 SCO SC inv €€€ VC M
Solea senegalensis Kaup, 1858 Soleidae demersal 1 0 0 0 0 0 SC SC inv €€€ VC L
Solea solea (Linnaeus, 1758) Soleidae demersal 1 0 0 0 0 0 SCO SC inv €€€ VC M
Sparus aurata Linnaeus, 1758 Sparidae demersal 0 1 0 0 0 0 SRC RC om €€€ VC M
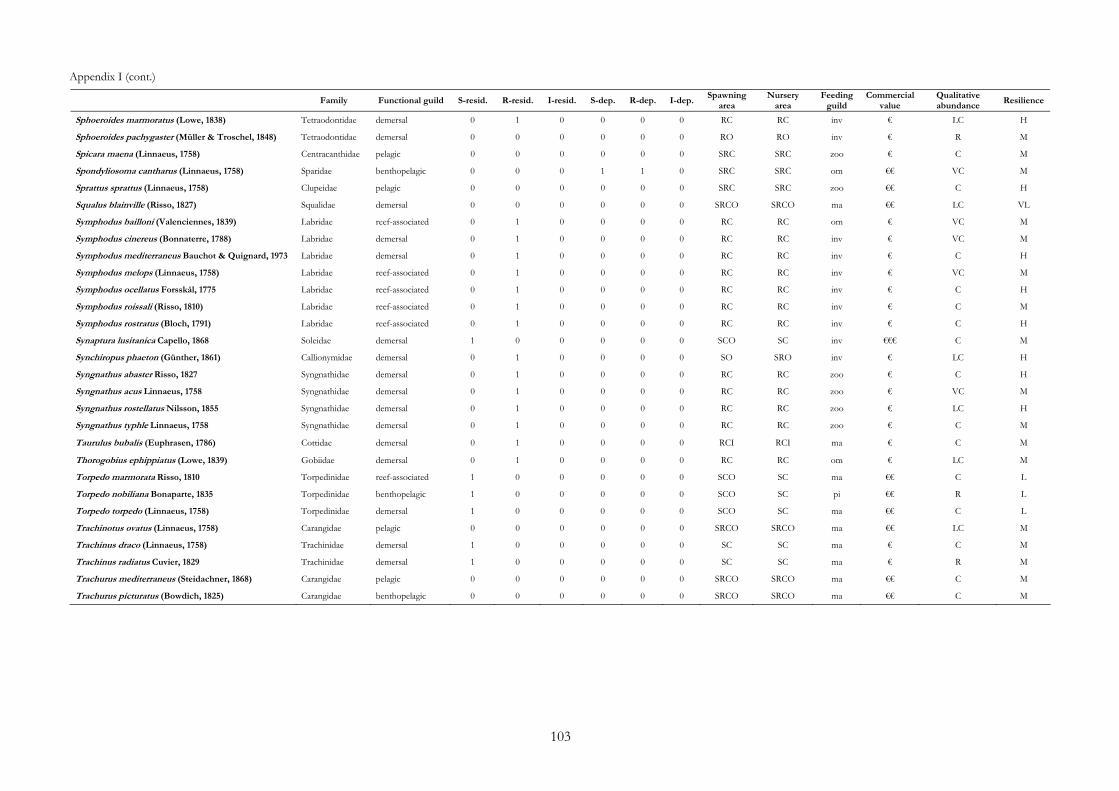
103
Appendix I (cont.)
Family Functional guild S-resid. R-resid. I-resid. S-dep. R-dep. I-dep. Spawning
area Nursery
area Feeding
guild Commercial
value Qualitative abundance
Resilience
Sphoeroides marmoratus (Lowe, 1838) Tetraodontidae demersal 0 1 0 0 0 0 RC RC inv € LC H
Sphoeroides pachygaster (Müller & Troschel, 1848) Tetraodontidae demersal 0 0 0 0 0 0 RO RO inv € R M
Spicara maena (Linnaeus, 1758) Centracanthidae pelagic 0 0 0 0 0 0 SRC SRC zoo € C M
Spondyliosoma cantharus (Linnaeus, 1758) Sparidae benthopelagic 0 0 0 1 1 0 SRC SRC om €€ VC M
Sprattus sprattus (Linnaeus, 1758) Clupeidae pelagic 0 0 0 0 0 0 SRC SRC zoo €€ C H
Squalus blainville (Risso, 1827) Squalidae demersal 0 0 0 0 0 0 SRCO SRCO ma €€ LC VL
Symphodus bailloni (Valenciennes, 1839) Labridae reef-associated 0 1 0 0 0 0 RC RC om € VC M
Symphodus cinereus (Bonnaterre, 1788) Labridae demersal 0 1 0 0 0 0 RC RC inv € VC M
Symphodus mediterraneus Bauchot & Quignard, 1973 Labridae demersal 0 1 0 0 0 0 RC RC inv € C H
Symphodus melops (Linnaeus, 1758) Labridae reef-associated 0 1 0 0 0 0 RC RC inv € VC M
Symphodus ocellatus Forsskål, 1775 Labridae reef-associated 0 1 0 0 0 0 RC RC inv € C H
Symphodus roissali (Risso, 1810) Labridae reef-associated 0 1 0 0 0 0 RC RC inv € C M
Symphodus rostratus (Bloch, 1791) Labridae reef-associated 0 1 0 0 0 0 RC RC inv € C H
Synaptura lusitanica Capello, 1868 Soleidae demersal 1 0 0 0 0 0 SCO SC inv €€€ C M
Synchiropus phaeton (Günther, 1861) Callionymidae demersal 0 1 0 0 0 0 SO SRO inv € LC H
Syngnathus abaster Risso, 1827 Syngnathidae demersal 0 1 0 0 0 0 RC RC zoo € C H
Syngnathus acus Linnaeus, 1758 Syngnathidae demersal 0 1 0 0 0 0 RC RC zoo € VC M
Syngnathus rostellatus Nilsson, 1855 Syngnathidae demersal 0 1 0 0 0 0 RC RC zoo € LC H
Syngnathus typhle Linnaeus, 1758 Syngnathidae demersal 0 1 0 0 0 0 RC RC zoo € C M
Taurulus bubalis (Euphrasen, 1786) Cottidae demersal 0 1 0 0 0 0 RCI RCI ma € C M
Thorogobius ephippiatus (Lowe, 1839) Gobiidae demersal 0 1 0 0 0 0 RC RC om € LC M
Torpedo marmorata Risso, 1810 Torpedinidae reef-associated 1 0 0 0 0 0 SCO SC ma €€ C L
Torpedo nobiliana Bonaparte, 1835 Torpedinidae benthopelagic 1 0 0 0 0 0 SCO SC pi €€ R L
Torpedo torpedo (Linnaeus, 1758) Torpedinidae demersal 1 0 0 0 0 0 SCO SC ma €€ C L
Trachinotus ovatus (Linnaeus, 1758) Carangidae pelagic 0 0 0 0 0 0 SRCO SRCO ma €€ LC M
Trachinus draco (Linnaeus, 1758) Trachinidae demersal 1 0 0 0 0 0 SC SC ma € C M
Trachinus radiatus Cuvier, 1829 Trachinidae demersal 1 0 0 0 0 0 SC SC ma € R M
Trachurus mediterraneus (Steidachner, 1868) Carangidae pelagic 0 0 0 0 0 0 SRCO SRCO ma €€ C M
Trachurus picturatus (Bowdich, 1825) Carangidae benthopelagic 0 0 0 0 0 0 SRCO SRCO ma €€ C M
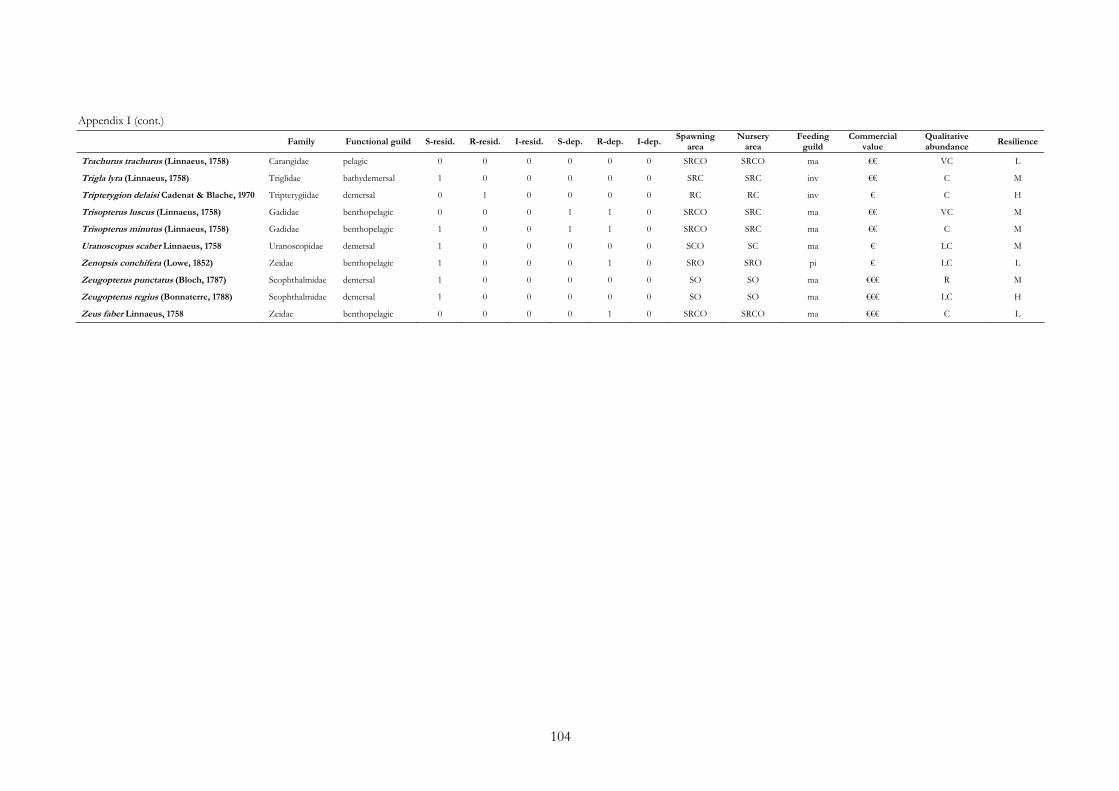
104
Appendix I (cont.)
Family Functional guild S-resid. R-resid. I-resid. S-dep. R-dep. I-dep. Spawning
area Nursery
area Feeding
guild Commercial
value Qualitative abundance
Resilience
Trachurus trachurus (Linnaeus, 1758) Carangidae pelagic 0 0 0 0 0 0 SRCO SRCO ma €€ VC L
Trigla lyra (Linnaeus, 1758) Triglidae bathydemersal 1 0 0 0 0 0 SRC SRC inv €€ C M
Tripterygion delaisi Cadenat & Blache, 1970 Tripterygiidae demersal 0 1 0 0 0 0 RC RC inv € C H
Trisopterus luscus (Linnaeus, 1758) Gadidae benthopelagic 0 0 0 1 1 0 SRCO SRC ma €€ VC M
Trisopterus minutus (Linnaeus, 1758) Gadidae benthopelagic 1 0 0 1 1 0 SRCO SRC ma €€ C M
Uranoscopus scaber Linnaeus, 1758 Uranoscopidae demersal 1 0 0 0 0 0 SCO SC ma € LC M
Zenopsis conchifera (Lowe, 1852) Zeidae benthopelagic 1 0 0 0 1 0 SRO SRO pi € LC L
Zeugopterus punctatus (Bloch, 1787) Scophthalmidae demersal 1 0 0 0 0 0 SO SO ma €€€ R M
Zeugopterus regius (Bonnaterre, 1788) Scophthalmidae demersal 1 0 0 0 0 0 SO SO ma €€€ LC H
Zeus faber Linnaeus, 1758 Zeidae benthopelagic 0 0 0 0 1 0 SRCO SRCO ma €€€ C L