
Trabalho de Conclusão de Curso- Marcio Oshiro · iii Resumo Oshiro, M. Relacionamento entre as...
57
UNIVERSIDADE DE SÃO PAULO ESCOLA DE ENGENHARIA DE SÃO CARLOS DEPARTAMENTO DE ENGENHARIA DE PRODUÇÃO LEIBNIZ UNIVERSITÄT HANNOVER INSTITUT FÜR FABRIKANLAGEN UND LOGISTIK RELACIONAMENTO ENTRE AS DIMENSÕES CULTURAIS E OS INDICADORES DE DESEMPENHO LOGÍSTICO MARCIO SILVA OSHIRO ORIENTADORES: PROF. DR. FERNANDO CÉSAR ALMADA DOS SANTOS DIPL.- WIRTSCH.-ING. SEBASTIAN BERTSCH HANNOVER 2012
Transcript of Trabalho de Conclusão de Curso- Marcio Oshiro · iii Resumo Oshiro, M. Relacionamento entre as...
UNIVERSIDADE DE SÃO PAULO
ESCOLA DE ENGENHARIA DE SÃO CARLOS
DEPARTAMENTO DE ENGENHARIA DE PRODUÇÃO
LEIBNIZ UNIVERSITÄT HANNOVER
INSTITUT FÜR FABRIKANLAGEN UND LOGISTIK
RELACIONAMENTO ENTRE AS DIMENSÕES CULTURAIS E OS INDICADORES DE
DESEMPENHO LOGÍSTICO
MARCIO SILVA OSHIRO
ORIENTADORES: PROF. DR. FERNANDO CÉSAR ALMADA DOS SANTOS
DIPL.- WIRTSCH.-ING. SEBASTIAN BERTSCH
HANNOVER
2012
SÃO PAULO UNIVERSITY
ENGINEERING SCHOOL OF SÃO CARLOS
MECHANICAL PRODUCTION ENGINEERING DEPARTMENT
LEIBNIZ UNIVERSITY OF HANNOVER
INSTITUTE FOR PRODUCTION SYSTEMS AND LOGISTICS
RELATIONSHIP BETWEEN THE CULTURAL DIMENSIONS AND THE LOGISTICS
KEY PERFORMANCE INDICATORS
MARCIO SILVA OSHIRO
TUTORS: PROF. DR. FERNANDO CÉSAR ALMADA DOS SANTOS
DIPL.- WIRTSCH.-ING. SEBASTIAN BERTSCH
HANNOVER
2012

i
DEDICATÓRIA
À minha família, Eliane, Sergio e Aline Oshiro pelo
apoio dado desde minha formação até a conclusão de
meus estudos, pelos bons exemplos e esforço feito para
que eu conseguisse aproveitar as oportunidades
importantes surgidas no decorrer de minha vida.
ii
Special Thanks
To Professor Fernando César Almada dos Santos, whose dedication and attention with the
Students of the Mechanical Production Engineering of the University of São Paulo- São
Carlos was always exemplar and outstripped the level of work obligations. Thanks also for the
support with this thesis and the selection for the exchange program to the Leibniz University
of Hannover, that permitted this thesis to took form. Also to Diego Fogaça, who in association
with professor Fernando collaborated to correct and guideline this project.
To the Professor Sebastian Bertsch for the collaboration in important matters for this
assignment. Thanks also for the support and friendship during my stay in Germany.
To my family for all the support and struggle to educate and give me the possibilities to
develop as a person and as a professional.
To all the friends that I met in Germany and I still miss enormously specially Fabio Reway,
Imke Snorkfräulein, Julia Helmert and Thomas Beck for the support in bad and good
moments.
To all the friends that supported and motivated me during my education and life specially
André Cardoso, André Paschoal, Hugo Bastos, Gabriel Mantese, Rafael Querino and Ramon
Fachini.
iii
Resumo
Oshiro, M. Relacionamento entre as dimensões culturais e os indicadores de desempenho
logístico. 2012. Trabalho de Conclusão de Curso – Escola de Engenharia de São Carlos,
Universidade de São Paulo, São Carlos, 2012.
O conceito de cultura está presente em todo indivíduo ou coletivo. O modo como as pessoas
ou coletividades definem seus objetivos e tentam alcançá-los, interagem entre si ou com o
meio em que estão, passa sem dúvida por sua maneira de agir ou cultura. Não é de se
estranhar então, que a cultura de uma organização altere seu desempenho de diversos modos.
Muitas empresas hoje em dia entendem isso e tentam moldar seus chamados “valores
organizacionais” com vista no desempenho que desejam alcançar em diversos segmentos. O
desempenho logístico encontra-se em meio a isso, envolvendo, por sua característica
existencial, interações entre funções empresariais e organizações distintas, e segmentos de
mercado diferentes. O conceito de cultura pode ser mais bem entendido por sua divisão em
dimensões culturais, entre elas, baixa versus alta distância do poder, feminilidade versus
masculinidade, coletivismo versus individualismo, baixa versus alta aversão à incerteza e
orientação de longo versus curto prazo. Como essas dimensões culturais afetam o
desempenho logístico e como uma empresa pode se beneficiar com tal conhecimento é então
de grande importância e tema deste estudo teórico. Neste trabalho foi realizada também uma
comparação entre as culturas nacionais de Alemanha e Brasil e discutido quais as vantagens
que cada país poderia ter em relação ao desempenho logístico de suas empresas. Criou-se
também uma base teórica com a adoção de um modelo de indicadores de desempenho
logístico para que futuros estudos práticos possam mensurar com mais exatidão a
interferência da cultura no desempenho logístico de empresas.
Palavras-chave: Cultura organizacional, Cultura Nacional, Indicadores de Desempenho
Logístico.
iv
Abstract
Oshiro, M. Relationship between the cultural dimensions and the logistics key
performance indicators. 2012. Graduation Final Paper- Engineering School of São Carlos,
São Paulo University, São Carlos, 2012.
The concept of culture is present in every individual or collective. The way that people or
collectivities define their objective and try to achieve them, how they interact with each other
or with their environment, depends on their manner of acting or by their culture. It is no
surprise then that organizational culture can influence on a company’s performance in many
ways. A great number of firms nowadays understand that and try to build their so-called
“organizational values” in order to accomplish the performance desired in various segments.
The logistics performance of a company stands at the middle of this, comprehending, by its
existential characteristics, interactions between different organizational functions,
organizations and market segments. The concept of culture can be better understood when
divided in cultural dimensions, among them, high versus low power distance, femininity
versus masculinity, collectivism versus individualism, high versus low uncertainty avoidance
and long- versus short- term orientation. How this cultural dimensions impact on the logistics
performance and how a company can benefit from this knowledge is a very important matter
and the theme of this theoretical study. In this work was realized also a comparison between
the national cultures of Brazil and Germany and it was discussed, which advantages each
country could have in respect of the logistics performance of its companies. Moreover, it was
created a theoretical basis with the adoption of a logistics performance indicators model in
order to provide future practical studies the chance of measuring more exactly the interference
of the culture on the logistical performance of companies.
Keywords: Organizational Culture, National Culture, Logistics Performance Indicators.
v
Table of Contents
1. Introduction .......................................................................................................................... 1
2. Objectives .............................................................................................................................. 2
3. Thesis structure .................................................................................................................... 3
4. Methods ................................................................................................................................. 3
5. Literature Review ................................................................................................................. 4
5.1 Organizational and National Culture ................................................................................ 4
5.2 Cultural Dimensions ......................................................................................................... 5
5.2.1 Power Distance .......................................................................................................... 6
5.2.2 Uncertainty Avoidance .............................................................................................. 7
5.2.3 Individualism and Collectivism ................................................................................ 8
5.2.4 Masculinity and Femininity ..................................................................................... 10
5.2.5 Long- versus Short- Term Orientation .................................................................... 10
5.3 Brazil Cultural Dimensions ............................................................................................ 11
5.4 Germany Cultural Dimensions ....................................................................................... 12
5.5 Logistics ......................................................................................................................... 13
5.6 Logistics Key Process Indicators .................................................................................... 15
6. Results and Discussions ...................................................................................................... 20
6.1 Relationship between Cultural Dimensions and High Availability ............................... 21
6.1.1 High Availability Indicators .................................................................................... 22
6.2 Relationship between Cultural Dimensions and Low Lead Time .................................. 23
6.2.1 Low Lead Time Indicators ...................................................................................... 25
6.3 Relationship between Cultural Dimensions and High Productivity ............................... 26
6.3.1 High Productivity Indicators ................................................................................... 29
6.4 Relationship between Cultural Dimensions and High Delivery Service ........................ 30
6.4.1 High Delivery Service Indicators ............................................................................ 32
6.5 Relationship between Cultural Dimensions and Low Stock Costs ................................ 33
6.5.1 Low Stock Costs Indicators ..................................................................................... 36
6.6 Relationship between Cultural Dimensions and Low Process Costs ............................. 37
6.6.1 Low Process Costs Indicators .................................................................................. 39
6.7 Comparison between Brazil and Germany concerning the Logistics Performance ....... 40
7. Conclusions ......................................................................................................................... 44
8. Final Considerations .......................................................................................................... 46
1
1. Introduction
Business logistics deals with all move and store activities that facilitate product flow from the
point of raw-material acquisition to the point of final consumption, as well as the information
flows that set the product in motion for providing adequate levels of consumer service at a
reasonable cost (BALLOU, 1987). Logistics is therefore an integrative, complex and wide-
reaching area, since the movement activity impacts in marketing, production, distribution,
purchasing, etc. It may be necessary that these areas operate sub-optimally, in order that the
role system can work more effectively (CHRISTOPHER,1973).
According to Nilsson (2006), “complexity in logistics is often defined out of quantifiable
measures and based on the notion of numerous actors or parts which are interconnected.” The
highly competitive environment along with customers’ demands for tailored products and
services has forced companies to continuously evaluate, improve and reengineer their
logistics operations (GOTZAMANI; LONGINIDIS; VOUZAS, 2010).
This necessity of quantifiable measure on logistical performance made companies adopt
process indicators models to evaluate their logistics and, if possible, identify improvements.
Process indicators are absolute or comparative values or magnitudes that are used to observe
the situation of a company in a point or period of time (LUCZAK; WEBER; WIENDAHL,
2004, Translation by the author)
Among other factors, the performance of a company is influenced by its organizational
culture and the national culture of its employees. Hofstede (1980) defines culture as “the
collective mental programming of the people in an environment.”
Hofstede (2001) also proposes five cultural dimensions to analyze the differences and
similarities of the cultures across nations and organizations: high versus low power distance,
femininity versus masculinity, collectivism versus individualism, high versus low uncertainty
avoidance and long- versus short- term orientation.
2
2. Objectives
The objective of this research project is to identify the relation between Hofstede’s cultural
dimensions and logistics Key Process Indicators (KPIs). This assignment will focus on
analyzing the influence that these cultural dimensions have on logistics KPIs and the
advantages and disadvantages that Germany and Brazil could have in comparison to each
other in terms of their national culture when related to the logistics KPIs.
The relationship between the cultural dimensions and the logistics performance indicators is
believed to be an interesting topic of study because of the easy measurement, widespread use
in the companies and practical possibility of utilization of KPIs for the companies to achieve
better efficiency and efficacy on its logistics performance. The relationship is considered to
add a practical characteristic to the use of the concept of culture (national and organizational)
by the companies, which is extremely important in a globalized world, when trying to be more
competitive in logistics.
Furthermore, it is also aim of this study to create a consistent theoretical basis for a future
practical work that would compare the logistics KPIs of a German and a Brazilian company
and help understanding how organizational culture can be used to improve the company’s
logistics performance. The use of the performance indicators by this work would have,
therefore, a focus on the selection of a model of KPIs that is simple enough to be carefully
related to the culture dimensions and to be easily implemented on companies, but also
comprehensive enough to evaluate the logistics performance of a company in general.
3
3. The structure of this End of Course Assignment
The arrangement of this thesis was organized chronologically to the research that developed
and took form to achieve the objectives described before. As a result, it has a structure that is
easy to comprehend.
The fourth topic named Methods presents the methodology used in this work to develop the
thesis and achieve the desired results and objectives.
The fifth topic is the literature review and presents the theoretical background to understand
this thesis. The themes are organizational and national culture, cultural dimensions, Germany
and Brazil cultural dimensions, logistics and logistics key performance indicators.
The sixth topic presents the results and discussions of this paper. It presents the relationships
found between the cultural dimensions and the logistics key process indicators of the model
adopted, through the logistical objectives to which they are related. A further description of
each of the logistics KPIs adopted is made. At the end of this chapter, a comparison of the
Brazilian and German culture in terms of the expected logistics performance of the companies
in both countries is done.
The seventh topic presents the conclusion of the author about the results achieved by the
thesis. It discusses the importance of the results to the companies and suggestions about how
to use them, the limitations of the thesis and further studies suggestions to complement the
research and finally the comments of the author about the conclusion of the objectives defined
for this study.
The eighth topic presents the final considerations of the author about this thesis. This topic is
then followed by the references used to do this research.
4. Methods
As a theoretical work, this bachelor thesis will find out the relationships between Hofstede’s
cultural dimensions and the logistics KPIs following the steps mentioned below. During the
literature review, several books and articles of renowned journals will be consulted.
4
First, a literature review of cultural dimensions will be made, in order to understand how
culture in societies can be better analyzed and how they differ and have similarities in the
countries that are the main theme of this study: Brazil and Germany.
A literature review of logistics will be made subsequently, to define important concepts used
to build this study.
Afterwards, literature of logistics key process indicators will be reviewed, with the purpose of
finding a model that enables the comparison of its indicators with Hofstede’s cultural
dimensions and a future comparison between a Brazilian and a German company regarding
their performance in logistics and organizational culture.
Based on this theoretical ground, it will be possible to analyze the influence of the cultural
dimension on the logistics KPIs used, check which advantages and disadvantages Brazil and
Germany have, as their national culture influences their companies’ logistical performance
and finally discuss how a company can use this knowledge to acquire better results in logistics.
5. Literature Review
5.1 Organizational and National Culture
According to Hofstede (2001), “culture is defined as collective programming of the mind; it
manifests itself not only in values but in more superficial ways: in symbols, heroes and
rituals”. As a collective feature, culture is present in each group of people that share common
characteristics, objectives or occupations. This research project, however, will focus on the
differences and similarities of cultures between countries and organizations.
The term culture should be reserved for the deeper level of basic assumptions and beliefs that
are shared by members of an organization, that operate unconsciously and that define in a
basic “taken-for-granted” fashion an organization’s view on its own and over its environment
(SCHEIN, 1989). This fashion is result of a routine of handling problems, regarding the
external or internal environment of a company, and accomplishing repeatedly reliable
outcomes.
5
On the other hand, national cultural values reflect the psychological dynamics of conflict and
compatibilities that society portrays in the course of everyday living (BYRNE; BRADLEY,
2006). Therefore, people’s integrated values in society and their national identity play an
important role on the definition of a country’s national culture. However, the degree of
national cultural homogeneity varies from one society to another, and may be especially low
for some of the newer nations (HOFSTEDE, 2001).
5.2 Cultural Dimensions
According to Hofstede et al. (2002), national cultures, even though different, deal with similar
problems related to social life, like identity, hierarchy, gender, truth and virtue. What differs
however is the way to solve such problems.
Aiming to compare how culture differs in nations and how values in the workplace are
influenced by culture, Hofstede conducted a study through 50 countries by the staff of IBM
between 1967 and 1973.
The dimensions mentioned are, according to Hofstede(2001):
- High versus Low Power distance, which is related to the basic problem of human inequality;
- High versus Low Uncertainty avoidance, related to the level of stress of a group when in
contact with an unknown future;
-Individualism versus Collectivism, related to the integration of individuals into primary
groups;
-Masculinity versus Femininity, related to the division of emotional roles between men and
women;
-Long-term versus Short-term orientation, related to the time choice of focus for people’s
efforts: the future or the present.
6
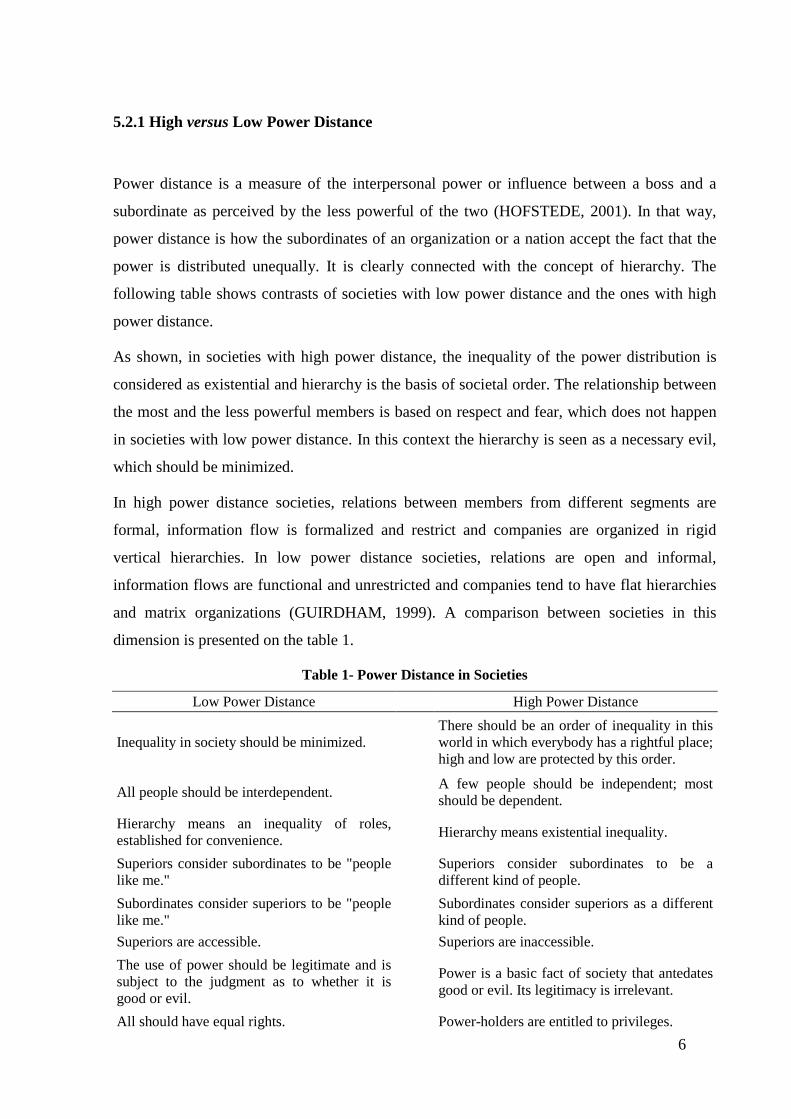
5.2.1 High versus Low Power Distance
Power distance is a measure of the interpersonal power or influence between a boss and a
subordinate as perceived by the less powerful of the two (HOFSTEDE, 2001). In that way,
power distance is how the subordinates of an organization or a nation accept the fact that the
power is distributed unequally. It is clearly connected with the concept of hierarchy. The
following table shows contrasts of societies with low power distance and the ones with high
power distance.
As shown, in societies with high power distance, the inequality of the power distribution is
considered as existential and hierarchy is the basis of societal order. The relationship between
the most and the less powerful members is based on respect and fear, which does not happen
in societies with low power distance. In this context the hierarchy is seen as a necessary evil,
which should be minimized.
In high power distance societies, relations between members from different segments are
formal, information flow is formalized and restrict and companies are organized in rigid
vertical hierarchies. In low power distance societies, relations are open and informal,
information flows are functional and unrestricted and companies tend to have flat hierarchies
and matrix organizations (GUIRDHAM, 1999). A comparison between societies in this
dimension is presented on the table 1.
Table 1- Power Distance in Societies
Low Power Distance High Power Distance
Inequality in society should be minimized. There should be an order of inequality in this world in which everybody has a rightful place; high and low are protected by this order.
All people should be interdependent. A few people should be independent; most should be dependent.
Hierarchy means an inequality of roles, established for convenience.
Hierarchy means existential inequality.
Superiors consider subordinates to be "people like me."
Superiors consider subordinates to be a different kind of people.
Subordinates consider superiors to be "people like me."
Subordinates consider superiors as a different kind of people.
Superiors are accessible. Superiors are inaccessible.
The use of power should be legitimate and is subject to the judgment as to whether it is good or evil.
Power is a basic fact of society that antedates good or evil. Its legitimacy is irrelevant.
All should have equal rights. Power-holders are entitled to privileges.
7
Those in power should try to look less powerful than they are.
Those in power should try to look as powerful as possible.
The system is to blame. The underdog is to blame.
The way to change a social system is to redistribute power.
The way to change a social system is to dethrone those in power.
People at various power levels feel less threatened and more prepared to trust people.
Other people are a potential threat to one´s power and can rarely be trusted.
Latent harmony exists between the powerful and the powerless.
Latent conflict exists between the powerful and the powerless.
Cooperation among the powerless can be based on solidarity.
Cooperation among the powerless is difficult to attain because of their low-faith-in-people norm.
Source: Hofstede ( 1980, p. 122).
According to Hooker (2003), high power distance societies govern themselves by deferring to
superiors, while the low power distance societies do it mostly with rules and raising the young
people with basic principles of justice and rationality.
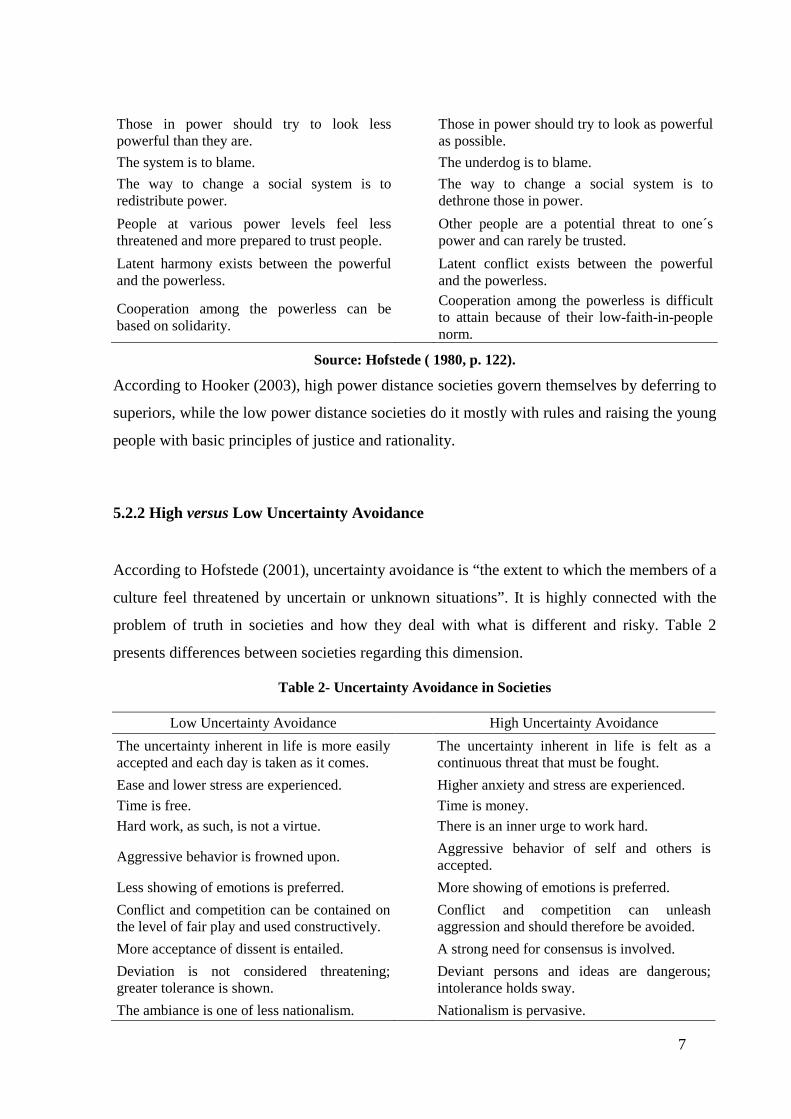
5.2.2 High versus Low Uncertainty Avoidance
According to Hofstede (2001), uncertainty avoidance is “the extent to which the members of a
culture feel threatened by uncertain or unknown situations”. It is highly connected with the
problem of truth in societies and how they deal with what is different and risky. Table 2
presents differences between societies regarding this dimension.
Table 2- Uncertainty Avoidance in Societies
Low Uncertainty Avoidance High Uncertainty Avoidance
The uncertainty inherent in life is more easily accepted and each day is taken as it comes.
The uncertainty inherent in life is felt as a continuous threat that must be fought.
Ease and lower stress are experienced. Higher anxiety and stress are experienced.
Time is free. Time is money. Hard work, as such, is not a virtue. There is an inner urge to work hard.
Aggressive behavior is frowned upon. Aggressive behavior of self and others is accepted.
Less showing of emotions is preferred. More showing of emotions is preferred.
Conflict and competition can be contained on the level of fair play and used constructively.
Conflict and competition can unleash aggression and should therefore be avoided.
More acceptance of dissent is entailed. A strong need for consensus is involved.
Deviation is not considered threatening; greater tolerance is shown.
Deviant persons and ideas are dangerous; intolerance holds sway.
The ambiance is one of less nationalism. Nationalism is pervasive.
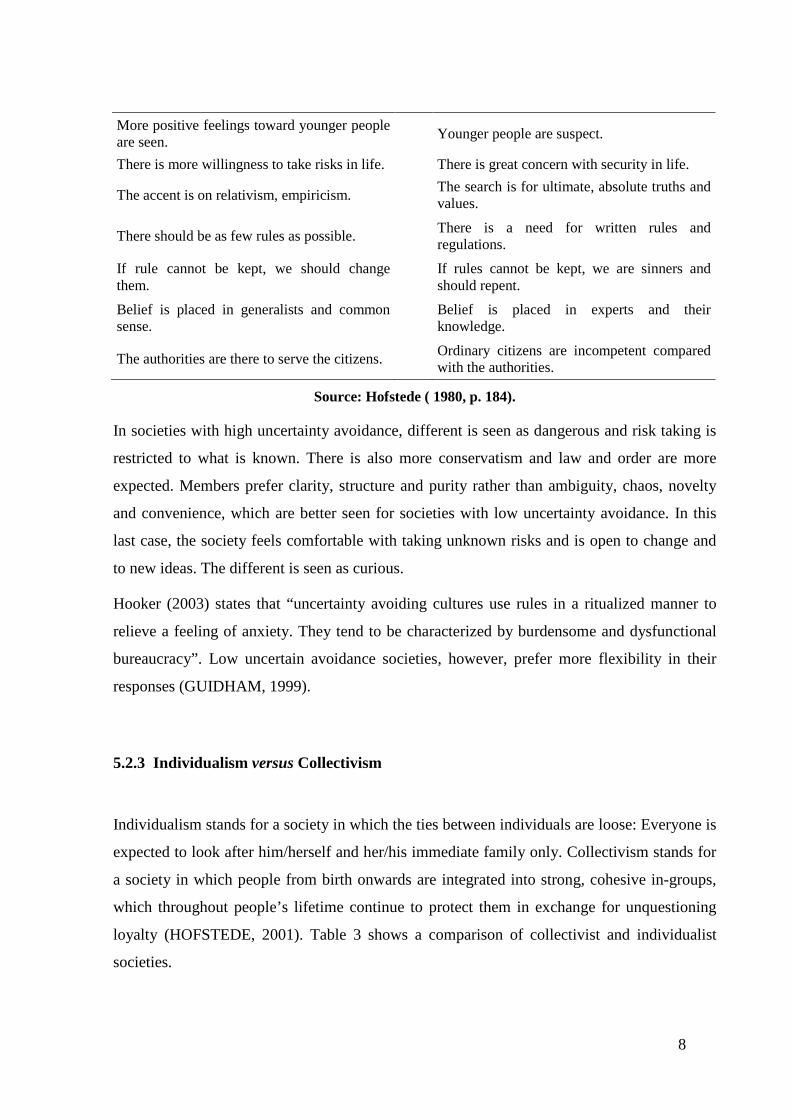
8
More positive feelings toward younger people are seen.
Younger people are suspect.
There is more willingness to take risks in life. There is great concern with security in life.
The accent is on relativism, empiricism. The search is for ultimate, absolute truths and values.
There should be as few rules as possible. There is a need for written rules and regulations.
If rule cannot be kept, we should change them.
If rules cannot be kept, we are sinners and should repent.
Belief is placed in generalists and common sense.
Belief is placed in experts and their knowledge.
The authorities are there to serve the citizens. Ordinary citizens are incompetent compared with the authorities.
Source: Hofstede ( 1980, p. 184).
In societies with high uncertainty avoidance, different is seen as dangerous and risk taking is
restricted to what is known. There is also more conservatism and law and order are more
expected. Members prefer clarity, structure and purity rather than ambiguity, chaos, novelty
and convenience, which are better seen for societies with low uncertainty avoidance. In this
last case, the society feels comfortable with taking unknown risks and is open to change and
to new ideas. The different is seen as curious.
Hooker (2003) states that “uncertainty avoiding cultures use rules in a ritualized manner to
relieve a feeling of anxiety. They tend to be characterized by burdensome and dysfunctional
bureaucracy”. Low uncertain avoidance societies, however, prefer more flexibility in their
responses (GUIDHAM, 1999).
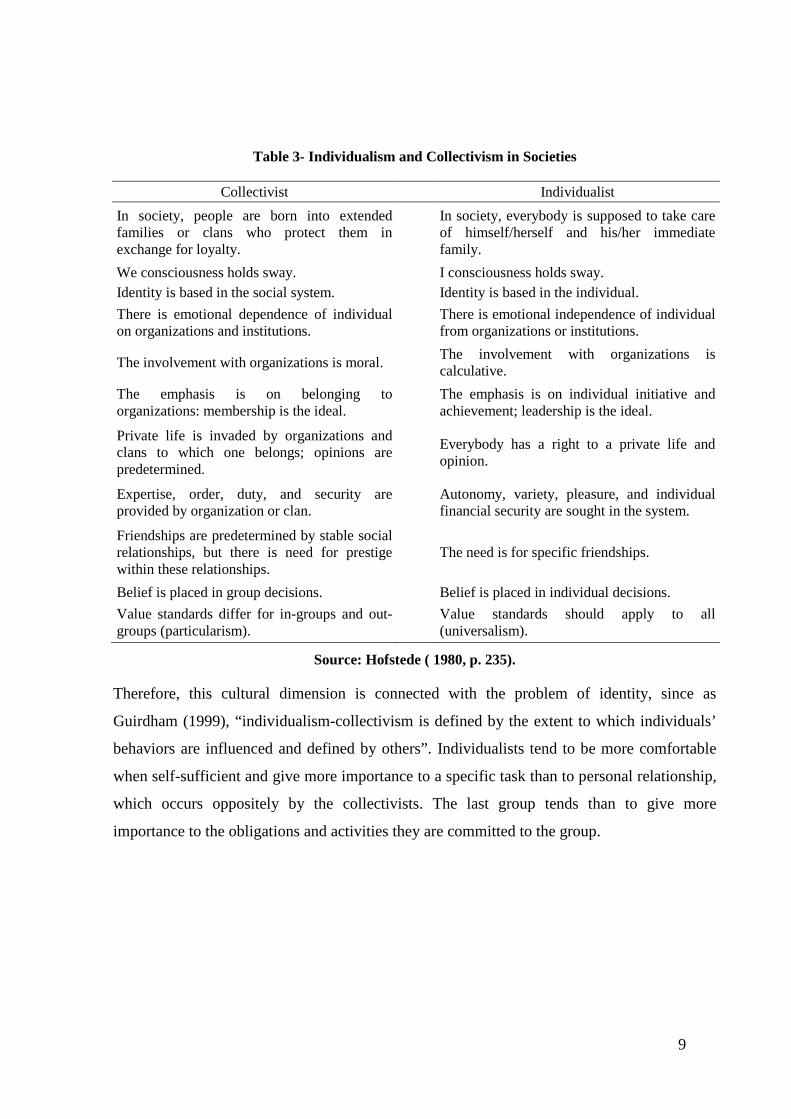
5.2.3 Individualism versus Collectivism
Individualism stands for a society in which the ties between individuals are loose: Everyone is
expected to look after him/herself and her/his immediate family only. Collectivism stands for
a society in which people from birth onwards are integrated into strong, cohesive in-groups,
which throughout people’s lifetime continue to protect them in exchange for unquestioning
loyalty (HOFSTEDE, 2001). Table 3 shows a comparison of collectivist and individualist
societies.
9
Table 3- Individualism and Collectivism in Societies
Collectivist Individualist
In society, people are born into extended families or clans who protect them in exchange for loyalty.
In society, everybody is supposed to take care of himself/herself and his/her immediate family.
We consciousness holds sway. I consciousness holds sway. Identity is based in the social system. Identity is based in the individual.
There is emotional dependence of individual on organizations and institutions.
There is emotional independence of individual from organizations or institutions.
The involvement with organizations is moral. The involvement with organizations is calculative.
The emphasis is on belonging to organizations: membership is the ideal.
The emphasis is on individual initiative and achievement; leadership is the ideal.
Private life is invaded by organizations and clans to which one belongs; opinions are predetermined.
Everybody has a right to a private life and opinion.
Expertise, order, duty, and security are provided by organization or clan.
Autonomy, variety, pleasure, and individual financial security are sought in the system.
Friendships are predetermined by stable social relationships, but there is need for prestige within these relationships.
The need is for specific friendships.
Belief is placed in group decisions. Belief is placed in individual decisions.
Value standards differ for in-groups and out-groups (particularism).
Value standards should apply to all (universalism).
Source: Hofstede ( 1980, p. 235).
Therefore, this cultural dimension is connected with the problem of identity, since as
Guirdham (1999), “individualism-collectivism is defined by the extent to which individuals’
behaviors are influenced and defined by others”. Individualists tend to be more comfortable
when self-sufficient and give more importance to a specific task than to personal relationship,
which occurs oppositely by the collectivists. The last group tends than to give more
importance to the obligations and activities they are committed to the group.
10
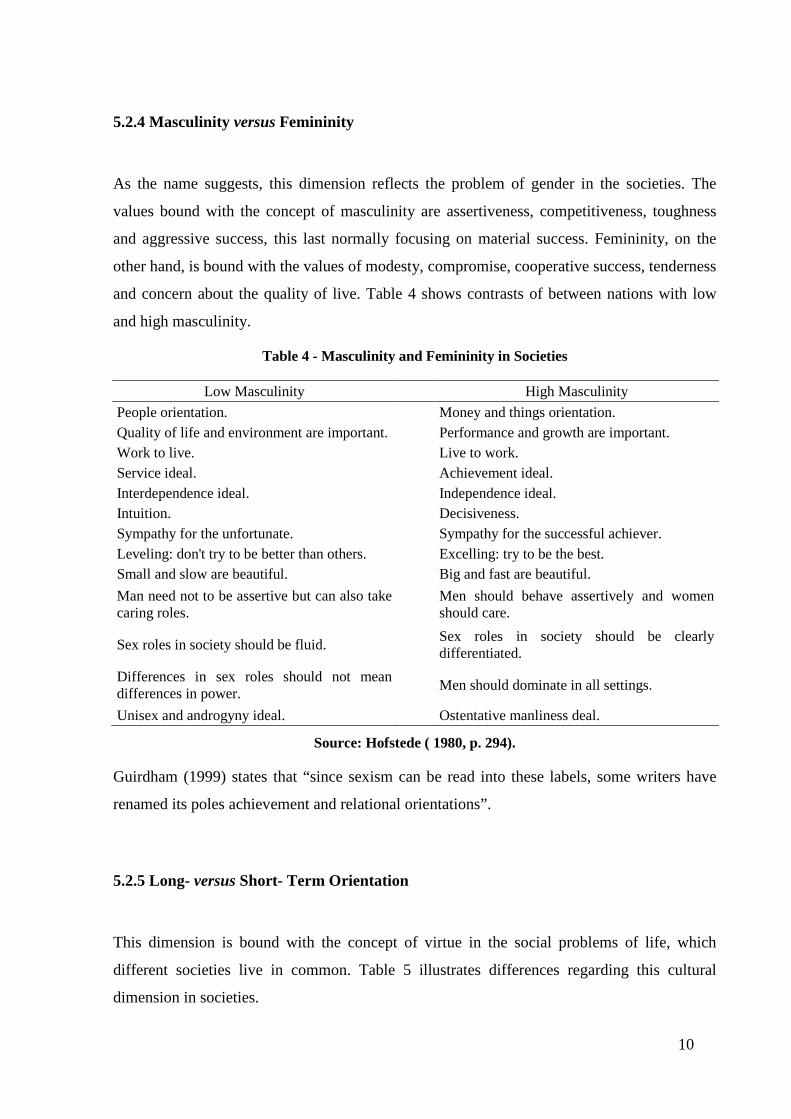
5.2.4 Masculinity versus Femininity
As the name suggests, this dimension reflects the problem of gender in the societies. The
values bound with the concept of masculinity are assertiveness, competitiveness, toughness
and aggressive success, this last normally focusing on material success. Femininity, on the
other hand, is bound with the values of modesty, compromise, cooperative success, tenderness
and concern about the quality of live. Table 4 shows contrasts of between nations with low
and high masculinity.
Table 4 - Masculinity and Femininity in Societies
Low Masculinity High Masculinity
People orientation. Money and things orientation. Quality of life and environment are important. Performance and growth are important. Work to live. Live to work. Service ideal. Achievement ideal. Interdependence ideal. Independence ideal. Intuition. Decisiveness. Sympathy for the unfortunate. Sympathy for the successful achiever. Leveling: don't try to be better than others. Excelling: try to be the best. Small and slow are beautiful. Big and fast are beautiful.
Man need not to be assertive but can also take caring roles.
Men should behave assertively and women should care.
Sex roles in society should be fluid. Sex roles in society should be clearly differentiated.
Differences in sex roles should not mean differences in power.
Men should dominate in all settings.
Unisex and androgyny ideal. Ostentative manliness deal.
Source: Hofstede ( 1980, p. 294).
Guirdham (1999) states that “since sexism can be read into these labels, some writers have
renamed its poles achievement and relational orientations”.
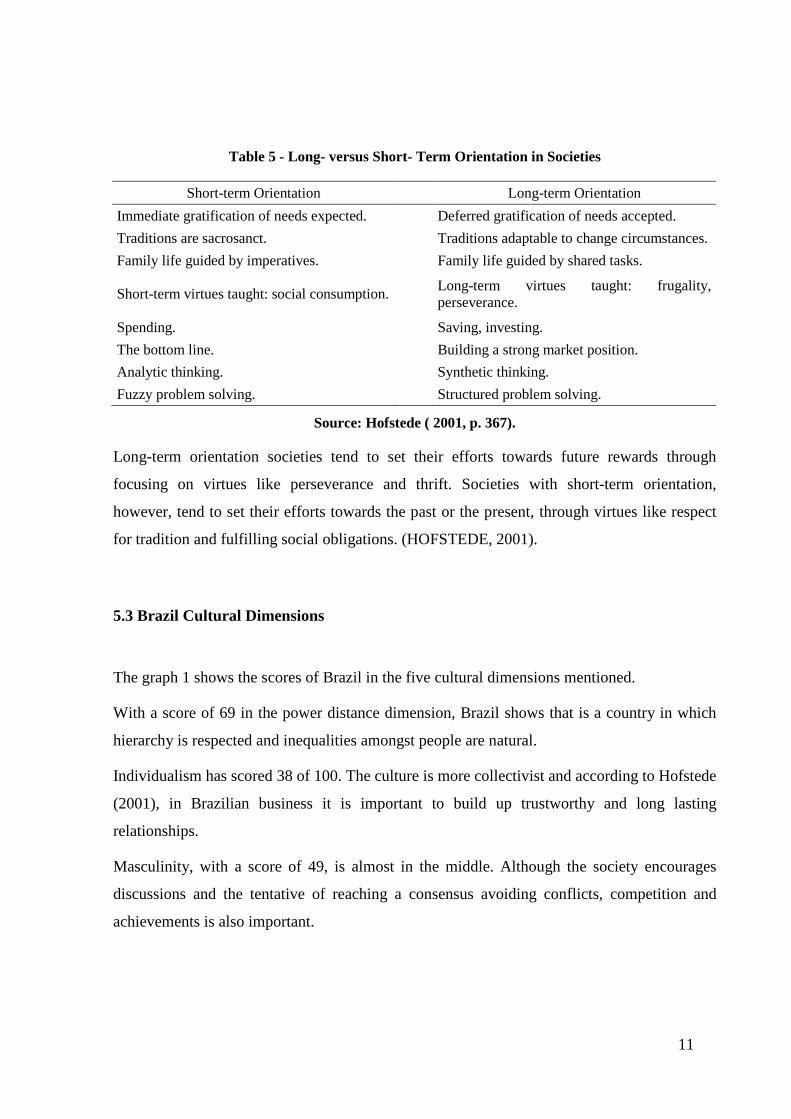
5.2.5 Long- versus Short- Term Orientation
This dimension is bound with the concept of virtue in the social problems of life, which
different societies live in common. Table 5 illustrates differences regarding this cultural
dimension in societies.
11
Table 5 - Long- versus Short- Term Orientation in Societies
Short-term Orientation Long-term Orientation
Immediate gratification of needs expected. Deferred gratification of needs accepted.
Traditions are sacrosanct. Traditions adaptable to change circumstances.
Family life guided by imperatives. Family life guided by shared tasks.
Short-term virtues taught: social consumption. Long-term virtues taught: frugality, perseverance.
Spending. Saving, investing.
The bottom line. Building a strong market position.
Analytic thinking. Synthetic thinking.
Fuzzy problem solving. Structured problem solving.
Source: Hofstede ( 2001, p. 367).
Long-term orientation societies tend to set their efforts towards future rewards through
focusing on virtues like perseverance and thrift. Societies with short-term orientation,
however, tend to set their efforts towards the past or the present, through virtues like respect
for tradition and fulfilling social obligations. (HOFSTEDE, 2001).
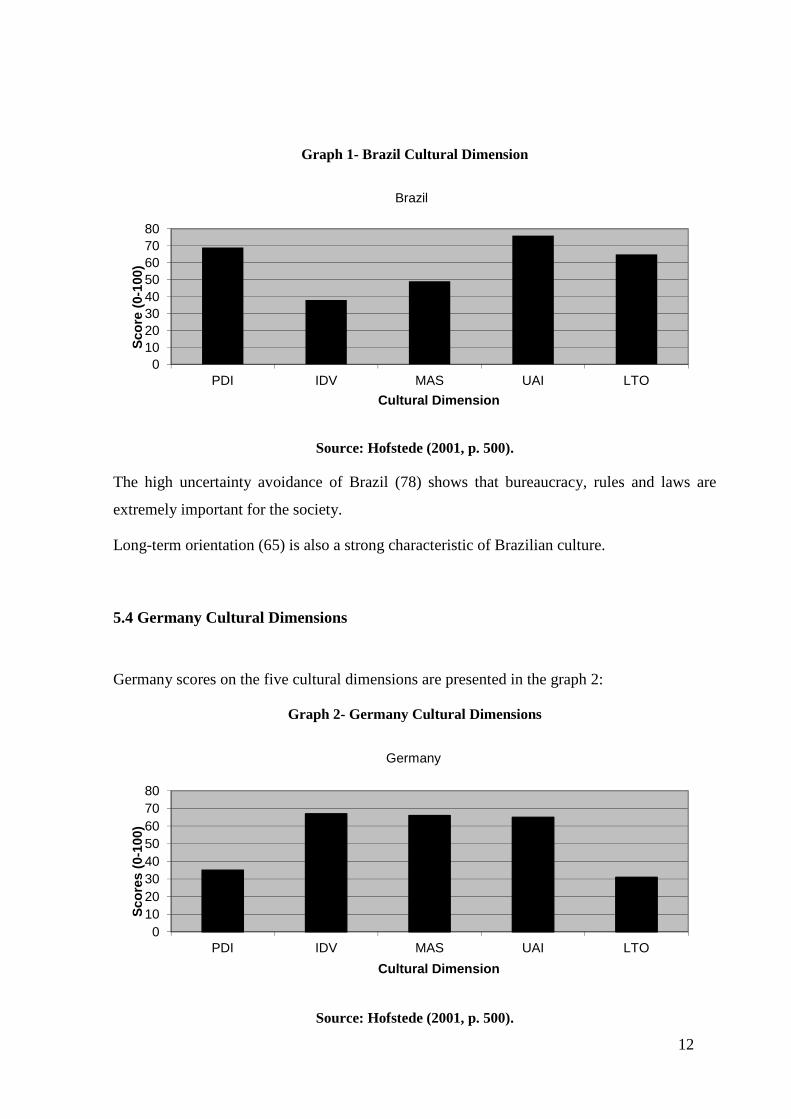
5.3 Brazil Cultural Dimensions
The graph 1 shows the scores of Brazil in the five cultural dimensions mentioned.
With a score of 69 in the power distance dimension, Brazil shows that is a country in which
hierarchy is respected and inequalities amongst people are natural.
Individualism has scored 38 of 100. The culture is more collectivist and according to Hofstede
(2001), in Brazilian business it is important to build up trustworthy and long lasting
relationships.
Masculinity, with a score of 49, is almost in the middle. Although the society encourages
discussions and the tentative of reaching a consensus avoiding conflicts, competition and
achievements is also important.
12
Graph 1- Brazil Cultural Dimension
Source: Hofstede (2001, p. 500).
The high uncertainty avoidance of Brazil (78) shows that bureaucracy, rules and laws are
extremely important for the society.
Long-term orientation (65) is also a strong characteristic of Brazilian culture.
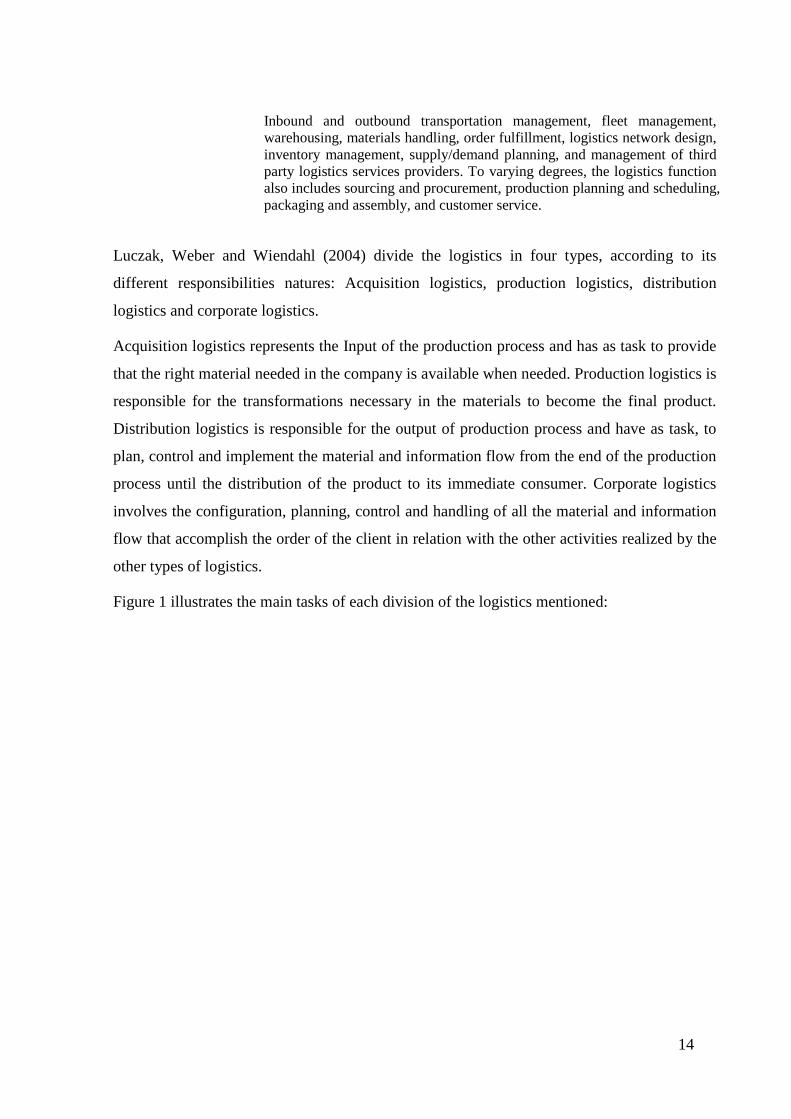
5.4 Germany Cultural Dimensions
Germany scores on the five cultural dimensions are presented in the graph 2:
Graph 2- Germany Cultural Dimensions
Source: Hofstede (2001, p. 500).
01020304050607080
PDI IDV MAS UAI LTO
Sco
re (
0-10
0)
Cultural Dimension
Brazil
01020304050607080
PDI IDV MAS UAI LTO
Sco
res
(0-1
00)
Cultural Dimension
Germany

13
Germany’s power distance is relative low (35). “A direct and participative communication
and meeting style is common, control is disliked and leadership is challenged to show
expertise and best accepted when it’s based on it.”(HOFSTEDE, 2012) Individualism is also a
strong dimension in Germany (67). Self-sufficiency is encouraged and is, consequently, an
important skill.
Masculinity, with a score of 66, is a characteristic of the German society as well. Performance,
assertiveness and competition are highly valued.
Germany stands in the line of countries, which have high uncertainty avoidance. Rules, law
and bureaucracy are present in the society to reduce anxiety and unknown risks are not
desired.
Finally, the long-term orientation is low, indicating an urge for achieving quick results.
5.5 Logistics
As far as history records, the goods that people wanted were not produced where they wanted
to consume them, or these goods were not accessible when people wanted to consume them
(BALLOU, 2004). This basic problem is the reason of the importance and development of the
logistics.
Nowadays, logistics can be defined as the responsibility to design and administer systems to
control movement and geographical positioning of raw materials, work-in-progress, and
finished inventories at the lowest total cost (BOWERSOX; CLOSS; COOPER, 2007).
Consequently, it is very important in the field of logistics to minimize human and financial
assets, as well as operational expenditures, in order to add value to the products through the
right performance of service to the costumers.
As the “right performance”, it is meant that companies should balance their logistics
competencies in a way that satisfies costumers at a realistic cost, since as Bowersox, Closs
and Cooper (2007) “very seldom will either the lowest total cost or the highest attainable
customer service constitute the desirable logistics strategy”.
The functions of the company that logistics has the responsibility to manage are, according to
the Supply Chain Council (2012):
14
Inbound and outbound transportation management, fleet management, warehousing, materials handling, order fulfillment, logistics network design, inventory management, supply/demand planning, and management of third party logistics services providers. To varying degrees, the logistics function also includes sourcing and procurement, production planning and scheduling, packaging and assembly, and customer service.
Luczak, Weber and Wiendahl (2004) divide the logistics in four types, according to its
different responsibilities natures: Acquisition logistics, production logistics, distribution
logistics and corporate logistics.
Acquisition logistics represents the Input of the production process and has as task to provide
that the right material needed in the company is available when needed. Production logistics is
responsible for the transformations necessary in the materials to become the final product.
Distribution logistics is responsible for the output of production process and have as task, to
plan, control and implement the material and information flow from the end of the production
process until the distribution of the product to its immediate consumer. Corporate logistics
involves the configuration, planning, control and handling of all the material and information
flow that accomplish the order of the client in relation with the other activities realized by the
other types of logistics.
Figure 1 illustrates the main tasks of each division of the logistics mentioned:
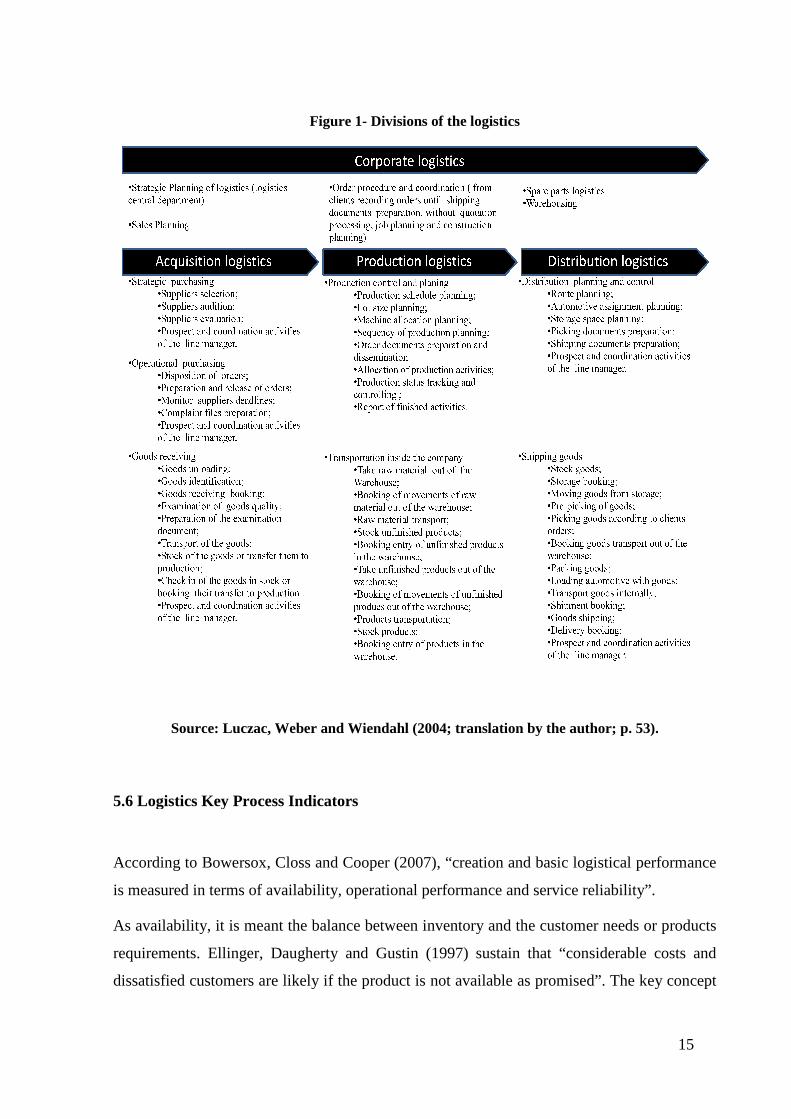
Source: Luczac, Weber and Wiendahl (2004; translation by the author; p. 53).
5.6 Logistics Key Process Indicators
According to Bowersox, Closs and Cooper (2007), “creation and basic logistical performance
is measured in terms of availability, operational performance a
As availability, it is meant the balance between inventory and the customer needs or products
requirements. Ellinger, Daugherty and Gustin (1997) sustain that “considerable costs and
dissatisfied customers are likely if the
Figure 1- Divisions of the logistics
, Weber and Wiendahl (2004; translation by the author; p. 53).
5.6 Logistics Key Process Indicators
According to Bowersox, Closs and Cooper (2007), “creation and basic logistical performance
is measured in terms of availability, operational performance and service reliability”.
As availability, it is meant the balance between inventory and the customer needs or products
requirements. Ellinger, Daugherty and Gustin (1997) sustain that “considerable costs and
dissatisfied customers are likely if the product is not available as promised”. The key concept
15
, Weber and Wiendahl (2004; translation by the author; p. 53).
According to Bowersox, Closs and Cooper (2007), “creation and basic logistical performance
nd service reliability”.
As availability, it is meant the balance between inventory and the customer needs or products
requirements. Ellinger, Daugherty and Gustin (1997) sustain that “considerable costs and
is not available as promised”. The key concept
16
to achieve the right availability is, consequently, flexibility to manage information in order to
have high availability, without proportional investment on inventory.
Operational performance deals with the time required to deliver a customer’s order. It
involves delivery speed, reliability (ability to assure that the delivery will be made at the
established time), flexibility to accommodate unusual and unexpected customer request,
malfunction (probability of logistic failure) and recovery time in case of a malfunction.
Service reliability, on the other hand, is connected with quality attributes of logistics. It is
therefore the result of careful planning supported by employee training, operational dedication,
comprehensive management and continuous improvement.
According to Ballou (1987), “the large number of factors that make up overall customer
service and the smaller number that make up order cycle are too numerous for most
companies to measure by a single value”. He also states that it is common for firms to
measure individual elements of the order cycle to measure the logistical performance, such as
stock-availability, percentage of orders filled on request, percentage of items out of stock,
delivery time or percentage of orders delivered within a certain number of days from receipt
of the order.
The performance indicators system adopted in this work will be based on a method of
logistics benchmarking study created by Luczak, Weber and Wiendahl (2004).
They divide the company logistics objectives in two basic directions: High logistics service
and low logistics costs. For the first direction to succeed, the firm’s logistics should provide as
secondary objectives:
- High availability;
- High productivity;
- Low lead time (between the order and the delivery);
- High delivery service.
For the second direction the company should focus on maintaining:
- Low process costs;
- Low stock costs.
The indicators are divided into three categories. Service and costs indicators, which have a
comparative nature and, consequently, can be used to identify chances of improvements in
logistics and structural indicators, that are used to describe and clarify some aspects of the two
indicators mentioned before. Therefore, for this
will be presented.
The acquisition logistics indicators are shown in the figure
“delivery reliability” is to assure and provide that the suppliers have a high availability of the
materials needed for the production of the company.
Figure
Source: Luczac, Weber and Wiendahl
As for the acquisition logistics, the production logistics indicators (Figure
focusing on the main objective high logistics efficiency. There is no indicator regarding the
measurement of the productivity, because it is considered that the
processing time”, which should be as high as possible,
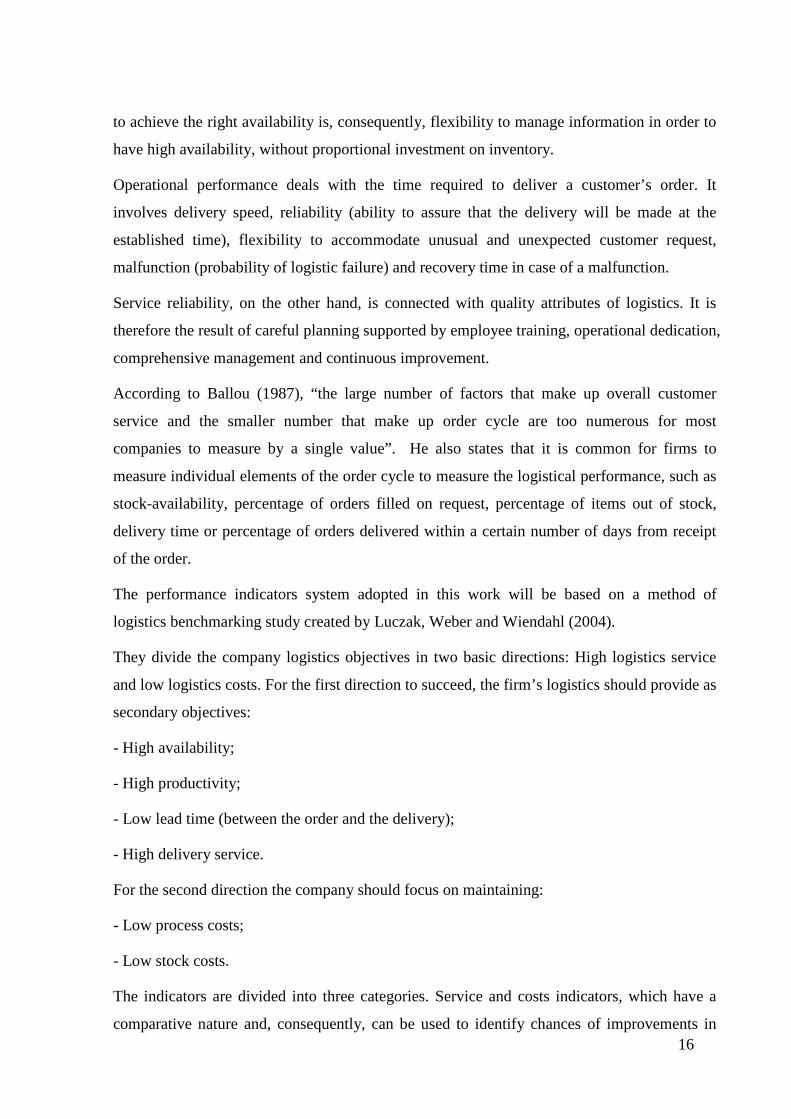
logistics and structural indicators, that are used to describe and clarify some aspects of the two
indicators mentioned before. Therefore, for this work only the two first types of indicators
The acquisition logistics indicators are shown in the figure 2. The focus of the indicator
“delivery reliability” is to assure and provide that the suppliers have a high availability of the
terials needed for the production of the company.
Figure 2- Indicators of the acquisition logistics
Source: Luczac, Weber and Wiendahl (2004; translation by the author; p. 66).
As for the acquisition logistics, the production logistics indicators (Figure
focusing on the main objective high logistics efficiency. There is no indicator regarding the
measurement of the productivity, because it is considered that the indicator “percentage of
processing time”, which should be as high as possible, already covers this concept.
17
logistics and structural indicators, that are used to describe and clarify some aspects of the two
work only the two first types of indicators
. The focus of the indicator
“delivery reliability” is to assure and provide that the suppliers have a high availability of the
(2004; translation by the author; p. 66).
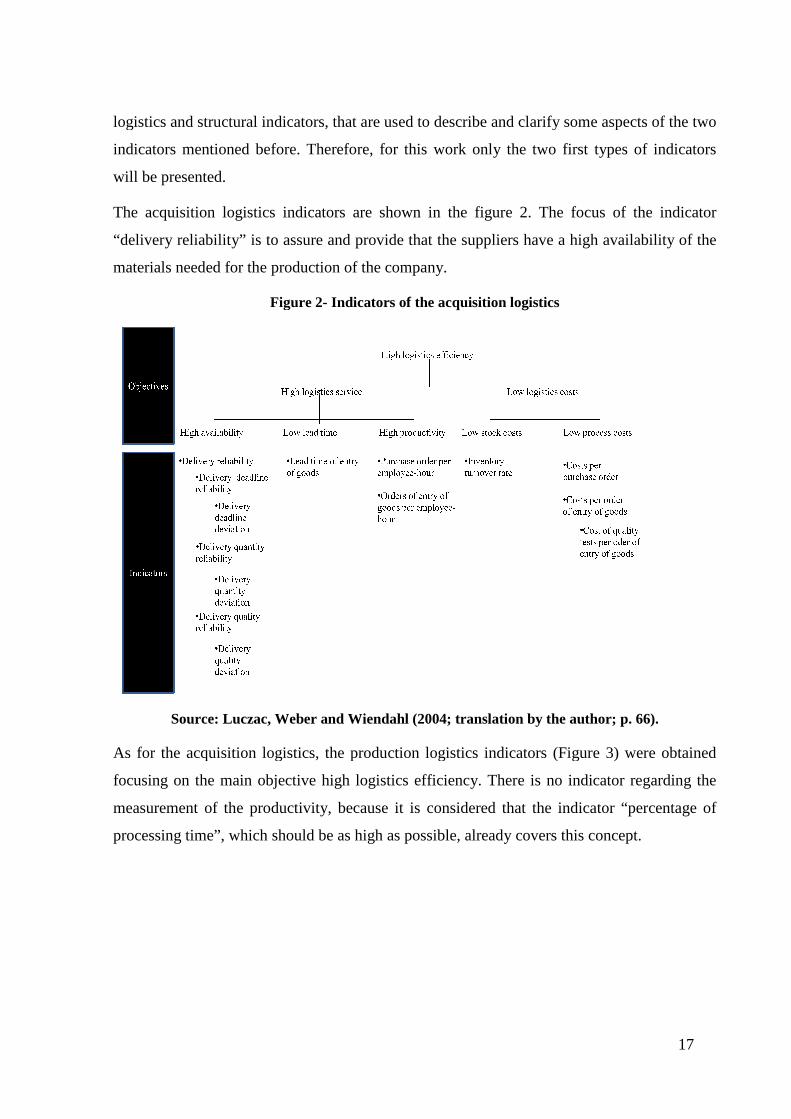
As for the acquisition logistics, the production logistics indicators (Figure 3) were obtained
focusing on the main objective high logistics efficiency. There is no indicator regarding the
indicator “percentage of
this concept.
Figure
Source: Luczac, Weber and Wiendahl
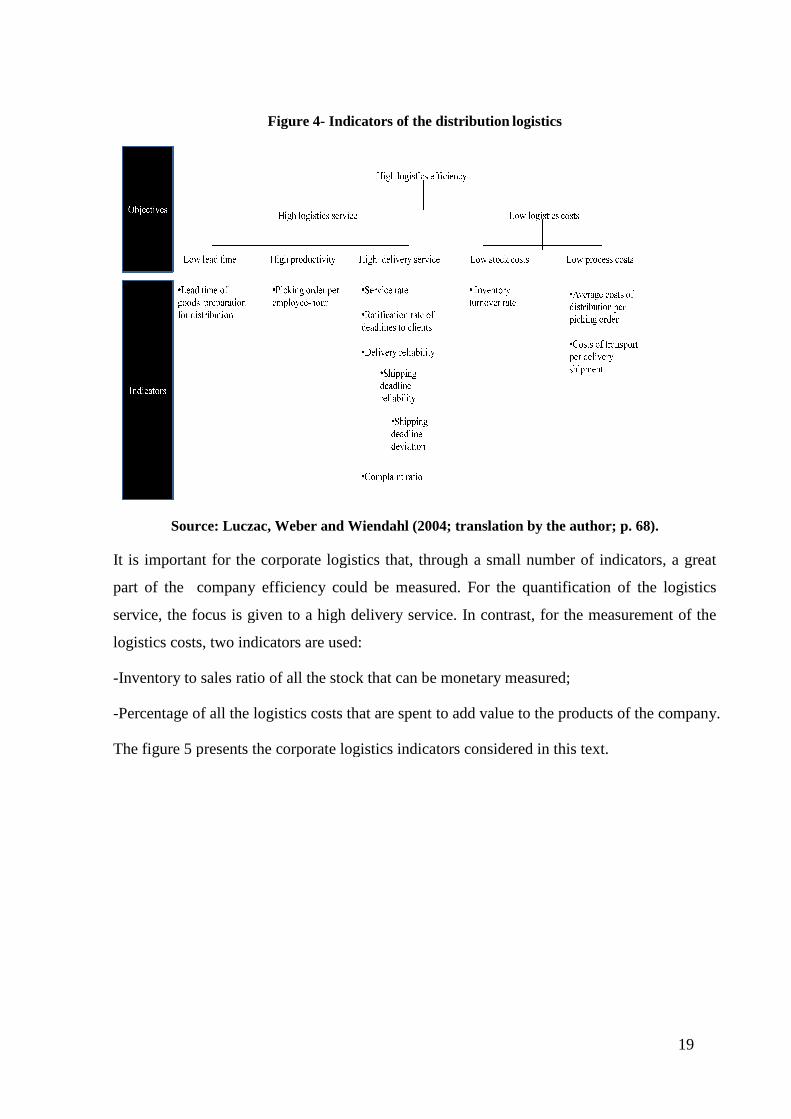
The distribution logistics indicators are presented on the figure
objective “high availability” were mentioned mainly because the objective “high delivery
service” mentioned for the production logistics can also be used for this
Figure 3- Indicators of the production logistics
Source: Luczac, Weber and Wiendahl (2004; translation by the author; p. 67).
distribution logistics indicators are presented on the figure 4. No indicators for the
objective “high availability” were mentioned mainly because the objective “high delivery
service” mentioned for the production logistics can also be used for this
18
(2004; translation by the author; p. 67).
. No indicators for the
objective “high availability” were mentioned mainly because the objective “high delivery
service” mentioned for the production logistics can also be used for this purpose.
Figure
Source: Luczac, Weber and Wiendahl
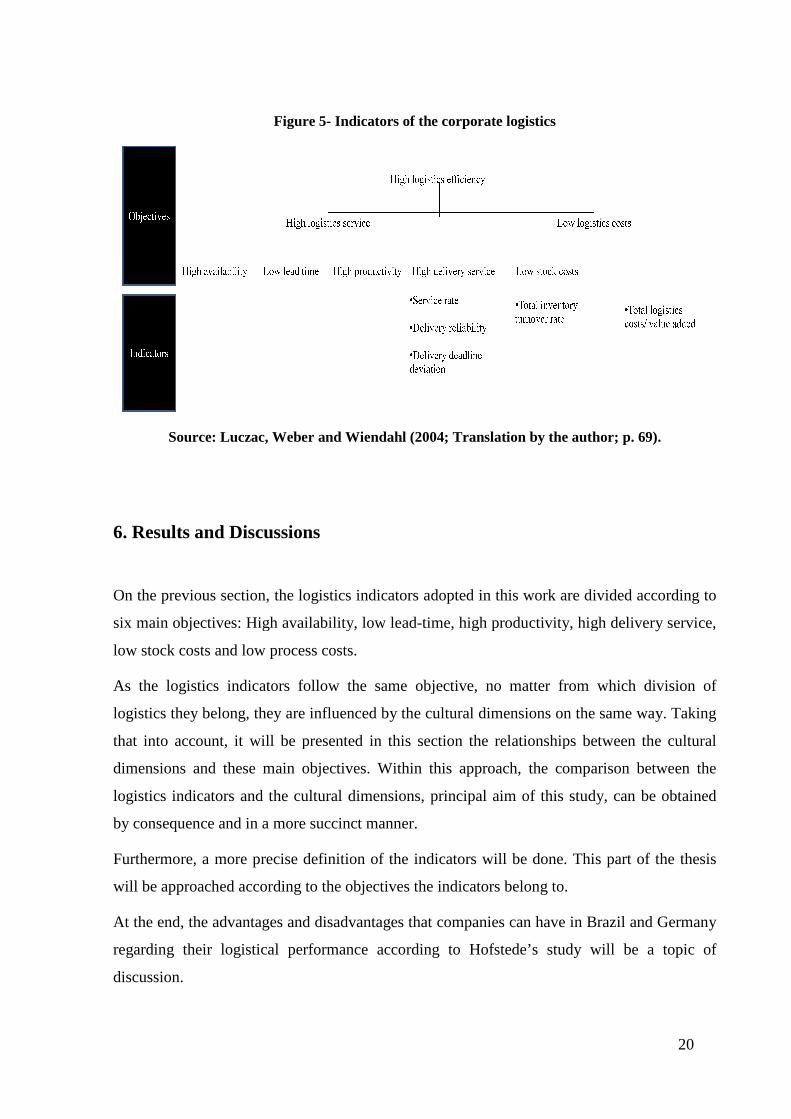
It is important for the corporate logistics that, through a small number of indicators, a great
part of the company efficiency
service, the focus is given to a high delivery service. In contrast, for the measurement of the
logistics costs, two indicators are used:
-Inventory to sales ratio of all the
-Percentage of all the logistics costs that are spent to add value to the products of the company.
The figure 5 presents the corporate logistics indicators considered in this
Figure 4- Indicators of the distribution logistics
Source: Luczac, Weber and Wiendahl (2004; translation by the author; p. 68).
or the corporate logistics that, through a small number of indicators, a great
efficiency could be measured. For the quantification of the logistics
service, the focus is given to a high delivery service. In contrast, for the measurement of the
logistics costs, two indicators are used:
Inventory to sales ratio of all the stock that can be monetary measured;
Percentage of all the logistics costs that are spent to add value to the products of the company.
presents the corporate logistics indicators considered in this
19
(2004; translation by the author; p. 68).
or the corporate logistics that, through a small number of indicators, a great
could be measured. For the quantification of the logistics
service, the focus is given to a high delivery service. In contrast, for the measurement of the
Percentage of all the logistics costs that are spent to add value to the products of the company.
presents the corporate logistics indicators considered in this text.
Figure
Source: Luczac, Weber and Wiendahl
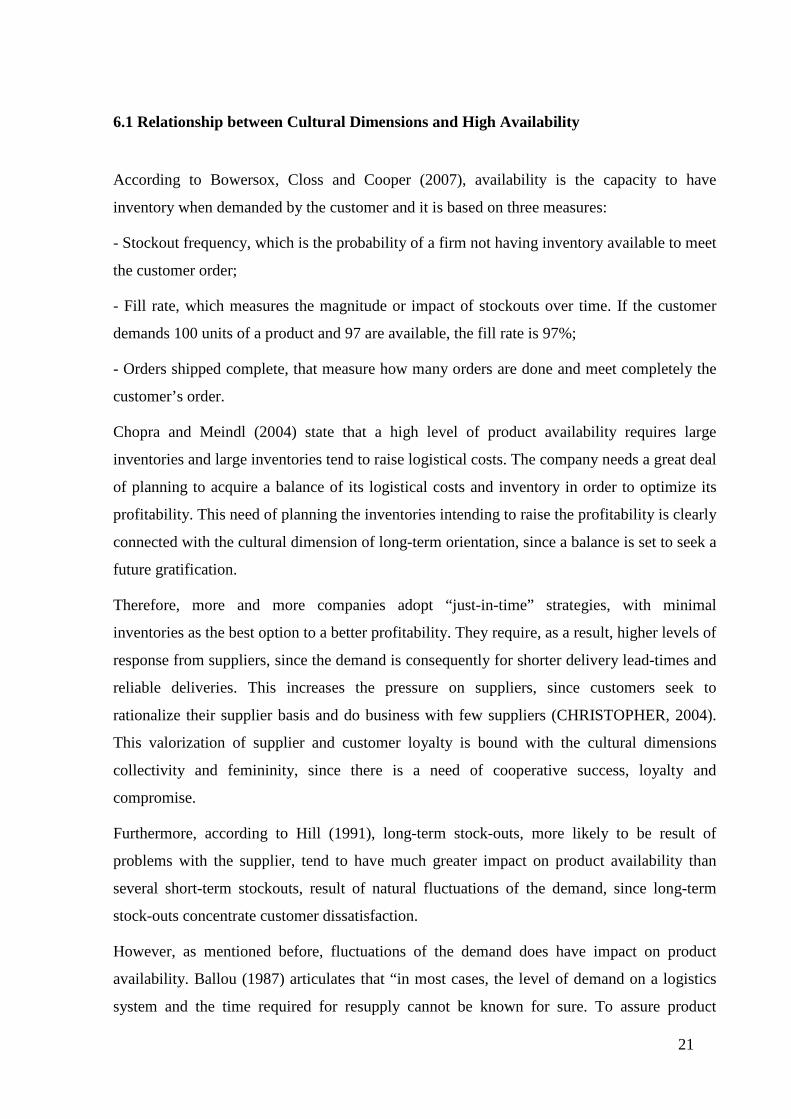
6. Results and Discussions
On the previous section, the logistics indicators adopted in this work are divided according to
six main objectives: High availability, low
low stock costs and low process
As the logistics indicators follow the same objective, no matter from which division of
logistics they belong, they are influenced by the cultural dimensions on the same way.
that into account, it will be presented in this section the relationships between the cultural
dimensions and these main objectives.
logistics indicators and the cultural dimensions, principal aim of this study, can be obtained
by consequence and in a more succinct manner.
Furthermore, a more precise def
will be approached according to the objectives the indicators belong to.
At the end, the advantages and disadvantages that companies can have in Brazil and Germany
regarding their logistical p
discussion.
Figure 5- Indicators of the corporate logistics
Source: Luczac, Weber and Wiendahl (2004; Translation by the author; p. 69).
. Results and Discussions
On the previous section, the logistics indicators adopted in this work are divided according to
six main objectives: High availability, low lead-time, high productivity, high deliver
process costs.
ors follow the same objective, no matter from which division of
logistics they belong, they are influenced by the cultural dimensions on the same way.
it will be presented in this section the relationships between the cultural
ensions and these main objectives. Within this approach, the comparison between the
logistics indicators and the cultural dimensions, principal aim of this study, can be obtained
by consequence and in a more succinct manner.
Furthermore, a more precise definition of the indicators will be done. This part of the
will be approached according to the objectives the indicators belong to.
At the end, the advantages and disadvantages that companies can have in Brazil and Germany
regarding their logistical performance according to Hofstede’s study will be
20
(2004; Translation by the author; p. 69).
On the previous section, the logistics indicators adopted in this work are divided according to
, high productivity, high delivery service,
ors follow the same objective, no matter from which division of
logistics they belong, they are influenced by the cultural dimensions on the same way. Taking
it will be presented in this section the relationships between the cultural
, the comparison between the
logistics indicators and the cultural dimensions, principal aim of this study, can be obtained
inition of the indicators will be done. This part of the thesis
At the end, the advantages and disadvantages that companies can have in Brazil and Germany
study will be a topic of
21
6.1 Relationship between Cultural Dimensions and High Availability
According to Bowersox, Closs and Cooper (2007), availability is the capacity to have
inventory when demanded by the customer and it is based on three measures:
- Stockout frequency, which is the probability of a firm not having inventory available to meet
the customer order;
- Fill rate, which measures the magnitude or impact of stockouts over time. If the customer
demands 100 units of a product and 97 are available, the fill rate is 97%;
- Orders shipped complete, that measure how many orders are done and meet completely the
customer’s order.
Chopra and Meindl (2004) state that a high level of product availability requires large
inventories and large inventories tend to raise logistical costs. The company needs a great deal
of planning to acquire a balance of its logistical costs and inventory in order to optimize its
profitability. This need of planning the inventories intending to raise the profitability is clearly
connected with the cultural dimension of long-term orientation, since a balance is set to seek a
future gratification.
Therefore, more and more companies adopt “just-in-time” strategies, with minimal
inventories as the best option to a better profitability. They require, as a result, higher levels of
response from suppliers, since the demand is consequently for shorter delivery lead-times and
reliable deliveries. This increases the pressure on suppliers, since customers seek to
rationalize their supplier basis and do business with few suppliers (CHRISTOPHER, 2004).
This valorization of supplier and customer loyalty is bound with the cultural dimensions
collectivity and femininity, since there is a need of cooperative success, loyalty and
compromise.
Furthermore, according to Hill (1991), long-term stock-outs, more likely to be result of
problems with the supplier, tend to have much greater impact on product availability than
several short-term stockouts, result of natural fluctuations of the demand, since long-term
stock-outs concentrate customer dissatisfaction.
However, as mentioned before, fluctuations of the demand does have impact on product
availability. Ballou (1987) articulates that “in most cases, the level of demand on a logistics
system and the time required for resupply cannot be known for sure. To assure product
22
availability, additional amounts of stock (safety stock) are maintained.” It is clear that the
cultural dimension high uncertainty avoidance is positive to have a high availability.
As the last dimension mentioned, power distance is negative for a company’s objective of
high availability, since “organizations must be structured to diagnose effectively and
efficiently customer needs and deliver the desired benefits to the customer” (MANRODT;
DAVIS, 1993). In that manner, lean companies can identify better and quickly the customer’s
needs and adjust itself better to provide the necessary product availability.
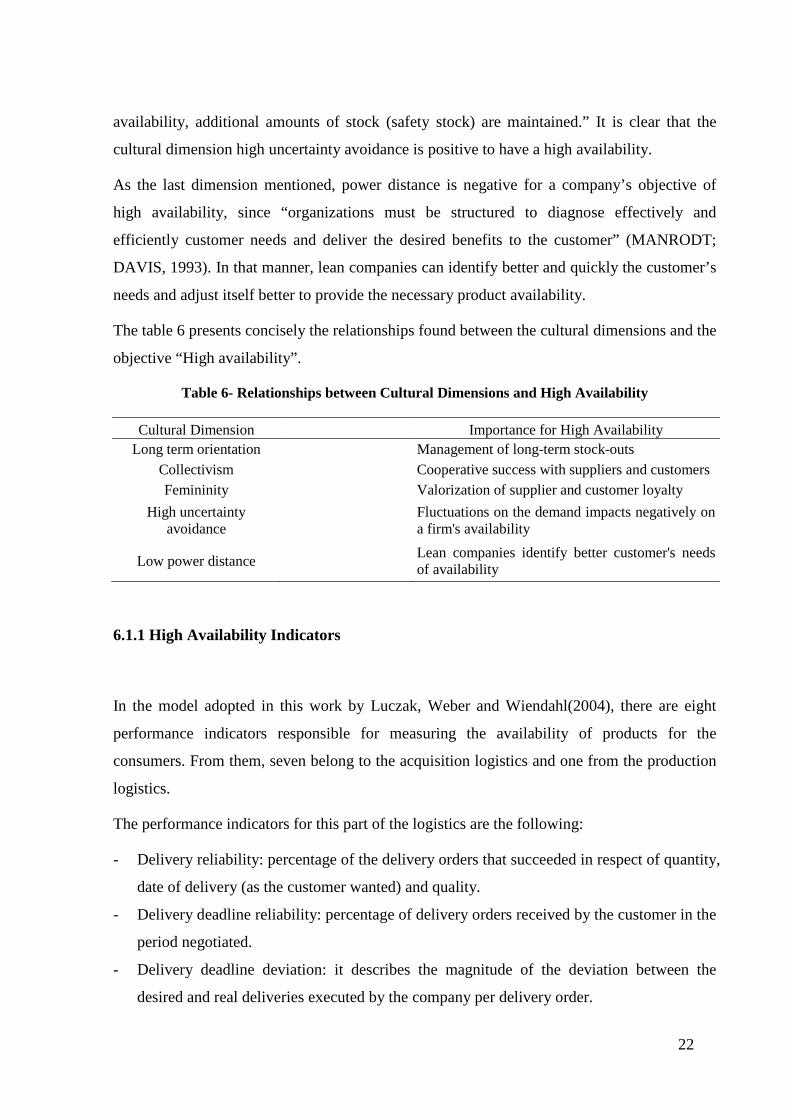
The table 6 presents concisely the relationships found between the cultural dimensions and the
objective “High availability”.
Table 6- Relationships between Cultural Dimensions and High Availability
Cultural Dimension Importance for High Availability Long term orientation
Management of long-term stock-outs
Collectivism
Cooperative success with suppliers and customers Femininity
Valorization of supplier and customer loyalty
High uncertainty avoidance
Fluctuations on the demand impacts negatively on a firm's availability
Low power distance
Lean companies identify better customer's needs of availability
6.1.1 High Availability Indicators
In the model adopted in this work by Luczak, Weber and Wiendahl(2004), there are eight
performance indicators responsible for measuring the availability of products for the
consumers. From them, seven belong to the acquisition logistics and one from the production
logistics.
The performance indicators for this part of the logistics are the following:
- Delivery reliability: percentage of the delivery orders that succeeded in respect of quantity,
date of delivery (as the customer wanted) and quality.
- Delivery deadline reliability: percentage of delivery orders received by the customer in the
period negotiated.
- Delivery deadline deviation: it describes the magnitude of the deviation between the
desired and real deliveries executed by the company per delivery order.
23
- Delivery quantity reliability: percentage of delivery orders that succeeded in terms of the
quantity demanded by the customer.
- Delivery quantity deviation: it describes the magnitude of the deviation between the
demanded and real quantities delivered to the customers.
- Delivery quality reliability: percentage of delivery orders occurred as needed by the
customer in terms of quality of the products.
- Delivery quality deviation: deviation in percentage of the number of good products
delivered per order.
For the production logistics, there is only one indicator in the model, although an alternative
one can be used:
- Availability of goods for the start of the production plan: percentage of production
activities, which were started in the planned time (regarding availability of materials).
- Minimal material stock accomplished: percentage of workdays in which the stocks of
materials needed for the production were at least equal to the minimal stock planned of
them.
6.2 Relationship between Cultural Dimensions and Low Lead Time
Lead-time includes all the time from ordering until the goods ordered arrive at the customer or
from demand to fulfillment. It comprehends several different activities: Order information
transfer, order handling, engineering, planning and scheduling, supply of components ( if they
are not in inventory), manufacturing order release, manufacturing (can be divided into set-up,
operation, handling and queuing), assembly, distribution and installation. In many cases,
however, depending of the customer orientation, type of products, etc., not all these activities
are performed during the lead times (WEDEL, 1996).
For Wedel and Lumsden (1995), “the reduction of lead time increases effectiveness and
reduces inventory, which gives competitive advantages and possibilities for price rises”. Short
lead times is therefore a key objective to the companies, since it is seen as an improvement for
the customers and it enhances the profitability.
24
For that reason, it is very important to reduce wastes in the lead time through a long term
planning, as for Tersine and Hummingbird (1995), time is usually wasted because of
serialization of independent activities, non-synchronization of dependent activities (poor
scheduling), production of parts that are rejected/reworked (unacceptable quality), or
inefficient work flows (poor layouts). Consequently, long-term orientation has a positive
relation with low lead times.
Planning and keeping inventories is sometimes necessary, as guaranteed fixed delivery dates
demand few distortions and low uncertainty, and uncertainty increases with increased lead
times (WEDEL; LUMSDEN, 1995). For Bowersox, Closs and Cooper (2007), the
consistency of the company’s lead-time is a prerequisite for its reduction, since when
performance occurs fasters than expected, unplanned work will be required to handle and
store inventory that arrives early and delayed performance of lead-times results on disruption
of operations and need of safety stock to cover uncertainties. When consistency is achieved,
shorter cycle times are desired, because they reduce total assets deployed, improve turn
performance and reduce inventory risk. High Uncertainty avoidance is consequently positive
for low lead times.
Additionally, often reductions in lead times acquired by the shop floor workers or by the
management are not well communicated through the organization. Information of lead-time
reductions should be highly accessible in the organizations, because inability to capture lead-
time reductions results in marketing potentials not utilized (WEDEL; LUMSDEN, 1995).
Flatter organizations, in which the communication flows more directly, have a competitive
advantage in this direction. Besides, “time spent in decision making will be considerable,
since it expands exponentially in relation to the number of levels of management wishing to
have input into decisions”(CHARNEY, 1991).High Power distance is, as a result, negative for
low lead times.
Traditionally, product flows are managed by semi-autonomous departments (purchasing,
transportation, distribution, warehousing, manufacturing and customer service) with
insufficient coordination among them. Information about quantity and timing of product flows
is normally done through loosely integrated transactional systems. Improvements on lead
times involve simplification, automation and integration (TERSINE; HUMMINGBIRD,
1995). Collectivism is, therefore, positive to low lead times.
25
The constant reduction of lead times requires the companies adapt themselves to change.
According to Wedel (1996), companies often choose a human oriented method of change
management, giving value to factors such as motivation, development of competence and
involvement through decentralization, extended work content and better working conditions.
This human orientation and all these values are clearly connected with the cultural dimension
femininity. Nevertheless, the concept of lead time reduction is based on the constant
achieving deal of eliminating waste and focusing on the performance of the company to gain
competitive advantages. These values of competitiveness and achievements are natural of the
masculinity cultural dimension. This relationship of low lead times and the cultural dimension
masculinity will be adopted as “undefined” by this work, since each orientation has pros and
contras.
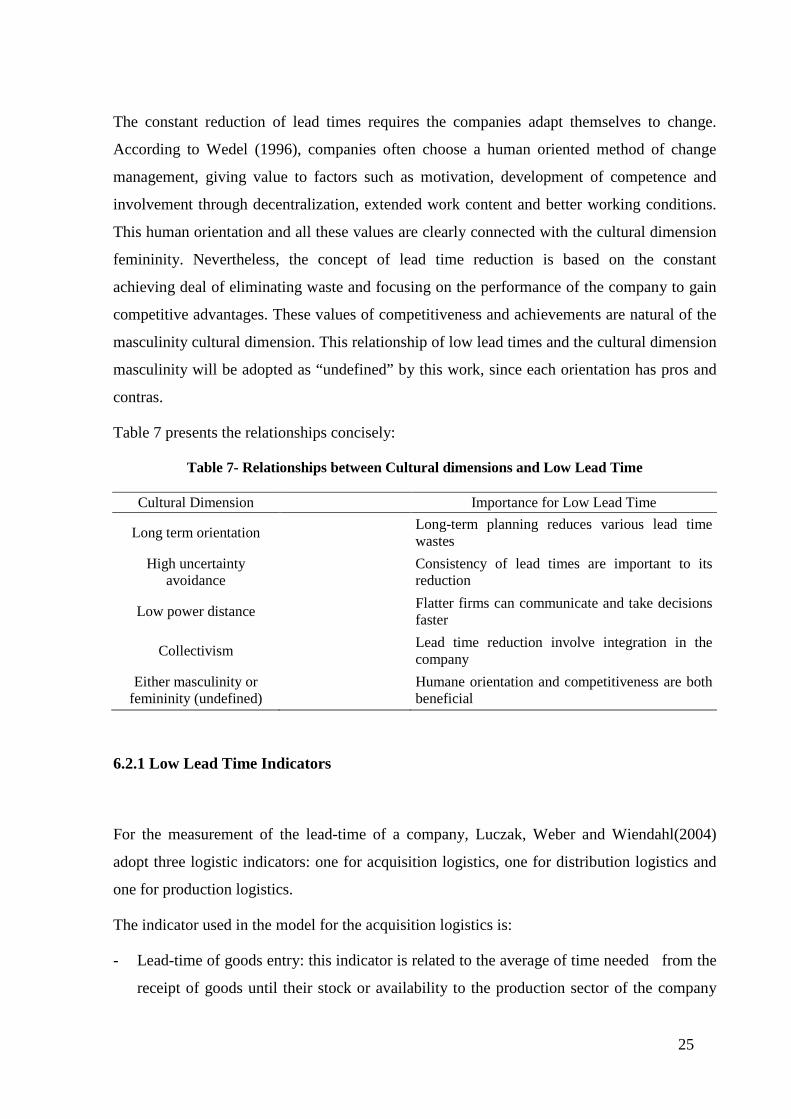
Table 7 presents the relationships concisely:
Table 7- Relationships between Cultural dimensions and Low Lead Time
Cultural Dimension
Importance for Low Lead Time
Long term orientation
Long-term planning reduces various lead time wastes
High uncertainty avoidance
Consistency of lead times are important to its reduction
Low power distance
Flatter firms can communicate and take decisions faster
Collectivism
Lead time reduction involve integration in the company
Either masculinity or femininity (undefined)
Humane orientation and competitiveness are both beneficial
6.2.1 Low Lead Time Indicators
For the measurement of the lead-time of a company, Luczak, Weber and Wiendahl(2004)
adopt three logistic indicators: one for acquisition logistics, one for distribution logistics and
one for production logistics.
The indicator used in the model for the acquisition logistics is:
- Lead-time of goods entry: this indicator is related to the average of time needed from the
receipt of goods until their stock or availability to the production sector of the company
26
per entry of goods order. If the industry is interested in, a deviation of this indicator can be
used too.
For the production logistics, the model suggests the following indicator:
- Percentage of processing time: it represents the percentage of the minimal time needed for
the production process of a product in comparison to the real time consumed by the
company. In that manner, this indicator measures the percentage of time, in which value is
added to a product, leaving, for example, transportation and stock times out of analysis.
The distribution logistics is measured regarding the lead-time performance with the following
indicator:
- Lead-time of goods preparation for distribution: Measures the average time per delivery
order, that are destined to packaging and loading the transport chosen with the products. If
interesting for the company, a deviation of this time can be used as indicator as well.
6.3 Relationship between Cultural Dimensions and High Productivity
The concept of productivity has different perceptions. For assembly-line workers,
productivity may be associated with work effort, to a plant manager may be related with the
measurement of output of the industry, for an executive may refer to the profitability of the
plant and for the consumer may be concerned with the quality of the products and their price
(LEVITAN; WERNEKE, 1984).
Coelli et al. (1998), however, adopt the definition of a firm’s productivity as “the ratio of the
output(s) that it produces to the input(s) that it uses.” This definition is widely spread in the
literature and is adopted in this work for comprehending the other definitions mentioned
above.
Kendrick and Grossman (1980) mention eight internal and external factors that influence the
productivity of a company:
- Basic values and institutions: like desire for material advancement, willingness to work
hard and to save and invest for the future, the willingness to assume responsibilities and
risks, to innovate, and to adapt to change.
- Advances in productive knowledge: the most important determinant of productivity
growth. Refer to technological and organizational progresses applied in the production.
27
- Changes in the quality of labor: like changes in the average education, health, vitality,
age-sex and degree of effort of persons engaged in production.
- Changes in quality of land: changes in natural resources.
- Resource reallocations: this has to do with economic efficiency, i.e., production in
conformity with the community’s preferences.
- Volume- related factors: there are several factors related to the rate and variability of
economic growth that influences the productivity. For example economies of scale,
changes in utilization of capacity and variability of demand.
- Net government services to business: the contributions of government to business
productivity like requirements, regulations, etc.
- Residual factors: factors that affect the productivity and are not included in the categories
before like changes in legal, institutional and social environment within each business
operates that impact on unit real costs.
The high number of factors, which can influence the productivity of a company and make it
change, reflects the necessity of it to be aware of its internal and external environment and be
flexible to these changes. Therefore, high uncertainty avoidance has a negative impact on the
goal high productivity.
Some of these factors like advances in productive knowledge and changes of basic values and
quality of labor and land need a big deal of planning to be used in favor of the firm’s
productivity. Changes in the other factors, otherwise, are normally better known as soon as
possible for the company to have more time to adapt itself. The cultural dimension long-term
orientation has a positive influence on the productivity of a company.
Furthermore, O’ Mahony and van Ark (2003) ensure in their study of productivity at the
company level that companies that invest more in Research and Development have in general
more productivity than the ones that invest less in it. This is due to the intense planning
process involved in this area so that the products can enter the market, which minimizes
unpredicted problems happening in the production phases, which could impact negatively to
the productivity of the company. That is a clear example of the benefits of long-term
orientation contributing to a high productivity.
To achieve greater productivity, management needs to share authority with workers by giving
the employees a greater voice in determining the production processes. Work reform and job
redesign can improve the production process. New channels of communication can improve
28
decision-making at all levels by spurring management efficiency and delegating responsibility
to those actually performing the work. Job satisfaction may also play a major role in worker
productivity, since providing them with a greater share in decision-making can reduce
alienation and, with it, nonproductive practices such as absenteeism, turnover, and poor-
quality work (LAVITAN; WERNEKE, 1984). Higher productivity is therefore negatively
related with the cultural dimension high power distance.
Lavitan and Werneke (1984) also mention the example of the Japanese system of industrial
relations in the quality control circles, which counts with the participation of engineers and
shop-floor employees in order to better achieve the companies’ goals. This cooperation
between workers of different areas is connected with the cultural dimension collectivism and
takes place nowadays in many companies in the called multifunctional teams. Collectivism
has consequently a positive relation with the objective high productivity.
The influence of the masculinity cultural dimension on productivity, however, is difficult to
predict. “A performance orientation encourages challenging goals and creates motivation to
achieve bottom line results (SNELL; DEAN, 1994 apud NAOR; LINDERMAN;
SCHROEDER, 2010)”. Naor, Linderman and Schroeder (2010) defend that assertiveness is
negative and humane orientation is positive for the manufacturing performance, since
negotiation, compromise and sensitivity make relationships between various functions and
divisions more productive, which can help implement high performance manufacturing
practices. Fairness in the internal relationships between employees and in the external
treatment of both suppliers and customers is a key quality attribute for a high productivity too.
The benefits of a masculine organizational culture caused by a performance orientation
encounters opposition of the benefits of low assertiveness and humane orientation,
characteristics of the femininity cultural dimension.
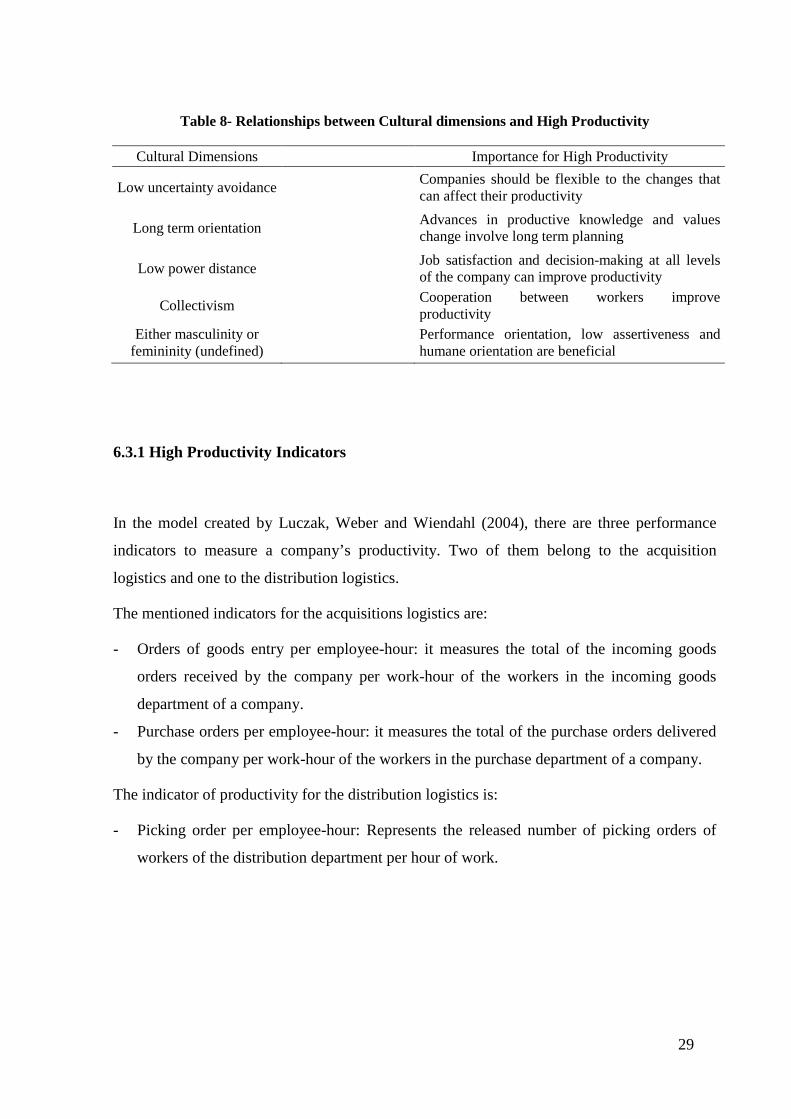
The table 8 presents the relationships mentioned briefly:
29
Table 8- Relationships between Cultural dimensions and High Productivity
Cultural Dimensions
Importance for High Productivity
Low uncertainty avoidance
Companies should be flexible to the changes that can affect their productivity
Long term orientation
Advances in productive knowledge and values change involve long term planning
Low power distance
Job satisfaction and decision-making at all levels of the company can improve productivity
Collectivism
Cooperation between workers improve productivity
Either masculinity or femininity (undefined)
Performance orientation, low assertiveness and humane orientation are beneficial
6.3.1 High Productivity Indicators
In the model created by Luczak, Weber and Wiendahl (2004), there are three performance
indicators to measure a company’s productivity. Two of them belong to the acquisition
logistics and one to the distribution logistics.
The mentioned indicators for the acquisitions logistics are:
- Orders of goods entry per employee-hour: it measures the total of the incoming goods
orders received by the company per work-hour of the workers in the incoming goods
department of a company.
- Purchase orders per employee-hour: it measures the total of the purchase orders delivered
by the company per work-hour of the workers in the purchase department of a company.
The indicator of productivity for the distribution logistics is:
- Picking order per employee-hour: Represents the released number of picking orders of
workers of the distribution department per hour of work.

30
6.4 Relationship between Cultural Dimensions and High Delivery Service
The functions of transport logistics, product handling and inventory management have as
mission to solve place and time problems regarding material flow. As they involve
administration and movement of goods and do not transform the product, they began to be
understood as a service matter. The delivery service basically consists of four dimensions
(VAHRENKAMP, 2011):
- Delivery time, which involves the time between the order placement and the arrival of the
order to the client.
- Delivery reliability that is related with the capacity of the company to fulfill orders in
terms of due dates and production.
- Delivery consistency, which measures the accuracy of the company to meet the exact
quantity of good products ordered and the exact way that the delivery should be done.
- Delivery flexibility, which regards to the available order modalities (related to the ways of
communication that they can proceed), delivery modalities that is related to the mode and
manner that the material flow can happen and delivery information availability to the
customers, that is bound with the ability of the company to inform the customers about the
distribution process (if some problem occurred or not).
Analyzing the dimensions of the delivery service suggested by Vahrenkamp (2011), it is
possible to predict that high power distance is negative to a high delivery service. Since the
information flow and decision-making process is faster in low power distance organizations,
the delivery time tends to be shorter, the ability of the company to attend due dates tend to be
higher and the delivery information should be available for the customer faster. Additionally,
the employees are less alienated about the production process and more motivated to work
and give suggestions to improve the efficiency of the production and material flow, which
tend to improve the ability of the company to meet customers’ orders in terms of production
and delivery consistency. High power distance is, as a result, negative to a high delivery
service.
Since customer’s orders and requirements are different, companies should adopt different
plans and strategies to meet them (BALLOU, 1987). It is task of the modern logistics to
provide its functions with the comprehensive planning, use of networks, intelligent controlling
and precise control of materials to achieve the desired delivery service (VAHRENKAMP,
31
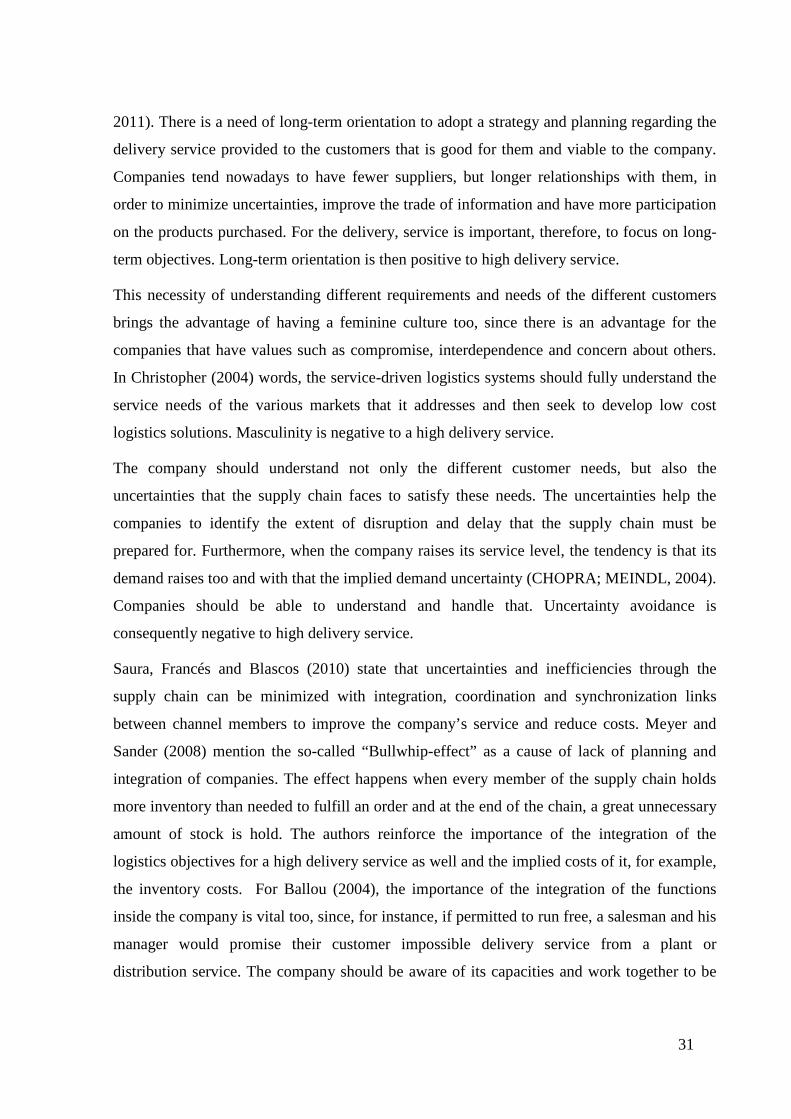
2011). There is a need of long-term orientation to adopt a strategy and planning regarding the
delivery service provided to the customers that is good for them and viable to the company.
Companies tend nowadays to have fewer suppliers, but longer relationships with them, in
order to minimize uncertainties, improve the trade of information and have more participation
on the products purchased. For the delivery, service is important, therefore, to focus on long-
term objectives. Long-term orientation is then positive to high delivery service.
This necessity of understanding different requirements and needs of the different customers
brings the advantage of having a feminine culture too, since there is an advantage for the
companies that have values such as compromise, interdependence and concern about others.
In Christopher (2004) words, the service-driven logistics systems should fully understand the
service needs of the various markets that it addresses and then seek to develop low cost
logistics solutions. Masculinity is negative to a high delivery service.
The company should understand not only the different customer needs, but also the
uncertainties that the supply chain faces to satisfy these needs. The uncertainties help the
companies to identify the extent of disruption and delay that the supply chain must be
prepared for. Furthermore, when the company raises its service level, the tendency is that its
demand raises too and with that the implied demand uncertainty (CHOPRA; MEINDL, 2004).
Companies should be able to understand and handle that. Uncertainty avoidance is
consequently negative to high delivery service.
Saura, Francés and Blascos (2010) state that uncertainties and inefficiencies through the
supply chain can be minimized with integration, coordination and synchronization links
between channel members to improve the company’s service and reduce costs. Meyer and
Sander (2008) mention the so-called “Bullwhip-effect” as a cause of lack of planning and
integration of companies. The effect happens when every member of the supply chain holds
more inventory than needed to fulfill an order and at the end of the chain, a great unnecessary
amount of stock is hold. The authors reinforce the importance of the integration of the
logistics objectives for a high delivery service as well and the implied costs of it, for example,
the inventory costs. For Ballou (2004), the importance of the integration of the functions
inside the company is vital too, since, for instance, if permitted to run free, a salesman and his
manager would promise their customer impossible delivery service from a plant or
distribution service. The company should be aware of its capacities and work together to be
32
more efficient in terms of delivery service. Collectivity is, for that reason, positive to a high
delivery service.
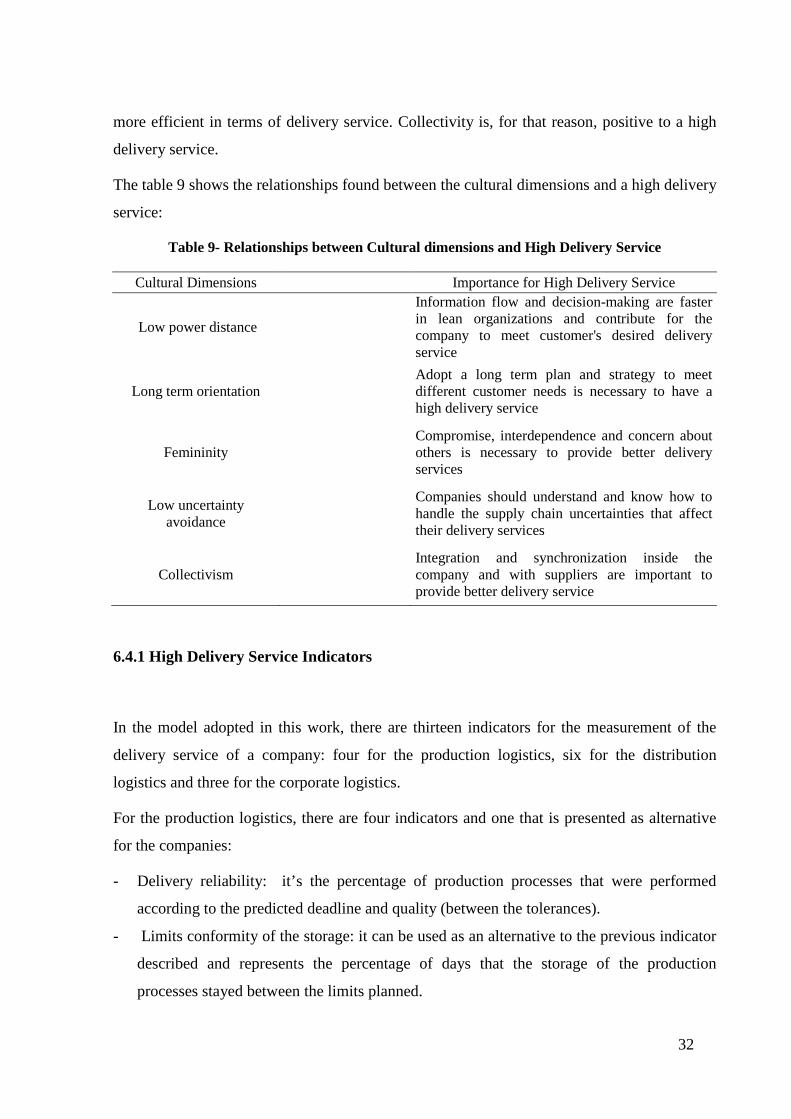
The table 9 shows the relationships found between the cultural dimensions and a high delivery
service:
Table 9- Relationships between Cultural dimensions and High Delivery Service
Cultural Dimensions
Importance for High Delivery Service
Low power distance
Information flow and decision-making are faster in lean organizations and contribute for the company to meet customer's desired delivery service
Long term orientation
Adopt a long term plan and strategy to meet different customer needs is necessary to have a high delivery service
Femininity
Compromise, interdependence and concern about others is necessary to provide better delivery services
Low uncertainty avoidance
Companies should understand and know how to handle the supply chain uncertainties that affect their delivery services
Collectivism
Integration and synchronization inside the company and with suppliers are important to provide better delivery service
6.4.1 High Delivery Service Indicators
In the model adopted in this work, there are thirteen indicators for the measurement of the
delivery service of a company: four for the production logistics, six for the distribution
logistics and three for the corporate logistics.
For the production logistics, there are four indicators and one that is presented as alternative
for the companies:
- Delivery reliability: it’s the percentage of production processes that were performed
according to the predicted deadline and quality (between the tolerances).
- Limits conformity of the storage: it can be used as an alternative to the previous indicator
described and represents the percentage of days that the storage of the production
processes stayed between the limits planned.
33
- Delivery quantity reliability: this indicator describes the percentage of production
processes that produced the right quantity of good products (in respect of quality).
- Delivery deadline reliability: percentage of production processes that were completed in
the right time (deadline).
- Delivery deadline deviation: deviation of the time of end of the production processes
according to the deadlines.
For the distribution logistics, the model describes the following performance indicators:
- Service rate: percentage of customers’ orders correctly delivered in terms of quantity of
good products and right delivery date.
- Ratification rate of deadlines to clients: percentage of orders accepted by the customers in
terms of right delivery date (it represents the right delivery date in the point of view of the
client).
- Delivery reliability: percentage of orders delivered according to the stipulated time
(accepted by the customer and confirmed by the supplier) and quantity of good products
in terms of quality.
- Shipping deadline reliability: percentage of shipping orders that occurred in the agreed
time, accepted by the customer and confirmed by the supplier.
- Shipping deadline deviation: average deviation in workdays between the date that the
shipping should have occurred and the day that the shipping was performed.
- Complaint ratio: percentage of customers’ complaints per shipment order in a predefined
period.
For the measurement of the delivery service in the corporate logistics, the model uses the
indicators service rate, delivery reliability and delivery deadline deviation, which were
already described.
6.5 Relationship between Cultural Dimensions and Low Stock Costs
According to Ballou (1987), there are three relevant costs when managing inventories:
- Carrying costs: these costs are associated with holding a quantity of goods for a period of
time. Cost of capital is one component of this cost, since inventory ties up capital that
could be spent in other ways. Therefore, there is inventory service costs as taxes and
34
insurance. There are also storage-space costs, inventory-risk costs due to deterioration or
obsolescence, damage and pilferage.
- Procurement costs: these are related to acquiring the needed quantities for stock
replenishment and include the cost of processing an order through Order-Processing,
Accounting, and/ or Purchasing Departments, the cost of transmitting the order to the
supplier, cost of setting up production or handling procedures to fill the order cost of
materials handling or processing of the order at the receiving dock and the cost of the
goods.
- Out- of- stock costs: when the demands cannot be matched by the stocks there can be lost-
sales costs, when a customer withdraw his order as well as the profits that may not be
realized as a result of the impossibility of attending this demand, or backorder costs, when
a customer is willing to delay the purchasing but adopt additional costs for the waiting.
Ballou (1987) states that planning and controlling of inventories is a matter of balancing
carrying, procurement and out-of stock costs, since the more that is held in inventory, the
higher are the inventory-carrying costs, but larger orders (needed for maintain the high
inventory level) causes lower procurement and out-of stock costs. Furthermore, according to
Christopher (2004), fifty percent or more of a company’s assets will often be tied up in
inventory and the company’s policies on inventory levels and stock locations will clearly
influence the size of the total inventory. The size of inventory is affected too by the extent to
which inventory levels are monitored and managed, and the extent to which systems are in
operation, which minimize the requirements for inventory. As conclusion, long-term
orientation is positive to maintain low stock costs.
For Chadwick and Waddington (1982), the fear of a "stock-out" can lead to overstocking.
Staff should be made well aware of the dangers of overstocking and attitudes changed to
"stocks should be kept at minimum acceptable levels." The aim should be a stocking policy
designed to "match up" with the budgeted sales and flexible enough to respond quickly to
meet changed market conditions. Therefore, high uncertainty avoidance is negative to have
low stock costs.
This necessity of awareness of the danger of overstocking and of changing attitudes to
maintain stock at minimum levels is a factor that shows the benefits of collectivity too.
Additionally to that, the objective of maintaining low stock costs is better handled when the
functional departments work integrated, since inventory levels can be affected by many
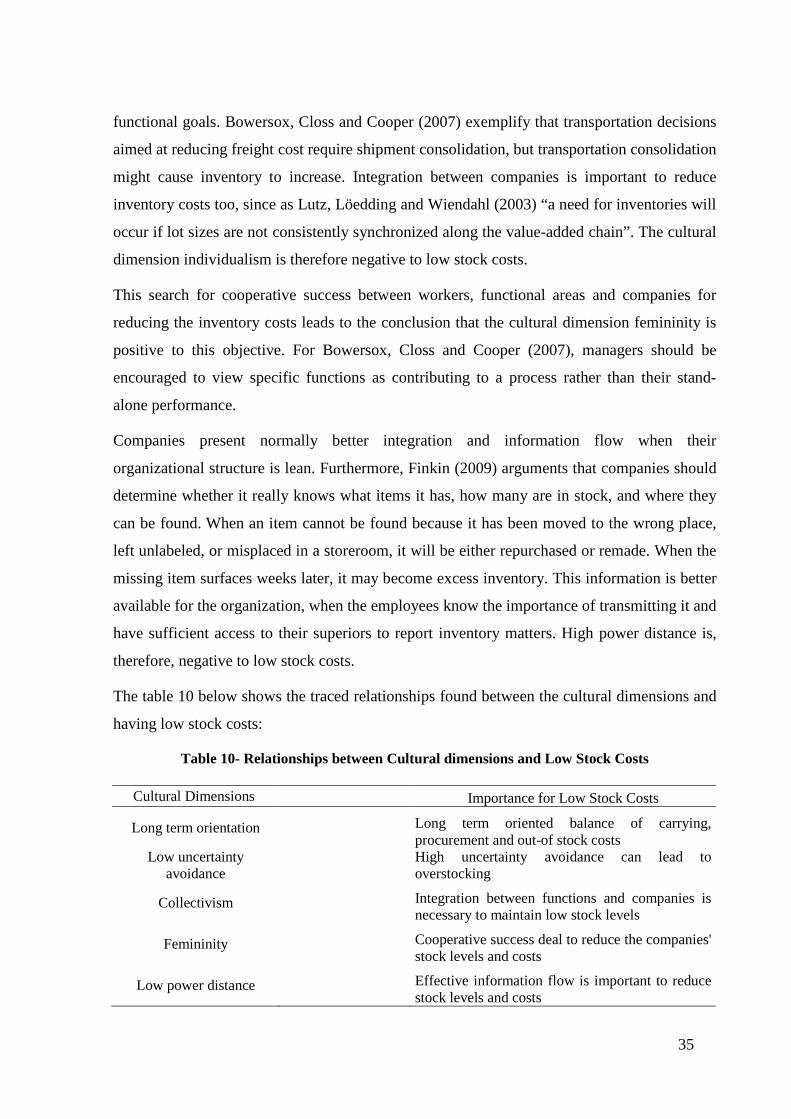
35
functional goals. Bowersox, Closs and Cooper (2007) exemplify that transportation decisions
aimed at reducing freight cost require shipment consolidation, but transportation consolidation
might cause inventory to increase. Integration between companies is important to reduce
inventory costs too, since as Lutz, Löedding and Wiendahl (2003) “a need for inventories will
occur if lot sizes are not consistently synchronized along the value-added chain”. The cultural
dimension individualism is therefore negative to low stock costs.
This search for cooperative success between workers, functional areas and companies for
reducing the inventory costs leads to the conclusion that the cultural dimension femininity is
positive to this objective. For Bowersox, Closs and Cooper (2007), managers should be
encouraged to view specific functions as contributing to a process rather than their stand-
alone performance.
Companies present normally better integration and information flow when their
organizational structure is lean. Furthermore, Finkin (2009) arguments that companies should
determine whether it really knows what items it has, how many are in stock, and where they
can be found. When an item cannot be found because it has been moved to the wrong place,
left unlabeled, or misplaced in a storeroom, it will be either repurchased or remade. When the
missing item surfaces weeks later, it may become excess inventory. This information is better
available for the organization, when the employees know the importance of transmitting it and
have sufficient access to their superiors to report inventory matters. High power distance is,
therefore, negative to low stock costs.
The table 10 below shows the traced relationships found between the cultural dimensions and
having low stock costs:
Table 10- Relationships between Cultural dimensions and Low Stock Costs
Cultural Dimensions Importance for Low Stock Costs
Long term orientation
Long term oriented balance of carrying, procurement and out-of stock costs
Low uncertainty avoidance
High uncertainty avoidance can lead to overstocking
Collectivism
Integration between functions and companies is necessary to maintain low stock levels
Femininity
Cooperative success deal to reduce the companies' stock levels and costs
Low power distance
Effective information flow is important to reduce stock levels and costs
36
6.5.1 Low Stock Costs Indicators
In the model of Luczak, Weber and Wiendahl (2004) there are six performance indicators to
measure the stock costs: one for the acquisition logistics, three for the production logistics,
one for the distribution logistics and one for the corporate logistics.
The performance indicator used for the acquisition logistics is:
- Inventory turnover rate: it gives information about the times per period (in the model the
period adopted is one year) a company sells and replenishes its stock of finished products.
This indicator is calculated as the quotient of the sum of the value of all the goods sold in
the period and the average value of the inventory.
For the production logistics the indicators are:
- Inventory turnover rate of total stock: it represents the times per period (in the model one
year) that a company ends and replenishes its total stock dispatched to production. It is
calculated as the costs of the materials dispatched to production in one year divided by the
sum of the cost of the average of materials present in stock and the cost of the average of
unfinished goods present in the waiting queue to be processed.
- Inventory turnover rate of materials: it represents the times per period (in the model one
year) that the company ends and replenishes its stock of material. It is calculated as the
costs of the material that leaves the area of stock (raw material and unfinished goods)
divided by the average cost of the materials present in stock.
- Inventory turnover rate of work in process: it represents the times per period (in the model
one year) that the company ends and replenishes its stock of unfinished goods waiting to
be processed. It is calculated as the cost of the all the unfinished goods that proceeded to
the production in one year divided by the costs of the average number of unfinished goods
normally waiting in the queue to be processed.
For the distribution logistics, the indicator used is:
Inventory turnover rate: its related to the capital present in the distribution stocks. It is
calculated as the quotient of the sum of the value of all the products dispatched by the
distribution department and average value of the stock present in the distribution sector of a
company ( until the load of the goods into a transport).
The corporate logistics counts with the following indicators of stock performance:
37
- Total inventory turnover rate: Represents the turnover rate of all the goods present in the
company. It is calculated as the quotient of the estimated value of all the salable products of
the company and the sum of all the average stocks present in the company (of the distribution
and production and finished or unfinished goods).
6.6 Relationship between Cultural Dimensions and Low Process Costs
Logistics cuts across traditional company organizations functions with cost impacts on most
of these functions. The cost of processing orders for example is an amalgam of costs that
incur in different functional areas and that are difficult to bring together. For that reason,
logistics decisions made to one process (like transportation, procurement, production, etc.),
can have unpredicted results in other processes (CHRISTOPHER, 2004). Engblom et al.
(2011) divide the logistics costs into six components: transport, warehousing, inventory
carrying, logistics administration, transport packaging, and indirect costs of logistics. In this
work, inventory carrying was still mentioned as being related to the other logistics objective
“low stock costs”.
For Ballou (1987), understanding the trade-offs like production versus transportation and
customer service versus all logistics costs helps to set the scope of the logistics plan and when
some of the major cost elements are not considered, suboptimal plans are done. Bowersox,
Closs and Cooper (2007) also state that the logistics interface with procurement,
manufacturing engineering and marketing can be greatly enhanced with the incorporation of
Design for Logistics into the early phases of product development, since product and
components design should consider transportation and internal materials handling methods to
ensure that cost-efficient, damage-free logistics can be achieved. This brings out the necessity
of long-term orientation, to position the logistics strategy of the company, in order to reduce
logistics process costs in general. Long-term orientation is, consequently, positive for having
low process costs.
Since there are trade-offs between the different processes of logistics, integration and
cooperation between them is necessary to achieve the minimal costs desired for the customer
service needed. Christopher (2004) reinforces also that external integration is important to
maintain low process costs in logistics, as purchased materials and supplies not only represent
a significant part of the total costs in most organizations, but there is a major opportunity for
38
leveraging the capabilities and competencies of suppliers through closer integration of the
buyers’ and suppliers’ logistics processes. Collectivism is, as a result, positive to low cost of
logistics processes.
This search for collectivity to achieve low costs implies to a necessity for compromise and
cooperative success, characteristics of a feminine culture. Ballou (1987) introduces methods
that the companies can use to encourage coordination between the logistics processes like an
incentive system that establishes a series of cross charges, or transfer costs, among various
logistics activities; or an incentive system that establishes some form of a cost-saving
arrangement between the functions. Femininity is, as conclusion, positive to low process
costs.
As discussed before in this work, low power distance prevents unnecessary costs in the
logistics processes regarding delayed and sometimes failed information flow, improves
employees satisfaction, which can lead to reduced costs in some processes and reduce their
alienation, in order that they can easier take responsibilities and don’t occupy the managers
time with sometimes “simple” decisions. Ballou (1987), however, recognizes the importance
of having hierarchy, since “only a manager has the scope to balance the operations to achieve
the highest level of efficiency” and oversee the product movement, in order to equilibrate
customer service and the costs to produce the service. The relationship between high power
distance and low process costs will be considered by this work as “undefined”.
For Chopra and Meindl (2004), the abilities to handle uncertainties and provide
responsiveness to logistics comes at a cost. Respond to a wider range of quantities demanded,
for example, demands capacity to be increased and that increases costs. Further abilities like
meet short lead times, handle a large variety of products, build highly innovative products,
meet a very high service level and handle supply uncertainty imply additional costs.
Uncertainty avoidance is, therefore, positive to low process costs.
The table 11 presents the relationships discussed concisely:

39
Table 11- Relationships between Cultural dimensions and Low Process Costs
Cultural Dimensions Importance for Low Process Costs
Long term orientation
Need to consider all logistics costs elements and manage the logistics trade-offs with long term orientation
Collectivism
Integration between company's functions to explore better the logistics costs trade-offs and between Organizations and suppliers to have lower process costs
Femininity
Necessity for compromise and cooperative success between functions and companies
Either high or low power distance (undefined)
Faster information flow, employees satisfaction and responsibilities share are important, but hierarchy is important as well
High uncertainty avoidance
Abilities to handle uncertainties and provide responsiveness to logistics comes at a cost
6.6.1 Low Process Costs Indicators
In the model adopted in this work by Weber and Wiendahl (2004), there are nine performance
indicators related to the measurement of the process costs.
The indicators for the acquisition logistics are:
- Costs per purchase order: average cost of strategic and operative purchase orders that
incur to the purchase department including staff and material expenses.
- Costs per order of entry of goods: average cost of the orders that incur to the incoming
goods department considering staff and material expenses.
- Cost of quality tests per order of entry of goods: average of quality tests costs (including
the compilation of a quality proof document) of the incoming goods considering quality
tests and staff expenses
For the production logistics, the indicators are:
- Costs of the production logistics per production order: average cost per production order
of the costs related to the production logistics, that involve the production planning and
controlling and the internal transport of the materials at the company, regarding material
and staff expenses.
40
- Cost of the transport per production order: average cost per production order of the
personnel and material expenses related to the transport of materials inside the company.
- Cost of the production planning per production order: Average cost per production order
of the staff and material expenses regarding the production planning and controlling.
For the distribution logistics, the indicators are:
- Average costs of distribution per picking order: average costs regarding personnel and
material expenses of the distribution activities from the release of the goods from the
stock until their loading in a transport method per picking order. The costs of distribution
planning and controlling for the coordination of the flow of materials should be accounted
too.
- Costs of transport per delivery shipment: average costs related to staff and material
expenses of the process of planning and sending the goods for the customers. The costs of
the distribution planning and controlling that are necessary to the shipment should be
accounted too.
The indicator used by the corporate logistics according to the model is:
- Total logistics costs/ value added: percentage of the corporate logistics costs that are used
to add value to the products to be sold. The corporate logistic costs are the staff costs of
the purchasing, production, distribution, logistic service, order contact service and
coordination and the central logistics departments added to the material costs of the
distribution and logistics service departments. The value added of the formula is
calculated as the sales amount differed by the material costs.
6.7 Comparison between Brazil and Germany concerning the Logistics Performance
Once the relationships of the logistics objectives of the performance indicators and the cultural
dimensions of Hofstede are defined, it is possible to compare the national culture of Brazil and
Germany in order to identify possible advantages and disadvantages that the companies can encounter
in each country and that can contribute to a better logistics performance.
Graph 3 brings the comparison between the two countries regarding their national cultures:
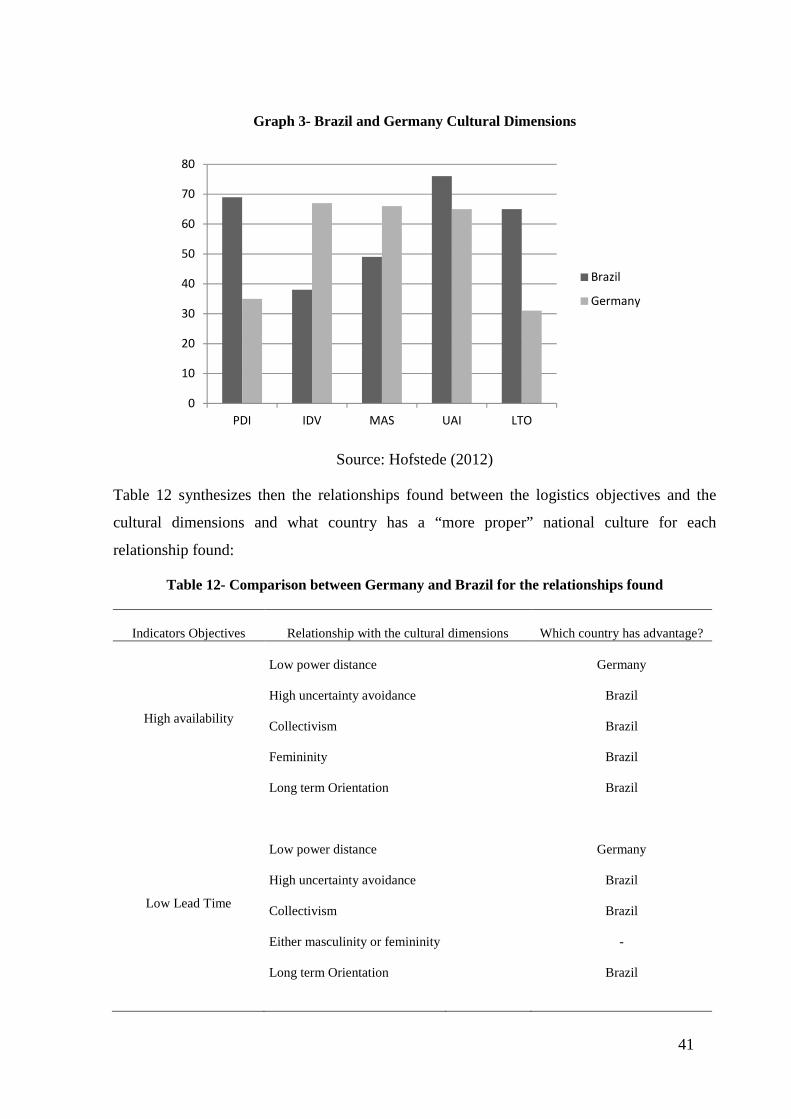
41
Graph 3- Brazil and Germany Cultural Dimensions
Source: Hofstede (2012)
Table 12 synthesizes then the relationships found between the logistics objectives and the
cultural dimensions and what country has a “more proper” national culture for each
relationship found:
Table 12- Comparison between Germany and Brazil for the relationships found
Indicators Objectives Relationship with the cultural dimensions Which country has advantage?
High availability
Low power distance Germany
High uncertainty avoidance Brazil
Collectivism Brazil
Femininity Brazil
Long term Orientation Brazil
Low Lead Time
Low power distance Germany
High uncertainty avoidance Brazil
Collectivism Brazil
Either masculinity or femininity -
Long term Orientation Brazil
0
10
20
30
40
50
60
70
80
PDI IDV MAS UAI LTO
Brazil
Germany
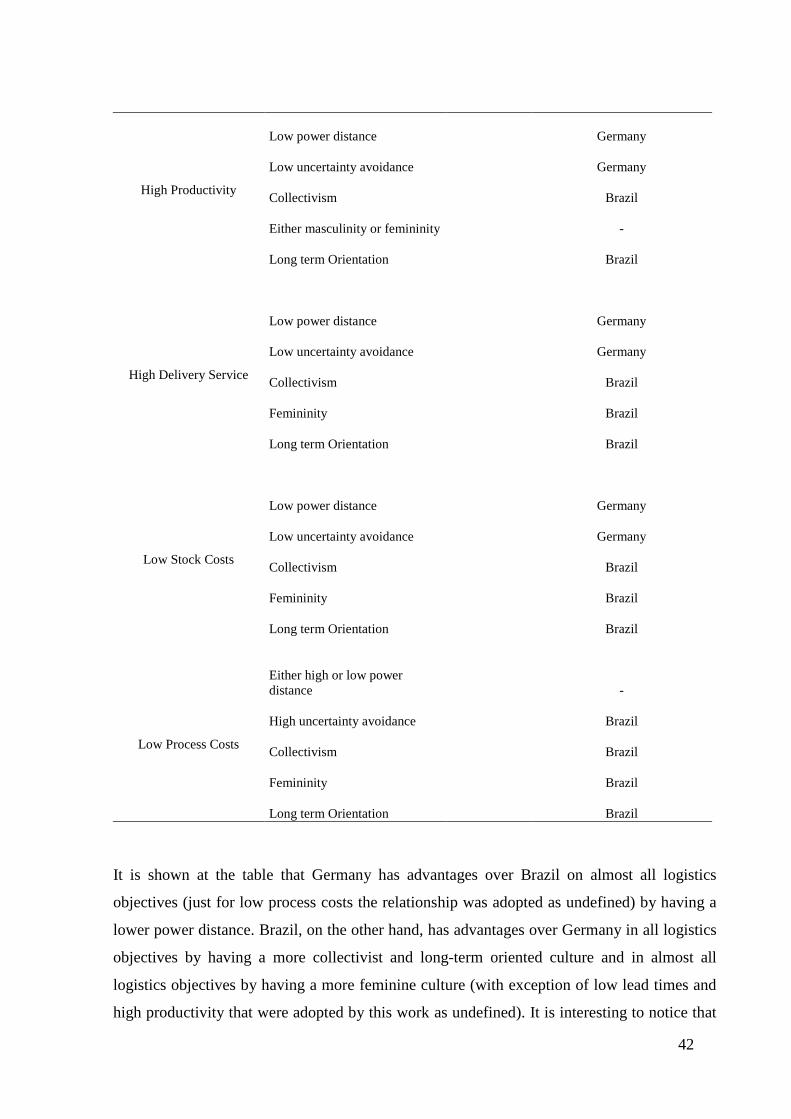
42
High Productivity
Low power distance Germany
Low uncertainty avoidance Germany
Collectivism Brazil
Either masculinity or femininity -
Long term Orientation Brazil
High Delivery Service
Low power distance Germany
Low uncertainty avoidance Germany
Collectivism Brazil
Femininity Brazil
Long term Orientation Brazil
Low Stock Costs
Low power distance Germany
Low uncertainty avoidance Germany
Collectivism Brazil
Femininity Brazil
Long term Orientation Brazil
Low Process Costs
Either high or low power distance -
High uncertainty avoidance Brazil
Collectivism Brazil
Femininity Brazil
Long term Orientation Brazil
It is shown at the table that Germany has advantages over Brazil on almost all logistics
objectives (just for low process costs the relationship was adopted as undefined) by having a
lower power distance. Brazil, on the other hand, has advantages over Germany in all logistics
objectives by having a more collectivist and long-term oriented culture and in almost all
logistics objectives by having a more feminine culture (with exception of low lead times and
high productivity that were adopted by this work as undefined). It is interesting to notice that
43
these four cultural dimension orientations (low power distance, collectivism, long-term
orientation and femininity) are really a tendency for the logistics nowadays, since the new
supply chain theories are based on empowerment, integration, fewer suppliers and
collaborative success between the functions of the company and between the members of a
supply chain. Companies with such values and culture orientation are expected, therefore, to
have benefits in their logistical performance.
The effect of the cultural dimension uncertainty avoidance on the logistics overall
performance of both countries is difficult to analyze. Both countries have relative high
uncertainty avoidance (Brazil has 76 and Germany 65 as score in this dimension). Germany
would probably have benefits from having lower uncertainty avoidance when trying to
achieve a higher productivity, higher delivery service and lower stock costs. This may occur
by the high number of external uncertainties that can interfere in these objectives and the
necessary ability to deal with them to achieve a better performance in these areas. Brazilian
companies, however, would have advantages concerning this dimension when trying to
achieve higher availability, low lead-time and low process costs. These logistical objectives
are normally result of efficient and consistent operations and could then benefit from
environments with lower risk.
Another point that needs attention is that when compared to Germany, Brazilian culture is
very proper to have lower logistics process costs. In the future, a comparison or benchmarking
study between companies of both countries could be done to better analyze if the influence of
the national culture can really affect the logistics performance indicators that cover this
objective.
44
7. Conclusions
This thesis analyzes the qualitative influences that the five cultural dimensions of Hofstede
have in the logistics performance indicators by Luczak, Weber and Wiendahl (2004) through
the logistics objectives that they are connected. A qualitative comparison between the German
and the Brazilian national cultures with regards to the performance in the logistic objectives
was made as well.
The cultural dimensions are important to understand how national and organizational cultures
differ. This knowledge is very important in a globalized world, where the companies have to
maintain relationships with different companies, several times from different countries.
Since culture have influence on how people work and relation with others, how the company
works and pursue its objectives and consequently how the performance of a firm is, this
knowledge is very useful for the companies to build its organizational culture. Furthermore, it
is important to understand how to act better in the desired environment or market, how to
relate itself with different companies and how to be more competitive too.
It is essential to say also that although in this work, the logistics objectives related to the
performance indicators are analyzed and related to the cultural dimensions separately, they
have a broad interface and should not be pursued individually by the companies. There is
clearly trade-offs between having, for example, a high availability and low stock costs. The
major contribution of this work is to understand how the culture influences on the logistical
performance of a firm and how the organization can prepare itself to have a better
performance in it. As showed, integration and collectivity are critical factors of success for
every logistical objective and for an overall better logistical performance, the objectives of the
logistics should be treated as parts of a whole that function better when integrated.
The limitations of this project are clear. As it is a theoretical study, it was not possible to
conclude objectively what country, Brazil or Germany, have a more proper culture to the
companies succeed to have a better logistical performance. Even though the relationships of
the cultural dimensions with the logistics objectives were clear, it was not possible to identify,
for instance, if it was Germany’s lower power distance and uncertainty avoidance or the
Brazil’s higher collectivism and more long-term orientated culture that should impact more on
having a higher productivity performance. Another limitation is that the study of culture
encompasses many particularities and, naturally, culture is not uniform. It is, as a result,
45
difficult to evaluate the expected logistics performance of a company based on its national
culture, as in one nation the companies are different and the people involved too.
Further suggestions of study would be the development of a method to measure the
implications and relative importance of each cultural dimension on the main logistical
objectives and as consequence performance indicators presented in this work. This study
could be very useful for companies to restructure its strategy and its organizational culture
with focus on their logistical performance, and to have a more precise tool to evaluate
logistics trade-offs regarding the cultural dimensions too. Another suggestion of study would
be the comparison concerning the logistical performance of companies in similar markets in
Brazil and Germany. As this study provides a research about the performance indicators that
can be used and the theoretical basis of the culture comparison between the countries, a
posterior comparison of companies of the two countries would be important to validate the
theoretical relationships found in this study and to investigate the validity of the influence of
the national culture on the logistics performance of companies. Further possibilities of study
could be a practical research about how to manage and change a company’s culture with its
logistical performance in view or how to plan a new company and build its strategy
considering its desired logistical performance.
As a final point, the main objectives planned at the beginning of this research project were
achieved. Besides the limitations of this theoretical research, the influence of the culture on
the logistics KPI’s was analyzed and the relative advantages and disadvantages of the
Brazilian and German national cultures in terms of logistical performance was investigated
with basis in important authors and journals. A basis for a future study of comparison between
a German and a Brazilian company in terms of its cultural dimensions and logistics
performance was also made by the selection and explanation of the logistics performance
indicators model by Luczak, Weber and Wiendahl (2004).
46
8. Final Considerations
This study observed that, for the logistics performance of a company, the cultural dimensions
of low power distance, collectivism, femininity and long term orientation are important.
Although it was not the objective of this assignment, it is significant to mention that the
companies can implement these values through different methods and with different tools. In
fact, there are also different ways and apparatus to pursue the logistics objectives. Sales and
Operations Planning (S&OP), for example, is a concept that can be used to achieve a better
integration between functions of the company and help them achieve lower logistical costs
and higher service levels. Design for Logistics can also, through long term orientation, reduce
logistical costs and improve service levels. As well as this two logistics management theories
there are others that can bring benefits to the performance of the company like the Warehouse
Management System (WMS), Enterprise Resource Planning (ERP), Just in Time, etc.
Besides, this project opens a wide range of possibilities, not only of a practical study between
companies of Germany and Brazil, but also between other countries. This could be an
interesting tool for benchmarking in the logistics sector.
As this study focus on the performance of logistics, it seems clear that the cultural dimensions
can impact also in other functions like production, quality, etc. Since almost all companies
nowadays have a culture and divulgate it to their employees, but the reason of adoption of this
values are mainly historical, this studies could be also of high importance for the companies
to rationalize their organizational culture and emphasize the importance of maintaining this
values to their employees.
Regarding the insertion of this study in the actual economic situation of both countries it was
interesting to analyze that, although Germany could have cultural advantages in some
logistics aspects by having lower Uncertainty Avoidance than Brazil, Germany is passing
through a high uncertainty situation due to the European crisis and at the moment the logistics
sector, as the whole European economy, is struggling to regain its usual competitiveness. As a
practical study between companies of both countries was suggested, this crisis could have a
negative effect on the conclusions.
47
References
BALLOU, R. Basic business logistics: Transportation, materials management, physical
distribution. 2. Ed. New Jersey: Prentice- Hall, 1987.
BALLOU, R. Business logistics/ Supply chain management. 5.ed. New Jersey: Pearson,
2004.
BOWERSOX, D. J.; CLOSS, D. J.; COOPER, M. B. Supply chain logistics management.
2.ed. New York: McGraw-Hill, 2007.
BYRNE, G; BRADLEY, F. Culture’s influence on leadership efficiency: How personal and
national cultures affect leadership style. Journal of business research, v.60, p. 168-175,
2007.
CHADWICK, L; WADDINGTON, A. Inventory Control: how to reduce stockholding costs.
International Journal of Retail & Distribution Mana gement, v. 10, i. 3, p. 61 – 62, 1982.
CHARNEY, C. Time to market: Reducing product lead time. 1. Ed. Michigan: Society of
Manufacturing Engineers, 1991.
CHOPRA, S; MEINDL, P. Supply Chain Management: Strategy, Planning, and Operations.
2. Ed. New Jersey: Pearson, 2004.
CHRISTOPHER, M. Logistics and Supply Chain Management: Strategies for reducing cost
and improving service. 2. Ed. Prentice-Hall, 2004.
CHRISTOPHER, M. Marketing and logistics: A new area of management concern.
Industrial Marketing Management , Amsterdam, v.2, p. 131-144, 1973.
COELLI, T; Rao, D; O'Donnell, C; Battese, G. An introduction to efficiency and
productivity analysis. 2. Ed. New York: Springer, 1998.
COUNCIL OF SUPPLY CHAIN MANAGEMENT PROFESSIONALS. CSCMP Supply
Chain Management Definitions. Available on:
<http://cscmp.org/aboutcscmp/definitions.asp>. Access at: 10/06/ 2012.
ELLINGER, A; DAUGHERTY, P; GUSTIN, C. The Relationship between Integrated
Logistics and Customer Service. Transportation Research Part E: Logistics and
Transportation Review, v. 33, I. 2, p. 129-138, 1997.
48
ENGBLOM, J; SOLAKIVI, T; TÖYLI, J; OJALA, L. Multiple-method analysis of logistics
costs. International Journal of Production Economics, v.137, p. 29-35, 2011.
FINKIN, E. How to Limit Inventory Expenses. Journal of Business Strategy, v. 10, i. 1, p.
50 – 53, 1989.
GOTZAMANI, K; LONGINIDIS, P; VOUZAS, F. The logistics services outsourcing
dilemma: quality management and financial performance perspectives. Supply Chain
Management: An International Journal, v. 15, i. 6, p. 438 – 453, 2010.
GUIRDHAM, M. Communicating across cultures. Basingstoke : Macmillan Business, 1999.
HILL, R. Measuring Stock Service Levels. Logistics Information Management, v. 4, i. 4, p.
8 – 11, 1991.
HOFSTEDE, G. Culture’s consequences: comparing values, behaviors, institutions, and
organizations across nations. 2. ed. Thousand Oaks, CA: Sage Publications, 2001.
HOFSTEDE, G. Culture’s consequences: international differences in work-related values.
Beverly Hills: Sage, 1980.
HOFSTEDE, G. Geert Hofstede TM Cultural Dimensions. Available on: <http://www.geert-
hofstede.com>. Access at: 06/06/2012 .
HOOKER, J. Working across cultures. Stanford, Calif: Stanford University Press, 2003.
KENDRICK, J; GROSSMAN, E. Productivity in the United States: Trends and cycles.
Maryland: The John Hopkins University Press, 1980.
LEVITAN, S; WERNEKE, D. Productivity : Problems, prospects and policies. Maryland:
The John Hopkins University Press, 1984.
LUCZAK, H; WEBER, J; WIENDAHL, H. Logistik- Benchmarking: Praxisleitfaden mit
LogiBEST. 2. Ed. Berlin: Springer, 2004.
LUTZ, S; LÖEDDING, H; WIENDAHL, H. Logistics-oriented inventory analysis.
International Journal of Production Economics, v. 85, p. 217–231, 2003.
MANRODT, K; DAVIS, F. The Evolution to Service Response Logistics. International
Journal of Physical Distribution & Logistics Management, v. 23, i.5, p. 56 – 64, 1993.
MEYER, J; SANDER, U. Bestände senken, Lieferservice steigern: Ansatzpunkt
Bestandsmanagement. Aachen: Forschungsinstitut für Rationalisierung, 2008.
49
NAOR, M; LINDERMAN, K; SCHROEDER, R. , 2010. The globalization of operations in
Eastern and Western countries: Unpacking the relationship between national and
organizational culture and its impact on manufacturing performance. Journal of Operations
Management, v. 28, p. 194-205, 2010.
NILSSON, F. Logistics management in practice: Towards theories of complex logistics. The
international journal of logistics management, v. 17, n. 1, p. 38-54, 2006.
O’MAHONY, M; VAN ARK, B. EU productivity and competitiveness: An industry
perspective. Luxembourg: Enterprise publications, 2003.
SAURA, I; FRANCÉS, D; BLASCO, M. Antecedents and consequences of logistics value:
An empirical investigation in the Spanish market. Industrial Marketing Management , v.39,
p. 493–506, 2010.
SCHEIN, E. H. Organizational culture and leadership. 1. Ed. San Francisco: Jossey-Bass,
1989.
TERSINE, R; HUMMINGBIRD, E. Lead-time reduction: the search for competitive
advantage. International Journal of Operations & Production Ma nagement, v. 15, i. 2, p.
8 – 18, 1995.
VAHRENKAMP, R. Die Logistische Revolution: Der Aufstieg der Logistik in der
Massenkonsumgesellschaft. Frankfurt am Main: Campus Verlag, 2011.
WEDEL, J; LUMSDEN, K. The influence of lead-time reductions on decisions and rules in the production planning process. International Journal of Production Economics, v. 41, p.399-404, 1995.
WEDEL, J. Lead time reduction in manufacturing: From initiation to realization. Göteborg:
Department of transportation and logistics Chalmers University of Technology, 1996.