Telescope performance and image simulations of the balloon ...
16
Introduction The Technique Image reconstruction and SNR Conclusions Telescope performance and image simulations of the balloon-borne coded-mask protoMIRAX experiment Ana Virginia Penacchioni In collaboration with Jo˜ ao Braga, Manuel Castro and Flavio D’Amico Instituto Nacional de Pesquisas Espaciais (INPE) S˜ ao Jos´ e dos Campos, Brazil VIII Workshop da PG-AST/DAS, 8 Abril 2015 Penacchioni, A.V. The Proto-MIRAX mission
Transcript of Telescope performance and image simulations of the balloon ...
Introduction The Technique Image reconstruction and SNR Conclusions
Telescope performance and image simulations ofthe balloon-borne coded-mask protoMIRAX
experiment
Ana Virginia PenacchioniIn collaboration with Joao Braga, Manuel Castro and Flavio
D’Amico
Instituto Nacional de Pesquisas Espaciais (INPE)Sao Jose dos Campos, Brazil
VIII Workshop da PG-AST/DAS, 8 Abril 2015
Penacchioni, A.V. The Proto-MIRAX mission
Introduction The Technique Image reconstruction and SNR Conclusions
1 Introduction
2 The Technique
3 Image reconstruction and SNR
4 Conclusions
Penacchioni, A.V. The Proto-MIRAX mission

Introduction The Technique Image reconstruction and SNR Conclusions
The ProtoMIRAX Experiment
What is it?Balloon-borne experimentHard X-ray imager telescopeX-ray coded-mask
Goal: study the spectral and temporal variability of brightX-ray binaries. Prototype for the MIRAX mission.
Why?: The development and testing, with subsequent flightverification/validation will pave the way for equivalentmodeling of MIRAX, a space mission.
Penacchioni, A.V. The Proto-MIRAX mission

Introduction The Technique Image reconstruction and SNR Conclusions
The ProtoMIRAX Experiment
CdZnTe detectorsEnergy range: 30-200 keVEffective area: ∼ 84 cm2
Coded mask technique
Penacchioni, A.V. The Proto-MIRAX mission
Introduction The Technique Image reconstruction and SNR Conclusions
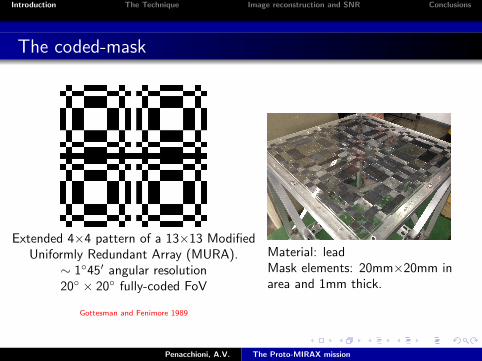
The coded-mask
Extended 4×4 pattern of a 13×13 ModifiedUniformly Redundant Array (MURA).
∼ 1◦45′ angular resolution20◦ × 20◦ fully-coded FoV
Gottesman and Fenimore 1989
Material: leadMask elements: 20mm×20mm inarea and 1mm thick.
Penacchioni, A.V. The Proto-MIRAX mission
Introduction The Technique Image reconstruction and SNR Conclusions
The sources
We modeled the emissions from the Crab Nebula and threesources in the Galactic center region:1E 1740.7-2942, GRS 1758-258 and GX 1+4.
Diffuse background −→ Noise source.Altitude: ∼ 42 km −→ Atmospheric depth x ≈ 2.7 g/cm2.Photons interact with the atmosphere, generating secondaryparticles. Flux is attenuated:
F = F0e−µ
ρx sec(z)
µρ = absorption coefficient of the air [cm2/g] (depends on E ),cos z= sin φ sin δ + cos φ cos δ cos H= zenith angle,H=hour angle, φ=geographic latitude, δ=declination of the source.
Penacchioni, A.V. The Proto-MIRAX mission
Introduction The Technique Image reconstruction and SNR Conclusions
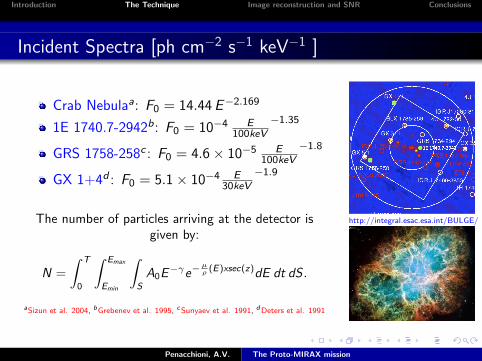
Incident Spectra [ph cm−2 s−1 keV−1 ]
Crab Nebulaa: F0 = 14.44E−2.169
1E 1740.7-2942b: F0 = 10−4 E100keV
−1.35
GRS 1758-258c : F0 = 4.6× 10⁻⁵ E100keV
−1.8
GX 1+4d : F0 = 5.1× 10⁻⁴ E30keV
−1.9
The number of particles arriving at the detector isgiven by:
N =
∫ T
0
∫ Emax
Emin
∫S
A0E−γe−
µρ (E)xsec(z)dE dt dS .
aSizun et al. 2004, bGrebenev et al. 1995, cSunyaev et al. 1991, dDeters et al. 1991
http://integral.esac.esa.int/BULGE/
Penacchioni, A.V. The Proto-MIRAX mission
Introduction The Technique Image reconstruction and SNR Conclusions
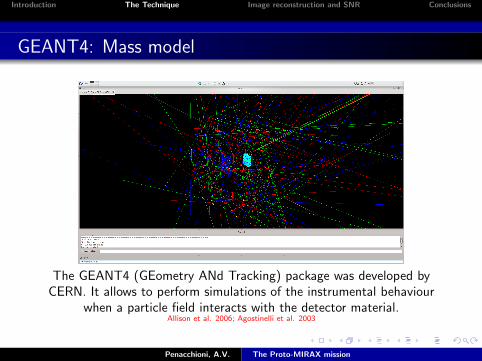
GEANT4: Mass model
The GEANT4 (GEometry ANd Tracking) package was developed byCERN. It allows to perform simulations of the instrumental behaviour
when a particle field interacts with the detector material.Allison et al. 2006; Agostinelli et al. 2003
Penacchioni, A.V. The Proto-MIRAX mission
Introduction The Technique Image reconstruction and SNR Conclusions
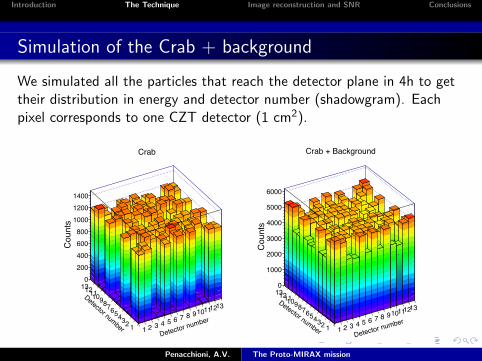
Simulation of the Crab + background
We simulated all the particles that reach the detector plane in 4h to gettheir distribution in energy and detector number (shadowgram). Eachpixel corresponds to one CZT detector (1 cm2).
Detector number1 2 3 4 5 6 7 8 910111213
Detector number 12345678910111213
Cou
nts
0200400600800
100012001400
Crab
Detector number1 2 3 4 5 6 7 8 910111213
Detector number 12345678910111213
Cou
nts
0
1000
2000
3000
4000
5000
6000
Crab + Background
Penacchioni, A.V. The Proto-MIRAX mission
Introduction The Technique Image reconstruction and SNR Conclusions
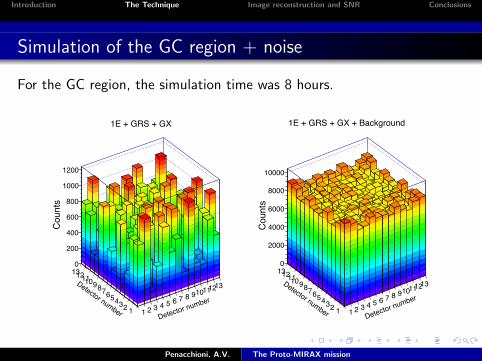
Simulation of the GC region + noise
For the GC region, the simulation time was 8 hours.
Detector number1 2 3 4 5 6 7 8 910111213Detector number 12345678910111213
Cou
nts
0
200
400
600
800
1000
1200
1E + GRS + GX
Detector number
1 2 3 4 5 6 7 8 910111213Detector number 12345678910111213C
ount
s0
2000
4000
6000
8000
10000
1E + GRS + GX + Background
Penacchioni, A.V. The Proto-MIRAX mission
Introduction The Technique Image reconstruction and SNR Conclusions
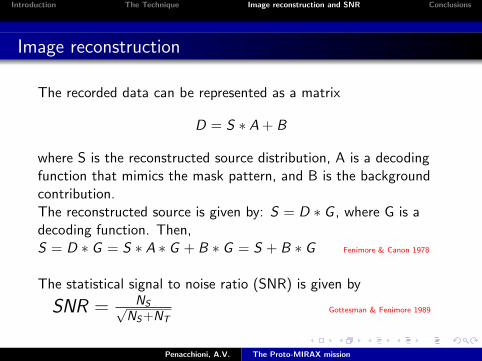
Image reconstruction
The recorded data can be represented as a matrix
D = S ∗ A + B
where S is the reconstructed source distribution, A is a decodingfunction that mimics the mask pattern, and B is the backgroundcontribution.The reconstructed source is given by: S = D ∗ G , where G is adecoding function. Then,S = D ∗ G = S ∗ A ∗ G + B ∗ G = S + B ∗ G Fenimore & Canon 1978
The statistical signal to noise ratio (SNR) is given by
SNR = NS√NS+NT
Gottesman & Fenimore 1989
Penacchioni, A.V. The Proto-MIRAX mission
Introduction The Technique Image reconstruction and SNR Conclusions
Image reconstruction
)°
Angular coordinates (
-10.05-6.70
-3.350
3.356.70
10.05
)°
Angular coordinates ( -10.05-6.70
-3.350
3.356.70
10.05
m
0
20
40
60
80
100
120
0
20
40
60
80
100
Crab
)°Angular coordinates (
-8.37 -5.02 -1.67 0 1.67 5.02 8.37
)°
Angular coordinates ( -8.37-5.02
-1.6701.675.02
8.37
m
0
5
10
15
20
25
0
5
10
15
20
25
1E 1740.7-2942
GRS 1758-258
GX 1+4
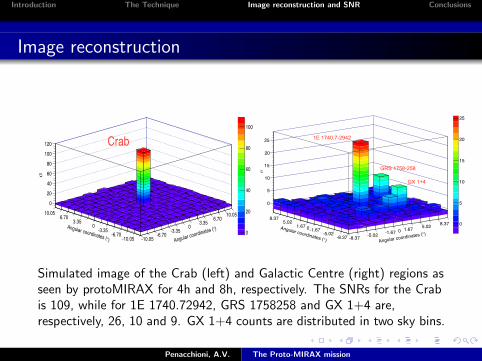
Simulated image of the Crab (left) and Galactic Centre (right) regions asseen by protoMIRAX for 4h and 8h, respectively. The SNRs for the Crabis 109, while for 1E 1740.72942, GRS 1758258 and GX 1+4 are,respectively, 26, 10 and 9. GX 1+4 counts are distributed in two sky bins.
Penacchioni, A.V. The Proto-MIRAX mission

Introduction The Technique Image reconstruction and SNR Conclusions
Published Results
Penacchioni, A.V. The Proto-MIRAX mission
Introduction The Technique Image reconstruction and SNR Conclusions
Conclusions
In this work we presented results of simulated images ofregions with bright X-ray sources with the protoMIRAXexperiment at balloon altitudes.
We reconstructed images of 2 regions of the sky: Crab Nebulaand 3 sources in the GC: 1E 1740.7-2942, GRS 1758-258 andGX 1+4.
Measured SNR of 109, 26, 9 and 10 for Crab, 1E, GX andGRS, respectively. 60% of the purely statistical values. Due tonon-uniformity of the background across the detector plane,collimator response and gaps between the detectors.
Penacchioni, A.V. The Proto-MIRAX mission
Introduction The Technique Image reconstruction and SNR Conclusions
Conclusions
It is possible to make observations of crowded fields andprovide flux and spectral information without sourceconfusion.
protoMIRAX plays an important role in testing new detectortechnology and imaging systems in a near-space environment.It is a pathfinder for the MIRAX mission.
Penacchioni, A.V. The Proto-MIRAX mission
Introduction The Technique Image reconstruction and SNR Conclusions
THANK YOU!
Penacchioni, A.V. The Proto-MIRAX mission