TELE NORTE LESTE PARTICIPAÇÕES S.A.
25
December/02 1 TELE NORTE LESTE PARTICIPAÇÕES S.A. TELE NORTE LESTE PARTICIPAÇÕES S.A.
-
Upload
julian-zamora -
Category
Documents
-
view
40 -
download
0
description
TELE NORTE LESTE PARTICIPAÇÕES S.A. Overview – September / 2002. Largest Integrated Telecom Company in Brazil 15.1 million fixed lines in service 978,000 mobile subscribers (Nov/02) Concession Area: 65% of Brazilian Territory / 93 million people 40% of Country’s GDP - PowerPoint PPT Presentation
Transcript of TELE NORTE LESTE PARTICIPAÇÕES S.A.
December/021
TELE NORTE LESTE PARTICIPAÇÕES S.A.TELE NORTE LESTE PARTICIPAÇÕES S.A.
December/022
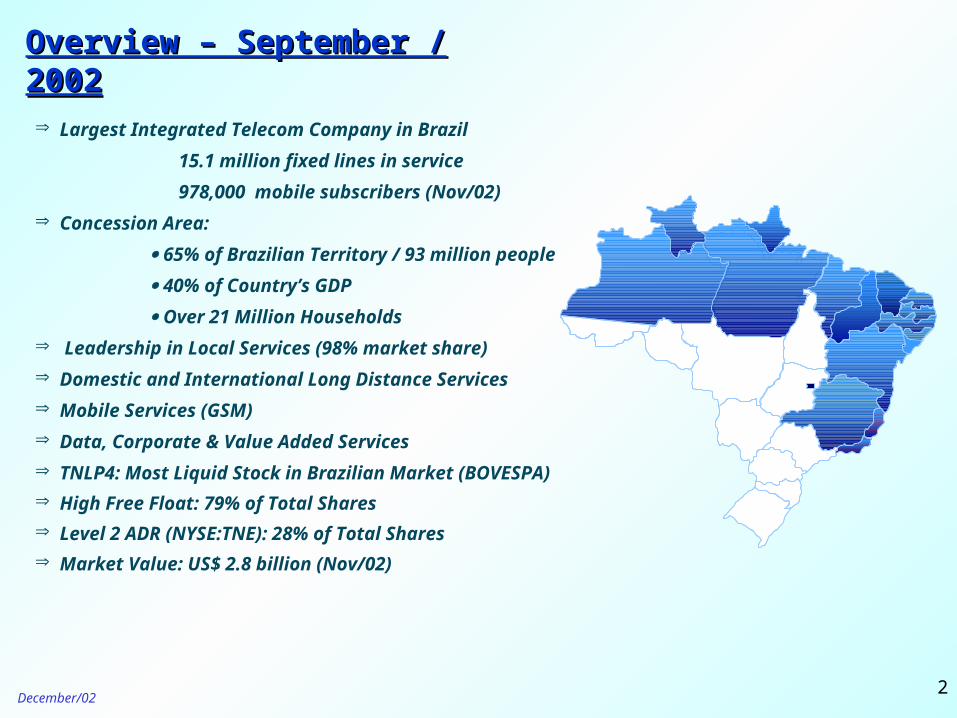
Largest Integrated Telecom Company in Brazil
15.1 million fixed lines in service
978,000 mobile subscribers (Nov/02)
Concession Area:
65% of Brazilian Territory / 93 million people
40% of Country’s GDP
Over 21 Million Households
Leadership in Local Services (98% market share)
Domestic and International Long Distance Services
Mobile Services (GSM)
Data, Corporate & Value Added Services
TNLP4: Most Liquid Stock in Brazilian Market (BOVESPA)
High Free Float: 79% of Total Shares
Level 2 ADR (NYSE:TNE): 28% of Total Shares
Market Value: US$ 2.8 billion (Nov/02)
Overview – September / 2002Overview – September / 2002
December/023
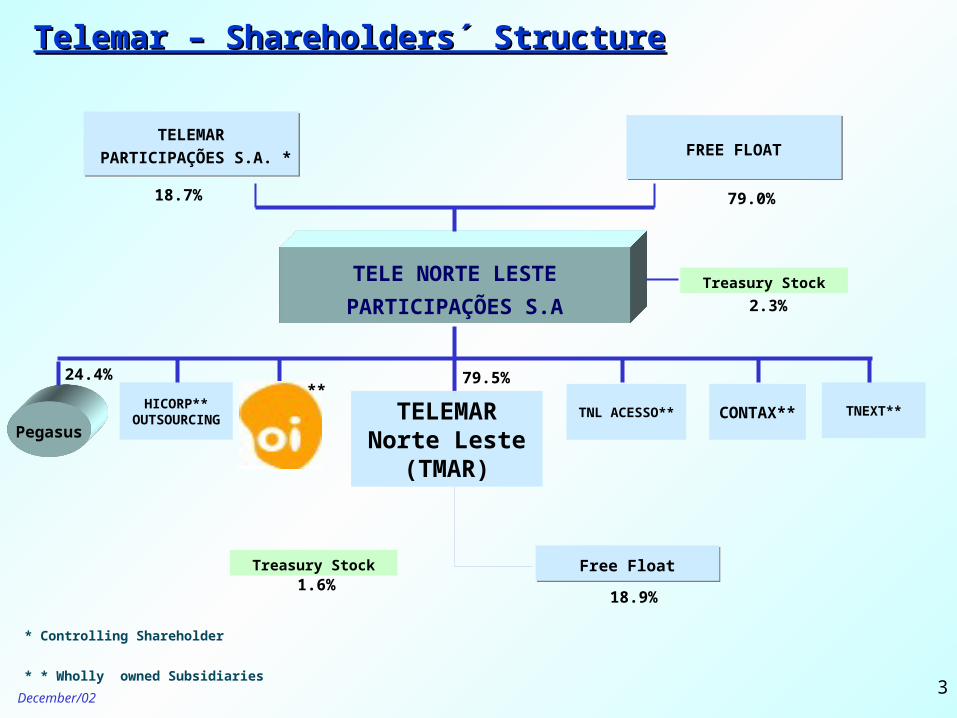
TELE NORTE LESTE
PARTICIPAÇÕES S.A
79.0% 18.7%
HICORP**OUTSOURCING TNL ACESSO** CONTAX** TNEXT**
TELEMAR
PARTICIPAÇÕES S.A. *
TELEMAR
PARTICIPAÇÕES S.A. *
TELEMARNorte Leste
(TMAR)
Treasury Stock
79.5%
Free FloatFree Float
18.9%
Treasury Stock
FREE FLOATFREE FLOAT
Pegasus
Telemar – Shareholders´ StructureTelemar – Shareholders´ Structure
* Controlling Shareholder
* * Wholly owned Subsidiaries
24.4%
2.3%
1.6%
**
December/024
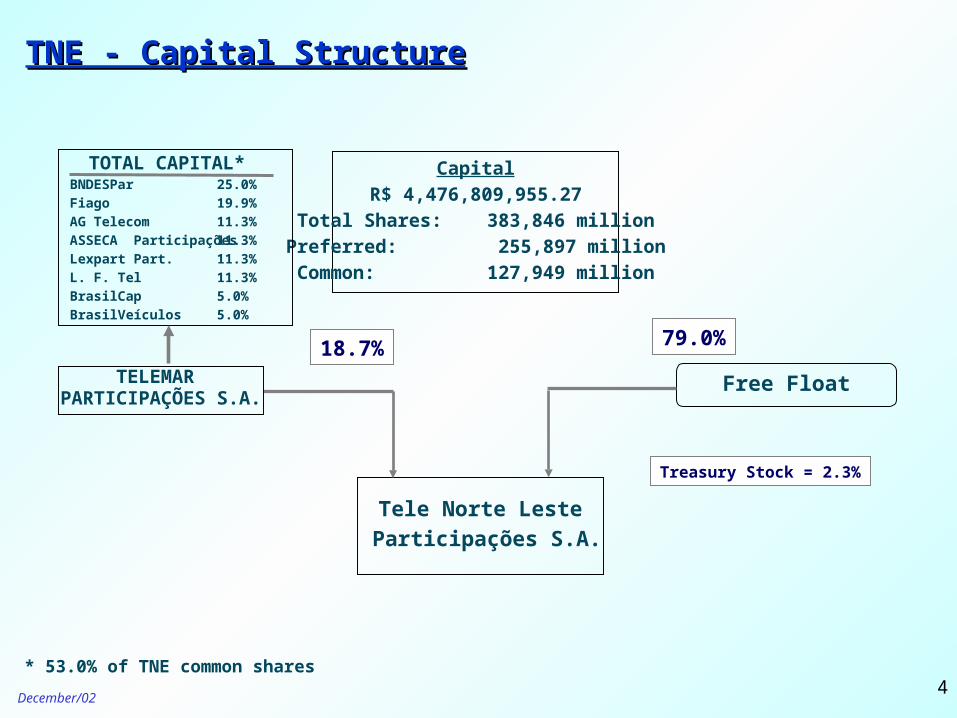
TNE - Capital StructureTNE - Capital Structure
Tele Norte Leste
Participações S.A.
Free Float
79.0%18.7%TELEMAR
PARTICIPAÇÕES S.A.
Capital
R$ 4,476,809,955.27
Total Shares: 383,846 million
Preferred: 255,897 million
Common: 127,949 million
Treasury Stock = 2.3%
TOTAL CAPITAL*BNDESPar
Fiago
AG Telecom
ASSECA Participações
Lexpart Part.
L. F. Tel
BrasilCap
BrasilVeículos
25.0%
19.9%
11.3%
11.3%
11.3%
11.3%
5.0%
5.0%
* 53.0% of TNE common shares
December/025
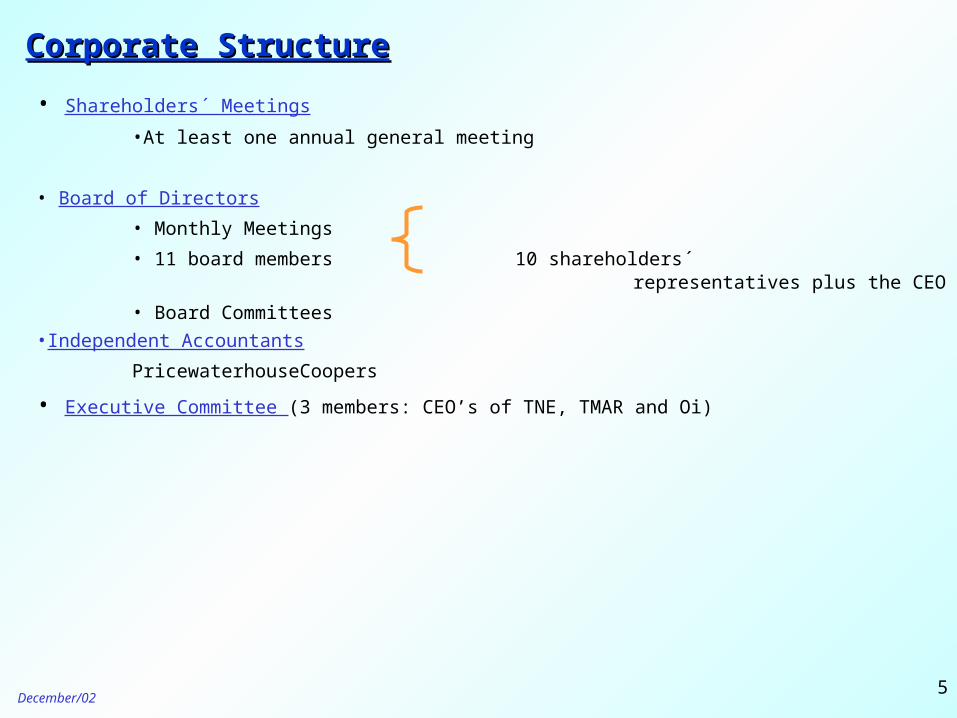
• Shareholders´ Meetings
•At least one annual general meeting
• Board of Directors
• Monthly Meetings
• 11 board members 10 shareholders´ representatives plus the CEO
• Board Committees
•Independent Accountants
PricewaterhouseCoopers
• Executive Committee (3 members: CEO’s of TNE, TMAR and Oi)
Corporate StructureCorporate Structure
December/026
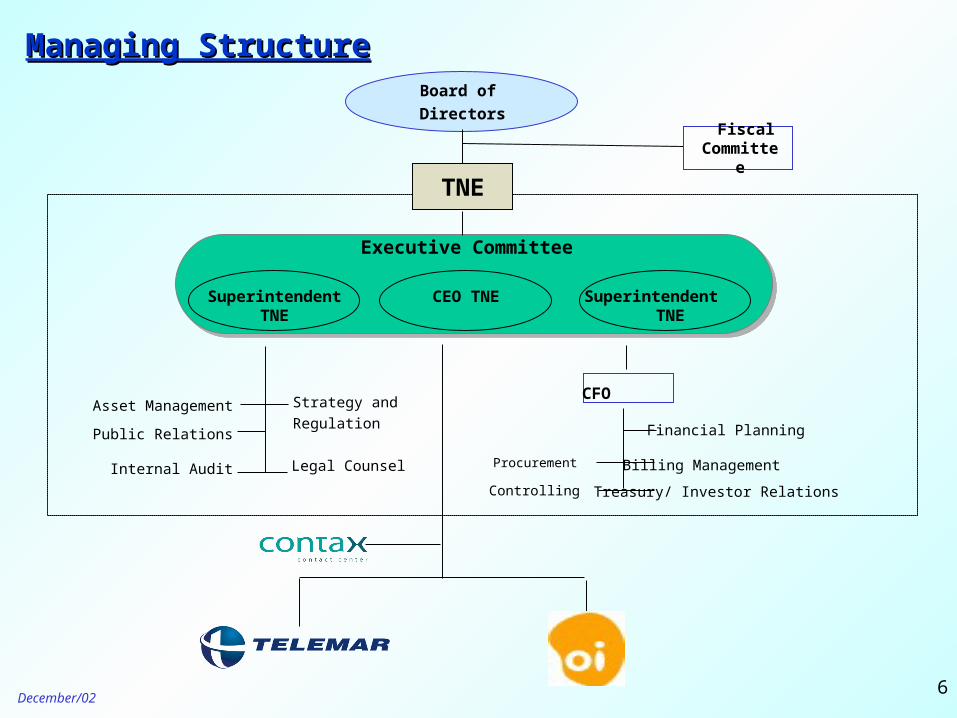
Managing StructureManaging Structure
Fiscal Committee
Board of
Directors
TNE
Executive Committee
Controlling
Procurement
Treasury/ Investor Relations
CFOStrategy and
Regulation
Legal Counsel
Financial Planning
Asset Management
Public Relations
Billing ManagementInternal Audit
Superintendent TNE
SuperintendentTNE
CEO TNE
December/027
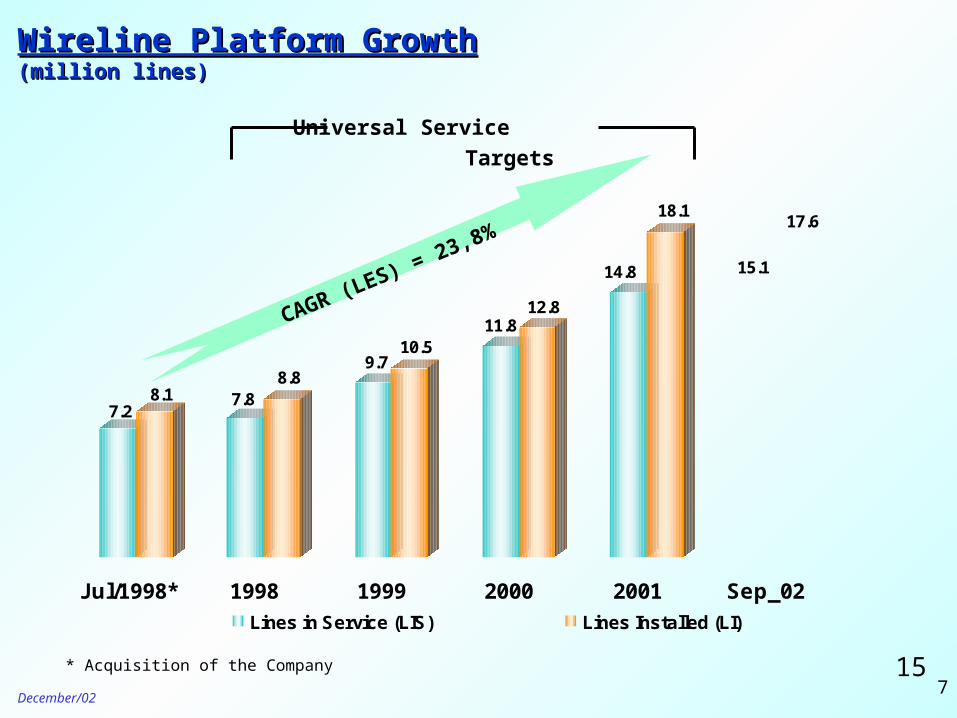
Universal Service
Targets
Wireline Platform GrowthWireline Platform Growth(million lines)(million lines)
* Acquisition of the Company
CAGR (LES) = 23,8%
15
7.28.1 7.8
8.89.7
10.511.8
12.8
14.8
18.1
15.1
17.6
Jul/1998* 1998 1999 2000 2001 Sep_02
Lines in Service (LIS) Lines Installed (LI)
December/028
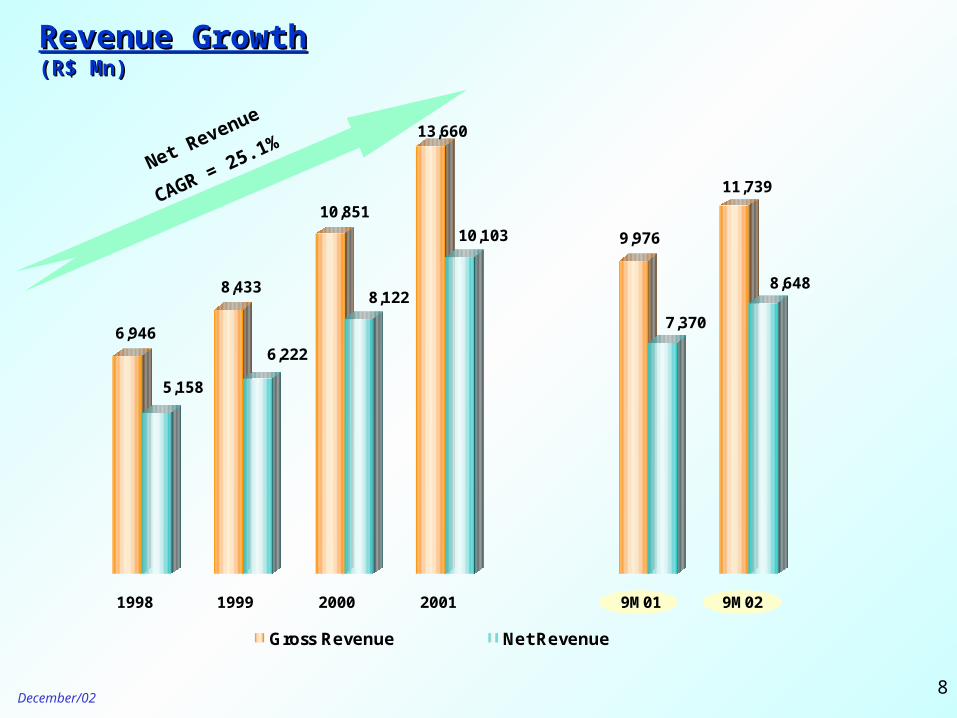
6,946
5,158
8,433
6,222
10,851
8,122
13,660
10,103 9,976
7,370
11,739
8,648
1998 1999 2000 2001 9M01 9M02
Gross Revenue Net Revenue
Revenue GrowthRevenue Growth(R$ Mn)(R$ Mn)
Net Revenue
CAGR = 25.1%
December/029
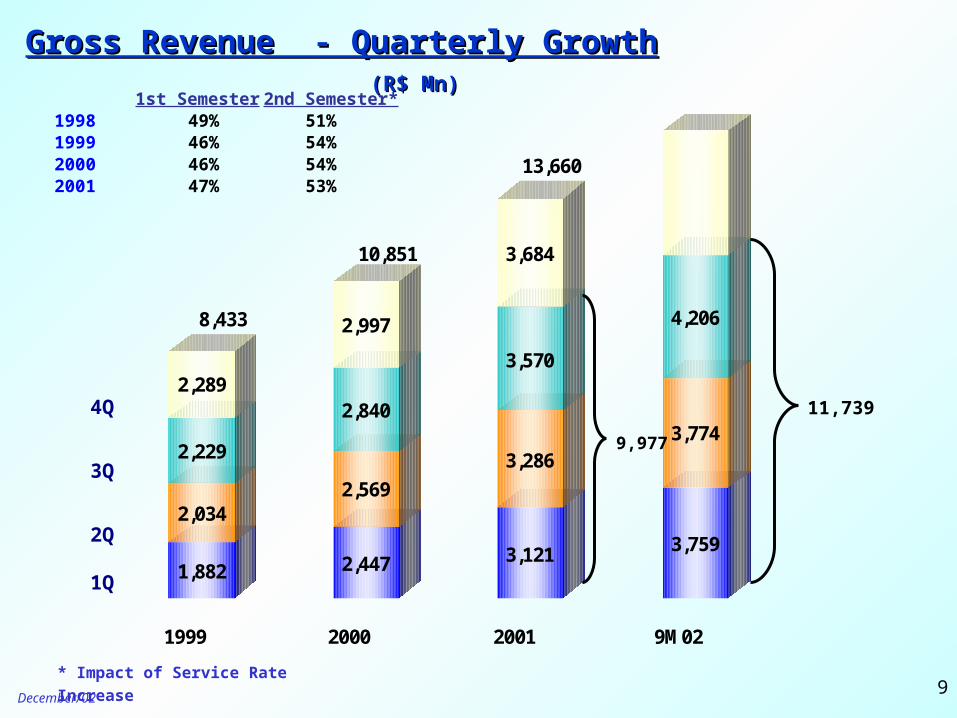
1,882
2,034
2,229
2,289
2,447
2,569
2,840
2,997
3,121
3,286
3,570
3,684
3,759
3,774
4,206
1999 2000 2001 9M02
8,433
10,851
13,660
Gross Revenue - Quarterly GrowthGross Revenue - Quarterly Growth (R$ Mn)(R$ Mn)
3Q
1Q
2Q
4Q
1st Semester 2nd Semester*1998 49% 51%1999 46% 54%2000 46% 54%2001 47% 53%
* Impact of Service Rate Increase
11,739
9,977
December/0210
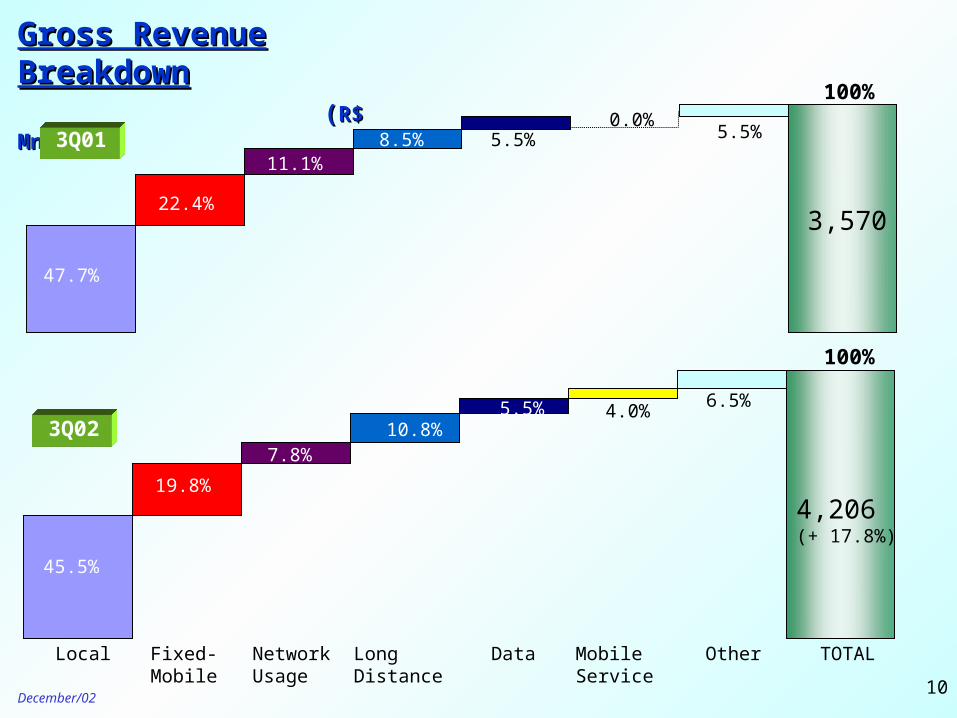
Gross Revenue BreakdownGross Revenue Breakdown ((R$ Mn)R$ Mn)
100%
3Q01
3,570
47.7%
22.4%
11.1% 8.5% 5.5%
5.5%0.0%
100%
3Q02
45.5%
19.8%
7.8% 10.8%
5.5% 4.0%6.5%
4,206(+ 17.8%)
Local Fixed-Mobile
Network Usage
LongDistance
Data MobileService
Other TOTAL
December/0211
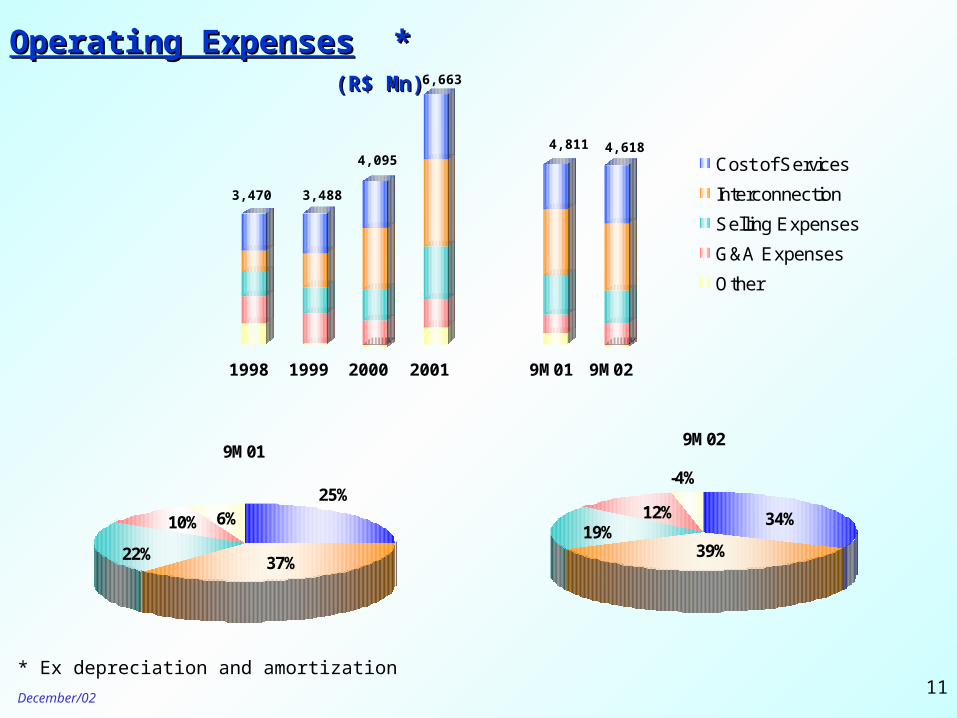
Operating ExpensesOperating Expenses * * (R$ Mn) (R$ Mn)
3,470 3,488
4,095
6,663
4,6184,811
9M01
6%25%
10%
22% 37%
9M02
-4%
34%12%
39%19%
1998 1999 2000 2001 9M01 9M02
Cost of Services
Interconnection
Selling Expenses
G&A Expenses
Other
* Ex depreciation and amortization
December/0212
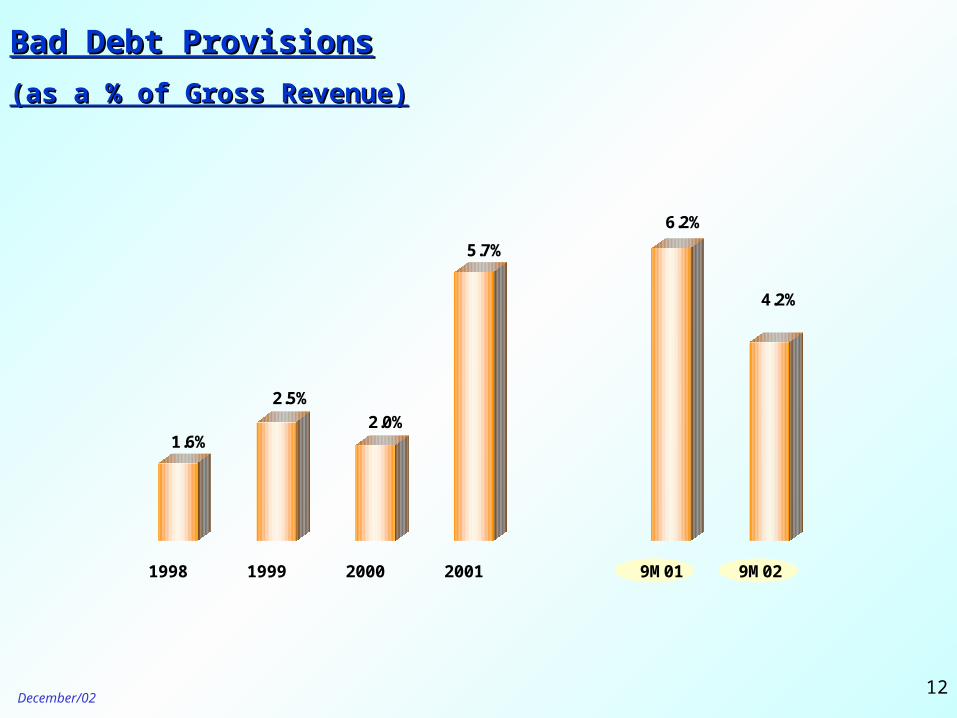
Bad Debt ProvisionsBad Debt Provisions
(as a % of Gross Revenue)(as a % of Gross Revenue)
1.6%
2.5%
2.0%
5.7%
6.2%
4.2%
1998 1999 2000 2001 9M01 9M02
December/0213
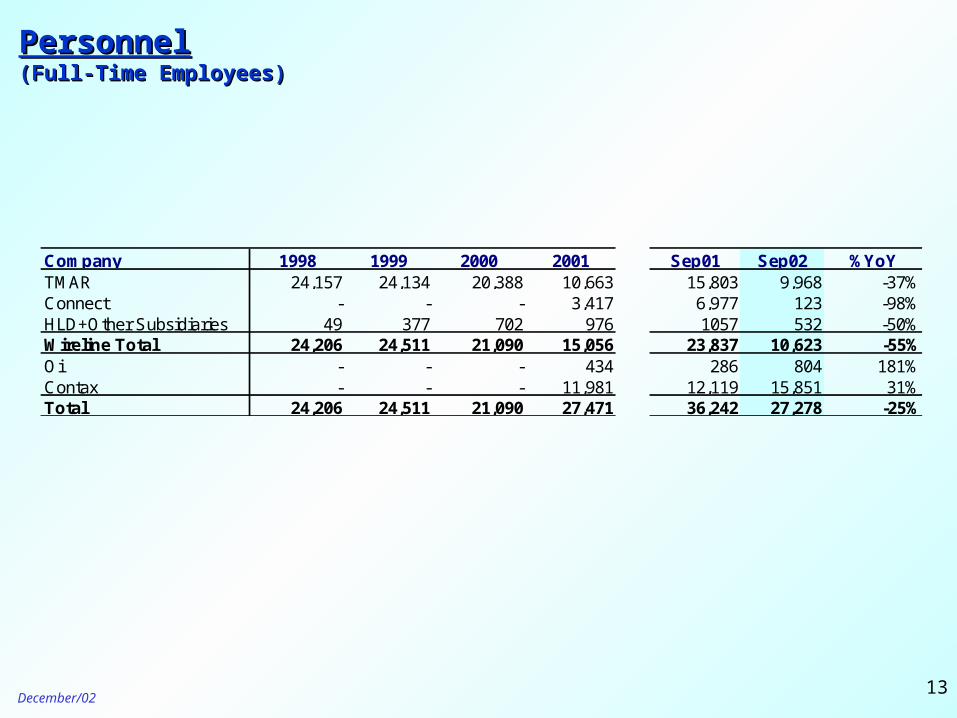
PersonnelPersonnel(Full-Time Employees)(Full-Time Employees)
Company 1998 1999 2000 2001 Sep01 Sep02 %YoYTMAR 24,157 24,134 20,388 10,663 15,803 9,968 -37%Connect - - - 3,417 6,977 123 -98%HLD+Other Subsidiaries 49 377 702 976 1057 532 -50%Wireline Total 24,206 24,511 21,090 15,056 23,837 10,623 -55%Oi - - - 434 286 804 181%Contax - - - 11,981 12,119 15,851 31%Total 24,206 24,511 21,090 27,471 36,242 27,278 -25%
December/0214
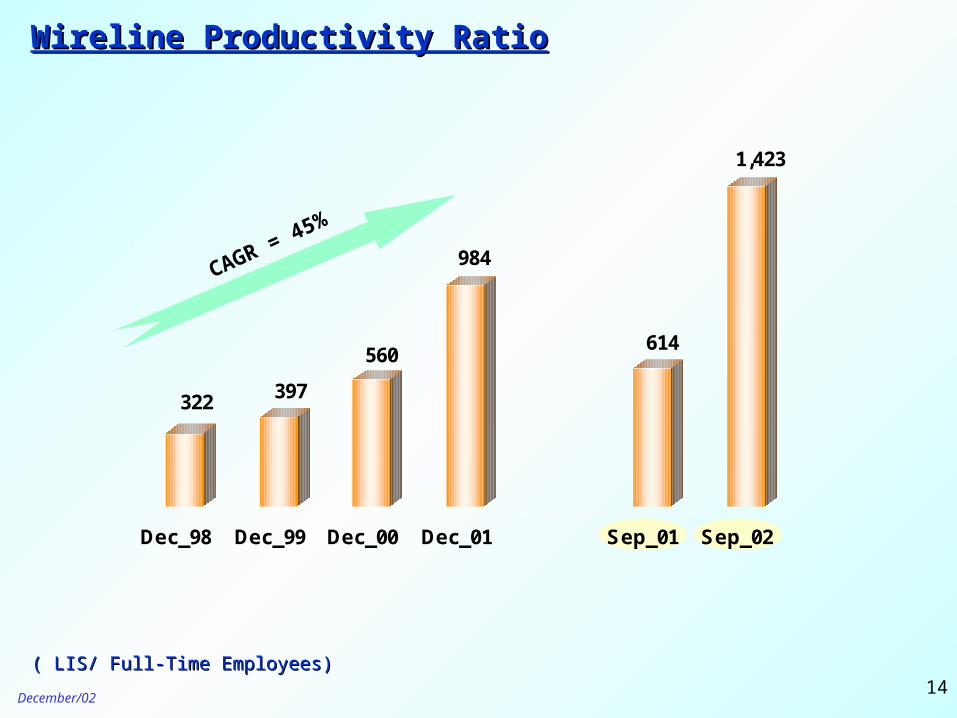
322 397
560
984
614
1,423
Dec_98 Dec_99 Dec_00 Dec_01 Sep_01 Sep_02
Wireline Productivity RatioWireline Productivity Ratio
CAGR = 45%
( LIS/ Full-Time Employees)( LIS/ Full-Time Employees)
December/0215
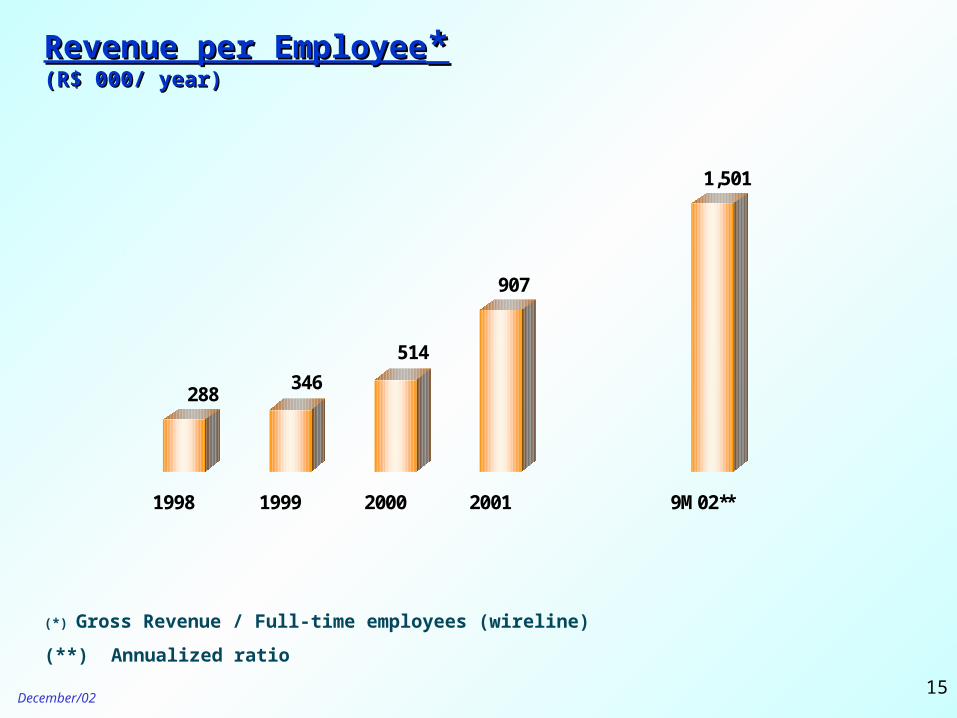
Revenue per EmployeeRevenue per Employee**(R$ 000/ year)(R$ 000/ year)
(*) Gross Revenue / Full-time employees (wireline)
(**) Annualized ratio
288346
514
907
1,501
1998 1999 2000 2001 9M02**
December/0216
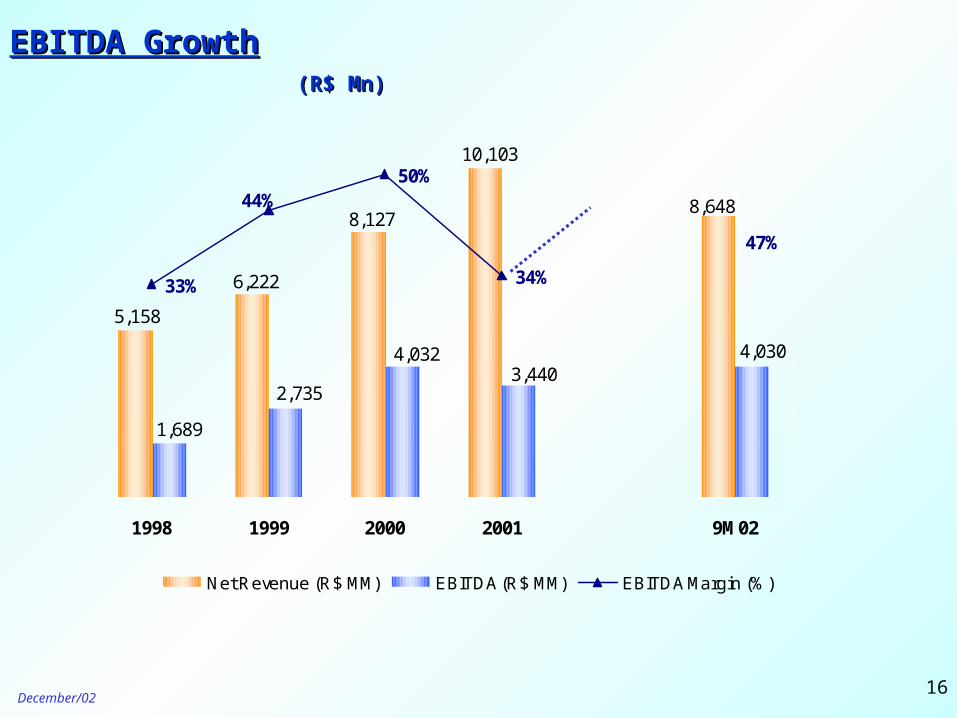
EBITDA GrowthEBITDA Growth (R$ Mn)(R$ Mn)
8,6488,127
6,222
10,103
5,158
4,030
1,689
2,735
4,0323,440
33%
50%
34%
47%
44%
1998 1999 2000 2001 9M02
Net Revenue (R$ MM) EBITDA (R$ MM) EBITDA Margin (%)
December/0217
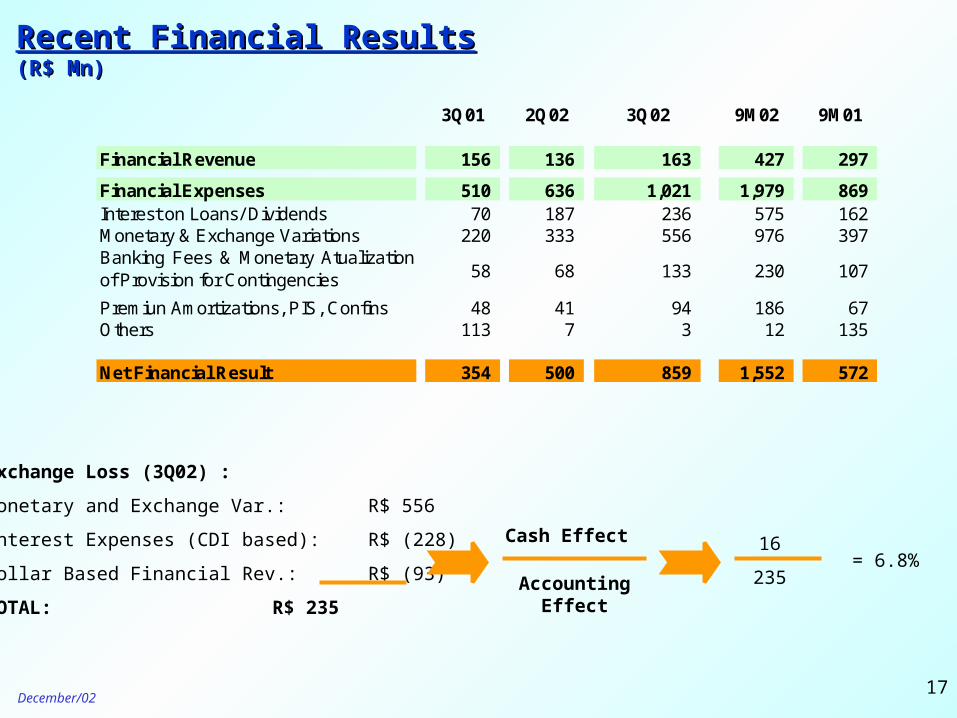
Recent Financial ResultsRecent Financial Results(R$ Mn)(R$ Mn)
Exchange Loss (3Q02) :
Monetary and Exchange Var.: R$ 556
Interest Expenses (CDI based): R$ (228)
Dollar Based Financial Rev.: R$ (93)
TOTAL: R$ 235
16
235= 6.8%
Cash Effect
Accounting Effect
3Q01 2Q02 3Q02 9M02 9M01
Financial Revenue 156 136 163 427 297
Financial Expenses 510 636 1,021 1,979 869 Interest on Loans/ Dividends 70 187 236 575 162 Monetary & Exchange Variations 220 333 556 976 397
Premiun Amortizations, PIS, Confins 48 41 94 186 67 Others 113 7 3 12 135
Net Financial Result 354 500 859 1,552 572
230 107 Banking Fees & Monetary Atualizationof Provision for Contingencies 133 68 58
December/0218
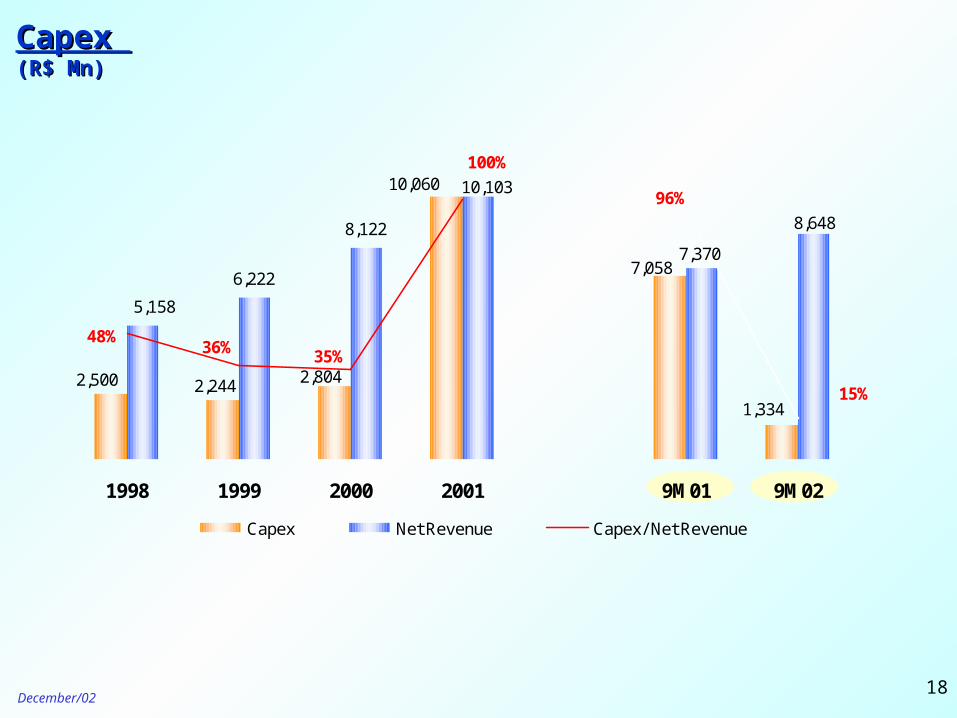
6,222
8,122
2,500 2,244 2,804
7,058
1,334
10,060 10,103
5,158
7,370
8,648
48%36% 35%
100%
96%
15%
1998 1999 2000 2001 9M01 9M02
Capex Net Revenue Capex/ Net Revenue
Capex Capex (R$ Mn)(R$ Mn)
December/0219
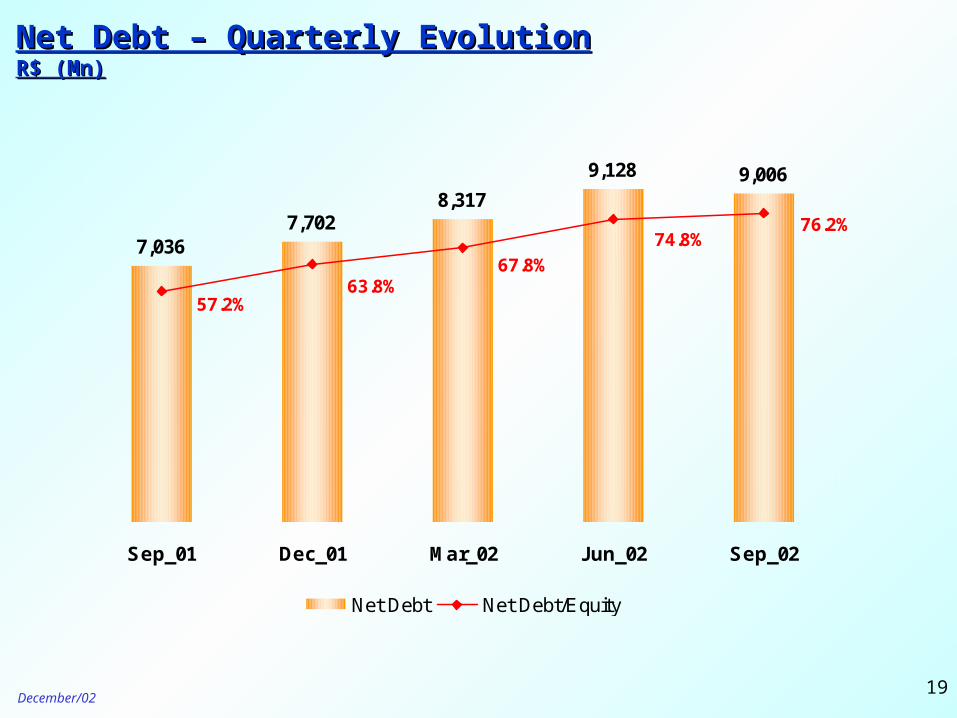
Net Debt – Quarterly EvolutionNet Debt – Quarterly EvolutionR$ (Mn)R$ (Mn)
7,0367,702
8,317
9,128 9,006
67.8%63.8%
74.8%
57.2%
76.2%
Sep_01 Dec_01 Mar_02 Jun_02 Sep_02
Net Debt Net Debt/Equity
December/0220
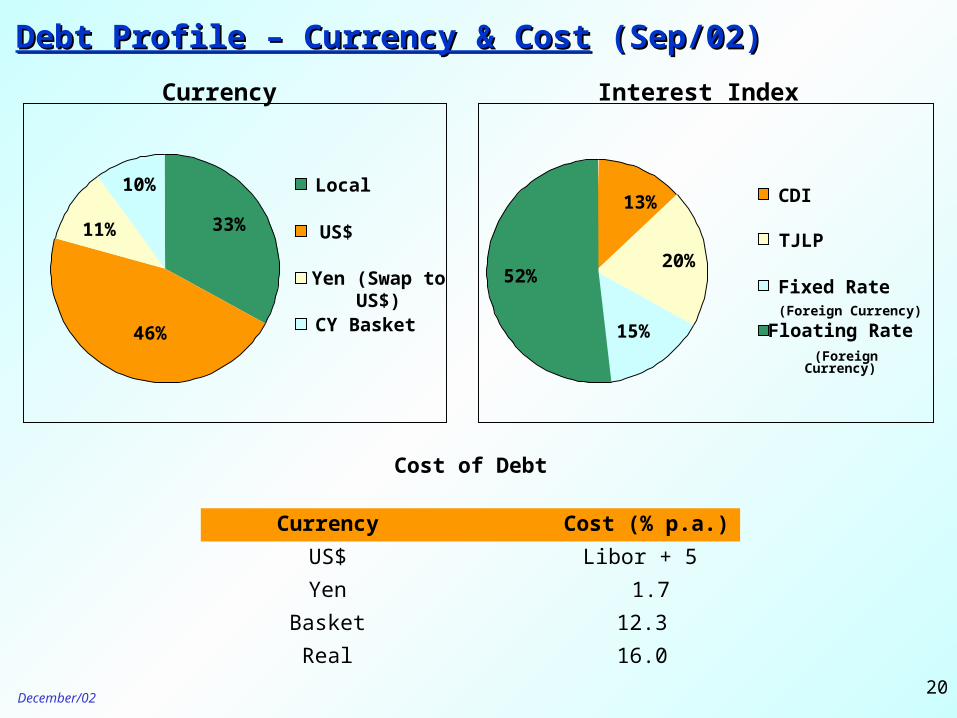
Debt Profile – Currency & CostDebt Profile – Currency & Cost (Sep/02) (Sep/02)
Currency
46%
11%
10%
33%
Local
US$
Yen (Swap to US$)
CY Basket
52%
15%
20%
13% CDI
TJLP
Fixed Rate (Foreign Currency)
Floating Rate (Foreign Currency)
Interest Index
Currency Cost (% p.a.)
US$ Libor + 5
Yen 1.7
Basket 12.3
Real 16.0
Cost of Debt
December/0221
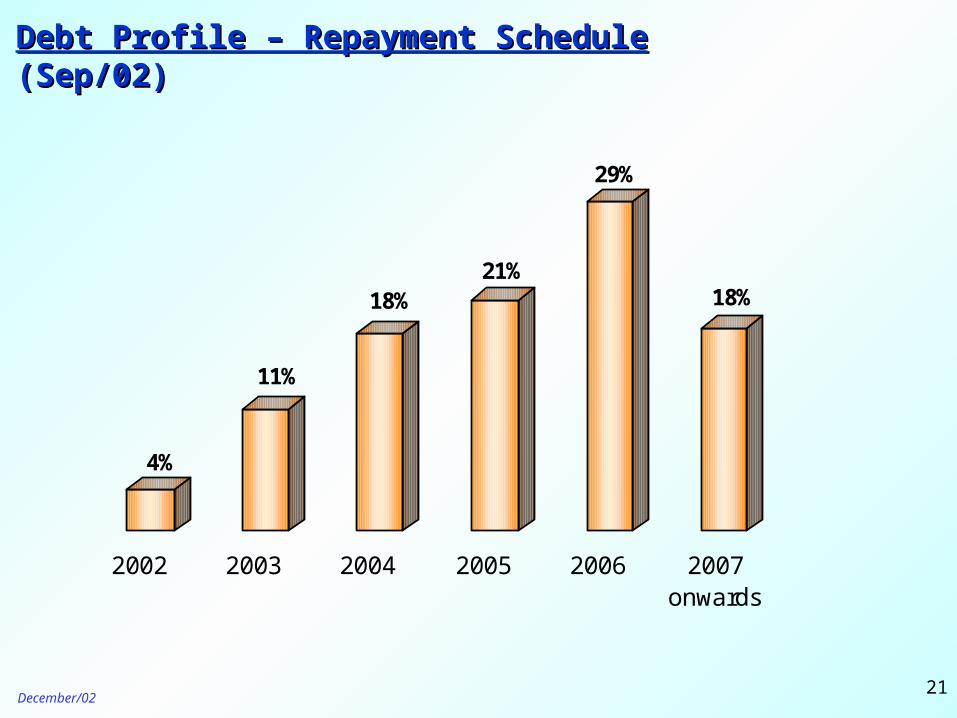
Debt Profile – Repayment ScheduleDebt Profile – Repayment Schedule (Sep/02) (Sep/02)
4%
11%
18%21%
29%
18%
2002 2003 2004 2005 2006 2007onwards
December/0222
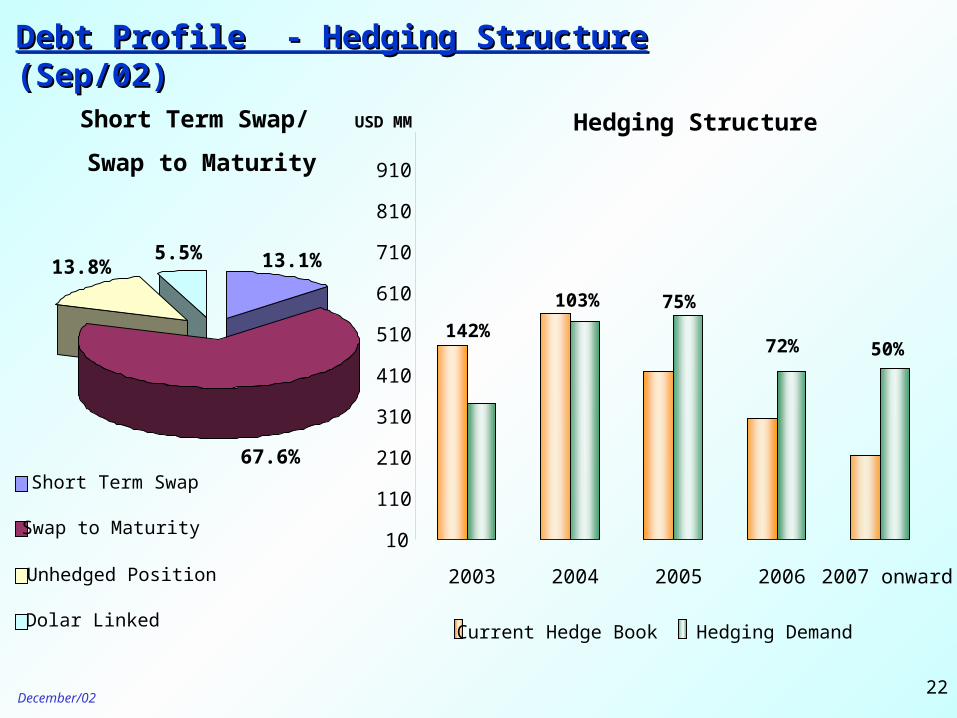
Debt Profile - Hedging StructureDebt Profile - Hedging Structure (Sep/02) (Sep/02)
Short Term Swap/
Swap to Maturity
USD MM
67.6%
13.1%13.8%5.5%
Short Term Swap
Swap to Maturity
Unhedged Position
Dolar Linked
142%
103% 75%
72% 50%
10
110
210
310
410
510
610
710
810
910
2003 2004 2005 2006 2007 onward
Current Hedge Book Hedging Demand
Hedging Structure
December/0223
978,000 subscribers in only 6 months of operations (Nov/02);
R$ 36.00 ARPU in the 3Q02;
78% pre and 22% post paid clients;
Financing US$ 1.4 billion credit (suppliers and bank facilities);
Coverage: 14 states – 396 cities;
2,360 integrated sites;
GSM National and International roaming (23 countries);
Net Revenue in 9 months: R$ 152 million;
Total debt in Sep/02: R$ 3.9 billion;
Network CAPEX through 2004: R$ 2.7 billion (R$ 1.8 billion until Sep/02).
TNE – PCS ´´Oi´´ - Current StatusTNE – PCS ´´Oi´´ - Current Status
December/0224
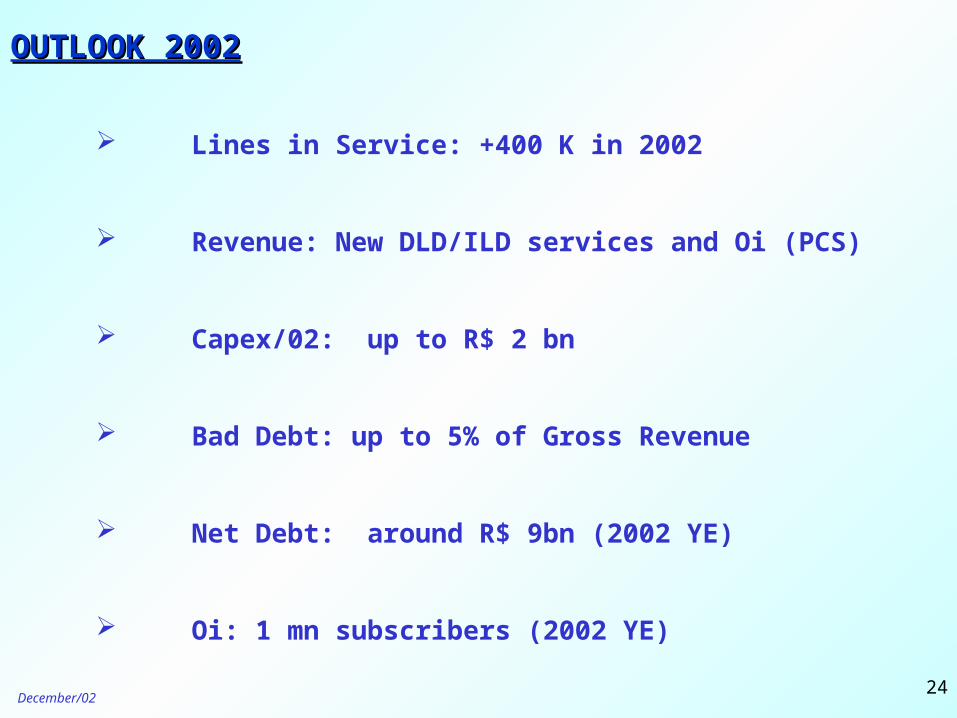
OUTLOOK 2002OUTLOOK 2002
Lines in Service: +400 K in 2002
Revenue: New DLD/ILD services and Oi (PCS)
Capex/02: up to R$ 2 bn
Bad Debt: up to 5% of Gross Revenue
Net Debt: around R$ 9bn (2002 YE)
Oi: 1 mn subscribers (2002 YE)
December/0225
This presentation contains forward-looking statements. Statements that are not historical facts,
including statements about our beliefs and expectations, are forward-looking statements and involve
inherent risks and uncertainties. These statements are based on current plans, estimates and
projections, and therefore you should not place undue reliance on them. Forward-looking statements
speak only as of the date they are made, and we undertake no obligation to update publicly any of them
in light of new information or future events.
““SAFE HARBOR” STATEMENTSAFE HARBOR” STATEMENT
Investor Relations
Rua Humberto de Campos, 425 / 8º andar
Leblon
Rio de Janeiro -RJ
Phone: ( 55 21) 3131-1314/1313/1315/1316/1317
Fax: (55 21) 3131-1155
E-mail: [email protected]
Visit our website: http://www.telemar.com.br/ri