SSIIMMPPÓÓSSIIOO SSOOBBRREE … · COMO MEDIR A QUALIDADE DA CARNE NA LINHA ... apresentavam-se...
95
S S I I M M P P Ó Ó S S I I O O S S O O B B R R E E R R E E N N D D I I M M E E N N T T O O E E Q Q U U A A L L I I D D A A D D E E D D A A C C A A R R N N E E S S U U Í Í N N A A 15 e 16/09/98 – Concórdia, SC A A N N A A I I S S
-
Upload
phungkhanh -
Category
Documents
-
view
214 -
download
0
Transcript of SSIIMMPPÓÓSSIIOO SSOOBBRREE … · COMO MEDIR A QUALIDADE DA CARNE NA LINHA ... apresentavam-se...
SSIIMMPPÓÓSSIIOO SSOOBBRREE
RREENNDDIIMMEENNTTOO EE
QQUUAALLIIDDAADDEE DDAA CCAARRNNEE
SSUUÍÍNNAA
1155 ee 1166//0099//9988 –– CCoonnccóórrddiiaa,, SSCC
AA NN AA II SS

REPÚBLICA FEDERATIVA DO BRASIL
Presidente: Fernando Henrique Cardoso
Ministro da Agricultura e do Abastecimento: Francisco Turra
EMPRESA BRASILEIRA DE PESQUISA AGROPECUÁRIA - EMBRAPA
Presidente: Alberto Duque Portugal
Diretores: Dante Daniel Giacomelli Scolari
Elza Ângela Battaggia Brito da Cunha
José Roberto Rodrigues Peres
CENTRO NACIONAL DE PESQUISA DE SUÍNOS E AVES - CNPSA
Chefe Geral: Dirceu João Duarte Talamini
Chefe Adjunto de Pesquisa e Desenvolvimento de Suínos:
Paulo Roberto Souza da Silveira
Chefe Adjunto de Pesquisa e Desenvolvimento de Aves:
Gilberto Silber Schmidt
Chefe Adjunto de Apoio Técnico e Administrativo:
Ademir Francisco Girotto

SSIIMMPPÓÓSSIIOO SSOOBBRREE
RREENNDDIIMMEENNTTOO EE
QQUUAALLIIDDAADDEE DDAA CCAARRNNEE
SSUUÍÍNNAA
1155 ee 1166//0099//9988 –– CCoonnccóórrddiiaa,, SSCC
AA NN AA II SS
Embrapa Suínos e Aves. Documentos, 51
Exemplares desta publicação podem ser solicitados à:
Embrapa Suínos e Aves
Br 153 - Km 110 - Vila Tamanduá
Caixa Postal 21
89.700-000 - Concórdia - SC
Telefone: (049) 4428555
Fax: (049) 4428559
Tiragem: 200 exemplares
Tratamento Editorial: Tânia Maria Biavatti Celant
© EMBRAPA - 1998
SIMPÓSIO SOBRE RENDIMENTO E QUALIDADE DA
CARNE SUÍNA, 1998, Concórdia, SC. Anais...
Concórdia: EMBRAPA-CNPSA,1998. 82p. (EMBRAPA-
CNPSA. Documentos, 51).
1.Suíno-carne-qualidade-congresso. 2.Suíno-carne-
rendimento-congresso. I.Título. II.Série.
CDD 664.906
PROMOÇÃO
Embrapa Suínos e Aves
APOIO E PATROCÍNIO
ACCS
Embrapa Suínos e Aves
SINDICARNE-SC
SINDICARNE-RS
ORGANIZAÇÃO
Teresinha Marisa Bertol (Embrapa Suínos e Aves) Jorge Vitor Ludke (Embrapa Suínos e Aves) Paulo R. S. da Silveira (Embrapa Suínos e Aves) Renato Irgang (UFSC)
COMISSÃO DE APOIO
Cícero J. Monticelli
Dianir Formiga
Douglas Vizzotto
Márcia M.T. Zanotto
Rosali S. Vanzin
Sandra S. Schirmann
Sérgio R. da S. Alves Tânia M.B. Celant
Tânia M. G. Scolari
Vânia M. Faccio
SSUUMMÁÁRRIIOO
FATORES PRODUTIVOS QUE AFETAM A QUALIDADE DA CARNE SUÍNA Sergio Nicolaiewsky.................................................................................
01
COMO MEDIR A QUALIDADE DA CARNE NA LINHA DE ABATE DE
SUÍNOS
José Vicente Peloso......................................................................
05
CARACTERÍSTICAS FÍSICAS E ORGANOLÉPTICAS DA CARNE E
GORDURA QUE AFETAM A QUALIDADE DOS PRODUTOS
INDUSTRIALIZADOS
Massami Shimokomaki & Rubison Olivo...........................................
12
EXIGÊNCIAS NUTRICIONAIS PARA MÁXIMO RENDIMENTO DE
CARNE EM SUÍNOS
Alexandre de Mello Kessler...........................................................
18
GENETIC AND NUTRITIONAL INFLUENCES ON PORK QUALITY
Michael Ellis.................................................................................
25
SWINE BREEDING, SEX, FEEDING REGIME, AND SLAUGHTER
WEIGTH AND THEIR EFFECTS ON CARCASS LEAN YIELD
Michael Ellis.................................................................................
55
1 Simpósio sobre Rendimento e Qualidade da Carne Suína -15 e 16 de setembro/98
FFAATTOORREESS PPRROODDUUTTIIVVOOSS QQUUEE AAFFEETTAAMM
AA QQUUAALLIIDDAADDEE DDAA CCAARRNNEE SSUUÍÍNNAA
Sergio Nicolaiewsky
Professor do Depto. de Zootecnia da Faculdade de Agronomia da Universidade Federal do Rio Grande do Sul (UFRGS) - Núcleo de Pesquisa sobre Qualidade da Carne Suína
IInnttrroodduuççããoo
O plantel de suínos em algumas áreas do Brasil, em termos de qualidade,
alcança níveis próximos aos dos melhores rebanhos do mundo. Países
desenvolvidos tais como Dinamarca, França e Estados Unidos consideram
importante critério de seleção a qualidade da carne suína.
A preocupação com a qualidade de carne como critério para seleção iniciou-
se a partir de observações em que era verificado que determinados suínos eram
susceptíveis ao estresse e que essa característica passava dos pais à progênie.
Animais acometidos dessa síndrome produziam carcaças cujas carnes
apresentavam-se com problemas de cor, estrutura e de perda de líquidos,
resultado de uma queda de pH muito rápida (em que o pH de 7,2 caia a valores
inferiores a 6,0 em menos de uma hora, quando em processo de rigor mortis
normal esse pH é atingido a partir de 8 horas após o abate) associado a
temperaturas elevadas de carcaça. Neste caso, o glicogênio muscular é
convertido rapidamente em ácido lático, ocasionando uma desnaturação das
proteínas responsáveis pela capacidade de fixação de água e pela coloração da
carne. Esse tipo de anomalia é conhecida como PSE (do inglês: pale, soft and
exudative), que é uma carne pálida, flácida e com forte tendência a perder
líquidos.
Existem casos em que devido a uma deficiência de glicogênio por estímulos
prolongados como grandes distâncias de transporte, tempo de descanso e jejum
prolongado, temperatura ambiente baixa, brigas entre os animais etc., ocorre
somente uma leve diminuição de pH na carne, e após 24 horas do abate, o pH
encontra-se acima de 6,2. Neste caso, estamos frente a carcaças DFD (do
inglês: dark, firm and dry) que é uma carne com coloração escura, seca e firme e
que, ao contrário da PSE, se caracteriza pela elevada capacidade de fixação de
água e pouca conservabilidade.
FFaattoorreess qquuee aaffeettaamm aa qquuaalliiddaaddee ddaa ccaarrnnee ddee ssuuíínnooss
Na produção da carne de suínos os objetivos principais são obter um
produto que seja, do ponto de vista do consumidor: seguro; atenda
consistentemente suas necessidades; um bom negócio; tenha sido criado e
abatido sob condições humanitárias aceitáveis.
2 Simpósio sobre Rendimento e Qualidade da Carne Suína -15 e 16 de setembro/98
FFaattoorreess ddee pprroodduuççããoo qquuee aaffeettaamm aa qquuaalliiddaaddee ddaa ccaarrnnee ssuuíínnaa
Carcaça magra e com carne de qualidade - marmoreio - maciez; promotores
de crescimento; susceptibilidade ao stress; exercícios, estado atlético e
metabolismo muscular.
OO ttrraannssppoorrttee ee oo mmaanneejjoo pprréé--aabbaattee aaffeettaannddoo aa qquuaalliiddaaddee ddaa ccaarrnnee
Tempo de jejum; densidade no transporte; temperatura corporal; mortes
durante o transporte; desidratação; manuseio pré-abate (descanso).
EEffeeiittooss ddoo pprroocceessssaammeennttoo nnaa qquuaalliiddaaddee ddaa ccaarrnnee
Insensibilização - fraturas ósseas e hematomas; congelamento e perda de
líquido - coloração - maciez.
PPaannoorraammaa nnoo mmuunnddoo ee nnoo ssuull ddoo BBrraassiill
Em observações feitas nos Estados Unidos, Canadá, Austrália, Dinamarca e
Alemanha foi verificado que durante os últimos quatro anos houve um crescente
aumento do número de suínos extremamente excitáveis. São animais muito
difíceis de serem manejados nos abatedouros e geralmente resultam em carcaças
PSE após o abate.
A incidência de carcaças suínas com anomalias de qualidade de carne em
nosso meio pode estar aumentando à medida que esforços estão sendo feitos
para aumentar a quantidade de carne em detrimento da gordura. Há um
consenso de que a seleção de suínos para a produção de carcaças com mais
carne e menos gordura provocou um efeito negativo sobre a qualidade da carne
resultando em perdas importantes.
Enquanto a qualidade de carne suína vem sendo intensamente pesquisada
na Europa e Estados Unidos desde a década de 60, no Brasil, e mais
especificamente no Rio Grande do Sul, estes estudos iniciaram-se em 1988, na
UFRGS, com trabalho da professora Jane M.R. Ourique da Faculdade de
Veterinária que avaliou as correlações das características de qualidade da carne
medidas através do pH, coloração e perdas por gotejamento. O trabalho seguinte
foi o da professora Paulete V. Culau do Instituto de Biociências (1990) que
verificou o efeito da distância de transporte e tempo de descanso dos animais
antes do abate sobre a qualidade da carne. Em 1991, a professora Maria Cristina
Bressan, da Universidade Federal de Lavras - MG, estudou o efeito do intervalo
de tempo entre a sangria e a entrada das carcaças na câmara fria e diferentes
velocidades de resfriamento sobre as características de qualidade da carne suína.
Os trabalhos foram orientados pelo autor, professor da Faculdade de Agronomia,
e apresentados como dissertações para o grau de mestre.
3 Simpósio sobre Rendimento e Qualidade da Carne Suína -15 e 16 de setembro/98
O quarto trabalho da seqüência foi de autoria do Médico Veterinário Remy
Andrade Jr., serviu de base para seu curso de especialização na UFPR e tratava
de diferentes fatores que poderiam afetar a qualidade da carne suína, bem como
o efeito das carnes PSE e DFD sobre a perda de líquido no processo de
resfriamento.
Em 1992 e 1993 realizamos, com a participação de todos os autores,
previamente citados um levantamento da ocorrência de carcaças PSE no Estado
do Rio Grande do Sul.
Finalmente, em 1997 o Engenheiro Agrônomo Ricardo Monghilhott de Brito,
também no Curso de Mestrado da Faculdade de Agronomia da UFRGS, verificou
o efeito do uso adicional das vitaminas E e C na qualidade da carne suína.
Deste conjunto de trabalhos é possível concluir que a incidência de
carcaças com PSE, no Rio Grande do Sul, ou no Sul do Brasil, varia de 20 a
40%, o que não é muito diferente dos dados publicados relativos a outros países
como Noruega (1981) 20%, Alemanha Ocidental (1982) 41,2%, Inglaterra
(1978 e 1983) 12,8 a 15,5%, Espanha (1986) 31%, Estados Unidos da América
do Norte (1992) 16%, Checoslováquia (1992) 22 a 31,5% e Austrália (1992)
32%.
CCoonncclluussõõeess
Para atender as exigências da indústria de produzir um suíno em condições
de bem-estar animal, com qualidade de carne e em níveis compatíveis de
produtividade, é preciso: melhoria das qualidades sensoriais da carne sem
comprometer a muscularidade; resolver as questões éticas e de segurança do
uso do hormônio de crescimento - Somatotropina (PST); desenvolvimento de um
Kit de diagnóstico do gen receptor do ryanodine para facilitar a eliminação dos
aspectos negativos do gen halotano; melhoria das condições de transporte, pré-
abate e insensibilização conhecendo melhor o comportamento animal e sua
tolerância ao stress; controle da desidratação no transporte e rehidratação antes
do abate e formas de manter os suínos calmos e frios antes do abate.
BBiibblliiooggrraaffiiaa
1. OURIQUE, Jane Maria Rubensan; NICOLAIEWSKY, Sergio. Características
físico-químicas e suas relações na avaliação de qualidade da carne suína.
In: XXVII REUNIÃO ANUAL DA SOCIEDADE BRASILEIRA DE
ZOOTECNIA, 1990, Campinas. Anais... p.431.
2. OURIQUE, Jane Maria Rubensan; NICOLAIEWSKY, Sergio. Características
físico-químicas e suas relações na avaliação de qualidade da carne suína.
Revista da Sociedade Brasileira de Zootecnia, Campinas, v.19, n.2,
p.118-125, 1990.
4 Simpósio sobre Rendimento e Qualidade da Carne Suína -15 e 16 de setembro/98
3. CULAU, Paulete de Oliveira Vargas; OURIQUE, Jane Maria Rubensan;
NICOLAIEWSKY, Sergio. The effect of transportation distance and
preslaughter lairage time on the pig meat quality. In: INTERNATIONAL
CONGRESS OF MEAT SCIENCE AND TECHNOLOGY, 1991, Kulmbach.
Proceedings..., v.1, p.224-228.
4. CULAU, Paulete de Oliveira Vargas; OURIQUE, Jane Maria Rubensan;
NICOLAIEWSKY, Sergio. Transporte e descanso pré-abate em relação a
PSE e DFD - Verão. In: XXX REUNIÃO ANUAL DA SOCIEDADE
BRASILEIRA DE ZOOTECNIA, 1993, Rio de Janeiro. Anais... p.183.
5. CULAU, Paulete de Oliveira Vargas; OURIQUE, Jane Maria Rubensan;
NICOLAIEWSKY, Sergio. Efeito do manejo pré-abate sobre incidência de
PSE e DFD em suínos. Archivos Latinoamericanos de Producción Animal,
v.1, n.2, 1993.
6. ANDRADE JR., Remy; NICOLAIEWSKY, Sergio; OURIQUE, Jane Maria
Rubensan; CULAU, Paulete de Oliveira Vargas; BRESSAN, Maria Cristina.
Análise de alguns fatores determinantes da qualidade da carne suína. I.
Efeito da distância GRANJA-FRIGORÍFICO, tempo de descanso, sexo e
peso-vivo. In: CONGRESSO BRASILEIRO DE MEDICINA VETERINÁRIA,
1992, Curitiba.
7. ANDRADE JR., Remy; NICOLAIEWSKY, Sergio; OURIQUE, Jane Maria
Rubensan; CULAU, Paulete de Oliveira Vargas; BRESSAN, Maria Cristina.
Análise de alguns fatores determinantes da qualidade da carne suína. II.
Perdas de peso de carcaças suínas PSE-DFD e normas durante o
resfriamento. In: CONGRESSO BRASILEIRO DE MEDICINA VETERINÁRIA,
1992, Curitiba.
8. BRESSAN, Maria Cristina; CULAU, Paulete de Oliveira Vargas; OURIQUE,
Jane Maria Rubensan; NICOLAIEWSKY, Sergio. Effect of time between
bleeding and the entry of carcasses in chilling chamber and chilling rates
on pork quality. In: INTERNATIONAL CONGRESS OF MEAT SCIENCE
AND TECHNOLOGY, 1992, Clermont Ferrand. Proceedings..., v.2,
p.165-168.
9. CULAU, Paulete de Oliveira Vargas; OURIQUE, Jane Maria Rubensan;
NICOLAIEWSKY, Sergio; BRESSAN, Maria Cristina. Incidence of PSE in
commercial pig carcasses in Rio Grande do Sul. In: INTERNATIONAL
CONGRESS OF MEAT SCIENCE AND TECHNOLOGY, 1994. The Hague.
10. BRITO, Ricardo Monguilhott de. 1997. Adição das vitaminas E e C na dieta e
sua influência na qualidade da carne suína. 95f. Faculdade de Agronomia,
UFRGS, Porto Alegre. Dissertação de Mestrado. Agronomia, Zootecnia.
5 Simpósio sobre Rendimento e Qualidade da Carne Suína -15 e 16 de setembro/98
CCOOMMOO MMEEDDIIRR AA QQUUAALLIIDDAADDEE DDAA CCAARRNNEE NNAA
LLIINNHHAA DDEE AABBAATTEE DDEE SSUUÍÍNNOOSS
José Vicente Peloso
Med. Veterinário – M.Agr.Sc.
SADIA S.A., Concórdia – SC
IInnttrroodduuççããoo
Uma considerável e significativa variação na qualidade da carne do suíno é
verificada nos frigoríficos brasileiros, europeus e norte-americanos pesquisados
até o momento3,12,24,39. É sabido que os desvios de qualidade que ocorrem na
carne suína são causados ao mesmo tempo por fatores genéticos e
ambientais1,28,31,33,38. As relações de causa e efeito mais evidentes ocorrem entre
a Porcine Stress Syndrome (PSS) e a carne Pálida, Mole e Esxudativa
(PSE)6,15,17,29,31 e entre o gene RN (Rendimento Napoli) e a carne ácida18. A tarefa
de medir objetivamente a qualidade da carne contida nas carcaças na linha de
abate de suínos exige a definição da utilidade e da precisão da medida, aliadas
obviamente ao custo-benefício da mesma7,8. Medir a qualidade para o
aproveitamento industrial das carcaças tem no mínimo três utilidades: “tipificar”
carcaças de acordo com a qualidade da carne, permitindo a identificação de
carcaças portadoras de defeitos que comprometem o rendimento e as
características sensoriais durante o processamento dos produtos a que elas se
destinam. Criar critérios que permitem bonificar ou penalizar as carcaças de
acordo com os valores obtidos dentro destes valores pré-definidos. A terceira
utilidade é o controle pela fábrica, permitindo conhecer a freqüência de carcaças
e ou cortes que não possuem a qualidade desejada e o conseqüente
gerenciamento deste problema.
Todas as avaliações objetivas e subjetivas possíveis dentro do frigorífico
são baseadas nas transformações bioquímicas, físico-químicas e visuais que
acontecem na musculatura estriada esquelética contida nas carcaças30. Após o
abate do animal, esta musculatura passa a ser regulada, por um certo período de
tempo, através do metabolismo anaeróbico (ausência de oxigênio nas células
musculares) após o fim do metabolismo aeróbico (sangria e morte do animal)5.
Durante este período, o músculo deixa de ser músculo e transforma-se em carne.
Neste espaço de tempo, ocorrem modificações no músculo e em suas estruturas
básicas (fibra muscular, mioplasma e suas proteínas constituintes), que vão
definir a qualidade final deste músculo que virou carne26,27.
VVaarriiaaççõõeess nnaa qquuaalliiddaaddee ddaa mmaattéérriiaa--pprriimmaa
Este conjunto de transformações que ocorre no músculo pode alterar de
maneira irreversível as propriedades funcionais e as características tecnológicas e
sensoriais da carne10. Estas transformações estão, de uma maneira ampla,
condicionadas aos efeitos da quebra ou consumo do glicogênio muscular,
6 Simpósio sobre Rendimento e Qualidade da Carne Suína -15 e 16 de setembro/98
levando a uma maior ou menor concentração de ácido lático, determinando
consequentemente o valor final do pH da carne10,19,22. Em outras palavras, a
glicólise muscular em toda a sua cadeia de reações bioquímicas é o fator
determinante da qualidade final do músculo suíno26,27. Para os frigoríficos, isto
se traduz no mais freqüente problema tanto para produtos in natura quanto para
processados, principalmente os embutidos e cozidos: a carne PSE35. Entretanto,
na avaliação individual das características físicas, ou seja, capacidade de
retenção de água, consistência (maciez, dureza, firmeza) e cor, definem-se
outras categorias de qualidade da carne suína: RFN (normal ou ideal); RSE (cor
normal, porém exsudativa e mole) e DFD (escura, dura e seca)12,36.
MMeeddiinnddoo aa qquuaalliiddaaddee ddaa ccaarrnnee nnaass ccaarrccaaççaass
Dentro do frigorífico podemos dividir os momentos de avaliação da
qualidade da carne em dois: antes e após o resfriamento das carcaças. Mais
ainda, antes do resfriamento só é possível fazer qualquer medição quando os
músculos escolhidos ficam expostos, do contrário a tarefa se torna pouco prática
e de certa maneira irrelevante. Entretanto, já foi demonstrado que certas
avaliações feitas no suíno vivo, possuem moderada correlação com as medidas
tomadas nas carcaças correspondentes16,17. Valores de qualidade de carne
obtidos de suínos vivos podem ter importância como critério de seleção em
programas de melhoramento genético, mas seus métodos os tornam inviáveis
em avaliações de grande escala, como as necessárias dentro de um frigorífico.
A primeira, e provavelmente uma das mais importantes medidas possíveis
logo após o abate, é o valor do pH inicial ou pH40 (40 minutos pós-sangria,
dependendo da disponibilidade prática). É uma medida utilizada quase como um
padrão Mundial23,39, possui moderada correlação com a qualidade final da carne e
geralmente é feita no lombo (m. Longissimus lumborum) e/ou no pernil (m.
semimembranosus)8,21,22,32. Serve como razoável estimador da carne PSE neste
instante, porém sua precisão para detecção de PSE e/ou DFD aumenta quanto
aliado a uma medida de cor e outra de capacidade de retenção de água
(CRA)7,8,13,21,32,34. O pH inicial possui alta correlação com o genótipo de
sensibilidade ao stress (“gene do halotano”) e é possível diferenciar os animais
sensíveis ao stress dos não sensíveis, pelos valores do pH406,15,16,20,31. A melhor
aplicação do pH40 é quando se consegue utilizá-lo como potente estimador da
CRA final da carcaça, numa velocidade de nórea de mais de 300 suínos/hora.
Além do pH40, outras avaliações são utilizadas, porém com menor
freqüência, ainda na carcaça quente, como valores de dispersão de luz ou cor,
condutividade e/ou resistência elétrica21,25. O primeiro pode ser obtido dos
equipamentos de tipificação de carcaças (relação carne:gordura) que utilizam a
dispersão de luz como princípio de leitura da espessura do toucinho e do lombo
(ex.: HGP4™, FOM™). Infelizmente, os valores de cor obtidos pelas pistolas de
tipificação, são fracos estimadores da qualidade final do lombo8,13,32. As
avaliações elétricas necessitam de equipamentos especialmente projetados para
tanto (ver Tabela 1), que são mais resistentes ao ambiente industrial do que os
pHmêtros. Desta forma, ambos podem ser empregados como substitutos do
pH40, porém com menor precisão21,25,37.
7 Simpósio sobre Rendimento e Qualidade da Carne Suína -15 e 16 de setembro/98
A situação ideal é aquela na qual a qualidade final da carne contida na
carcaça fria, pode ser estimada com suficiente precisão ainda na carcaça
quente13,32. Assim sendo, é a qualidade final, ou seja, aquela presente na carne
quando a carcaça é cortada (pernil, costado, barriga e paleta) que é mais
relevante para a indústria7,13. Como já visto, valores de pH, cor e condutividade,
utilizados em conjunto possibilitam com maior ou menor precisão, a detecção de
carcaças com carne PSE antes do resfriamento. Após o resfriamento, quando as
reações bioquímicas cessam por completo na carne e sua qualidade final é
atingida, a utilização de valores de pHu ou pH último, cor final associadas as
medidas de CRA, permitem definir com maior precisão a real freqüência de
lombos ou pernis RFN, RSE, PSE e DFD no frigorífico4,5,11,36. Neste sentido, as
avaliações mais relevantes são as de cor de superfície, geralmente obtidas
através do valor L* (lightness), o pHu, e a dispersão da luz através de fibra
ótica8,21,33,34. No ambiente comercial, o método mais prático para se determinar a
CRA da carne é o Drip Loss ou Gotejamento, embora métodos alternativos
tenham sido descritos14. Quando bem empregado, o gotejamento serve como
valor de referência, e seu valor poder ser estimado com precisão suficiente
usando-se por exemplo o pHu ou cor final do músculo7,13,20,21,22,30,32,37.

8 Simpósio sobre Rendimento e Qualidade da Carne Suína -15 e 16 de setembro/98
Tabela 1. Métodos de avaliação da carne suína freqüentemente utilizados na prática e na pesquisa.
Método Preci-
são
Tipo de
Equipamento
Custo
inicial
Tempo de
Medição
Aplica-
ção
Vantagem Desvantagem Outras
Considerações
Avaliação
Visual
da Cor e
Firmeza
Mode-
rada
Padrões
Fotográficos/
“Pastilhas”
Japonesas
Baixo
Rápido
Simples
Rápido
e
Simples
Músculo tem que
ser exposto e
padronizado
Intensidade da luz no
ambiente pode influenciar
julgamento do observador
Métodos Físicos:
% Gotejamento
Alta
Balança com
precisão de 1
grama
Mode-
rado
Lento
Simples
Medida
objetiva
da CRA#
Vagaroso,
propenso a erro,
destrutivo
Necessária padronização das
amostras de músculo
(dimensões e peso)
Filtro de
Papel
Mode-
rada
Balança de
miligrama, filtro
especial
Mode-
rado
Moderado
Simples
Medida
relacionada a
CRA#
Músculo tem que
ser exposto
Usado nas
24 horas
post mortem
Centrifugação:
Para
CRA#
Alta
Centrífuga de
alta velocidade
Alto
Lento
Simples
Medida
relacionada a
CRA#
Vagaroso,
propenso a erro,
destrutivo
Pouco
prático
Para absorção
de água
Alta
Centrífuga de
baixa
Velocidade
Mode-
rado
Lento
Complexa
Relacionada a
absorção
de água
Vagarosa e
destrutiva
Momento post
mortem não é crítico
pH:
Eletrodo de
vidro/epoxi
Alta
pHmêtro e
eletrodo
(Correção p/ To)
Mode-
rado
Rápido
Simples
Fácil
manuseio
Calibração e
quebra do eletrodo
pHmêtro sensível
a baixas temperaturas
Óticos/Elétricos:
Reflectância
da Luz
Mode-
rada
Colorímetro
(Ex.: Minolta™)
Alto
Rápido
Simples
Mede cor da
superfície
Músculo tem que
ser exposto
Descreve variação de cor
Padrão CIE L* a b
Dispersão
da Luz
Mode-
rada
Fibra Ótica
(Ex.: FOP™)
Mode-
rado
Rápido
Simples
Mede cor
profunda
Precisão Descreve CRA
do músculo
Condutividade
Elétrica
Mode-
rada
PQM™
LT-K*21™
Mode-
rado
Rápido
Simples
Velocidade
da medida
Precisão Mais utilizado
experimentalmente
Resistência
Elétrica
Mode-
rada
MS-Tester™
LF Digi 550™
Mode-
rado
Rápido
Simples
Fácil
manuseio
Invasivo Mais utilizado
experimentalmente
Químicos:
Extração de
Lipídios
Alta
Laboratorial
Alto
Rápido
Complexa
Precisão
Custo
Considerado padrão para
gordura intra-muscular
Solubilidade de
proteínas
Mode-
rada
Centrífuga/
Espectrofotômetro
Alto
Lento
Complexa
Medida direta
da CRA
Destrutiva/
Velocidade
Mais utilizado na pesquisa/
experimentalmente

9 Simpósio sobre Rendimento e Qualidade da Carne Suína -15 e 16 de setembro/98
Adaptado de Kauffman & Warner (1993) e Cross & Belk (1994) + opinião pessoal do autor. #Capacidade de Retenção de Água.
10 Simpósio sobre Rendimento e Qualidade da Carne Suína -15 e 16 de setembro/98
RReeffeerrêênncciiaass BBiibblliiooggrrááffiiccaass
1. BÄCKSTRÖM, L. & KAUFFMAN, R. The Porcine Stress Syndrome: A review of genetics,
environmental factors, and animal well-being implications. Agri-Practice, v.16, p.24-
30, 1995.
2. CROSS, H. R. & BELK, K. E. Objective measurements of carcass and meat quality. Meat
Science, v. 36, p.191-202, 1994.
3. CULAU, P. O. V., OURIQUE, J. M. R., NICOLAIEWSKY & BRESSAN, M. C. Incidence of
PSE in commercial pig carcasses in Rio Grande do Sul state, Brazil. Boletim Técnico
da Associação Sul Brasileira das Indústrias de Produtos Suínos, Porto Alegre, 1994.
4. EIKELENBOOM, G., HOVINK-BOLINK, A. H. & VAN DER WAL, P. G. The eating quality of
pork 1. The influence of ultimate pH. Fleischwirtschaft, v. 76, p.392-393, 1996.
5. FERNANDEZ, X., FORSLID, A. & TORNBERG, E. The effect of high post-mortem
temperature on the development of pale, soft and exudative pork: Interaction with
ultimate pH. Meat Science, v. 37, p.133-147, 1994.
6. GARCÍA-MACÍAS, J. A., GISPERT, M., OLIVER, M. A., DIESTRE, A., ALONSO, P.,
MUÑOZ-LUNA, A., SIGGENS, K. & CUTHBERT-HEAVENS, D. The effects of cross,
slaughter weight and halothane genotype on leanness and meat quality in pig
carcasses. Animal Science, v. 63, p.487-496, 1996.
7. GARRIDO, M. D., BAÑÓN, S., PEDAUYÉ, J., & LAENCINA, J. Objective meat quality
measurements of ham: A pratical classification method on the slaughterline. Meat
Science, v. 37, p.421-428, 1994.
8. GARRIDO, M. D., PEDAUYÉ, J., BAÑÓN, S. & LAENCINA, J. Objective assessment of
pork quality. Meat Science, v. 37, p.411-420, 1994.
9. IRIE, M. & SWATLAND, H. J. Prediction of fluid losses from pork using subjective and
objective paleness. Meat Science, v. 33, p.277-292, 1993.
10. KARLSSON, A., ESSEN-GUSTAVSSON, B. & LUNDSTRÖM, K. Muscle glycogen depletion
pattern in halothane-gene-free pigs at slaugther and its relation to meat quality. Meat
Science, v. 38, p.91-101, 1994.
11. KAUFFMAN, R. G., & WARNER, R. D. Evaluating pork carcasses for composition and
quality. In: Hollis, G. R., Warner, R. D. ed. Growth of the pig. Wallingford, CABI,
p.141-166, 1993.
12. KAUFMANN, R. G., SCHERER, A. & MEEKER, D. L. Variations in pork quality. History,
definition, extent, resolution. National Pork Producers Council Publication, Iowa, p.1-
8, 1992.
13. KAUFFMAN, R. G., SYBESMA, W., SMULDERS, F. J. M., EIKELENBOOM, G., ENGEL, B.,
VAN LAACK, R. L. J. M., HOVINK-BOLINK, A. H., STERRENBURG, P., NORDHEIM,
E. V., WALSTRA, P. & VAN DER WAL, P. G. The effectiveness of examining early
post mortem musculature to predict ultimate pork quality. Meat Science, v. 34,
p.283-300, 1993.
14. KIM, B. C., KAUFFMAN, R. G., NORMAN, J. M. & JOO, S. T. Measuring water-holding
capacity in pork musculature with a tensiometer. Meat Science, v. 39, p.363-374,
1995.
15. KOCWIN-PODSIADLA, M., PRZYBYLSKI, W., KURYL, J., TALMANT, A. MONIN, G.
Muscle glycogen level and meat quality in pigs of different halothane genotypes.
Meat Science, v. 40, p.121-125, 1995.
16. LAHUCKY, R., CHRISTIAN, L. L., KOVAC, L., STALDER, K. J. & BAUEROVA, M. Meat
quality assessed ante- and post-mortem by different ryanodine receptor gene status
of pigs. Meat Science, v. 47, p.277-286, 1997.
11 Simpósio sobre Rendimento e Qualidade da Carne Suína -15 e 16 de setembro/98
17. LAHUCKY, R., MOJTO, J., POLTARSKY, J., MIRI, A. RENOU, J. P., TALMANT, A. &
MONIN, G. Evaluation of halothane sensitivity and prediction of post-mortem muscle
metabolism in pigs from a muscle biopsy using 31P NMR spectroscopy. Meat Science,
v. 33, p.373-384, 1993.
18. LUNDSTRÖM, K., ENFÄLT, A. C., TORNBERG, E. & AGERHEM, H. Sensory and
technological meat quality in carriers and non-carriers of the RN¯ allele in Hampshire
crosses and in purebred Yorkshire pigs. Meat Science, v. 48, p.115-124, 1998.
19. MOESGÅRD, B., QUISTORFF, B., CHRISTENSEN, V. G., THERKELSEN, I. & JØRGENSEN,
P. F. Differences of post-mortem ATP turnover in skeletal muscle of normal and
heterozygote malignant-hyperthermia pigs: Comparison of 31P-NMR and analytical
biochemical measurements. Meat Science, v. 39, p.43-58, 1995.
20. OLIVER, M. A., GISPERT, M. & DIESTRE, A. The effects of breed and halothane
sensitivity on pig meat quality. Meat Science, v.35, p.105-118, 1993.
21. OLIVER, M. A., GISPERT, M., TIBAU, J. & DIESTRE, A. The measurements of light
scattering and electrical conductivity for the prediction of PSE pig meat at various
times post mortem. Meat Science, v.29, p.141-151, 1991.
22. ROSEIRO, L. C., SANTOS, C. & MELO, R. S. Muscle pH60, colour (L, a, b) and water-
holding capacity and the influence of post-mortem meat temperature. Meat Science,
v. 38, p.353-360, 1994.
23. ROSEIRO, L. C., SANTOS, C., ALMEIDA, J. & MELO, R. S. Measurements of pH60 in pork
using ISFET/REFET and glass electrode methods. Meat Science, v. 38, p.347-352,
1994.
24. SANTOS, C., ROSEIRO, L. C., GONÇALVES, H. & MELO, R. S. Incidence of different pork
quality categories in a portuguese slaughterhouse: A survey. Meat Science, v. 38,
p.279-287, 1994.
25. SCHMITTEN, F., SCHEPERS, K., JÜNGST, H., REUL, U. & FESTERLING, A. Fleischqualität
beim schwien – Untersuchungen zu deren erfassung. Fleischwirtshaft, v. 64, p.1238-
1242, 1984.
26. SCHWÄGELE, F., HASCHKE, C., HONIKEL, K. O. & KRAUSS, G. Enzymological
investigations on the causes for the PSE-syndrome, I. Comparative studies on
pyruvate kinase from PSE- and normal pig muscles. Meat Science, v. 44, p.27-40,
1996.
27. SCHWÄGELE, F., LOPEZ BUESA, P. L. & HONIKEL, K. O. Enzymological investigations on
the causes for the PSE-syndrome, II. Comparative studies on the glycogen
phosphorylase from pig muscles. Meat Science, v. 44, p.41-54, 1996.
28. SHAW, F. D., TROUT, G. R. & MCPHEE, C. P. Plasma and muscle cortisol measurements
as indicators of meat quality and stress in pigs. Meat Science, v. 39, p.237-246,
1995.
29. SUTTON, D. S., ELLIS, M., LAN, Y., MCKEITH, F. K. & WILSON, E. R. Influence of
slaughter weight and stress gene genotype on the water-holding capacity and protein
gel characteristics of three porcine muscles. Meat Science, v. 46, p.173-180, 1997.
30. SWATLAND, H. J. Physical measurements of meat quality: Optical measurements, pros
and cons. Meat Science, v. 36, p.251-259, 1994.
31. TAM, L. G., BERG, E. P., GERRARD, D. E., SHEISS, E. B., TAN, F. J., OKOS, M. R. &
FORREST, J. C. Effect of halothane genotype on porcine meat quality and myoglobin
autoxidation. Meat Science, v. 49, p.41-54, 1998.
32. VAN DER WAL, P. G., DE VRIES, A. G. & EIKELENBOOM, G. Predictive value of
slaughterhouse measurements of ultimate pork quality in seven halothane negative
Yorkshire populations. Meat Science, v. 40, p.183-192, 1995.
33. VAN DER WAL, P. G., ENGEL, B. & HULSEGGE, B. Causes for variation in pork quality.
Meat Science, v. 46, p.319-328, 1997.

12 Simpósio sobre Rendimento e Qualidade da Carne Suína -15 e 16 de setembro/98
34. VAN LAAK, R. L. J. M., KAUFFMAN, R. G., SYBESMA, W., SMULDERS, F. J. M.,
EIKELENBOOM, G. & PINHEIRO, J. C. Is colour brightness (L-value) a reliable
indicator of water-holding capacity in porcine muscle? Meat Science, v. 38, p.193-
201, 1994.
35. WARNER, R. D., KAUFFMAN, R. G. & GREASER, M. L. Muscle protein changes post
mortem in relation to pork quality traits. Meat Science, v. 45, p.339-352, 1997.
36. WARNER, R. D., KAUFFMAN, R. G. & RUSSEL, R. L. Quality attributes of major porcine
muscles: A comparison with the Longissimus lumborum. Meat Science, v. 33, p.359-
372, 1993.
37. WARRISS, P. D., BROWN, S. N., ADAMS, S. J. M. Use of the Tecpro Pork Quality Meter
for assessing meat quality on the slaughterline. Meat Science, v. 30, p.147-156,
1991.
38. WARRISS, P. D., BROWN, S. N., ADAMS, S. J. M. & CORLETT, I. K. Relationships
between subjective and objective assessments of stress at slaughter and meat quality
in pigs. Meat Science, v. 38, p.329-340, 1994.
39. WARRISS, P. D., BROWN, S. N., BARTON GADE, P., SANTOS, C., NANNI COSTA,
L., LAMBOOIJ, E. & GEERS, R. An analysis of data relating to pig carcass quality and
indices of stress collected in the European Union. Meat Science, v. 49, p.137-144,
1998.
13 Simpósio sobre Rendimento e Qualidade da Carne Suína -15 e 16 de setembro/98
CCAARRAACCTTEERRÍÍSSTTIICCAASS FFÍÍSSIICCAASS EE OORRGGAANNOOLLÉÉPPTTIICCAASS DDAA CCAARRNNEE
EE GGOORRDDUURRAA QQUUEE AAFFEETTAAMM AA QQUUAALLIIDDAADDEE DDOOSS PPRROODDUUTTOOSS
IINNDDUUSSTTRRIIAALLIIZZAADDOOSS
Massami Shimokomaki1 & Rubison Olivo2
1Programa de Mestrado e Doutorado em Ciência dos Alimentos, Depto. de Tecnologia de
Alimentos e Medicamentos, CCA-Universidade Estadual de Londrina, Caixa Postal, 6001, CEP
86051-970-Londrina, PR, Email [email protected] 2Rezende Alimentos, Uberlândia, MG
O consumo de carnes industrializadas vem aumentando significativamente
devido aos diversos fatores: estabilidade da moeda, mudança de comportamento
como a da entrada das mulheres do mercado de trabalho, etc. Estimou-se pela
Instituto Nielsen de que no período de 92 a 93, o consumo atingiu a 263 mil
toneladas de embutidos emulsionados no Brasil. Baseando-se nestes fatos, pode-se
projetar um consumo per capita de aproximadamente 2 kg indicando a importância
destes produtos na nossa economia. Por estes fatos, abordaremos nesse artigo, os
cuidados necessários para a obtenção de produtos emulsionados cárneos com
qualidade.
EEmmuullssããoo ccáárrnneeaa
As emulsões cárneas são consideradas por muito autores como sendo uma
emulsão óleo em água porem, não são emulsões verdadeiras. E uma suspensão
coloidal complexa não totalmente homogênea e suas partículas dispersas possuem
tamanho de 10 a 50u. A fase dispersa é constituída por partículas de gordura, fibras
musculares, aditivos, farináceos, e a fase continua é constituída pela água, sal,
proteínas hidrossolúveis, e outros elementos solúveis. Muitos autores consideram,
dessa forma quando não estão finamente triturados, os embutidos como sendo uma
massa cárnea.
CCoommoo ssããoo ffoorrmmaaddaass aass mmaassssaass ccáárrnneeaass??
A mistura dos ingredientes realizada pelo cutter confere uniformidade ao produto
em relação ao tamanho das partículas. Nesta fase, ocorre a fragmentação da
estrutura fibrosa dos músculos o que aumenta a exposição da superfície das
proteínas. As proteínas miofibrilares nesta fase encontram-se no estado insolúvel.
Posteriormente, na presença dos sais e água inicia-se a solubilização e o subsequente
entumescimento das proteínas devido a absorção da água produzindo uma matriz
viscosa (SOL). Essas proteínas solubilizadas funcionarão como agentes emulsificantes
sendo a miosina considerada o principal componente emulsionante. A estabilidade
desse sistema é o principal fator para a qualidade da massa e depende da propriedade
de agentes emulsificantes em reter a água e gordura produzindo o efeito denominado
coesividade proporcionada pela inter-relação destes componentes. A coesividade é
afetada principalmente durante a fase de cozimento quando a gordura não se separa
do sistema.
14 Simpósio sobre Rendimento e Qualidade da Carne Suína -15 e 16 de setembro/98
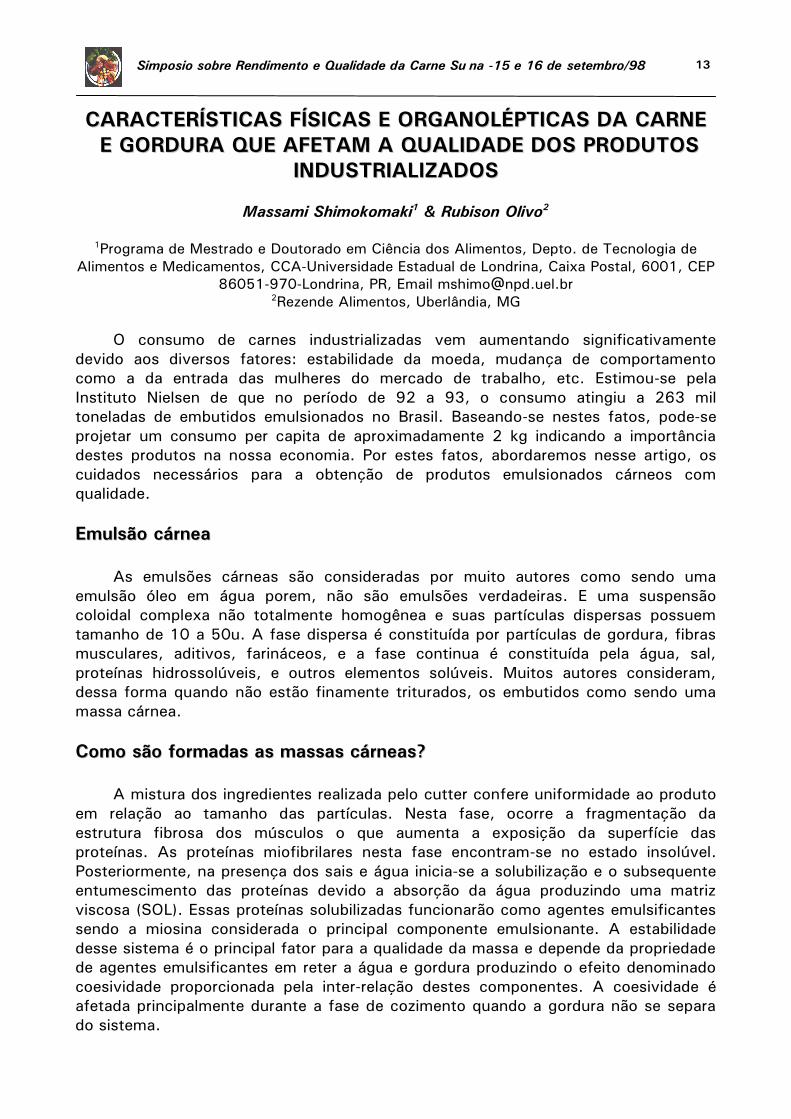
Modelos tem sido propostos para explicar a estabilidade da emulsão da carne. e
dois deles são preponderantes: teoria da emulsão e teoria de aprisionamento físico. A
teoria da emulsão apresentada por Mandigo e seu grupo (1) descrevem a formação de
um Filme Protéico Interfacial (FPI) que é elaborada durante o batimento no cutter
circundando a gotícula de gordura. através da sua porção hidrofóbica enquanto que a
porção hidrofílica
localizada externamente à gotícula retém a água o que ocorre freqüentemente
nas emulsões verdadeiras (Fig. 1).
A teoria do aprisionamento físico defende a hipótese de que as gotículas de
gorduras são retidas devido ao desenvolvimento das forças iônicas presentes na
matriz protéica. As proteínas geleificam-se durante o cozimento formando uma malha
retendo as gotículas de gordura e a água (2).
FIG. 1 - Formação de uma emulsão em que a proteína atua como agente estabilizador
formando um filme que une gordura e água (Ref. 4).
QQuueebbrraa ddaa EEmmuullssããoo
Apesar das discussões levantadas a respeito, ha o consenso de que os dois
fenômenos podem ocorrer durante o processamento sendo que na massa ainda crua
ocorre a formação da emulsão e ao provocar o tratamento térmico, o fenômeno do
aprisionamento físico pelo gel protéico seria preponderante (3). E possível, portanto,
afirmar que o produto cru apresenta uma textura tipo pasta em um estagio de
fragilidade (SOL) e nessa fase ha a necessidade dos cuidados de manuseio para que
não suceda a separação da gordura evitando o fenômeno da quebra da emulsão. Este
fato traz como conseqüência inconformidade na qualidade do produto podendo
provocar problemas de ordem econômica aos Frigoríficos. A máxima estabilidade do
sistema [e conseguida através do equilíbrio entre a espessura do FPI e densidade e
integridade da matriz protéica da emulsão durante o cozimento.
15 Simpósio sobre Rendimento e Qualidade da Carne Suína -15 e 16 de setembro/98
FFaattoorreess qquuee aaffeettaamm aa eessttaabbiilliiddaaddee ddaa eemmuullssããoo
A estabilidade da emulsão é afetada por diversos fatores dos quais podemos
destacar? tempo e temperatura utilizados durante o processo da emulsificação, tipo e
tamanho dos seus constituintes. Durante a cominutação, a temperatura da massa
aumenta provocada pela fricção pelo cutter. A temperatura máxima limite depende do
ponto de fusão das gorduras como 10-12ºC para frango, 15-18ºC para suínos e 21-
22ºC para bovinos. A temperatura deverá ser mantida inerente ao tipo de gordura
utilizada sem o qual ocorrera a sua fusão provocando o fat out durante o cozimento.
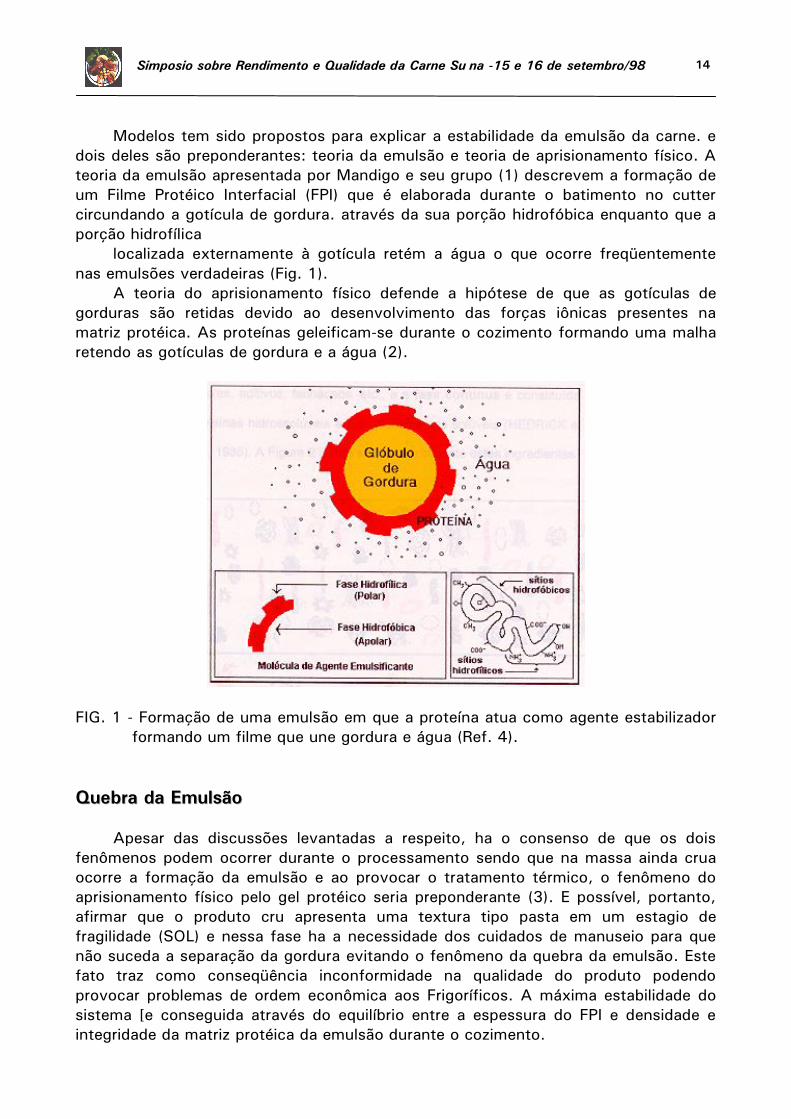
Jones e Mandigo (1) observaram que durante a preparação da massa, a temperatura
deveria ser mantida a 16ºC. À essa temperatura, formam-se poros ao redor da
gotícula de gordura que funcionam como válvulas de escape como o descrito na Fig.
2 (fase 1) por onde saem as gotículas menores de gordura {a medida que se eleva a
temperatura. Ao mesmo tempo, ocorre a desnaturação protéica que envolve a
gotícula aumentando o espessamento do FPI dificultando gradativamente o
mecanismo da liberação da pressão interna (fase 2) ate que a gotícula e circundada
pelo filme (fase 3). Em conseqüência, com o continuar do aumento dessa pressão
interna com o aquecimento da massa, ha a ruptura da membrana interfacial (fase 4)
provocando a quebra da emulsão.
FIG. 2 - Ilustração esquemática dos prováveis acontecimentos durante a formação (1),
estabilização (2,3) e quebra (4) da emulsão provocadas pela elevação da
temperatura (Ref. 1).
CCoommppoorrttaammeennttoo ddoo ccoolláággeennoo dduurraannttee aa eemmuullssiiffiiccaaççããoo
Outras proteínas podem ser utilizadas como agente emulsificante. Destaca-se o
colágeno presente em diversos tecidos e órgãos que representam uma grande
quantidade desprezada em frigoríficos como a pele, pulmão. Em determinadas
condições, colágeno co-distribue com as proteínas miofibrilares podendo auxiliar na
16 Simpósio sobre Rendimento e Qualidade da Carne Suína -15 e 16 de setembro/98
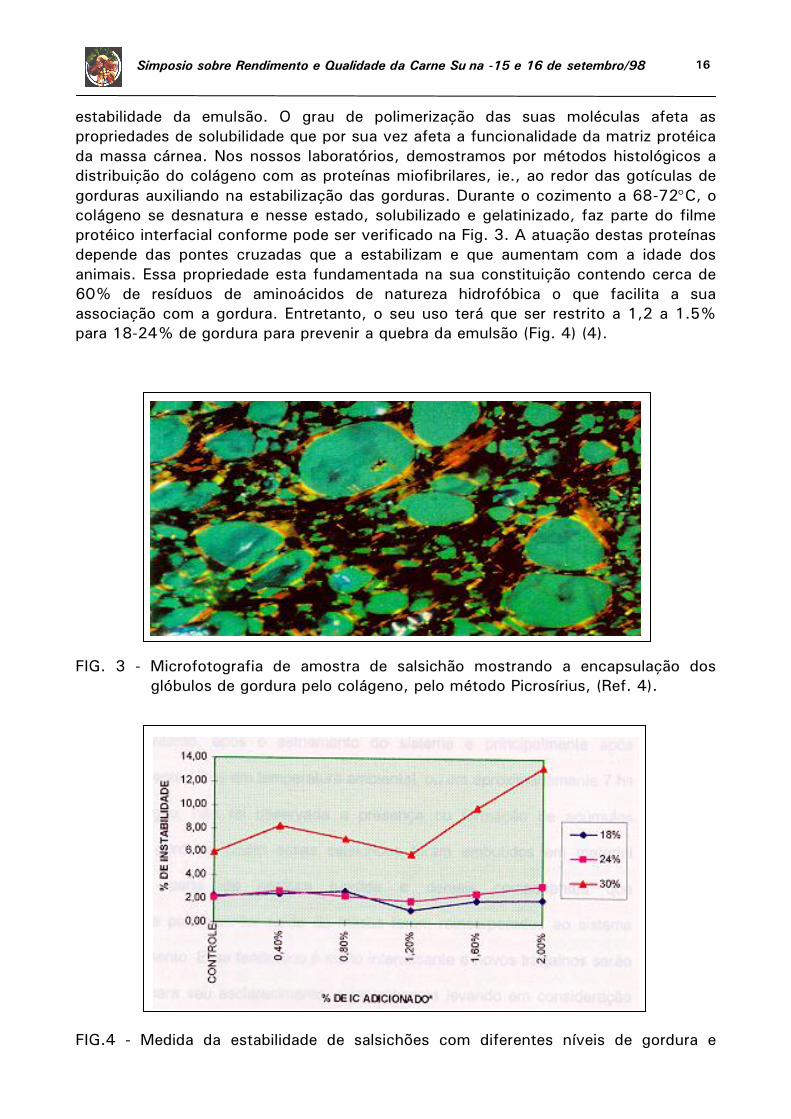
estabilidade da emulsão. O grau de polimerização das suas moléculas afeta as
propriedades de solubilidade que por sua vez afeta a funcionalidade da matriz protéica
da massa cárnea. Nos nossos laboratórios, demostramos por métodos histológicos a
distribuição do colágeno com as proteínas miofibrilares, ie., ao redor das gotículas de
gorduras auxiliando na estabilização das gorduras. Durante o cozimento a 68-72C, o
colágeno se desnatura e nesse estado, solubilizado e gelatinizado, faz parte do filme
protéico interfacial conforme pode ser verificado na Fig. 3. A atuação destas proteínas
depende das pontes cruzadas que a estabilizam e que aumentam com a idade dos
animais. Essa propriedade esta fundamentada na sua constituição contendo cerca de
60% de resíduos de aminoácidos de natureza hidrofóbica o que facilita a sua
associação com a gordura. Entretanto, o seu uso terá que ser restrito a 1,2 a 1.5%
para 18-24% de gordura para prevenir a quebra da emulsão (Fig. 4) (4).
FIG. 3 - Microfotografia de amostra de salsichão mostrando a encapsulação dos
glóbulos de gordura pelo colágeno, pelo método Picrosírius, (Ref. 4).
FIG.4 - Medida da estabilidade de salsichões com diferentes níveis de gordura e
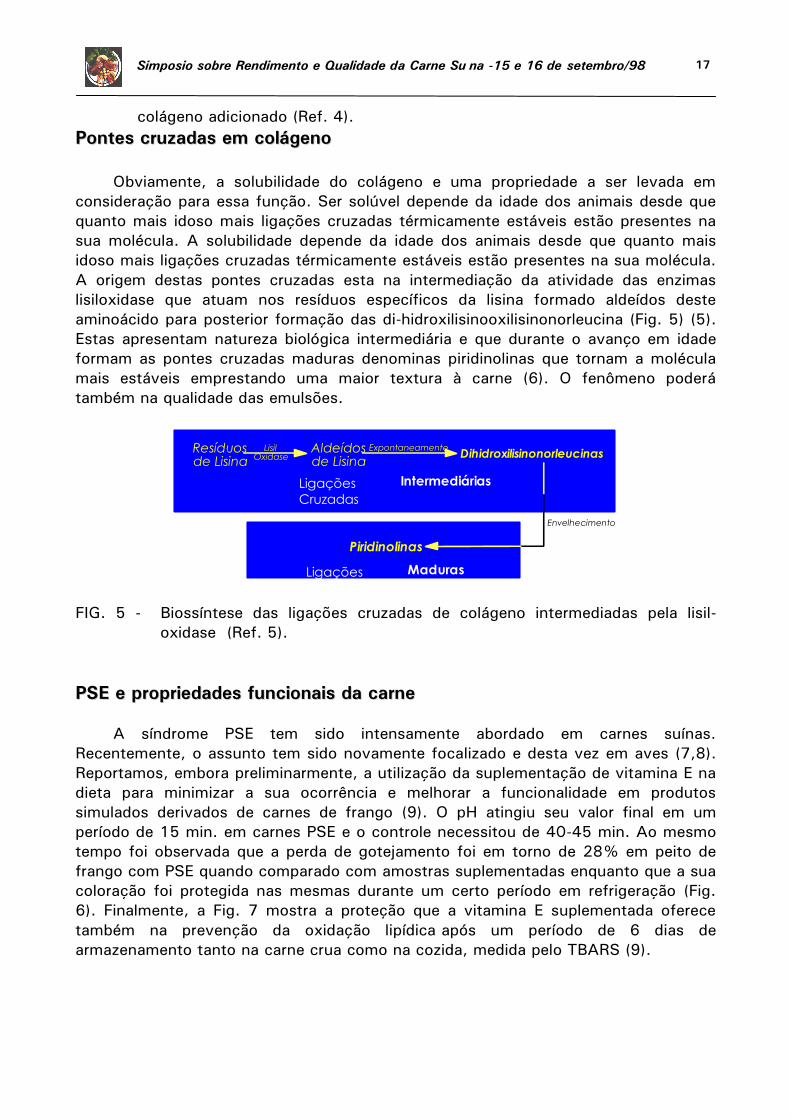
17 Simpósio sobre Rendimento e Qualidade da Carne Suína -15 e 16 de setembro/98
colágeno adicionado (Ref. 4).
PPoonntteess ccrruuzzaaddaass eemm ccoolláággeennoo
Obviamente, a solubilidade do colágeno e uma propriedade a ser levada em
consideração para essa função. Ser solúvel depende da idade dos animais desde que
quanto mais idoso mais ligações cruzadas térmicamente estáveis estão presentes na
sua molécula. A solubilidade depende da idade dos animais desde que quanto mais
idoso mais ligações cruzadas térmicamente estáveis estão presentes na sua molécula.
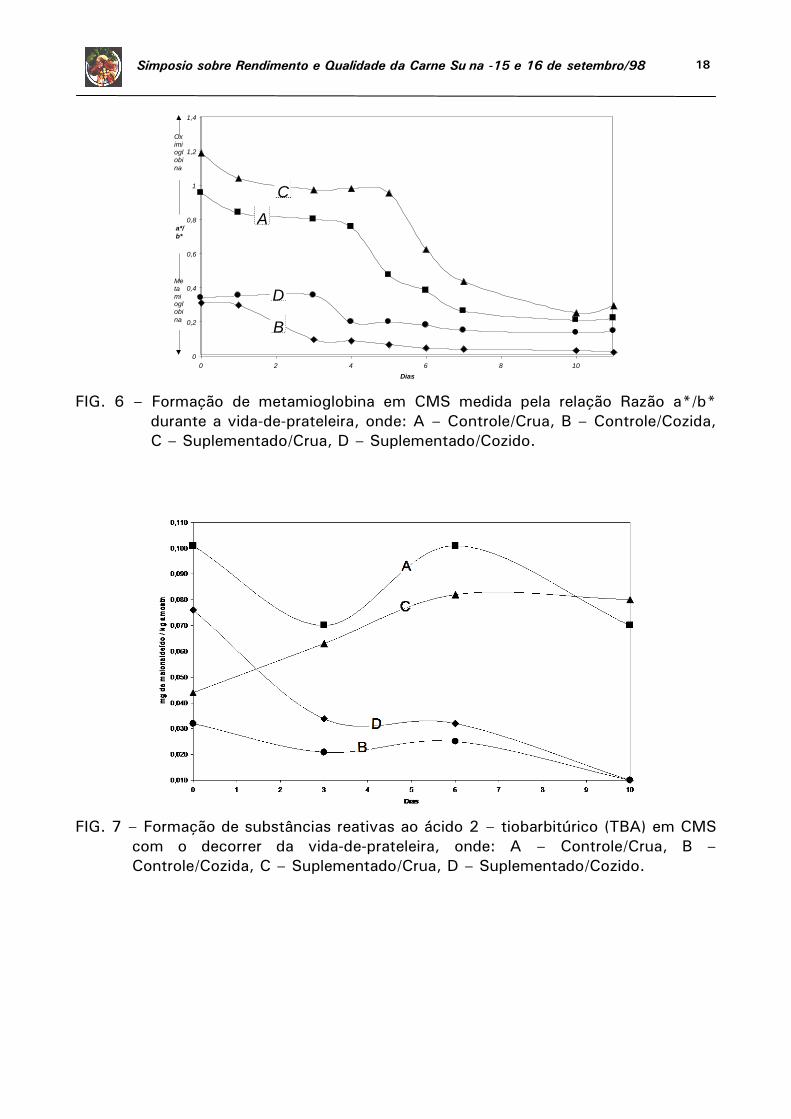
A origem destas pontes cruzadas esta na intermediação da atividade das enzimas
lisiloxidase que atuam nos resíduos específicos da lisina formado aldeídos deste
aminoácido para posterior formação das di-hidroxilisinooxilisinonorleucina (Fig. 5) (5).
Estas apresentam natureza biológica intermediária e que durante o avanço em idade
formam as pontes cruzadas maduras denominas piridinolinas que tornam a molécula
mais estáveis emprestando uma maior textura à carne (6). O fenômeno poderá
também na qualidade das emulsões.
Resíduosde Lisina
Aldeídosde Lisina
LisilOxidase
ExpontaneamenteDihidroxilisinonorleucinas
Ligações
Cruzadas
Intermediárias
Piridinolinas
Ligações
Cruzadas
Maduras
Envelhecimento
FIG. 5 - Biossíntese das ligações cruzadas de colágeno intermediadas pela lisil-
oxidase (Ref. 5).
PPSSEE ee pprroopprriieeddaaddeess ffuunncciioonnaaiiss ddaa ccaarrnnee
A síndrome PSE tem sido intensamente abordado em carnes suínas.
Recentemente, o assunto tem sido novamente focalizado e desta vez em aves (7,8).
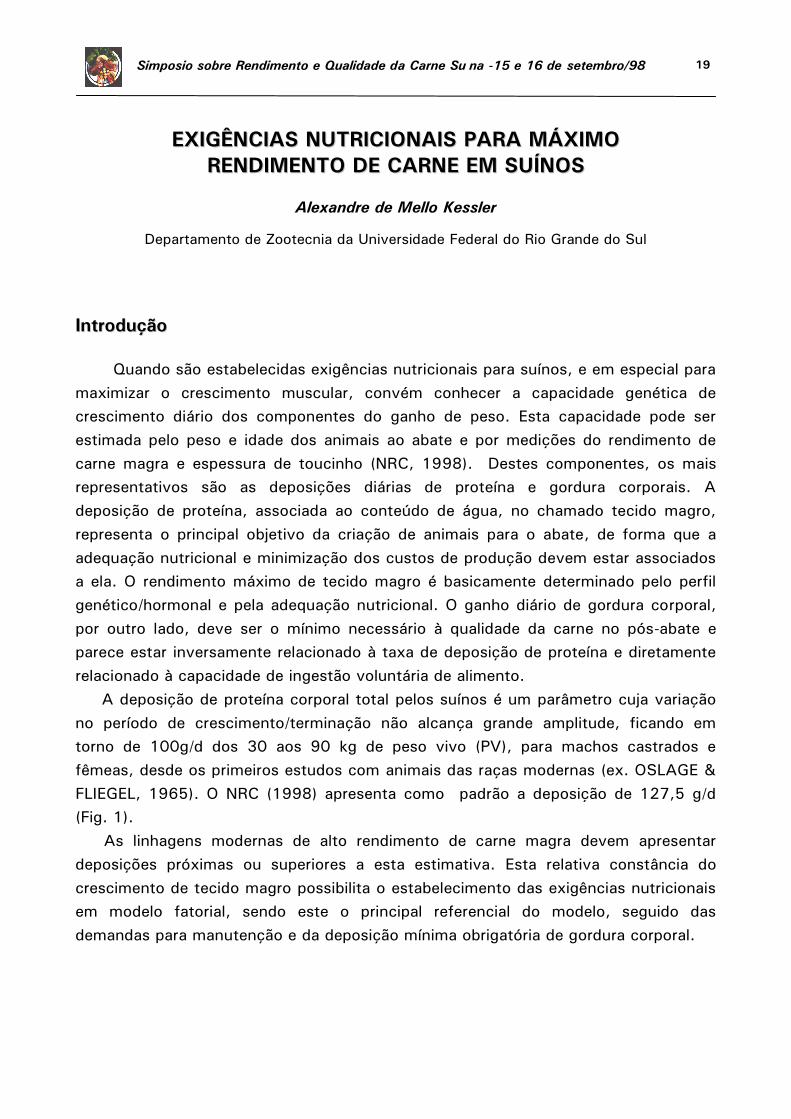
Reportamos, embora preliminarmente, a utilização da suplementação de vitamina E na
dieta para minimizar a sua ocorrência e melhorar a funcionalidade em produtos
simulados derivados de carnes de frango (9). O pH atingiu seu valor final em um
período de 15 min. em carnes PSE e o controle necessitou de 40-45 min. Ao mesmo
tempo foi observada que a perda de gotejamento foi em torno de 28% em peito de
frango com PSE quando comparado com amostras suplementadas enquanto que a sua
coloração foi protegida nas mesmas durante um certo período em refrigeração (Fig.
6). Finalmente, a Fig. 7 mostra a proteção que a vitamina E suplementada oferece
também na prevenção da oxidação lipídica após um período de 6 dias de
armazenamento tanto na carne crua como na cozida, medida pelo TBARS (9).
18 Simpósio sobre Rendimento e Qualidade da Carne Suína -15 e 16 de setembro/98
0
0,2
0,4
0,6
0,8
1
1,2
1,4
0 2 4 6 8 10
Dias
a*/
b*
A
B
C
D
Oximioglobi
na
Metamioglobi
na
FIG. 6 – Formação de metamioglobina em CMS medida pela relação Razão a*/b*
durante a vida-de-prateleira, onde: A – Controle/Crua, B – Controle/Cozida,
C – Suplementado/Crua, D – Suplementado/Cozido.
FIG. 7 – Formação de substâncias reativas ao ácido 2 – tiobarbitúrico (TBA) em CMS
com o decorrer da vida-de-prateleira, onde: A – Controle/Crua, B –
Controle/Cozida, C – Suplementado/Crua, D – Suplementado/Cozido.
19 Simpósio sobre Rendimento e Qualidade da Carne Suína -15 e 16 de setembro/98
EEXXIIGGÊÊNNCCIIAASS NNUUTTRRIICCIIOONNAAIISS PPAARRAA MMÁÁXXIIMMOO
RREENNDDIIMMEENNTTOO DDEE CCAARRNNEE EEMM SSUUÍÍNNOOSS
Alexandre de Mello Kessler
Departamento de Zootecnia da Universidade Federal do Rio Grande do Sul
IInnttrroodduuççããoo
Quando são estabelecidas exigências nutricionais para suínos, e em especial para
maximizar o crescimento muscular, convém conhecer a capacidade genética de
crescimento diário dos componentes do ganho de peso. Esta capacidade pode ser
estimada pelo peso e idade dos animais ao abate e por medições do rendimento de
carne magra e espessura de toucinho (NRC, 1998). Destes componentes, os mais
representativos são as deposições diárias de proteína e gordura corporais. A
deposição de proteína, associada ao conteúdo de água, no chamado tecido magro,
representa o principal objetivo da criação de animais para o abate, de forma que a
adequação nutricional e minimização dos custos de produção devem estar associados
a ela. O rendimento máximo de tecido magro é basicamente determinado pelo perfil
genético/hormonal e pela adequação nutricional. O ganho diário de gordura corporal,
por outro lado, deve ser o mínimo necessário à qualidade da carne no pós-abate e
parece estar inversamente relacionado à taxa de deposição de proteína e diretamente
relacionado à capacidade de ingestão voluntária de alimento.
A deposição de proteína corporal total pelos suínos é um parâmetro cuja variação
no período de crescimento/terminação não alcança grande amplitude, ficando em
torno de 100g/d dos 30 aos 90 kg de peso vivo (PV), para machos castrados e
fêmeas, desde os primeiros estudos com animais das raças modernas (ex. OSLAGE &
FLIEGEL, 1965). O NRC (1998) apresenta como padrão a deposição de 127,5 g/d
(Fig. 1).
As linhagens modernas de alto rendimento de carne magra devem apresentar
deposições próximas ou superiores a esta estimativa. Esta relativa constância do
crescimento de tecido magro possibilita o estabelecimento das exigências nutricionais
em modelo fatorial, sendo este o principal referencial do modelo, seguido das
demandas para manutenção e da deposição mínima obrigatória de gordura corporal.

20 Simpósio sobre Rendimento e Qualidade da Carne Suína -15 e 16 de setembro/98
80
90
100
110
120
130
140
10 20 30 40 50 60 70 80 90 100 110 120
Peso vivo (kg)
De
po
siç
ão
co
rpo
ral to
tal d
e p
rote
ína
(g
/d)
FIG. 1. Deposição diária corporal total potencial de suínos conforme a faixa de peso,
pela equação Y = (0,47666 + 0,02147*PV - 0,00023758*PV2 +
0,000000713*PV3) * 127,5; para animais com ganho médio de carne magra
de 325 g/d, ou 127,5 g/d de proteína total (NRC, 1998).
OO PPooddeerr ddaa LLiissiinnaa
A lisina dietética é a longo tempo considerada como o nutriente que mais
influencia a deposição de proteína pelos suínos em crescimento, sendo portanto
tomada como base das exigências nutricionais para os demais aminoácidos e proteína
dietética total (KESSLER, 1992; FULLER, 1996; BIKKER & BOSCH, 1996). Isto se
deve à sua constância na proteína corporal, à relativa limitação nos alimentos práticos
e uma destinação metabólica preferencial para a deposição de tecido magro. Além
disto, como a deposição de proteína, no suíno em crescimento, representa a maior
parte da demanda por este aminoácido, as estimativas das exigências diárias devem
recair sobre este parâmetro, que por sua vez é a base das exigências dos demais
aminoácidos, conforme as relações dentro da proteína ideal, já sedimentadas em
inúmeros estudos. Na tabela 1 podem ser observadas estas relações dentro das
exigências líquidas para manutenção e crescimento e na composição das dietas. As
exigências diária de lisina devem ser estabelecidas com base no ganho diário de
proteína ou tecido magro, pois existe uma dissociação importante entre o consumo de
lisina e energia e seus efeitos sobre as deposições de proteína e gordura (KESSLER,
1992; KESSLER et al., 1995), e as exigências para manutenção são pequenas.
Estimativas obtidas a partir dados de experimentos empíricos indicam, por sua vez,
uma relação de lisina dietética total consumida para proteína corporal retida de 0,15-
0,17: 1,0 (g/g)(ARC, 1981; KESSLER, 1992). Estimativas fatoriais estão entre 0,10 e
0,12:1,0 (g de lisina digestível para cada g de proteína corporal retida).
21 Simpósio sobre Rendimento e Qualidade da Carne Suína -15 e 16 de setembro/98
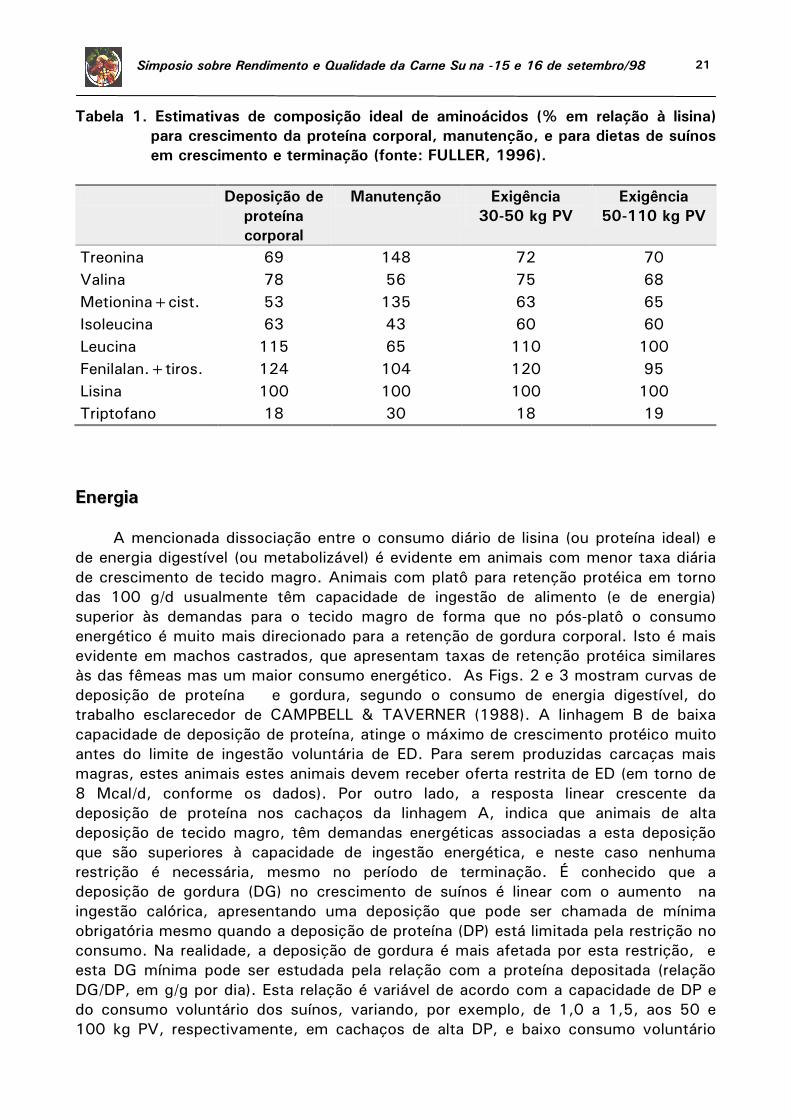
Tabela 1. Estimativas de composição ideal de aminoácidos (% em relação à lisina)
para crescimento da proteína corporal, manutenção, e para dietas de suínos
em crescimento e terminação (fonte: FULLER, 1996).
Deposição de
proteína
corporal
Manutenção Exigência
30-50 kg PV
Exigência
50-110 kg PV
Treonina 69 148 72 70
Valina 78 56 75 68
Metionina+cist. 53 135 63 65
Isoleucina 63 43 60 60
Leucina 115 65 110 100
Fenilalan.+tiros. 124 104 120 95
Lisina 100 100 100 100
Triptofano 18 30 18 19
EEnneerrggiiaa
A mencionada dissociação entre o consumo diário de lisina (ou proteína ideal) e
de energia digestível (ou metabolizável) é evidente em animais com menor taxa diária
de crescimento de tecido magro. Animais com platô para retenção protéica em torno
das 100 g/d usualmente têm capacidade de ingestão de alimento (e de energia)
superior às demandas para o tecido magro de forma que no pós-platô o consumo
energético é muito mais direcionado para a retenção de gordura corporal. Isto é mais
evidente em machos castrados, que apresentam taxas de retenção protéica similares
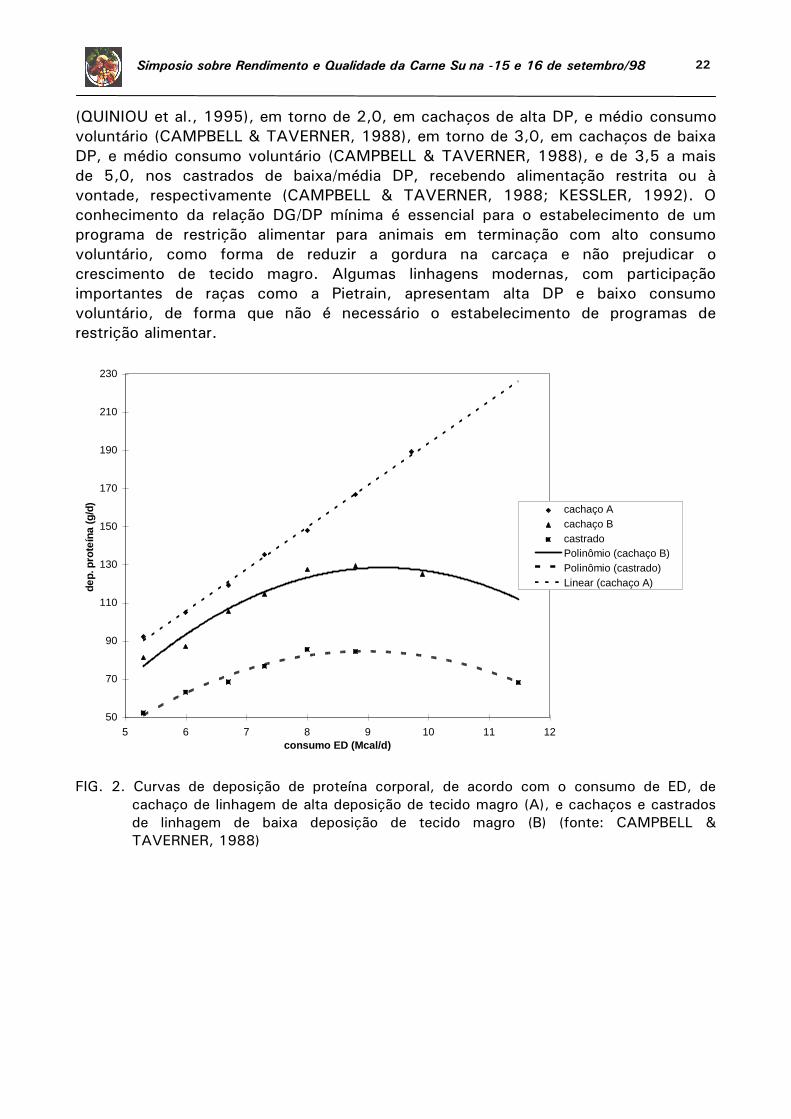
às das fêmeas mas um maior consumo energético. As Figs. 2 e 3 mostram curvas de
deposição de proteína e gordura, segundo o consumo de energia digestível, do
trabalho esclarecedor de CAMPBELL & TAVERNER (1988). A linhagem B de baixa
capacidade de deposição de proteína, atinge o máximo de crescimento protéico muito
antes do limite de ingestão voluntária de ED. Para serem produzidas carcaças mais
magras, estes animais estes animais devem receber oferta restrita de ED (em torno de
8 Mcal/d, conforme os dados). Por outro lado, a resposta linear crescente da
deposição de proteína nos cachaços da linhagem A, indica que animais de alta
deposição de tecido magro, têm demandas energéticas associadas a esta deposição
que são superiores à capacidade de ingestão energética, e neste caso nenhuma
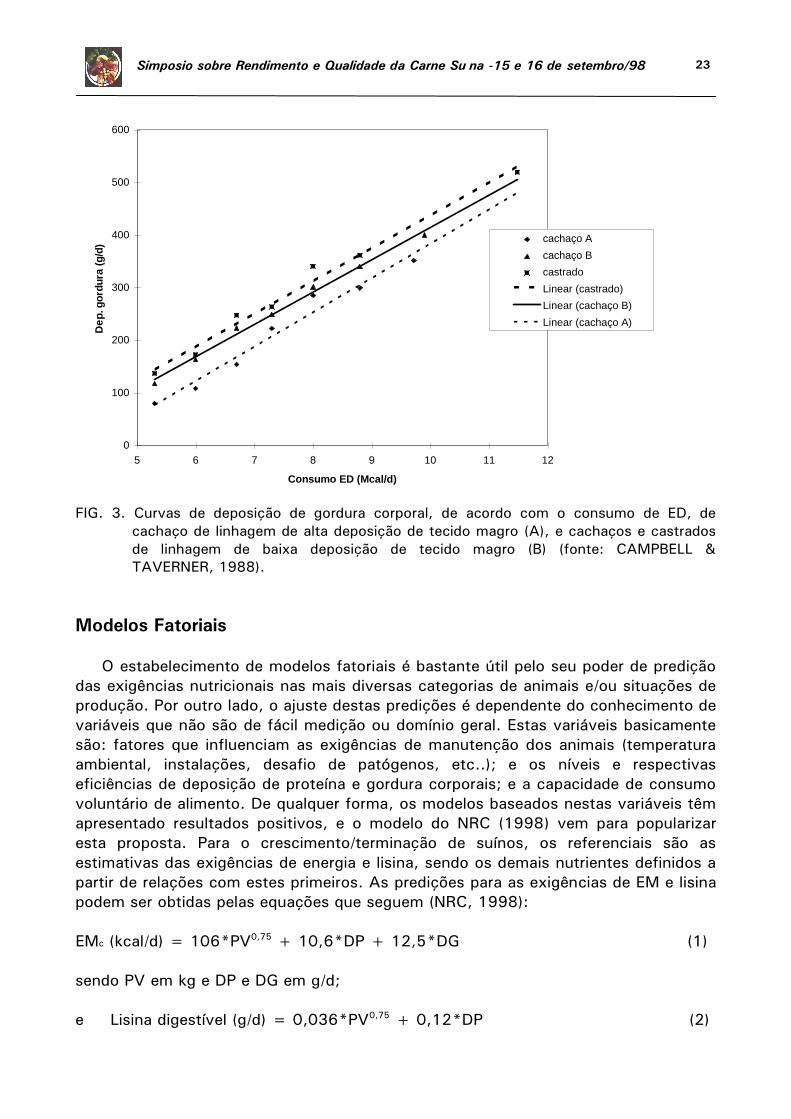
restrição é necessária, mesmo no período de terminação. É conhecido que a
deposição de gordura (DG) no crescimento de suínos é linear com o aumento na
ingestão calórica, apresentando uma deposição que pode ser chamada de mínima
obrigatória mesmo quando a deposição de proteína (DP) está limitada pela restrição no
consumo. Na realidade, a deposição de gordura é mais afetada por esta restrição, e
esta DG mínima pode ser estudada pela relação com a proteína depositada (relação
DG/DP, em g/g por dia). Esta relação é variável de acordo com a capacidade de DP e
do consumo voluntário dos suínos, variando, por exemplo, de 1,0 a 1,5, aos 50 e
100 kg PV, respectivamente, em cachaços de alta DP, e baixo consumo voluntário
22 Simpósio sobre Rendimento e Qualidade da Carne Suína -15 e 16 de setembro/98
(QUINIOU et al., 1995), em torno de 2,0, em cachaços de alta DP, e médio consumo
voluntário (CAMPBELL & TAVERNER, 1988), em torno de 3,0, em cachaços de baixa
DP, e médio consumo voluntário (CAMPBELL & TAVERNER, 1988), e de 3,5 a mais
de 5,0, nos castrados de baixa/média DP, recebendo alimentação restrita ou à
vontade, respectivamente (CAMPBELL & TAVERNER, 1988; KESSLER, 1992). O
conhecimento da relação DG/DP mínima é essencial para o estabelecimento de um
programa de restrição alimentar para animais em terminação com alto consumo
voluntário, como forma de reduzir a gordura na carcaça e não prejudicar o
crescimento de tecido magro. Algumas linhagens modernas, com participação
importantes de raças como a Pietrain, apresentam alta DP e baixo consumo
voluntário, de forma que não é necessário o estabelecimento de programas de
restrição alimentar.
50
70
90
110
130
150
170
190
210
230
5 6 7 8 9 10 11 12
consumo ED (Mcal/d)
de
p. p
rote
ína
(g
/d)
cachaço A
cachaço B
castrado
Polinômio (cachaço B)
Polinômio (castrado)
Linear (cachaço A)
FIG. 2. Curvas de deposição de proteína corporal, de acordo com o consumo de ED, de
cachaço de linhagem de alta deposição de tecido magro (A), e cachaços e castrados
de linhagem de baixa deposição de tecido magro (B) (fonte: CAMPBELL &
TAVERNER, 1988)
23 Simpósio sobre Rendimento e Qualidade da Carne Suína -15 e 16 de setembro/98
0
100
200
300
400
500
600
5 6 7 8 9 10 11 12
Consumo ED (Mcal/d)
De
p. g
ord
ura
(g
/d)
cachaço A
cachaço B
castrado
Linear (castrado)
Linear (cachaço B)
Linear (cachaço A)
FIG. 3. Curvas de deposição de gordura corporal, de acordo com o consumo de ED, de
cachaço de linhagem de alta deposição de tecido magro (A), e cachaços e castrados
de linhagem de baixa deposição de tecido magro (B) (fonte: CAMPBELL &
TAVERNER, 1988).
Modelos Fatoriais
O estabelecimento de modelos fatoriais é bastante útil pelo seu poder de predição
das exigências nutricionais nas mais diversas categorias de animais e/ou situações de
produção. Por outro lado, o ajuste destas predições é dependente do conhecimento de
variáveis que não são de fácil medição ou domínio geral. Estas variáveis basicamente
são: fatores que influenciam as exigências de manutenção dos animais (temperatura
ambiental, instalações, desafio de patógenos, etc..); e os níveis e respectivas
eficiências de deposição de proteína e gordura corporais; e a capacidade de consumo
voluntário de alimento. De qualquer forma, os modelos baseados nestas variáveis têm
apresentado resultados positivos, e o modelo do NRC (1998) vem para popularizar
esta proposta. Para o crescimento/terminação de suínos, os referenciais são as
estimativas das exigências de energia e lisina, sendo os demais nutrientes definidos a
partir de relações com estes primeiros. As predições para as exigências de EM e lisina
podem ser obtidas pelas equações que seguem (NRC, 1998):
EMc (kcal/d) = 106*PV0,75 + 10,6*DP + 12,5*DG (1)
sendo PV em kg e DP e DG em g/d;
e Lisina digestível (g/d) = 0,036*PV0,75 + 0,12*DP (2)
24 Simpósio sobre Rendimento e Qualidade da Carne Suína -15 e 16 de setembro/98
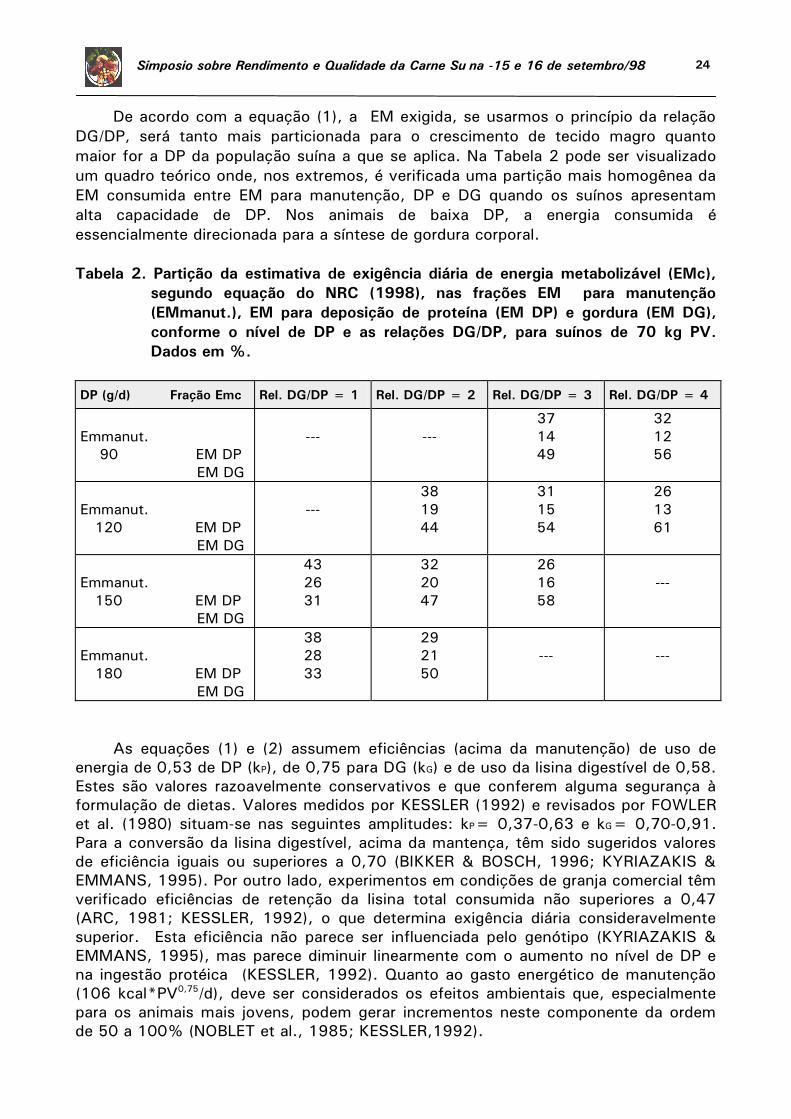
De acordo com a equação (1), a EM exigida, se usarmos o princípio da relação
DG/DP, será tanto mais particionada para o crescimento de tecido magro quanto
maior for a DP da população suína a que se aplica. Na Tabela 2 pode ser visualizado
um quadro teórico onde, nos extremos, é verificada uma partição mais homogênea da
EM consumida entre EM para manutenção, DP e DG quando os suínos apresentam
alta capacidade de DP. Nos animais de baixa DP, a energia consumida é
essencialmente direcionada para a síntese de gordura corporal.
Tabela 2. Partição da estimativa de exigência diária de energia metabolizável (EMc),
segundo equação do NRC (1998), nas frações EM para manutenção
(EMmanut.), EM para deposição de proteína (EM DP) e gordura (EM DG),
conforme o nível de DP e as relações DG/DP, para suínos de 70 kg PV.
Dados em %.
DP (g/d) Fração Emc Rel. DG/DP = 1 Rel. DG/DP = 2 Rel. DG/DP = 3 Rel. DG/DP = 4
Emmanut.
90 EM DP
EM DG
---
---
37
14
49
32
12
56
Emmanut.
120 EM DP
EM DG
---
38
19
44
31
15
54
26
13
61
Emmanut.
150 EM DP
EM DG
43
26
31
32
20
47
26
16
58
---
Emmanut.
180 EM DP
EM DG
38
28
33
29
21
50
---
---
As equações (1) e (2) assumem eficiências (acima da manutenção) de uso de
energia de 0,53 de DP (kP), de 0,75 para DG (kG) e de uso da lisina digestível de 0,58.
Estes são valores razoavelmente conservativos e que conferem alguma segurança à
formulação de dietas. Valores medidos por KESSLER (1992) e revisados por FOWLER
et al. (1980) situam-se nas seguintes amplitudes: kP= 0,37-0,63 e kG= 0,70-0,91.
Para a conversão da lisina digestível, acima da mantença, têm sido sugeridos valores
de eficiência iguais ou superiores a 0,70 (BIKKER & BOSCH, 1996; KYRIAZAKIS &
EMMANS, 1995). Por outro lado, experimentos em condições de granja comercial têm
verificado eficiências de retenção da lisina total consumida não superiores a 0,47
(ARC, 1981; KESSLER, 1992), o que determina exigência diária consideravelmente
superior. Esta eficiência não parece ser influenciada pelo genótipo (KYRIAZAKIS &
EMMANS, 1995), mas parece diminuir linearmente com o aumento no nível de DP e
na ingestão protéica (KESSLER, 1992). Quanto ao gasto energético de manutenção
(106 kcal*PV0,75/d), deve ser considerados os efeitos ambientais que, especialmente
para os animais mais jovens, podem gerar incrementos neste componente da ordem
de 50 a 100% (NOBLET et al., 1985; KESSLER,1992).
25 Simpósio sobre Rendimento e Qualidade da Carne Suína -15 e 16 de setembro/98
NNoovvaass PPeerrssppeeccttiivvaass ee CCoonncclluussõõeess
O futuro da nutrição de suínos está obviamente ligado ao progresso no
melhoramento genético destes animais. Se mantida a direção de produção de animais
com alta taxa de crescimento de tecido magro, o ajuste nutricional será, como
mencionado, realizado a partir da correta estimativa das deposições diárias de
proteína e gordura corporais. Por outro lado, os efeitos dos níveis de proteína total
consumida e seus efeitos sobre a gordura da carcaça e a partição da do crescimento
proteico na carcaça e vísceras precisa ser melhor estudado. As linhagens modernas
apresentam maior proporção corporal como músculos e com aumento considerável de
fibras glicolíticas. Isto pode levar a uma revisão das fontes de energia da dieta bem
como dos níveis de nutrientes associados ao metabolismo energético deste novo
padrão de composição corporal.
RReeffeerrêênncciiaass BBiibblliiooggrrááffiiccaass
1. AGRICULTURAL RESEARCH COUNCIL (ARC). 1981. The nutrient requirements of
pigs. Farnham Royal, Commonwealth Agricultural Bureau. p. 67-124.
2. BIKKER, P. & BOSCH, M. 1996. Nutrient requirements of pigs with high genetic
potential for lean gain. In: Rostagno, H. S. (Ed.) Simpósio Internacional sobre
exigências nutricionais de aves e suínos. 1996. Viçosa, MG. 223-239.
3. CAMPBELL, R. G. & TAVERNER, M. R. 1988. Genotype and sex effects on the
relationship between energy intake and protein deposition in growing pigs. J.
Anim. Sci. 66: 676-686.
4. FOWLER, V. R.; FULLER, M. F.; CLOSE, W. H.; WHITTEMORE, C. T. 1980. Energy
requirements for the growing pig. In: Mount, L. E. (Ed.). Energy Metabolism.
London, Butterworths. 151-156.
5. FULLER, M. F. 1996. Macronutrient requiremens of growing swine. In: Rostagno,
H. S. (Ed.) Simpósio Internacional sobre exigências nutricionais de aves e
suínos. 1996. Viçosa, MG. 205-221.
6. KESSLER, A. M. 1992. Efeito da proteína e lisina da dieta no metabolismo do
nitrogênio de suínos em crescimento. Tese de Doutorado. Porto Alegre,
UFRGS, 188p.
7. KESSLER, A. M.; PENZ JR., A. M.; ROSO, V. M. 1995. Uso da técnica de
componentes principais em características de consumo de nutrientes,
composição do ganho de peso e eficiência alimentar de suínos em
crescimento. In: Anais da XXXII Reunião da SBZ. Brasília, 565-567.
8. KYRIAZAKIS, I. & EMMANS, G. C. 1995. Do breeds os pig differ in the efficiency
with which they use a limiting protein supply? Br. J. Nutr. 74: 183-195.
9. NATIONAL RESEARCH COUNCIL (NRC). 1998. Nutrient requirements of swine.
10th Ed. Washington, NRC. 189 p.
10. NOBLET, J.; LEDIVIDICH, J.; BIKAWA, T. 1985. Interaction between energy level
in the diet and environmental temperature on the utilizaion of energy in
growing pigs. J. Anim. Sci. 61: 452-459.
11. OSLAGE, H. J. & FLIEGEL, H. 1965. Nitrogen and energy metabolism of growing-
fattening pigs with an approximately maximal feed intake. In: Blaxter, K. L.
(Ed.) Energy Metabolism. Academic Press, London, 297-306.
12. QUINIOU, N.; NOBLET, J.; VAN MILGEN, J.; DOURMAD, J. 1995. Effect of
energy intake on performance, nutrient and tissue gain and protein and energy
utilization in growing boars. Animal Science 61: 133-143.
26 Simpósio sobre Rendimento e Qualidade da Carne Suína -15 e 16 de setembro/98
GGEENNEETTIICC AANNDD NNUUTTRRIITTIIOONNAALL IINNFFLLUUEENNCCEESS
OONN PPOORRKK QQUUAALLIITTYY
M. Ellis
Department of Animal Sciences, University of Illinois
Urbana Il 61801, USA
IInnttrroodduuccttiioonn
Discussion of the issue of pork quality is complicated by two factors. Firstly,
there are many different components to quality, a number of which are not clearly
defined and are difficult to measure objectively. In addition, genetics and nutrition are
only two of a multitude of factors, many of which are outside of the producer's
control, that impact the ultimate quality of pork and in many situations their effects
relative to other factors will be small. Nevertheless, both genetics and nutrition can
have a significant influence on pork quality, both positive and negative, and an
understanding of these impacts is the first step to developing production programs to
optimize quality.
There have been a number of attempts to define quality, with perhaps the most
extensive being that of Hoffmann (1994) who suggested that meat quality could be
considered in terms of sensory properties, technological factors, nutritive value and
hygienic and toxicological or food safety aspects. This review will focus on water
holding capacity, a major factor that affects processing and saleable product yields,
and pork color and palatability, factors that have a major bearing on the consumer
acceptability of pork. In addition, nutritional influences on fat quality will be
considered.
11.. GGeenneettiicc IInnfflluueenncceess oonn QQuuaalliittyy
11..11 VVaarriiaattiioonn AAmmoonngg BBrreeeeddss aanndd GGeenneettiicc LLiinneess
One of the most rapid and easiest methods to improve any trait is to import a
breed or genetic line with superior characteristics and, consequently, there has been
great interest in variation between breeds for quality aspects. A breed that has
received considerable attention in this respect is the Duroc. This breed has a number
of positive production attributes, including high feed intake, fast growth and
hardiness, and it has been used extensively as a part of commercial sire and dam
lines. In addition, the Duroc has high intramuscular fat (IMF) relative to other breeds
and there is evidence of a positive association between IMF and eating quality.
Recent studies in North America and Europe have confirmed the advantages of
the Duroc relative to other breeds and lines. The National Pork Producers Council has
carried out two comparisons, one involving purebreds (NPPC, 1994) and the other
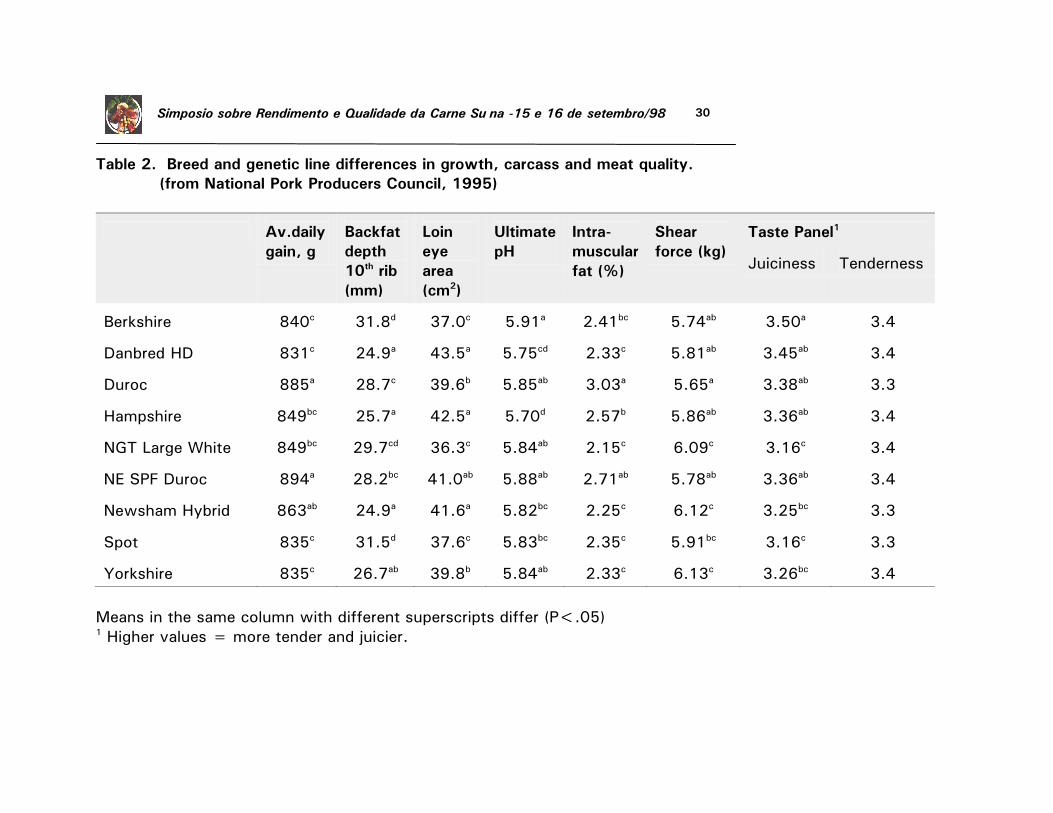
terminal sire lines (NPPC, 1995) and these studies are summarized in Tables l and 2,
27 Simpósio sobre Rendimento e Qualidade da Carne Suína -15 e 16 de setembro/98
respectively. These results illustrate the higher growth rates and intramuscular fat
levels for the Duroc. Differences among breeds and lines for eating quality and shear
force were, however, modest and did not always favor the Duroc (Tables l and 2). A
threshold model has been proposed for the association between IMF and eating
quality (Bejerholm and Barton-Gade, 1986; DeVol et al., 1988) with the proposed
minimum IMF level for optimum eating quality being between 2 to 3%. A possible
explanation for the relatively small differences in eating quality between the Duroc
and other breeds in the NPPC studies is that all of the breeds and lines investigated
had IMF levels close to or above the proposed threshold (Tables l and 2).
A study carried out in the United Kingdom (MLC, 1991) compared slaughter pigs
with increasing proportions of Duroc and showed an increase in growth rate, backfat
thickness and IMF and an improvement in eating quality with increasing Duroc
inclusion (Table 3). However, the incidence of the Pale, Soft, Exudative (PSE) pig
meat condition also decreased with increasing Duroc inclusion and a number of
authors have shown a negative relationship between PSE and palatability traits (e.g.
Topel et al., 1976) which suggests that any eating quality advantage for the Duroc
may be due, in part, to the lower incidence of PSE associated with this breed.
The genetic line comparisons carried out by the NPPC (Tables l and 2) focused
attention on the Berkshire, with this breed producing the best eating quality and
lowest shear force of all those evaluated. The Berkshire is being used in programs to
produce a “high quality” product for specific markets, including for export to Japan.
However, the growth performance and, particularly, the carcass lean contents of the
Berkshire are relatively poor (Tables 1 and 2) and, therefore, the costs of producing
Berkshires will be relatively high. This illustrates the dilemma faced by the swine
industry in terms of trade-offs between growth and carcass characteristics and, thus,
the costs of production, and quality attributes.
11..22.. SSiinnggllee GGeenneess AAssssoocciiaatteedd wwiitthh QQuuaalliittyy
Although there are likely to be a large number of individual genes that impact
pork quality, at the present time only two genes with major effects on quality traits
have been identified; these are the Halothane and Rendement Napole (RN) genes.
Interestingly both these genes exert their influence through effects on post-mortem
glycolysis and, consequently, either the rate or the extent of the decline in pH after
slaughter. The Halothane gene can produce a very rapid decline in muscle pH
immediately post mortem when muscle temperatures are still high and this
combination results in the PSE condition. The RN gene produces a normal rate of but
a more extensive pH decline, producing a low ultimate pH in the muscle i.e. the acid-
meat condition.

28 Simpósio sobre Rendimento e Qualidade da Carne Suína -15 e 16 de setembro/98

29 Simpósio sobre Rendimento e Qualidade da Carne Suína -15 e 16 de setembro/98
Table 1. Breed differences in growth, carcass and meat quality (from National Pork Producers Council, 1994).
Av.daily
gain, g
Backfat
depth
10th rib
(mm)
Loin
eye
area
(cm2)
Ultimate
pH
Intra-
muscular
fat (%)
Shear
force
(kg)
Taste Panel1
Juiciness
Tenderness
Berkshire
754
29.5
32.8
5.90
3.24
5.79
3.1
3.5
Chester White
735
30.5
34.5
5.86
3.13
5.92
3.3
3.4
Duroc
804
27.2
34.2
5.73
4.29
5.90
3.3
3.4
Hampshire
735
23.4
39.7
5.57
2.63
6.19
3.3
3.3
Landrace
754
26.2
36.7
5.67
2.49
6.38
3.1
3.1
Poland China
758
28.7
34.7
5.74
3.22
6.54
3.1
3.0
Spot
740
28.7
34.9
5.72
3.09
6.51
3.0
3.0
Yorkshire
745
26.7
35.4
5.72
2.48
6.39
3.0
3.1
1 higher values = more tender and juicier.
30 Simpósio sobre Rendimento e Qualidade da Carne Suína -15 e 16 de setembro/98
Table 2. Breed and genetic line differences in growth, carcass and meat quality.
(from National Pork Producers Council, 1995)
Av.daily
gain, g
Backfat
depth
10th rib
(mm)
Loin
eye
area
(cm2)
Ultimate
pH
Intra-
muscular
fat (%)
Shear
force (kg)
Taste Panel1 Juiciness
Tenderness
Berkshire
840c
31.8d
37.0c
5.91a
2.41bc
5.74ab
3.50a
3.4
Danbred HD
831c
24.9a
43.5a
5.75cd
2.33c
5.81ab
3.45ab
3.4
Duroc
885a
28.7c
39.6b
5.85ab
3.03a
5.65a
3.38ab
3.3
Hampshire
849bc
25.7a
42.5a
5.70d
2.57b
5.86ab
3.36ab
3.4
NGT Large White
849bc
29.7cd
36.3c
5.84ab
2.15c
6.09c
3.16c
3.4
NE SPF Duroc
894a
28.2bc
41.0ab
5.88ab
2.71ab
5.78ab
3.36ab
3.4
Newsham Hybrid
863ab
24.9a
41.6a
5.82bc
2.25c
6.12c
3.25bc
3.3
Spot
835c
31.5d
37.6c
5.83bc
2.35c
5.91bc
3.16c
3.3
Yorkshire
835c
26.7ab
39.8b
5.84ab
2.33c
6.13c
3.26bc
3.4
Means in the same column with different superscripts differ (P<.05) 1 Higher values = more tender and juicier.

31 Simpósio sobre Rendimento e Qualidade da Carne Suína -15 e 16 de setembro/98
Table 3. Influence of proportion of Duroc genes on carcass and eating quality.
(from Meat and Livestock Commission, 1991)
Approx.
LSDa Percentage Duroc
0
25
50
75
P2 backfat depth (mm)
10.2
11.2
11.7
12.8
.59
Intramuscular fat, (%)
.70
.86
1.08
1.27
.10
Carcasses judged PSE (%)
8.3
5.4
1.6
0.1
4.20
Taste panelb: Tenderness
4.96
5.03
5.32
5.38
.25
Juiciness
4.09
4.11
4.18
4.38
.17
Pork flavor
3.88
3.99
3.96
3.98
.12
a Least significant difference between means, P<.05 b Evaluated using an 8-point scale; lower values = poorer quality.
1.2.1. The Halothane Gene
This is so-called because animals homozygous for the recessive form of the gene
show a distinctive response when exposed to the anaesthetic gas halothane which is
characterized by muscle rigidity and hyperthermia. The halothane gene is of interest
because it influences all aspects of the production and marketing chain with both
beneficial and deleterious effects. The gene is being exploited in commercial
programs with, most commonly, heterozygous carrier animals being produced as the
slaughter generation.
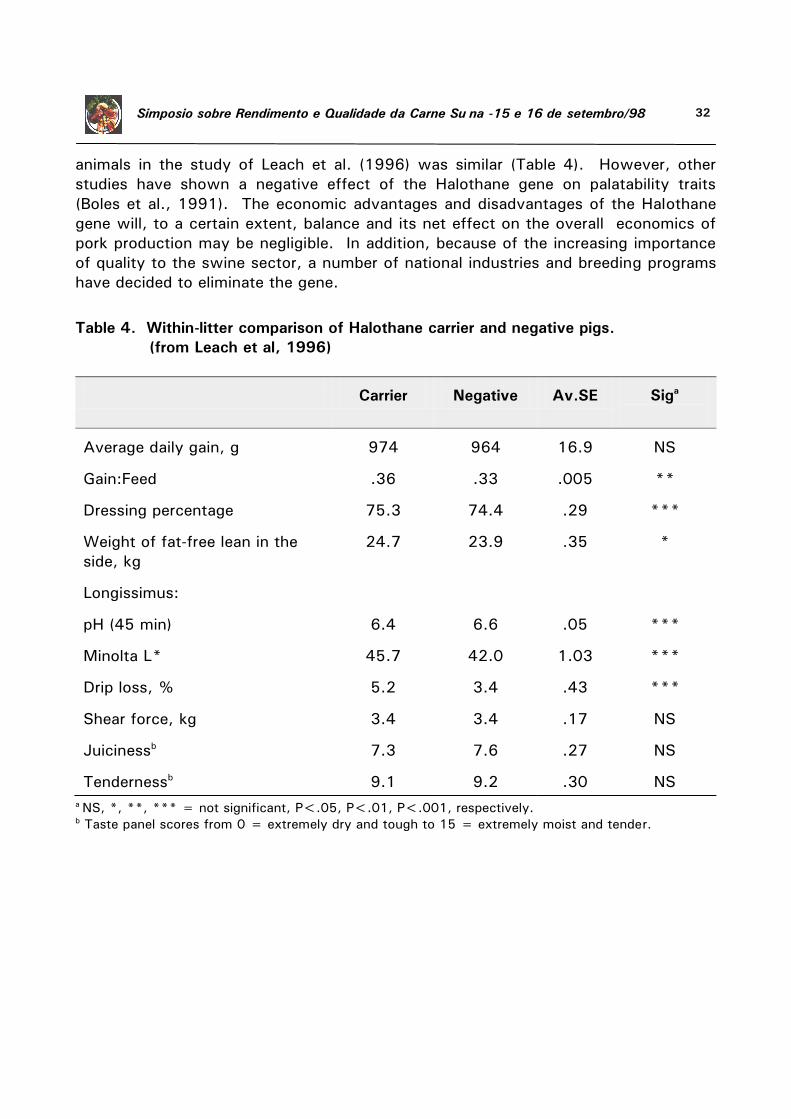
The benefits and disadvantages of producing Halothane carrier progeny can be
illustrated by the results of a recent study carried out at the University of Illinois
(Leach et al., 1996). In this trial, a Halothane carrier sire line was mated to a
negative female line resulting in both Halothane carrier and negative progeny being
produced within the same litter. This allows the effects of the gene to be evaluated
against the same genetic background. Halothane carriers had a number of
advantages over negative animals, including better feed efficiency, improved carcass
yield, and increased carcass lean content (Table 4). However, carriers had poorer
muscle color and water holding capacity (Table 4) which would offset any growth and
carcass advantage. Interestingly, the eating quality of the carrier and negative
32 Simpósio sobre Rendimento e Qualidade da Carne Suína -15 e 16 de setembro/98
animals in the study of Leach et al. (1996) was similar (Table 4). However, other
studies have shown a negative effect of the Halothane gene on palatability traits
(Boles et al., 1991). The economic advantages and disadvantages of the Halothane
gene will, to a certain extent, balance and its net effect on the overall economics of
pork production may be negligible. In addition, because of the increasing importance
of quality to the swine sector, a number of national industries and breeding programs
have decided to eliminate the gene.
Table 4. Within-litter comparison of Halothane carrier and negative pigs.
(from Leach et al, 1996)
Carrier
Negative
Av.SE
Siga
Average daily gain, g
974
964
16.9
NS
Gain:Feed
.36
.33
.005
**
Dressing percentage
75.3
74.4
.29
***
Weight of fat-free lean in the
side, kg
24.7
23.9
.35
*
Longissimus: pH (45 min)
6.4
6.6
.05
***
Minolta L*
45.7
42.0
1.03
***
Drip loss, %
5.2
3.4
.43
***
Shear force, kg
3.4
3.4
.17
NS
Juicinessb
7.3
7.6
.27
NS
Tendernessb
9.1
9.2
.30
NS
a NS, *, **, *** = not significant, P<.05, P<.01, P<.001, respectively. b Taste panel scores from 0 = extremely dry and tough to 15 = extremely moist and tender.
33 Simpósio sobre Rendimento e Qualidade da Carne Suína -15 e 16 de setembro/98
11..22..22.. TThhee RReennddeemmeenntt NNaappoollee GGeennee
Another single gene that has been shown to affect meat quality is the
Rendement Napole (RN) gene, which is also referred to as the Napole or Acid Meat
gene or the Hampshire effect, because its effects have only been observed in
purebred and crossbred Hampshire pigs, or commercial lines with Hampshire ancestry.
Historically, breed comparison involving the Hampshire have generally shown low
ultimate pH values for this breed in comparison with others (Sayre et al., 1963).
More recently, a comparison of terminal sire breeds and lines carried out by NPPC
also showed this phenomenon in US Hampshire populations (Table 2; NPPC, 1995).
Monin and Sellier (1985), working with Hampshire populations in France, were the
first to show that the low ultimate pH or acid meat was the result of elevated
glycogen and glycolytic potential levels in the muscle. Glycolytic potential (GP) is an
index of the potential of the muscle for glycolysis and it is calculated from the
concentrations of glycogen, glucose-6-phosphate, glucose, and lactate within the
muscle.
The GP of Hampshires is elevated compared to other breeds (Monin and Sellier,
1985) resulting in an extended decline in pH post mortem, producing an abnormally
low ultimate pH and the so-called acid-meat condition. At these low pH levels, the
muscle approaches its isoelectric point at which there are no electric charges on the
muscle proteins and, consequently, the water holding capacity of the muscle is
dramatically reduced. Evidence suggests that the high GP levels are the result of a
single dominant gene. The dominant allele, which produces the acid-meat condition,
is designated RN- and the recessive allele is designated rn+.
The net effect of the RN- allele is to increase drip, purge, and cooking losses and
reduce curing and processing yields. In addition, muscle color is generally paler for
high GP compared to low GP animals. However, the RN- allele also has positive
effects on quality with a number of studies showing a reduction in shear force and
improvements in tenderness and juiciness for animals with high GP (genotypes RN-RN-
and/or RN-rn+) compared to low GP pigs (genotype rn+rn+). High GP animals also
seem to have small advantages in growth rate, backfat thickness, loin eye area, and
carcass lean content compared to those with low GP. Thus, the RN gene has both
positive and negative effects with the major trade-off being between reduced water
holding capacity and improved eating quality. In practice, this gene may be exploited
in situations where a high eating quality product is desired but eliminated from
populations where the meat is principally used for cured and processed products.
Estimates of the frequency of the dominant allele (RN-), which have largely been
derived in European populations, have generally been high (between 0.5 and 0.7). A
recent study involving samples of pigs from US Hampshire breeders, produced an
estimate of the frequency of the RN- allele of 0.64 (Miller, 1998), which is within the
range found in European populations.
Because this is a dominant gene, the RN- allele can be eliminated by using only
homozygous recessive animals (rn+rn+ ) as replacement breeding stock. However,
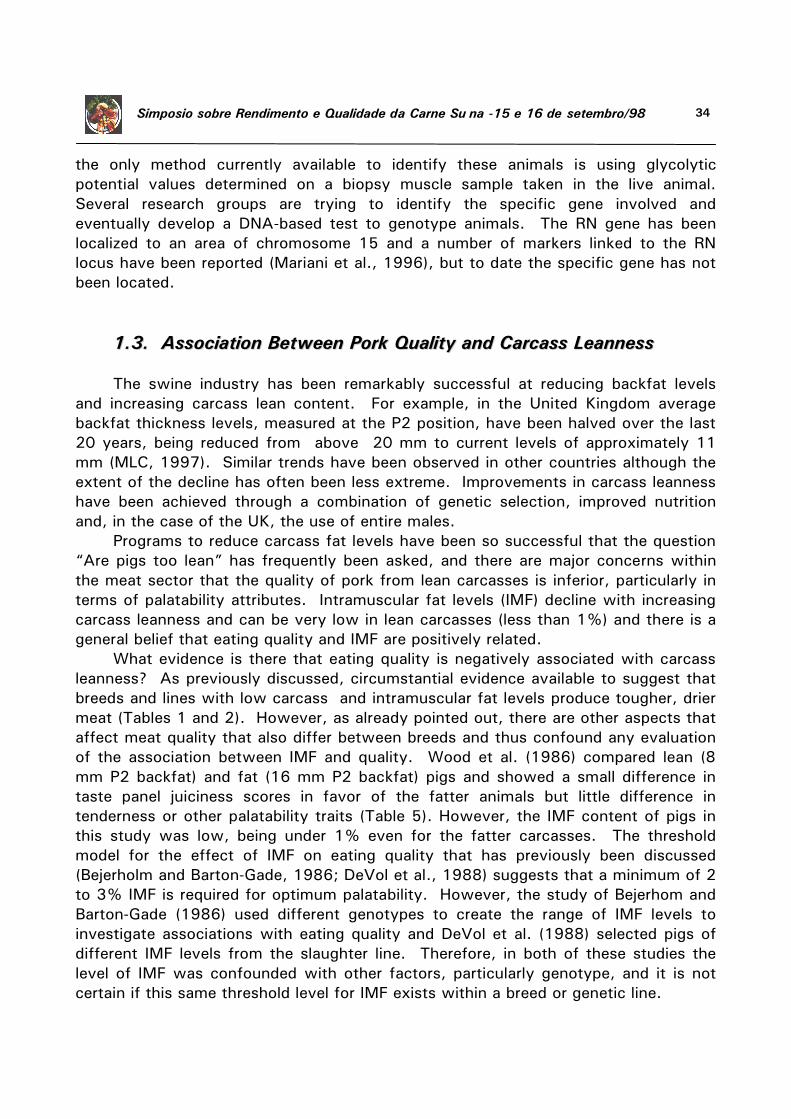
34 Simpósio sobre Rendimento e Qualidade da Carne Suína -15 e 16 de setembro/98
the only method currently available to identify these animals is using glycolytic
potential values determined on a biopsy muscle sample taken in the live animal.
Several research groups are trying to identify the specific gene involved and
eventually develop a DNA-based test to genotype animals. The RN gene has been
localized to an area of chromosome 15 and a number of markers linked to the RN
locus have been reported (Mariani et al., 1996), but to date the specific gene has not
been located.
11..33.. AAssssoocciiaattiioonn BBeettwweeeenn PPoorrkk QQuuaalliittyy aanndd CCaarrccaassss LLeeaannnneessss
The swine industry has been remarkably successful at reducing backfat levels
and increasing carcass lean content. For example, in the United Kingdom average
backfat thickness levels, measured at the P2 position, have been halved over the last
20 years, being reduced from above 20 mm to current levels of approximately 11
mm (MLC, 1997). Similar trends have been observed in other countries although the
extent of the decline has often been less extreme. Improvements in carcass leanness
have been achieved through a combination of genetic selection, improved nutrition
and, in the case of the UK, the use of entire males.
Programs to reduce carcass fat levels have been so successful that the question
“Are pigs too lean” has frequently been asked, and there are major concerns within
the meat sector that the quality of pork from lean carcasses is inferior, particularly in
terms of palatability attributes. Intramuscular fat levels (IMF) decline with increasing
carcass leanness and can be very low in lean carcasses (less than 1%) and there is a
general belief that eating quality and IMF are positively related.
What evidence is there that eating quality is negatively associated with carcass
leanness? As previously discussed, circumstantial evidence available to suggest that
breeds and lines with low carcass and intramuscular fat levels produce tougher, drier
meat (Tables 1 and 2). However, as already pointed out, there are other aspects that
affect meat quality that also differ between breeds and thus confound any evaluation
of the association between IMF and quality. Wood et al. (1986) compared lean (8
mm P2 backfat) and fat (16 mm P2 backfat) pigs and showed a small difference in
taste panel juiciness scores in favor of the fatter animals but little difference in
tenderness or other palatability traits (Table 5). However, the IMF content of pigs in
this study was low, being under 1% even for the fatter carcasses. The threshold
model for the effect of IMF on eating quality that has previously been discussed
(Bejerholm and Barton-Gade, 1986; DeVol et al., 1988) suggests that a minimum of 2
to 3% IMF is required for optimum palatability. However, the study of Bejerhom and
Barton-Gade (1986) used different genotypes to create the range of IMF levels to
investigate associations with eating quality and DeVol et al. (1988) selected pigs of
different IMF levels from the slaughter line. Therefore, in both of these studies the
level of IMF was confounded with other factors, particularly genotype, and it is not
certain if this same threshold level for IMF exists within a breed or genetic line.
35 Simpósio sobre Rendimento e Qualidade da Carne Suína -15 e 16 de setembro/98
Relatively few studies have investigated the genetic correlations between
carcass lean and eating quality. However, estimates of the genetic correlations
between backfat thickness and IMF on the one hand and palatability traits on the
other have generally been unfavorable suggesting that genetic selection for improved
carcass lean content will produce a correlated reduction in pork tenderness and
juiciness.
The relationship between IMF and pork palatability is, therefore, not clearly
established. There is some interest in selecting for higher levels of IMF; however,
there are no techniques currently available to do this in the live animal. There are
reports that suggest that there may be single genes that have a large effect on IMF
levels and ultimately it may be feasible to select for these using a DNA-based test.
However, todate none of these genes have been identified.
Table 5. Influence of backfat thickness on eating quality of pork loin chops.
(from Wood et al., 1986).
Backfat thickness (P2, mm)
Lean (8)
Fat (16)
SEDa
Intramuscular fat (%)
.55
.96
0.37***
Tendernessb
1.0
1.1
.37
Juicinessb
1.0
1.3
0.7**
Flavor likingb
1.5
1.7
.15
Pork flavorb
.6
.9
.14
Overall acceptabilityb
.7
1.0
.23
a Standard error of the difference (SED); *, **, *** = P<.05, P<.01; P<.001 respectively. b Evaluated using a 15 point scale; -7 to +7; lower values = poorer quality.
22.. NNuuttrriittiioonnaall IInnfflluueenncceess oonn QQuuaalliittyy
2.1. Vitamin and Minerals
22..11..11.. VViittaammiinn EE aanndd SSeelleenniiuumm
A major cause of deterioration in the quality of meat during storage is lipid
36 Simpósio sobre Rendimento e Qualidade da Carne Suína -15 e 16 de setembro/98
oxidation which can result in a number of undesirable changes and reduce the shelf-
life of pork. These changes include the development of oxidative rancidity and an
associated increase in unpleasant odors and flavors. In addition, the deterioration of
fresh pork color during aerobic storage has been attributed to oxidative changes in the
chemical form of muscle pigments; myoglobin can be converted into metmyoglobin
producing a dull brown muscle color which is less attractive to the consumer. This
color change is particularly important for ground products, such as sausage, where a
greater surface area is generally available for oxidation to take place. It has also been
proposed that oxidation of the phospholipids in the cell membranes disrupts cell wall
integrity and can reduce water holding capacity. The unsaturated fatty acid content
of body fat, including the phospholipids in membranes, is very closely related to the
composition of the dietary fat and can therefore be readily manipulated by altering the
dietary fat source (see section 2.2). One approach to reducing the impact of
oxidation on product appearance is to use vacuum or modified atmosphere packaging
and storage, which exclude or displace oxygen and limit oxidation.
Another potential approach to reducing oxidation in pork and improving shelf-life
and quality is to use antioxidants and the feeding of high levels of vitamin E to pigs
and other species has been widely investigated. In growing-finishing pigs, the NRC
(1998) recommended that the dietary requirements for vitamin E to prevent deficiency
symptoms is 11 mg/kg of feed of DL-a-tocopherol; however, increased levels of 30
mg/kg or higher are recommended in situations where relatively high levels of
unsaturated fatty acids are fed (Ullrey, 198l). However, there has been considerable
interest in pigs, as well as in cattle and sheep, in feeding much higher levels of
supplementary vitamin E to prevent deterioration in meat quality during storage
associated with lipid oxidation discussed above.
Jensen et al. (1998) summarized the results of 14 studies that investigated the
impact of feeding high levels of vitamin E (within the range of 100 to 800 mg/kg of
feed of DL-a-tocopherol) to growing-finishing pigs. These studies used chops, steaks
and/or ground pork products and employed a range of storage times and conditions
post mortem. All of the studies that measured muscle vitamin E levels showed a
dose-dependent increase and a significant reduction in lipid oxidation from feeding
high vitamin E levels. The effects of vitamin E feeding on pork color and water
holding capacity were, however, more variable. For example, Jensen et al. (1997)
found no effect of feeding vitamin E at levels up to 700 mg/kg on muscle color and
drip loss despite the fact that muscle vitamin E levels were increased and lipid
oxidation was decreased by the elevated dietary vitamin E treatments. Asghar et al.
(1991) found that the surface redness of the muscle (measured by Hunter a* values)
was increased and the drip loss from frozen pork chops upon thawing was decreased
by feeding 200 mg of a-tocopherol acetate per kg of feed compared to the controls
(10 mg/kg); the color and drip loss of muscle from pigs fed 100 mg/kg feed was
intermediate between the other two treatments but not statistically different from the
controls.
Two recent studies that have investigated the effect of vitamin E on water
37 Simpósio sobre Rendimento e Qualidade da Carne Suína -15 e 16 de setembro/98
holding capacity are summarized in Table 6. The study of Cheah et al. (1995)
showed a significant reduction in drip loss from feeding 500 mg/kg of feed of
supplementary vitamin E for 46 days prior to slaughter for both Halothane negative
and carrier animals. In contrast, Cannon et al. (1996) fed 100 mg/kg of feed of
supplementary vitamin E for an 84 day period prior to slaughter and showed no effect
on muscle color or drip loss for storage periods of up to 56 days post mortem. An
obvious explanation for the difference in response observed in these two studies is
the lower level of vitamin E used by Cannon et al. (1996) and these authors
suggested that the lack of response may have resulted from the low a-tocopherol
concentrations found in the muscle of treated pigs. Obviously, the response to
dietary vitamin E supplementation will depend on the level fed and the time of feeding
and may actually vary depending on the response criterion used.
Another nutrient that is involved in reducing lipid oxidation in the cell membrane
is selenium, which is a component of the enzyme glutathione peroxidase. This
enzyme can remove peroxides from cell membranes and has, therefore, a shared role
with vitamin E in reducing cell membrane oxidation. However, there is little
experimental evidence to suggest that providing pigs with additional selenium above
that required to prevent deficiency symptoms shows any benefit in terms of meat
quality.
22..11..22.. VViittaammiinn DD33
Recently, there has been considerable interest in feeding high levels of vitamin
D3 to cattle to improve tenderness (Swanek et al., 1997). It has been suggested that
such an approach results in an increase in muscle calcium levels which stimulate
proteolytic enzyme activity post mortem and improve meat tenderness. A
preliminary study was carried out at the University of Illinois to investigate the impact
of feeding high levels of vitamin D3 (331 vs 55,000 vs 175,000 IU/kg) to finishing
pigs during the final 10 days prior to slaughter (Enright et al., 1998). This study
failed to show any beneficial effects of feeding vitamin D3 on palatability traits;
however, drip loss was reduced and muscle color was darker for treated animals
relative to controls (Table 7).
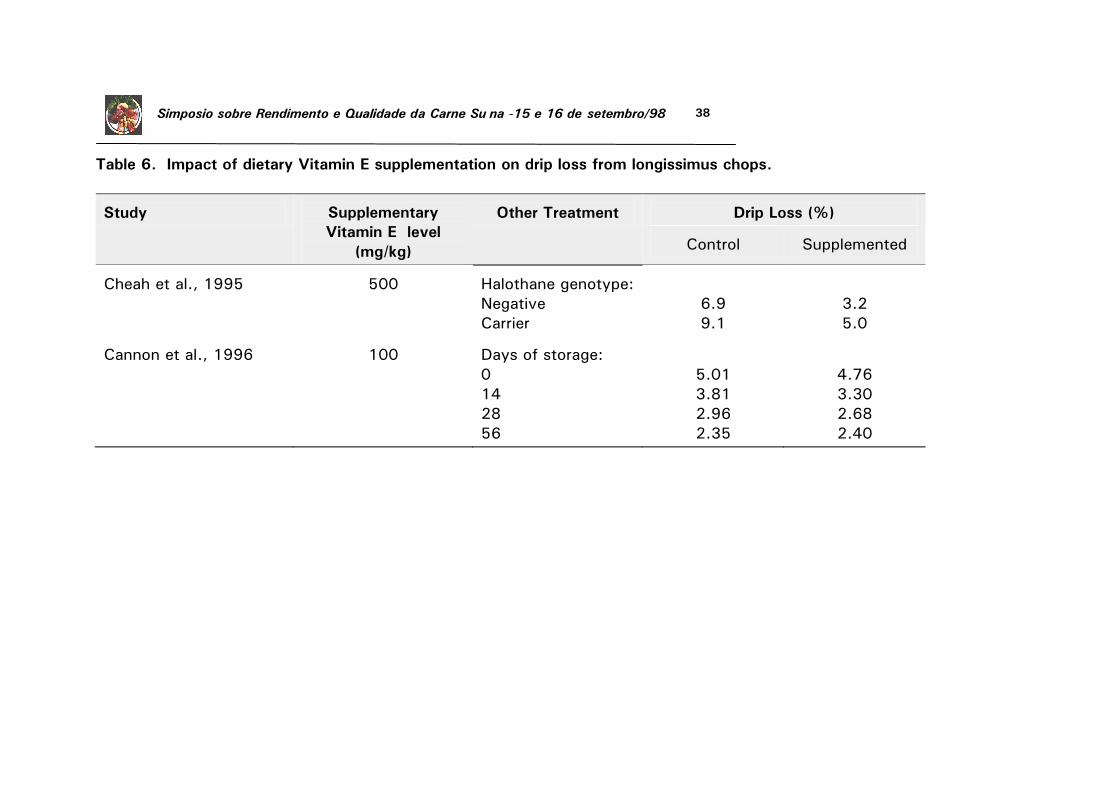
38 Simpósio sobre Rendimento e Qualidade da Carne Suína -15 e 16 de setembro/98
Table 6. Impact of dietary Vitamin E supplementation on drip loss from longissimus chops.
Study
Supplementary
Vitamin E level
(mg/kg)
Other Treatment
Drip Loss (%)
Control
Supplemented
Cheah et al., 1995
500
Halothane genotype:
Negative
Carrier
6.9
9.1
3.2
5.0 Cannon et al., 1996
100
Days of storage:
0
14
28
56
5.01
3.81
2.96
2.35
4.76
3.30
2.68
2.40
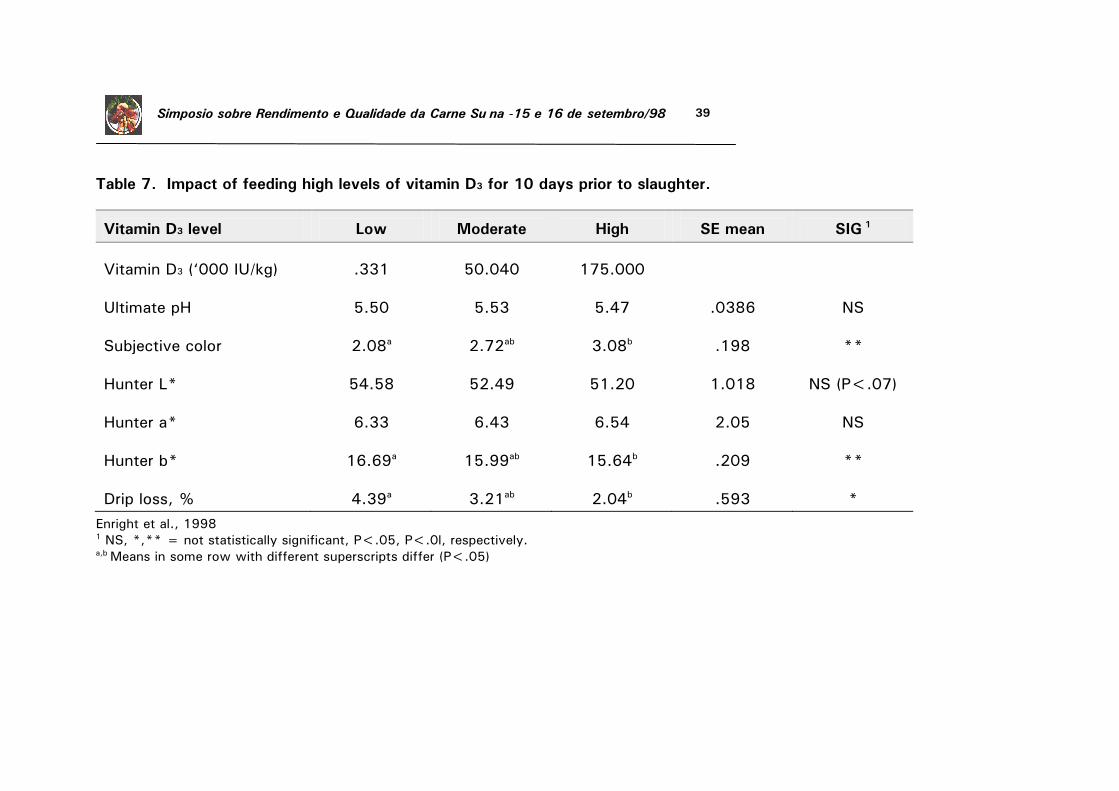
39 Simpósio sobre Rendimento e Qualidade da Carne Suína -15 e 16 de setembro/98
Table 7. Impact of feeding high levels of vitamin D3 for 10 days prior to slaughter.
Vitamin D3 level
Low
Moderate
High
SE mean
SIG 1
Vitamin D3 (‘000 IU/kg)
.331
50.040
175.000
Ultimate pH
5.50
5.53
5.47
.0386
NS
Subjective color
2.08a
2.72ab
3.08b
.198
**
Hunter L*
54.58
52.49
51.20
1.018
NS (P<.07)
Hunter a*
6.33
6.43
6.54
2.05
NS
Hunter b*
16.69a
15.99ab
15.64b
.209
**
Drip loss, %
4.39a
3.21ab
2.04b
.593
*
Enright et al., 1998 1 NS, *,** = not statistically significant, P<.05, P<.0l, respectively. a,b Means in some row with different superscripts differ (P<.05)
40 Simpósio sobre Rendimento e Qualidade da Carne Suína -15 e 16 de setembro/98
22..22.. FFaatt NNuuttrriittiioonn aanndd FFaatt QQuuaalliittyy
Fat quality is largely defined in terms of physical and nutritive characteristics,
aspects which are both closely related to the fatty acid composition of the fat depots.
In the pig, many of the fatty acids in the diet are absorbed across the gut intact and
are deposited directly into the fat. Thus, the composition of the fat depots, in terms
of fatty acid profile, is closely related to the fatty acid composition of the dietary fat.
If pigs are fed a diet with no added fats or oils they synthesize and deposit saturated
fatty acids (principally palmitic and stearic) and mono-unsaturated oleic acid (Metz
and Dekker, 198l). Deposition of polyunsaturated fatty acids (principally C18:2 and
C18:3) occurs only if they are included in the diet.
The major issues relating to fat quality are soft fat, oxidative rancidity, and the
impact of the composition of pork fat on human health. These issues are receiving
increasing attention in the US industry because of the significant changes in
production practices and consumer requirements that have occurred over recent
years.
Soft fat is of major concern to the meat processor because it can cause
significant problems during cutting, grinding and slicing operations and can result in
lower processing yields and reduced value. For example, Shackleford et al. (1990)
fed corn-soy diets with 0 (control) or 10% of either beef tallow, safflower oil,
sunflower oil, or canola oil and showed a significant reduction in fat firmness for pigs
fed the oil containing diets relative to controls. In addition, belly slicing yields and the
bacon flavor and overall palatability ratings were lower for pigs fed canola oil.
The softness of fat is directly proportional to the amount of unsaturated fatty
acids in the fat depot. This area is receiving increasing attention because of changes
in the genetics of pigs and in feed ingredients used to formulate swine rations. Soft
fat problems are relatively greater in leaner pigs which have a greater proportion of
the fatty acids in the carcass fat derived from the diet and a smaller proportion from
de novo synthesis of fatty acids by the animal. This is illustrated by the results of a
UK study (Wood et al., 1989, Table 8) that compared the composition of the backfat
in pigs with different carcass fat levels and showed that leaner pigs had a higher
proportion of polyunsaturated fatty acids (C18:2 and C18:3).
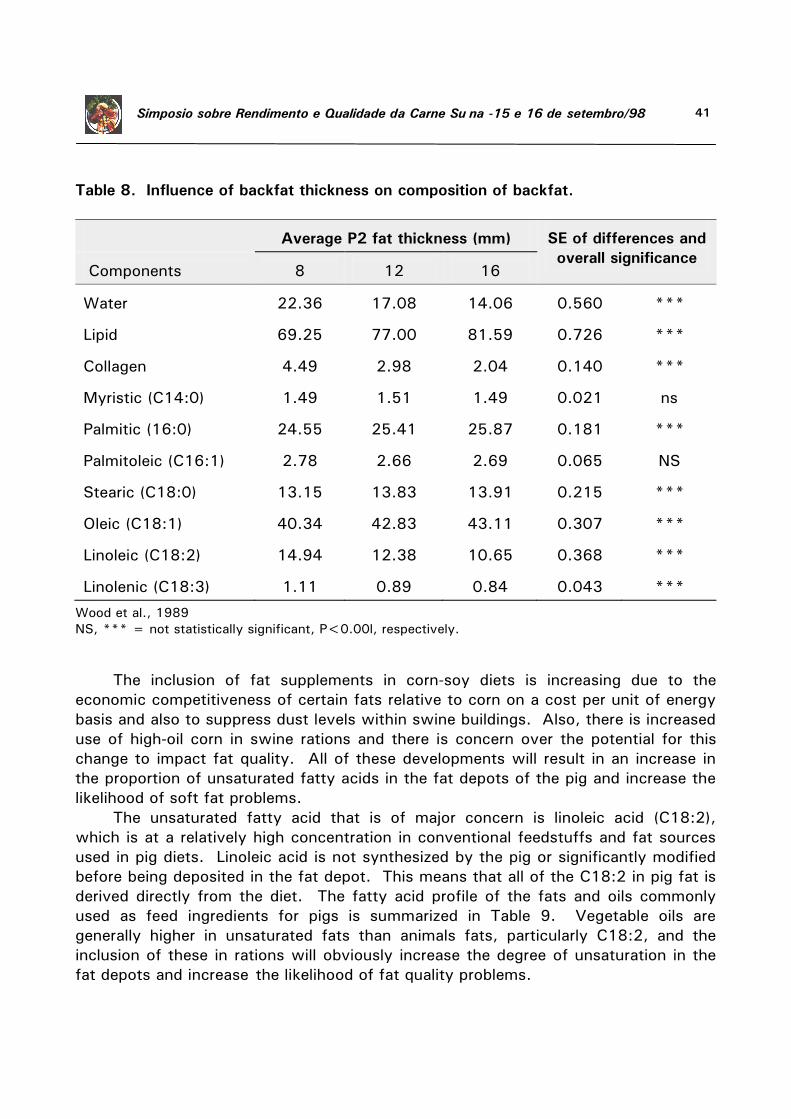
41 Simpósio sobre Rendimento e Qualidade da Carne Suína -15 e 16 de setembro/98
Table 8. Influence of backfat thickness on composition of backfat.
Average P2 fat thickness (mm)
SE of differences and
overall significance Components
8
12
16
Water
22.36
17.08
14.06
0.560
***
Lipid
69.25
77.00
81.59
0.726
***
Collagen
4.49
2.98
2.04
0.140
***
Myristic (C14:0)
1.49
1.51
1.49
0.021
ns
Palmitic (16:0)
24.55
25.41
25.87
0.181
***
Palmitoleic (C16:1)
2.78
2.66
2.69
0.065
NS
Stearic (C18:0)
13.15
13.83
13.91
0.215
***
Oleic (C18:1)
40.34
42.83
43.11
0.307
***
Linoleic (C18:2)
14.94
12.38
10.65
0.368
***
Linolenic (C18:3)
1.11
0.89
0.84
0.043
***
Wood et al., 1989
NS, *** = not statistically significant, P<0.00l, respectively.
The inclusion of fat supplements in corn-soy diets is increasing due to the
economic competitiveness of certain fats relative to corn on a cost per unit of energy
basis and also to suppress dust levels within swine buildings. Also, there is increased
use of high-oil corn in swine rations and there is concern over the potential for this
change to impact fat quality. All of these developments will result in an increase in
the proportion of unsaturated fatty acids in the fat depots of the pig and increase the
likelihood of soft fat problems.
The unsaturated fatty acid that is of major concern is linoleic acid (C18:2),
which is at a relatively high concentration in conventional feedstuffs and fat sources
used in pig diets. Linoleic acid is not synthesized by the pig or significantly modified
before being deposited in the fat depot. This means that all of the C18:2 in pig fat is
derived directly from the diet. The fatty acid profile of the fats and oils commonly
used as feed ingredients for pigs is summarized in Table 9. Vegetable oils are
generally higher in unsaturated fats than animals fats, particularly C18:2, and the
inclusion of these in rations will obviously increase the degree of unsaturation in the
fat depots and increase the likelihood of fat quality problems.

42 Simpósio sobre Rendimento e Qualidade da Carne Suína -15 e 16 de setembro/98

43 Simpósio sobre Rendimento e Qualidade da Carne Suína -15 e 16 de setembro/98
Table 9. Fatty acid composition of fats and oils
Type of Lipid
Selected fatty acids (% of total fatty acids)
Tot.
Sat
Tot.
Unsat
U:S1
ratio
Iodine
Value
<C10
C12:0
C14:0
C16:0
C16:1
C18:0
C18:1
C18:2
C18:3
>C20
Animal Fats:
Beef tallow
Choice White Grease
Lard
Poultry Fat
Restaurant Grease
0.1
0.2
0.1
0.0
-
0.9
0.2
0.2
0.1
-
2.7
1.9
1.3
0.9
1.9
24.9
21.5
23.8
21.6
16.2
4.2
5.7
2.7
5.7
2.5
18.9
14.9
13.5
6.0
10.5
3.1
11.6
10.2
19.4
17.5
0.6
0.4
1.0.
1.0
1.9
0.6
0.4
1.0
1.2
1.0
0.3
1.8
1.0
1.2
1.0
52.1
40.8
41.1
31.2
29.9
47.9
59.2
58.9
68.8
70.1
0.92
1.45
1.44
2.20
2.34
44
60
64
78
75
Fish Oils:
Anchovy
Herring
Menhaden
-
-
-
-
0.2
0
7.4
7.1
8.0
17.4
11.7
10.5
10.5
9.6
10.5
4.0
0.8
3.8
11.6
11.9
14.5
1.2
1.1
2.1
0.8
0.8
1.5
30.3
45.6
29.5
34.6
22.8
33.3
65.4
77.2
66.7
1.89
3.39
66.7
-
-
-
Vegetable Oils:
Canola (Rapeseed)
Coconut
Corn
Cottonseed
Olive
Palm
Peanut
Safflower
Sesame
Soybean
Sunflower
0.0
14.0
0.0
0.0
0.0
0.0
0.0
0.0
0.0
0.0
0.0
0.0
44.6
0.0
0.0
0.0
0.1
0.0
0.0
0.0
0.0
0.0
0.0
16.8
0.0
0.8
0.0
1.0
0.1
0.4
0.0
0.1
0.0
4.0
8.2
10.9
22.7
11.0
43.5
9.5
6.2
8.9
10.3
5.4
0.2
0.0
0.0
0.8
0.8
0.3
0.1
0.4
0.2
0.2
0.2
1.8
2.8
1.8
2.3
2.2
4.3
2.2
2.3
4.8
3.8
3.5
56.1
5.8
24.2
17.0
72.5
36.6
44.8
11.7
39.3
22.8
45.3
20.3
1.8
59.0
51.5
7.9
9.1
32.0
74.1
41.3
51.0
39.8
9.3
0.0
0.7
0.2
0.6
0.2
-
0.4
0.3
6.8
0.2
3.6
-
-
0.1
0.3
0.1
6.4
-
0.2
0.2
-
7.4
91.9
13.3
27.1
14.1
51.6
17.8
9.5
14.8
15.1
10.6
92.6
8.1
86.7
72.9
85.9
48.4
82.2
90.5
85.2
84.2
89.4
12.4
6
0.09
6.53
2.69
6.08
0.94
4.63
9.52
5.73
5.64
8.47
117
10
125
105
86
50
92
140
110
130
133
NRC, 1998

44 Simpósio sobre Rendimento e Qualidade da Carne Suína -15 e 16 de setembro/98
1 Unsaturated to saturated fatty acid ratio.
45 Simpósio sobre Rendimento e Qualidade da Carne Suína -15 e 16 de setembro/98
A measure of the degree of unsaturation of fats, both dietary and within the
body, is the Iodine Value (IV), with higher values indicating a greater proportion of
unsaturated fats. Boyd (1997) investigated the relationships between dietary fatty
acid profile and the fatty acid profile and IV of backfat. The relationship between
dietary linoleic (C18:2) content and the IV of the backfat was linear (Figure l- em
anexo), with IVs increasing from approximately 65 to 76 for diets containing 1.3 and
3.5% of C18:2, respectively.
Threshold levels for body fat composition for soft fat problems have not been
clearly established. The Danes have set a fairly rigid standard of a maximum body fat
IV of 70 (Barton-Gade, 1987). Boyd (1997) suggested that some pigs fed a corn-soy
diet with no added fat would exceed this threshold. To prevent problems occurring,
dietary specifications in Europe generally include a maximum inclusion level for C18:2
which is commonly set at around 1.6% of the diet for finisher rations. Boyd (1997)
has suggested a less stringent IV threshold of 74 for US conditions and a dietary
linoleic acid maximum of 2.10% to meet this threshold.
An area that has received relatively little attention is the relationship between the
composition of pig fat and the eating quality of pork, particularly in terms of odor and
flavor. Historically, major problems in this respect were experienced with feeding fish
oils or fish meals with a relatively high oil content and the associated development of
fishy taints in the meat. Fish oils are generally high in polyunsaturated fatty acids
such as C20:5 and C22:6 (Irie and Sakimoto, 1992) that are very susceptible to
oxidative rancidity and the development of off-flavors.
The relationship between fatty acid composition of intramuscular fat and the
palatability of pork was investigated by Cameron and Enser (1991) who showed that
the correlations between the concentration of specific fatty acids and eating quality
traits were generally weak (Table 10). However, correlations involving
polyunsaturated fatty acids and palatability scores were generally negative and those
for the saturated fatty acids were generally positive suggesting that the higher the
degree of unsaturation in the IMF, the poorer the eating quality. A possible
explanation for this is the increased level of oxidation and development of rancidity
for fat that is high in unsaturated fatty acid.
One of the consequences of the close relationship between the composition of
dietary and body fat is that it is relatively easy to manipulate fat composition by
changing the fat source fed to the pig. In the human, the consumption of high levels
of saturated fat has been associated with an increasing incidence of coronary heart
disease and a number of studies have investigated the potential for increasing the
concentrations of “healthier” fatty acids in pig fat by including them in the diet.
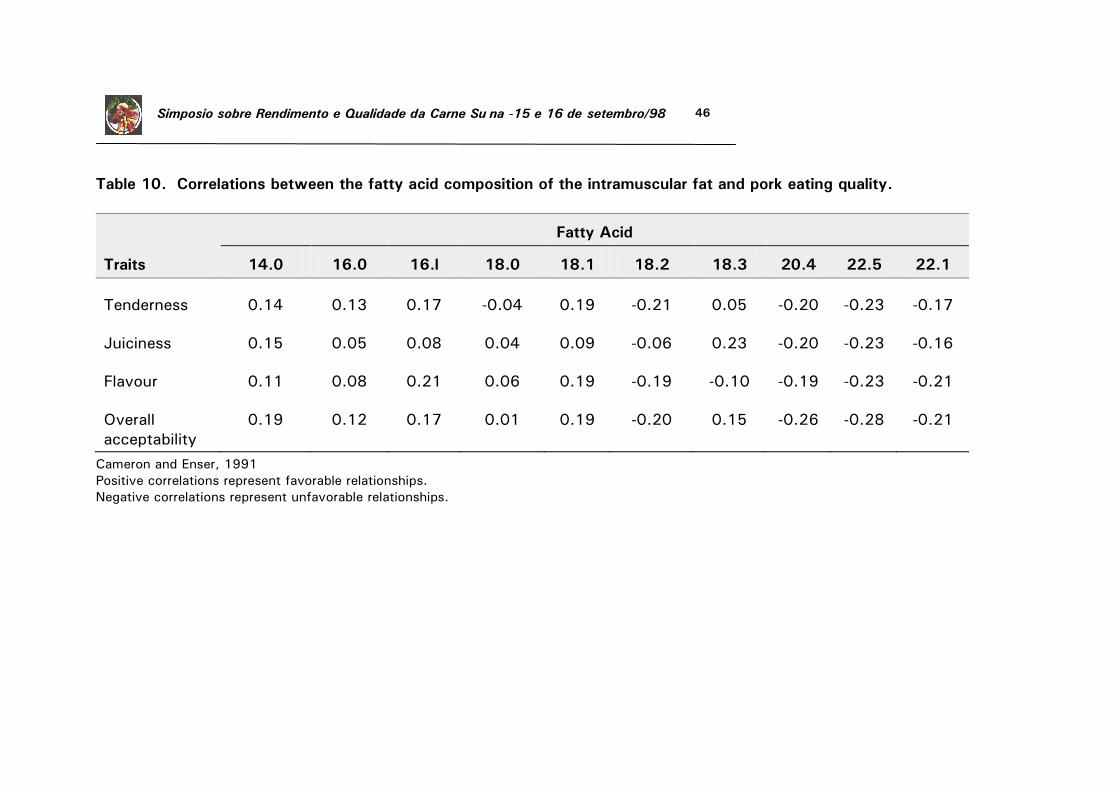
46 Simpósio sobre Rendimento e Qualidade da Carne Suína -15 e 16 de setembro/98
Table 10. Correlations between the fatty acid composition of the intramuscular fat and pork eating quality.
Fatty Acid
Traits
14.0
16.0
16.l
18.0
18.1
18.2
18.3
20.4
22.5
22.1
Tenderness
0.14
0.13
0.17
-0.04
0.19
-0.21
0.05
-0.20
-0.23
-0.17
Juiciness
0.15
0.05
0.08
0.04
0.09
-0.06
0.23
-0.20
-0.23
-0.16
Flavour
0.11
0.08
0.21
0.06
0.19
-0.19
-0.10
-0.19
-0.23
-0.21
Overall
acceptability
0.19
0.12
0.17
0.01
0.19
-0.20
0.15
-0.26
-0.28
-0.21
Cameron and Enser, 1991
Positive correlations represent favorable relationships.
Negative correlations represent unfavorable relationships.

47 Simpósio sobre Rendimento e Qualidade da Carne Suína -15 e 16 de setembro/98
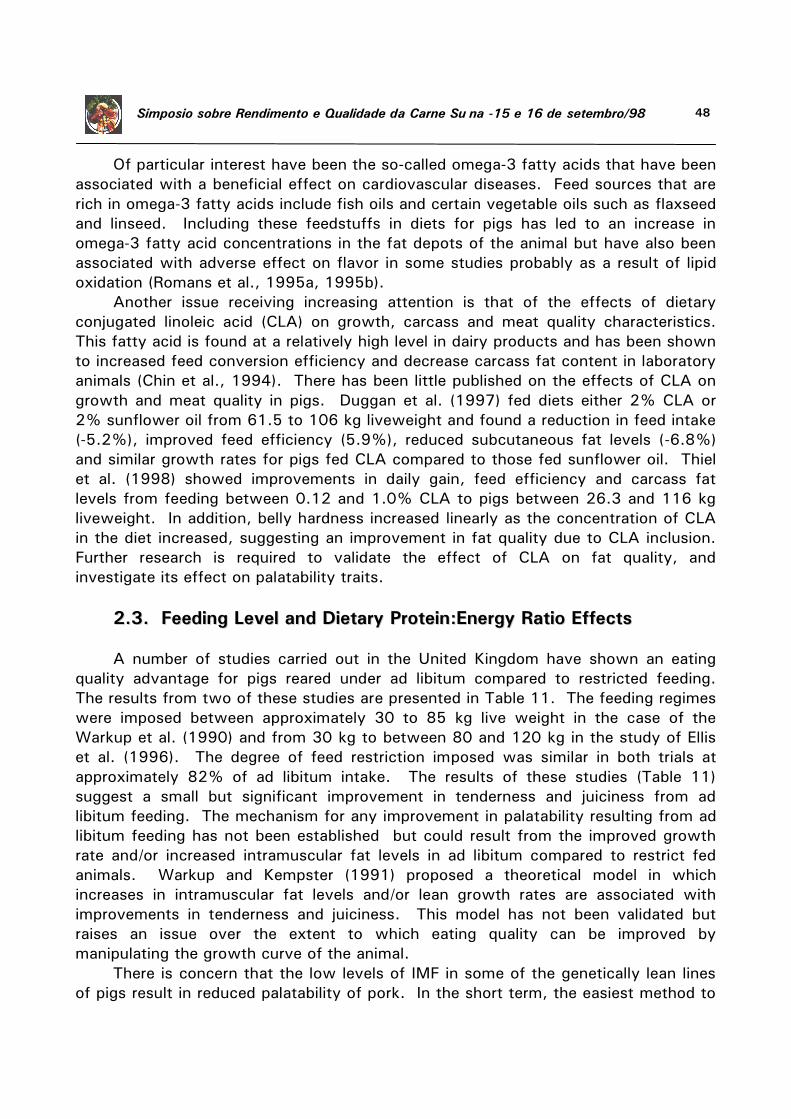
48 Simpósio sobre Rendimento e Qualidade da Carne Suína -15 e 16 de setembro/98
Of particular interest have been the so-called omega-3 fatty acids that have been
associated with a beneficial effect on cardiovascular diseases. Feed sources that are
rich in omega-3 fatty acids include fish oils and certain vegetable oils such as flaxseed
and linseed. Including these feedstuffs in diets for pigs has led to an increase in
omega-3 fatty acid concentrations in the fat depots of the animal but have also been
associated with adverse effect on flavor in some studies probably as a result of lipid
oxidation (Romans et al., 1995a, 1995b).
Another issue receiving increasing attention is that of the effects of dietary
conjugated linoleic acid (CLA) on growth, carcass and meat quality characteristics.
This fatty acid is found at a relatively high level in dairy products and has been shown
to increased feed conversion efficiency and decrease carcass fat content in laboratory
animals (Chin et al., 1994). There has been little published on the effects of CLA on
growth and meat quality in pigs. Duggan et al. (1997) fed diets either 2% CLA or
2% sunflower oil from 61.5 to 106 kg liveweight and found a reduction in feed intake
(-5.2%), improved feed efficiency (5.9%), reduced subcutaneous fat levels (-6.8%)
and similar growth rates for pigs fed CLA compared to those fed sunflower oil. Thiel
et al. (1998) showed improvements in daily gain, feed efficiency and carcass fat
levels from feeding between 0.12 and 1.0% CLA to pigs between 26.3 and 116 kg
liveweight. In addition, belly hardness increased linearly as the concentration of CLA
in the diet increased, suggesting an improvement in fat quality due to CLA inclusion.
Further research is required to validate the effect of CLA on fat quality, and
investigate its effect on palatability traits.
22..33.. FFeeeeddiinngg LLeevveell aanndd DDiieettaarryy PPrrootteeiinn::EEnneerrggyy RRaattiioo EEffffeeccttss
A number of studies carried out in the United Kingdom have shown an eating
quality advantage for pigs reared under ad libitum compared to restricted feeding.
The results from two of these studies are presented in Table 11. The feeding regimes
were imposed between approximately 30 to 85 kg live weight in the case of the
Warkup et al. (1990) and from 30 kg to between 80 and 120 kg in the study of Ellis
et al. (1996). The degree of feed restriction imposed was similar in both trials at
approximately 82% of ad libitum intake. The results of these studies (Table 11)
suggest a small but significant improvement in tenderness and juiciness from ad
libitum feeding. The mechanism for any improvement in palatability resulting from ad
libitum feeding has not been established but could result from the improved growth
rate and/or increased intramuscular fat levels in ad libitum compared to restrict fed
animals. Warkup and Kempster (1991) proposed a theoretical model in which
increases in intramuscular fat levels and/or lean growth rates are associated with
improvements in tenderness and juiciness. This model has not been validated but
raises an issue over the extent to which eating quality can be improved by
manipulating the growth curve of the animal.
There is concern that the low levels of IMF in some of the genetically lean lines
of pigs result in reduced palatability of pork. In the short term, the easiest method to
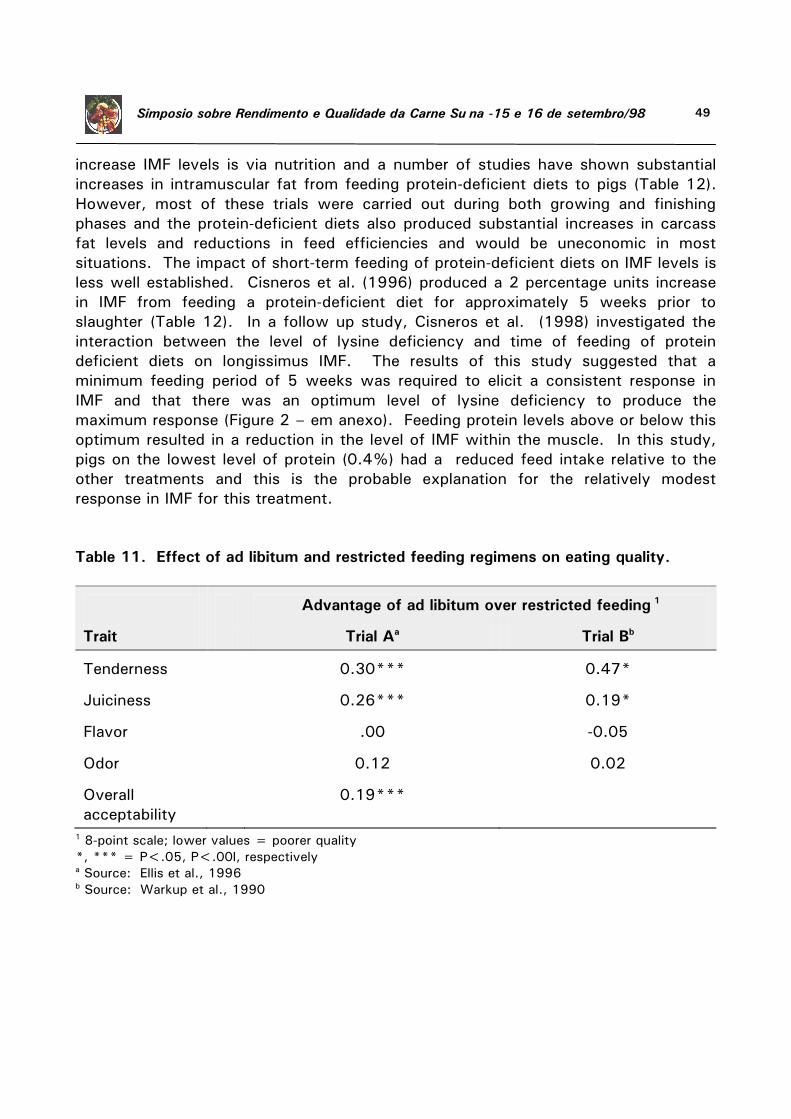
49 Simpósio sobre Rendimento e Qualidade da Carne Suína -15 e 16 de setembro/98
increase IMF levels is via nutrition and a number of studies have shown substantial
increases in intramuscular fat from feeding protein-deficient diets to pigs (Table 12).
However, most of these trials were carried out during both growing and finishing
phases and the protein-deficient diets also produced substantial increases in carcass
fat levels and reductions in feed efficiencies and would be uneconomic in most
situations. The impact of short-term feeding of protein-deficient diets on IMF levels is
less well established. Cisneros et al. (1996) produced a 2 percentage units increase
in IMF from feeding a protein-deficient diet for approximately 5 weeks prior to
slaughter (Table 12). In a follow up study, Cisneros et al. (1998) investigated the
interaction between the level of lysine deficiency and time of feeding of protein
deficient diets on longissimus IMF. The results of this study suggested that a
minimum feeding period of 5 weeks was required to elicit a consistent response in
IMF and that there was an optimum level of lysine deficiency to produce the
maximum response (Figure 2 – em anexo). Feeding protein levels above or below this
optimum resulted in a reduction in the level of IMF within the muscle. In this study,
pigs on the lowest level of protein (0.4%) had a reduced feed intake relative to the
other treatments and this is the probable explanation for the relatively modest
response in IMF for this treatment.
Table 11. Effect of ad libitum and restricted feeding regimens on eating quality.
Advantage of ad libitum over restricted feeding 1
Trait
Trial Aa
Trial Bb
Tenderness
0.30***
0.47*
Juiciness
0.26***
0.19*
Flavor
.00
-0.05
Odor
0.12
0.02
Overall
acceptability
0.19***
1 8-point scale; lower values = poorer quality
*, *** = P<.05, P<.00l, respectively a Source: Ellis et al., 1996 b Source: Warkup et al., 1990
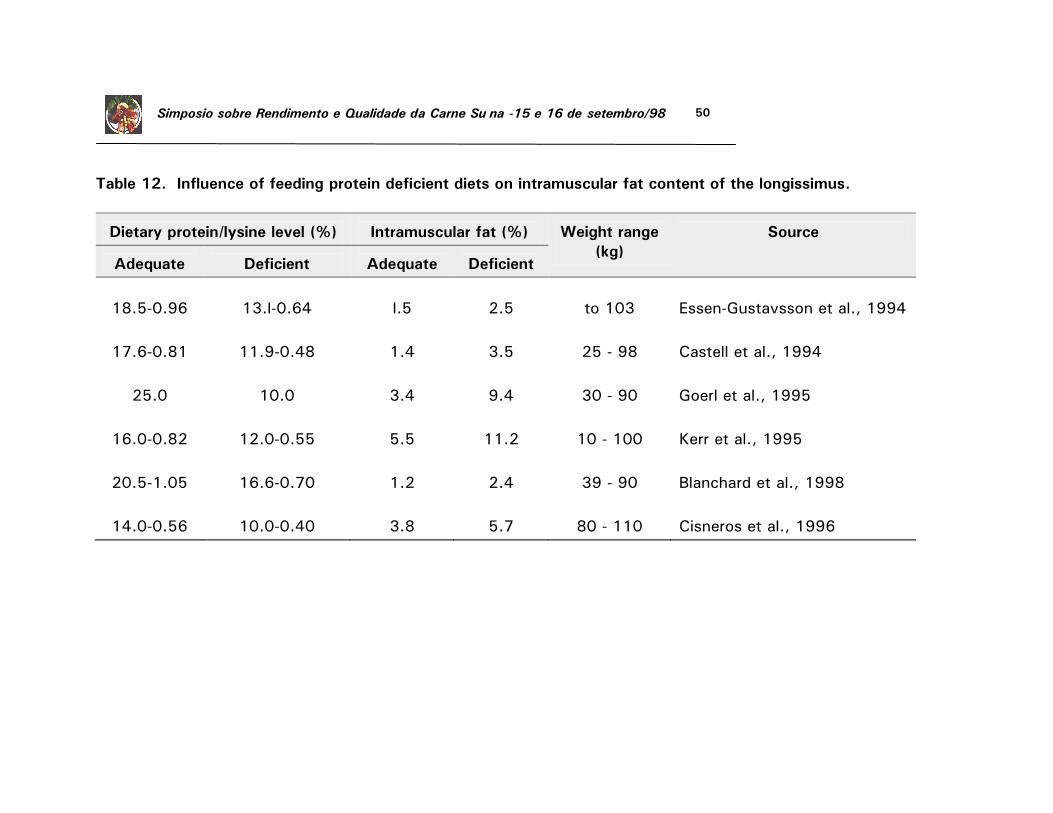
50 Simpósio sobre Rendimento e Qualidade da Carne Suína -15 e 16 de setembro/98
Table 12. Influence of feeding protein deficient diets on intramuscular fat content of the longissimus.
Dietary protein/lysine level (%)
Intramuscular fat (%)
Weight range
(kg)
Source
Adequate
Deficient
Adequate
Deficient
18.5-0.96
13.l-0.64
l.5
2.5
to 103
Essen-Gustavsson et al., 1994
17.6-0.81
11.9-0.48
1.4
3.5
25 - 98
Castell et al., 1994
25.0
10.0
3.4
9.4
30 - 90
Goerl et al., 1995
16.0-0.82
12.0-0.55
5.5
11.2
10 - 100
Kerr et al., 1995
20.5-1.05
16.6-0.70
1.2
2.4
39 - 90
Blanchard et al., 1998
14.0-0.56
10.0-0.40
3.8
5.7
80 - 110
Cisneros et al., 1996
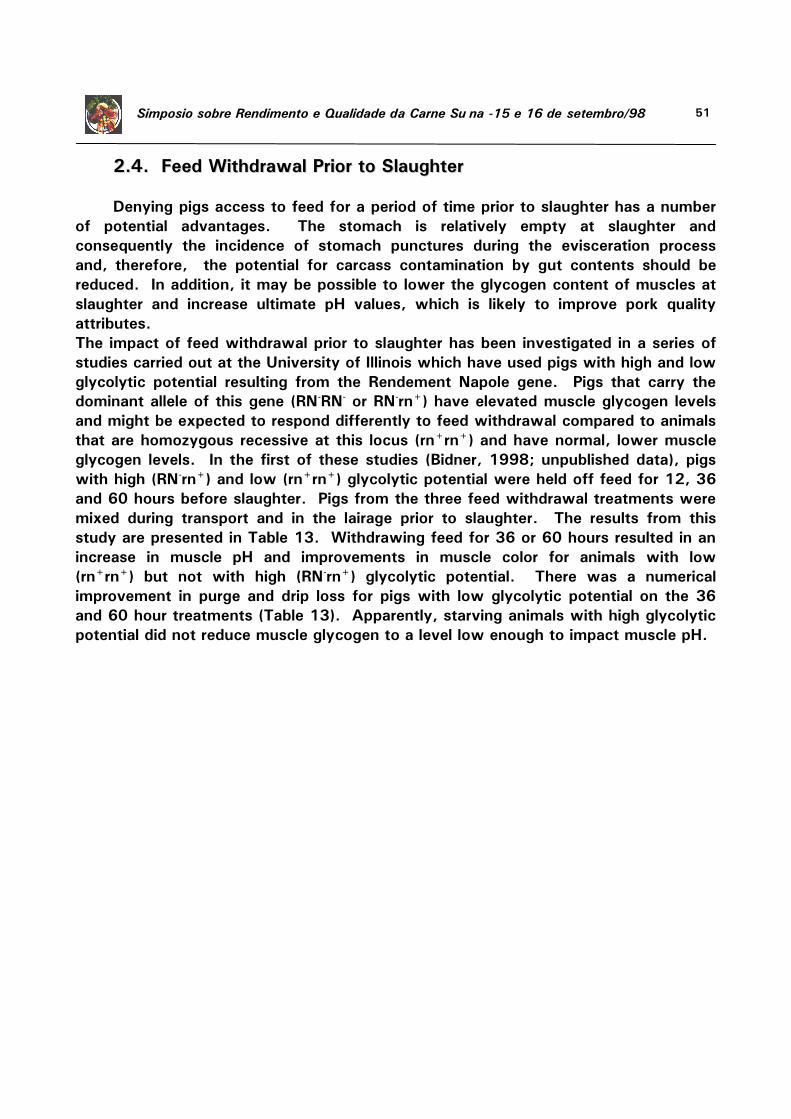
51 Simpósio sobre Rendimento e Qualidade da Carne Suína -15 e 16 de setembro/98
22..44.. FFeeeedd WWiitthhddrraawwaall PPrriioorr ttoo SSllaauugghhtteerr
Denying pigs access to feed for a period of time prior to slaughter has a number
of potential advantages. The stomach is relatively empty at slaughter and
consequently the incidence of stomach punctures during the evisceration process
and, therefore, the potential for carcass contamination by gut contents should be
reduced. In addition, it may be possible to lower the glycogen content of muscles at
slaughter and increase ultimate pH values, which is likely to improve pork quality
attributes.
The impact of feed withdrawal prior to slaughter has been investigated in a series of
studies carried out at the University of Illinois which have used pigs with high and low
glycolytic potential resulting from the Rendement Napole gene. Pigs that carry the
dominant allele of this gene (RN-RN- or RN-rn+) have elevated muscle glycogen levels
and might be expected to respond differently to feed withdrawal compared to animals
that are homozygous recessive at this locus (rn+rn+) and have normal, lower muscle
glycogen levels. In the first of these studies (Bidner, 1998; unpublished data), pigs
with high (RN-rn+) and low (rn+rn+) glycolytic potential were held off feed for 12, 36
and 60 hours before slaughter. Pigs from the three feed withdrawal treatments were
mixed during transport and in the lairage prior to slaughter. The results from this
study are presented in Table 13. Withdrawing feed for 36 or 60 hours resulted in an
increase in muscle pH and improvements in muscle color for animals with low
(rn+rn+) but not with high (RN-rn+) glycolytic potential. There was a numerical
improvement in purge and drip loss for pigs with low glycolytic potential on the 36
and 60 hour treatments (Table 13). Apparently, starving animals with high glycolytic
potential did not reduce muscle glycogen to a level low enough to impact muscle pH.

52 Simpósio sobre Rendimento e Qualidade da Carne Suína -15 e 16 de setembro/98
Table 13. Influence of pre-slaughter feed withdrawal on longissimus muscle quality in pigs with low (rn+rn+) and high (RN-
rn+) glycolytic potential - Study l.
Glycolytic potential
Low
High
Time off-feed (hours)
12
36
60
12
36
60
SE
SIG
Ultimate pH
5.45a
5.59b
5.65b
5.36a
5.34a
5.36a
.02
*
Purge Loss, %
4.10
2.46
2.37
4.48
4.66
4.05
.33
NS
Drip Loss, %
4.17
3.11
3.50
5.49
6.22
5.25
.30
NS
Hunter L*
55.54a
53.08b
51.76b
55.33a
55.55a
55.48a
.45
*
(Bidner, 1998; unpublished data)
NS, * = not statistically significant, P<.05 a, b means within rows with different superscripts differ
53 Simpósio sobre Rendimento e Qualidade da Carne Suína -15 e 16 de setembro/98
In a further study (Bidner, 1998; unpublished data), pigs with high and low
glycolytic potential were held off-feed for periods of 12 or 36 hours prior to slaughter.
Pigs remained in their farm groups and were not mixed with unfamiliar pigs prior to
slaughter. The longer period of feed withdrawal produced no change in muscle pH or
any of the quality attributes for pigs with low and high glycolytic potential (Table 14).
These results are in contrast to those described earlier (Table 13) where pigs were
mixed with unfamiliar animals and suggest that some form of additional stress is
required to reduce muscle glycogen and levels and improve meat quality. These two
studies show that genotype and animal handling factors interact to determine the
response in pork quality to feed withdrawal.
In addition, prolonged periods of feed withdrawal are associated with loss of
carcass weight and a reduced return in situations where animals that are paid for on a
dead weight basis. Dressing percentage (i.e. carcass weight expressed as a
percentage of slaughter live weight) is actually increased by removing feed from pigs
prior to slaughter as a result of losses of gut fill and offal weight, particularly a
reduction in liver weight. This is illustrated by the results from the first study from the
University of Illinois described above where dressing percentage was increased from
68.9 to 74.2 % for pigs held off feed for 12 and 60 hours, respectively (Table 15).
However, European research has shown that carcass weights start to decline after
about 9 to 18 hours of starvation and Warriss and Brown (1983) predicted that
between 18 and 48 hours of starvation the rate of loss was to equivalent to 0.11 %
of carcass weight per hour.
An interesting finding in relation to feed withdrawal prior to slaughter has
emerged from recent research carried out at the University of Illinois that investigated
eating behavior in growing-finishing pigs (Hyun et al., 1997). This study showed that
in uncrowded situations, pigs consumed relatively little feed during the night time
between 6.00 pm and 6.00 am. This suggests that if pigs are despatched for
slaughter early in the morning then the majority will not have fed for approximately
12 hours. If, however, pigs are crowded or the environmental temperature is high
then feeding is likely to continue during the night time.
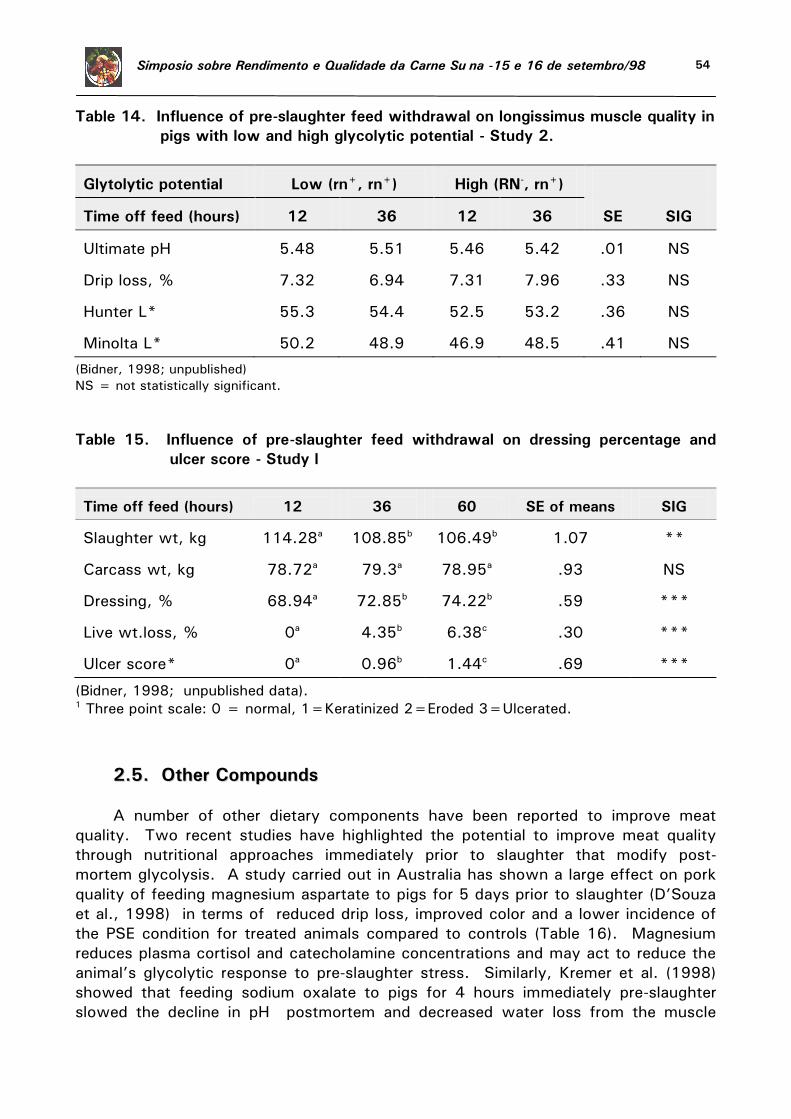
54 Simpósio sobre Rendimento e Qualidade da Carne Suína -15 e 16 de setembro/98
Table 14. Influence of pre-slaughter feed withdrawal on longissimus muscle quality in
pigs with low and high glycolytic potential - Study 2.
Glytolytic potential
Low (rn+, rn+)
High (RN-, rn+)
Time off feed (hours)
12
36
12
36
SE
SIG
Ultimate pH
5.48
5.51
5.46
5.42
.01
NS
Drip loss, %
7.32
6.94
7.31
7.96
.33
NS
Hunter L*
55.3
54.4
52.5
53.2
.36
NS
Minolta L*
50.2
48.9
46.9
48.5
.41
NS
(Bidner, 1998; unpublished)
NS = not statistically significant.
Table 15. Influence of pre-slaughter feed withdrawal on dressing percentage and
ulcer score - Study l
Time off feed (hours)
12
36
60
SE of means
SIG
Slaughter wt, kg
114.28a
108.85b
106.49b
1.07
**
Carcass wt, kg
78.72a
79.3a
78.95a
.93
NS
Dressing, %
68.94a
72.85b
74.22b
.59
***
Live wt.loss, %
0a
4.35b
6.38c
.30
***
Ulcer score*
0a
0.96b
1.44c
.69
***
(Bidner, 1998; unpublished data). 1 Three point scale: 0 = normal, 1=Keratinized 2=Eroded 3=Ulcerated.
22..55.. OOtthheerr CCoommppoouunnddss
A number of other dietary components have been reported to improve meat
quality. Two recent studies have highlighted the potential to improve meat quality
through nutritional approaches immediately prior to slaughter that modify post-
mortem glycolysis. A study carried out in Australia has shown a large effect on pork
quality of feeding magnesium aspartate to pigs for 5 days prior to slaughter (D’Souza
et al., 1998) in terms of reduced drip loss, improved color and a lower incidence of
the PSE condition for treated animals compared to controls (Table 16). Magnesium
reduces plasma cortisol and catecholamine concentrations and may act to reduce the
animal’s glycolytic response to pre-slaughter stress. Similarly, Kremer et al. (1998)
showed that feeding sodium oxalate to pigs for 4 hours immediately pre-slaughter
slowed the decline in pH postmortem and decreased water loss from the muscle
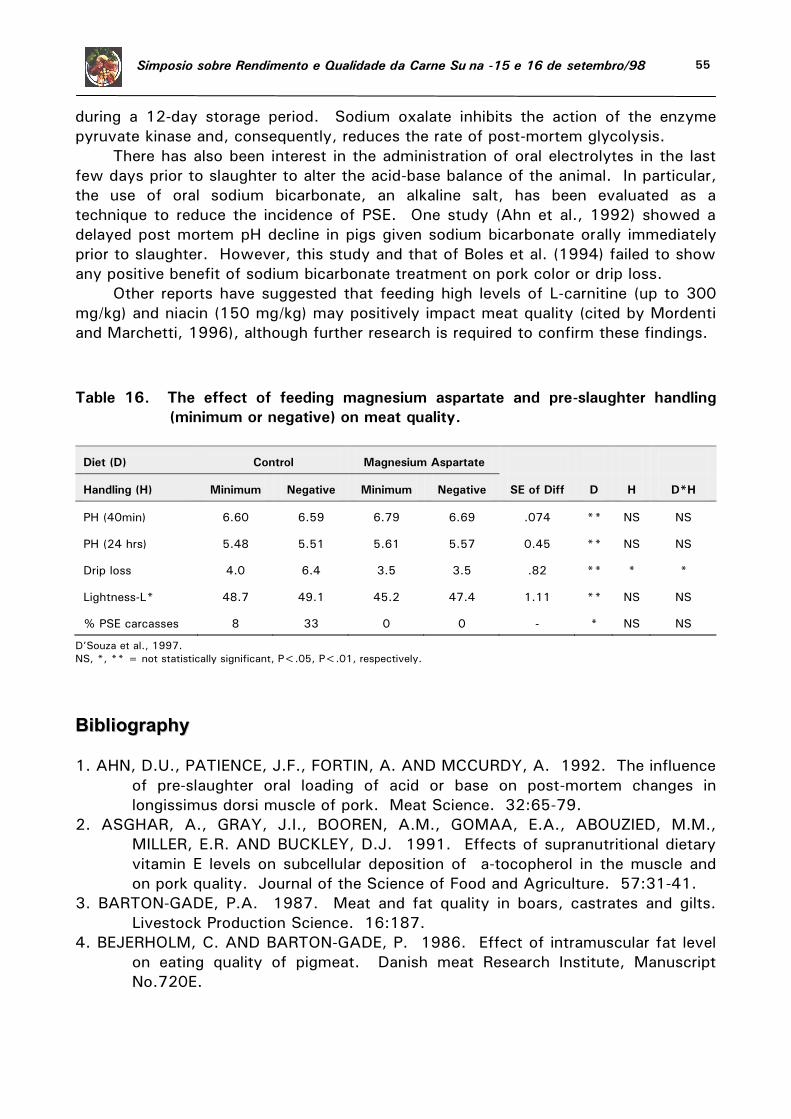
55 Simpósio sobre Rendimento e Qualidade da Carne Suína -15 e 16 de setembro/98
during a 12-day storage period. Sodium oxalate inhibits the action of the enzyme
pyruvate kinase and, consequently, reduces the rate of post-mortem glycolysis.
There has also been interest in the administration of oral electrolytes in the last
few days prior to slaughter to alter the acid-base balance of the animal. In particular,
the use of oral sodium bicarbonate, an alkaline salt, has been evaluated as a
technique to reduce the incidence of PSE. One study (Ahn et al., 1992) showed a
delayed post mortem pH decline in pigs given sodium bicarbonate orally immediately
prior to slaughter. However, this study and that of Boles et al. (1994) failed to show
any positive benefit of sodium bicarbonate treatment on pork color or drip loss.
Other reports have suggested that feeding high levels of L-carnitine (up to 300
mg/kg) and niacin (150 mg/kg) may positively impact meat quality (cited by Mordenti
and Marchetti, 1996), although further research is required to confirm these findings.
Table 16. The effect of feeding magnesium aspartate and pre-slaughter handling
(minimum or negative) on meat quality.
Diet (D)
Control
Magnesium Aspartate
Handling (H)
Minimum
Negative
Minimum
Negative
SE of Diff
D
H
D*H
PH (40min)
6.60
6.59
6.79
6.69
.074
**
NS
NS
PH (24 hrs)
5.48
5.51
5.61
5.57
0.45
**
NS
NS
Drip loss
4.0
6.4
3.5
3.5
.82
**
*
*
Lightness-L*
48.7
49.1
45.2
47.4
1.11
**
NS
NS
% PSE carcasses
8
33
0
0
-
*
NS
NS
D’Souza et al., 1997.
NS, *, ** = not statistically significant, P<.05, P<.01, respectively.
BBiibblliiooggrraapphhyy
1. AHN, D.U., PATIENCE, J.F., FORTIN, A. AND MCCURDY, A. 1992. The influence
of pre-slaughter oral loading of acid or base on post-mortem changes in
longissimus dorsi muscle of pork. Meat Science. 32:65-79.
2. ASGHAR, A., GRAY, J.I., BOOREN, A.M., GOMAA, E.A., ABOUZIED, M.M.,
MILLER, E.R. AND BUCKLEY, D.J. 1991. Effects of supranutritional dietary
vitamin E levels on subcellular deposition of a-tocopherol in the muscle and
on pork quality. Journal of the Science of Food and Agriculture. 57:31-41.
3. BARTON-GADE, P.A. 1987. Meat and fat quality in boars, castrates and gilts.
Livestock Production Science. 16:187.
4. BEJERHOLM, C. AND BARTON-GADE, P. 1986. Effect of intramuscular fat level
on eating quality of pigmeat. Danish meat Research Institute, Manuscript
No.720E.

56 Simpósio sobre Rendimento e Qualidade da Carne Suína -15 e 16 de setembro/98
5. BLANCHARD, P.J., ELLIS, M., WARKUP, C.C., HARDY, B., CHADWICK, J.P. and
DEANS, G.A. 1998. The influence of rate of lean and subcutaneous fat tissue
development on pork eating quality. Animal Science. (Submitted).
6. BOLES, J., PATIENCE, J.F., SCHAEFER, A.L. AND AALHUS, J.L. 1991. Effect of
porcine somatotrophin, stress susceptibility and final end point of cooking on
the sensory, physical and chemical properties of pork loin chops. Journal of
Animal Science. 69:2865-2870.
7. BOLES, J.A., PARRISH, F.C., SKAGGS, C.L. and CHRISTIAN, L.L. 1994. Effect of
loading of acid or base on the incidence of pale soft exudative pork (PSE) in
stress-susceptible pigs. Meat Science 37:181-194.
8. BOYD, R.D. 1997. Relationship between dietary fatty acid profile and body fat
composition in growing pig. PIC USA T & D Technical Memo 153. Pig
Improvement Company, USA, Franklin, Kentucky.
9. CAMERON, N.D. and ENSER, M.B. 1991. Fatty acid composition of lipid in
longissimus dorsi muscle of Duroc and British Landrace pigs and its
relationship with eating quality. Meat Science 29:295-307.
10. CANNON, J.E., MORGAN, J.B., SCHMIDT, G.R., TATUM, J.D., SOFOS, J.N.,
SMITH, G.C., DELMORE, R.J. AND WILLIAMS, S.N. 1996. Growth and fresh
meat quality characteristics of pigs supplemented with vitamin E. Journal
Animal Science 74:98-105.
11. CASTELL, A.G., CLIPLEF, R.L., PASTE-FLYNN, L.M. AND BUTLER, G. 1994.
Performance, carcass and pork characteristics of castrates and gilts self-fed
diets differing in protein content and lysine:energy ratio. Canadian Journal of
Animal Science. 74:519-528.
12. CHEAH, K.S., CHEAH, A.M. AND KRAUSGRILL, D.I. 1995. Effect of dietary
supplementation of vitamin E on pig meat quality. Meat Science 39:255-
264.
13. CHIN, S.F., STORKSON, J.M., ALBRIGHT, K.J., COOK, M.E. AND PARIZA, M.W.
1994. Conjugated linoleic acid is a growth factor for rats as shown by
enhanced weight gain and improved feed efficiency. Journal of Nutrition.
124:2344-2349.
14. CISNEROS, F., ELLIS, M., BAKER, D.H., EASTER R.A. AND MCKEITH, F.K.
1996. The influence of short-term feeding of amino acid-deficient diets and
high dietary leucine levels on the intramuscular fat content of pig muscle.
Animal Science. 63:517-522.
15. CISNEROS, F., WITTE, D., ELLIS, M., MCKEITH, F.K. and BAKER, D.A. 1998.
The influence of dietary lysine level and time of feeding on the intramuscular
fat content of pork. Animal Science (submitted).
16. DE VOL, D.L., MCKEITH, F.K., BECHTEL, P.J., NOVAKOFSKI, J., SHANKS, R.D.
and CARR, T.R. 1988. Variation in composition and palatability traits and
relationships between muscle characteristics and palatability in a random
sample of pork carcasses. Journal of Animal Science. 66:385-395.
17. D’SOUZA, D.N., WARNER, R.D., LEWY, B.J. and DUNSHEA, F.R. 1998. The
effect of dietary magnesium aspartate supplementation on pork quality.
Journal of Animal Science. 76: 104-109.
57 Simpósio sobre Rendimento e Qualidade da Carne Suína -15 e 16 de setembro/98
18. DUGGAN, M.E.R., AALHUS, J.L., SCHAEFER, A.L. and KRAMER, J.K.G. 1997.
The effect of conjugated linoleic acid on fat to lean repartitioning and feed
conversion in pigs. Canadian Journal of Animal Science. 77:723-725.
19. ELLIS, M., WEBB, A.J., AVERY, P.J. and BROWN, I. 1996. The influence of
terminal sire genotype, sex, slaughter weight, feeding regime and slaughter-
house on growth performance and carcass and meat quality of pigs and on
the organoleptic properties of fresh pork. Animal Science. 62:521;530.
20. ENRIGHT, K.L., ELLIS, M., MCKEITH, FK., BERGER, L.L., BAKER, D.H. and
ANDERSON, B.K. 1998. The effects of feeding high levels of vitamin D3 on
pork quality. Paper to be presented at the National Meeting of American
Society of Animal Science.
21. ESSEN-GUSTAVSSON, B., KARLSSON, A., LUNDSTROM, K. and ENFLAT, A-C.
1994. Intramuscular fat and muscle fibre lipid contents of halothane-gene-
free pigs fed high or low protein diets and its relation to meat quality. Meat
Science. 38:269-277.
22. GOERL, K.F., EILERT, S.J., MANDIGO, R.W., CHEN, H.Y. and MILLER, P.S.
1995. Pork characteristics as affected by two populations of swine and six
crude protein levels. Journal of Animal Science. 73:3621-3626.
23. HOFFMAN, 1994. What is quality? Definitions, measurement and evaluation of
meat quality. Meat Focus International. 3:73-82.
24. HYUN, Y., ELLIS, M., MCKEITH, F.K. and WILSON, E.R. 1997. Feed intake
pattern of group-housed growing-finishing pigs monitored using a
computerized feed intake recording system. Journal of Animal Science.
75:1443-1451.
25. IRIE, M. and SAKIMOTO, M. 1992. Fat characteristics of pigs fed fish oil
containing eicosapentaenoic and docosahexaenoic acids. Journal of Animal
Science. 70:470-477.
26. JENSEN, C., GUIDERA, J., SKOVGAARD, I.M, STAUN, H., and SKIBSTEAD, L.H.
1997. Effects of dietary a-tocopherol deposition in porcine m.psoas major
and m.longissimus dorsi and on drip loss, color stability of pork meat. Meat
Science. 45:491-500.
27. JENSEN, C., LAURIDSEN, C. and BERTELSEN, G. 1998. Dietary vitamin E:
quality and storage stability of pork and poultry. Trends in Food Science &
Technology 9:62-72.
28. KREMER, B.T., STAHLY, T.S. and SEBRANEK, J.G. 1998. Effect of dietary
sodium oxalate on meat quality of pork. Proceedings of the Midwestern
Section of the American Society of Animal Science. pp47 (Abstract).
29. LEACH, L.M., ELLIS, M., SUTTON, D.S., MCKEITH, F.K.,and WILSON, E.R.
1996. The growth performance, carcass characteristics and meat quality of
halothane carrier and negative pigs. Journal of Animal Science. 74:934-943.
30. MARIANI, P., LUNDSTROM, K., GUSTAFSSON, U., ENFALT, A.C., JUNEJA, R.K.
and ANDERSON, L. 1996. A major lucus (RN) affecting muscle glycogen
content is located on pig chromosome 15. Mammalian Genome. 7:52-54.
31. METZ, S.H.M. and DEKKER, R.A. 1981. The contribution of fat mobilisation to
the regulation of fat deposition in growing Large White and Pietrain pigs.
Animal Production 33:149-157.
58 Simpósio sobre Rendimento e Qualidade da Carne Suína -15 e 16 de setembro/98
32. MILLER, K.D. 1998. The detection and characterization of pigs with differing
glycolytic potential levels within United States Swine Populations. Ph.D.
Thesis, University of Illinois at Urbana-Champaign, IL, USA.
33. MLC, 1991. Stotfold Pig Development Unit. Second Trial Results. Meat and
Livestock Commission, Milton Keynes, England.
34. MLC, 1997. Pig Yearbook. Meat and Livestock Commission, Milton Keynes,
England.
35. MONIN, G. and SELLIER, P. 1985. Pork of low technological quality with a
normal rate of muscle pH fall in the immediate post-mortem period: The case
of the Hampshire breed. Meat Science. 13:49-63.
36. MORDENTI, A. and MARCHETTI, M. 1996. Use of vitamins for non-
conventional purposes. Proceedings of the 15th IPVs Congress, Bologna, Italy,
pp39-44.
37. NPPC, 1994. Pork Quality:Genetic Evaluation Summary. National Pork Producers
Council, Des Moines, IA.
38. NPPC, 1995. Genetic Evaluation: Terminal Line Program Results. National Pork
Producers Council, Des Moines, IA.
39. NRC, 1998. Nutrient requirements of swine (Tenth Revised Edition). National
Academy Press.
40. ROMANS, J.R., JOHNSON, R.C., WULF, D.M., LIBAL, G.W. and COSTELLO,
W.J. 1995a. Effects of ground flaxseed in swine diets on pig performance
and on physical and sensory characteristics and omega-3 fatty acid content of
pork: I. Dietary level of Flaxseed. Journal of Animal Science 73:1982-1986.
41. ROMANS, J.R., JOHNSON, R.C., WULF, D.M., LIBAL, G.W. and COSTELLO,
W.J. 1995b. Effects of ground flaxseed in swine diets on pig performance
and on physical and sensory characteristics and omega-3 fatty acid content of
pork: II. Duration of 15% dietary Flaxseed. Journal of Animal Science
73:1987-1999.
42. SAYRE, R.N., BRISKEY, E.J. and HOESKSTRAW, W.G. 1963. Comparison of
muscle characteristics and postmortem glycolysis in three breeds of swine.
Journal of Animal Science. 22:1012-1020.
43. SHACKLEFORD, S.D., MILLER, M.F., HAYDON, K.D., LOVEGREN, N.V., LYON,
C.E. and Reagan, J.O. 1990. Acceptability of bacon as influenced by the
feeding of elevated levels on monosaturated fats to growing-finishing swine.
Journal of Food Science. 55:361l.
44. SWANEK, S.S., MORGAN, J.B., OWENS, F.N., DOLEZAL, H.G., and GILL, D.R.
1997. Effects of vitamin D3 supplementation of beef steers on longissimus
muscle tenderness. Journal of Animal Sciences (Supplement 1): 252
(Abstract).
45. THIEL, R.L., SPARKS, J.C., WIEGAN, B.R., PARRISH, F.C. and Ewan, R.C.
1998. Conjugated linoleic acid improves performance and body composition
in swine. Journal of Animal Science. 76:61 (Abstract).
46. TOPEL, D.G., MILLER, J.A., BERGER, P.J., RUST, R.E., PARRISH, F.C.Jr. and
ONO, K. 1976. Palatability and visual acceptance of dark, normal and pale
colored porcine m.longissimus. Journal of Food Science. 41:628-630.

59 Simpósio sobre Rendimento e Qualidade da Carne Suína -15 e 16 de setembro/98
47. ULLREY, D.E. 198l. Vitamin E for swine. Journal of Animal Science. 53:1939-
1056. Warkup, C.C., Dilworth, A.W., Kempster, A.J. and Wood, J.D. 1990.
The effect of sire type, company source, feeding regime and sex on eating
quality of pig meat. Animal Production. 50:560 (Abstract).
48. WARKUP, C.C., AND KEMPSTER, A.J. 1991. A possible explanation of the
variation in tenderness and juiciness in pig meat. Animal Production. 52:559
(Abstract).
49. WARRISS, P.D., and BROWN, S.N. 1983. The influence of preslaughter fasting
on carcass and liver yield in pigs. Livestock Production Science 10:273-282.
50. WOOD, J.D., JONES, R.C.D., FRANCOMBE, M.A. and WHELEHAN, O.P. 1995.
Comparison of factors affecting the tenderness of pigmeat. Animal Science.
60:561 (Abstract).
51. WOOD, J.D., ENSER,M., WHITTINGTON, F.M. MONCRIEFF, C.B. & KEMPSTER,
A.J. 1989. Backfat composition in pigs:differences between fat thickness
groups and sexes. Livestock Production Science. 22:351-362.
52. WOOD, J.D., JONES, R.C.D., FRANCOMBE, M.A. and WHELEHAN, O.P. 1986.
The effect of fat thickness and sex on pig meat quality with special reference
to the problems associated with overleaness. 2. Laboratory and trained taste
panel results. Animal Production. 43:535-544.
60 Simpósio sobre Rendimento e Qualidade da Carne Suína -15 e 16 de setembro/98
SSWWIINNEE BBRREEEEDDIINNGG,, SSEEXX,, FFEEEEDDIINNGG RREEGGIIMMEE,, AANNDD SSLLAAUUGGHHTTEERR
WWEEIIGGHHTT AANNDD TTHHEEIIRR EEFFFFEECCTTSS OONN CCAARRCCAASSSS LLEEAANN YYIIEELLDD
Mike Ellis
Professor Of Swine Genetics And Management
Department Of Animal Sciences,
University Of Illinois
IInnttrroodduuccttiioonn
The pressure for producers to improve carcass lean content comes initially from
consumers who in most areas of the world increasingly demand lean pig meat
products. This has led to the introduction of carcass payment schemes based on
lean content in many countries. In addition, the feed energy cost of depositing lean is
significantly less than that for depositing fat and, consequently, producing lean
carcasses results in an improvement in feed efficiency. This is a win-win situation -
lean carcasses cost the producer less to produce and have a greater value because
they meet market requirements.
Schemes to improve carcass lean content have been in place in some countries
for several years. For example, pricing schemes based on carcass lean have been in
operation in the UK for at least 30 years and the average backfat thickness of British
pigs, measured at the P2 position, has been halved over the last 25 years from in
excess of 20 mm to approaching 10 mm currently. However, carcass fat levels are
often higher in other countries with, for example, levels in the US currently averaging
approximately 25 mm and some sources in the meat sector has suggested that the
optimum level for the US market may be around 18 mm. One point to consider is
that even though the commercial optimum may be defined and achieved, there is
considerable variation around the optimum in lean contents among carcases from the
same population and that a significant proportion of carcasses will invariably be too
fat for market requirements and some carcasses may actually be too lean. This is
illustrated by UK data, where the current mean P2 fat depth is around 11 mm but the
range is from approximately 4 mm to 20 mm. It is important to point out that these
measurements of backfat thickness include the skin, and consequently, the extremely
lean carcasses have very little subcutaneous fat.
AApppprrooaacchheess ttoo IInnccrreeaassiinngg LLeeaann YYiieelldd
Broadly speaking, there are three major areas that producers should consider
when trying to improve carcass lean content, namely genetics, nutrition and carcass
modifiers. The factors to consider each of these areas are outlined in Table l.
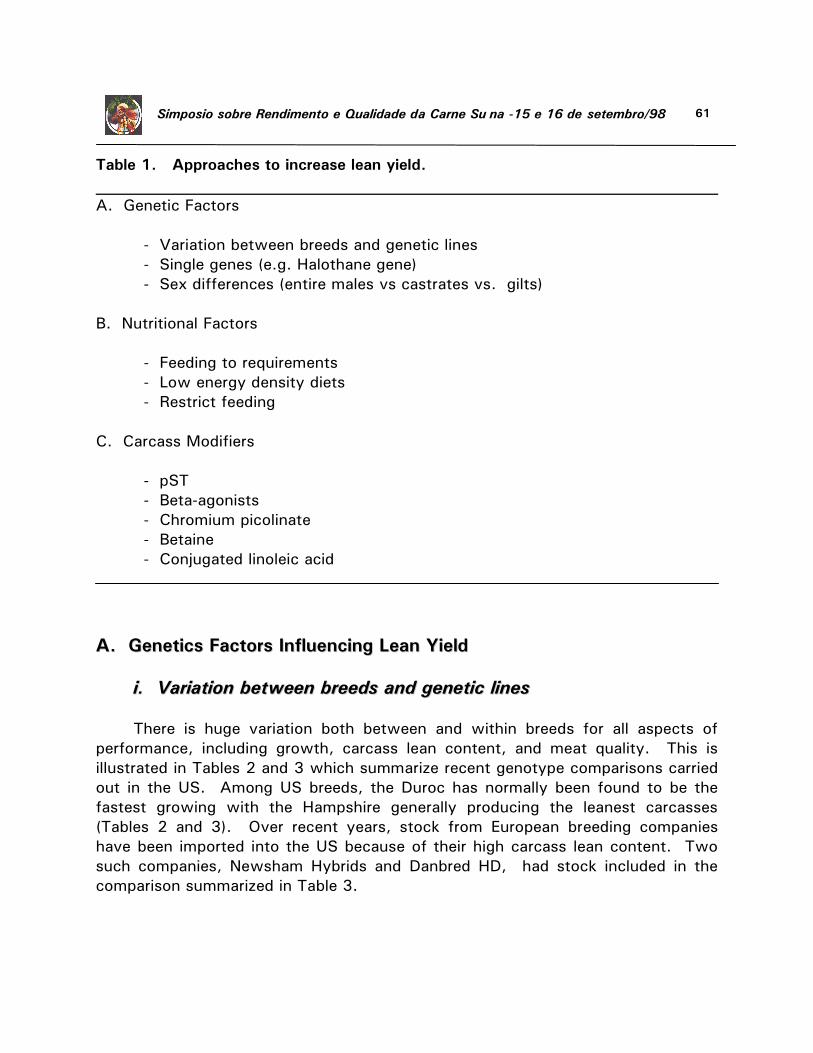
61 Simpósio sobre Rendimento e Qualidade da Carne Suína -15 e 16 de setembro/98
Table 1. Approaches to increase lean yield.
A. Genetic Factors
- Variation between breeds and genetic lines
- Single genes (e.g. Halothane gene)
- Sex differences (entire males vs castrates vs. gilts)
B. Nutritional Factors
- Feeding to requirements
- Low energy density diets
- Restrict feeding
C. Carcass Modifiers
- pST
- Beta-agonists
- Chromium picolinate
- Betaine
- Conjugated linoleic acid
AA.. GGeenneettiiccss FFaaccttoorrss IInnfflluueenncciinngg LLeeaann YYiieelldd
ii.. VVaarriiaattiioonn bbeettwweeeenn bbrreeeeddss aanndd ggeenneettiicc lliinneess
There is huge variation both between and within breeds for all aspects of
performance, including growth, carcass lean content, and meat quality. This is
illustrated in Tables 2 and 3 which summarize recent genotype comparisons carried
out in the US. Among US breeds, the Duroc has normally been found to be the
fastest growing with the Hampshire generally producing the leanest carcasses
(Tables 2 and 3). Over recent years, stock from European breeding companies
have been imported into the US because of their high carcass lean content. Two
such companies, Newsham Hybrids and Danbred HD, had stock included in the
comparison summarized in Table 3.

62 Simpósio sobre Rendimento e Qualidade da Carne Suína -15 e 16 de setembro/98
Table 2. Breed differences in growth, carcass and meat quality (from National Pork Producers Council, 1994).
Av.daily
gain, g
Backfat
depth
10th rib
(mm)
Loin
eye
area
(cm2)
Ultimate
pH
Intra-
muscular
fat (%)
Shear
force
(kg)
Taste Panel1
Juiciness
Tenderness
Berkshire
754
29.5
32.8
5.90
3.24
5.79
3.1
3.5
Chester White
735
30.5
34.5
5.86
3.13
5.92
3.3
3.4
Duroc
804
27.2
34.2
5.73
4.29
5.90
3.3
3.4
Hampshire
735
23.4
39.7
5.57
2.63
6.19
3.3
3.3
Landrace
754
26.2
36.7
5.67
2.49
6.38
3.1
3.1
Poland China
758
28.7
34.7
5.74
3.22
6.54
3.1
3.0
Spot
740
28.7
34.9
5.72
3.09
6.51
3.0
3.0
Yorkshire
745
26.7
35.4
5.72
2.48
6.39
3.0
3.1
1 higher values = more tender and juicier.
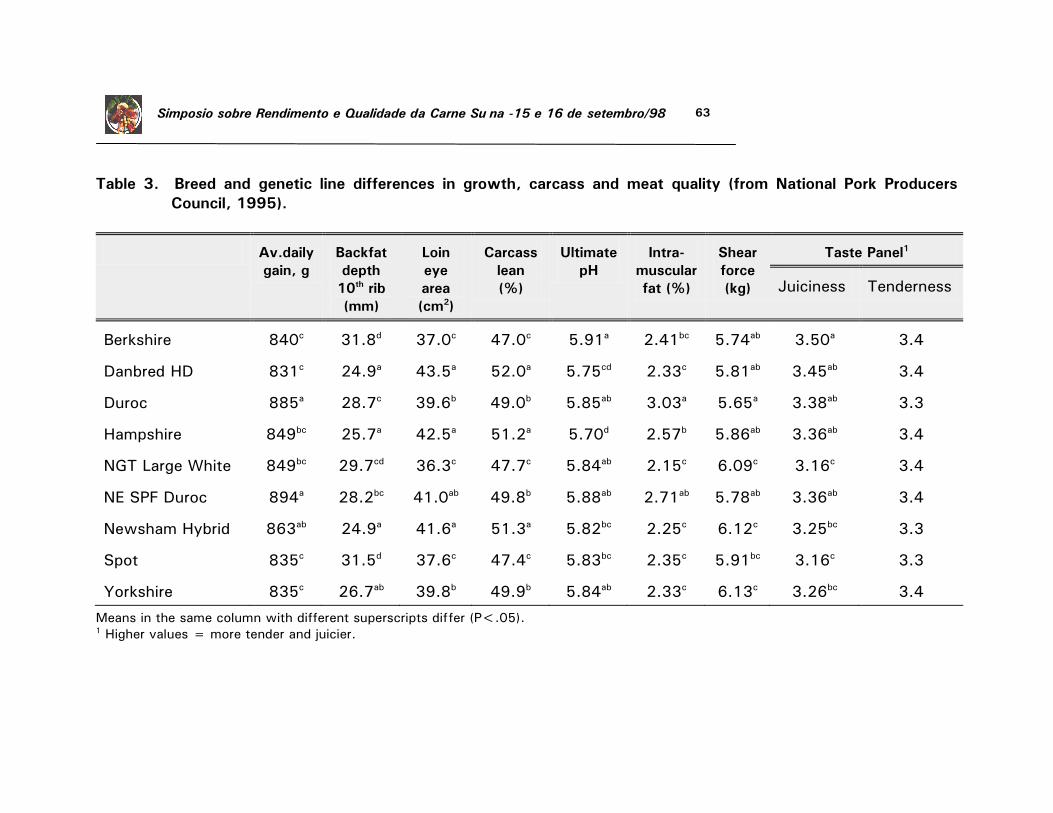
63 Simpósio sobre Rendimento e Qualidade da Carne Suína -15 e 16 de setembro/98
Table 3. Breed and genetic line differences in growth, carcass and meat quality (from National Pork Producers
Council, 1995).
Av.daily
gain, g
Backfat
depth
10th rib
(mm)
Loin
eye
area
(cm2)
Carcass
lean
(%)
Ultimate
pH
Intra-
muscular
fat (%)
Shear
force
(kg)
Taste Panel1
Juiciness
Tenderness
Berkshire
840c
31.8d
37.0c
47.0c
5.91a
2.41bc
5.74ab
3.50a
3.4
Danbred HD
831c
24.9a
43.5a
52.0a
5.75cd
2.33c
5.81ab
3.45ab
3.4
Duroc
885a
28.7c
39.6b
49.0b
5.85ab
3.03a
5.65a
3.38ab
3.3
Hampshire
849bc
25.7a
42.5a
51.2a
5.70d
2.57b
5.86ab
3.36ab
3.4
NGT Large White
849bc
29.7cd
36.3c
47.7c
5.84ab
2.15c
6.09c
3.16c
3.4
NE SPF Duroc
894a
28.2bc
41.0ab
49.8b
5.88ab
2.71ab
5.78ab
3.36ab
3.4
Newsham Hybrid
863ab
24.9a
41.6a
51.3a
5.82bc
2.25c
6.12c
3.25bc
3.3
Spot
835c
31.5d
37.6c
47.4c
5.83bc
2.35c
5.91bc
3.16c
3.3
Yorkshire
835c
26.7ab
39.8b
49.9b
5.84ab
2.33c
6.13c
3.26bc
3.4
Means in the same column with different superscripts differ (P<.05). 1 Higher values = more tender and juicier.

57 Simpósio sobre Rendimento e Qualidade da Carne Suína -15 e 16 de setembro/98

58 Simpósio sobre Rendimento e Qualidade da Carne Suína -15 e 16 de setembro/98
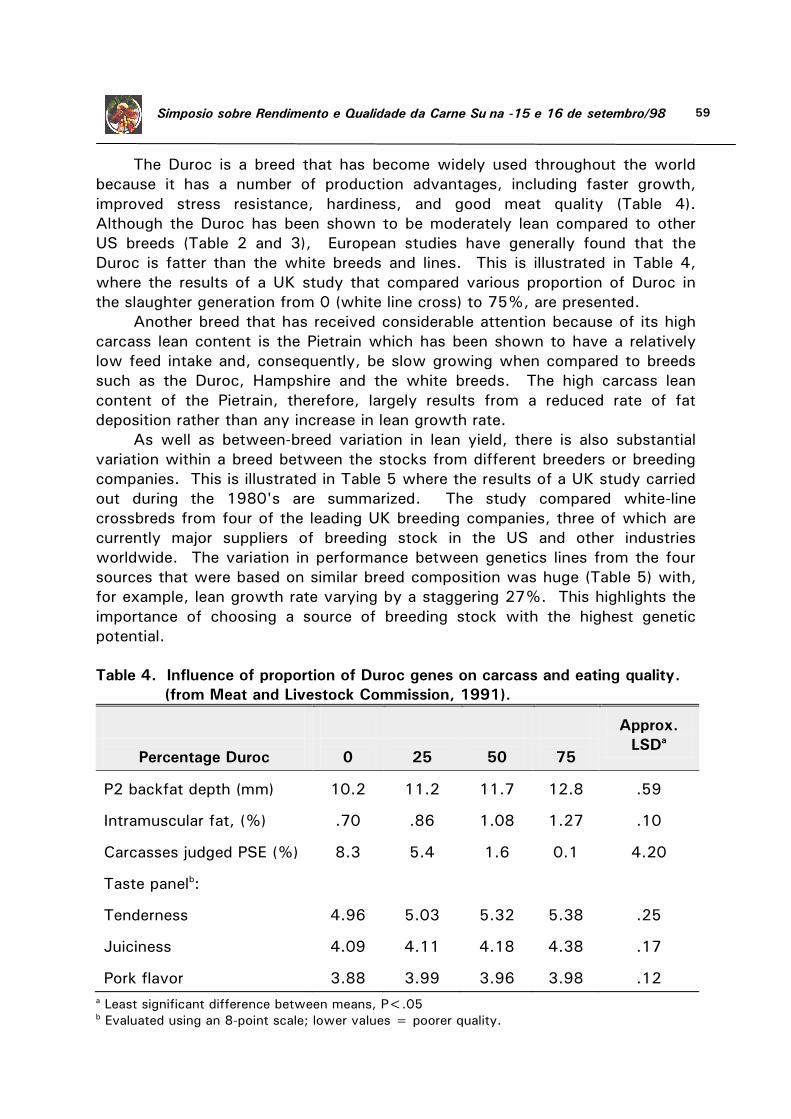
59 Simpósio sobre Rendimento e Qualidade da Carne Suína -15 e 16 de setembro/98
The Duroc is a breed that has become widely used throughout the world
because it has a number of production advantages, including faster growth,
improved stress resistance, hardiness, and good meat quality (Table 4).
Although the Duroc has been shown to be moderately lean compared to other
US breeds (Table 2 and 3), European studies have generally found that the
Duroc is fatter than the white breeds and lines. This is illustrated in Table 4,
where the results of a UK study that compared various proportion of Duroc in
the slaughter generation from 0 (white line cross) to 75%, are presented.
Another breed that has received considerable attention because of its high
carcass lean content is the Pietrain which has been shown to have a relatively
low feed intake and, consequently, be slow growing when compared to breeds
such as the Duroc, Hampshire and the white breeds. The high carcass lean
content of the Pietrain, therefore, largely results from a reduced rate of fat
deposition rather than any increase in lean growth rate.
As well as between-breed variation in lean yield, there is also substantial
variation within a breed between the stocks from different breeders or breeding
companies. This is illustrated in Table 5 where the results of a UK study carried
out during the 1980's are summarized. The study compared white-line
crossbreds from four of the leading UK breeding companies, three of which are
currently major suppliers of breeding stock in the US and other industries
worldwide. The variation in performance between genetics lines from the four
sources that were based on similar breed composition was huge (Table 5) with,
for example, lean growth rate varying by a staggering 27%. This highlights the
importance of choosing a source of breeding stock with the highest genetic
potential.
Table 4. Influence of proportion of Duroc genes on carcass and eating quality.
(from Meat and Livestock Commission, 1991).
Approx.
LSDa Percentage Duroc
0
25
50
75
P2 backfat depth (mm)
10.2
11.2
11.7
12.8
.59
Intramuscular fat, (%)
.70
.86
1.08
1.27
.10
Carcasses judged PSE (%)
8.3
5.4
1.6
0.1
4.20
Taste panelb: Tenderness
4.96
5.03
5.32
5.38
.25
Juiciness
4.09
4.11
4.18
4.38
.17
Pork flavor
3.88
3.99
3.96
3.98
.12
a Least significant difference between means, P<.05 b Evaluated using an 8-point scale; lower values = poorer quality.
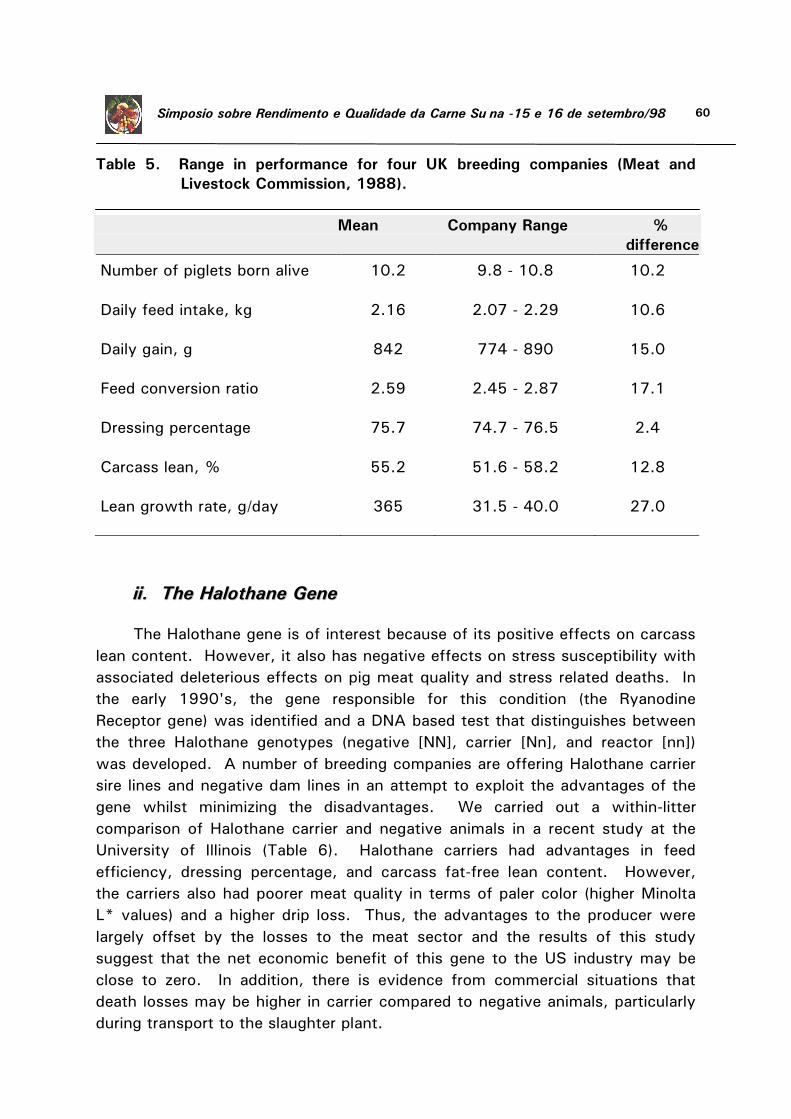
60 Simpósio sobre Rendimento e Qualidade da Carne Suína -15 e 16 de setembro/98
Table 5. Range in performance for four UK breeding companies (Meat and
Livestock Commission, 1988).
Mean Company Range %
difference
Number of piglets born alive
10.2 9.8 - 10.8 10.2
Daily feed intake, kg
2.16 2.07 - 2.29 10.6
Daily gain, g
842 774 - 890 15.0
Feed conversion ratio
2.59 2.45 - 2.87 17.1
Dressing percentage
75.7 74.7 - 76.5 2.4
Carcass lean, %
55.2 51.6 - 58.2 12.8
Lean growth rate, g/day
365 31.5 - 40.0 27.0
iiii.. TThhee HHaallootthhaannee GGeennee
The Halothane gene is of interest because of its positive effects on carcass
lean content. However, it also has negative effects on stress susceptibility with
associated deleterious effects on pig meat quality and stress related deaths. In
the early 1990's, the gene responsible for this condition (the Ryanodine
Receptor gene) was identified and a DNA based test that distinguishes between
the three Halothane genotypes (negative [NN], carrier [Nn], and reactor [nn])
was developed. A number of breeding companies are offering Halothane carrier
sire lines and negative dam lines in an attempt to exploit the advantages of the
gene whilst minimizing the disadvantages. We carried out a within-litter
comparison of Halothane carrier and negative animals in a recent study at the
University of Illinois (Table 6). Halothane carriers had advantages in feed
efficiency, dressing percentage, and carcass fat-free lean content. However,
the carriers also had poorer meat quality in terms of paler color (higher Minolta
L* values) and a higher drip loss. Thus, the advantages to the producer were
largely offset by the losses to the meat sector and the results of this study
suggest that the net economic benefit of this gene to the US industry may be
close to zero. In addition, there is evidence from commercial situations that
death losses may be higher in carrier compared to negative animals, particularly
during transport to the slaughter plant.
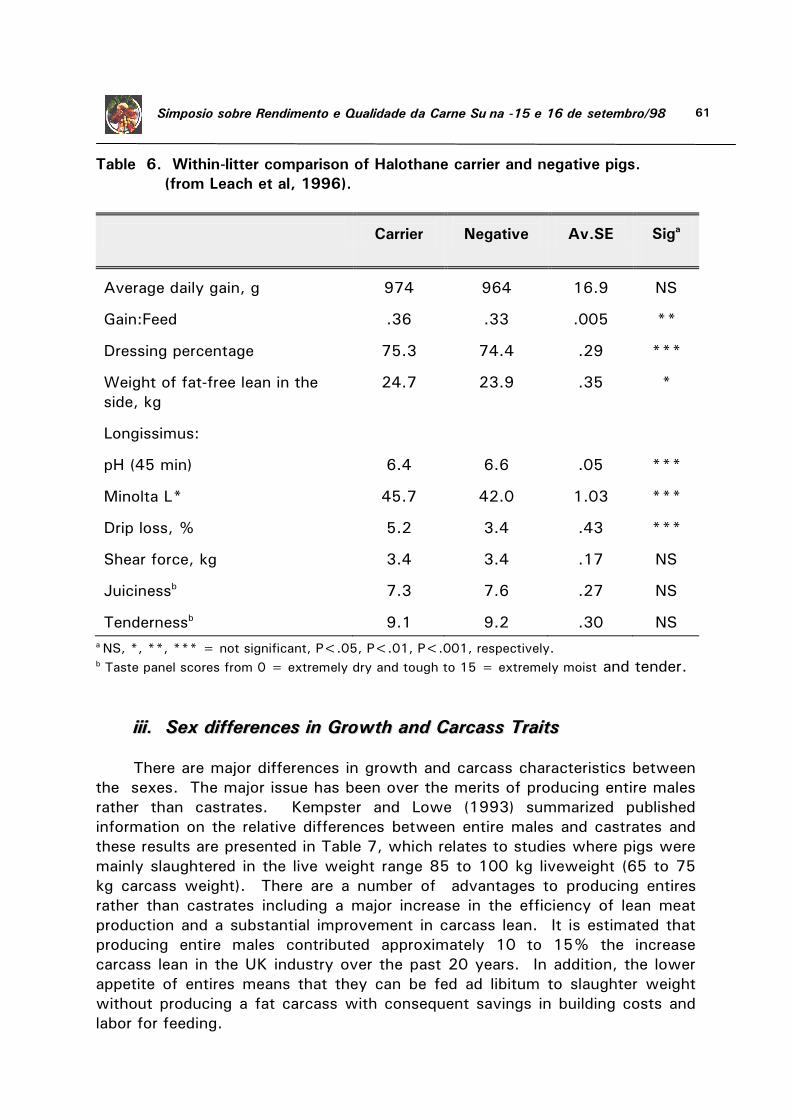
61 Simpósio sobre Rendimento e Qualidade da Carne Suína -15 e 16 de setembro/98
Table 6. Within-litter comparison of Halothane carrier and negative pigs.
(from Leach et al, 1996).
Carrier
Negative
Av.SE
Siga
Average daily gain, g
974
964
16.9
NS
Gain:Feed
.36
.33
.005
**
Dressing percentage
75.3
74.4
.29
***
Weight of fat-free lean in the
side, kg
24.7
23.9
.35
*
Longissimus: pH (45 min)
6.4
6.6
.05
***
Minolta L*
45.7
42.0
1.03
***
Drip loss, %
5.2
3.4
.43
***
Shear force, kg
3.4
3.4
.17
NS
Juicinessb
7.3
7.6
.27
NS
Tendernessb
9.1
9.2
.30
NS
a NS, *, **, *** = not significant, P<.05, P<.01, P<.001, respectively. b Taste panel scores from 0 = extremely dry and tough to 15 = extremely moist and tender.
iiiiii.. SSeexx ddiiffffeerreenncceess iinn GGrroowwtthh aanndd CCaarrccaassss TTrraaiittss
There are major differences in growth and carcass characteristics between
the sexes. The major issue has been over the merits of producing entire males
rather than castrates. Kempster and Lowe (1993) summarized published
information on the relative differences between entire males and castrates and
these results are presented in Table 7, which relates to studies where pigs were
mainly slaughtered in the live weight range 85 to 100 kg liveweight (65 to 75
kg carcass weight). There are a number of advantages to producing entires
rather than castrates including a major increase in the efficiency of lean meat
production and a substantial improvement in carcass lean. It is estimated that
producing entire males contributed approximately 10 to 15% the increase
carcass lean in the UK industry over the past 20 years. In addition, the lower
appetite of entires means that they can be fed ad libitum to slaughter weight
without producing a fat carcass with consequent savings in building costs and
labor for feeding.
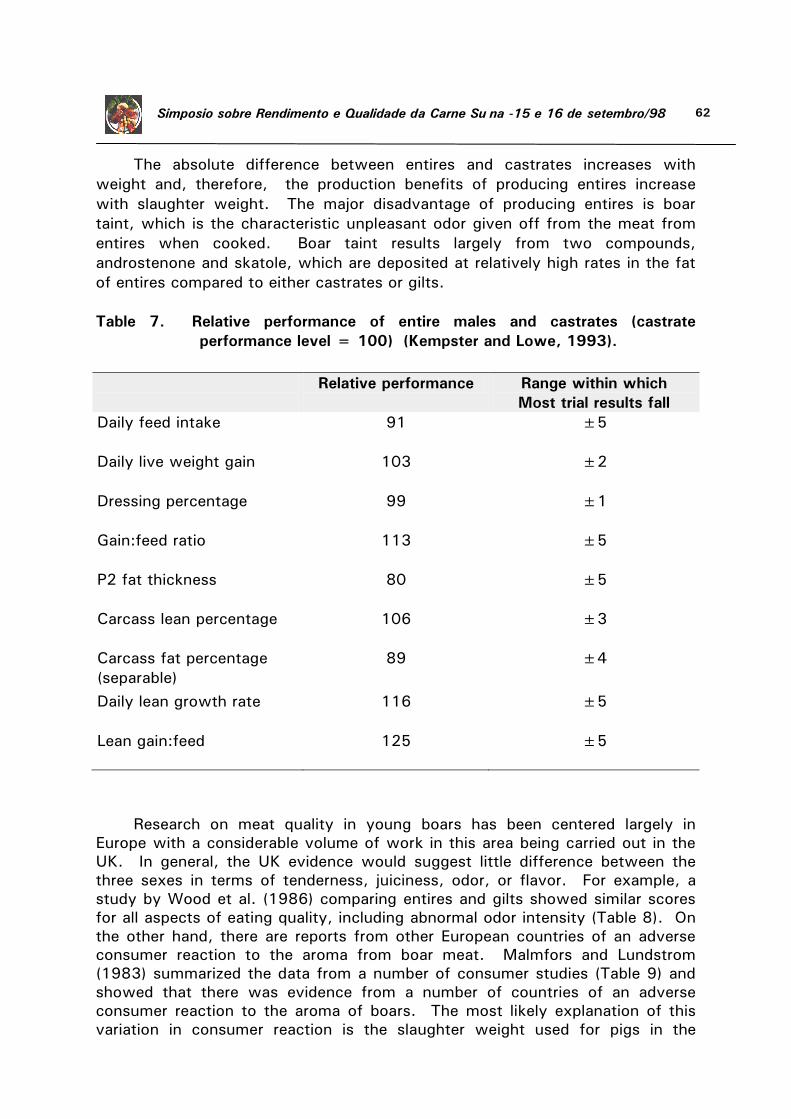
62 Simpósio sobre Rendimento e Qualidade da Carne Suína -15 e 16 de setembro/98
The absolute difference between entires and castrates increases with
weight and, therefore, the production benefits of producing entires increase
with slaughter weight. The major disadvantage of producing entires is boar
taint, which is the characteristic unpleasant odor given off from the meat from
entires when cooked. Boar taint results largely from two compounds,
androstenone and skatole, which are deposited at relatively high rates in the fat
of entires compared to either castrates or gilts.
Table 7. Relative performance of entire males and castrates (castrate
performance level = 100) (Kempster and Lowe, 1993).
Relative performance Range within which
Most trial results fall
Daily feed intake
91 ±5
Daily live weight gain
103
±2
Dressing percentage
99 ±1
Gain:feed ratio
113 ±5
P2 fat thickness
80 ±5
Carcass lean percentage
106 ±3
Carcass fat percentage
(separable)
89 ±4
Daily lean growth rate
116 ±5
Lean gain:feed
125 ±5
Research on meat quality in young boars has been centered largely in
Europe with a considerable volume of work in this area being carried out in the
UK. In general, the UK evidence would suggest little difference between the
three sexes in terms of tenderness, juiciness, odor, or flavor. For example, a
study by Wood et al. (1986) comparing entires and gilts showed similar scores
for all aspects of eating quality, including abnormal odor intensity (Table 8). On
the other hand, there are reports from other European countries of an adverse
consumer reaction to the aroma from boar meat. Malmfors and Lundstrom
(1983) summarized the data from a number of consumer studies (Table 9) and
showed that there was evidence from a number of countries of an adverse
consumer reaction to the aroma of boars. The most likely explanation of this
variation in consumer reaction is the slaughter weight used for pigs in the
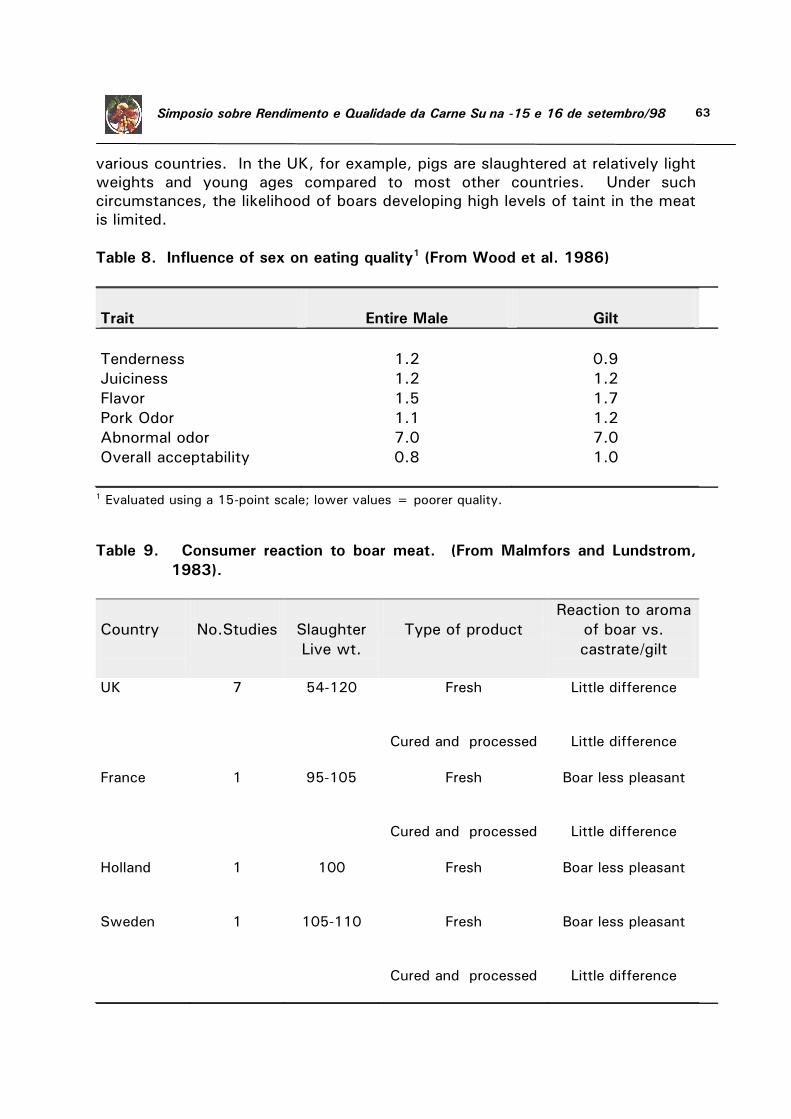
63 Simpósio sobre Rendimento e Qualidade da Carne Suína -15 e 16 de setembro/98
various countries. In the UK, for example, pigs are slaughtered at relatively light
weights and young ages compared to most other countries. Under such
circumstances, the likelihood of boars developing high levels of taint in the meat
is limited.
Table 8. Influence of sex on eating quality1 (From Wood et al. 1986)
Trait Entire Male Gilt
Tenderness 1.2 0.9
Juiciness 1.2 1.2
Flavor 1.5 1.7
Pork Odor 1.1 1.2
Abnormal odor 7.0 7.0
Overall acceptability
0.8 1.0
1 Evaluated using a 15-point scale; lower values = poorer quality.
Table 9. Consumer reaction to boar meat. (From Malmfors and Lundstrom,
1983).
Country
No.Studies
Slaughter
Live wt.
Type of product
Reaction to aroma
of boar vs.
castrate/gilt
UK
7 54-120 Fresh Little difference
Cured and processed Little difference
France
1 95-105 Fresh Boar less pleasant
Cured and processed Little difference
Holland
1 100 Fresh Boar less pleasant
Sweden
1 105-110 Fresh Boar less pleasant
Cured and processed Little difference
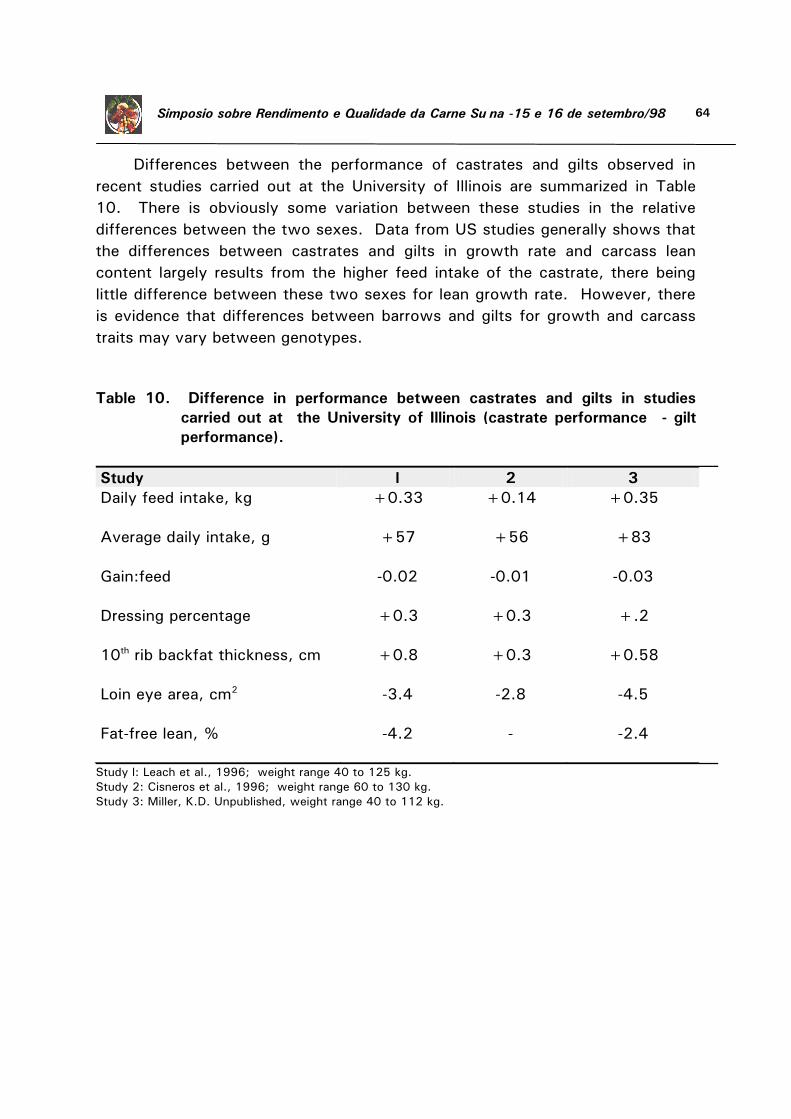
64 Simpósio sobre Rendimento e Qualidade da Carne Suína -15 e 16 de setembro/98
Differences between the performance of castrates and gilts observed in
recent studies carried out at the University of Illinois are summarized in Table
10. There is obviously some variation between these studies in the relative
differences between the two sexes. Data from US studies generally shows that
the differences between castrates and gilts in growth rate and carcass lean
content largely results from the higher feed intake of the castrate, there being
little difference between these two sexes for lean growth rate. However, there
is evidence that differences between barrows and gilts for growth and carcass
traits may vary between genotypes.
Table 10. Difference in performance between castrates and gilts in studies
carried out at the University of Illinois (castrate performance - gilt
performance).
Study l 2 3
Daily feed intake, kg
+0.33 +0.14 +0.35
Average daily intake, g
+57 +56 +83
Gain:feed
-0.02 -0.01 -0.03
Dressing percentage
+0.3 +0.3 +.2
10th rib backfat thickness, cm
+0.8 +0.3 +0.58
Loin eye area, cm2
-3.4 -2.8 -4.5
Fat-free lean, %
-4.2 - -2.4
Study l: Leach et al., 1996; weight range 40 to 125 kg.
Study 2: Cisneros et al., 1996; weight range 60 to 130 kg.
Study 3: Miller, K.D. Unpublished, weight range 40 to 112 kg.
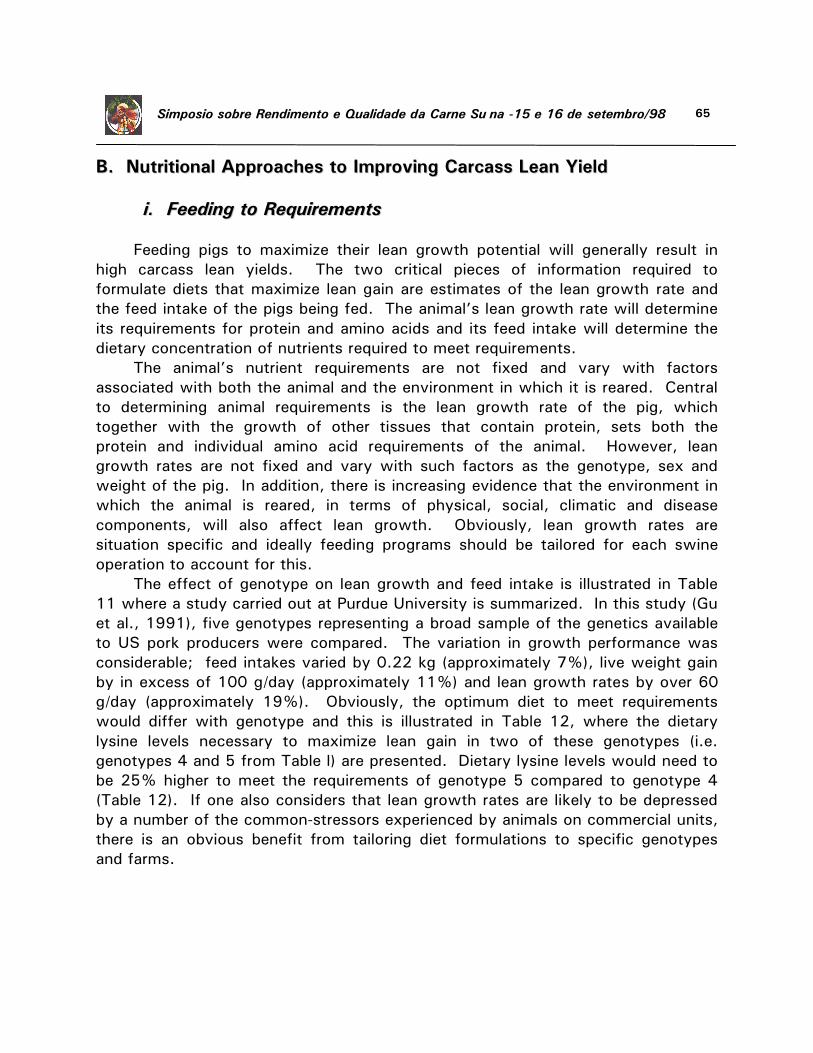
65 Simpósio sobre Rendimento e Qualidade da Carne Suína -15 e 16 de setembro/98
BB.. NNuuttrriittiioonnaall AApppprrooaacchheess ttoo IImmpprroovviinngg CCaarrccaassss LLeeaann YYiieelldd
ii.. FFeeeeddiinngg ttoo RReeqquuiirreemmeennttss
Feeding pigs to maximize their lean growth potential will generally result in
high carcass lean yields. The two critical pieces of information required to
formulate diets that maximize lean gain are estimates of the lean growth rate and
the feed intake of the pigs being fed. The animal’s lean growth rate will determine
its requirements for protein and amino acids and its feed intake will determine the
dietary concentration of nutrients required to meet requirements.
The animal’s nutrient requirements are not fixed and vary with factors
associated with both the animal and the environment in which it is reared. Central
to determining animal requirements is the lean growth rate of the pig, which
together with the growth of other tissues that contain protein, sets both the
protein and individual amino acid requirements of the animal. However, lean
growth rates are not fixed and vary with such factors as the genotype, sex and
weight of the pig. In addition, there is increasing evidence that the environment in
which the animal is reared, in terms of physical, social, climatic and disease
components, will also affect lean growth. Obviously, lean growth rates are
situation specific and ideally feeding programs should be tailored for each swine
operation to account for this.
The effect of genotype on lean growth and feed intake is illustrated in Table
11 where a study carried out at Purdue University is summarized. In this study (Gu
et al., 1991), five genotypes representing a broad sample of the genetics available
to US pork producers were compared. The variation in growth performance was
considerable; feed intakes varied by 0.22 kg (approximately 7%), live weight gain
by in excess of 100 g/day (approximately 11%) and lean growth rates by over 60
g/day (approximately 19%). Obviously, the optimum diet to meet requirements
would differ with genotype and this is illustrated in Table 12, where the dietary
lysine levels necessary to maximize lean gain in two of these genotypes (i.e.
genotypes 4 and 5 from Table l) are presented. Dietary lysine levels would need to
be 25% higher to meet the requirements of genotype 5 compared to genotype 4
(Table 12). If one also considers that lean growth rates are likely to be depressed
by a number of the common-stressors experienced by animals on commercial units,
there is an obvious benefit from tailoring diet formulations to specific genotypes
and farms.
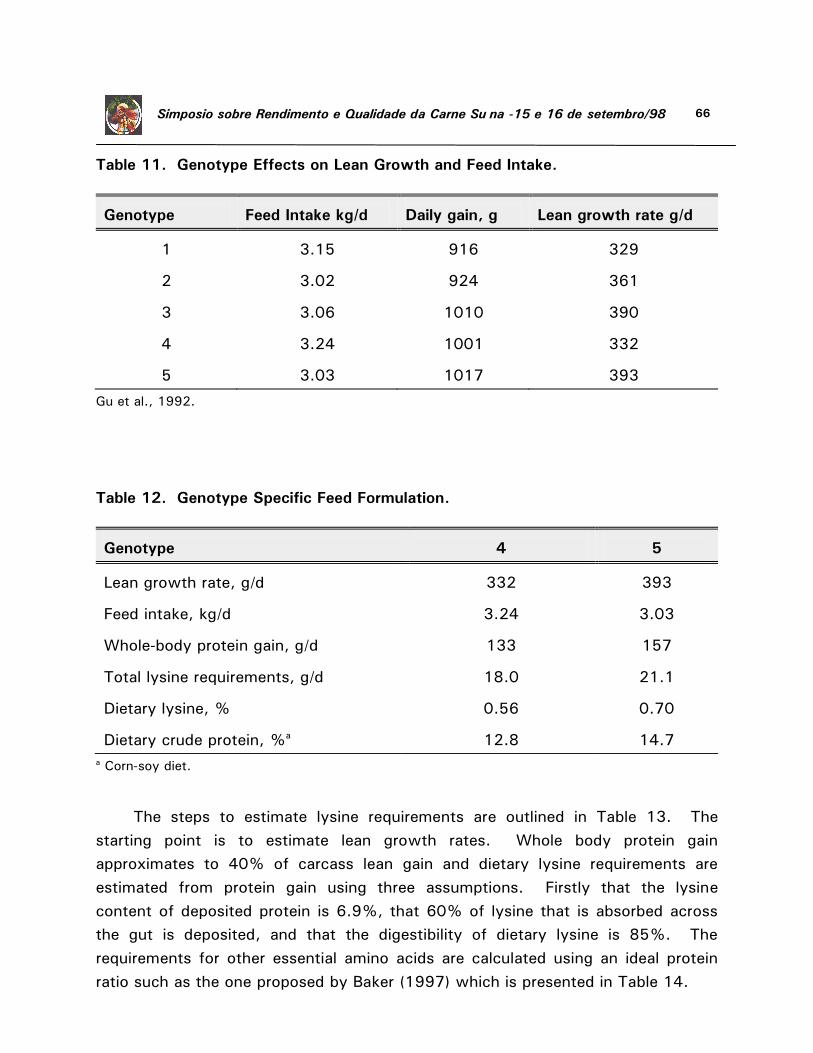
66 Simpósio sobre Rendimento e Qualidade da Carne Suína -15 e 16 de setembro/98
Table 11. Genotype Effects on Lean Growth and Feed Intake.
Genotype
Feed Intake kg/d
Daily gain, g
Lean growth rate g/d
1
3.15
916
329
2
3.02
924
361
3
3.06
1010
390
4
3.24
1001
332
5
3.03
1017
393
Gu et al., 1992.
Table 12. Genotype Specific Feed Formulation.
Genotype
4
5
Lean growth rate, g/d
332
393
Feed intake, kg/d
3.24
3.03
Whole-body protein gain, g/d
133
157
Total lysine requirements, g/d
18.0
21.1
Dietary lysine, %
0.56
0.70
Dietary crude protein, %a
12.8
14.7
a Corn-soy diet.
The steps to estimate lysine requirements are outlined in Table 13. The
starting point is to estimate lean growth rates. Whole body protein gain
approximates to 40% of carcass lean gain and dietary lysine requirements are
estimated from protein gain using three assumptions. Firstly that the lysine
content of deposited protein is 6.9%, that 60% of lysine that is absorbed across
the gut is deposited, and that the digestibility of dietary lysine is 85%. The
requirements for other essential amino acids are calculated using an ideal protein
ratio such as the one proposed by Baker (1997) which is presented in Table 14.
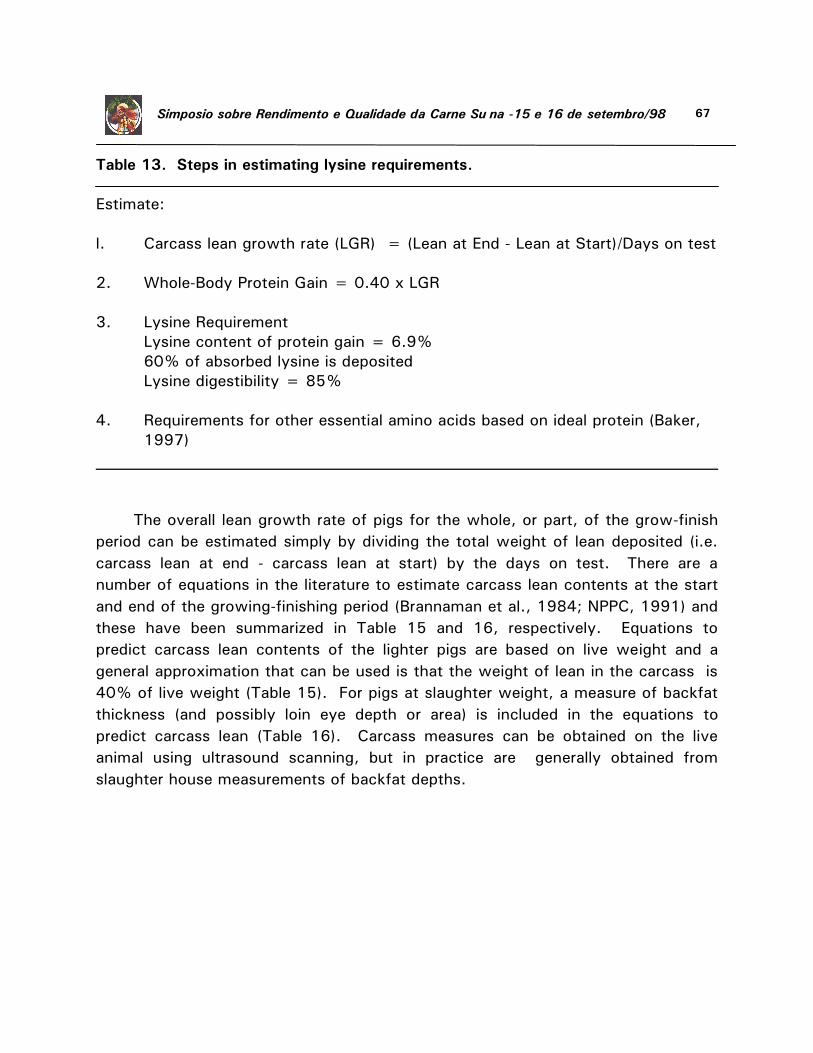
67 Simpósio sobre Rendimento e Qualidade da Carne Suína -15 e 16 de setembro/98
Table 13. Steps in estimating lysine requirements.
Estimate:
l. Carcass lean growth rate (LGR) = (Lean at End - Lean at Start)/Days on test
2. Whole-Body Protein Gain = 0.40 x LGR
3. Lysine Requirement
Lysine content of protein gain = 6.9%
60% of absorbed lysine is deposited
Lysine digestibility = 85%
4. Requirements for other essential amino acids based on ideal protein (Baker,
1997)
The overall lean growth rate of pigs for the whole, or part, of the grow-finish
period can be estimated simply by dividing the total weight of lean deposited (i.e.
carcass lean at end - carcass lean at start) by the days on test. There are a
number of equations in the literature to estimate carcass lean contents at the start
and end of the growing-finishing period (Brannaman et al., 1984; NPPC, 1991) and
these have been summarized in Table 15 and 16, respectively. Equations to
predict carcass lean contents of the lighter pigs are based on live weight and a
general approximation that can be used is that the weight of lean in the carcass is
40% of live weight (Table 15). For pigs at slaughter weight, a measure of backfat
thickness (and possibly loin eye depth or area) is included in the equations to
predict carcass lean (Table 16). Carcass measures can be obtained on the live
animal using ultrasound scanning, but in practice are generally obtained from
slaughter house measurements of backfat depths.
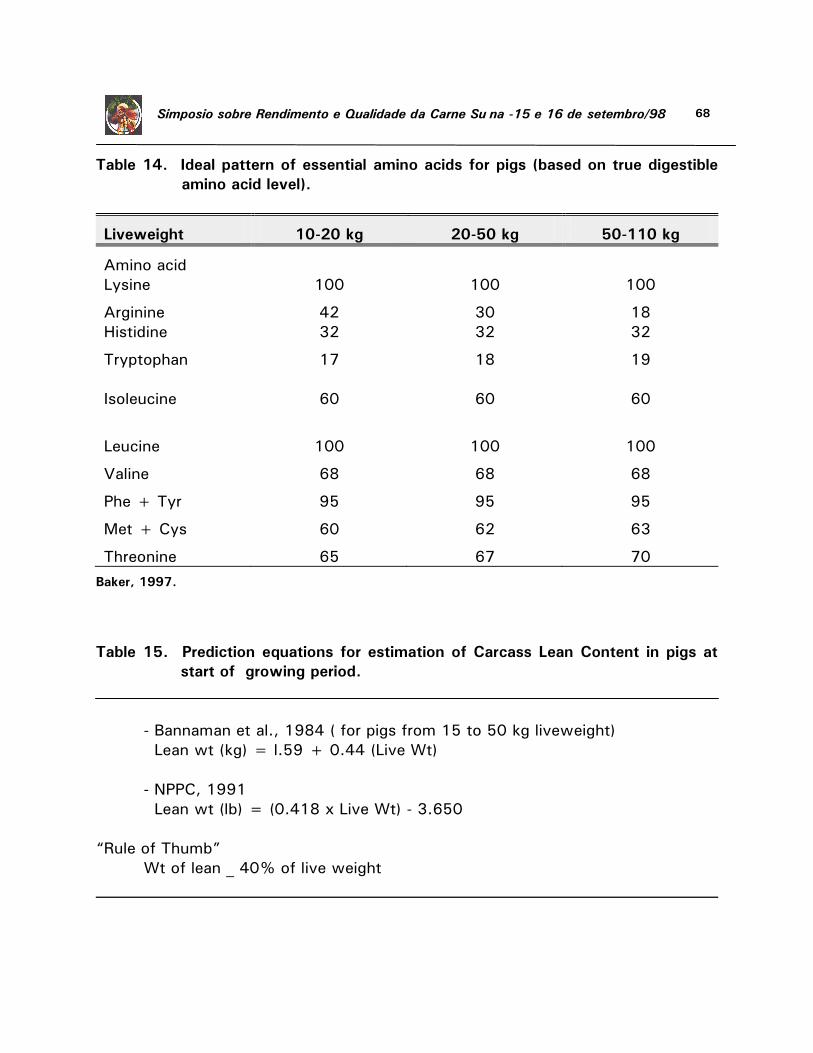
68 Simpósio sobre Rendimento e Qualidade da Carne Suína -15 e 16 de setembro/98
Table 14. Ideal pattern of essential amino acids for pigs (based on true digestible
amino acid level).
Liveweight
10-20 kg
20-50 kg
50-110 kg
Amino acid
Lysine
100
100
100 Arginine
Histidine
42
32
30
32
18
32 Tryptophan
Isoleucine
17
60
18
60
19
60
Leucine
100
100
100
Valine
68
68
68
Phe + Tyr
95
95
95
Met + Cys
60
62
63
Threonine
65
67
70
Baker, 1997.
Table 15. Prediction equations for estimation of Carcass Lean Content in pigs at
start of growing period.
- Bannaman et al., 1984 ( for pigs from 15 to 50 kg liveweight)
Lean wt (kg) = l.59 + 0.44 (Live Wt)
- NPPC, 1991
Lean wt (lb) = (0.418 x Live Wt) - 3.650
“Rule of Thumb”
Wt of lean _ 40% of live weight

69 Simpósio sobre Rendimento e Qualidade da Carne Suína -15 e 16 de setembro/98
Table 16. Generalized equations to predict carcass fat-free lean at slaughter
(NPPC, 1991).
From fat-0-meater measurement
FFL = 51.537 + [0.035 x HCW (lb)] - [12.260 x FOM(in)]
From last-rib ruler backfat (midline) measurement:
FFL = 50.767 + [0.035 x HCW] - [8.979 x LR fat)
Estimation of overall lean growth rates obviously gives one value for the
whole of the growth period and has the advantages of being simple to derive and if
the carcass measurements are obtained from the slaughter plant, the data is easy
and cheap to collect. In addition, slaughter plant data are collected by direct
measurements on the carcass rather than indirect measurement on the live animal.
However, there are a number of possible disadvantages to such an approach,
including the potential for biases in predicting carcass lean content from generalized
equations (discussed below). In addition, carcass weights and backfat measures
are not taken in a standardized way across slaughter plants and this may introduce
errors in prediction of carcass composition. Finally, and most importantly, such an
approach assumes that lean and protein growth is linear across the whole of the
growth period and this not the case. The rate of deposition of lean is curvilinear
being relatively low at lighter weights, increasing to a maximum and then declining.
Some typical protein growth curves are presented in Figure l, which is taken from
Schinckel et al. (1994).
Theoretically, knowledge of the lean growth curve of pigs in a given situation
will allow relatively frequent changes in diet formulation to be made in response to
the animal’s changing requirements for protein. This is particularly the case as
animal approach slaughter weights, at which stage lean growth rates tend to
decline relatively rapidly (Figure l). Adjusting dietary lysine and protein levels to
take account of these reducing requirements can generally result in considerable
savings in feed costs and also reduces nitrogen output in the excreta, an
increasingly important consideration in situation where excess nitrogen outputs are
a problem.
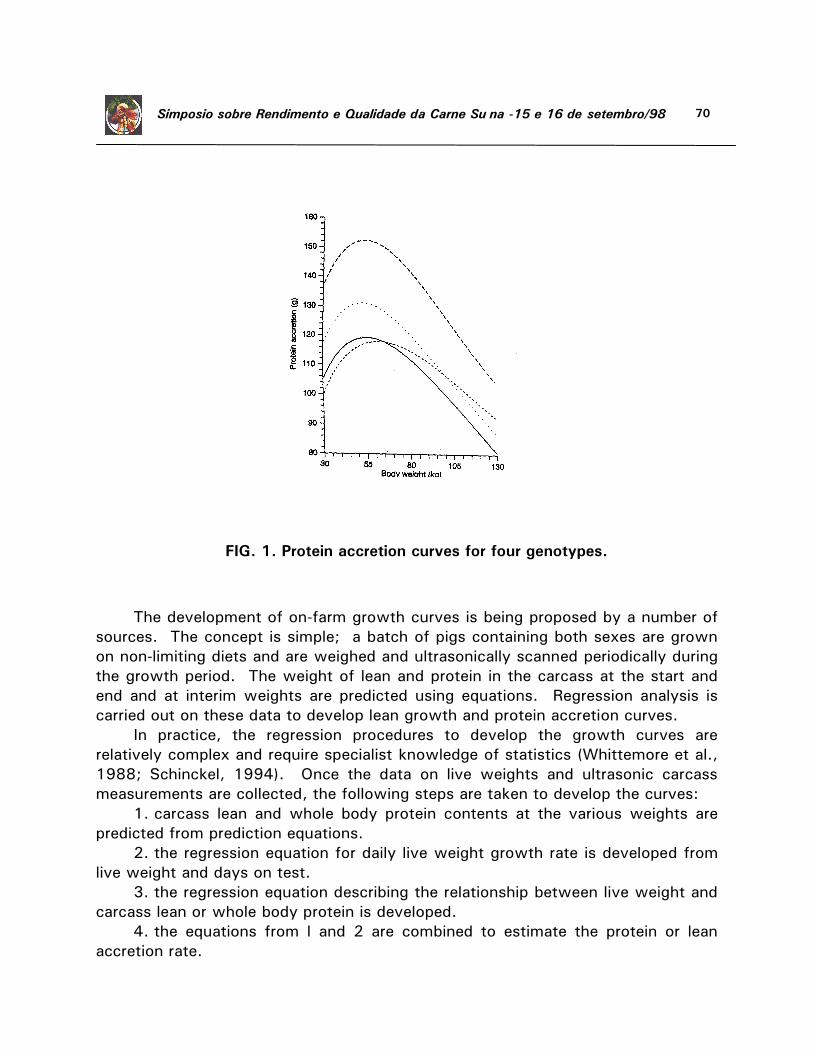
70 Simpósio sobre Rendimento e Qualidade da Carne Suína -15 e 16 de setembro/98
The development of on-farm growth curves is being proposed by a number of
sources. The concept is simple; a batch of pigs containing both sexes are grown
on non-limiting diets and are weighed and ultrasonically scanned periodically during
the growth period. The weight of lean and protein in the carcass at the start and
end and at interim weights are predicted using equations. Regression analysis is
carried out on these data to develop lean growth and protein accretion curves.
In practice, the regression procedures to develop the growth curves are
relatively complex and require specialist knowledge of statistics (Whittemore et al.,
1988; Schinckel, 1994). Once the data on live weights and ultrasonic carcass
measurements are collected, the following steps are taken to develop the curves:
1. carcass lean and whole body protein contents at the various weights are
predicted from prediction equations.
2. the regression equation for daily live weight growth rate is developed from
live weight and days on test.
3. the regression equation describing the relationship between live weight and
carcass lean or whole body protein is developed.
4. the equations from l and 2 are combined to estimate the protein or lean
accretion rate.
FIG. 1. Protein accretion curves for four genotypes.
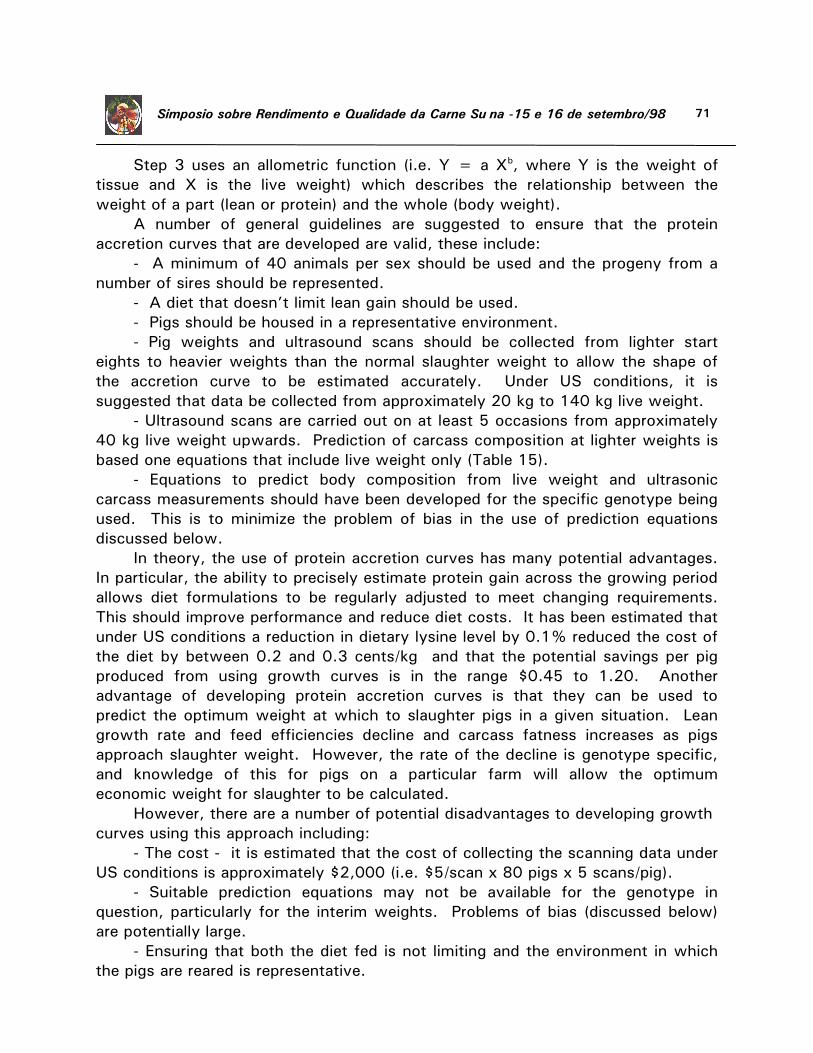
71 Simpósio sobre Rendimento e Qualidade da Carne Suína -15 e 16 de setembro/98
Step 3 uses an allometric function (i.e. Y = a Xb, where Y is the weight of
tissue and X is the live weight) which describes the relationship between the
weight of a part (lean or protein) and the whole (body weight).
A number of general guidelines are suggested to ensure that the protein
accretion curves that are developed are valid, these include:
- A minimum of 40 animals per sex should be used and the progeny from a
number of sires should be represented.
- A diet that doesn’t limit lean gain should be used.
- Pigs should be housed in a representative environment.
- Pig weights and ultrasound scans should be collected from lighter start
eights to heavier weights than the normal slaughter weight to allow the shape of
the accretion curve to be estimated accurately. Under US conditions, it is
suggested that data be collected from approximately 20 kg to 140 kg live weight.
- Ultrasound scans are carried out on at least 5 occasions from approximately
40 kg live weight upwards. Prediction of carcass composition at lighter weights is
based one equations that include live weight only (Table 15).
- Equations to predict body composition from live weight and ultrasonic
carcass measurements should have been developed for the specific genotype being
used. This is to minimize the problem of bias in the use of prediction equations
discussed below.
In theory, the use of protein accretion curves has many potential advantages.
In particular, the ability to precisely estimate protein gain across the growing period
allows diet formulations to be regularly adjusted to meet changing requirements.
This should improve performance and reduce diet costs. It has been estimated that
under US conditions a reduction in dietary lysine level by 0.1% reduced the cost of
the diet by between 0.2 and 0.3 cents/kg and that the potential savings per pig
produced from using growth curves is in the range $0.45 to 1.20. Another
advantage of developing protein accretion curves is that they can be used to
predict the optimum weight at which to slaughter pigs in a given situation. Lean
growth rate and feed efficiencies decline and carcass fatness increases as pigs
approach slaughter weight. However, the rate of the decline is genotype specific,
and knowledge of this for pigs on a particular farm will allow the optimum
economic weight for slaughter to be calculated.
However, there are a number of potential disadvantages to developing growth
curves using this approach including:
- The cost - it is estimated that the cost of collecting the scanning data under
US conditions is approximately $2,000 (i.e. $5/scan x 80 pigs x 5 scans/pig).
- Suitable prediction equations may not be available for the genotype in
question, particularly for the interim weights. Problems of bias (discussed below)
are potentially large.
- Ensuring that both the diet fed is not limiting and the environment in which
the pigs are reared is representative.
72 Simpósio sobre Rendimento e Qualidade da Carne Suína -15 e 16 de setembro/98
- Requires some basic knowledge of statistical procedures, particularly
regression and also access to a computer and basic statistical software.
- The information is retrospective and if something changes on the unit that
influences lean/protein growth then the information may not be accurate. For
example, if the climate changes dramatically between the seasons, this may have a
dramatic effect on lean growth and would invalidate growth curves developed
under different climatic conditions.
- The initial improvements from applying growth curves can be large,
particularly in situations where the diets currently fed on the farm are substantially
out of line with animal requirements. However, the subsequent development of
lean growth curves may only result in fine-tuning of the diets and may not justify
the cost.
- Perhaps the major limitation is that this approach has not been fully
evaluated in comparison with other simpler approaches and is, therefore, not a
technology that has been proven under field conditions.
A potential problem with any approach that uses prediction equations is that
of bias, which is defined as the difference between measured values and those
predicted from equations. The use of prediction equations such as those presented
in Table 15 and 16 can result in significant bias, particularly if they are used in
populations that differ substantially from the one in which the equations were
developed.
Schinckel (unpublished data) using the data of Gu et al. (1992), has shown
that bias in predicting the carcass lean contents of different genotypes at
approximately 20 kg can result in errors in calculating overall lean growth rates
between 20 to 25 g/day. This is equivalent to an error of approximately 8% for
overall lean growth rates averaging 300 g/day. Biases can be much larger when
predicting carcass lean content at slaughter weights, particularly where equations
from other sources are used and the lean content of the test group is outside the
range of the population from which the prediction equations were developed. This
is illustrated by the study of Wilson (1995) who estimated bias in a range of
genotypes from predicting carcass lean content using the NPPC equation given in
Table 17. The higher the lean content of the genotype, the greater was the bias
(Table 17) with at the extreme, the equation under-predicting carcass lean content
by almost 16 percentage units. This would result in lean growth rates being
underestimated by over 100 g/day for the leaner genotypes. The best approach
to minimizing bias in predicting carcass lean content is by using equations
developed for the genotype that is used on the farm, although this is not always
possible.
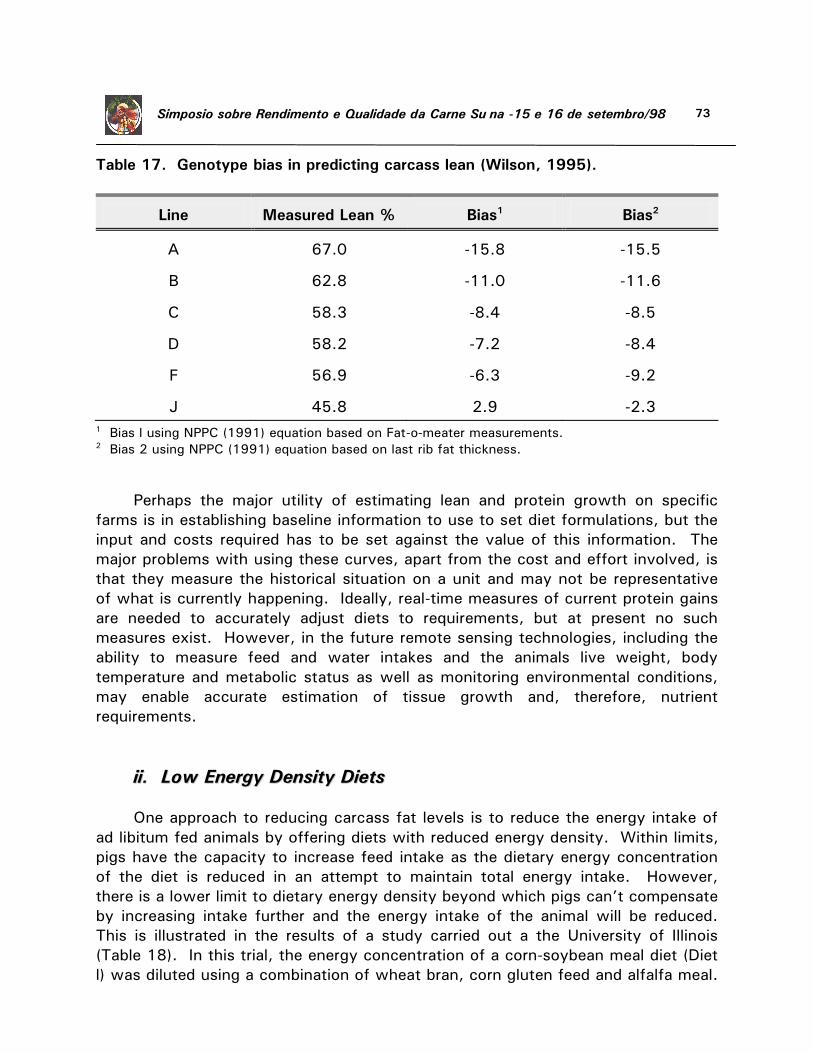
73 Simpósio sobre Rendimento e Qualidade da Carne Suína -15 e 16 de setembro/98
Table 17. Genotype bias in predicting carcass lean (Wilson, 1995).
Line Measured Lean %
Bias1
Bias2
A
67.0
-15.8
-15.5
B
62.8
-11.0
-11.6
C
58.3
-8.4
-8.5
D
58.2
-7.2
-8.4
F
56.9
-6.3
-9.2
J
45.8
2.9
-2.3
1 Bias l using NPPC (1991) equation based on Fat-o-meater measurements. 2 Bias 2 using NPPC (1991) equation based on last rib fat thickness.
Perhaps the major utility of estimating lean and protein growth on specific
farms is in establishing baseline information to use to set diet formulations, but the
input and costs required has to be set against the value of this information. The
major problems with using these curves, apart from the cost and effort involved, is
that they measure the historical situation on a unit and may not be representative
of what is currently happening. Ideally, real-time measures of current protein gains
are needed to accurately adjust diets to requirements, but at present no such
measures exist. However, in the future remote sensing technologies, including the
ability to measure feed and water intakes and the animals live weight, body
temperature and metabolic status as well as monitoring environmental conditions,
may enable accurate estimation of tissue growth and, therefore, nutrient
requirements.
iiii.. LLooww EEnneerrggyy DDeennssiittyy DDiieettss
One approach to reducing carcass fat levels is to reduce the energy intake of
ad libitum fed animals by offering diets with reduced energy density. Within limits,
pigs have the capacity to increase feed intake as the dietary energy concentration
of the diet is reduced in an attempt to maintain total energy intake. However,
there is a lower limit to dietary energy density beyond which pigs can’t compensate
by increasing intake further and the energy intake of the animal will be reduced.
This is illustrated in the results of a study carried out a the University of Illinois
(Table 18). In this trial, the energy concentration of a corn-soybean meal diet (Diet
l) was diluted using a combination of wheat bran, corn gluten feed and alfalfa meal.
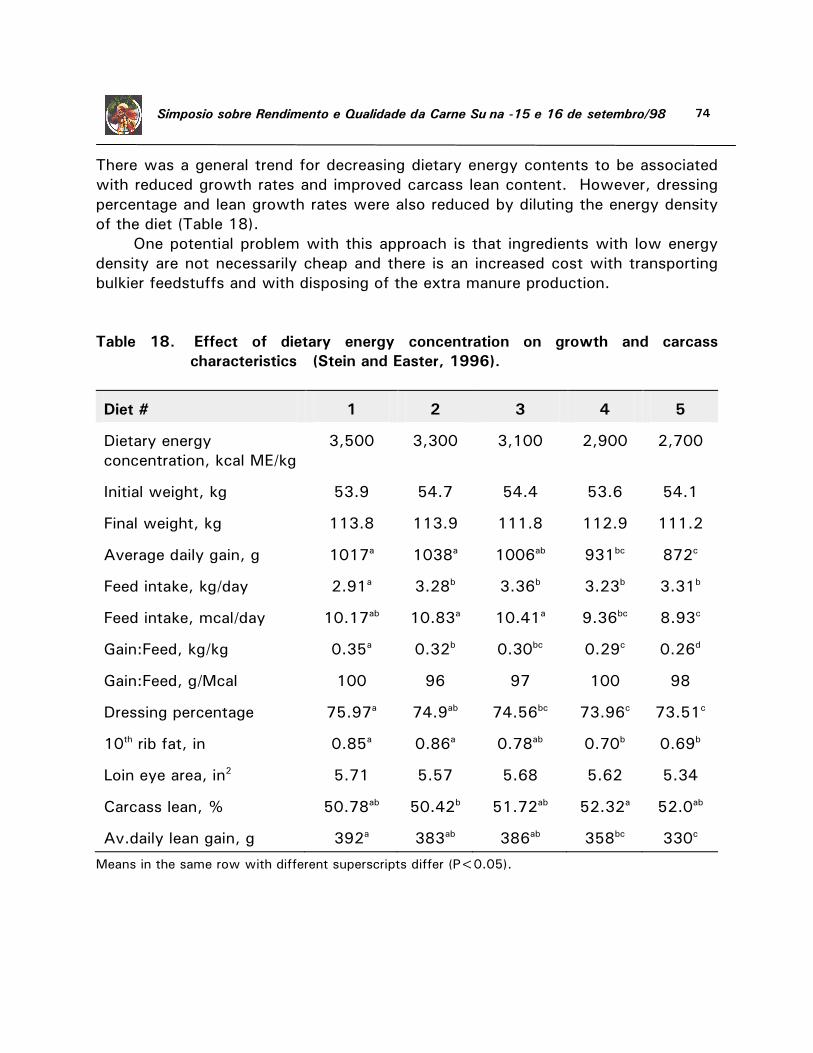
74 Simpósio sobre Rendimento e Qualidade da Carne Suína -15 e 16 de setembro/98
There was a general trend for decreasing dietary energy contents to be associated
with reduced growth rates and improved carcass lean content. However, dressing
percentage and lean growth rates were also reduced by diluting the energy density
of the diet (Table 18).
One potential problem with this approach is that ingredients with low energy
density are not necessarily cheap and there is an increased cost with transporting
bulkier feedstuffs and with disposing of the extra manure production.
Table 18. Effect of dietary energy concentration on growth and carcass
characteristics (Stein and Easter, 1996).
Diet #
1
2
3
4
5
Dietary energy
concentration, kcal ME/kg
3,500
3,300
3,100
2,900
2,700
Initial weight, kg
53.9
54.7
54.4
53.6
54.1
Final weight, kg
113.8
113.9
111.8
112.9
111.2
Average daily gain, g
1017a
1038a
1006ab
931bc
872c
Feed intake, kg/day
2.91a
3.28b
3.36b
3.23b
3.31b
Feed intake, mcal/day
10.17ab
10.83a
10.41a
9.36bc
8.93c
Gain:Feed, kg/kg
0.35a
0.32b
0.30bc
0.29c
0.26d
Gain:Feed, g/Mcal
100
96
97
100
98
Dressing percentage
75.97a
74.9ab
74.56bc
73.96c
73.51c
10th rib fat, in
0.85a
0.86a
0.78ab
0.70b
0.69b
Loin eye area, in2
5.71
5.57
5.68
5.62
5.34
Carcass lean, %
50.78ab
50.42b
51.72ab
52.32a
52.0ab
Av.daily lean gain, g
392a
383ab
386ab
358bc
330c
Means in the same row with different superscripts differ (P<0.05).
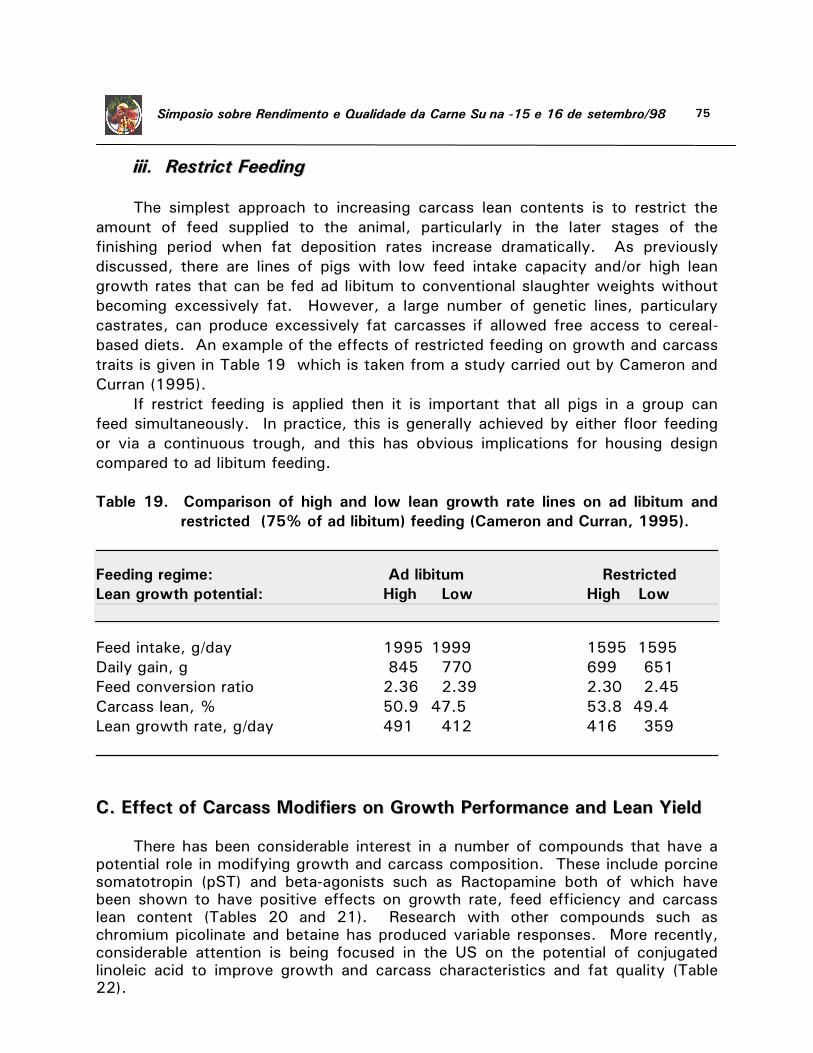
75 Simpósio sobre Rendimento e Qualidade da Carne Suína -15 e 16 de setembro/98
iiiiii.. RReessttrriicctt FFeeeeddiinngg
The simplest approach to increasing carcass lean contents is to restrict the
amount of feed supplied to the animal, particularly in the later stages of the
finishing period when fat deposition rates increase dramatically. As previously
discussed, there are lines of pigs with low feed intake capacity and/or high lean
growth rates that can be fed ad libitum to conventional slaughter weights without
becoming excessively fat. However, a large number of genetic lines, particulary
castrates, can produce excessively fat carcasses if allowed free access to cereal-
based diets. An example of the effects of restricted feeding on growth and carcass
traits is given in Table 19 which is taken from a study carried out by Cameron and
Curran (1995).
If restrict feeding is applied then it is important that all pigs in a group can
feed simultaneously. In practice, this is generally achieved by either floor feeding
or via a continuous trough, and this has obvious implications for housing design
compared to ad libitum feeding.
Table 19. Comparison of high and low lean growth rate lines on ad libitum and
restricted (75% of ad libitum) feeding (Cameron and Curran, 1995).
Feeding regime: Ad libitum Restricted
Lean growth potential: High Low High Low
Feed intake, g/day 1995 1999 1595 1595
Daily gain, g 845 770 699 651
Feed conversion ratio 2.36 2.39 2.30 2.45
Carcass lean, % 50.9 47.5 53.8 49.4
Lean growth rate, g/day 491 412 416 359
CC.. EEffffeecctt ooff CCaarrccaassss MMooddiiffiieerrss oonn GGrroowwtthh PPeerrffoorrmmaannccee aanndd LLeeaann YYiieelldd
There has been considerable interest in a number of compounds that have a
potential role in modifying growth and carcass composition. These include porcine
somatotropin (pST) and beta-agonists such as Ractopamine both of which have
been shown to have positive effects on growth rate, feed efficiency and carcass
lean content (Tables 20 and 21). Research with other compounds such as
chromium picolinate and betaine has produced variable responses. More recently,
considerable attention is being focused in the US on the potential of conjugated
linoleic acid to improve growth and carcass characteristics and fat quality (Table
22).
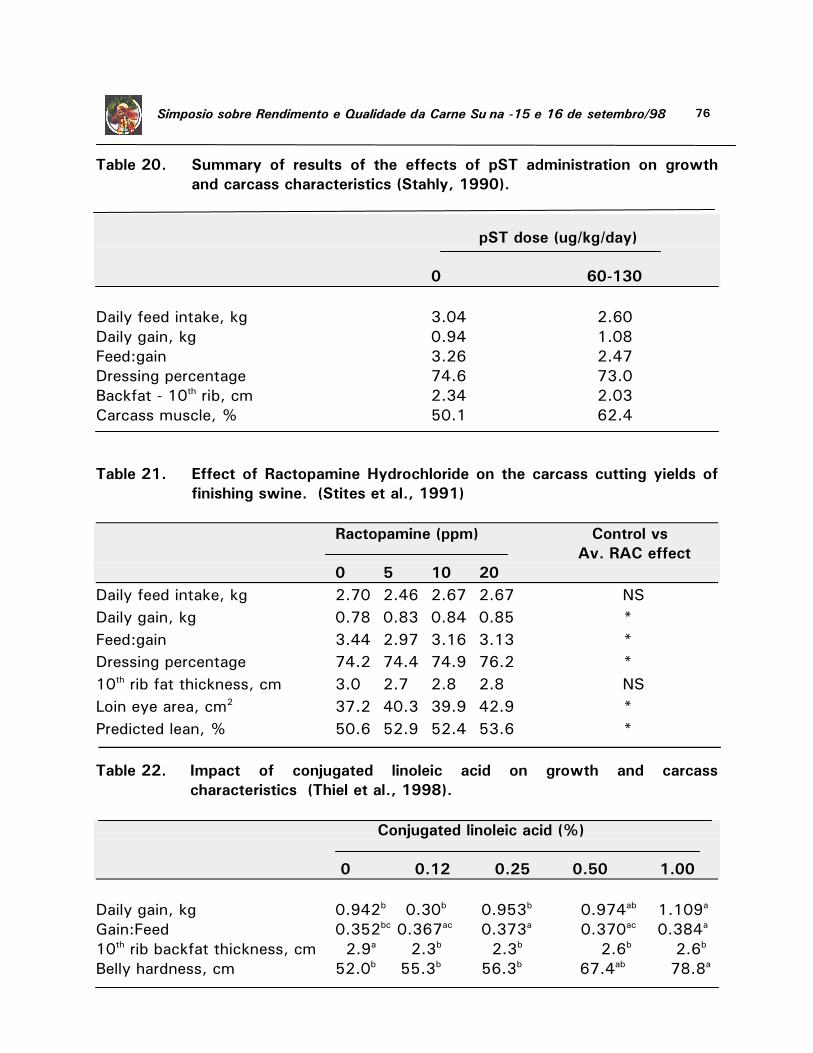
76 Simpósio sobre Rendimento e Qualidade da Carne Suína -15 e 16 de setembro/98
Table 20. Summary of results of the effects of pST administration on growth
and carcass characteristics (Stahly, 1990).
pST dose (ug/kg/day)
0 60-130
Daily feed intake, kg 3.04 2.60
Daily gain, kg 0.94 1.08
Feed:gain 3.26 2.47
Dressing percentage 74.6 73.0
Backfat - 10th rib, cm 2.34 2.03
Carcass muscle, % 50.1 62.4
Table 21. Effect of Ractopamine Hydrochloride on the carcass cutting yields of
finishing swine. (Stites et al., 1991)
Ractopamine (ppm) Control vs
Av. RAC effect
0 5 10 20 Daily feed intake, kg 2.70 2.46 2.67 2.67 NS
Daily gain, kg 0.78 0.83 0.84 0.85 *
Feed:gain 3.44 2.97 3.16 3.13 *
Dressing percentage 74.2 74.4 74.9 76.2 *
10th rib fat thickness, cm 3.0 2.7 2.8 2.8 NS
Loin eye area, cm2 37.2 40.3 39.9 42.9 *
Predicted lean, % 50.6 52.9 52.4 53.6 *
Table 22. Impact of conjugated linoleic acid on growth and carcass
characteristics (Thiel et al., 1998).
Conjugated linoleic acid (%)
0 0.12 0.25 0.50 1.00
Daily gain, kg 0.942b 0.30b 0.953b 0.974ab 1.109a
Gain:Feed 0.352bc 0.367ac 0.373a 0.370ac 0.384a
10th rib backfat thickness, cm 2.9a 2.3b 2.3b 2.6b 2.6b
Belly hardness, cm 52.0b 55.3b 56.3b 67.4ab 78.8a
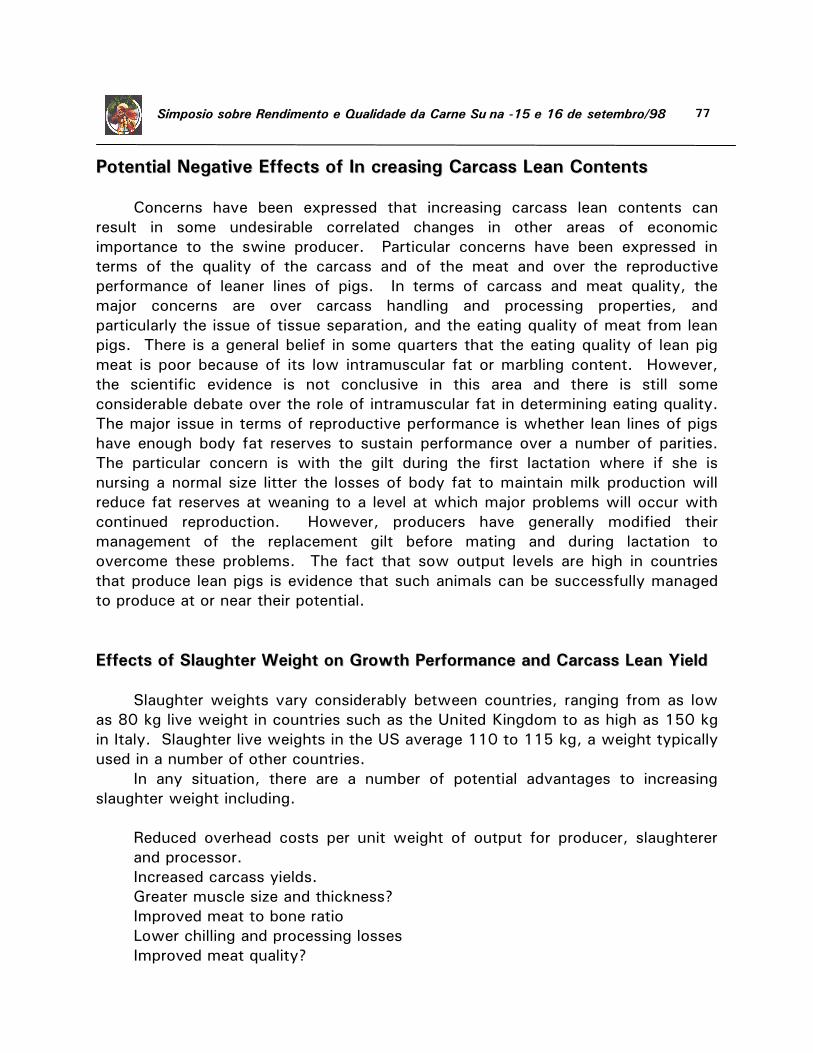
77 Simpósio sobre Rendimento e Qualidade da Carne Suína -15 e 16 de setembro/98
PPootteennttiiaall NNeeggaattiivvee EEffffeeccttss ooff IInn ccrreeaassiinngg CCaarrccaassss LLeeaann CCoonntteennttss
Concerns have been expressed that increasing carcass lean contents can
result in some undesirable correlated changes in other areas of economic
importance to the swine producer. Particular concerns have been expressed in
terms of the quality of the carcass and of the meat and over the reproductive
performance of leaner lines of pigs. In terms of carcass and meat quality, the
major concerns are over carcass handling and processing properties, and
particularly the issue of tissue separation, and the eating quality of meat from lean
pigs. There is a general belief in some quarters that the eating quality of lean pig
meat is poor because of its low intramuscular fat or marbling content. However,
the scientific evidence is not conclusive in this area and there is still some
considerable debate over the role of intramuscular fat in determining eating quality.
The major issue in terms of reproductive performance is whether lean lines of pigs
have enough body fat reserves to sustain performance over a number of parities.
The particular concern is with the gilt during the first lactation where if she is
nursing a normal size litter the losses of body fat to maintain milk production will
reduce fat reserves at weaning to a level at which major problems will occur with
continued reproduction. However, producers have generally modified their
management of the replacement gilt before mating and during lactation to
overcome these problems. The fact that sow output levels are high in countries
that produce lean pigs is evidence that such animals can be successfully managed
to produce at or near their potential.
EEffffeeccttss ooff SSllaauugghhtteerr WWeeiigghhtt oonn GGrroowwtthh PPeerrffoorrmmaannccee aanndd CCaarrccaassss LLeeaann YYiieelldd
Slaughter weights vary considerably between countries, ranging from as low
as 80 kg live weight in countries such as the United Kingdom to as high as 150 kg
in Italy. Slaughter live weights in the US average 110 to 115 kg, a weight typically
used in a number of other countries.
In any situation, there are a number of potential advantages to increasing
slaughter weight including.
Reduced overhead costs per unit weight of output for producer, slaughterer
and processor.
Increased carcass yields.
Greater muscle size and thickness?
Improved meat to bone ratio
Lower chilling and processing losses
Improved meat quality?
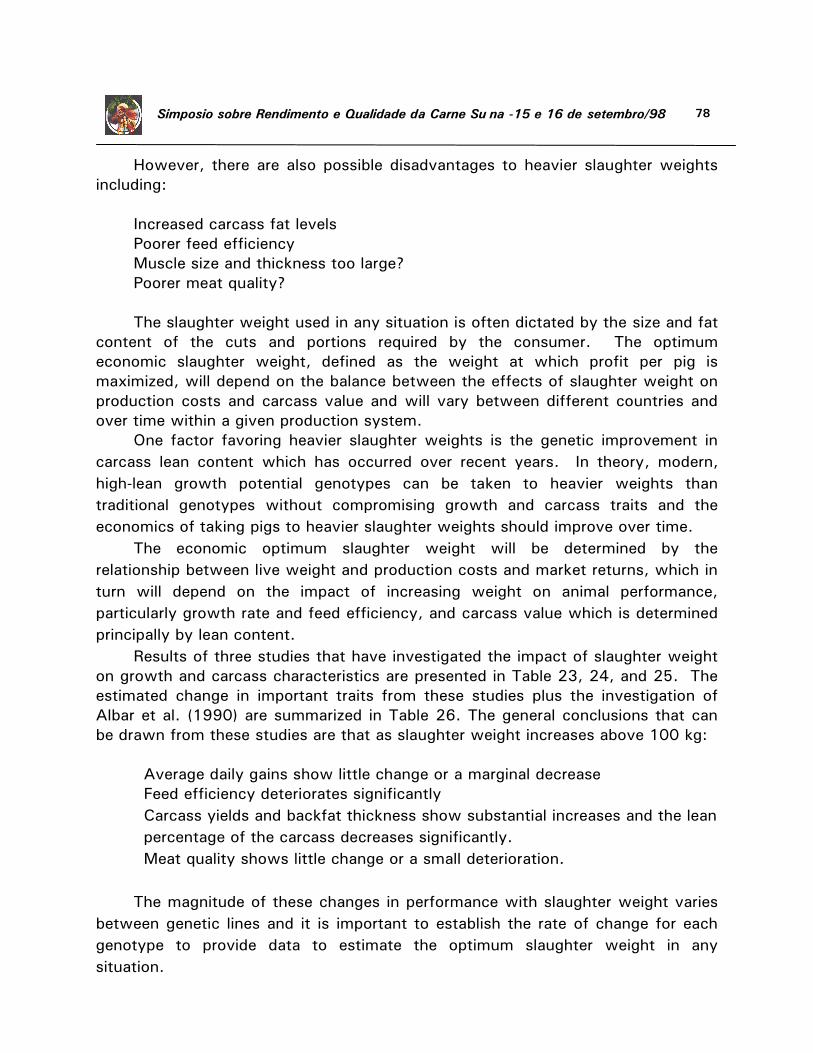
78 Simpósio sobre Rendimento e Qualidade da Carne Suína -15 e 16 de setembro/98
However, there are also possible disadvantages to heavier slaughter weights
including:
Increased carcass fat levels
Poorer feed efficiency
Muscle size and thickness too large?
Poorer meat quality?
The slaughter weight used in any situation is often dictated by the size and fat
content of the cuts and portions required by the consumer. The optimum
economic slaughter weight, defined as the weight at which profit per pig is
maximized, will depend on the balance between the effects of slaughter weight on
production costs and carcass value and will vary between different countries and
over time within a given production system.
One factor favoring heavier slaughter weights is the genetic improvement in
carcass lean content which has occurred over recent years. In theory, modern,
high-lean growth potential genotypes can be taken to heavier weights than
traditional genotypes without compromising growth and carcass traits and the
economics of taking pigs to heavier slaughter weights should improve over time.
The economic optimum slaughter weight will be determined by the
relationship between live weight and production costs and market returns, which in
turn will depend on the impact of increasing weight on animal performance,
particularly growth rate and feed efficiency, and carcass value which is determined
principally by lean content.
Results of three studies that have investigated the impact of slaughter weight
on growth and carcass characteristics are presented in Table 23, 24, and 25. The
estimated change in important traits from these studies plus the investigation of
Albar et al. (1990) are summarized in Table 26. The general conclusions that can
be drawn from these studies are that as slaughter weight increases above 100 kg:
Average daily gains show little change or a marginal decrease
Feed efficiency deteriorates significantly
Carcass yields and backfat thickness show substantial increases and the lean
percentage of the carcass decreases significantly.
Meat quality shows little change or a small deterioration.
The magnitude of these changes in performance with slaughter weight varies
between genetic lines and it is important to establish the rate of change for each
genotype to provide data to estimate the optimum slaughter weight in any
situation.
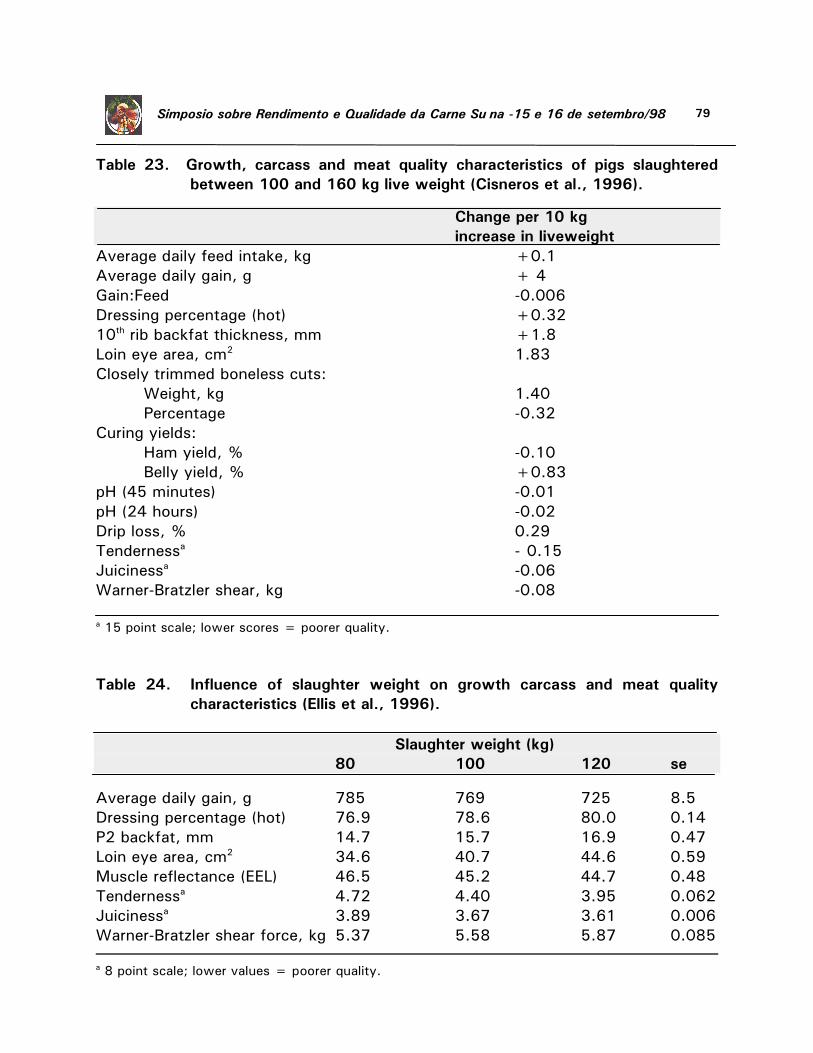
79 Simpósio sobre Rendimento e Qualidade da Carne Suína -15 e 16 de setembro/98
Table 23. Growth, carcass and meat quality characteristics of pigs slaughtered
between 100 and 160 kg live weight (Cisneros et al., 1996).
Change per 10 kg
increase in liveweight
Average daily feed intake, kg +0.1
Average daily gain, g + 4
Gain:Feed -0.006
Dressing percentage (hot) +0.32
10th rib backfat thickness, mm +1.8
Loin eye area, cm2 1.83
Closely trimmed boneless cuts:
Weight, kg 1.40
Percentage -0.32
Curing yields:
Ham yield, % -0.10
Belly yield, % +0.83
pH (45 minutes) -0.01
pH (24 hours) -0.02
Drip loss, % 0.29
Tendernessa - 0.15
Juicinessa -0.06
Warner-Bratzler shear, kg -0.08
a 15 point scale; lower scores = poorer quality.
Table 24. Influence of slaughter weight on growth carcass and meat quality
characteristics (Ellis et al., 1996).
Slaughter weight (kg)
80 100 120 se
Average daily gain, g 785 769 725 8.5
Dressing percentage (hot) 76.9 78.6 80.0 0.14
P2 backfat, mm 14.7 15.7 16.9 0.47
Loin eye area, cm2 34.6 40.7 44.6 0.59
Muscle reflectance (EEL) 46.5 45.2 44.7 0.48
Tendernessa 4.72 4.40 3.95 0.062
Juicinessa 3.89 3.67 3.61 0.006
Warner-Bratzler shear force, kg 5.37 5.58 5.87 0.085
a 8 point scale; lower values = poorer quality.
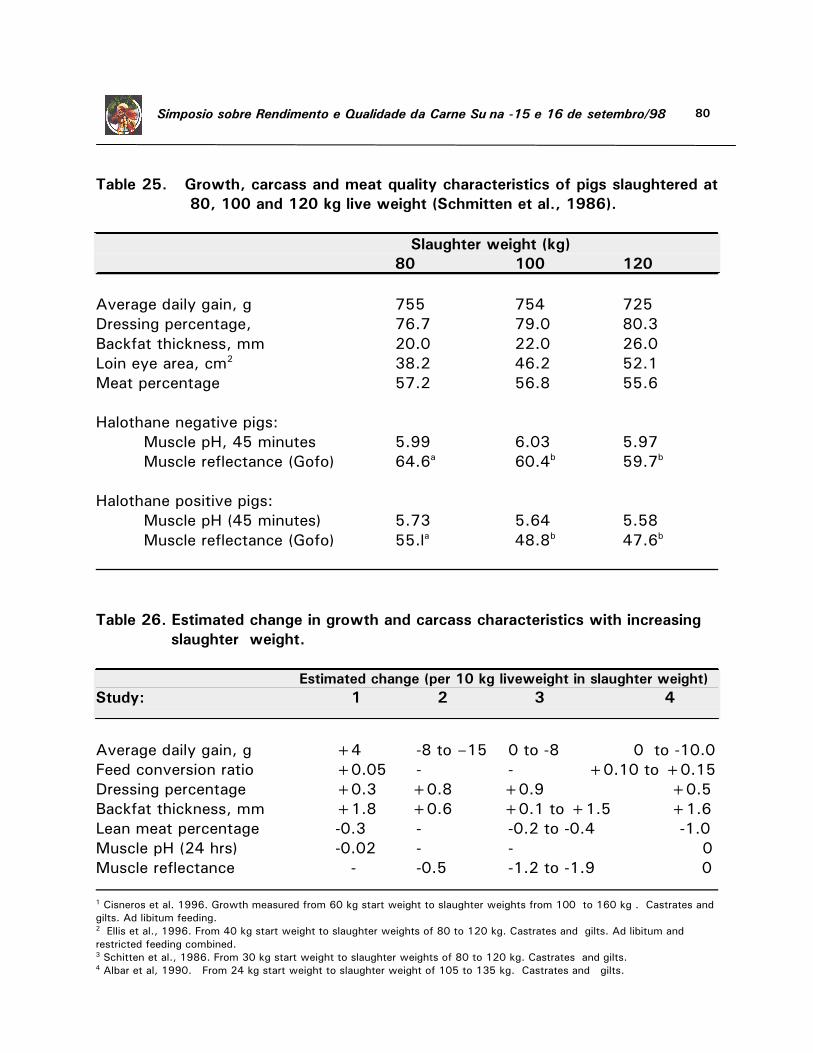
80 Simpósio sobre Rendimento e Qualidade da Carne Suína -15 e 16 de setembro/98
Table 25. Growth, carcass and meat quality characteristics of pigs slaughtered at
80, 100 and 120 kg live weight (Schmitten et al., 1986).
Slaughter weight (kg)
80 100 120
Average daily gain, g 755 754 725
Dressing percentage, 76.7 79.0 80.3
Backfat thickness, mm 20.0 22.0 26.0
Loin eye area, cm2 38.2 46.2 52.1
Meat percentage 57.2 56.8 55.6
Halothane negative pigs:
Muscle pH, 45 minutes 5.99 6.03 5.97
Muscle reflectance (Gofo) 64.6a 60.4b 59.7b
Halothane positive pigs:
Muscle pH (45 minutes) 5.73 5.64 5.58
Muscle reflectance (Gofo) 55.la 48.8b 47.6b
Table 26. Estimated change in growth and carcass characteristics with increasing
slaughter weight.
Estimated change (per 10 kg liveweight in slaughter weight)
Study: 1 2 3 4
Average daily gain, g +4 -8 to –15 0 to -8 0 to -10.0
Feed conversion ratio +0.05 - - +0.10 to +0.15
Dressing percentage +0.3 +0.8 +0.9 +0.5
Backfat thickness, mm +1.8 +0.6 +0.1 to +1.5 +1.6
Lean meat percentage -0.3 - -0.2 to -0.4 -1.0
Muscle pH (24 hrs) -0.02 - - 0
Muscle reflectance - -0.5 -1.2 to -1.9 0
1 Cisneros et al. 1996. Growth measured from 60 kg start weight to slaughter weights from 100 to 160 kg . Castrates and
gilts. Ad libitum feeding. 2 Ellis et al., 1996. From 40 kg start weight to slaughter weights of 80 to 120 kg. Castrates and gilts. Ad libitum and
restricted feeding combined. 3 Schitten et al., 1986. From 30 kg start weight to slaughter weights of 80 to 120 kg. Castrates and gilts. 4 Albar et al, 1990. From 24 kg start weight to slaughter weight of 105 to 135 kg. Castrates and gilts.
81 Simpósio sobre Rendimento e Qualidade da Carne Suína -15 e 16 de setembro/98
BBiibblliiooggrraapphhyy
1. ALBAR, J., LATIMIER, P. and GRANIER, R. 1990. [Slaughter weight:Evaluation
of fattening performance and carcass composition for pigs over 100 kg at
slaughter.] Journal Rech. Porcine En France. 22:119-132.
2. BAKER, D.H. 1997. Ideal amino acid profiles for swine and poultry and their
applications in feed formulation. Biokyowa Technical Review - 9.
3. BRANNAMAN, J.L., CHRISTIAN, L.L., ROTHSCHILD, M.F. and KLINE, E.A.
1984. Prediction equations for estimating lean quantity in 15- to 50 kg pigs.
Journal of Animal Science. 59:991-996.
4. CAMERON, N.D., and CURRAN, M.K. 1995. Responses in carcass composition
to divergent selection for components of efficient lean growth in pigs. Animal
Science 61:347-359.
5. CISNEROS, F., ELLIS, M., MCKEITH, F.K., MCCAW, J. and FERNANDO, R.L.
1996. Influence of slaughter weight on growth and carcass characteristics,
commercial cutting and curing yields, and meat quality of barrows and gilts
from two genotypes. Journal of Animal Science. 74: 925-933.
6. ELLIS, M., WEBB, A.J., AVERY, P.J. and BROWN, I. 1996. The influence of
terminal sire genotypes, sex, slaughter weight, feeding regime and slaughter
house on growth performance and carcass and meat quality in pigs and on the
organoleptic properties of fresh pork. Animal Science. 62: 521-530.
7. GU, Y., SCHINCKEL, A.P. and MARTIN, T.G. 1992. Growth, development and
carcass composition in five genotypes of swine. Journal of Animal Science.
70:1719-1729.
8. KEMPSTER, A.J. and LOWE, D.B. 1993. Meat production with entire males.
44th Annual Meeting of the European Association for Animal Production,
Arhus, Denmark, P2l.
9. MALMFORS, B. and LUNDSTROM, K. 1983. Consumer reaction to boar meat -
a review. Livestock Production Science. 10: 187-196.
10.MEAT and LIVESTOCK COMMISSION. 1988. Stotfold Pig Development
Unit:First Trial Results, MLC, Milton Keynes, England.
11. NPPC. 199l. Guidelines for evaluating market hogs. National Pork Producers
Council, Des Moines, Iowa.
12. SCHINCKEL, A.P. 1992. Concepts of lean growth modelling and methods of
describing genetic differences for application to lean growth models.
Proceedings of the National Pork Production Council. Lean-Growth Modelling
Symposium. Des Moines, IA pp53-73.
13. SCHINCKEL, A.P. 1994. Nutrient requirements of modern pig genotypes. In
Recent Advances in Animal Nutrition”, Nottingham University Press. pp133-
169.
82 Simpósio sobre Rendimento e Qualidade da Carne Suína -15 e 16 de setembro/98
14. SCHINCKEL, A.P., PRECKEL, P.V. and EINSTEIN, M.E. 1996. Prediction of
daily protein accretion rates of pigs from estimates of fat-free lean gain
between 20 and 120 kilograms live weight. Journal of Animal Science.
74:498-503.
15. SCHMITTEN, F., KLINGELHOLLER, A., SCHEPERS, K-H., FESTERLING, A., and
JUNGST, H. 1986. Influence of final weight on meat quality in pigs.
Zuchtungskunde 58: 282-290.
16. STAHLY, T.S. 1990. Impact of somatotropin and beta-adrenergic agonists on
growth, carcass composition and nutrient requirements of pigs. In “Recent
Advances in Animal Nutrition”. pp103-112.
17. STEIN, H.H. and EASTER, R.A. 1996. Dietary energy concentration effects on
carcass leanness in finishing hogs. University of Illinois Swine Research
Reports. pp41-45.
18. STITES, C.R., MCKEITH, F.K., SINGH, S.D., BECHTEL, P.J., MOWREY, D.H.
and JONES, D.J. 1991. The effect of ractopamine hydrochloride on the
carcass cutting yields of finishing swine. Journal of Animal Sciences.
69:3094-3101.
19. THIEL, R.L., SPARKS, J.C., WIEGAND, B.R., PARRISH, F.C. Jr., and EWAN,
R.C. 1998. Conjugated linoleic acid improves performance and body
composition in swine. Journal of Animal Science. 76:61 (Abstract).
20. WHITTEMORE, C.T., TULLIS, J.B. and EMMANS, G.C. 1988. Protein growth
in pigs. Animal Production. 46: 437-445.
21. WILSON, E.R. 1995. Bias in predicting fat-free lean using the NPPC fat-free
lean index for pork carcasses. Journal of Animal Science. 73(1):60.
22. WOOD, J.D., JONES, R.C.D., FRANCOMBE, M.A. and WHELEHAN O.P. 1986.
The effects of fat thickness and sex on pig meat quality with special reference
to the problems associated with overleanness. Animal Production. 43:535-
544.