Spatial variability of leaf nutrient contents in a drip ... · content was extracted by...
12
Universidade de São Paulo 2012 Spatial variability of leaf nutrient contents in a drip irrigated citrus orchard Eng. Agríc.,v.32,n.3,p.479-489,2012 http://www.producao.usp.br/handle/BDPI/38652 Downloaded from: Biblioteca Digital da Produção Intelectual - BDPI, Universidade de São Paulo Biblioteca Digital da Produção Intelectual - BDPI Sem comunidade Scielo
Transcript of Spatial variability of leaf nutrient contents in a drip ... · content was extracted by...
Universidade de São Paulo
2012
Spatial variability of leaf nutrient contents in a
drip irrigated citrus orchard Eng. Agríc.,v.32,n.3,p.479-489,2012http://www.producao.usp.br/handle/BDPI/38652
Downloaded from: Biblioteca Digital da Produção Intelectual - BDPI, Universidade de São Paulo
Biblioteca Digital da Produção Intelectual - BDPI
Sem comunidade Scielo
___________________________________
1 Engo Agrícola, Prof. Adjunto, Departamento de Solos e Engenharia Agrícola - Setor de Ciências Agrárias, Universidade Federal do
Paraná, [email protected]. 2 Engo Agrônomo, Prof. Livre Docente, Departamento de Engenharia de Biossistemas, LEB - ESALQ/USP, [email protected]. 3 Engo Agrônomo, Prof. Dr., Instituto Federal Goiano, Câmpus de Rio Verde, [email protected]. 4 Engo Agrônomo, Prof. Associado, Departamento de Estatística, Centro Politécnico da Universidade Federal do Paraná,
Recebido pelo Conselho Editorial em: 28-10-2009
Aprovado pelo Conselho Editorial em: 9-1-2012
Eng. Agríc., Jaboticabal, v.32, n.3, p.479-489, maio/jun. 2012
SPATIAL VARIABILITY OF LEAF NUTRIENT CONTENTS IN A DRIP IRRIGATED
CITRUS ORCHARD
ROBSON A. ARMINDO1, RUBENS D. COELHO
2, MARCONI B. TEIXEIRA
3,
PAULO J. RIBEIRO JUNIOR4
ABSTRACT: This study aimed to evaluate the spatial variability of leaf content of macro and
micronutrients. The citrus plants orchard with 5 years of age, planted at regular intervals of 8 x 7 m,
was managed under drip irrigation. Leaf samples were collected from each plant to be analyzed in
the laboratory. Data were analyzed using the software R, version 2.5.1 Copyright (C) 2007, along
with geostatistics package GeoR. All contents of macro and micronutrients studied were adjusted to
normal distribution and showed spatial dependence.The best-fit models, based on the likelihood, for
the macro and micronutrients were the spherical and matern. It is suggest for the macronutrients
nitrogen, phosphorus, potassium, calcium, magnesium and sulfur the minimum distances between
samples of 37; 58; 29; 63; 46 and 15 m respectively, while for the micronutrients boron, copper,
iron, manganese and zinc, the distances suggests are 29; 9; 113; 35 and 14 m, respectively.
KEYWORDS: Citrus latifolia Tan., macronutrients, micronutrients, geostatistics.
VARIABILIDADE ESPACIAL DOS TEORES FOLIARES DE NUTRIENTES EM UM
POMAR DE CITROS SOB IRRIGAÇÃO LOCALIZADA
RESUMO: O objetivo do presente trabalho foi estudar a variabilidade espacial de macro e
micronutrientes foliares. O pomar com plantas de 5 anos de idade, plantado com espaçamento
regular de 8 x 7 m, foi manejado sob irrigação localizada. Foram coletadas amostras foliares de
cada planta do pomar para serem analisadas em laboratório. Os dados foram analisados por meio do
programa computacional R, versão 2.5.1 Copyright (C) 2007, juntamente com o pacote GeoR.
Todos os teores de macro e micronutrientes estudados ajustaram-se à distribuição normal e
apresentaram dependência espacial. Os modelos de melhor ajuste, com base na verosimilhança,
para os macro e micronutrientes, foram esférico e matern. Para os macronutrientes nitrogênio,
fósforo, potássio, cálcio, magnésio e enxofre, sugerem-se distâncias mínimas entre amostras de 37;
58; 29; 63; 46 e 15 m, respectivamente, enquanto para os micronutrientes boro, cobre, ferro,
manganês e zinco, essas distâncias são de 29; 9; 113; 35 e 14 m, respectivamente.
PALAVRAS-CHAVE: Citrus latifolia Tan., macronutrientes, micronutrientes, geoestatística.
Robson A. Armindo, Rubens D. Coelho, Marconi B. Teixeira et al.
Eng. Agríc., Jaboticabal, v.32, n.3, p.479-489, maio/jun. 2012
480
INTRODUCTION
The obtaining of information about the spatial variability of soil and plant properties is of
great importance for the assessment of fertility; soil removal, mapping and classification;
development of more adequate sampling schemes, aiming to improve the management conditions
and increase in crop productivity (CAMPOS et al., 2009).
Before performing a grid of sampling, we should analyze, by means of more sophisticated,
statistics, the potential dependence of the variables, the object of study, which are determined by
analyzing the samples, i.e., to know whether these variables are dependent or independent one from
the other (BARBIERI et al., 2008).
Some technological advances in agriculture and farming have contributed in the technique of
sampling points in the area, regular or irregular grid, in order to determine the spatial and temporal
variation of properties that affect crop yields by maps of variability. Thereafter, corrective solutions
based on these maps have been used, in order to optimize the utilization of resources and to reduce
production costs (MOLIN & MASCARIN, 2007).
Geostatistics was used by FARIAS et al. (2003) to evaluate the spatial variability of yield and
fruit size in orange orchards with and without irrigation, in the municipality of Luiz Antônio, state
of São Paulo, and concluded that geostatistics has proved to be an extremely useful tool to
characterize the variability, to map and to analyze the risk areas, and to assist in program of
Precision Agriculture for citrus culture.
Thus, through the use of geostatistics, this study aimed to analyze a set of spatially referenced
content in leaves, trying to describe the spatial dependence of the macronutrients and micronutrients
in citrus plants, as support for a rational management of fertilization and experimentation in the
studied area.
MATERIAL AND METHODS
This study was conducted at the Experimental Area of Irrigation (Areão Farm) of the
Department of Biosystems Engineering, Luiz de Queiroz College of Agriculture, University of São
Paulo. The geographic coordinates of the experimental area are: 22º42’30” South latitude and
47º30’00” West longitude, being at 576 m above sea level. The climate, according to Köeppen
classification, is Cwa type, with mean values of annual rainfall of 1,253 mm, mean annual
temperature of 21.2 °C, relative humidity of 74% wind speed: 2.2 m s-1
with predominant direction
E/SE. The driest period of the year focuses on the months of June, July and August. The soil of the
experimental area was classified as Ultisoil (Red Alfisol). The total study area was 5,975 m2, with a
slope of 8.5%.
The studies were conducted in an orchard of 'Tahiti' accid lime (Citrus latifolia Tan.) grafted
in 'Rangpur' lime (Citrus limonia Osbeck), aged five years, using 112 plants, doing the liming and
fertilization according to RAIJ et al. (1997). The cultural treatments consisted of spraying with
chemical pesticides.
Irrigation was scheduled for everyday applications, using an electronic controller and
hydraulic valves. On days with precipitation greater than 10 mm, irrigation was cancelled. Irrigation
aimed the replacement of crop evapotranspiration (ETc) obtained with a weighing lysimeter located
in the center of the area, 4 m diameter and 1.3 m deep, consisting of three electronic load cell
coupled to an automated collection data (Model CR 23x Campbell Scientific, Logan, UT, USA).
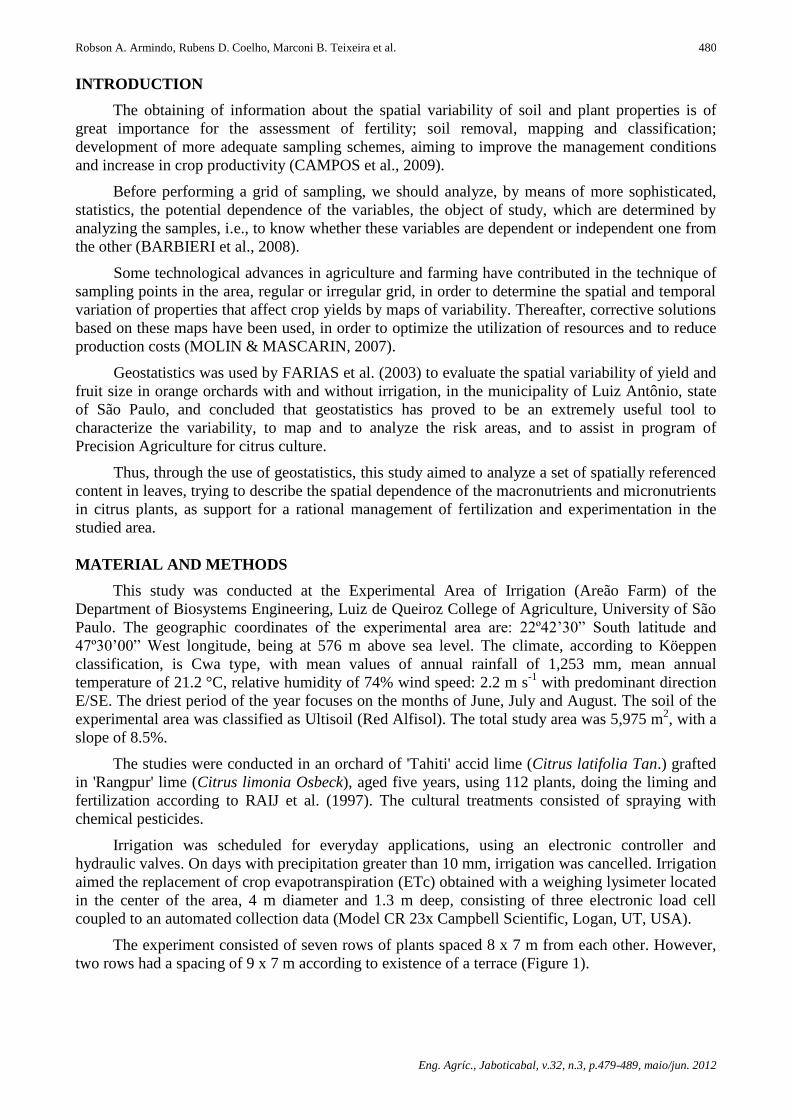
The experiment consisted of seven rows of plants spaced 8 x 7 m from each other. However,
two rows had a spacing of 9 x 7 m according to existence of a terrace (Figure 1).
Spatial variability of leaf nutrient contents in a drip irrigated citrus orchard
Eng. Agríc., Jaboticabal, v.32, n.3, p.479-489, maio/jun. 2012
481
FIGURE 1. Aerial photo of the “Tahiti” acid lime orchard installed at the experimental Areão Farm
- ESALQ/USP.
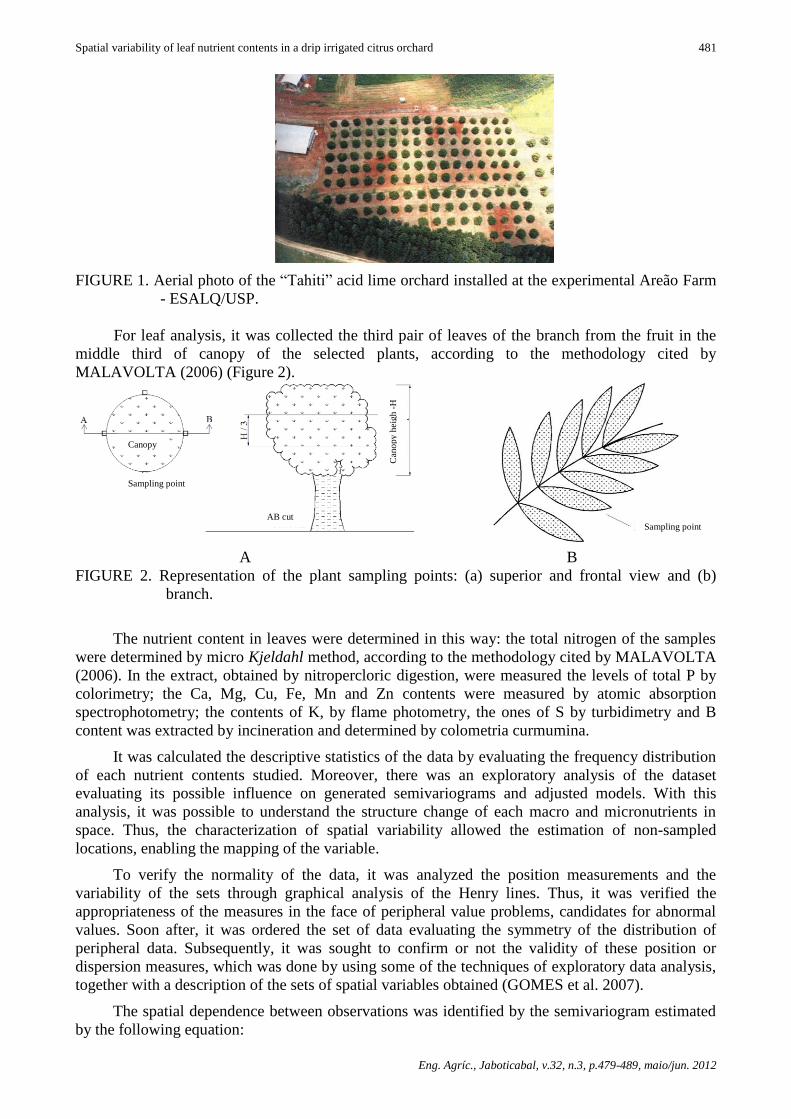
For leaf analysis, it was collected the third pair of leaves of the branch from the fruit in the
middle third of canopy of the selected plants, according to the methodology cited by
MALAVOLTA (2006) (Figure 2).
A B
FIGURE 2. Representation of the plant sampling points: (a) superior and frontal view and (b)
branch.
The nutrient content in leaves were determined in this way: the total nitrogen of the samples
were determined by micro Kjeldahl method, according to the methodology cited by MALAVOLTA
(2006). In the extract, obtained by nitropercloric digestion, were measured the levels of total P by
colorimetry; the Ca, Mg, Cu, Fe, Mn and Zn contents were measured by atomic absorption
spectrophotometry; the contents of K, by flame photometry, the ones of S by turbidimetry and B
content was extracted by incineration and determined by colometria curmumina.
It was calculated the descriptive statistics of the data by evaluating the frequency distribution
of each nutrient contents studied. Moreover, there was an exploratory analysis of the dataset
evaluating its possible influence on generated semivariograms and adjusted models. With this
analysis, it was possible to understand the structure change of each macro and micronutrients in
space. Thus, the characterization of spatial variability allowed the estimation of non-sampled
locations, enabling the mapping of the variable.
To verify the normality of the data, it was analyzed the position measurements and the
variability of the sets through graphical analysis of the Henry lines. Thus, it was verified the
appropriateness of the measures in the face of peripheral value problems, candidates for abnormal
values. Soon after, it was ordered the set of data evaluating the symmetry of the distribution of
peripheral data. Subsequently, it was sought to confirm or not the validity of these position or
dispersion measures, which was done by using some of the techniques of exploratory data analysis,
together with a description of the sets of spatial variables obtained (GOMES et al. 2007).
The spatial dependence between observations was identified by the semivariogram estimated
by the following equation:
Canopy
Can
op
y h
eigh -
H
Sampling point
Sampling point AB cut
Robson A. Armindo, Rubens D. Coelho, Marconi B. Teixeira et al.
Eng. Agríc., Jaboticabal, v.32, n.3, p.479-489, maio/jun. 2012
482
N(h)
1i
2
ii
* hszsz2N(h)
1hγ (1)
In which,
* h - semivariance;
N(h) - number of experimental pairs;
iz s e iz s h - observations, and
h - distance.
It was used the geoR package of the computer program R for all values of sample size,
mean, median, minimum, maximum, variance, coefficient of variation, the lower quartile and upper
quartile. It was adopted the criteria established by WARRICK & NIELSEN (1980) to classify the
elements according to the coefficient of variation. After this analysis, geostatistical analysis was
performed adjusting semivariogram values that determine the nugget effect, sill and range. The
semivariogram models were selected based on maximum likelihood, and this is calculated by means
of a function of the software used. It was tested the following semivariogram models: (a) spherical,
*(h) = C0 + C1 [1.5(h/a)–0.5 (h/a)³] for 0 < h < a and *(h) = C0 + C1 for h>a; (b) exponential,
*(h) = C0 + C1 [1–exp(-3h/a)] for 0 < h < d, in which d is the maximum distance in which the
semivariogram is defined; (c) gaussian, g*(h) = C0 + C1[1–exp (-3h²/a²)] for 0 < h < d; (d) matern
(u; , kappa) = [2 ^ (kappa-1) (kappa)] ^ (-1) (u/) ^ kappa K_κ(u/), in which and kappa are
parameters and K_κ(…) denotes the modified Bessel function of the third order type kappa for >
0 and kappa > 0.
With the package geoR kriging, spatial variability maps were generated by kriging
technique. The ratio between the nugget effect and sill [C0/(C0 + C1)] might, according to
TRANGMAR et al. (1985), classify and compare the analysed macro and micronutrients. The
spatial dependence classes have been defined using the classification proposed by
CAMBARDELLA et al. (1994) in: strong spatial dependence, for the ratio less than or equal to
0.25; moderate spatial dependence, for the ratio greater than 0.25 and less than or equal to 0.75; and
weak dependence, for the ratio greater than 0.75.
RESULTS AND DISCUSSION
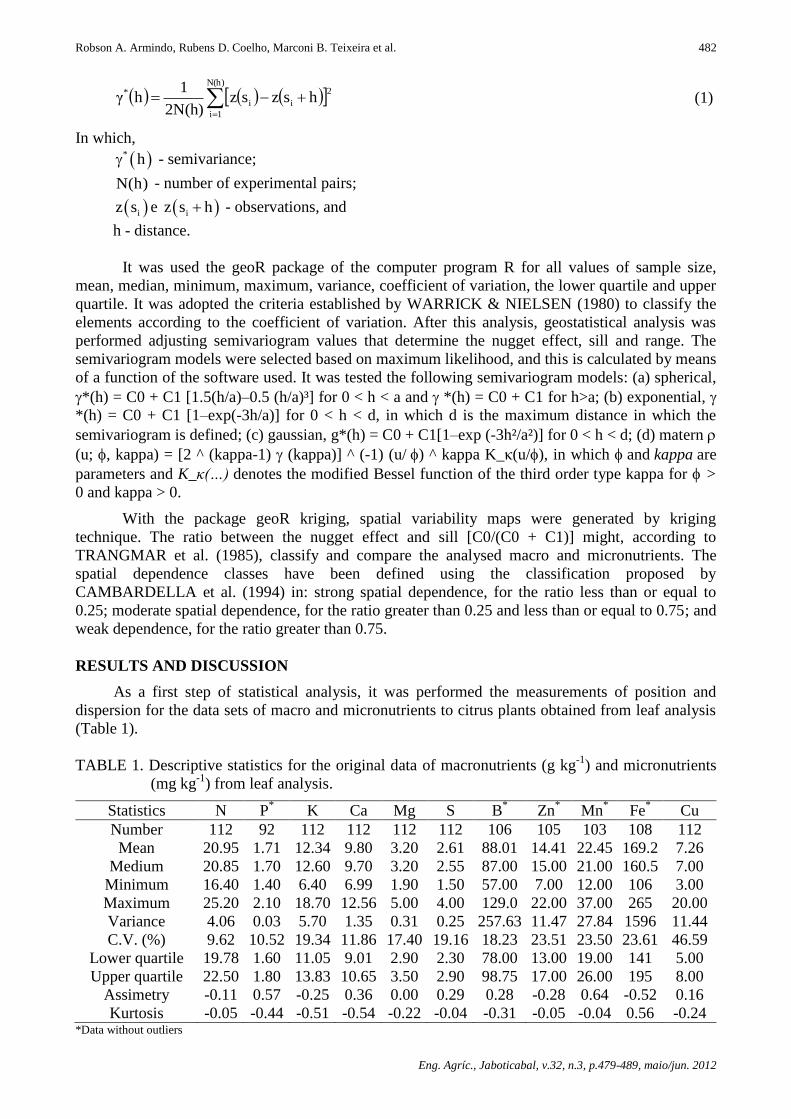
As a first step of statistical analysis, it was performed the measurements of position and
dispersion for the data sets of macro and micronutrients to citrus plants obtained from leaf analysis
(Table 1).
TABLE 1. Descriptive statistics for the original data of macronutrients (g kg-1
) and micronutrients
(mg kg-1
) from leaf analysis.
Statistics N P*
K Ca
Mg S B* Zn
* Mn
* Fe
* Cu
Number 112 92 112 112 112 112 106 105 103 108 112
Mean 20.95 1.71 12.34 9.80 3.20 2.61 88.01 14.41 22.45 169.2 7.26
Medium 20.85 1.70 12.60 9.70 3.20 2.55 87.00 15.00 21.00 160.5 7.00
Minimum 16.40 1.40 6.40 6.99 1.90 1.50 57.00 7.00 12.00 106 3.00
Maximum 25.20 2.10 18.70 12.56 5.00 4.00 129.0 22.00 37.00 265 20.00
Variance 4.06 0.03 5.70 1.35 0.31 0.25 257.63 11.47 27.84 1596 11.44
C.V. (%) 9.62 10.52 19.34 11.86 17.40 19.16 18.23 23.51 23.50 23.61 46.59
Lower quartile 19.78 1.60 11.05 9.01 2.90 2.30 78.00 13.00 19.00 141 5.00
Upper quartile 22.50 1.80 13.83 10.65 3.50 2.90 98.75 17.00 26.00 195 8.00
Assimetry -0.11 0.57 -0.25 0.36 0.00 0.29 0.28 -0.28 0.64 -0.52 0.16
Kurtosis -0.05 -0.44 -0.51 -0.54 -0.22 -0.04 -0.31 -0.05 -0.04 0.56 -0.24 *Data without outliers
Spatial variability of leaf nutrient contents in a drip irrigated citrus orchard
Eng. Agríc., Jaboticabal, v.32, n.3, p.479-489, maio/jun. 2012
483
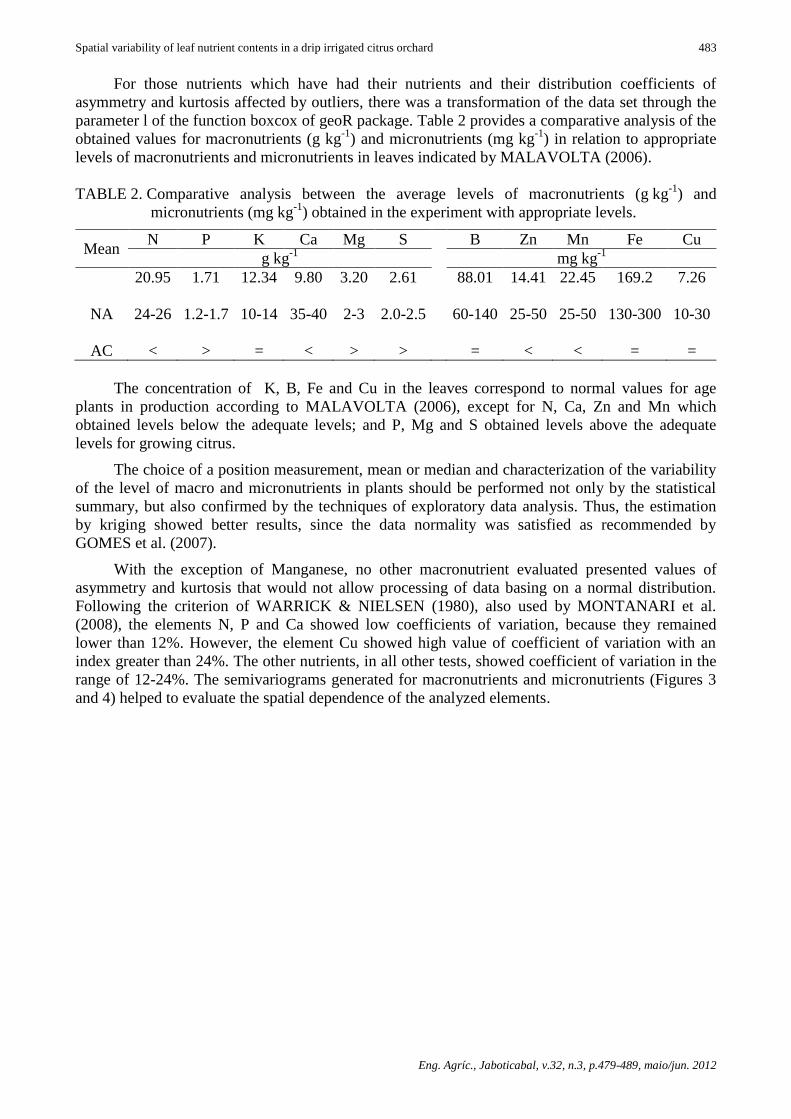
For those nutrients which have had their nutrients and their distribution coefficients of
asymmetry and kurtosis affected by outliers, there was a transformation of the data set through the
parameter l of the function boxcox of geoR package. Table 2 provides a comparative analysis of the
obtained values for macronutrients (g kg-1
) and micronutrients (mg kg-1
) in relation to appropriate
levels of macronutrients and micronutrients in leaves indicated by MALAVOLTA (2006).
TABLE 2. Comparative analysis between the average levels of macronutrients (g kg-1
) and
micronutrients (mg kg-1
) obtained in the experiment with appropriate levels.
Mean N P K Ca Mg S B Zn Mn Fe Cu
g kg-1
mg kg-1
20.95 1.71 12.34 9.80 3.20 2.61 88.01 14.41 22.45 169.2 7.26
NA
24-26 1.2-1.7 10-14 35-40 2-3 2.0-2.5 60-140 25-50 25-50 130-300 10-30
AC < > = < > > = < < = =
The concentration of K, B, Fe and Cu in the leaves correspond to normal values for age
plants in production according to MALAVOLTA (2006), except for N, Ca, Zn and Mn which
obtained levels below the adequate levels; and P, Mg and S obtained levels above the adequate
levels for growing citrus.
The choice of a position measurement, mean or median and characterization of the variability
of the level of macro and micronutrients in plants should be performed not only by the statistical
summary, but also confirmed by the techniques of exploratory data analysis. Thus, the estimation
by kriging showed better results, since the data normality was satisfied as recommended by
GOMES et al. (2007).
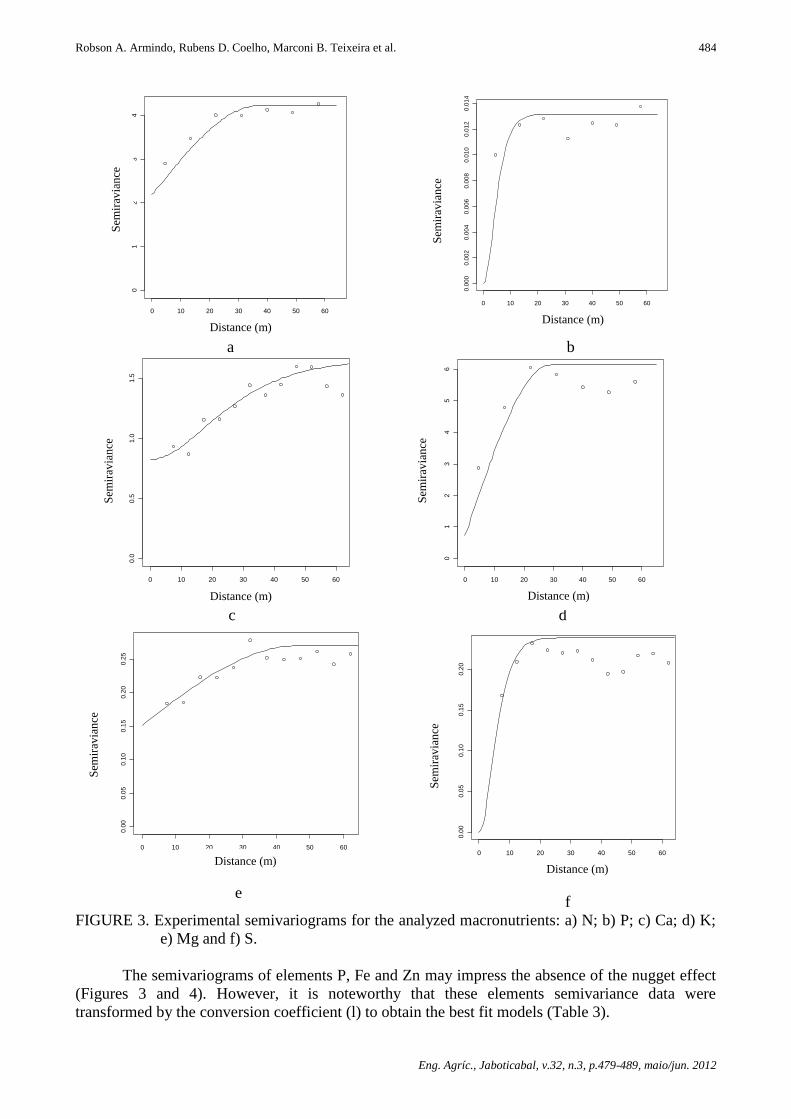
With the exception of Manganese, no other macronutrient evaluated presented values of
asymmetry and kurtosis that would not allow processing of data basing on a normal distribution.
Following the criterion of WARRICK & NIELSEN (1980), also used by MONTANARI et al.
(2008), the elements N, P and Ca showed low coefficients of variation, because they remained
lower than 12%. However, the element Cu showed high value of coefficient of variation with an
index greater than 24%. The other nutrients, in all other tests, showed coefficient of variation in the
range of 12-24%. The semivariograms generated for macronutrients and micronutrients (Figures 3
and 4) helped to evaluate the spatial dependence of the analyzed elements.
Robson A. Armindo, Rubens D. Coelho, Marconi B. Teixeira et al.
Eng. Agríc., Jaboticabal, v.32, n.3, p.479-489, maio/jun. 2012
484
0 10 20 30 40 50 60
01
23
4
Nitrogênio
distância (m)
se
miv
ari
ân
cia
0 10 20 30 40 50 60
0.0
00
0.0
02
0.0
04
0.0
06
0.0
08
0.0
10
0.0
12
0.0
14
distância (m)
se
miv
ari
ân
cia
a b
0 10 20 30 40 50 60
0.0
0.5
1.0
1.5
distância (m)
se
miv
ari
ân
cia
0 10 20 30 40 50 60
01
23
45
6
distância (m)
se
miv
ari
ân
cia
c d
0 10 20 30 40 50 60
0.0
00
.05
0.1
00
.15
0.2
00
.25
distância (m)
se
miv
ari
ân
cia
0 10 20 30 40 50 60
0.0
00
.05
0.1
00
.15
0.2
0
distância (m)
se
miv
ari
ân
cia
e
f
FIGURE 3. Experimental semivariograms for the analyzed macronutrients: a) N; b) P; c) Ca; d) K;
e) Mg and f) S.
The semivariograms of elements P, Fe and Zn may impress the absence of the nugget effect
(Figures 3 and 4). However, it is noteworthy that these elements semivariance data were
transformed by the conversion coefficient (l) to obtain the best fit models (Table 3).
Distance (m)
Sem
irav
ian
ce
Sem
irav
ian
ce
Sem
irav
ian
ce
Sem
irav
ian
ce
Sem
irav
ian
ce
Sem
irav
ian
ce
Distance (m) Distance (m)
Distance (m) Distance (m)
Distance (m)
Spatial variability of leaf nutrient contents in a drip irrigated citrus orchard
Eng. Agríc., Jaboticabal, v.32, n.3, p.479-489, maio/jun. 2012
485
0 10 20 30 40 50 60
05
01
00
15
02
00
25
0
Boro
distância (m)
se
miv
ari
ân
cia
0 10 20 30 40 50 60
0.0
00
0.0
05
0.0
10
0.0
15
0.0
20
Cobre
distância (m)
se
miv
ari
ân
cia
a
b
0 10 20 30 40 50 60
0.0
00
00
0.0
00
10
0.0
00
20
0.0
00
30
distância (m)
se
miv
ari
ân
cia
0 10 20 30 40 50 60
0.0
00
.05
0.1
00
.15
Manganês
distância(m)
se
miv
ari
ân
cia
c D
0 10 20 30 40 50 60
02
46
81
01
2
Zinco
distância (m)
se
miv
ari
ân
cia
e
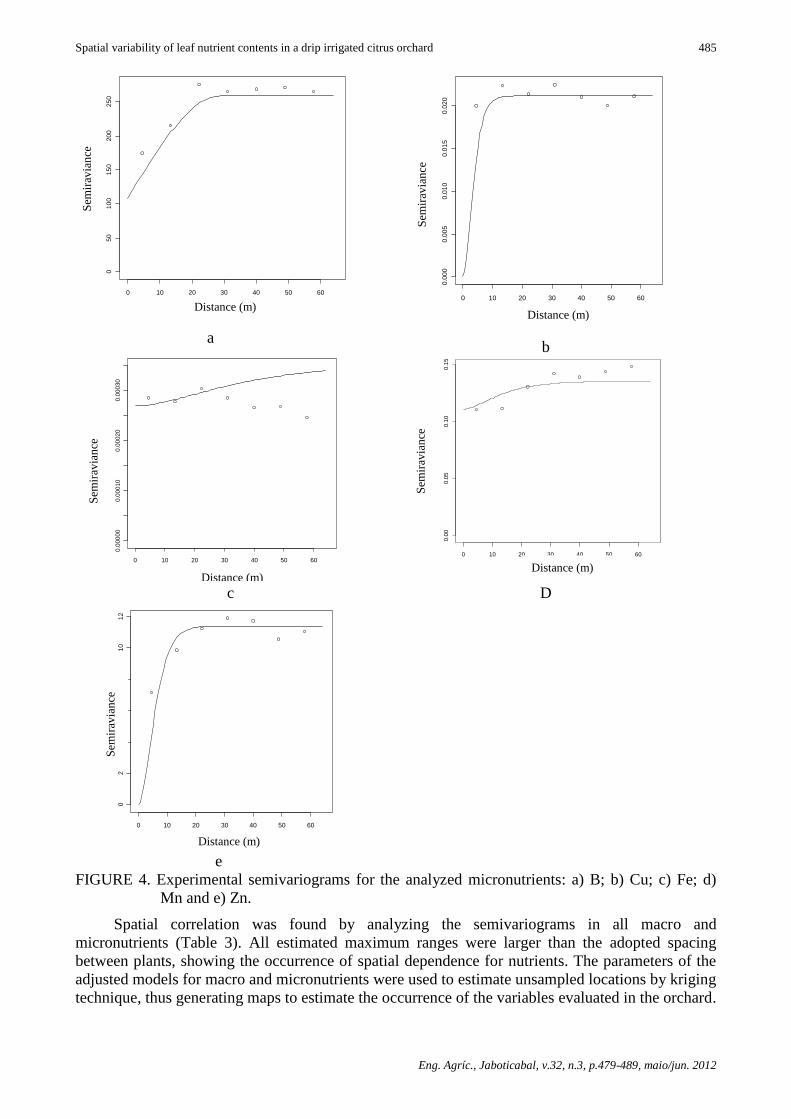
FIGURE 4. Experimental semivariograms for the analyzed micronutrients: a) B; b) Cu; c) Fe; d)
Mn and e) Zn.
Spatial correlation was found by analyzing the semivariograms in all macro and
micronutrients (Table 3). All estimated maximum ranges were larger than the adopted spacing
between plants, showing the occurrence of spatial dependence for nutrients. The parameters of the
adjusted models for macro and micronutrients were used to estimate unsampled locations by kriging
technique, thus generating maps to estimate the occurrence of the variables evaluated in the orchard.
Sem
irav
ian
ce
Sem
irav
ian
ce
Sem
irav
ian
ce
Sem
irav
ian
ce
Sem
irav
ian
ce
Distance (m)
Distance (m) Distance (m)
Distance (m) Distance (m)
Robson A. Armindo, Rubens D. Coelho, Marconi B. Teixeira et al.
Eng. Agríc., Jaboticabal, v.32, n.3, p.479-489, maio/jun. 2012
486
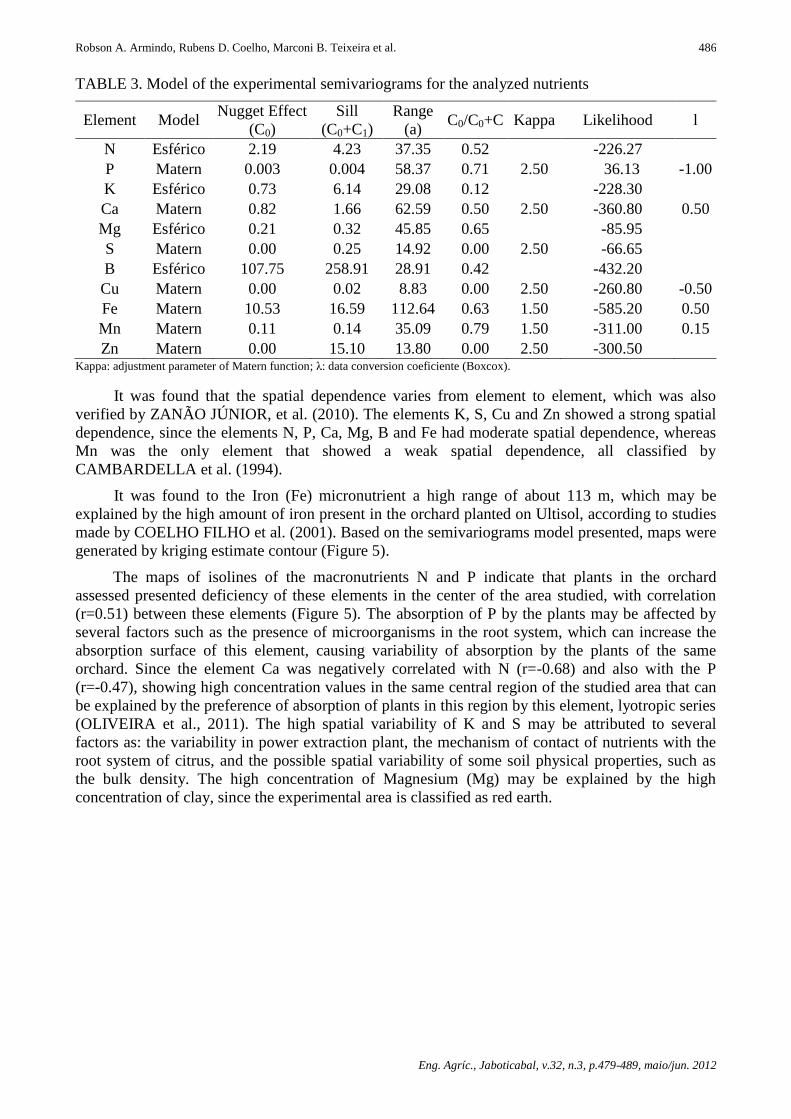
TABLE 3. Model of the experimental semivariograms for the analyzed nutrients
Element Model Nugget Effect
(C0)
Sill
(C0+C1)
Range
(a) C0/C0+C Kappa Likelihood l
N Esférico 2.19 4.23 37.35 0.52 -226.27
P Matern 0.003 0.004 58.37 0.71 2.50 36.13 -1.00
K Esférico 0.73 6.14 29.08 0.12 -228.30
Ca Matern 0.82 1.66 62.59 0.50 2.50 -360.80 0.50
Mg Esférico 0.21 0.32 45.85 0.65 -85.95
S Matern 0.00 0.25 14.92 0.00 2.50 -66.65
B Esférico 107.75 258.91 28.91 0.42 -432.20
Cu Matern 0.00 0.02 8.83 0.00 2.50 -260.80 -0.50
Fe Matern 10.53 16.59 112.64 0.63 1.50 -585.20 0.50
Mn Matern 0.11 0.14 35.09 0.79 1.50 -311.00 0.15
Zn Matern 0.00 15.10 13.80 0.00 2.50 -300.50 Kappa: adjustment parameter of Matern function; λ: data conversion coeficiente (Boxcox).
It was found that the spatial dependence varies from element to element, which was also
verified by ZANÃO JÚNIOR, et al. (2010). The elements K, S, Cu and Zn showed a strong spatial
dependence, since the elements N, P, Ca, Mg, B and Fe had moderate spatial dependence, whereas
Mn was the only element that showed a weak spatial dependence, all classified by
CAMBARDELLA et al. (1994).
It was found to the Iron (Fe) micronutrient a high range of about 113 m, which may be
explained by the high amount of iron present in the orchard planted on Ultisol, according to studies
made by COELHO FILHO et al. (2001). Based on the semivariograms model presented, maps were
generated by kriging estimate contour (Figure 5).
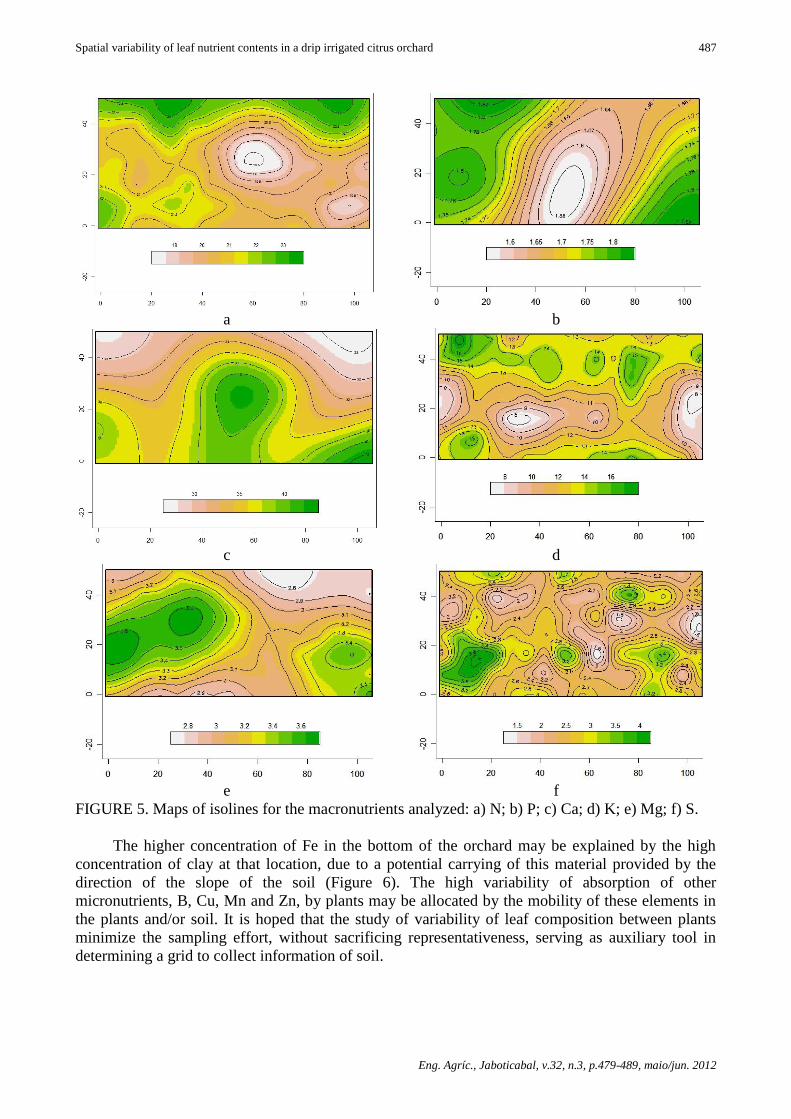
The maps of isolines of the macronutrients N and P indicate that plants in the orchard
assessed presented deficiency of these elements in the center of the area studied, with correlation
(r=0.51) between these elements (Figure 5). The absorption of P by the plants may be affected by
several factors such as the presence of microorganisms in the root system, which can increase the
absorption surface of this element, causing variability of absorption by the plants of the same
orchard. Since the element Ca was negatively correlated with N (r=-0.68) and also with the P
(r=-0.47), showing high concentration values in the same central region of the studied area that can
be explained by the preference of absorption of plants in this region by this element, lyotropic series
(OLIVEIRA et al., 2011). The high spatial variability of K and S may be attributed to several
factors as: the variability in power extraction plant, the mechanism of contact of nutrients with the
root system of citrus, and the possible spatial variability of some soil physical properties, such as
the bulk density. The high concentration of Magnesium (Mg) may be explained by the high
concentration of clay, since the experimental area is classified as red earth.
Spatial variability of leaf nutrient contents in a drip irrigated citrus orchard
Eng. Agríc., Jaboticabal, v.32, n.3, p.479-489, maio/jun. 2012
487
a b
c d
e f
FIGURE 5. Maps of isolines for the macronutrients analyzed: a) N; b) P; c) Ca; d) K; e) Mg; f) S.
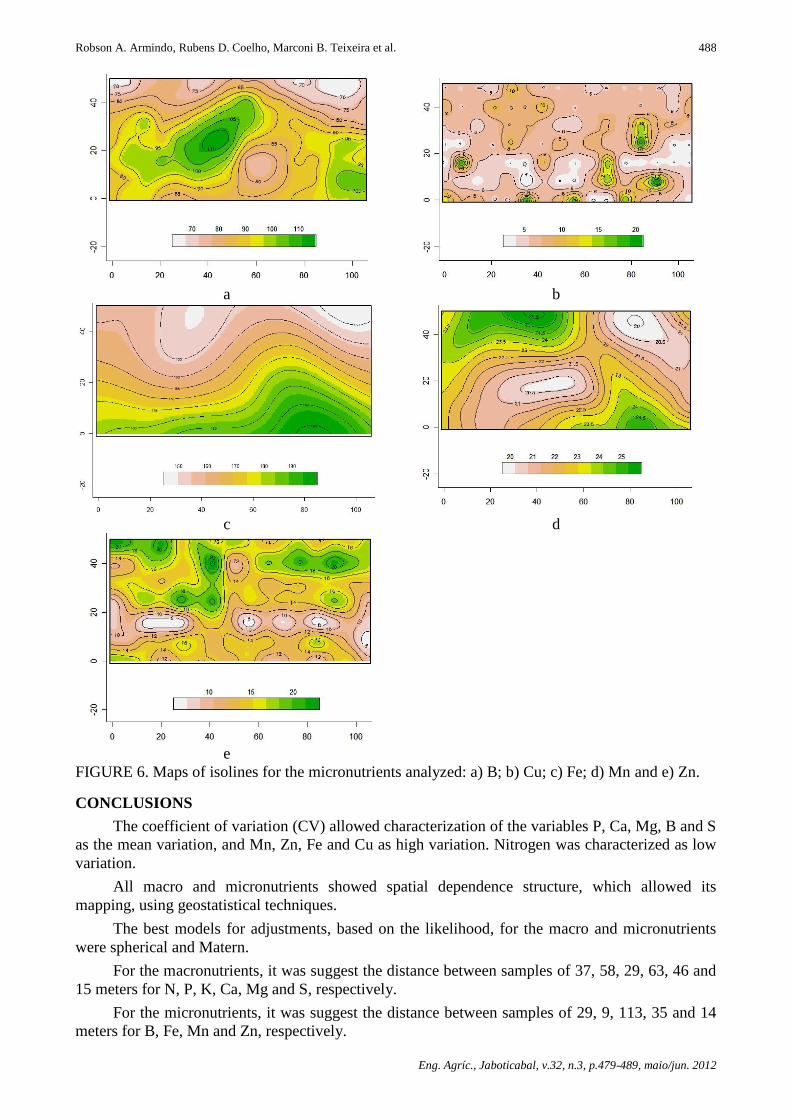
The higher concentration of Fe in the bottom of the orchard may be explained by the high
concentration of clay at that location, due to a potential carrying of this material provided by the
direction of the slope of the soil (Figure 6). The high variability of absorption of other
micronutrients, B, Cu, Mn and Zn, by plants may be allocated by the mobility of these elements in
the plants and/or soil. It is hoped that the study of variability of leaf composition between plants
minimize the sampling effort, without sacrificing representativeness, serving as auxiliary tool in
determining a grid to collect information of soil.
Robson A. Armindo, Rubens D. Coelho, Marconi B. Teixeira et al.
Eng. Agríc., Jaboticabal, v.32, n.3, p.479-489, maio/jun. 2012
488
a b
c d
e
FIGURE 6. Maps of isolines for the micronutrients analyzed: a) B; b) Cu; c) Fe; d) Mn and e) Zn.
CONCLUSIONS
The coefficient of variation (CV) allowed characterization of the variables P, Ca, Mg, B and S
as the mean variation, and Mn, Zn, Fe and Cu as high variation. Nitrogen was characterized as low
variation.
All macro and micronutrients showed spatial dependence structure, which allowed its
mapping, using geostatistical techniques.
The best models for adjustments, based on the likelihood, for the macro and micronutrients
were spherical and Matern.
For the macronutrients, it was suggest the distance between samples of 37, 58, 29, 63, 46 and
15 meters for N, P, K, Ca, Mg and S, respectively.
For the micronutrients, it was suggest the distance between samples of 29, 9, 113, 35 and 14
meters for B, Fe, Mn and Zn, respectively.
Spatial variability of leaf nutrient contents in a drip irrigated citrus orchard
Eng. Agríc., Jaboticabal, v.32, n.3, p.479-489, maio/jun. 2012
489
ACKNOWLEDGEMENT
The authors thank the Ministry of Science and Technology (MCT), the National Council for
Scientific and Technological Development (CNPq) and Foundation for Research Support of São
Paulo (FAPESP), for financially supporting this research through the Nacional Institute of Science
and Technology in Irrigation Engineering (INCTEI).
REFERENCES
BARBIERI, D.M.; MARQUES JUNIOR, J.; PEREIRA, G.T. Variabilidade espacial de atributos
químicos de um argissolo para aplicação de insumos à taxa variável em diferentes formas de relevo.
Engenharia Agrícola, Jaboticabal, v.28, n.4, p.645-653, 2008.
CAMBARDELLA, C.A.; MOORMAN, T.B.; NOVAK, J.M.; PARKIN, T.B.; TURCO, R.F.;
KONOPKA, A.E. Field-scale variability of soil properties in central Iowa soils. Soil Science Society
of America Journal, Madison, v.58, n.5, p.1.501-1.511, 1994.
CAMPOS, M.C.C.; MARQUES JÚNIOR, J.; PEREIRA, G.T.; SOUZA, Z.M. de; MONTANARI,
R. Planejamento agrícola e implantação de sistema de cultivo de cana-de-açúcar com auxílio de
técnicas geoestatísticas. Revista Brasileira de Engenharia Agrícola Ambiental, Campina Grande,
v.13, n.3, p.297-304, 2009.
COELHO FILHO, M.A.; COELHO R.D.; GONÇALVES, A.C.A. Variabilidade espacial de
variáveis físico-hídricas do solo em um pomar de lima ácida Tahiti, irrigado por microaspersão.
Revista Brasileira de Engenharia Agrícola Ambiental, Campina Grande, v.5, n.2, p.239-246, 2001.
FARIAS, P.R.S.; NOCITI, L.A.S.; BARBOSA, J.C.; PERECIN, D. Agricultura de precisão:
mapeamento da produtividade em pomares cítricos usando geoestatística. Revista Brasileira de
Fruticultura, Jaboticabal, v.25, n.2, p.235-241, 2003.
GOMES, N.M.; SILVA, A.M.; MELLO, C.R.; FARIA, M.A.; OLIVEIRA, P.M. Métodos de ajuste
e modelos de semivariograma aplicados ao estudo da variabilidade espacial de atributos físico-
hídricos do solo. Revista Brasileira de Ciência do Solo, Viçosa, v.31, p.435-443, maio/jun. 2007.
MALAVOLTA, E. Manual de nutrição mineral de plantas. São Paulo: Ceres, 2006. 638 p.
MOLIN, J.P.; MASCARIN, L.S. Colheita de citros e obtenção de dados para mapeamento da
produtividade. Engenharia Agrícola, Jaboticabal, v.27, n.1, p. 259-266, 2007.
MONTANARI, R.; PEREIRA, G.T.; MARQUES JÚNIOR, J.; SOUZA, Z.M.; PAZETO, R.J.;
CAMARGO, L.A. Variabilidade espacial de atributos químicos em Latossolo e Argissolos. Ciência
Rural, Santa Maria, v.38, p.1266-1272, ago/set. 2008.
OLIVEIRA, F.A.; MEDEIROS, J.F.; DUARTE, S.N.; SILVA JÚNIOR, M.J.; CAMPELO, C.H.
Calibração de extratores providos de cápsula porosa para monitoramento da salinidade e da
concentração de íons. Engenharia Agrícola, Jaboticabal, v.31, n.3, p.520-528, 2011.
RAIJ, B. van; CANTARELLA, H.; QUAGGIO, J.A.; FURLANI, A.M.C. Recomendações
deadubação e calagem para o Estado de São Paulo. 2.ed. Campinas: Instituto
Agronômico/Fundação IAC, 1997. 285 p. (Boletim Técnico, 100).
TRANGMAR, B.B.; YOST, R.S.; UEHARA, G. Applications of geoestatistics to spatial studies of
soil proprieties. Advances in Agronomy, Kent, v.38, p.45-94, 1985.
WARRICK, A.W.; NIELSEN, D.R. Sapatial variability of soil physical properties in the field. In:
HILLEL, D. Application of soil physics. New York: Academic Press, 1980. v.1, p.319-344.
ZANÃO JÚNIOR, L.A.; LANA, R.M.Q.; GUIMARÃES, E.C.; PEREIRA, J.M.A. Variabilidade
espacial dos teores de macronutrientes em latossolos sob sistema plantio direto. Revista Brasileira
de Ciência do Solo, v.34, p.389-400, set/out. 2010.