Spatial patterns in the brood combs of Nannotrigona ...
12
©FUNPEC-RP www.funpecrp.com.br Genetics and Molecular Research 8 (2): 577-588 (2009) Spatial patterns in the brood combs of Nannotrigona testaceicornis (Hymenoptera: Meliponinae): male clusters A. Eterovic 1,2 , G.C.P. Cabral 3 , A.A. Oliveira 2 , V.L. Imperatriz-Fonseca 2,3 and P.S. Santos-Filho 2 1 Centro de Ciências Naturais e Humanas, Universidade Federal do ABC, Santo André, SP, Brasil 2 Departamento de Ecologia, Instituto de Biociências, Universidade de São Paulo, São Paulo, SP, Brasil 3 Departamento de Biologia, Faculdade de Filosofia, Ciências e Letras de Ribeirão Preto, Universidade de São Paulo, Ribeirão Preto, SP, Brasil Corresponding author: P.S. Santos-Filho E-mail: [email protected] Genet. Mol. Res. 8 (2): 577-588 (2009) Received December 12, 2008 Accepted January 26, 2009 Published May 19, 2009 ABSTRACT. Genetic models of sex and caste determination in euso- cial stingless bees suggest specific patterns of male, worker and gyne cell distribution in the brood comb. Conflict between queen and laying workers over male parentage and center-periphery gradients of condi- tions, such as food and temperature, could also contribute to non-ran- dom spatial configuration. We converted the positions of the hexagonal cells in a brood comb to Cartesian coordinates, labeled by sex or caste of the individuals inside. To detect and locate clustered patterns, the mapped brood combs were evaluated by indexes of dispersion (MMC, mean distance of cells of a given category from their centroid) and ec- centricity (DMB, distance between this centroid and the overall brood comb centroid) that we developed. After randomizing the labels and recalculating the indexes, we calculated probabilities that the original values had been generated by chance. We created sets of binary brood
Transcript of Spatial patterns in the brood combs of Nannotrigona ...
©FUNPEC-RP www.funpecrp.com.brGenetics and Molecular Research 8 (2): 577-588 (2009)
Spatial patterns in the brood combs of Nannotrigona testaceicornis (Hymenoptera: Meliponinae): male clusters
A. Eterovic1,2, G.C.P. Cabral3, A.A. Oliveira2, V.L. Imperatriz-Fonseca2,3 and P.S. Santos-Filho2
1Centro de Ciências Naturais e Humanas,Universidade Federal do ABC, Santo André, SP, Brasil2Departamento de Ecologia, Instituto de Biociências,Universidade de São Paulo, São Paulo, SP, Brasil3Departamento de Biologia, Faculdade de Filosofia,Ciências e Letras de Ribeirão Preto, Universidade de São Paulo,Ribeirão Preto, SP, Brasil
Corresponding author: P.S. Santos-FilhoE-mail: [email protected]
Genet. Mol. Res. 8 (2): 577-588 (2009)Received December 12, 2008Accepted January 26, 2009Published May 19, 2009
ABSTRACT. Genetic models of sex and caste determination in euso-cial stingless bees suggest specific patterns of male, worker and gyne cell distribution in the brood comb. Conflict between queen and laying workers over male parentage and center-periphery gradients of condi-tions, such as food and temperature, could also contribute to non-ran-dom spatial configuration. We converted the positions of the hexagonal cells in a brood comb to Cartesian coordinates, labeled by sex or caste of the individuals inside. To detect and locate clustered patterns, the mapped brood combs were evaluated by indexes of dispersion (MMC, mean distance of cells of a given category from their centroid) and ec-centricity (DMB, distance between this centroid and the overall brood comb centroid) that we developed. After randomizing the labels and recalculating the indexes, we calculated probabilities that the original values had been generated by chance. We created sets of binary brood
578
©FUNPEC-RP www.funpecrp.com.brGenetics and Molecular Research 8 (2): 577-588 (2009)
A. Eterovic et al.
combs in which males were aggregated, regularly or randomly distrib-uted among females. These stylized maps were used to describe the power of MMC and DMB, and they were applied to evaluate the male distribution in the sampled Nannotrigona testaceicornis brood combs. MMC was very sensitive to slight deviations from a perfectly rounded clump; DMB detected any asymmetry in the location of these compact to fuzzy clusters. Six of the 82 brood combs of N. testaceicornis that we analyzed had more than nine males, distributed according to variations in spatial patterns, as indicated by the two indexes.
Key words: Brood combs; Male clusters; Nannotrigona;Randomization; Spatial distribution
InTROduCTIOn
The great majority of stingless bee species build regular discoid, one-cell-thick brood combs. They are built in a roughly centrifugal pattern that generally results in a circular-shaped comb, which is observed as a randomly generated brood comb. How-ever, irregular shapes are not unusual. There are two main construction patterns of brood combs: in the first, cells are built, provisioned with food and oviposited in one by one, and in the second, many brood cells are built almost simultaneously, then provisioned and oviposited as a batch (Zucchi et al., 1999; Cepeda, 2006).
After construction of the central cell on the top of the most recently completed comb, the next cells are continuously added around this first cell, in concentric layers. The construc-tion of the next comb starts shortly before the previous one reaches its final size (Sakagami, 1982; Koedam, 1999). The centrifugal construction pattern of brood cells by workers leads to a temporal pattern from the center to the periphery. This is an important gradient associated with physical structure of a completed brood comb.
One may find in a brood comb from one to three categories of individuals, males, workers and gynes, in any combination of them. The simplest spatial patterns of the sexes and castes in a regular brood comb range from random through uniform, to aggregate. More complex patterns result when these simple distributions are combined.
Beyond the pure description of the distribution of sexes and castes in the brood comb, their spatial analysis allows contrast with theoretical expectations based on the biological gen-eration of such patterns. Sex determination theories generate predictions of expected spatial pat-terns associated with males and females. Queens do lay both haploid and diploid eggs and can control egg fertilization; nonetheless, the exact order in which queens lay these eggs is not well known. Hence there is no a priori reason to expect any particular spatial pattern for either sex.
On the other hand, Kerr’s theory of caste determination in Melipona (e.g., Kerr, 1950, 1969) in which double heterozygotes become queens whenever the nutritional level is high, allows predicting that the spatial distribution of queens should be random in the brood comb. Similarly, the caste determination theory of Ratnieks (1991), based on a single allele, which should occur in all females and that by a “coin flipping” mechanism generates queens, also results in an expected random distribution of queens in the comb. In fact, randomly distributed queen cells have been found frequently (Kerr, 1948; Koedam et al., 1995; results in Koedam,
579
©FUNPEC-RP www.funpecrp.com.brGenetics and Molecular Research 8 (2): 577-588 (2009)
Male clusters in Nannotrigona testaceicornis
1999, after Bonferroni’s correction; Moo-Valle et al., 2004). Due to simple complementarity, worker cells can also be expected to be casually spaced. Diploid males are expected to occur as a fraction of diploid eggs. Hence they would also be expected to be randomly distributed.
As workers do provision brood cells, any spatial pattern or gradient in the amount of food provisioned per brood cell can potentially affect caste determination in those species in which nutrition is involved, such as Melipona species. Those stingless bees, which build royal cells au-tomatically, provide larger amount of food that is proportional to the great volume of such cells.
Generally, workers in stingless bees do have developed ovaries (Sakagami et al., 1963) and can oviposit both trophic and reproductive haploid eggs. As a consequence, there generally is a conflict between the queen and reproductive workers over parentage of males. Kin selection theory predicts that given the relatedness asymmetries between each party and the other’s offspring, both the queen and the workers would be selected to produce all males.
As generally two or more brood combs are in simultaneous construction and workers tend to preferentially lay their male eggs in the first cells of the newest comb, the resulting pat-tern is a central aggregation of male cells (Kerr, 1950; Koedam, 1999; Moo-Valle et al., 2004; Koedam et al., 1999, 2005). At least in Melipona subnitida, the queen also has this preference for the first cells, but to a lower degree than the workers (Koedam et al., 2005).
It is conceivable that there are center-periphery gradients in food amount per cell and temperature, which may interact in a complex way with the centrifugal timing of construction of the brood comb. For instance, it has been suggested that Melipona males are concentrated in the center of the comb because of larger portions of pollen (Moo-Valle et al., 2004). However, at least in M. quadrifasciata, central cells have been found to have less food (Koedam, 1999).
We examined the bidimensional structure of a brood comb using orthogonal Cartesian coordinates. We also looked at the spatial distribution pattern of each sex/caste in brood combs of Nannotrigona testaceicornis.
MATERIAL And METHOdS
We designed an Excel worksheet for studying spatial distributions in brood combs. In the first row, pairs of cells were merged, resulting in perfect squares. In the row below, cells were merged in the same fashion, but with a lag of one cell to the preceding row. This work-sheet resembles a wall of squared bricks, which are surrounded by six other bricks (two in the row above, two in the same row and two in the row below), exactly as the hexagonal cells in a real brood comb. Each cell could be labeled as empty or as occupied by a male, a worker or a gyne pupa; according to what was observed in a real (or in a stylized) brood comb. In this way, we can make maps of each brood comb. We assigned a pair of relative Cartesian coordinates (column X; row Y) to each cell, based on its position in the worksheet. These coordinates were corrected so as to allow the same distance (equal to unity) between the centers of two adjacent cells. Based on this particular arrangement of the map in such worksheet, a three-column file (labels plus XY coordinates) was automatically generated for posterior analysis.
We propose two indexes to describe the spatial distribution of male cells in a given brood comb:
i) Mean Euclidean distance of male cells from the male centroid (MMC). Such cen-troid coordinates are the average X and Y coordinates of all the male cells in the brood comb. This measure indicates how males are dispersed and how compact (rounded) their cluster is in
580
©FUNPEC-RP www.funpecrp.com.brGenetics and Molecular Research 8 (2): 577-588 (2009)
A. Eterovic et al.
the brood comb. This is an index of dispersion or, complementarily, an index of aggregation, measured in cell units. ii) Distance between the male centroid and the brood comb centroid (DMB). The brood comb centroid coordinates are the average X and Y coordinates of all the cells, occupied or not. This measure indicates the displacement of the males’ distribution from the center of the brood comb, independently whether they form a compact or a fuzzy cluster of males. This is an index of eccentricity, also measured in cell units.
To evaluate accuracy, precision and sensitivity of the indexes MMC and DMB for describing the spatial pattern of the brood comb, we create stylized binary brood comb maps. They have the same size (271 cells) and shape - a regular hexagon of 10 bands of cells around the central one, with a fixed numbers of worker (210) and male (61) cells. In the first block of nine maps, there are three different degrees of male aggregation, with such clusters purposely located in three different positions, far from the brood comb center (AGG maps). In the second block, we designed three different patterns of regular distribution: groups of one, two or three adjacent male cells uniformly spaced by worker cells (REG maps). In the third block, three maps presented random distributions of male among worker cells (RND maps).
For each map, we computed the indexes MMC and DMB; these values for different sets of maps were compared by semi-parametric tests (ANOVA on ranks). The relationship between such indexes was assessed by linear correlation.
We randomized the cell labels but fixed the XY coordinates, thus maintaining the size and shape of the original brood comb. At each run (N = 100), we recalculated the MMC index. The original value was compared to these randomly generated values, allowing the empirical computation of the probability associated with this value, by counting the number of values lower than the observed MMC. These P values were estimated to the nearest 0.01 level. Low P values indicate that males are significantly aggregated, tending to a compact, round cluster. By an analog procedure, we obtained a randomly generated distribution of DMB values, allowing us to assess the significance of the original DMB measure for a given brood comb. Low P values indicate that male cluster (or male “cloud”) is significantly distant from the brood comb center.
Brood combs (N = 82) of 10 captive colonies maintained in Ribeirão Preto, São Paulo State, Brazil (21.18 S, 47.81 W), were sampled from July 2006 to March 2007. After remov-ing their opercula, the cells were checked for the sex and caste of pupae inside (as in Koedam, 1999). Maps of such brood combs were constructed as above. Only six maps with more than nine male cells were assessed by the same process used to describe the stylized maps.
RESuLTS And dISCuSSIOn
The conversion of the bidimensional location of all the brood comb cells into rows of XY labeled coordinates allowed a distance-based approach for the map structure. In turn, centroids of the clouds of labeled cells were intuitively and visually compelling, due to their inherent geometrical simplicity.
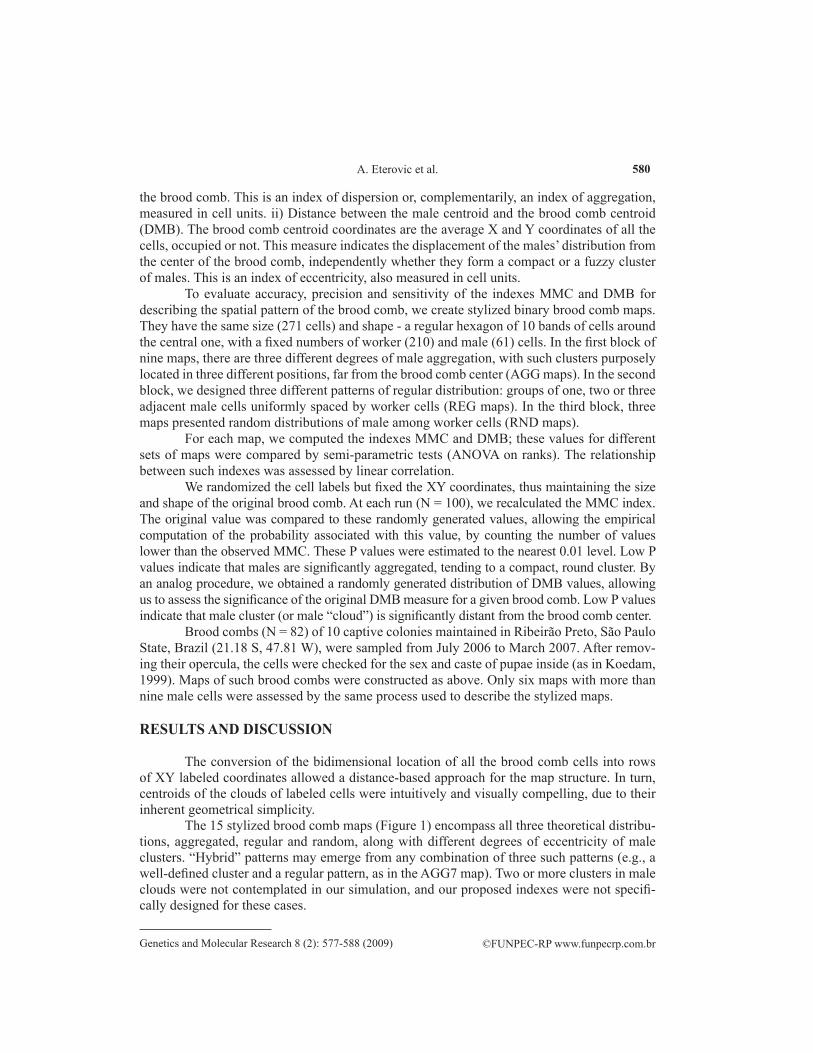
The 15 stylized brood comb maps (Figure 1) encompass all three theoretical distribu-tions, aggregated, regular and random, along with different degrees of eccentricity of male clusters. “Hybrid” patterns may emerge from any combination of three such patterns (e.g., a well-defined cluster and a regular pattern, as in the AGG7 map). Two or more clusters in male clouds were not contemplated in our simulation, and our proposed indexes were not specifi-cally designed for these cases.
581
©FUNPEC-RP www.funpecrp.com.brGenetics and Molecular Research 8 (2): 577-588 (2009)
Male clusters in Nannotrigona testaceicornis
Figure 1. Stylized binary brood comb maps of the same size (271 cells) and shape (regular hexagons of 10 bands of cells around the central part) generated with fixed numbers of worker (210, white) and male (61, black) cells. The first block of nine maps has three different degrees of male aggregation, with these clusters located at three different distances from the brood comb center (AGG1 to AGG9). The second block has a regular distribution of small clusters of male cells uniformly spaced by worker cells (REG1 to REG3). The third block has random distributions of male among worker cells (RND1 to RND3).
The nine AGG maps (Figure 1) may be grouped in sets of three maps according to two different modes. In the first mode, the set Ia comprises maps AGG1, AGG2, and AGG3; set IIa comprises AGG4, AGG5, and AGG6, and set IIIa comprises AGG7, AGG8, and AGG9. These sets differed in the degree of male dispersion. In the second mode, the set Ib comprises maps AGG1, AGG4, and AGG7; set IIb comprises AGG2, AGG5, and AGG8, and set IIIb comprises AGG3, AGG6, and AGG9. These sets differed in the degree of eccentricity of the male cluster. REG and RND maps (respectively, set IV and set V) did not present any internal differences in dispersion or eccentricity (Figure 1).
582
©FUNPEC-RP www.funpecrp.com.brGenetics and Molecular Research 8 (2): 577-588 (2009)
A. Eterovic et al.
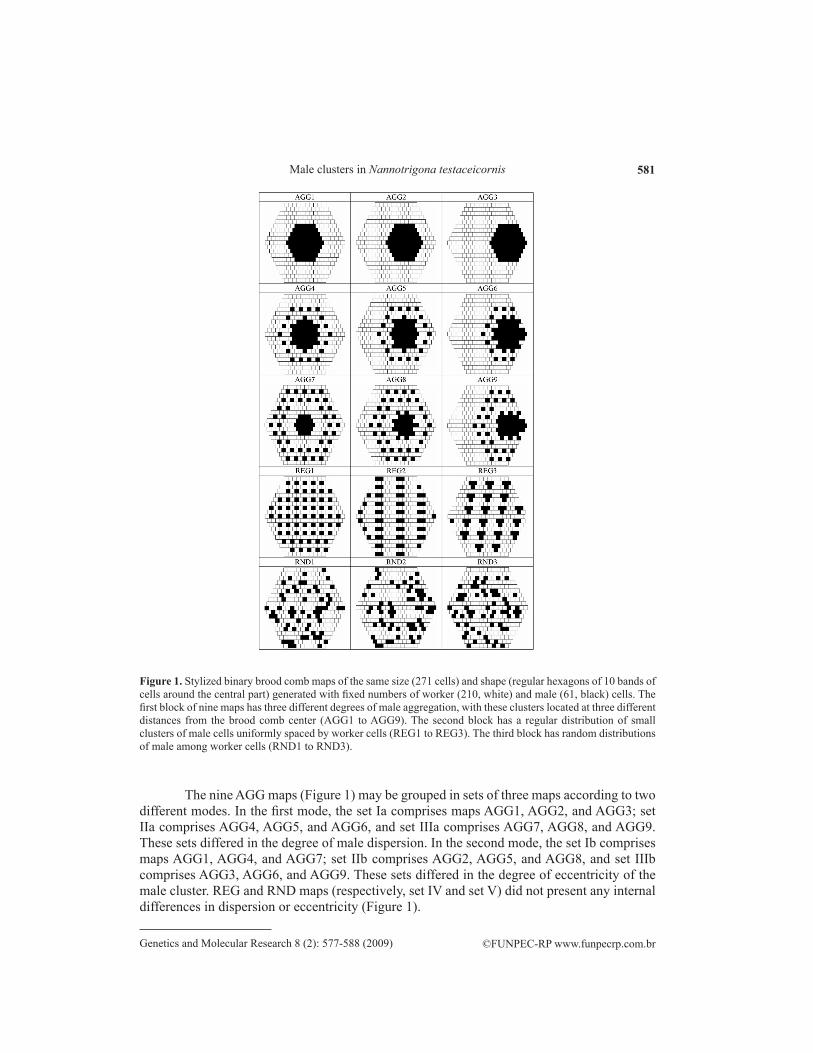
Figure 2. Dispersion of males, as measured by MMC index (mean distance of male cells from the male centroid) in five sets of three stylized maps. Sets Ia, IIa, and IIIa include AGG maps (aggregated pattern, grouped by the first mode; see text). Set IV includes REG maps (regular pattern) and set V, RND maps (random pattern). All sets have three maps. Whiskers are standard deviations. There were significant differences between sets (ANOVA on ranks: F = 32.25, P < 0.001). HSD Tukey test gave Ia = IIa, IIa = IIIa, and IV = V (the remaining pairwise comparisons are significant).
Figure 3. Eccentricity of male cluster in the brood comb, as measured by DMB index (distance of male centroid from the brood comb centroid) in five sets of three stylized maps. Sets Ia, IIa, and IIIa include AGG maps (aggregated pattern, grouped by the first mode; see text). Set IV includes REG maps (regular pattern) and set V, RND maps (random pattern). All sets have three maps. Whiskers are standard deviations. There are no significant differences between sets (ANOVA on ranks: F = 0.38, P = 0.815).
When the “aggregated block” was split according to the first mode, there were sig-nificant differences in the dispersion pattern of males between the five map sets (ANOVA on ranks F = 32.25, P < 0.001). By MMC measures, set Ia was similar to set IIa, and set IIa was similar to IIIa, as well the pair IV-V (HSD Tukey, P > 0.14 in these pairwise comparisons, Figure 2). However, these five map sets did not differ in eccentricity of male clusters (ANOVA on ranks F = 0.38, P = 0.815), assessed by DMB measures (Figure 3).
583
©FUNPEC-RP www.funpecrp.com.brGenetics and Molecular Research 8 (2): 577-588 (2009)
Male clusters in Nannotrigona testaceicornis
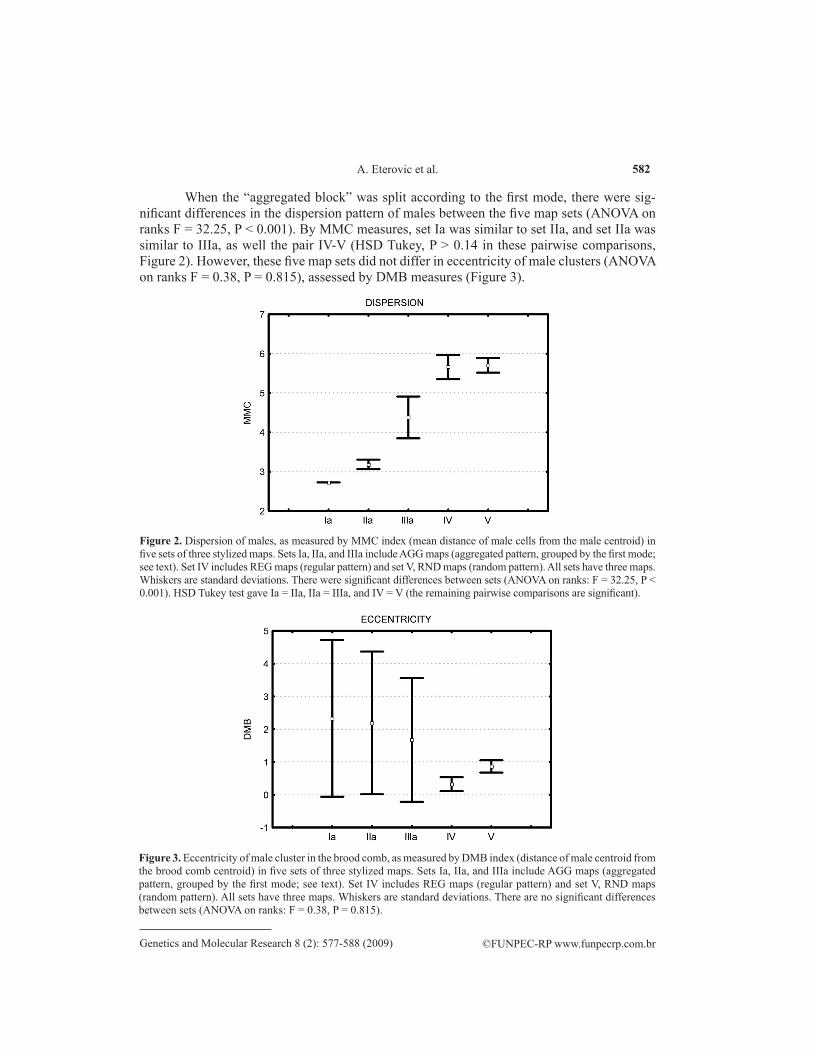
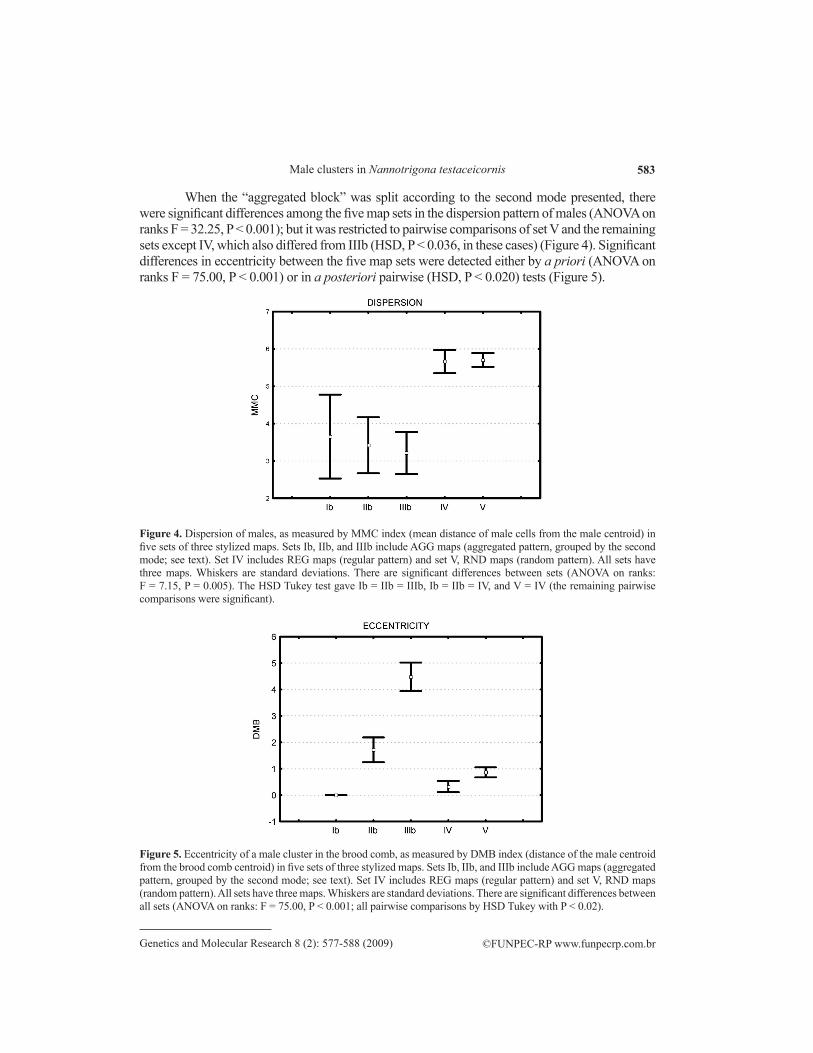
When the “aggregated block” was split according to the second mode presented, there were significant differences among the five map sets in the dispersion pattern of males (ANOVA on ranks F = 32.25, P < 0.001); but it was restricted to pairwise comparisons of set V and the remaining sets except IV, which also differed from IIIb (HSD, P < 0.036, in these cases) (Figure 4). Significant differences in eccentricity between the five map sets were detected either by a priori (ANOVA on ranks F = 75.00, P < 0.001) or in a posteriori pairwise (HSD, P < 0.020) tests (Figure 5).
Figure 4. Dispersion of males, as measured by MMC index (mean distance of male cells from the male centroid) in five sets of three stylized maps. Sets Ib, IIb, and IIIb include AGG maps (aggregated pattern, grouped by the second mode; see text). Set IV includes REG maps (regular pattern) and set V, RND maps (random pattern). All sets have three maps. Whiskers are standard deviations. There are significant differences between sets (ANOVA on ranks: F = 7.15, P = 0.005). The HSD Tukey test gave Ib = IIb = IIIb, Ib = IIb = IV, and V = IV (the remaining pairwise comparisons were significant).
Figure 5. Eccentricity of a male cluster in the brood comb, as measured by DMB index (distance of the male centroid from the brood comb centroid) in five sets of three stylized maps. Sets Ib, IIb, and IIIb include AGG maps (aggregated pattern, grouped by the second mode; see text). Set IV includes REG maps (regular pattern) and set V, RND maps (random pattern). All sets have three maps. Whiskers are standard deviations. There are significant differences between all sets (ANOVA on ranks: F = 75.00, P < 0.001; all pairwise comparisons by HSD Tukey with P < 0.02).
584
©FUNPEC-RP www.funpecrp.com.brGenetics and Molecular Research 8 (2): 577-588 (2009)
A. Eterovic et al.
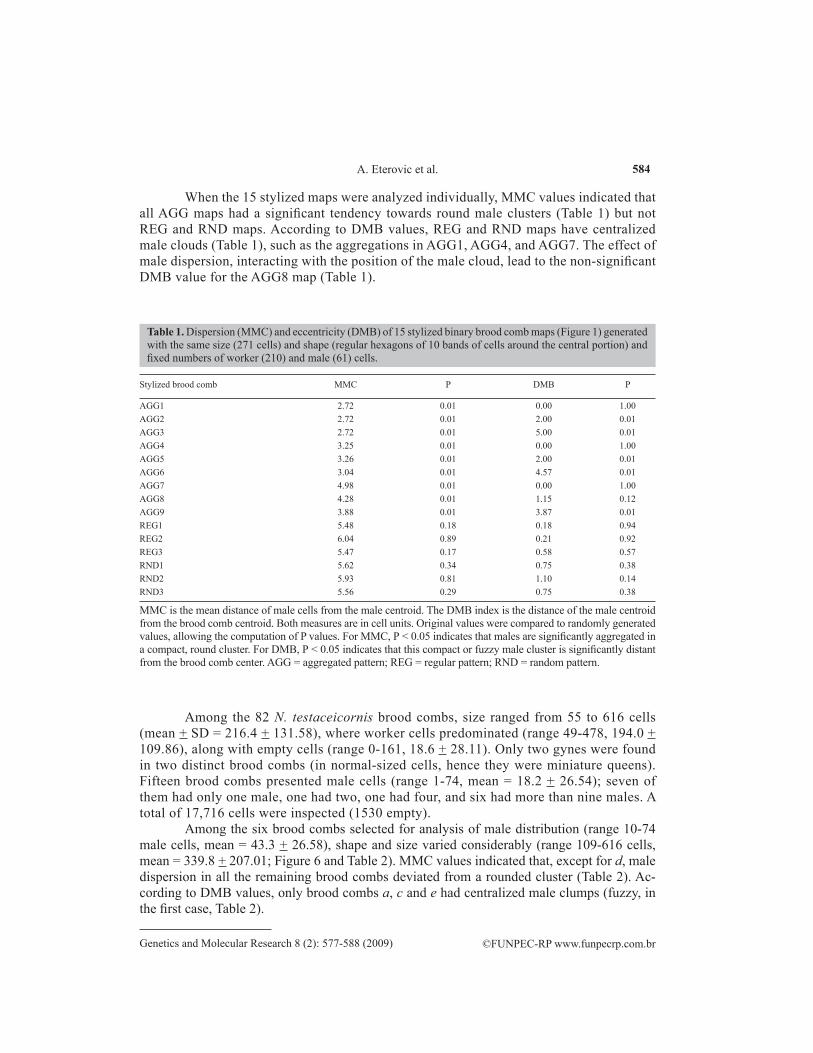
When the 15 stylized maps were analyzed individually, MMC values indicated that all AGG maps had a significant tendency towards round male clusters (Table 1) but not REG and RND maps. According to DMB values, REG and RND maps have centralized male clouds (Table 1), such as the aggregations in AGG1, AGG4, and AGG7. The effect of male dispersion, interacting with the position of the male cloud, lead to the non-significant DMB value for the AGG8 map (Table 1).
Stylized brood comb MMC P DMB P
AGG1 2.72 0.01 0.00 1.00AGG2 2.72 0.01 2.00 0.01AGG3 2.72 0.01 5.00 0.01AGG4 3.25 0.01 0.00 1.00AGG5 3.26 0.01 2.00 0.01AGG6 3.04 0.01 4.57 0.01AGG7 4.98 0.01 0.00 1.00AGG8 4.28 0.01 1.15 0.12AGG9 3.88 0.01 3.87 0.01REG1 5.48 0.18 0.18 0.94REG2 6.04 0.89 0.21 0.92REG3 5.47 0.17 0.58 0.57RND1 5.62 0.34 0.75 0.38RND2 5.93 0.81 1.10 0.14RND3 5.56 0.29 0.75 0.38
Table 1. Dispersion (MMC) and eccentricity (DMB) of 15 stylized binary brood comb maps (Figure 1) generated with the same size (271 cells) and shape (regular hexagons of 10 bands of cells around the central portion) and fixed numbers of worker (210) and male (61) cells.
MMC is the mean distance of male cells from the male centroid. The DMB index is the distance of the male centroid from the brood comb centroid. Both measures are in cell units. Original values were compared to randomly generated values, allowing the computation of P values. For MMC, P < 0.05 indicates that males are significantly aggregated in a compact, round cluster. For DMB, P < 0.05 indicates that this compact or fuzzy male cluster is significantly distant from the brood comb center. AGG = aggregated pattern; REG = regular pattern; RND = random pattern.
Among the 82 N. testaceicornis brood combs, size ranged from 55 to 616 cells (mean + SD = 216.4 + 131.58), where worker cells predominated (range 49-478, 194.0 + 109.86), along with empty cells (range 0-161, 18.6 + 28.11). Only two gynes were found in two distinct brood combs (in normal-sized cells, hence they were miniature queens). Fifteen brood combs presented male cells (range 1-74, mean = 18.2 + 26.54); seven of them had only one male, one had two, one had four, and six had more than nine males. A total of 17,716 cells were inspected (1530 empty).
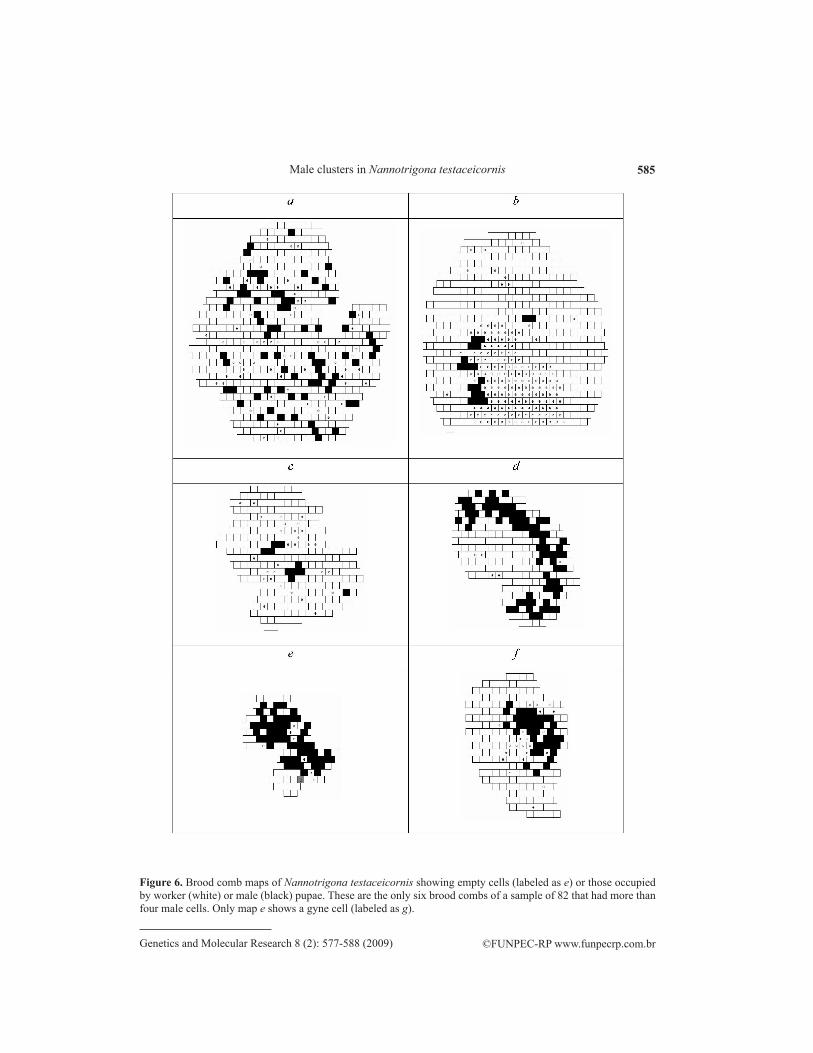
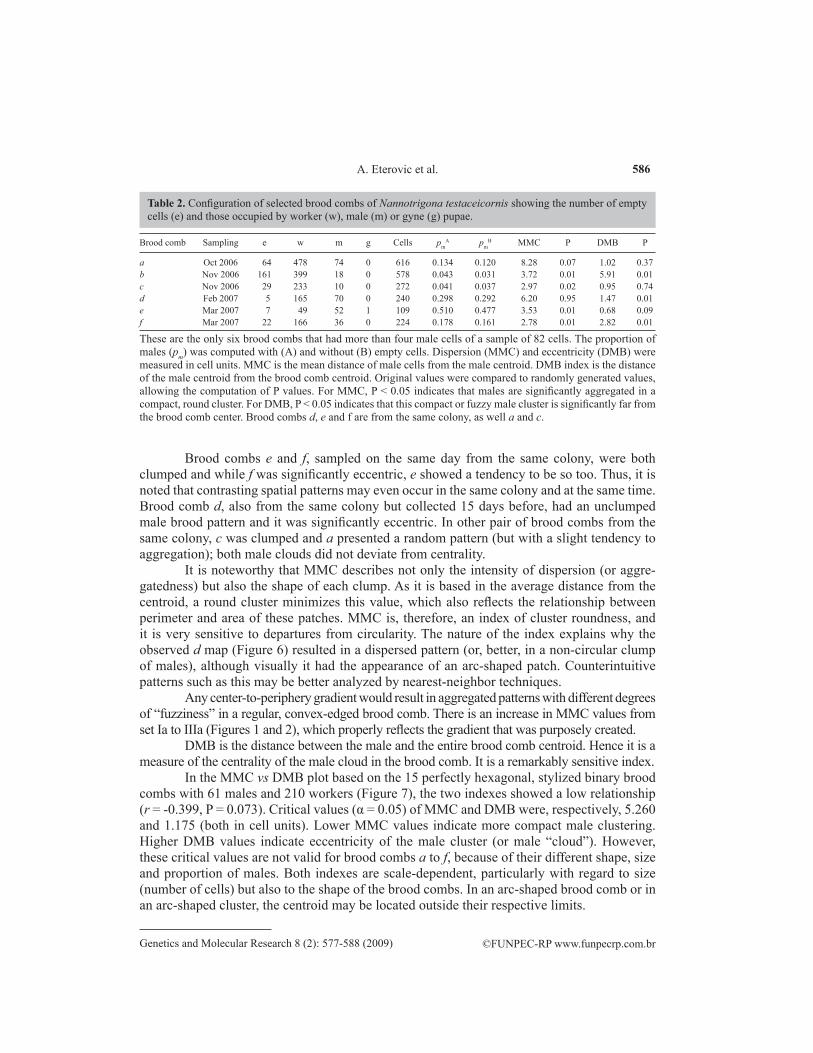
Among the six brood combs selected for analysis of male distribution (range 10-74 male cells, mean = 43.3 + 26.58), shape and size varied considerably (range 109-616 cells, mean = 339.8 + 207.01; Figure 6 and Table 2). MMC values indicated that, except for d, male dispersion in all the remaining brood combs deviated from a rounded cluster (Table 2). Ac-cording to DMB values, only brood combs a, c and e had centralized male clumps (fuzzy, in the first case, Table 2).
585
©FUNPEC-RP www.funpecrp.com.brGenetics and Molecular Research 8 (2): 577-588 (2009)
Male clusters in Nannotrigona testaceicornis
Figure 6. Brood comb maps of Nannotrigona testaceicornis showing empty cells (labeled as e) or those occupied by worker (white) or male (black) pupae. These are the only six brood combs of a sample of 82 that had more than four male cells. Only map e shows a gyne cell (labeled as g).
586
©FUNPEC-RP www.funpecrp.com.brGenetics and Molecular Research 8 (2): 577-588 (2009)
A. Eterovic et al.
Brood combs e and f, sampled on the same day from the same colony, were both clumped and while f was significantly eccentric, e showed a tendency to be so too. Thus, it is noted that contrasting spatial patterns may even occur in the same colony and at the same time. Brood comb d, also from the same colony but collected 15 days before, had an unclumped male brood pattern and it was significantly eccentric. In other pair of brood combs from the same colony, c was clumped and a presented a random pattern (but with a slight tendency to aggregation); both male clouds did not deviate from centrality.
It is noteworthy that MMC describes not only the intensity of dispersion (or aggre-gatedness) but also the shape of each clump. As it is based in the average distance from the centroid, a round cluster minimizes this value, which also reflects the relationship between perimeter and area of these patches. MMC is, therefore, an index of cluster roundness, and it is very sensitive to departures from circularity. The nature of the index explains why the observed d map (Figure 6) resulted in a dispersed pattern (or, better, in a non-circular clump of males), although visually it had the appearance of an arc-shaped patch. Counterintuitive patterns such as this may be better analyzed by nearest-neighbor techniques.
Any center-to-periphery gradient would result in aggregated patterns with different degrees of “fuzziness” in a regular, convex-edged brood comb. There is an increase in MMC values from set Ia to IIIa (Figures 1 and 2), which properly reflects the gradient that was purposely created.
DMB is the distance between the male and the entire brood comb centroid. Hence it is a measure of the centrality of the male cloud in the brood comb. It is a remarkably sensitive index.
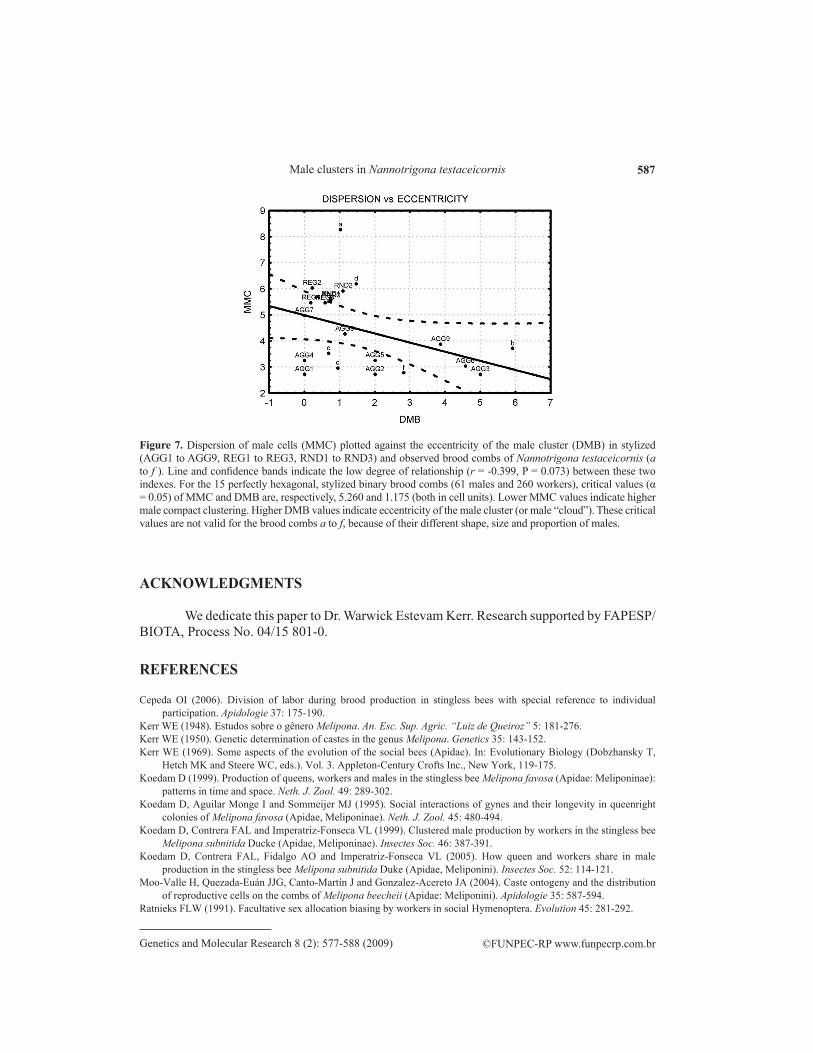
In the MMC vs DMB plot based on the 15 perfectly hexagonal, stylized binary brood combs with 61 males and 210 workers (Figure 7), the two indexes showed a low relationship (r = -0.399, P = 0.073). Critical values (α = 0.05) of MMC and DMB were, respectively, 5.260 and 1.175 (both in cell units). Lower MMC values indicate more compact male clustering. Higher DMB values indicate eccentricity of the male cluster (or male “cloud”). However, these critical values are not valid for brood combs a to f, because of their different shape, size and proportion of males. Both indexes are scale-dependent, particularly with regard to size (number of cells) but also to the shape of the brood combs. In an arc-shaped brood comb or in an arc-shaped cluster, the centroid may be located outside their respective limits.
Brood comb Sampling e w m g Cells pmA pm
B MMC P DMB P
a Oct 2006 64 478 74 0 616 0.134 0.120 8.28 0.07 1.02 0.37b Nov 2006 161 399 18 0 578 0.043 0.031 3.72 0.01 5.91 0.01c Nov 2006 29 233 10 0 272 0.041 0.037 2.97 0.02 0.95 0.74d Feb 2007 5 165 70 0 240 0.298 0.292 6.20 0.95 1.47 0.01e Mar 2007 7 49 52 1 109 0.510 0.477 3.53 0.01 0.68 0.09f Mar 2007 22 166 36 0 224 0.178 0.161 2.78 0.01 2.82 0.01
Table 2. Configuration of selected brood combs of Nannotrigona testaceicornis showing the number of empty cells (e) and those occupied by worker (w), male (m) or gyne (g) pupae.
These are the only six brood combs that had more than four male cells of a sample of 82 cells. The proportion of males (pm) was computed with (A) and without (B) empty cells. Dispersion (MMC) and eccentricity (DMB) were measured in cell units. MMC is the mean distance of male cells from the male centroid. DMB index is the distance of the male centroid from the brood comb centroid. Original values were compared to randomly generated values, allowing the computation of P values. For MMC, P < 0.05 indicates that males are significantly aggregated in a compact, round cluster. For DMB, P < 0.05 indicates that this compact or fuzzy male cluster is significantly far from the brood comb center. Brood combs d, e and f are from the same colony, as well a and c.
587
©FUNPEC-RP www.funpecrp.com.brGenetics and Molecular Research 8 (2): 577-588 (2009)
Male clusters in Nannotrigona testaceicornis
ACKnOWLEdGMEnTS
We dedicate this paper to Dr. Warwick Estevam Kerr. Research supported by FAPESP/BIOTA, Process No. 04/15 801-0.
REFEREnCES
Cepeda OI (2006). Division of labor during brood production in stingless bees with special reference to individual participation. Apidologie 37: 175-190.
Kerr WE (1948). Estudos sobre o gênero Melipona. An. Esc. Sup. Agric. “Luiz de Queiroz” 5: 181-276.Kerr WE (1950). Genetic determination of castes in the genus Melipona. Genetics 35: 143-152.Kerr WE (1969). Some aspects of the evolution of the social bees (Apidae). In: Evolutionary Biology (Dobzhansky T,
Hetch MK and Steere WC, eds.). Vol. 3. Appleton-Century Crofts Inc., New York, 119-175.Koedam D (1999). Production of queens, workers and males in the stingless bee Melipona favosa (Apidae: Meliponinae):
patterns in time and space. Neth. J. Zool. 49: 289-302.Koedam D, Aguilar Monge I and Sommeijer MJ (1995). Social interactions of gynes and their longevity in queenright
colonies of Melipona favosa (Apidae, Meliponinae). Neth. J. Zool. 45: 480-494.Koedam D, Contrera FAL and Imperatriz-Fonseca VL (1999). Clustered male production by workers in the stingless bee
Melipona subnitida Ducke (Apidae, Meliponinae). Insectes Soc. 46: 387-391.Koedam D, Contrera FAL, Fidalgo AO and Imperatriz-Fonseca VL (2005). How queen and workers share in male
production in the stingless bee Melipona subnitida Duke (Apidae, Meliponini). Insectes Soc. 52: 114-121.Moo-Valle H, Quezada-Euán JJG, Canto-Martín J and Gonzalez-Acereto JA (2004). Caste ontogeny and the distribution
of reproductive cells on the combs of Melipona beecheii (Apidae: Meliponini). Apidologie 35: 587-594.Ratnieks FLW (1991). Facultative sex allocation biasing by workers in social Hymenoptera. Evolution 45: 281-292.
Figure 7. Dispersion of male cells (MMC) plotted against the eccentricity of the male cluster (DMB) in stylized (AGG1 to AGG9, REG1 to REG3, RND1 to RND3) and observed brood combs of Nannotrigona testaceicornis (a to f ). Line and confidence bands indicate the low degree of relationship (r = -0.399, P = 0.073) between these two indexes. For the 15 perfectly hexagonal, stylized binary brood combs (61 males and 260 workers), critical values (α = 0.05) of MMC and DMB are, respectively, 5.260 and 1.175 (both in cell units). Lower MMC values indicate higher male compact clustering. Higher DMB values indicate eccentricity of the male cluster (or male “cloud”). These critical values are not valid for the brood combs a to f, because of their different shape, size and proportion of males.
588
©FUNPEC-RP www.funpecrp.com.brGenetics and Molecular Research 8 (2): 577-588 (2009)
A. Eterovic et al.
Sakagami SF (1982). Stingless Bees. In: Social Insects. (Hermann HR, ed.). Vol. 3. Academic Press, New York, 361-423.Sakagami SF, Beig D, Zucchi R and Akahira Y (1963). Occurrence of ovary developed workers in queenright colonies of
stingless bees. Rev. Bras. Biol. 23: 115-129.Zucchi R, Silva-Matos EV, Nogueira-Ferreira FH and Azevedo GG (1999). On the cell provisioning and oviposition
process (POP) of the stingless bees - Nomenclature reappraisal and evolutionary considerations (Hymenoptera, Apidae, Meliponinae). Sociobiology 34: 65-85.