Recursos Financeiros e Economia Verde · Escopo e Abrangência do Projeto Fonte: Gvces, 2014 ......
13
Recursos Financeiros e Economia Verde Paula Peirão Gvces Finanças Sustentáveis
Transcript of Recursos Financeiros e Economia Verde · Escopo e Abrangência do Projeto Fonte: Gvces, 2014 ......
Recursos Financeiros
e Economia Verde
Paula Peirão Gvces Finanças Sustentáveis
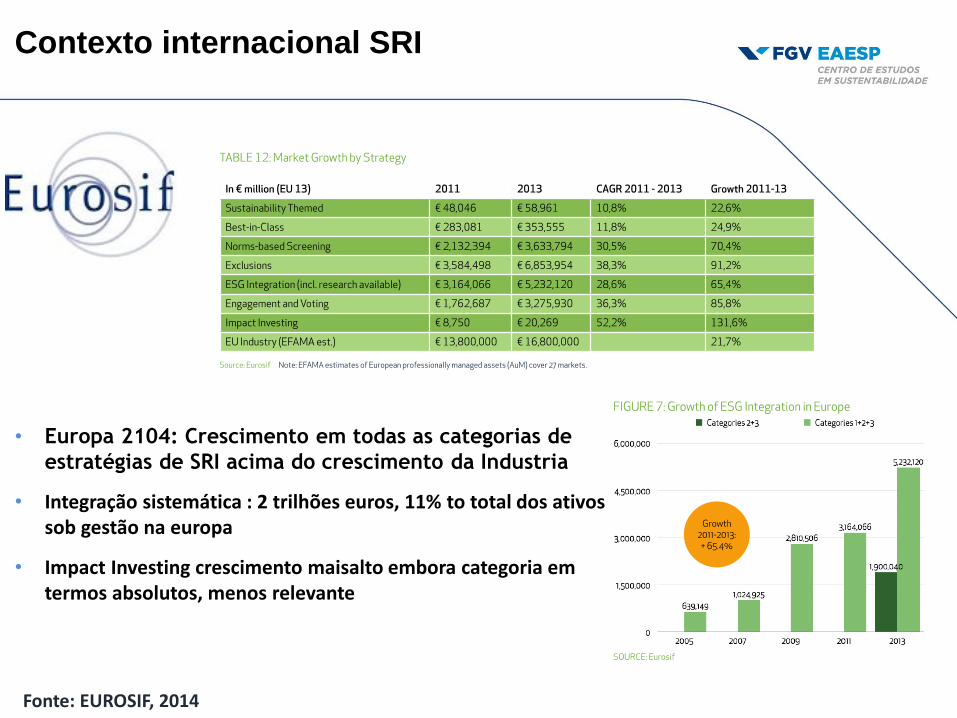
Contexto internacional SRI
• Europa 2104: Crescimento em todas as categorias de
estratégias de SRI acima do crescimento da Industria
• Integração sistemática : 2 trilhões euros, 11% to total dos ativos sob gestão na europa
• Impact Investing crescimento maisalto embora categoria em termos absolutos, menos relevante
Fonte: EUROSIF, 2014
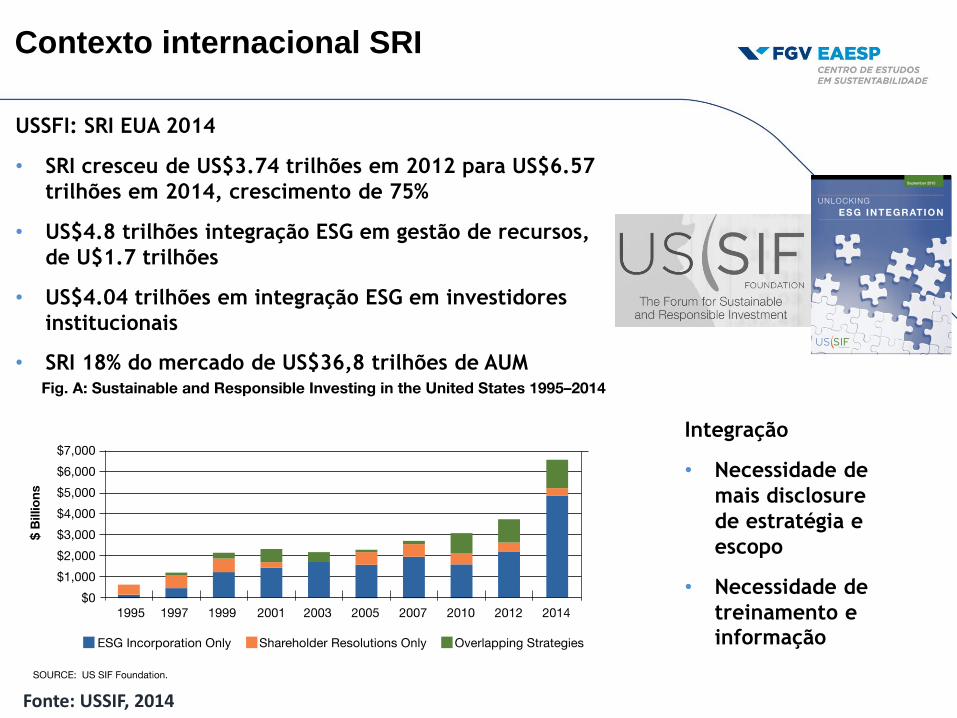
Contexto internacional SRI
USSFI: SRI EUA 2014
• SRI cresceu de US$3.74 trilhões em 2012 para US$6.57
trilhões em 2014, crescimento de 75%
• US$4.8 trilhões integração ESG em gestão de recursos,
de U$1.7 trilhões
• US$4.04 trilhões em integração ESG em investidores
institucionais
• SRI 18% do mercado de US$36,8 trilhões de AUM
Integração
• Necessidade de
mais disclosure
de estratégia e
escopo
• Necessidade de
treinamento e informação
Fonte: USSIF, 2014
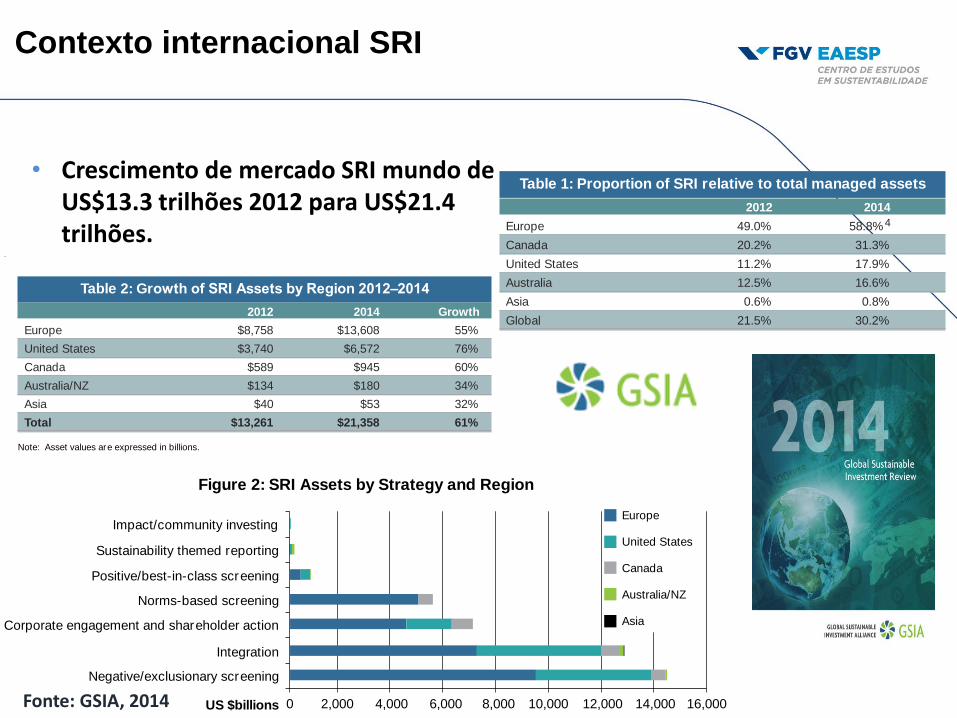
• Crescimento de mercado SRI mundo de US$13.3 trilhões 2012 para US$21.4 trilhões.
2014 Global Sustainable Investment Review 7
Global Sustainable Investments 2012–2014
Growth of Global SRI Assets
Global sustainable investment assets have expanded dramatically in recent years, rising from $13.3 trillion3
at the outset of 2012 to reach a total of $21.4 trillion at the start of 2014. This 61 percent growth outpaced
the growth in total professionally managed assets. As shown in Table 1, the proportion of SRI globally in
relation to professionally managed assets in the regions covered has increased to 30.2 percent, from 21.5
percent in 2012. This proportion has increased in all regions.
Table 1: Proportion of SRI relative to total managed assets
2012 2014
Europe 49.0% 58.8%4
Canada 20.2% 31.3%
United States 11.2% 17.9%
Australia 12.5% 16.6%
Asia 0.6% 0.8%
Global 21.5% 30.2%
Most of the SRI assets referred to in this report are in Europe (63.7 percent), but the relative contribution of
the United States has increased to 30.8 percent from 28.2 percent in 2012.
Figure 1: Proportion of Global SRI Assets by Region
Europe 63.7%
United States 30.8%
Canada 4.4%
Australia/NZ 0.8%
Asia 0.2%
US $21.4 trillion
3. All fig
u
r es are expressed in US dollars.
4. This figu r e is based on the aggregation of all SRI strategies reported in the European SRI Study 2014 without double counting, and is presented in order
to be consistent with the methodology of this global report. Please note, however, that this figu r e is not used in the European study as there is no single
European defin
i
tion for sust ai nabl e invest ing.
Contexto internacional SRI
2014 Global Sustainable Investment Review8
Over this two-year period, the fastest growing region has been the United States, followed by Canada and
Europe. These three regions are also the largest regions in terms of assets, accounting for 99 percent of
global SRI.
Table 2: Growth of SRI Assets by Region 2012–2014
2012 2014 Growth
Europe $8,758 $13,608 55%
United States $3,740 $6,572 76%
Canada $589 $945 60%
Australia/NZ $134 $180 34%
Asia $40 $53 32%
Total $13,261 $21,358 61%
Note: Asset values are expressed in billions.
Sustainable Investment Strategies
The largest sustainable investment strategy globally is negative screening/exclusions ($14.4 trillion), followed
by ESG integration ($12.9 trillion) and corporate engagement/shareholder action ($7.0 trillion). Negative
screening is the largest strategy in Europe, while ESG integration now dominates in the United States,
Australia/New Zealand and Asia.
Figure 2: SRI Assets by Strategy and Region
Corporate engagement and shareholder action
Impact/community investing
Integration
Negative/exclusionary screening
US $billions 0 2,000 4,000 6,000 8,000 10,000 12,000 14,000 16,000
Norms-based screening
Positive/best-in-class screening
Sustainability themed reporting
Europe
United States
Canada
Australia/NZ
Asia
Growth of SRI Strategies
Most of the SRI strategies experienced strong growth in the period 2012 to 2014. The fastest growing
strategies were sustainability-themed investing (136 percent growth) and ESG integration (117 percent). The
biggest contributors to ESG integration growth (in percentage terms) were the United States and Europe5;
for sustainability-themed investing the fastest gr owing regions were Canada and Australia/New Zealand.
Also growing well are norms-based screening (82 percent), exclusions (74 percent) and corporate
engagement/shareholder action (54 percent). For norms-based screening, traditionally a strategy confine d
to Europe, much of the growth originates in Canada, although Europe still has most of the assets in this
strategy.
5. Note that in Europe, exclusions mandated by legislation are not counted. If these were included the figu r e would be higher. However, the European
fig
u
r e includes “exclusions overlays,” i.e. situations where a minimum of one exclusionary criterion is deployed on a wide range of assets within a firm
(typically controversial weapons or tobacco). See the European section for more information.
Fonte: GSIA, 2014
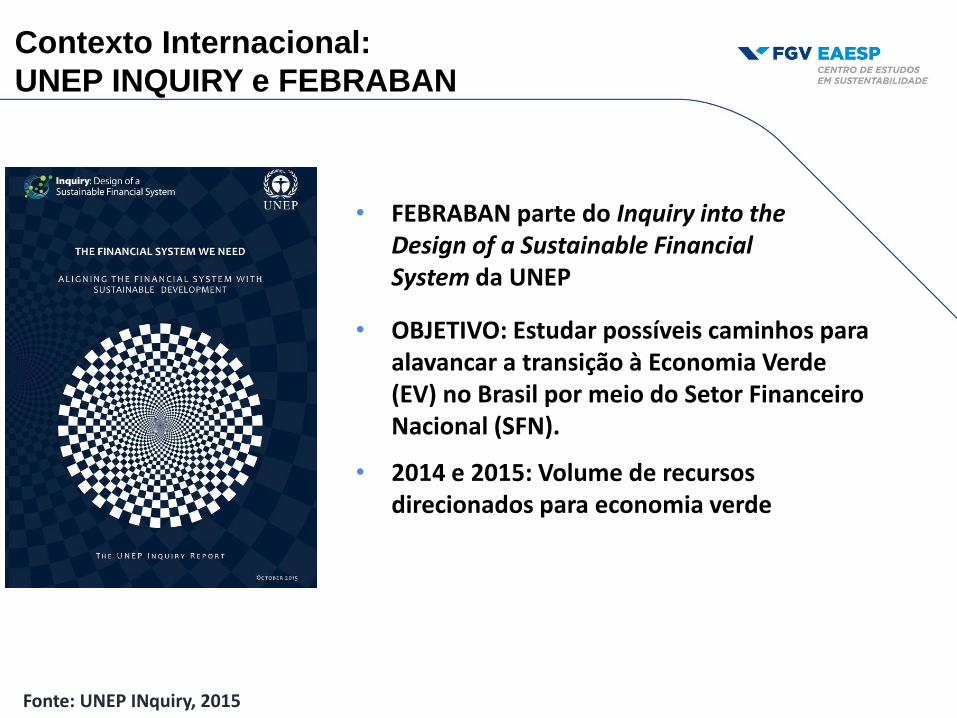
Contexto Internacional:
UNEP INQUIRY e FEBRABAN
• OBJETIVO: Estudar possiveis caminhos para alavancar a transicao a Economia Verde (EV) no Brasil por meio do Setor Financeiro Nacional (SFN).
• 2014 e 2015: Volume de recursos direcionados para economia verde
• FEBRABAN parte do Inquiry into the Design of a Sustainable Financial System da UNEP
Fonte: UNEP INquiry, 2015
Mensurando Recursos Financeiros alocados
para Economia Verde no Brasil
• VALOR ESTRATÉGICO: importância
de medir, controlar, avaliar e
gerenciar recursos alocados para
uma economia verde e sua
evolução para:
• Melhor compreender o Perfil de
risco da carteira
• Criar estratégia de como fomentar mais recursos para tal
Fonte: Gvces, 2014
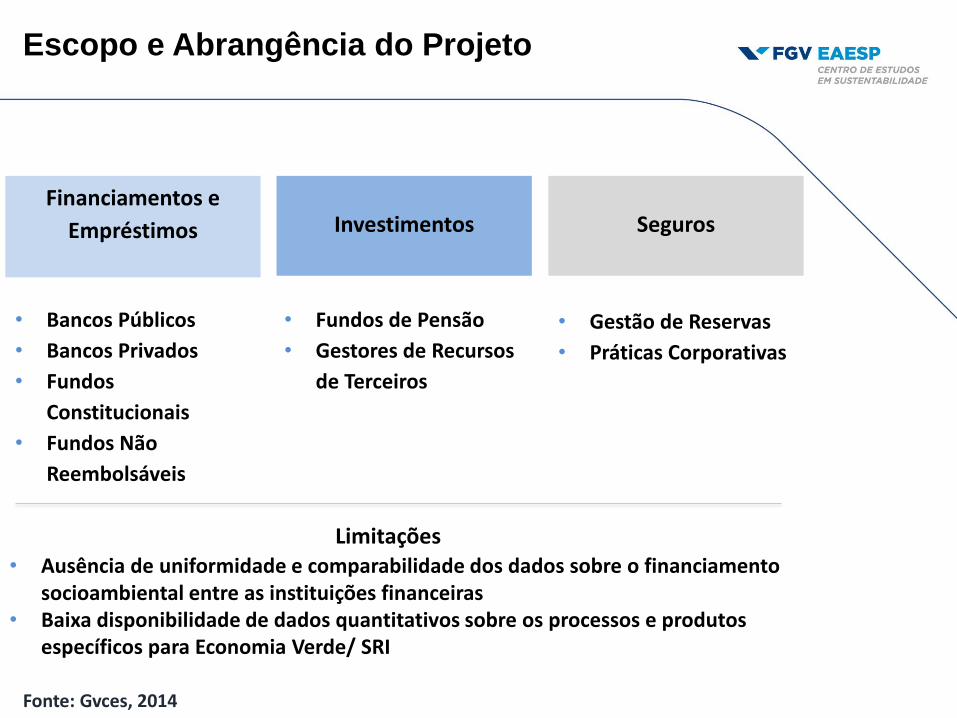
Escopo e Abrangência do Projeto
Fonte: Gvces, 2014
• Bancos Públicos
• Bancos Privados
• Fundos
Constitucionais
• Fundos Não
Reembolsáveis
• Fundos de Pensão
• Gestores de Recursos
de Terceiros
• Gestão de Reservas
• Práticas Corporativas
Financiamentos e
Empréstimos
Investimentos
Seguros
Limitações • Ausência de uniformidade e comparabilidade dos dados sobre o financiamento
socioambiental entre as instituições financeiras • Baixa disponibilidade de dados quantitativos sobre os processos e produtos
específicos para Economia Verde/ SRI
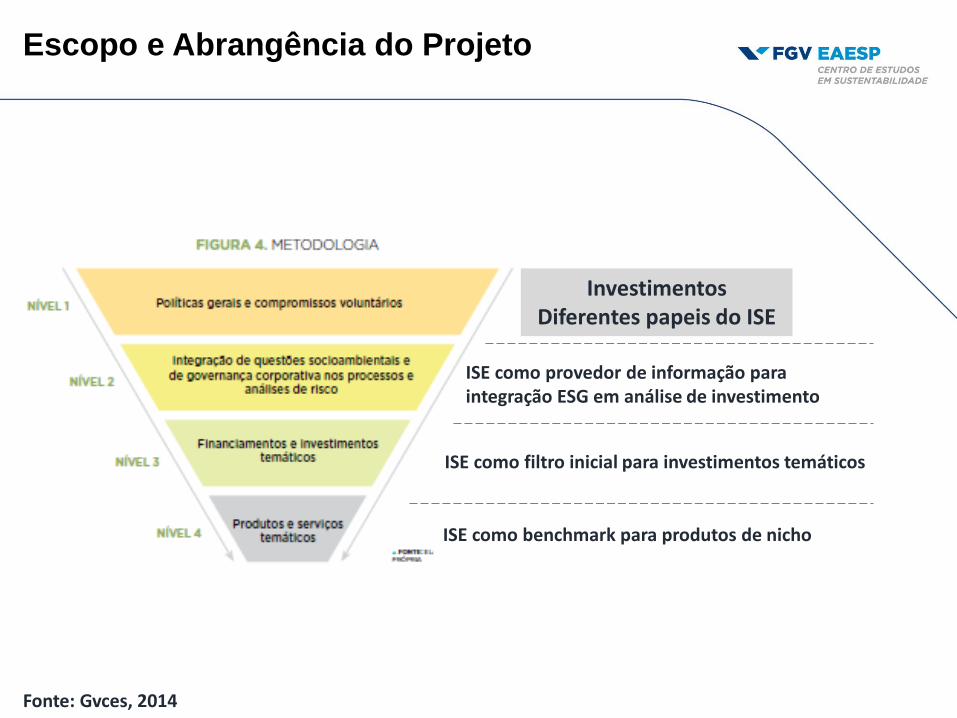
Escopo e Abrangência do Projeto
ISE como benchmark para produtos de nicho
Fonte: Gvces, 2014
ISE como filtro inicial para investimentos temáticos
ISE como provedor de informação para integração ESG em análise de investimento
Investimentos Diferentes papeis do ISE
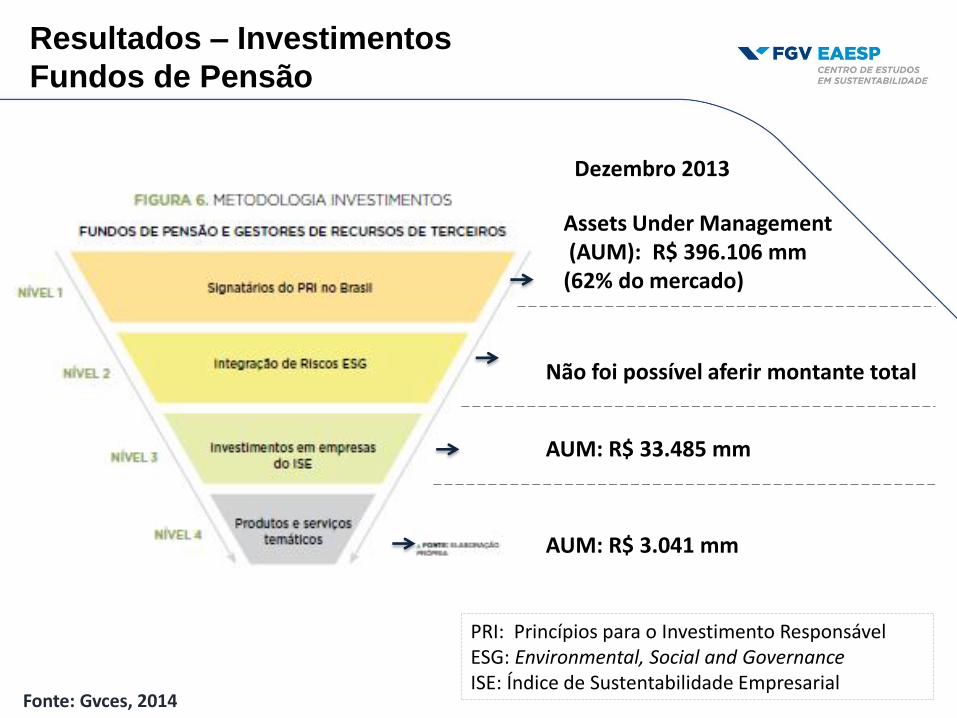
Resultados – Investimentos
Fundos de Pensão
Não foi possível aferir montante total
AUM: R$ 3.041 mm
AUM: R$ 33.485 mm
Assets Under Management (AUM): R$ 396.106 mm (62% do mercado)
Dezembro 2013
PRI: Princípios para o Investimento Responsável ESG: Environmental, Social and Governance ISE: Índice de Sustentabilidade Empresarial
Fonte: Gvces, 2014
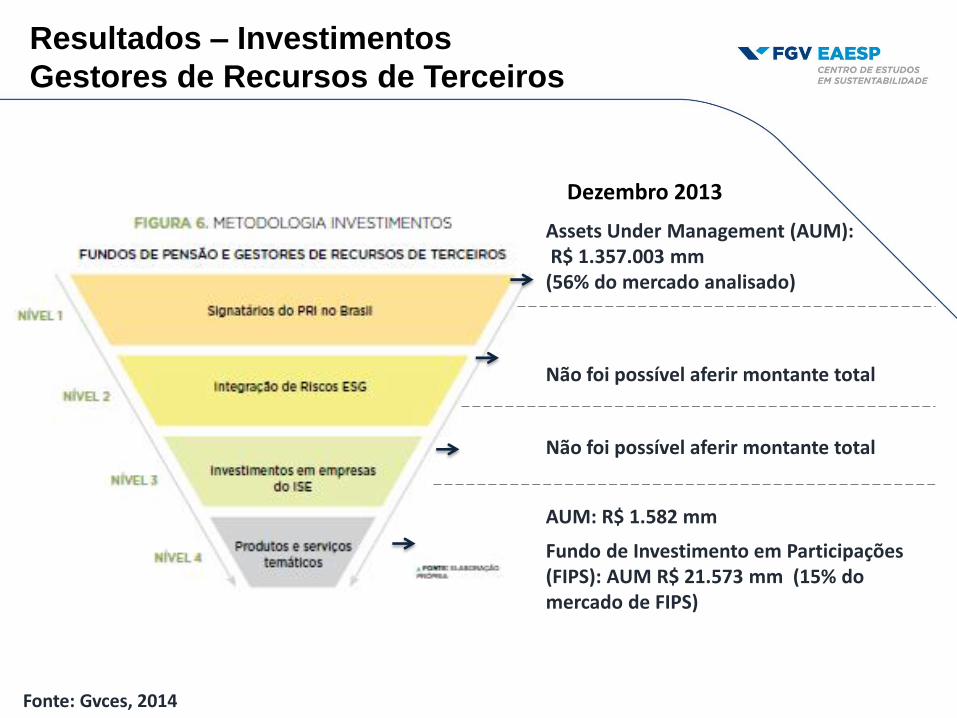
Não foi possível aferir montante total
AUM: R$ 1.582 mm
Não foi possível aferir montante total
Assets Under Management (AUM): R$ 1.357.003 mm (56% do mercado analisado)
Fundo de Investimento em Participações (FIPS): AUM R$ 21.573 mm (15% do mercado de FIPS)
Dezembro 2013
Fonte: Gvces, 2014
Resultados – Investimentos
Gestores de Recursos de Terceiros
Não foi possível aferir montante total
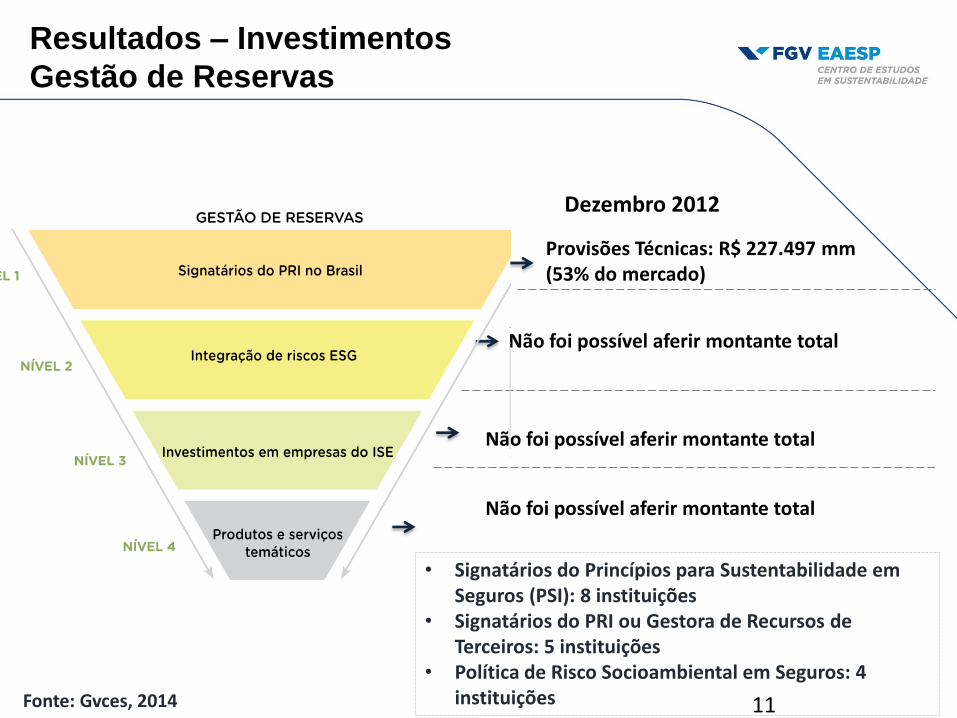
Provisões Técnicas: R$ 227.497 mm (53% do mercado)
Não foi possível aferir montante total
Não foi possível aferir montante total
Dezembro 2012
• Signatários do Princípios para Sustentabilidade em Seguros (PSI): 8 instituições
• Signatários do PRI ou Gestora de Recursos de Terceiros: 5 instituições
• Política de Risco Socioambiental em Seguros: 4 instituições 11 Fonte: Gvces, 2014
Resultados – Investimentos
Gestão de Reservas
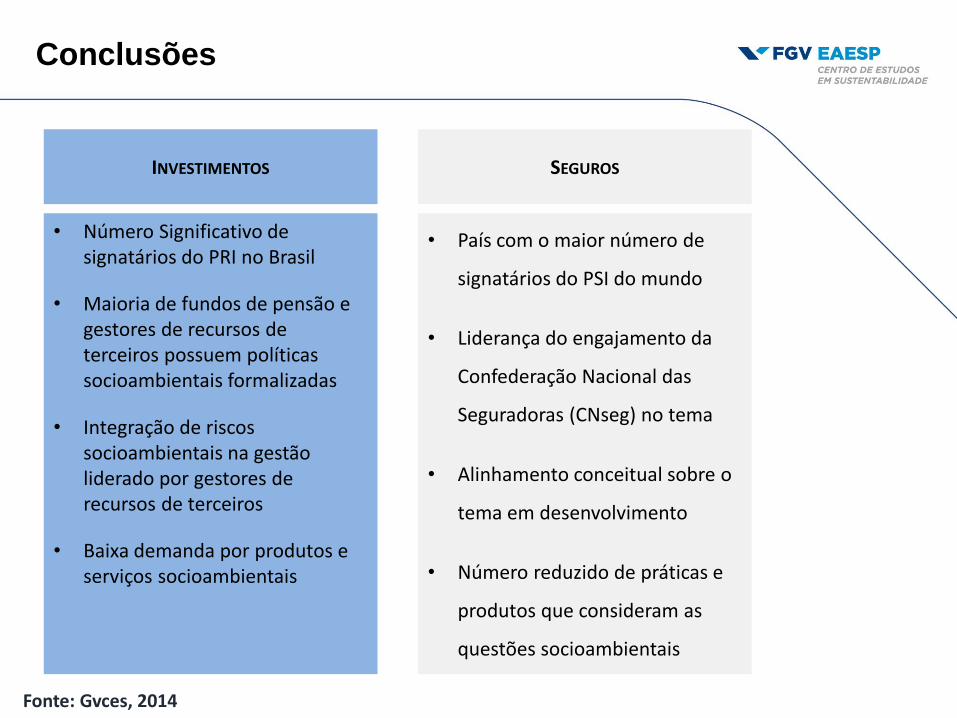
Conclusões
• Número Significativo de signatários do PRI no Brasil
• Maioria de fundos de pensão e gestores de recursos de terceiros possuem políticas socioambientais formalizadas
• Integração de riscos socioambientais na gestão liderado por gestores de recursos de terceiros
• Baixa demanda por produtos e serviços socioambientais
INVESTIMENTOS
• País com o maior número de
signatários do PSI do mundo
• Liderança do engajamento da
Confederação Nacional das
Seguradoras (CNseg) no tema
• Alinhamento conceitual sobre o
tema em desenvolvimento
• Número reduzido de práticas e
produtos que consideram as
questões socioambientais
SEGUROS
Fonte: Gvces, 2014
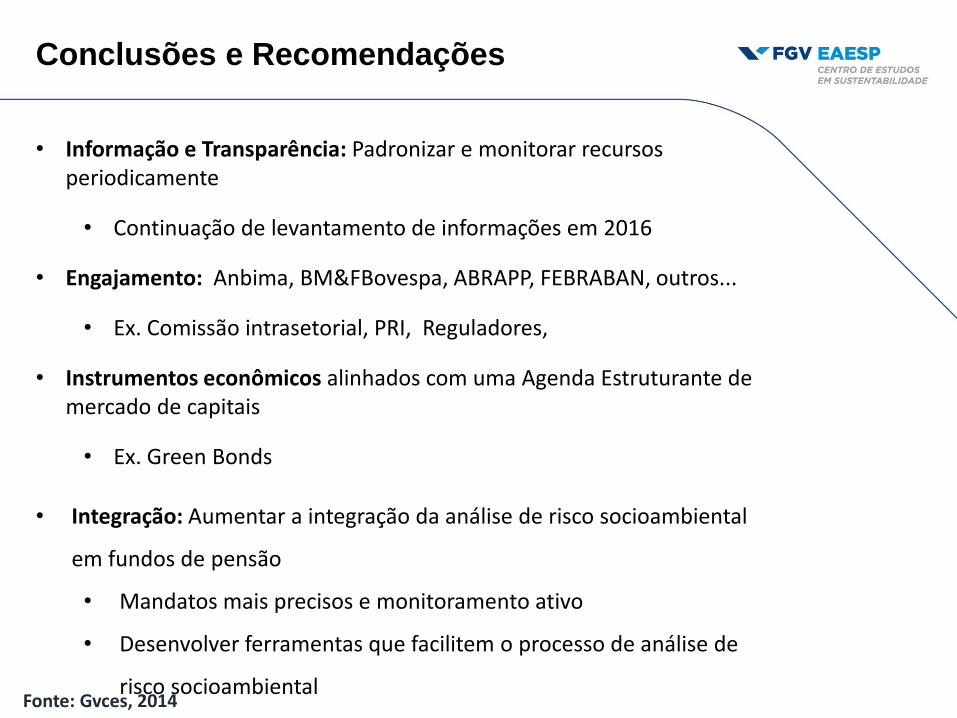
Conclusões e Recomendações
Fonte: Gvces, 2014
• Informação e Transparência: Padronizar e monitorar recursos periodicamente
• Continuação de levantamento de informações em 2016
• Engajamento: Anbima, BM&FBovespa, ABRAPP, FEBRABAN, outros...
• Ex. Comissão intrasetorial, PRI, Reguladores,
• Instrumentos econômicos alinhados com uma Agenda Estruturante de mercado de capitais
• Ex. Green Bonds
• Integração: Aumentar a integração da análise de risco socioambiental
em fundos de pensão
• Mandatos mais precisos e monitoramento ativo
• Desenvolver ferramentas que facilitem o processo de análise de
risco socioambiental