Recebido: 01/05/2013 Aprovado: 16/06/2014 Application of ...
14
Elisa Henning (UDESC – SC/Brasil) - [email protected] • Campus Avelino Marcante, 89219-710, Joinville-SC Murilo T. Maia (Konardi Usinagem Ltda – Brasil) - [email protected] Olga M. F. C. Walter (UDESC – SC/Brasil) - [email protected] Andréa C. Konrath (UDESC – SC/Brasil) - [email protected] Custodio C. Alves (Universidade da Região de Joinville – Brasil) - [email protected] Application of hotelling’s T² control chart for a machining process of the inside diameter of a steel cylinder HENNING, E.; MAIA, M. T.; WALTER, O. M. F. C.; KONRATH, A. C.; ALVES, C. C. Application of hotelling’s T² control chart for a machining process of the inside diameter of a steel cylinder. GEPROS. Gestão da Produção, Operações e Sistemas, Bauru, Ano 9, nº 2, abr-jun/2014, p. 155-167. Recebido: 01/05/2013 Aprovado: 16/06/2014 The quality of products and processes has proven to be crucial for companies to compete in the ma- rket. Statistical process control enables them to foresee problems in the process, thereby ensuring the quality of manufactured items. This paper aims to present a proposal for monitoring a machining process, with the help of this tool using control charts. This research arose from the need to monitor the rectification process of the inside diameter of a steel cylinder, a component of a product manu- factured in a company in southern Brazil. The parameters must follow design specifications, so the final product will not have performance problems. Thus, for monitoring this process, Shewhart X -S control charts are used for three measurements performed in sections of a cylinder, analyzing them separately. To complement, a multivariate Hotelling’s T 2 chart is used to monitor these three measure- ments simultaneously. The two approaches are compared in terms of performance and usage aspects. The results obtained in terms of performance were similar. However, the Shewhart control chart is easier to use and simpler to interpret by operators. The results enabled the company to know process stability, facilitating decision-making on actions taken for improvement. Statistical Process Control. Control Chart. Shewhart chart. Hotelling’s T 2 chart. Machining process. ABSTRACT Keywords
Transcript of Recebido: 01/05/2013 Aprovado: 16/06/2014 Application of ...
Elisa Henning (UDESC – SC/Brasil) - [email protected]• Campus Avelino Marcante, 89219-710, Joinville-SCMurilo T. Maia (Konardi Usinagem Ltda – Brasil) - [email protected] M. F. C. Walter (UDESC – SC/Brasil) - [email protected]éa C. Konrath (UDESC – SC/Brasil) - [email protected] C. Alves (Universidade da Região de Joinville – Brasil) - [email protected]
Application of hotelling’s T² control chart for a machining process of the inside diameter of a steel cylinder
HENNING, E.; MAIA, M. T.; WALTER, O. M. F. C.; KONRATH, A. C.; ALVES, C. C. Application of hotelling’s T² control chart for a machining process of the inside diameter of a steel cylinder. GEPROS. Gestão da Produção, Operações e Sistemas, Bauru, Ano 9, nº 2, abr-jun/2014, p. 155-167.
Recebido: 01/05/2013 Aprovado: 16/06/2014
The quality of products and processes has proven to be crucial for companies to compete in the ma-rket. Statistical process control enables them to foresee problems in the process, thereby ensuring the quality of manufactured items. This paper aims to present a proposal for monitoring a machining process, with the help of this tool using control charts. This research arose from the need to monitor the rectification process of the inside diameter of a steel cylinder, a component of a product manu-factured in a company in southern Brazil. The parameters must follow design specifications, so the final product will not have performance problems. Thus, for monitoring this process, Shewhart X -S control charts are used for three measurements performed in sections of a cylinder, analyzing them separately. To complement, a multivariate Hotelling’s T2 chart is used to monitor these three measure-ments simultaneously. The two approaches are compared in terms of performance and usage aspects. The results obtained in terms of performance were similar. However, the Shewhart control chart is easier to use and simpler to interpret by operators. The results enabled the company to know process stability, facilitating decision-making on actions taken for improvement.
Statistical Process Control. Control Chart. Shewhart chart. Hotelling’s T2 chart. Machining process.
ABSTRACT
Keywords

Application of hotelling’s T² control chart for a machining process of the inside diameter of a steel cylinder
GEPROS. Gestão da Produção, Operações e Sistemas, Bauru, Ano 9, nº 2, abr-jun/2014, p. 155-167156
1. INTRODUCTIONThe quality of products and processes has proven to be crucial for companies to compete in
the market. Statistical Process Control (SPC) is an efficient and powerful formal technique used for monitoring processes that allow us to predict problems in the process, ensuring the quality of the items that are produced. SPC consists of a collection of useful tools for resolving problems in obtaining a stable process. The control chart is one such tool, and probably the most technically sophisticated (MONTGOMERY, 2009).
In the industrial process, there are many situations that require simultaneous monitoring and control of more than one quality characteristic. Monitoring these quality characteristics in-dependently, is possible, but can be very misleading. This monitoring where many quality charac-teristics of interest are related is known as multivariate Statistical Process Control (BERSIMIS et al., 2007). Monitoring a process that has multiple quality characteristics is always a challenge to the quality controllers or practitioners. The Hotelling’s T2 control chart is widely used to monitor multivariate observations (CHENOURIA; VARIYATH, 2011).
The motivation for this paper came from the need to apply SPC in a machining cell of a pilot project at a company. Because the item is produced in batches and the feature being studied is crucial for it, statistical monitoring is required, which allows the quick detection of problems. The part being studied is measured in three sections, so there are three (3) variables to be studied. Each section of the part is analyzed individually, because if there is one that does not meet the specification, the part must be rejected or reprocessed. This makes it possible to use the Shewhart X
_ – S chart.
However, as there are three (3) variables being studied, each of which are correlated, it is possible to apply the Hotelling T² chart. By using the concepts of SPC, this study proposes a way to do the monitoring of these variables, thus ensuring the stability of the process. The main goal of this paper is to present a proposal for the monitoring of the sections of the internal diameter of the part being studied, using control charts. We also want to compare the monitoring between the Shewhart X
_ – S chart and the Hotelling T² chart for this process.
This article is structured as follows: in section 2, we present the theoretical context of control charts; in section 3, there is the methodology used to develop this work; section 4 presents the re-sults and discussion; and in section 5, there are the final remarks.
2. LITERATURE REVIEW
2.1. Statistical Control Charts
SPC, and in particular quality control techniques such as control charts, have become more and more important, due to the key role they play in industry. The main goal of Statistical Qua-lity Control is to reach a level of quality that becomes more and more the primary factor in the consumer’s decision regarding products and services (ALVES; SAMOHYL, 2004).
The processes must be continuously monitored to detect the presence of identifiable causes. Monitoring the characteristics of a process, it is possible to know and act on the causes of variabili-ty. By knowing the causes of process variation, it is possible to propose an action plan to eliminate special causes. The control chart is the primary tool used for monitoring processes and indicating the presence of special causes, which allows detection and the taking of corrective actions (COSTA et al., 2009).
A control chart is a visual statistical tool that highlights the presence of special causes. Basically, it consists of plotting lines representing the Upper Control Limit (UCL) and Lower Control Limit
Elisa Henning, Murilo T. Maia, Olga M. F. C. Walter, Andréa C. Konrath, Custodio C. Alves
GEPROS. Gestão da Produção, Operações e Sistemas, Bauru, Ano 9, nº 2, abr-jun/2014, p. 155-167 157
(LCL), the mean or target of the process (Central Line – CL) and the observed points, which repre-sent, in general, a statistic related to the variable of interest. A process is in statistical control when the variation of the samples in the chart is small, oscillating around the threshold of central control. This variation is due to random causes intrinsic to the process (COSTA et al., 2009). If one or more points are beyond the control limits, it indicates that the process can be out of statistical control, i.e. there may be a problem in the process (SAMOHYL, 2009). The most popular univariate control chart for variables is the Shewhart control chart, which achieved success due to its simplicity.
The implementation of control charts in a process occurs in two phases. In the first phase, we check if the process is under control by looking at the initial observations presented in the chart (CHENOURIA; VARIYATH, 2011). Also at this stage, a detailed study is done to check if the process is in statistical control by analyzing their characteristics in order to verify that the data are independent and identically distributed (VINING, 2009). After verification of the control charts, we seek to identify special causes. If special causes are identified in the production process, we seek to identify these causes in order to eliminate them.
According to Samohyl (2009), subgroups that were under the proven influence of identifiable causes should never be used. Without being part of the control chart, these subgroups must remain recorded with the actions taken to remove the causes that took the process out of statistical control. After eliminating the subgroups that take the process out of control, the limits are recalculated. A new analysis is then done. If there are no special causes in the process, then passes it to phase II, which is the monitoring process with the limits calculated in phase I. In phase II, the information obtained in phase I is used in the construction of the control charts that are used to test if the pro-cess remains under control when future observations are monitored.
The performance of a control chart is usually measured by parameters related to the dis-tribution of the time required for the chart to send a signal. The average run length (ARL) is an additional parameter, representing the average number of samples necessary to detect a change that has occurred in the process (ALVES; SAMOHYL, 2004). As said by Samohyl (2009), if it is a false positive, then it is called ARL0; if it is true, it is called ARL1.
2.2. Control Charts X_
– S
The X_
chart, developed by Shewhart in the 1920s, is the most widely used control chart in SPC today. Its use has been shown to be effective for monitoring the process and improve the result continuously and permanently (SAMOHYL, 2009). The control limits are usually set considering three (3) standard errors above and below the mean X
_. The ARL0, in this case is 370. In other wor-
ds, a false positive is accepted every 370 samples. To define the control limits in the X_
chart, we use Equations 1, 2, and 3.
(1)UCL = X + A3S_
(2)CL = X
(3)LCL = X + A3S_
where X_
corresponds to the average of the average of the samples, S_
corresponds to the average standard deviation, and A3 corresponds to the factor for the construction of the control charts, tabulated for various sample sizes n. Tables can be found in traditional SQC references such as Montgomery (2009), Costa et al. (2009), and Samohyl (2009). There is a chart for process variabi-lity monitoring, but in practice it is seldom used. The S variability chart is based directly on the
Application of hotelling’s T² control chart for a machining process of the inside diameter of a steel cylinder
GEPROS. Gestão da Produção, Operações e Sistemas, Bauru, Ano 9, nº 2, abr-jun/2014, p. 155-167158
standard deviation of the subgroups. However, the accuracy of the S chart is better than the R chart, showing fewer false positives, and its use should be considered in factories where the culture of quantitative methods is more evolved and appreciated (SAMOHYL, 2009). For the limits of the control chart of standard deviation S, we use Equations 4, 5, and 6.
(4)UCL = B4S_
(5)CL = B4S_
(6)LCL = B3S_
where S_
is the average standard deviation, and constants B3 and B4 are tabulated for various values of n.According to Montgomery (2009), and Costa et al. (2009), for control charts like the Shewhart
control chart to be effective, two assumptions must be previously analyzed and validated. The first is that the observations of the quality characteristic of interest are independent, with no significant autocorrelation in the data. The second is that the observations are normally distributed. The con-trol limits are constructed based on the assumption that the underlying distribution of the quality characteristic is normal and no major contamination due to outliers (MOUSTAFA, 2009).
2.3. Multivariate Control Charts
There are many situations where simultaneous monitoring is necessary to control two or more related quality characteristics, and monitor whether these characteristics can be misleading (MONTGOMERY, 2009). For these situations, specific tools should be used to detect, identify, and analyze the meaningful causes of variability in a process. Multivariate control charts represent one of these techniques being used to simultaneously control several characteristics that indicate the quality of a single production process. The most familiar monitoring and control procedure of a multivariate process is the Hotelling T2 control chart, for monitoring the mean vector of the process. It is directly analogous to the univariate Shewhart X
_ chart (MONTGOMERY, 2009). Ho-
telling was the first researcher to know the weakness of the univariate statistical control charts in his pioneering paper. In the following decades many contributors have established studies in the same field and an extensive literature can be found, like for e.g.: Jackson (1985); Tracy, Young and Mason (1992); Lowry and Montgomery (1995); Aparisi (1997); Nedumaran and Pignatiello Jr. (1999), Khoo et al. (2005); Champ and Farmer (2007), Bersimis et al. (2007) and Frisen (2011).
Among the existing multivariate charts, the Hotelling T2 control chart is the best known in the literature, and its applicability is most recommended for processes that have several quality characteristics. These characteristics are correlated and need to be monitored together. The T2 test statistic is based on Equation 7,
(7)T2 = n(X – X)́ + S-1(X – X)
where X_
corresponds to the vector of means, and S represents the covariance matrix of the process.
Elisa Henning, Murilo T. Maia, Olga M. F. C. Walter, Andréa C. Konrath, Custodio C. Alves
GEPROS. Gestão da Produção, Operações e Sistemas, Bauru, Ano 9, nº 2, abr-jun/2014, p. 155-167 159
The application of the Hotelling T2 multivariate control chart is done in two steps. In phase I, the limits are calculated using Equation 8 (TRACY et al., 1992; BERSIMIS et al., 2007),
(8)UCL = Fα,p,mn–m–p+1
p(m – 1)(n – 1)mn – m – p + 1
where p is the number of variables, m is the number of samples, n is the sample size, and F equals Snedecor’s F distribution with a degree of freedom for the numerator equal to α (equivalent to the rate of false positives), and for the denominator equal to p, mn-m-p+1.
For phase II of the application of the multivariate chart, the equation of the upper control limit is given by the Equation 9 (TRACY et al., 1992; BERSIMIS et al., 2007)
(9)UCL = Fα,p,mn–m–p+1
p(m + 1)(n – 1)mn – m – p + 1
The lower control limit (LCL) for the two phases is equal to zero. For the use of multivariate control charts, it is also necessary to verify the assumptions of normality and independence. If the multivariate normal is not an appropriate model, there is very little literature available on alterna-tive multivariate charting techniques (BERSIMIS et al., 2007) such multivariate non-parametric statistical process techniques (CHAKRABORTI et al., 2001). Autocorrelated multivariate process is also an area that must be further investigated.
3. METHODOLOGYThis paper, considered from the point of view of its nature, can be considered as applied
research (BARROS; LEHFELD, 2000; GIL, 2010), contributing to practical ends. It aims to solve problems or concrete needs found in reality. According with Gil (2010, p. 26), applied research in-cludes studies conducted in order to resolve issues identified in the framework of society, directed to the acquisition of knowledge for application in a specific situation.
From the point of view of the form of the approach to the problem, the research is quantita-tive, since to reach its proposed goals, the obtained results are analyzed using information from the control charts.
As a computational resource for the monitoring of data, the normality and autocorrelation analysis was done using the R software program (R DEVELOPMENT CORE TEAM, 2012), and the R packages “qcc” (SCRUCCA, 2004); “MSCQ” (SANTOS-FERNANDES, 2013) and QRMlib (MCNEIL; ULMAN, 2011).
In Figure 1, the steps in the application of SPC in this paper are shown.

Application of hotelling’s T² control chart for a machining process of the inside diameter of a steel cylinder
GEPROS. Gestão da Produção, Operações e Sistemas, Bauru, Ano 9, nº 2, abr-jun/2014, p. 155-167160
Figure 1 – Flowchart of the application of SQC to the data of the sections of the cylinder.
Check assumptions of normalityand autocorrelation
Removeautocorrelation
Apply control charts
Remove special causes
Is there aspecial cause
action?
Is the data autocorrelated?
Data collection
Source: Self-authorship, (2012).
For reasons of confidentiality, the name of the company where this work was done will be referred to as Company. Working for over 40 years in the market, the company is headquartered in southern Brazil, and produces one of the main components for the white line. Their product is responsible for circulating the refrigerant in a refrigeration system.
The machining cell in question went through a transition from design to manufacturing. Thus, no method had been used yet to check the stability of the process. It was just checked if the parts were within specification using measurements. Another problem that also occurred was the ignorance of the relationship between the measurements and the improvements in the production process, preventing the display of the gains from process changes. The work began with the collec-tion of the data necessary for the implementation (Phase 1). A measurement frequency of one piece every 24 minutes was adopted. Data collection for the implementation phase, which occurred from July 7 - 19, 2011, was done during both shifts of the machining cell in question.
Data collection occurred in the process of grinding the inner diameter of a 1020 steel cylin-der. The piece is separated into three (3) sections for measurement: top, middle, and bottom. Part of the data set from these measured sections is available in Table 1. The grinding of the inner dia-meter is performed to increase the diameter and decrease the roughness of the surface. These are the two main characteristics to ensure product quality in this process.

Elisa Henning, Murilo T. Maia, Olga M. F. C. Walter, Andréa C. Konrath, Custodio C. Alves
GEPROS. Gestão da Produção, Operações e Sistemas, Bauru, Ano 9, nº 2, abr-jun/2014, p. 155-167 161
Table 1 – Process data.
Sample x1 x2 x3 x4 x5 variable
1 32,627 32,625 32,624 32,629 32,625 middle
2 32,627 32,635 32,635 32,638 32,635 middle
3 32,625 32,623 32,625 32,638 32,632 middle
: : : : : : :
41 32,630 32,622 32,626 32,632 32,631 top
42 32,633 32,635 32,630 32,628 32,637 top
43 32,630 32,627 32,630 32,634 32,631 top
: : : : : : :
118 32,632 32,630 32,632 32,631 32,637 bottom
119 32,629 32,630 32,637 32,630 32,631 bottom
120 32,624 32,629 32,633 32,632 32,633 bottom
Source: Adapted from data provided by the company.
4. RESULTSThe machining cell in question went through a transition from design to manufacturing.
Thus, no method had been used yet to check the stability of the process. It was just checked if the parts were within specification using measurements. The need to implement SPC in the machi-ning cell was then seen. Initially, we tested the normality hypothesis by means of the Shapiro-Wilk test. The outcome of the normality test for first 30 subgroups of the top, middle, and bottom sec-tions of the cylinder is presented in Table 2.
Table 2 – Normality analysis of the data.
Section Top Middle Bottom
p-value 0.0009 0.7305 0.2466
Source: Self-authorship.
Using a significance level of 5%, we can see that the variables Middle and Bottom follow a normal distribution (p-value > 0.05), while the Top variable does not (p-value < 0.05). With the exception of the Top section, all the other variables show normal distribution. Thus, as a small departure from normality may not influence the results very much (MONTGOMERY, 2009), we chose to apply X
_ – S control charts to the original data of the top section (Figure 2). The data sho-
wed no autocorrelation as we can see in Figure 2.

Application of hotelling’s T² control chart for a machining process of the inside diameter of a steel cylinder
GEPROS. Gestão da Produção, Operações e Sistemas, Bauru, Ano 9, nº 2, abr-jun/2014, p. 155-167162
Figure 2 – Autocorrelation function chart of the variables Top, Middle and Bottom.
Source: Self-authorship.
In Figure 3, two samples (9 and 17) which are beyond the control limits can be seen - sample 17 in the X
_ chart (Figure 3a) and sample 9 in the S chart (Figure 3b). The control limits had to be
recalculated since correction errors of the parameters of the machine were identified by operators. Thus, subgroups 9 and 17 were removed from the analysis. With the removal of these subgroups, the assumptions were checked again, and the data were normally distributed and not autocorrelated.
Figure 3 – X_
(a) and S (b) control charts for the top section data.
Source: R software application.
The new control limits for the top (LCL=32.62323; CL=32.62989; UCL=32.63654), middle (LCL = 32.62491; CL = 32.62335; UCL = 32.6354 and bottom (LCL = 32.62348, CL = 32.62984, UCL = 32.63621) sections can be verified in Figures 4, 5, and 6, respectively. They represent phase II, i.e. the monitoring phase discussed below.

Elisa Henning, Murilo T. Maia, Olga M. F. C. Walter, Andréa C. Konrath, Custodio C. Alves
GEPROS. Gestão da Produção, Operações e Sistemas, Bauru, Ano 9, nº 2, abr-jun/2014, p. 155-167 163
Figures 4, 5, and 6 demonstrate that with all the sections measured and also considering the average, the process is kept under statistical control. This analysis did not consider the additional rules, as it would imply a change in the ARL0. The process, however, is stable only under the action of the natural variability of the process, with measurements within specification.
Figure 4 – Xbar (a) and S (b) chart of the top section (monitoring phase of the process).
Source: R software application.
Figure 5 – Xbar (a) and S (b) chart of the middle section (monitoring phase of the process).
Source: R software application.
Application of hotelling’s T² control chart for a machining process of the inside diameter of a steel cylinder
GEPROS. Gestão da Produção, Operações e Sistemas, Bauru, Ano 9, nº 2, abr-jun/2014, p. 155-167164
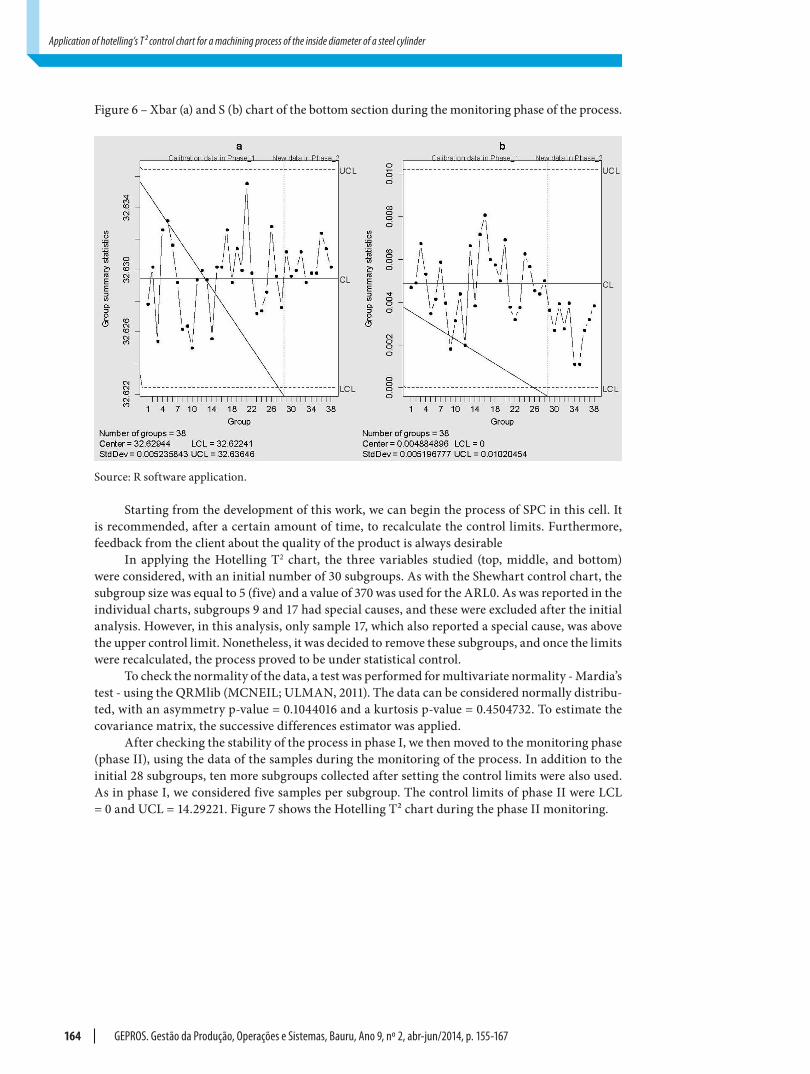
Figure 6 – Xbar (a) and S (b) chart of the bottom section during the monitoring phase of the process.
Source: R software application.
Starting from the development of this work, we can begin the process of SPC in this cell. It is recommended, after a certain amount of time, to recalculate the control limits. Furthermore, feedback from the client about the quality of the product is always desirable
In applying the Hotelling T2 chart, the three variables studied (top, middle, and bottom) were considered, with an initial number of 30 subgroups. As with the Shewhart control chart, the subgroup size was equal to 5 (five) and a value of 370 was used for the ARL0. As was reported in the individual charts, subgroups 9 and 17 had special causes, and these were excluded after the initial analysis. However, in this analysis, only sample 17, which also reported a special cause, was above the upper control limit. Nonetheless, it was decided to remove these subgroups, and once the limits were recalculated, the process proved to be under statistical control.
To check the normality of the data, a test was performed for multivariate normality - Mardia’s test - using the QRMlib (MCNEIL; ULMAN, 2011). The data can be considered normally distribu-ted, with an asymmetry p-value = 0.1044016 and a kurtosis p-value = 0.4504732. To estimate the covariance matrix, the successive differences estimator was applied.
After checking the stability of the process in phase I, we then moved to the monitoring phase (phase II), using the data of the samples during the monitoring of the process. In addition to the initial 28 subgroups, ten more subgroups collected after setting the control limits were also used. As in phase I, we considered five samples per subgroup. The control limits of phase II were LCL = 0 and UCL = 14.29221. Figure 7 shows the Hotelling T² chart during the phase II monitoring.

Elisa Henning, Murilo T. Maia, Olga M. F. C. Walter, Andréa C. Konrath, Custodio C. Alves
GEPROS. Gestão da Produção, Operações e Sistemas, Bauru, Ano 9, nº 2, abr-jun/2014, p. 155-167 165
Figure 7 – Hoteling T2 control chart (phase I and phase II).
Source: R software application
Thus, it can be seen that the two approaches - univariate from the Shewhart-style charts, and multivariate from the Hotelling T2 charts (Figure 7) - had similar results in terms of performance. But as the company was in the process of implementing SPC in that cell, the application of the Shewhart-style charts is easier to interpret by the operators. However the Hotelling T2 chart can be an option to be considered in the future.
This analysis did not take into account the additional rules in univariate Shewhart charts. These rules were created in order to accelerate the detection of changes in the process. The incor-poration of these rules may result in an increased number of false alarms (COSTA et al., 2009), which could limit the comparison performed. Additionally, caution is recommended when ap-plying two or more decision rules simultaneously, since an excessive number of false alarms may be harmful to an SPC program (MONTGOMERY, 2009).
Faster signaling of out-of-control processes leads to reduced losses, which can be significant in cases where small deviations from the established mean of the quality characteristic are turned into losses and less competitiveness. Thus, using MCUSUM and MEWMA charts, it is possible to check the quality of the products with higher accuracy, and also identify the adaptation of the operators to these new tools on the production line.

Application of hotelling’s T² control chart for a machining process of the inside diameter of a steel cylinder
GEPROS. Gestão da Produção, Operações e Sistemas, Bauru, Ano 9, nº 2, abr-jun/2014, p. 155-167166
5. CONCLUSION AND FINAL CONSIDERATIONSThe main objective of this study was to propose the application of control charts for the sta-
tistical process monitoring of the grinding of the inner diameter of a steel cylinder. Shewhart-style univariate and Hotelling T2 multivariate control charts were applied. Both the Shewhart control chart and the Hotelling T² control chart had almost the same performance in the analysis of the stability of the process, proving to be efficient in the analysis of the process studied. Thus, it was possible to verify the stability of this process around the design specifications.
In these situations, the application of multivariate statistical process control is justified by the use of multivariate Hotelling T2 control charts, a procedure that produces a single answer to whether the process is in statistical control. It is an alternative to the univariate Shewhart chart, since it has not been proposed to handle the variance-covariance structure between the variables. However, the implementation and interpretation of the Hotelling T² chart are more complex.
We believe that the use of the Shewhart chart is a good choice at the beginning of the SPC implementation work in the cell. For the company, at that time, was operationally easier to imple-ment, considering both, the workers/operators, as the computational resources available for online monitoring.
Therefore, after a while, when this practice is more established, it is suggested to proceed to using the Hotelling T2 chart itself, or even multivariate charts that are more sensitive to small shifts in the process mean, such as Multivariate Cumulative Sum (MCUSUM) chart or Multivariate Ex-ponential Moving Average (MEWMA) chart. However it would be recommended in future studies to evaluate and compare the use of the supplementary rules in both charts, Shewhart and Hotelling T² (APARISI et al., 2004).
REFERENCESALVES, C. C.; SAMOHYL, R. W. A utilização dos gráficos de controle CUSUM para o monitora-mento de processos industriais. In: ENCONTRO NACIONAL DE ENGENHARIA DE PRODU-ÇÃO, 2004, Florianópolis/SC. Anais do XXIV ENEGEP (Encontro Nacional de Engenharia de Produção Florianópolis), 2004.APARISI, F. Sampling plans for the multivariate T2 control chart. Quality Engineering, v. 10, n. 1, p.141 - 147, 1997.APARISI, F.; CHAMP, C. W.; GARCÍA-DÍAZ, J. C. A Performance Analysis of Hotelling’s χ2 Con-trol Chart with Supplementary Runs Rules. Quality Engineering, v. 16, n. 3, p. 359-368, 2004.BARROS, A. J. S.; LEHFELD, N. A. S. Fundamentos de Metodologia: um Guia para a Iniciação Científica. 2.ed, São Paulo: Makron Books, 2000. BERSIMIS, S.; PSARAKIS, S.; PANARETOS, J. Multivariate Statistical Process Control Charts: An Overview. Quality and Reliability Engineering International, v. 23, n. 5, p. 17-543, 2007. CHAKRABORTI, S.; VAN DER LAAN, P.; BAKIR, S. T. Nonparametric control charts: An over-view and some results. Journal of Quality Technology, v. 33, n. 3, p. 304-315, 2001.

Elisa Henning, Murilo T. Maia, Olga M. F. C. Walter, Andréa C. Konrath, Custodio C. Alves
GEPROS. Gestão da Produção, Operações e Sistemas, Bauru, Ano 9, nº 2, abr-jun/2014, p. 155-167 167
CHAMP, C. W.; JONES-FARMES, L. A. Properties of Multivariate Control Charts with Estimated Parameters. Sequential Analysis, v. 26, n. 2, p. 153-169, 2007.CHENOURIA, S.; VARIYATH, A. M. A Comparative Study of Phase II Robust Multivariate Con-trol Charts for Individual Observations. Quality and Reliability Engineering International, v. 27, n. 7, p. 857-865, 2011.COSTA, A. F. B.; EPPRECHT, E. K.; CARPINETTI, L. C. R. Controle estatístico de qualidade. 2.ed, São Paulo: Atlas, 2009.FRISEN, M. On multivariate control charts. Produção, v. 21, n. 2, p. 235-241, 2011.GIL, A. C. Como elaborar projetos de pesquisa. 5.ed, São Paulo: Atlas, 2010.JACKSON, J. E. Multivariate quality control. Communications in Statistics. Theory and Methods, v. 14, n. 11, 2657-2688, 1985.LOWRY, C. A.; MONTGOMERY, D. C. A review of multivariate control charts. IIE Transactions, v. 27, n. 6, p. 800-810, 1995. KHOO, M. B. C.; QUAH, S. H.; LOW, H. C.; CH’NG, C. K. Short runs multivariate control chart for process dispersion. International Journal of Reliability, Quality and Safety Engineering, v.12, n.2, p. 127-147, 2005.MCNEIL, A.; ULMAN, S. QRMlib: Provides R-language code to examine Quantitative Risk Management concepts. R package version 1.4.5.1. Available at: <http://CRAN.R-project.org/package=QRMlib>. Accessed: 20 mar. 2013.MONTGOMERY, D. C. Introdução ao Controle Estatístico da Qualidade. 4.ed, Rio de Janeiro: LTC, 2009.MOUSTAFA, O. A. A. A Control Chart based on MAD for Monitoring the Process Variability of a Quality Characteristic. International Journal of Statistics and Systems, v. 4, n. 1, p. 47-61, 2009.NEDUMARAN, G.; PIGNATIELLO JR, J. J. On Constructing T2 Control Charts for On-line Pro-cess Monitoring. IIE Transactions, v. 31, n. 6, p. 529-536, 1999.R DEVELOPMENT CORE TEAM. R: A language and environment for statistical computing. R Foundation for Statistical Computing, Vienna, Austria, 2012. Available at: <http://www.R-project.org>. Accessed: 20 set. 2012.SAMOHYL, R.W. Controle Estatístico de Qualidade. São Paulo: Elsevier Campus, 2009.SANTOS-FERNANDEZ, E. MSQC: Multivariate Statistical Quality Control. R package version 1.0.0. Available at: <http://CRAN.R-project.org/package=MSQC>. Accessed: 14 mar. 2013. SCRUCCA, L. QCC: An R package for quality control charting and statistical process control. R News, v.4, n.1, p.11-17, jun. 2004. Available at <http://cran.r-project.org/doc/Rnews/Rnews_2004-1.pdf>. Accessed: 20 mar. 2013.TRACY, N. D.; YOUNG J. C.; MASON, R. L. Multivariate Control Charts for Individual Observa-tions. Journal of Quality Technology, v. 24, n. 2, p. 88-95, 1992.VINING, G. Technical Advice: Phase I and phase II control charts. Quality Engineering, v. 21, n. 4, p. 478-479, 2009.