Os Desafios da Economia Portuguesa no Contexto Europeu e ... · no Contexto Europeu e Mundial João...
36
Os Desafios da Economia Portuguesa no Contexto Europeu e Mundial João César das Neves Universidade Católica Portuguesa 8 de Julho de 2015
-
Upload
phungtuyen -
Category
Documents
-
view
216 -
download
0
Transcript of Os Desafios da Economia Portuguesa no Contexto Europeu e ... · no Contexto Europeu e Mundial João...
Os Desafios da Economia Portuguesa no Contexto Europeu e Mundial
João César das Neves
Universidade Católica Portuguesa
8 de Julho de 2015

Pode o capitalismo sobreviver?
«A tese que tentarei estabelecer é que o desempenho actual e previsível do sistema capitalista é tal que nega a ideia de ele fracassar sob o peso do falhanço económico, mas que o seu próprio sucesso mina as instituições sociais que o protegem e “inevitavelmente” cria as condições nas quais ele não será capaz de viver e que apontam fortemente para o socialismo como o presumível herdeiro.»
Schumpeter, Joseph (1943) Capitalism, Socialism and Democracy, George Allen & Unwin, Parte II prólogo, p.61.
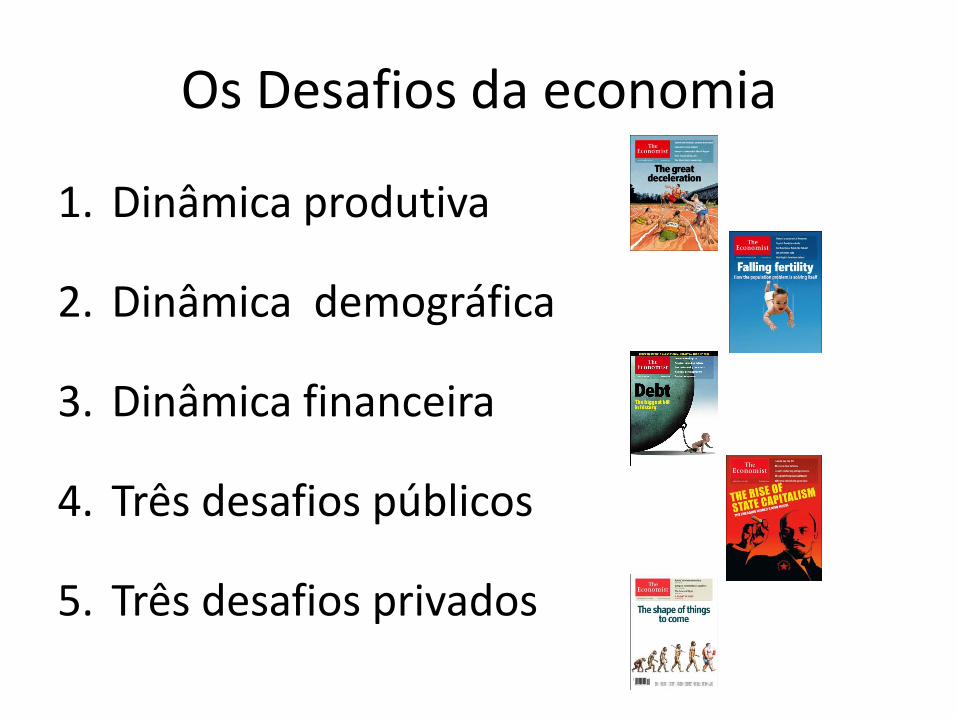
Os Desafios da economia
1. Dinâmica produtiva
2. Dinâmica demográfica
3. Dinâmica financeira
4. Três desafios públicos
5. Três desafios privados
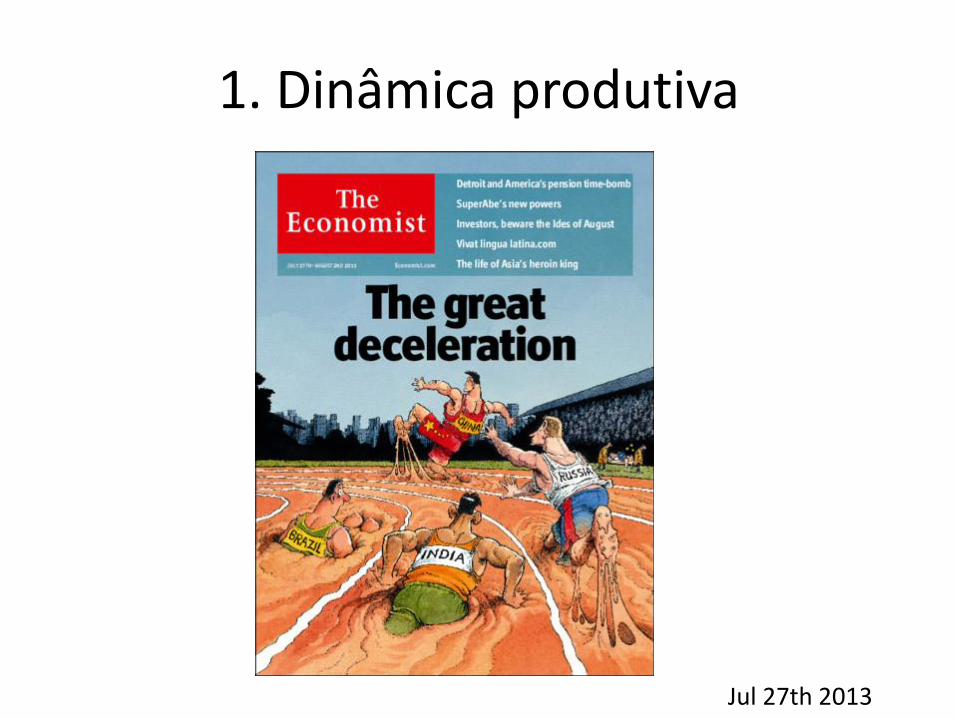
1. Dinâmica produtiva
Jul 27th 2013
Pode o capitalismo sobreviver?
«Normalmente, o homem de negócios moderno, seja empresário ou mero administrador, é do tipo executivo. Da lógica desta posição ele adquire algo da psicologia do empregado assalariado trabalhando numa organização burocrática. (…) Assim a empresa moderna, embora produto do processo capitalista, socializa a mente burguesa; ele limita impiedosamente o âmbito da motivação capitalista; não só isso, mas eventualmente mata as suas raízes.»
Schumpeter, Joseph (1943) Capitalism, Socialism and Democracy, George Allen & Unwin, cap. XIV, p.156
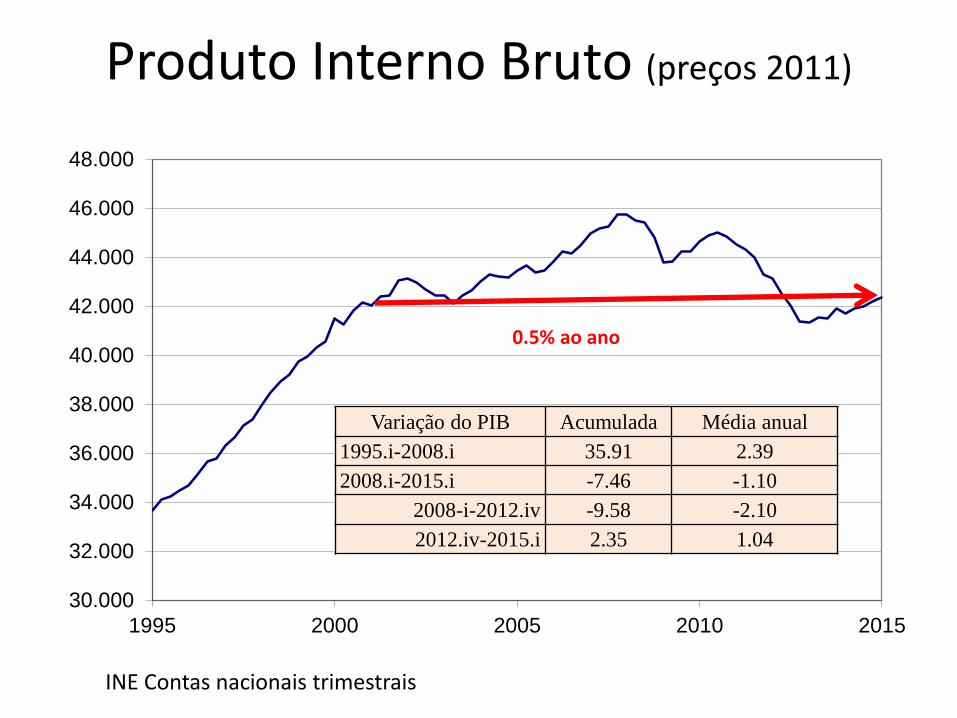
Produto Interno Bruto (preços 2011)
30.000
32.000
34.000
36.000
38.000
40.000
42.000
44.000
46.000
48.000
1995 2000 2005 2010 2015
INE Contas nacionais trimestrais
Variação do PIB Acumulada Média anual
1995.i-2008.i 35.91 2.39
2008.i-2015.i -7.46 -1.10
2008-i-2012.iv -9.58 -2.10
2012.iv-2015.i 2.35 1.04
0.5% ao ano
4000
4200
4400
4600
4800
5000
5200
5400
1998 2000 2002 2004 2006 2008 2010 2012 2014
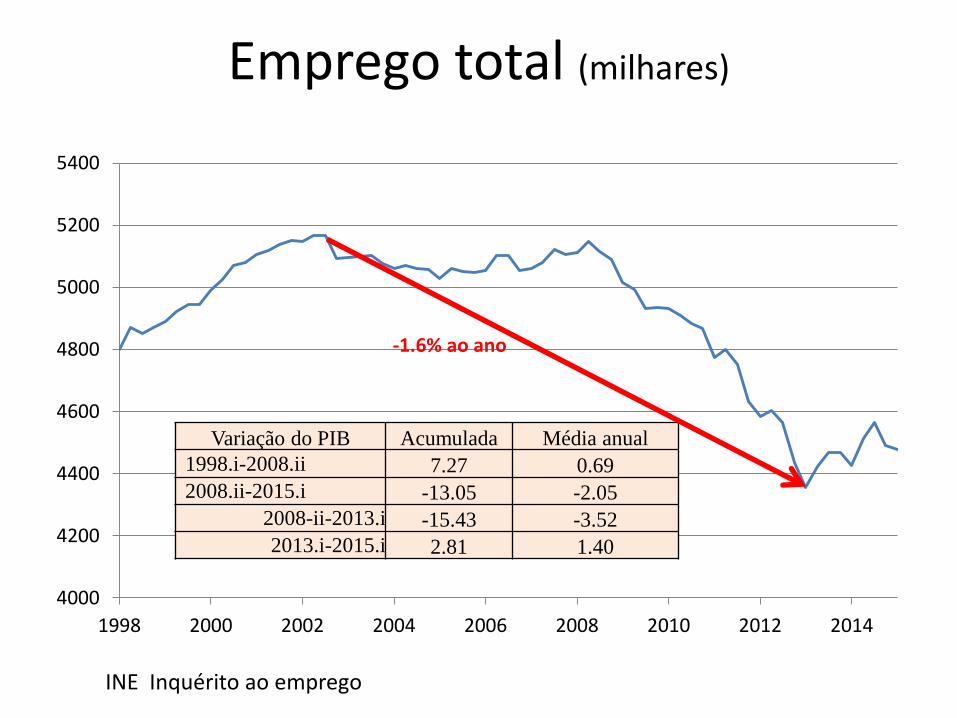
Emprego total (milhares)
INE Inquérito ao emprego
Variação do PIB Acumulada Média anual
1998.i-2008.ii 7.27 0.69
2008.ii-2015.i -13.05 -2.05
2008-ii-2013.i -15.43 -3.52
2013.i-2015.i 2.81 1.40
-1.6% ao ano
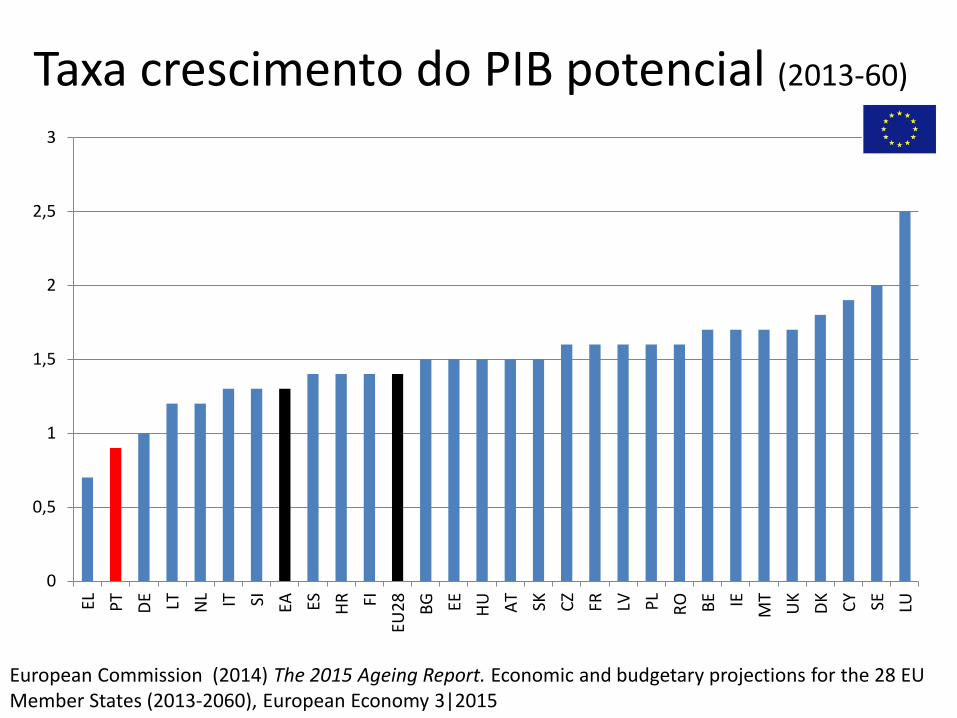
Taxa crescimento do PIB potencial (2013-60)
0
0,5
1
1,5
2
2,5
3
EL PT
DE LT NL IT SI EA ES HR FI
EU2
8
BG EE HU AT SK CZ
FR LV PL
RO BE IE
MT
UK
DK
CY SE LU
European Commission (2014) The 2015 Ageing Report. Economic and budgetary projections for the 28 EU Member States (2013-2060), European Economy 3|2015
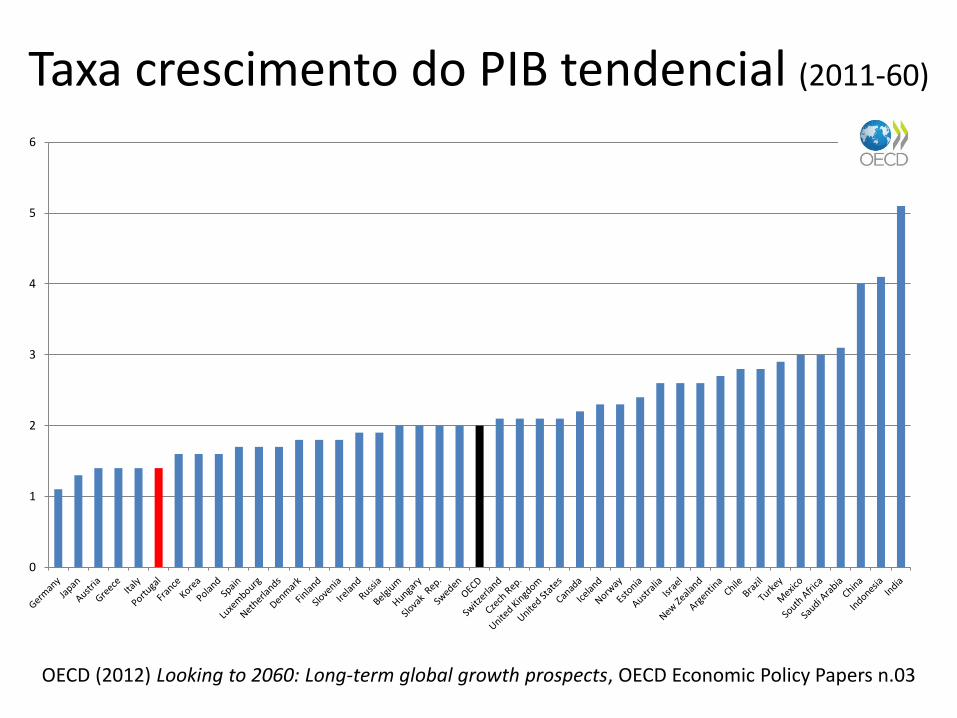
Taxa crescimento do PIB tendencial (2011-60)
OECD (2012) Looking to 2060: Long-term global growth prospects, OECD Economic Policy Papers n.03
0
1
2
3
4
5
6
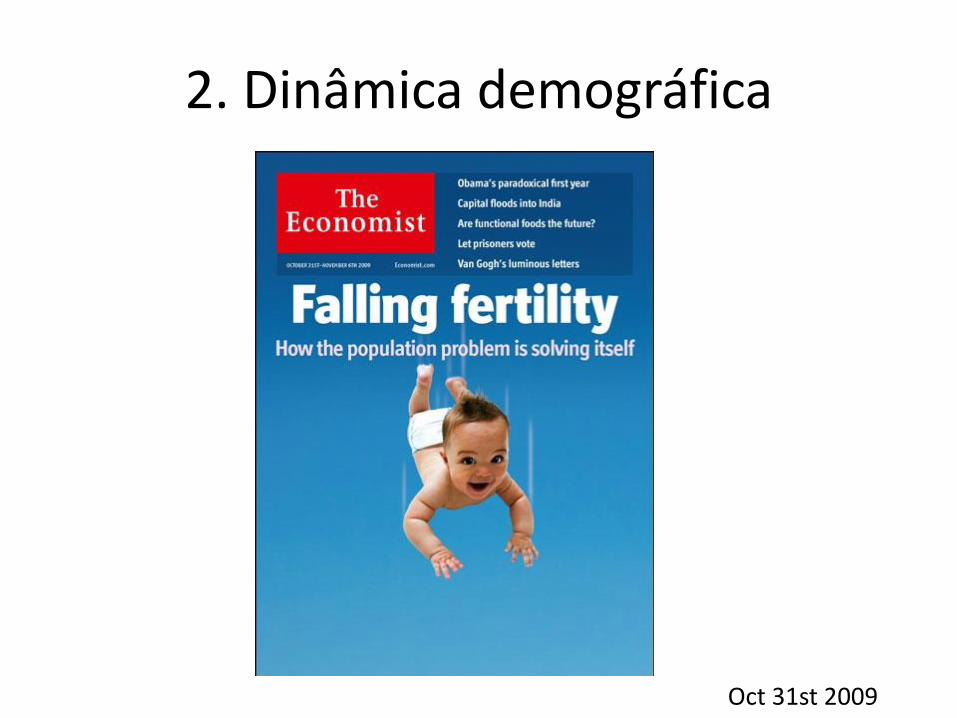
2. Dinâmica demográfica
Oct 31st 2009
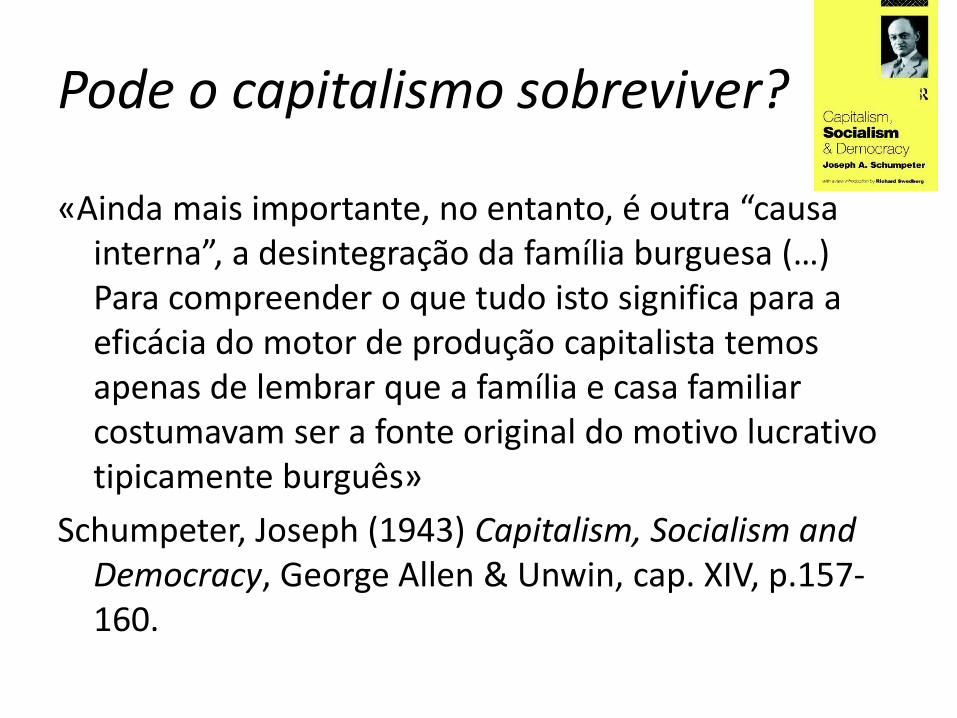
Pode o capitalismo sobreviver?
«Ainda mais importante, no entanto, é outra “causa interna”, a desintegração da família burguesa (…) Para compreender o que tudo isto significa para a eficácia do motor de produção capitalista temos apenas de lembrar que a família e casa familiar costumavam ser a fonte original do motivo lucrativo tipicamente burguês»
Schumpeter, Joseph (1943) Capitalism, Socialism and Democracy, George Allen & Unwin, cap. XIV, p.157-160.
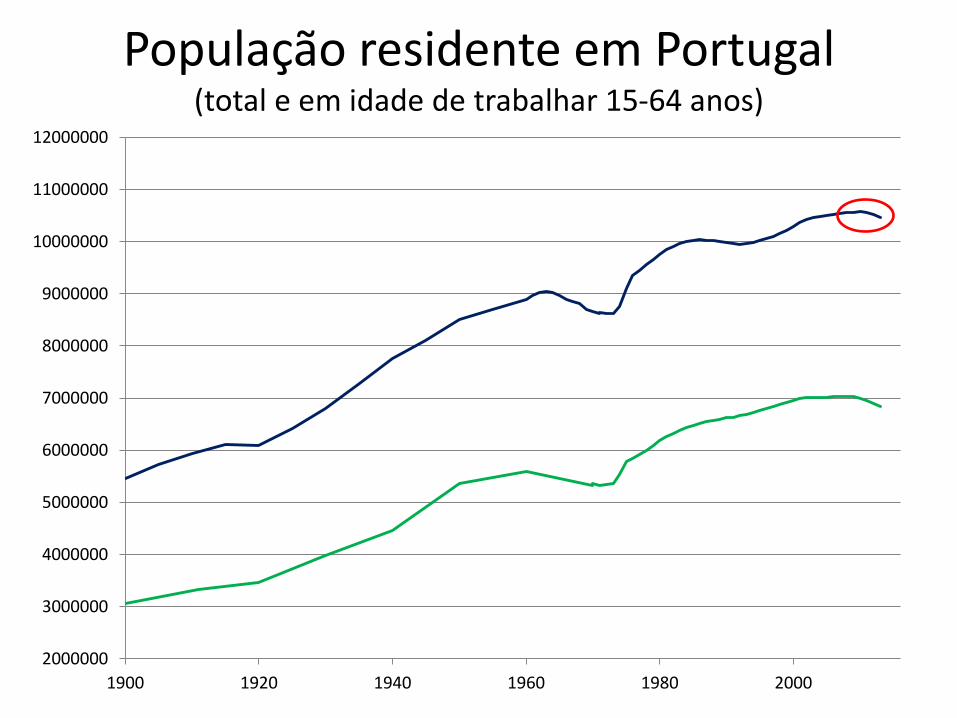
População residente em Portugal (total e em idade de trabalhar 15-64 anos)
2000000
3000000
4000000
5000000
6000000
7000000
8000000
9000000
10000000
11000000
12000000
1900 1920 1940 1960 1980 2000

População residente em Portugal
10 380 000
10 430 000
10 480 000
10 530 000
10 580 000
10 630 000
2004 2006 2008 2010 2012 2014
População residente
- 70 000
- 60 000
- 50 000
- 40 000
- 30 000
- 20 000
- 10 000
0
10 000
20 000
30 000
2004 2006 2008 2010 2012 2014
Variação populacional
- 50 000
- 40 000
- 30 000
- 20 000
- 10 000
0
10 000
20 000
30 000
2004 2006 2008 2010 2012 2014
Saldo natural
- 50 000
- 40 000
- 30 000
- 20 000
- 10 000
0
10 000
20 000
30 000
2004 2006 2008 2010 2012 2014
Saldo migratório
Menos 199 mil em cinco anos
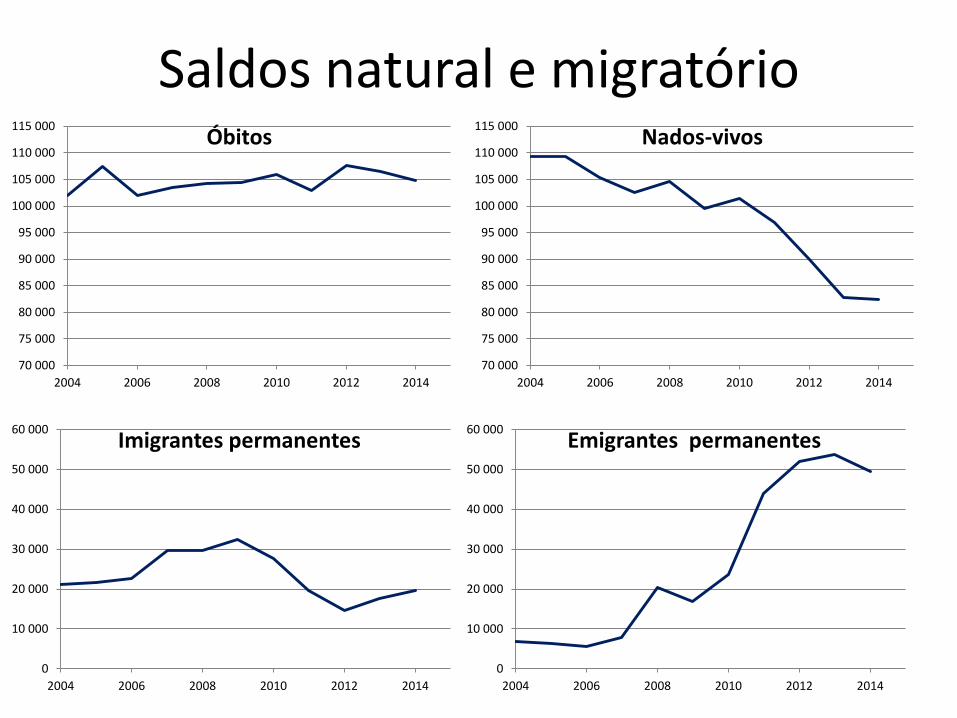
Saldos natural e migratório
70 000
75 000
80 000
85 000
90 000
95 000
100 000
105 000
110 000
115 000
2004 2006 2008 2010 2012 2014
Nados-vivos
70 000
75 000
80 000
85 000
90 000
95 000
100 000
105 000
110 000
115 000
2004 2006 2008 2010 2012 2014
Óbitos
0
10 000
20 000
30 000
40 000
50 000
60 000
2004 2006 2008 2010 2012 2014
Imigrantes permanentes
0
10 000
20 000
30 000
40 000
50 000
60 000
2004 2006 2008 2010 2012 2014
Emigrantes permanentes
2000000
3000000
4000000
5000000
6000000
7000000
8000000
9000000
10000000
11000000
12000000
1900 1920 1940 1960 1980 2000 2020 2040 2060
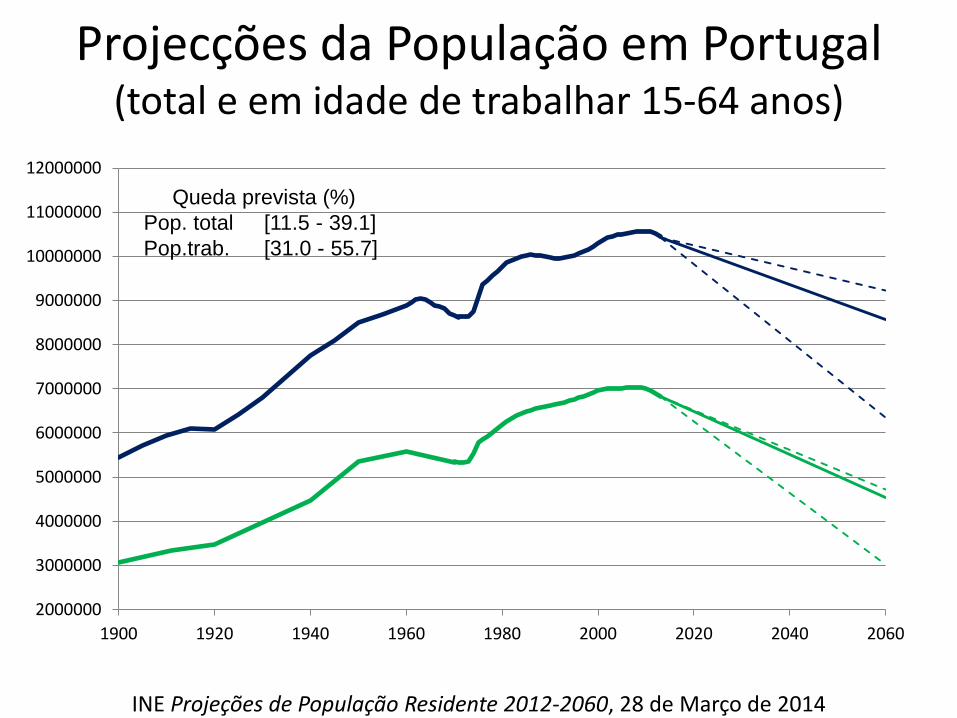
Projecções da População em Portugal (total e em idade de trabalhar 15-64 anos)
INE Projeções de População Residente 2012-2060, 28 de Março de 2014
Queda prevista (%)
Pop. total [11.5 - 39.1]
Pop.trab. [31.0 - 55.7]
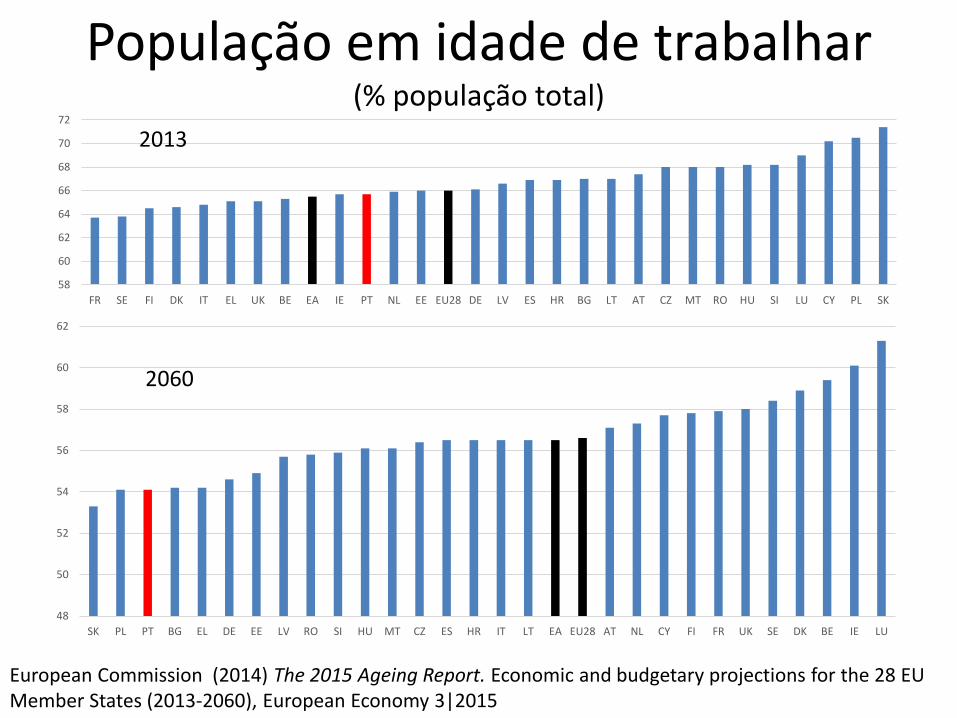
48
50
52
54
56
58
60
62
SK PL PT BG EL DE EE LV RO SI HU MT CZ ES HR IT LT EA EU28 AT NL CY FI FR UK SE DK BE IE LU
2060
58
60
62
64
66
68
70
72
FR SE FI DK IT EL UK BE EA IE PT NL EE EU28 DE LV ES HR BG LT AT CZ MT RO HU SI LU CY PL SK
2013
População em idade de trabalhar (% população total)
European Commission (2014) The 2015 Ageing Report. Economic and budgetary projections for the 28 EU Member States (2013-2060), European Economy 3|2015
3. Dinâmica financeira
Jun 13th 2009
Pode o capitalismo sobreviver?
«Com o declínio do energia impulsionadora fornecida pelo motivo familiar, o horizonte temporal do homem de negócios encolhe, aproximadamente, até à sua esperança de vida. (…) Ele desliza para uma mentalidade anti-poupança e aceita com disponibilidade crescente as teorias anti-poupança que são indicativas de uma filosofia de curto-prazo.»
Schumpeter, Joseph (1943) Capitalism, Socialism and Democracy, George Allen & Unwin, cap. XIV, p.161.
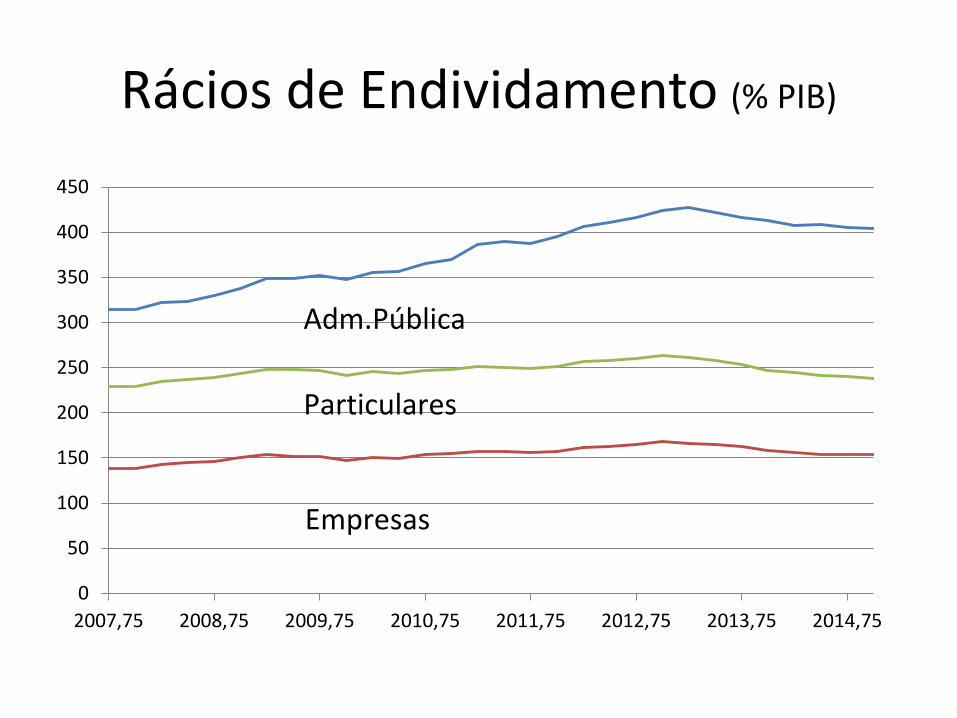
Rácios de Endividamento (% PIB)
0
50
100
150
200
250
300
350
400
450
2007,75 2008,75 2009,75 2010,75 2011,75 2012,75 2013,75 2014,75
Empresas
Particulares
Adm.Pública
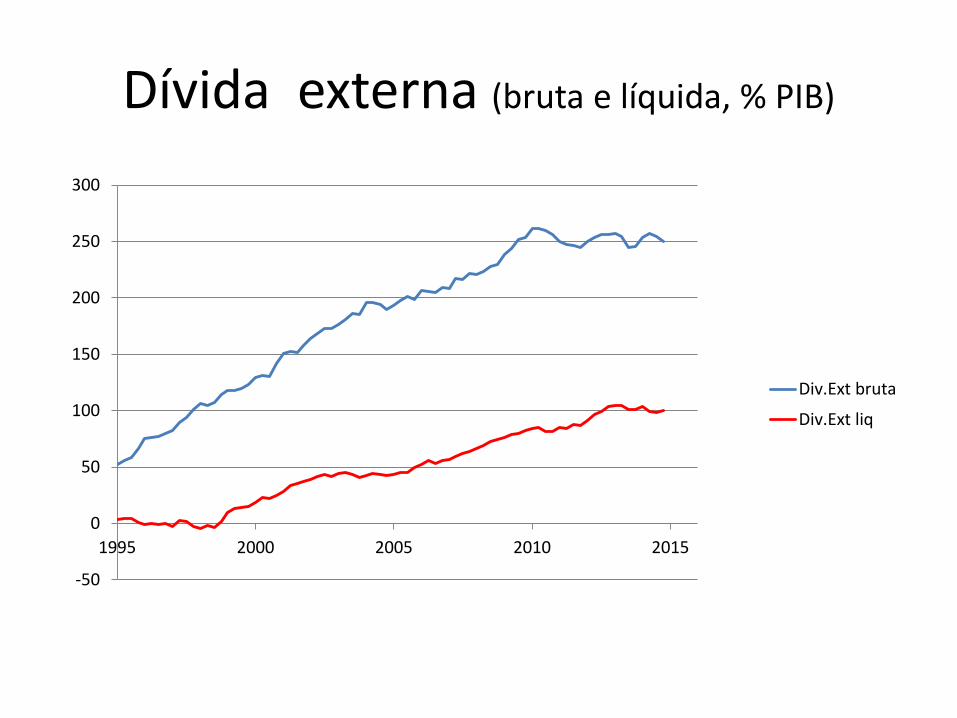
Dívida externa (bruta e líquida, % PIB)
-50
0
50
100
150
200
250
300
1995 2000 2005 2010 2015
Div.Ext bruta
Div.Ext liq
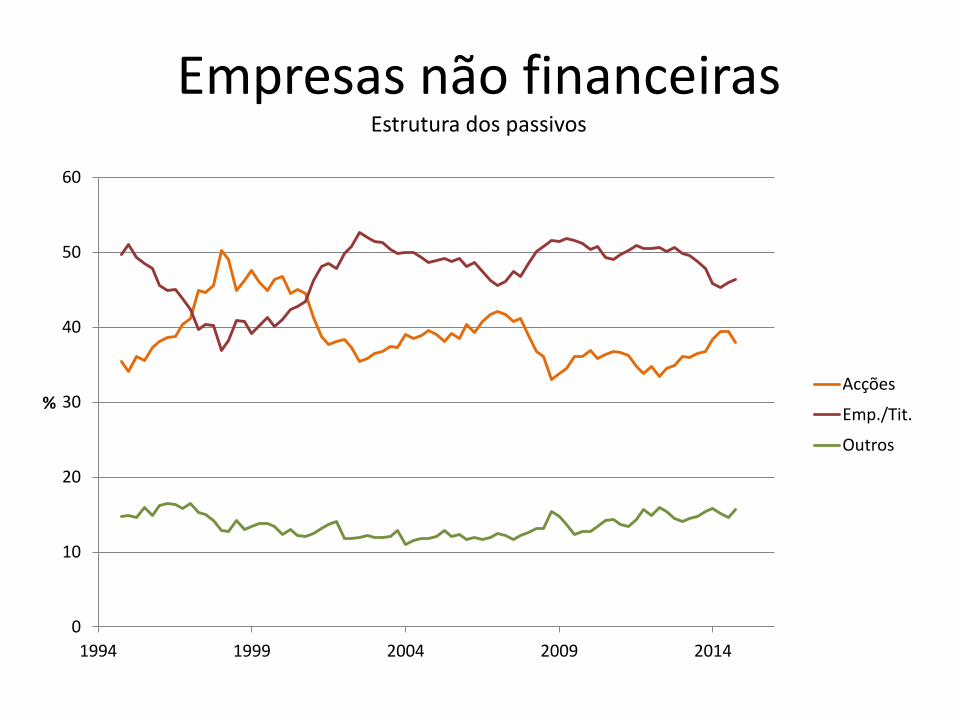
Empresas não financeiras Estrutura dos passivos
0
10
20
30
40
50
60
1994 1999 2004 2009 2014
% Acções
Emp./Tit.
Outros
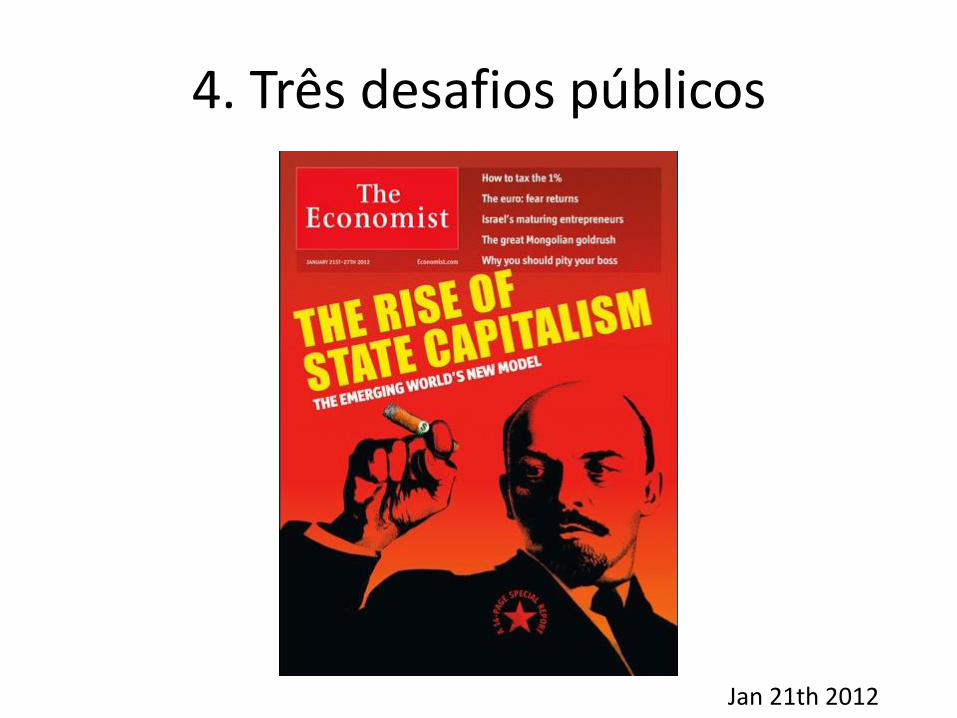
4. Três desafios públicos
Jan 21th 2012
Pode o socialismo funcionar?
«O método burocrático de conduzir os negócios e a atmosfera moral que ele espalha exerce sem dúvida uma influência depressiva nas mentes mais activas. Isto é devido sobretudo à dificuldade, inerente à máquina burocrática, de reconciliar a iniciativa individual com os mecanismos do seu funcionamento.»
Schumpeter, Joseph (1943) Capitalism, Socialism and Democracy, George Allen & Unwin, cap. XIV, p.156
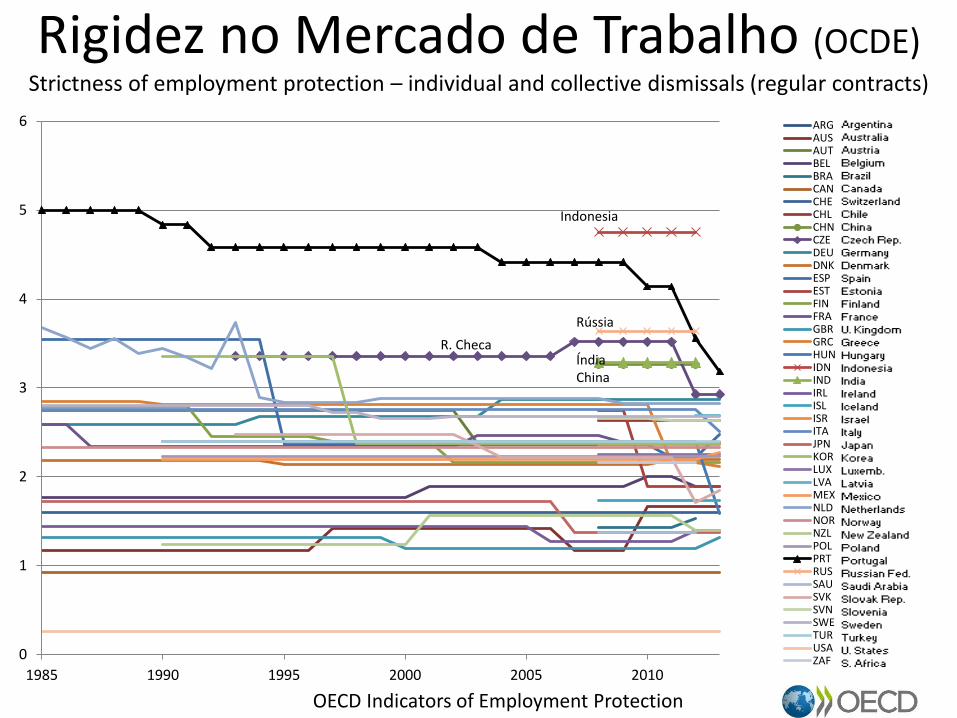
Rigidez no Mercado de Trabalho (OCDE) Strictness of employment protection – individual and collective dismissals (regular contracts)
0
1
2
3
4
5
6
1985 1990 1995 2000 2005 2010
ARGAUSAUTBELBRACANCHECHLCHNCZEDEUDNKESPESTFINFRAGBRGRCHUNIDNINDIRLISLISRITAJPNKORLUXLVAMEXNLDNORNZLPOLPRTRUSSAUSVKSVNSWETURUSAZAF
Indonesia
Rússia
R. Checa Índia China
OECD Indicators of Employment Protection
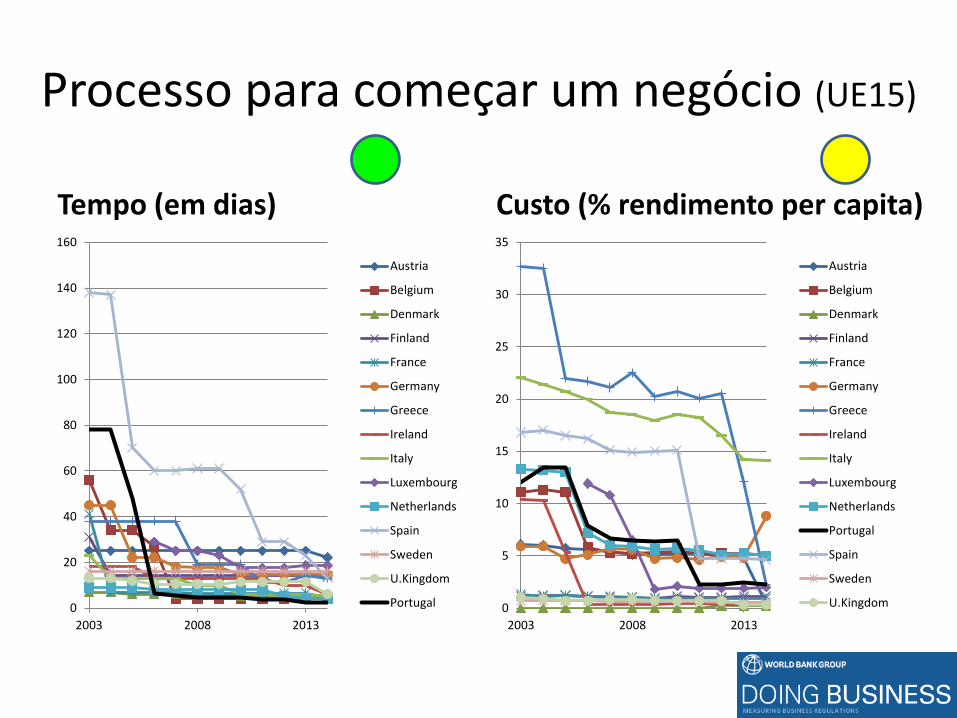
Processo para começar um negócio (UE15)
Tempo (em dias) Custo (% rendimento per capita)
0
5
10
15
20
25
30
35
2003 2008 2013
Austria
Belgium
Denmark
Finland
France
Germany
Greece
Ireland
Italy
Luxembourg
Netherlands
Portugal
Spain
Sweden
U.Kingdom0
20
40
60
80
100
120
140
160
2003 2008 2013
Austria
Belgium
Denmark
Finland
France
Germany
Greece
Ireland
Italy
Luxembourg
Netherlands
Spain
Sweden
U.Kingdom
Portugal

Forçar cumprimento de contratos (UE15)
Tempo (em dias) Custo (% reclamação)
0
200
400
600
800
1000
1200
1400
1600
1800
2003 2008 2013
Austria
Belgium
Denmark
Finland
France
Germany
Greece
Ireland
Italy
Luxembourg
Netherlands
Portugal
Spain
Sweden
U.Kingdom 0
5
10
15
20
25
30
35
40
45
2003 2008 2013
Austria
Belgium
Denmark
Finland
France
Germany
Greece
Ireland
Italy
Luxembourg
Netherlands
Portugal
Spain
Sweden
U.Kingdom
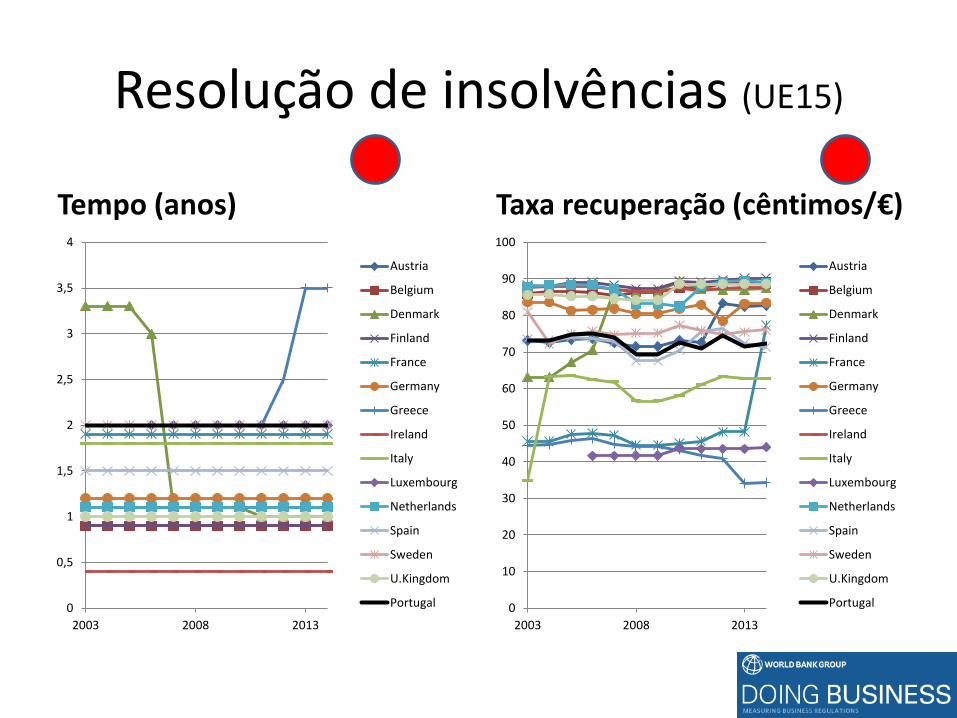
Resolução de insolvências (UE15)
Tempo (anos) Taxa recuperação (cêntimos/€)
0
0,5
1
1,5
2
2,5
3
3,5
4
2003 2008 2013
Austria
Belgium
Denmark
Finland
France
Germany
Greece
Ireland
Italy
Luxembourg
Netherlands
Spain
Sweden
U.Kingdom
Portugal 0
10
20
30
40
50
60
70
80
90
100
2003 2008 2013
Austria
Belgium
Denmark
Finland
France
Germany
Greece
Ireland
Italy
Luxembourg
Netherlands
Spain
Sweden
U.Kingdom
Portugal
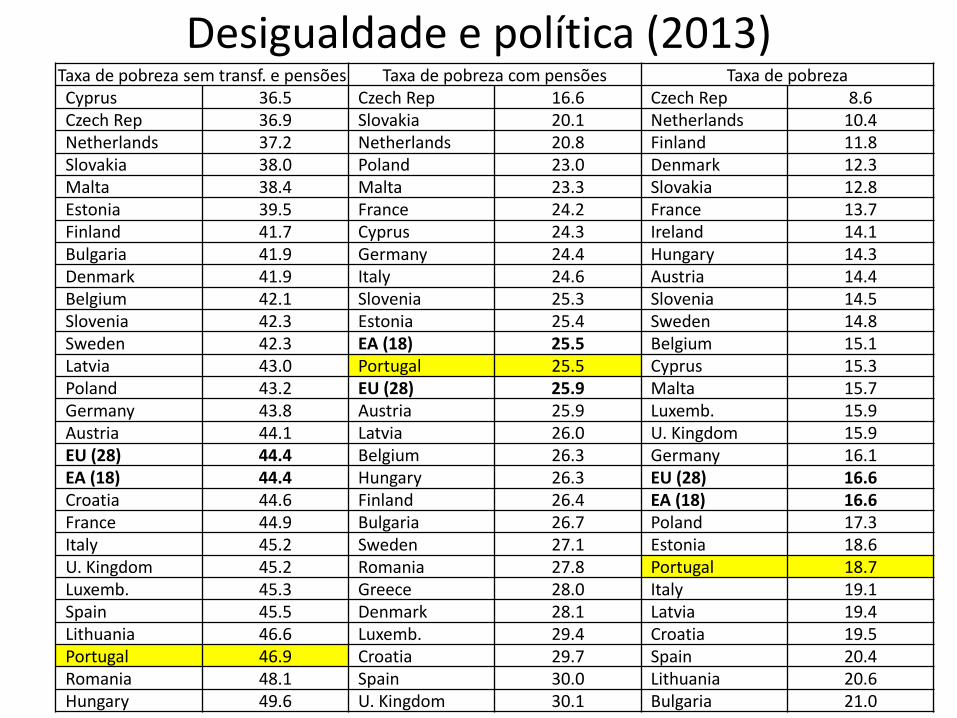
Desigualdade e política (2013) Taxa de pobreza sem transf. e pensões Taxa de pobreza com pensões Taxa de pobreza Cyprus 36.5 Czech Rep 16.6 Czech Rep 8.6 Czech Rep 36.9 Slovakia 20.1 Netherlands 10.4 Netherlands 37.2 Netherlands 20.8 Finland 11.8 Slovakia 38.0 Poland 23.0 Denmark 12.3 Malta 38.4 Malta 23.3 Slovakia 12.8 Estonia 39.5 France 24.2 France 13.7 Finland 41.7 Cyprus 24.3 Ireland 14.1 Bulgaria 41.9 Germany 24.4 Hungary 14.3 Denmark 41.9 Italy 24.6 Austria 14.4 Belgium 42.1 Slovenia 25.3 Slovenia 14.5 Slovenia 42.3 Estonia 25.4 Sweden 14.8 Sweden 42.3 EA (18) 25.5 Belgium 15.1 Latvia 43.0 Portugal 25.5 Cyprus 15.3 Poland 43.2 EU (28) 25.9 Malta 15.7 Germany 43.8 Austria 25.9 Luxemb. 15.9 Austria 44.1 Latvia 26.0 U. Kingdom 15.9 EU (28) 44.4 Belgium 26.3 Germany 16.1 EA (18) 44.4 Hungary 26.3 EU (28) 16.6 Croatia 44.6 Finland 26.4 EA (18) 16.6 France 44.9 Bulgaria 26.7 Poland 17.3 Italy 45.2 Sweden 27.1 Estonia 18.6 U. Kingdom 45.2 Romania 27.8 Portugal 18.7 Luxemb. 45.3 Greece 28.0 Italy 19.1 Spain 45.5 Denmark 28.1 Latvia 19.4 Lithuania 46.6 Luxemb. 29.4 Croatia 19.5 Portugal 46.9 Croatia 29.7 Spain 20.4 Romania 48.1 Spain 30.0 Lithuania 20.6 Hungary 49.6 U. Kingdom 30.1 Bulgaria 21.0
5. Três desafios privados
Dec 13th 2003
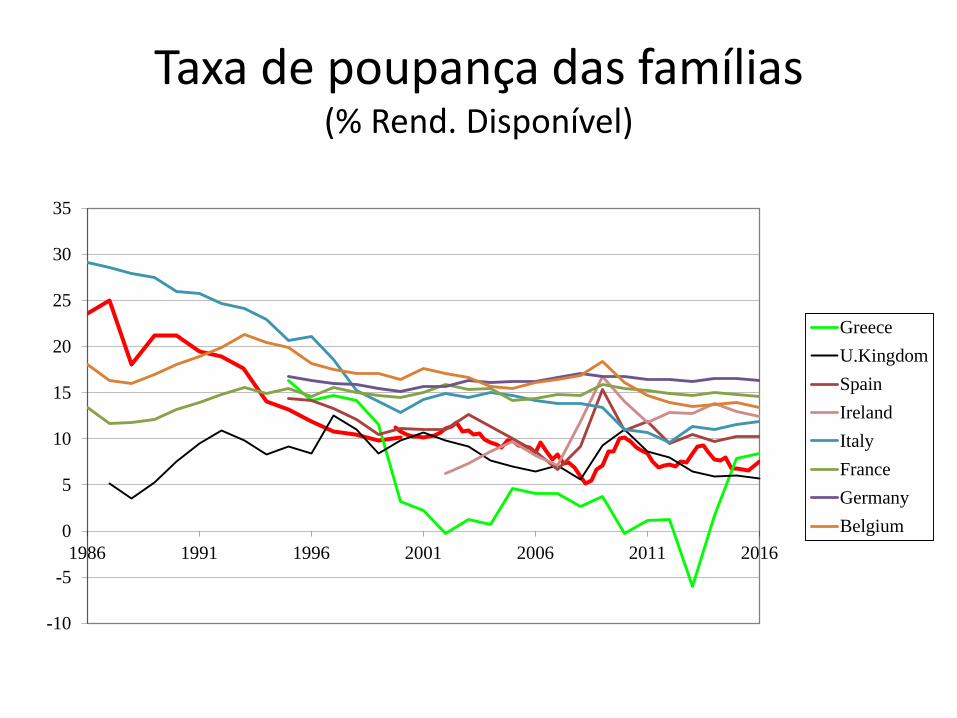
Taxa de poupança das famílias (% Rend. Disponível)
-10
-5
0
5
10
15
20
25
30
35
1986 1991 1996 2001 2006 2011 2016
Greece
U.Kingdom
Spain
Ireland
Italy
France
Germany
Belgium
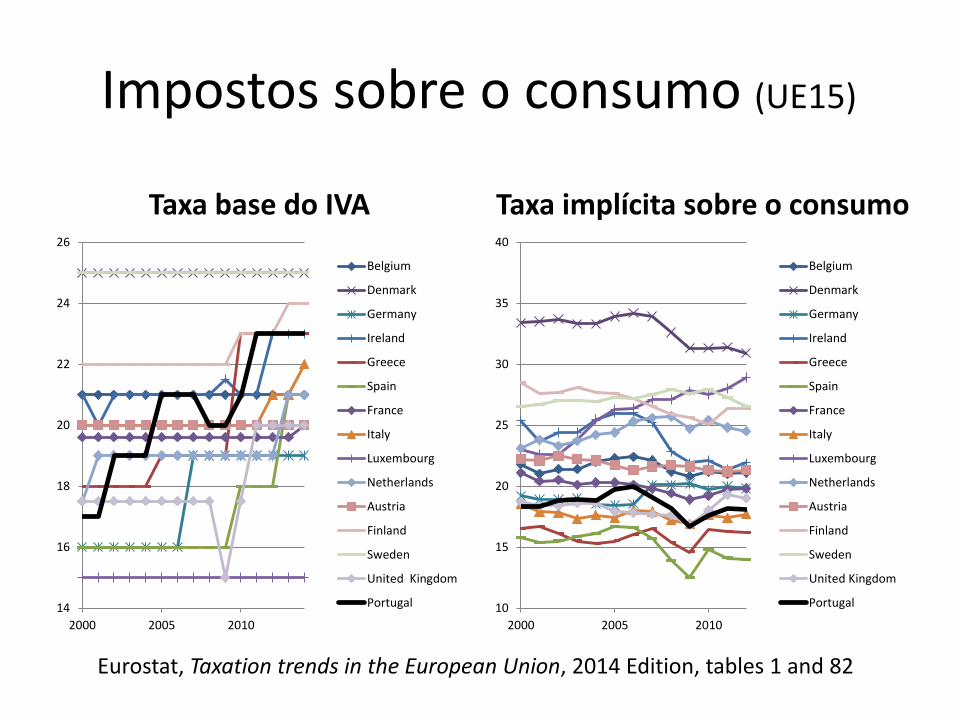
Impostos sobre o consumo (UE15)
Taxa base do IVA
14
16
18
20
22
24
26
2000 2005 2010
Belgium
Denmark
Germany
Ireland
Greece
Spain
France
Italy
Luxembourg
Netherlands
Austria
Finland
Sweden
United Kingdom
Portugal
Taxa implícita sobre o consumo
10
15
20
25
30
35
40
2000 2005 2010
Belgium
Denmark
Germany
Ireland
Greece
Spain
France
Italy
Luxembourg
Netherlands
Austria
Finland
Sweden
United Kingdom
Portugal
Eurostat, Taxation trends in the European Union, 2014 Edition, tables 1 and 82
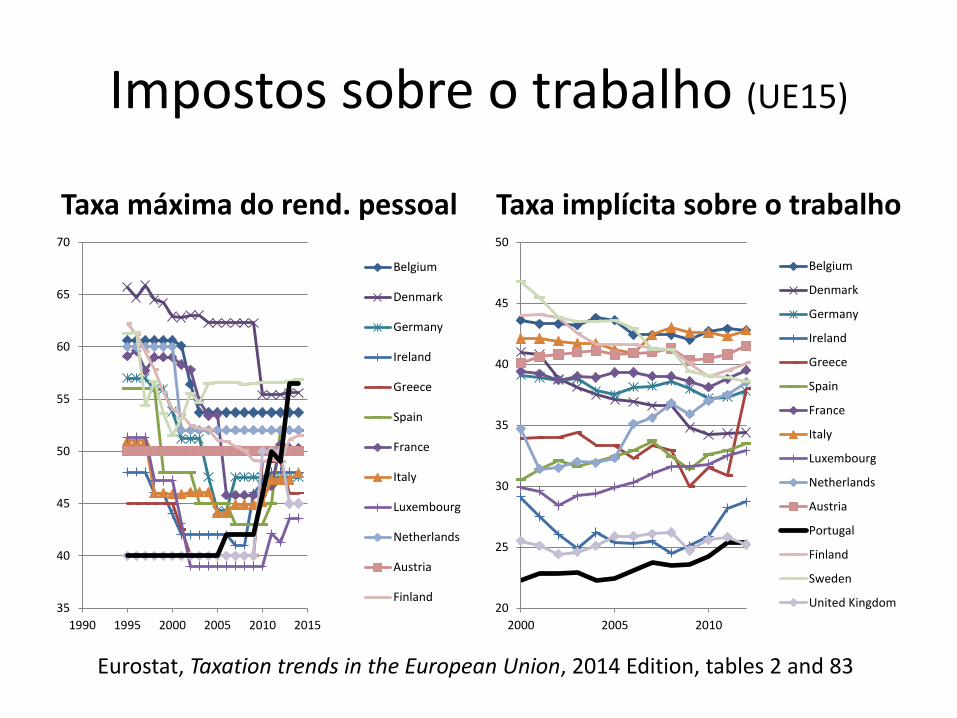
Impostos sobre o trabalho (UE15)
Taxa máxima do rend. pessoal Taxa implícita sobre o trabalho
20
25
30
35
40
45
50
2000 2005 2010
Belgium
Denmark
Germany
Ireland
Greece
Spain
France
Italy
Luxembourg
Netherlands
Austria
Portugal
Finland
Sweden
United Kingdom35
40
45
50
55
60
65
70
1990 1995 2000 2005 2010 2015
Belgium
Denmark
Germany
Ireland
Greece
Spain
France
Italy
Luxembourg
Netherlands
Austria
Finland
Eurostat, Taxation trends in the European Union, 2014 Edition, tables 2 and 83
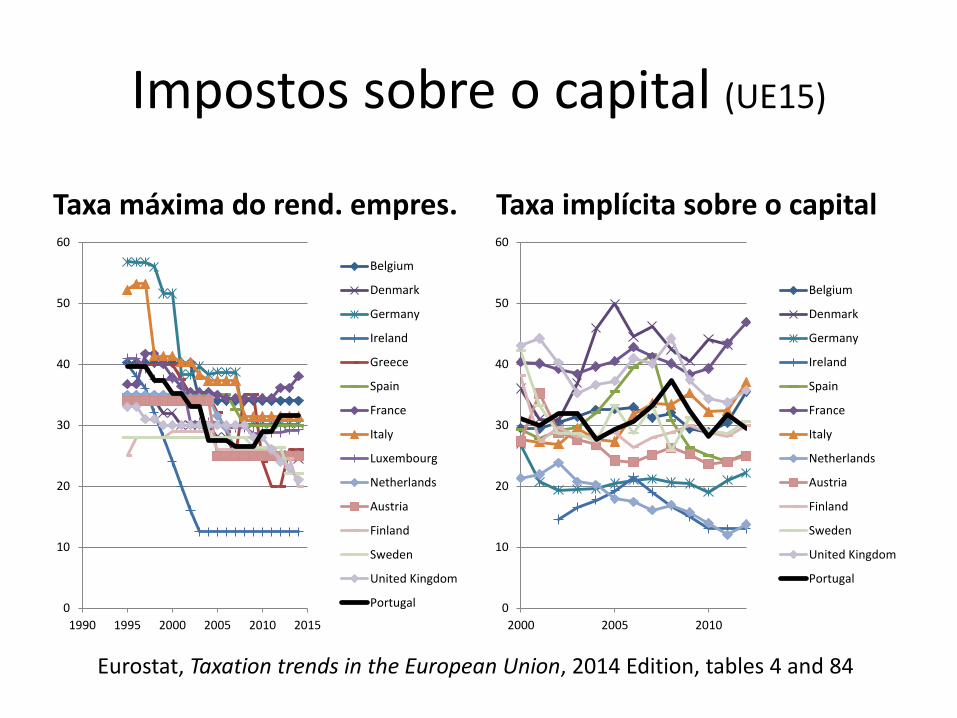
Impostos sobre o capital (UE15)
Taxa máxima do rend. empres. Taxa implícita sobre o capital
0
10
20
30
40
50
60
1990 1995 2000 2005 2010 2015
Belgium
Denmark
Germany
Ireland
Greece
Spain
France
Italy
Luxembourg
Netherlands
Austria
Finland
Sweden
United Kingdom
Portugal 0
10
20
30
40
50
60
2000 2005 2010
Belgium
Denmark
Germany
Ireland
Spain
France
Italy
Netherlands
Austria
Finland
Sweden
United Kingdom
Portugal
Eurostat, Taxation trends in the European Union, 2014 Edition, tables 4 and 84
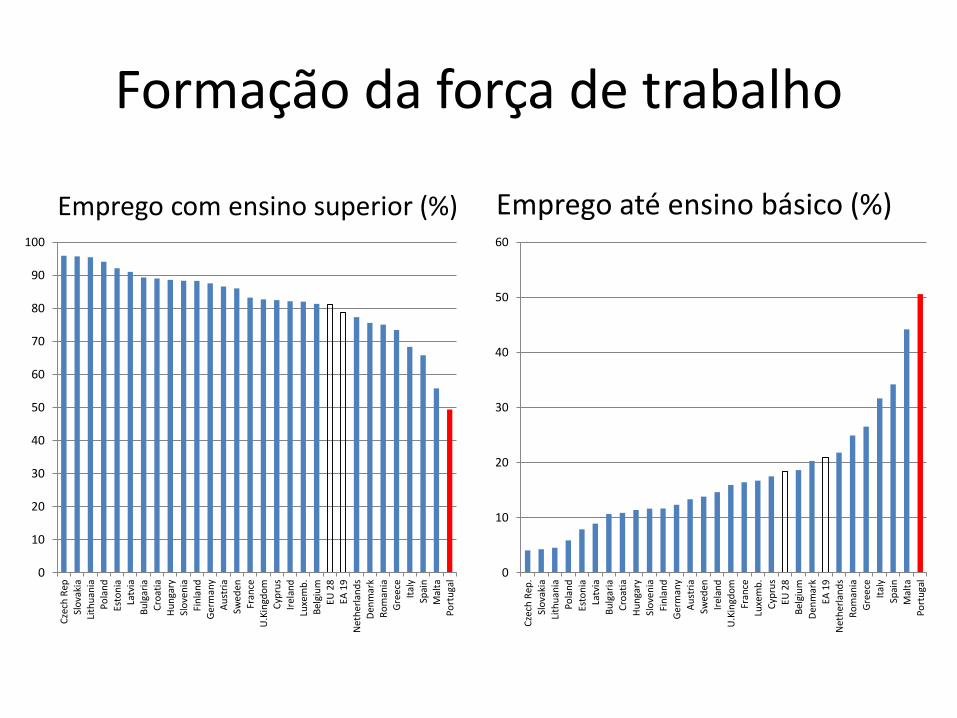
Formação da força de trabalho
Emprego com ensino superior (%) Emprego até ensino básico (%)
0
10
20
30
40
50
60
70
80
90
100
Cze
ch R
epSl
ova
kia
Lith
uan
iaP
ola
nd
Esto
nia
Latv
iaB
ulg
aria
Cro
atia
Hu
nga
rySl
ove
nia
Fin
lan
dG
erm
any
Au
stri
aSw
eden
Fran
ceU
.Kin
gdo
mC
ypru
sIr
elan
dLu
xem
b.
Bel
giu
mEU
28
EA 1
9N
eth
erla
nd
sD
enm
ark
Ro
man
iaG
ree
ceIt
aly
Spai
nM
alta
Po
rtu
gal
0
10
20
30
40
50
60
Cze
ch R
ep.
Slo
vaki
a
Lith
uan
ia
Po
lan
d
Esto
nia
Latv
ia
Bu
lgar
ia
Cro
atia
Hu
nga
ry
Slo
ven
ia
Fin
lan
d
Ger
man
y
Au
stri
a
Swed
en
Irel
and
U.K
ingd
om
Fran
ce
Luxe
mb
.
Cyp
rus
EU 2
8
Bel
giu
m
Den
mar
k
EA 1
9
Net
her
lan
ds
Ro
man
ia
Gre
ece
Ital
y
Spai
n
Mal
ta
Po
rtu
gal
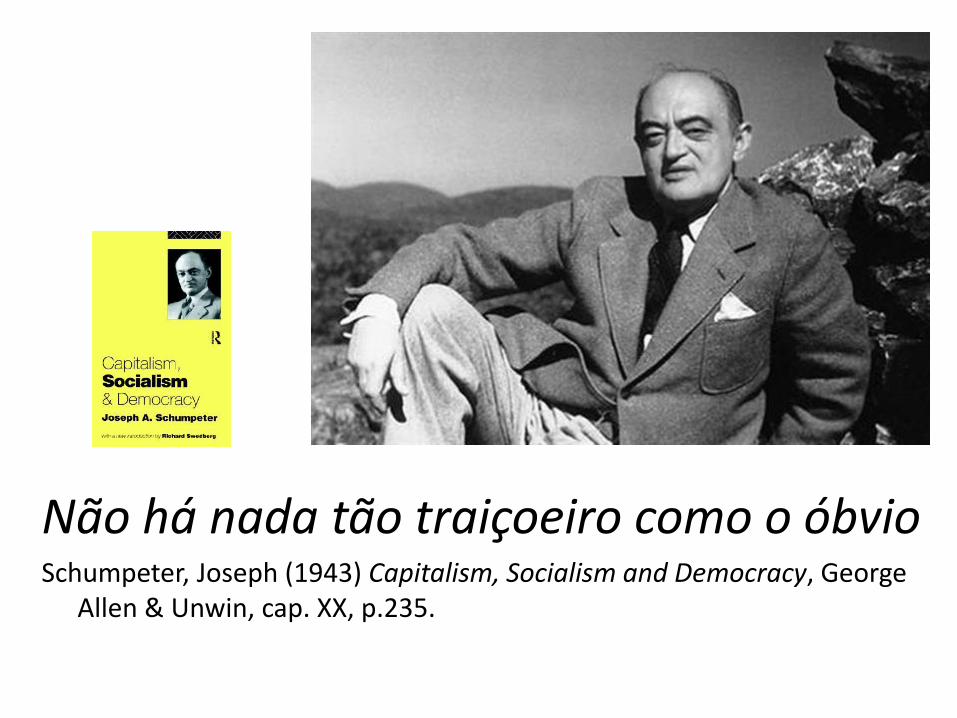
Não há nada tão traiçoeiro como o óbvio Schumpeter, Joseph (1943) Capitalism, Socialism and Democracy, George
Allen & Unwin, cap. XX, p.235.