Leitor automático para determinação do grupo sanguíneo...
29
FACULDADE DE E NGENHARIA DA UNIVERSIDADE DO P ORTO Leitor automático para determinação do grupo sanguíneo por aglutinação Nuno Miguel Duarte Costa P REPARATION FOR THE MS C DISSERTATION Master in Electrical and Computers Engineering Supervisor: Rosaldo José Fernandes Rossetti Second Supervisor: Joaquim Gabriel Magalhães Mendes February 16, 2013
-
Upload
trinhnguyet -
Category
Documents
-
view
216 -
download
0
Transcript of Leitor automático para determinação do grupo sanguíneo...

FACULDADE DE ENGENHARIA DA UNIVERSIDADE DO PORTO
Leitor automático para determinaçãodo grupo sanguíneo por aglutinação
Nuno Miguel Duarte Costa
PREPARATION FOR THE MSC DISSERTATION
Master in Electrical and Computers Engineering
Supervisor: Rosaldo José Fernandes Rossetti
Second Supervisor: Joaquim Gabriel Magalhães Mendes
February 16, 2013

Contents
1 Introduction 11.1 Context . . . . . . . . . . . . . . . . . . . . . . . . . . . . . . . . . . . . . . . 11.2 Problem . . . . . . . . . . . . . . . . . . . . . . . . . . . . . . . . . . . . . . . 11.3 Objectives . . . . . . . . . . . . . . . . . . . . . . . . . . . . . . . . . . . . . . 11.4 Report Structure . . . . . . . . . . . . . . . . . . . . . . . . . . . . . . . . . . . 2
2 Literature Review 32.1 Image Segmentation . . . . . . . . . . . . . . . . . . . . . . . . . . . . . . . . 3
2.1.1 Thresholding . . . . . . . . . . . . . . . . . . . . . . . . . . . . . . . . 42.1.2 Edge Detection . . . . . . . . . . . . . . . . . . . . . . . . . . . . . . . 42.1.3 Region Operations . . . . . . . . . . . . . . . . . . . . . . . . . . . . . 5
2.2 Feature Extraction . . . . . . . . . . . . . . . . . . . . . . . . . . . . . . . . . . 62.2.1 Region Descriptors . . . . . . . . . . . . . . . . . . . . . . . . . . . . . 62.2.2 Region Covariance . . . . . . . . . . . . . . . . . . . . . . . . . . . . . 62.2.3 SIFT . . . . . . . . . . . . . . . . . . . . . . . . . . . . . . . . . . . . 7
3 Methodology 93.1 Gel Card . . . . . . . . . . . . . . . . . . . . . . . . . . . . . . . . . . . . . . . 9
3.1.1 Results Interpretation . . . . . . . . . . . . . . . . . . . . . . . . . . . . 93.2 Practical procedures . . . . . . . . . . . . . . . . . . . . . . . . . . . . . . . . . 10
3.2.1 Image Acquisition . . . . . . . . . . . . . . . . . . . . . . . . . . . . . 103.2.2 Software Development . . . . . . . . . . . . . . . . . . . . . . . . . . . 11
4 Work Plan 134.0.3 Work Plan . . . . . . . . . . . . . . . . . . . . . . . . . . . . . . . . . . 134.0.4 Work Tools . . . . . . . . . . . . . . . . . . . . . . . . . . . . . . . . . 14
5 Conclusion 15
References 17
i

ii CONTENTS

List of Figures
3.1 Test results for different strengths of reaction (from [1]) . . . . . . . . . . . . . . 103.2 Gel card . . . . . . . . . . . . . . . . . . . . . . . . . . . . . . . . . . . . . . . 113.3 Image acquisition system . . . . . . . . . . . . . . . . . . . . . . . . . . . . . . 12
4.1 Gantt Chart . . . . . . . . . . . . . . . . . . . . . . . . . . . . . . . . . . . . . 13
iii

iv LIST OF FIGURES

List of Tables
3.1 Reagent result interpretation . . . . . . . . . . . . . . . . . . . . . . . . . . . . 10
v

vi LIST OF TABLES

Abbreviations
LOG Laplacian of GaussianDOG Difference of GaussiansJUDOCA Junction Detection Operator Based on Circumferential AnchorsSIFT Scale Invariant Feature TransformGLOH Gradient Location and Orientation HistogramPCA Principal Component AnalysisRBC Red Blood CellUSB Universal Serial BusOpenCV Open Source Computer VisionWEKA Waikato Environment for Knowledge Analysis
vii

Chapter 1
Introduction
This chapter presents the project problem, as the context and motivation for this work.
1.1 Context
This project is developed as a preparation for the MSc Dissertation in Electrical and Computers
Engineering scheduled to take place during the second semester of the current academic year. The
aim of this project is to acquaint the student in the duties and requirements for the development of
the dissertation.
1.2 Problem
In clinical laboratories, the gel test is a used method for ABO and Rh typing. ABO and Rh are
blood type systems for blood classification based on the existence or lack of certain red blood cell
(RBC) antigen antibodies. This test after a centrifugation step is usually carried by hand, where
the test result is determined by a laboratory employee. This project aims to simplify this process
by applying machine learning and computer vision techniques, with the purpose of reducing the
chance of human error in repetitive tasks.
1.3 Objectives
The objective of this project is to build an automated system for ABO typing using machine
learning and computer vision techniques. Despite replacing a Human factor with mathematics,
the objective is not to completely eliminate a laboratory employee from the process, as every
result should be validated. The final objective is to deploy a prototype in a clinical laboratory.
1

2 Introduction
1.4 Report Structure
This report is constituted by an introduction and four additional chapters. In the chapter 2 the
literature review is presented along some related works. In the chapter 3 the practical problem
is presented and framed in the computer vision context. In the chapter 4 the work plan and a
description of the several tasks are presented. The final chapter 5 has a brief conclusion to the
report.
Chapter 2
Literature Review
A problem of computer vision applied to the analysis of static images is, as described by Trier et
al. in [2], usually divided in well defined processing steps. Starting with the digital acquisition of
the image and its subsequent preprocessing, existing noise is reduced and the image is segmented
to isolate its individual characteristics. The next step is to extract and store relevant and descrip-
tive information from the segmented image, and then analyse this information with classification
techniques. The process ends with a possible validation of the obtained results, so that wrong
outcomes can be corrected. This chapter focuses in the segmentation and feature extraction steps
of the problem of computer vision applied to the analysis of static images, providing some used
known techniques.
2.1 Image Segmentation
Image segmentation is the process of grouping image pixels with similar characteristics into ho-
mogeneous regions. Formally, image segmentation can be defined by [3, 4]:
n⋃i=1
Si = F with Si∩S j = /0, i 6= j. (2.1)
Being F , in the equation 2.1, the set of all pixels of an image and P() the uniformity predicate
defined on groups of neighbour pixels, then segmentation is the partitioning of the initial set F
into smaller connected subset or regions (S1, S2, ..., Sn). The uniformity predicate is P(Si) = true
for all regions (Si) and P(Si ∪ S j) = true, when Si is adjacent to S j.
In computer vision, a good segmentation is essential to ensure good results in the recogni-
tion and analysis steps, as such different problems may require different segmentation methods
or a combination of multiple methods. The various methods can be broken into measurement-
space-based algorithms (e.g. level thresholding of histograms), pixel-similarity-based algorithms
(e.g. region growing), pixel-difference-based algorithms (e.g. edge detection), and physics-based
schemes [5].
3
4 Literature Review
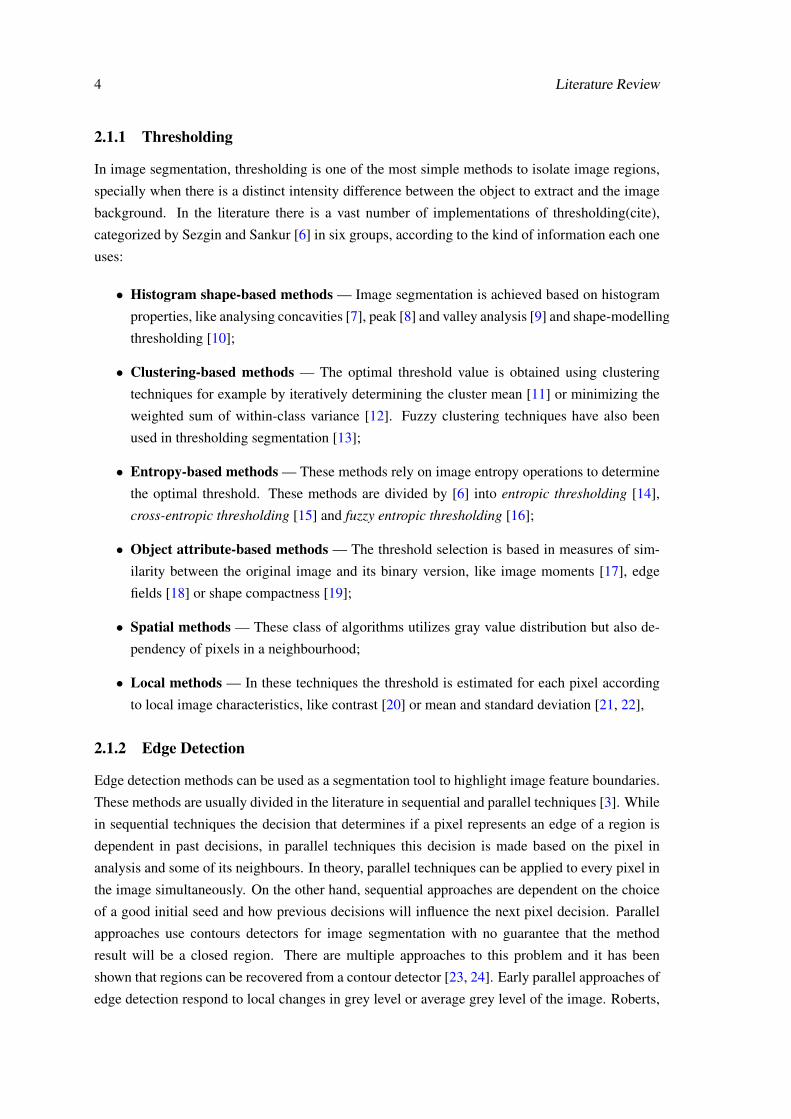
2.1.1 Thresholding
In image segmentation, thresholding is one of the most simple methods to isolate image regions,
specially when there is a distinct intensity difference between the object to extract and the image
background. In the literature there is a vast number of implementations of thresholding(cite),
categorized by Sezgin and Sankur [6] in six groups, according to the kind of information each one
uses:
• Histogram shape-based methods — Image segmentation is achieved based on histogram
properties, like analysing concavities [7], peak [8] and valley analysis [9] and shape-modelling
thresholding [10];
• Clustering-based methods — The optimal threshold value is obtained using clustering
techniques for example by iteratively determining the cluster mean [11] or minimizing the
weighted sum of within-class variance [12]. Fuzzy clustering techniques have also been
used in thresholding segmentation [13];
• Entropy-based methods — These methods rely on image entropy operations to determine
the optimal threshold. These methods are divided by [6] into entropic thresholding [14],
cross-entropic thresholding [15] and fuzzy entropic thresholding [16];
• Object attribute-based methods — The threshold selection is based in measures of sim-
ilarity between the original image and its binary version, like image moments [17], edge
fields [18] or shape compactness [19];
• Spatial methods — These class of algorithms utilizes gray value distribution but also de-
pendency of pixels in a neighbourhood;
• Local methods — In these techniques the threshold is estimated for each pixel according
to local image characteristics, like contrast [20] or mean and standard deviation [21, 22],
2.1.2 Edge Detection
Edge detection methods can be used as a segmentation tool to highlight image feature boundaries.
These methods are usually divided in the literature in sequential and parallel techniques [3]. While
in sequential techniques the decision that determines if a pixel represents an edge of a region is
dependent in past decisions, in parallel techniques this decision is made based on the pixel in
analysis and some of its neighbours. In theory, parallel techniques can be applied to every pixel in
the image simultaneously. On the other hand, sequential approaches are dependent on the choice
of a good initial seed and how previous decisions will influence the next pixel decision. Parallel
approaches use contours detectors for image segmentation with no guarantee that the method
result will be a closed region. There are multiple approaches to this problem and it has been
shown that regions can be recovered from a contour detector [23, 24]. Early parallel approaches of
edge detection respond to local changes in grey level or average grey level of the image. Roberts,
2.1 Image Segmentation 5
Sobel and Prewitt gradient operators, called first difference operators, and the Laplacian operator,
a second difference operator, detect edges by convolving a grey-scale image with local derivative
filters. Marr and Hildreth proposed the use of the zero-crossing segments of the Laplacian of
Gaussian operator (LOG) for contour detection, or replacing the previous LOG operator by the
Difference of Gaussians (DOG) operator for a fast approximation [25].
Canny defined an optimal edge detector method as an algorithm with the three main charac-
teristics [26]:
1. Good detection — There should be a low probability of failing to mark real edge points,
and low probability of falsely marking non-edge points;
2. Good localization — Points marked as edges by the operator should be as close as possible
to the centre of the true edge;
3. Single edge response — The detector should only produce a single output in response to a
single edge.
With these performance criteria Canny proposed a optimal edge detector by convolving the
image with an optimal filter, that can be approximated by the first derivative of the Gaussian, and
selecting the output maxima as the edges. For the two-dimensional scheme, the image is convo-
luted with the first order derivatives of the two-dimensional Gaussian. Computing the gradient of
the smoothed image, the edges are then located at the maxima of the gradient modulus taken in
the direction of the gradient.
Detection of lines, which correspond to local extrema of the grey level image, can also give
valuable information in the position of image edges. Haralick [28] proposed an algorithm where
lines occur at pixels having zero-crossings of the first direction derivative taken in the direction that
maximizes de second directional derivative. Giraudan [29] proposed similar algorithm detecting
a line at a negative local maximum of the second derivative of the image. In an analogous way,
junctions can identify image corners and the orientations of the edges forming it. Rangarajan et
al. [30] derive an optimal detector using Canny’s criteria, that locates junctions formed by two
linear symmetric edges. The junctions are then located at the local maxima output of the image
convolution with twelve different masks that differ in orientation and angle. Elias and Laganière
[31] propose an junction detection operator based on circumferential anchors (JUDOCA) that
splits the process in and edge detection phase and an junction detection phase.
2.1.3 Region Operations
Region based approaches attempt to group pixels into homogeneous regions, clustering images
features such as brightness, colour or texture. Region growing and splitting are two basic region
operators. While the first starts from a initial point as the seed region and then expands to its
homogeneous neighbours, the splitting approach uses the whole images as the initial region seed
and then keeps splitting the region until it is homogeneous. Region merging is usually used after
6 Literature Review
these operators to join similar regions. One major drawback is the inherent sequential nature of
these techniques.
Arbeláez et al. [24] identify three widely used algorithms of region segmentation: a graph-
based region merging algorithm proposed by Felzenszwalb and Huttenlocher [32] which produces
segmentations that are not too coarse and not too fine, despite making simple greedy decisions;
the mean shift segmentation algorithm by Comaniciu and Meer [33] where regions are formed by
grouping pixels whose convergence points are closer than a threshold hs in the spatial domain and
hr in the range domain; the spectral graph theoretic framework of normalized cuts who partitions
the image into regions of coherent texture and brightness [34, 35].
2.2 Feature Extraction
Feature extraction in image analysis is the process of translating image features to easily process-
able digital information. Some known techniques are based on shape attributes, contour, texture
or local image descriptors. From the past discussed methods for image segmentation some can
also be used as image descriptors, such as the image histogram, image edges or image blobs. Lo-
cal descriptors can be considered a robust method for image representation that allows to identify
objects or scenes even without previous image segmentation [36, 37]. These features do not need
to translate directly into a object propriety, since the goal is to analyse their statistics.
2.2.1 Region Descriptors
Region descriptors are features extracted from segmented image regions. These features can be
simple descriptors as region area and perimeter, shape circularity measurements [38], mean and
median values of region pixels, shape eccentricity and elongatedness ratios or region moments.
Gianfranco and Yi proposed the use of region moments as invariant region descriptors [39].
Region moments were presented as descriptors based on an extension of the image moments con-
cept. Region moments represent a statistical description of the region data which is a projection
onto the space of polynomials with two variables. In [39] the authors present three scale and ro-
tation invariant region moments descriptors: the first computes the central moments of the image
features of a region; the second one is the set of the Hu’s invariants [40] computed over every
image feature; the third computes the radial moments of the image features.
2.2.2 Region Covariance
Tuzel et al. [41] proposed the use of the covariance of multiple region statistics as the region
descriptor. The result is a low-dimensional covariance matrix that fuse multiple region features
which might be correlated.
CR =1
n−1
n
∑k=1
(zk−µ)(zk−µ)T (2.2)
2.2 Feature Extraction 7
The covariance matrix of a region R is then given by CR, in the equation 2.2, where {zk}k=1...n
are the feature points inside R and µ the mean of the points. In the paper, the authors also proposed
an alternative nearest neighbour search algorithm adapted to the covariance features.
2.2.3 SIFT
Lowe presented scale the invariant feature transform (SIFT) as a procedure of transforming image
data into scale-invariant coordinates relative to local features [42]. The process is divided in four
major steps: 1) scale-space extrema detection – a difference-of-Gaussian function is used to iden-
tify potential interest points that are invariant to scale and orientation; 2) Key point localization
– At each candidate location, a model is fit to determine location and scale. Key points are then
selected based on measures of their stability; 3) Orientation assignment – One or more orienta-
tions are assigned to each key point location based on local image gradient directions. All future
operations are performed on image data that has been transformed relative to the assigned orien-
tation, scale, and location for each feature, thereby providing invariance to these transformations
the features are invariant to image scaling and rotation, and partially invariant to change in illu-
mination and 3D camera viewpoint; and 4) Key point descriptor – The local image gradients are
measured at the selected scale in the region around each key point. These are transformed in to a
representation that allows for significant levels of local shape distortion and change in illumination
Despite generating big descriptor sets, the cost of extracting these features is minimized by
taking a cascade filtering approach, in which the more expensive operations are applied only at
locations that pass an initial test.
The gradient location and orientation histogram (GLOH), by Mikolajczyk and Schmid [43] is
proposed as an extension to the SIFT descriptor. The GLOH was designed to increase robustness
and distinctiveness of the SIFT, also applying principal component analysis (PCA) to reduce the
big descriptors size, as suggested by Ke and Sukthankar [44].

8 Literature Review
Chapter 3
Methodology
In clinical laboratories, the gel test is a used method for ABO and Rh typing. ABO and Rh are
blood type systems for blood classification based on the existence or lack of certain Red Blood
Cell (RBC) antigen antibodies. The proposed gel test by Lapierre et al. [45] uses microtubes
filled with a mixture of gel, buffer, and reagents that are centrifuged with a suspension of RBCs.
After centrifugation, in negative reagent reactions the RBCs pass through the gel and collect at the
bottom of the microtube, whereas in positive reagent reactions they are dispersed throughout the
length of the gel. This project aims to develop a prototype capable of automatically reading and
determining a gel card test, sending and storing the result in the laboratory’s digital system. In this
system, the captured card’s image, serial number, batch code and expiration date should be stored
in a system report for later evaluation.
3.1 Gel Card
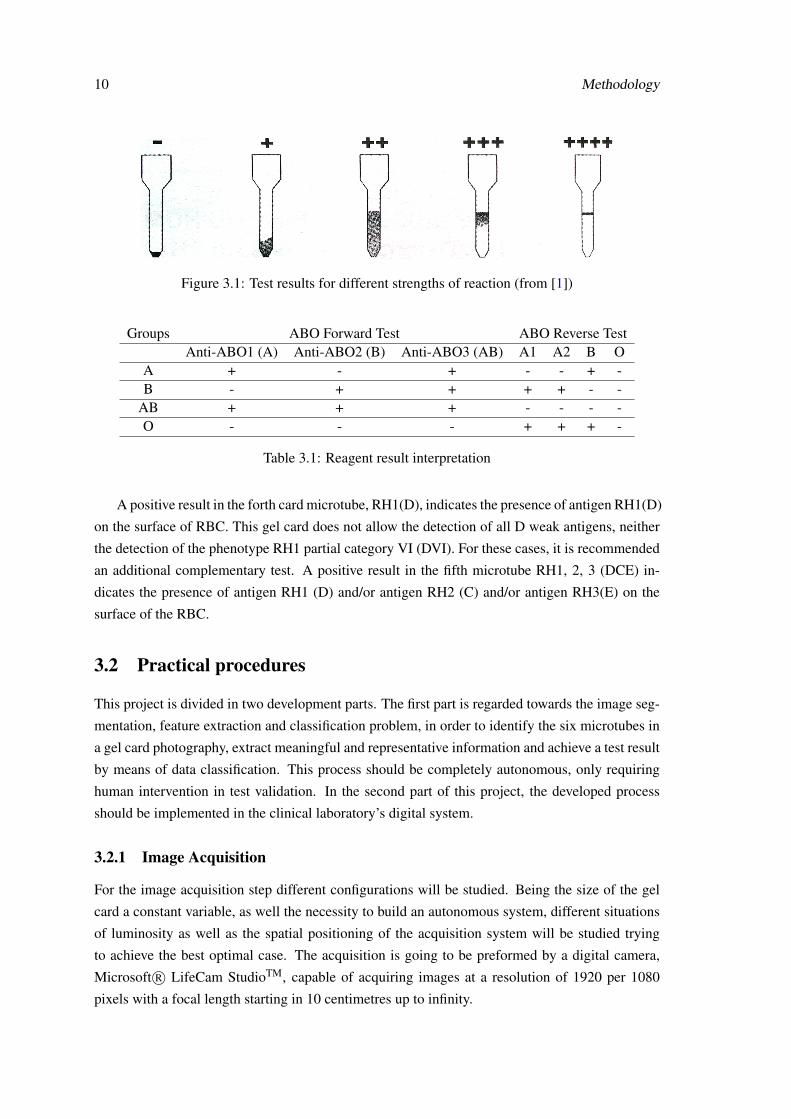
The gel cards studied in this project are developed by Bio-Rad Laboratories. The gel cards are
designed for ABO forward test and the determination of RH1 (D) antigens. Each card has six
gel microtubes, where five of them are impregnated with a reagent specific to the erythrocyte
antigen to be determined. The remaining microtube is used as control signal for test validity.
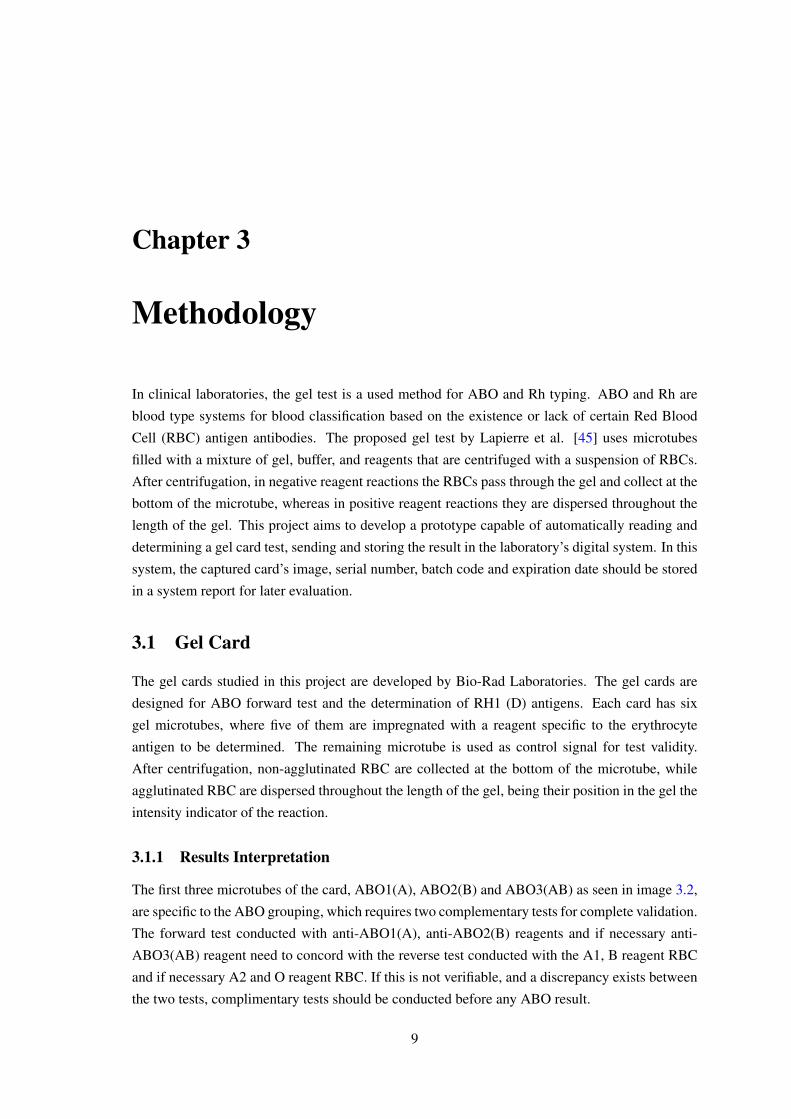
After centrifugation, non-agglutinated RBC are collected at the bottom of the microtube, while
agglutinated RBC are dispersed throughout the length of the gel, being their position in the gel the
intensity indicator of the reaction.
3.1.1 Results Interpretation
The first three microtubes of the card, ABO1(A), ABO2(B) and ABO3(AB) as seen in image 3.2,
are specific to the ABO grouping, which requires two complementary tests for complete validation.
The forward test conducted with anti-ABO1(A), anti-ABO2(B) reagents and if necessary anti-
ABO3(AB) reagent need to concord with the reverse test conducted with the A1, B reagent RBC
and if necessary A2 and O reagent RBC. If this is not verifiable, and a discrepancy exists between
the two tests, complimentary tests should be conducted before any ABO result.
9
10 Methodology
Figure 3.1: Test results for different strengths of reaction (from [1])
Groups ABO Forward Test ABO Reverse TestAnti-ABO1 (A) Anti-ABO2 (B) Anti-ABO3 (AB) A1 A2 B O
A + - + - - + -B - + + + + - -
AB + + + - - - -O - - - + + + -
Table 3.1: Reagent result interpretation
A positive result in the forth card microtube, RH1(D), indicates the presence of antigen RH1(D)
on the surface of RBC. This gel card does not allow the detection of all D weak antigens, neither
the detection of the phenotype RH1 partial category VI (DVI). For these cases, it is recommended
an additional complementary test. A positive result in the fifth microtube RH1, 2, 3 (DCE) in-
dicates the presence of antigen RH1 (D) and/or antigen RH2 (C) and/or antigen RH3(E) on the
surface of the RBC.
3.2 Practical procedures
This project is divided in two development parts. The first part is regarded towards the image seg-
mentation, feature extraction and classification problem, in order to identify the six microtubes in
a gel card photography, extract meaningful and representative information and achieve a test result
by means of data classification. This process should be completely autonomous, only requiring
human intervention in test validation. In the second part of this project, the developed process
should be implemented in the clinical laboratory’s digital system.
3.2.1 Image Acquisition
For the image acquisition step different configurations will be studied. Being the size of the gel
card a constant variable, as well the necessity to build an autonomous system, different situations
of luminosity as well as the spatial positioning of the acquisition system will be studied trying
to achieve the best optimal case. The acquisition is going to be preformed by a digital camera,
Microsoft R© LifeCam StudioTM, capable of acquiring images at a resolution of 1920 per 1080
pixels with a focal length starting in 10 centimetres up to infinity.
3.2 Practical procedures 11
Figure 3.2: Gel card
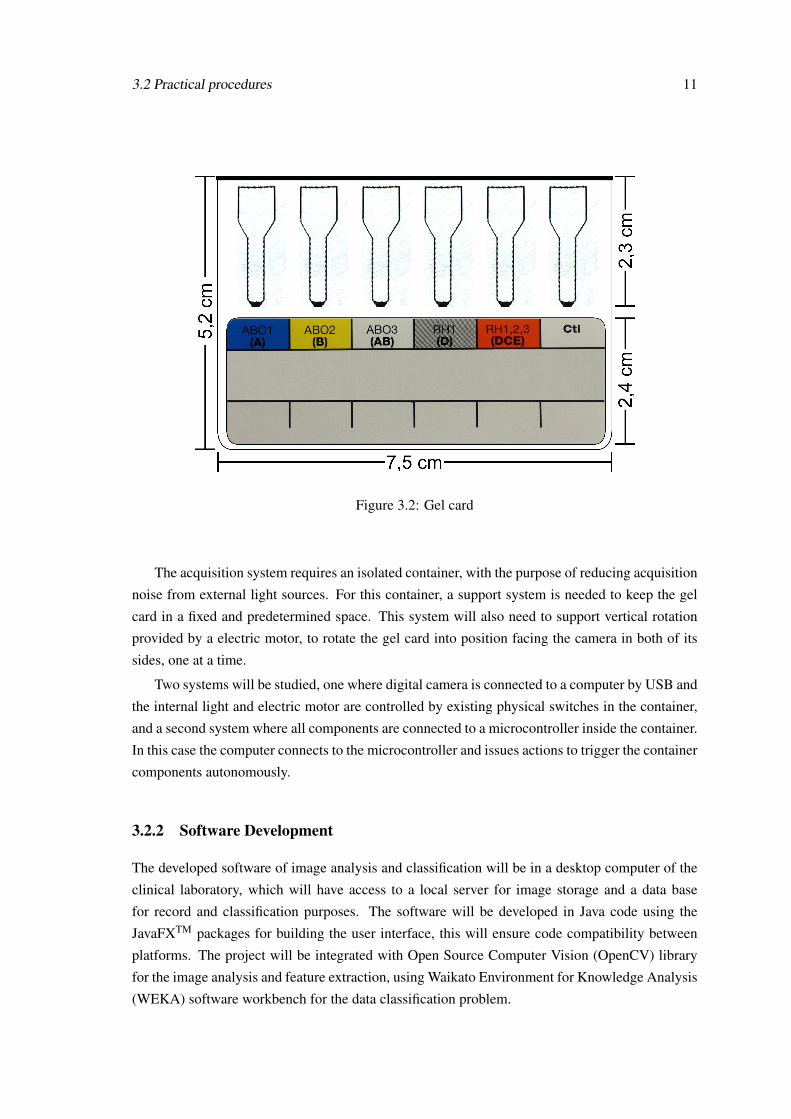
The acquisition system requires an isolated container, with the purpose of reducing acquisition
noise from external light sources. For this container, a support system is needed to keep the gel
card in a fixed and predetermined space. This system will also need to support vertical rotation
provided by a electric motor, to rotate the gel card into position facing the camera in both of its
sides, one at a time.
Two systems will be studied, one where digital camera is connected to a computer by USB and
the internal light and electric motor are controlled by existing physical switches in the container,
and a second system where all components are connected to a microcontroller inside the container.
In this case the computer connects to the microcontroller and issues actions to trigger the container
components autonomously.
3.2.2 Software Development
The developed software of image analysis and classification will be in a desktop computer of the
clinical laboratory, which will have access to a local server for image storage and a data base
for record and classification purposes. The software will be developed in Java code using the
JavaFXTM packages for building the user interface, this will ensure code compatibility between
platforms. The project will be integrated with Open Source Computer Vision (OpenCV) library
for the image analysis and feature extraction, using Waikato Environment for Knowledge Analysis
(WEKA) software workbench for the data classification problem.
12 Methodology
Figure 3.3: Image acquisition system
The user interface will have a screen region where the captured card image will be displayed,
a smaller region to display the classification test result and a validation region where the user can
evaluate the test result, fixing it.

Chapter 4
Work Plan
In this chapter the planned work schedule is presented, as some expected work tools. The work
schedule is displayed as a Gantt diagram with a estimation in weeks for each phase.
4.0.3 Work Plan
In figure 4.1 is presented the Gantt diagram of the project work plan with the expected duration
for each task. Each slot represents a week, being the indicated number the first day of said week.
2013
Feb Mar Apr May Jun
17 24 3 10 17 24 31 7 14 21 28 5 12 19 26 2
Feature extraction and classification study
Study of work tools
Practical procedures experiences
Tests and development of physical device
Development of test procedures
Development of final work
Implementation of physical device
Dissertation report
Presentation development
Website development and updating
Figure 4.1: Gantt Chart
13

14 Work Plan
• Feature extraction and classification study — Being this project a computer vision prob-
lem, it is required the selection of two feature extraction and two classification methods for
deeper understanding that are appropriate for solving the project goal;
• Study of work tools — It is required the study of the proposed work tools as well as an
validation of their usefulness for the project goal;
• Practical procedures experiences — In this task it will be tested the proposed hardware
for image capture and its responses to different light scenarios with the gel card;
• Tests and development of physical device — With the results of the previous task, the
development of the physical device will start. Here the decision for a partially manual or
fully automated system should be taken;
• Development of test procedures — Development of tests for the selected feature extraction
and classification methods;
• Development of final work — Development of the final project, ready to be deployed in
the clinical laboratory;
• Implementation of physical device — In this task the project will be integrated with the
physical image capturing device;
• Dissertation report and presentation development — This final task is reserved for the
writing of the dissertation report as well as developing the final project presentation;
• Website development and updating — This is a continuous task, starting from the first
week, for the development of the project website as its continuous update.
4.0.4 Work Tools
This project is going to be developed in the Java programming language, using the JavaFXTM
packages for building the user interface. The ABO test data will be stored in a local database and
the test images in a local server.
The project will also use the OpenCV library for the image analysis and feature extraction.
For the data classification problem it will be studied the use of WEKA software workbench.
Chapter 5
Conclusion
This work was developed as a report for Preparation of the MSc Dissertation.
The literature review revealed that the subject in hand has well defined roots, with journals arti-
cles dating back to 1974. There is a good amount of literature in the three highlighted steps, image
segmentation, feature extraction, and classification, being continually updated over the years. The
literature review chapter also tries to present a global introduction to te subjects in study.
It was then presented in chapter three the problem in study with the proposed physical captur-
ing device to be deployed in the clinical laboratory.
In the last chapter the work plan was discussed, giving approximate task duration as a brief
description of what each one represents.
15

16 Conclusion
References
[1] Bio-Rad. ScanGelTM Monoclonal ABO/RH - 86496 86426, 2008.
[2] Oivind Due Trier, Anil K. Jain, and Torfinn Taxt. Feature extraction methods for characterrecognition - a survey. Pattern Recognition, 29(4):641–662, 1996.
[3] H D Cheng, X H Jiang, Y Sun, and Jingli Wang. Color image segmentation: advances andprospects. Pattern Recognition, 34(September):2259–2281, 2001.
[4] Nikhil R. Pal and Sankar K. Pal. A Review on Image Segmentation Techniques. PatternRecognition, 26(9):1277–1294, 1993. (cited in Cheng, 2001).
[5] F Kurugollu, B Sankur, and a.E Harmanci. Color image segmentation using histogram mul-tithresholding and fusion. Image and Vision Computing, 19(13):915–928, November 2001.
[6] Mehmet Sezgin and Bülent Sankur. Survey over image thresholding techniques and quan-titative performance evaluation. Journal of Electronic Imaging, 13(1)(January):146–165,January 2004.
[7] Azriel Rosenfeld and Pilar De La Torre. Histogram concavity analysis as an aid in thresh-old selection. IEEE Transactions on Systems, Man, and Cybernetics, SMC-13(2):231–235,March 1983. (cited in Sezgin, 2004).
[8] M. Ibrahim Sezan. A peak detection algorithm and its application to histogram-based imagedata reduction. Computer Vision, Graphics, and Image Processing, 49(1):36–51, January1990. (cited in Sezgin, 2004).
[9] Mark J. Carlotto. Histogram Analysis Using a Scale-Space Approach. IEEE Transactionson Pattern Analysis and Machine Intelligence, PAMI-9(1):121–129, January 1987. (cited inSezgin, 2004).
[10] N. Ramesh. Thresholding based on histogram approximation. IEE Proceedings - Vision,Image, and Signal Processing, 142(5):271, October 1995. (cited in Sezgin, 2004).
[11] T. W. Ridler and S. Calvard. Picture Thresholding Using an Iterative Selection Method.IEEE Transactions on Systems, Man, and Cybernetics, 8(8):630–632, 1978. (cited in Sezgin,2004).
[12] Nobuyuki Otsu. A Threshold Selection Method from Gray-Level Histograms. IEEE TRANS-ACTIONS ON SYSTREMS, MAN, AND CYBERNETICS, SMC-9(1):62–66, 1979.
[13] C.V Jawahar, P.K Biswas, and A.K Ray. Investigations on fuzzy thresholding based on fuzzyclustering. Pattern Recognition, 30(10):1605–1613, October 1997.
17
18 REFERENCES
[14] J.N. Kapur, P.K. Sahoo, and Andrew K.C. Wong. A new method for gray-level picturethresholding using the entropy of the histogram. Computer Vision, Graphics, and ImageProcessing, 29(3):273–285, March 1985. (cited in Sezgin, 2004).
[15] C.H. Li and C.K. Lee. Minimum cross entropy thresholding. Pattern Recognition,26(4):617–625, April 1993. (cited in Sezgin, 2004).
[16] A.G. Shanbhag. Utilization of Information Measure as a Means of Image Thresholding.CVGIP: Graphical Models and Image Processing, 56(5):414–419, September 1994. (citedin Sezgin, 2004).
[17] W H Tsai. Moment-preserving thresholding: a new approach. Graphical Models and ImageProcessing, 19:377 – 393, 1985. (cited in Sezgin, 2004).
[18] Lois Hertz and Ronald W. Schafer. Multilevel thresholding using edge matching. ComputerVision, Graphics, and Image Processing, 44(3):279–295, December 1988. (cited in Sezgin,2004).
[19] Sankar K Pal and Azriel Rosenfeld. Image enhancement and thresholding by optimizationof fuzzy compactness. Pattern Recognition Letters, 7(2):77–86, February 1988. (cited inSezgin, 2004).
[20] J. Bernsen. Dynamic Thresholding of Grey-Level Images. Proc. of the 8th Int. Conf. onPattern Recognition, 1986. (cited in Sezgin, 2004).
[21] W. Niblack. An introduction to digital image processing. Prentice-Hall, Englewood Cliffs,NJ, pages 115–116, 1986. (cited in Sezgin, 2004).
[22] J. Sauvola and M. Pietaksinen. Adaptive document image binarization. Pattern Recognition,33:225–236, 2000. (cited in Sezgin, 2004).
[23] Aly A. Farag and Edward J. Delp. Edge linking by sequential search. Pattern Recognition,28(5):611–633, 1995.
[24] Pablo Arbeláez, Michael Maire, Charless Fowlkes, and Jitendra Malik. Contour detectionand hierarchical image segmentation. IEEE transactions on pattern analysis and machineintelligence, 33(5):898–916, May 2011.
[25] D Marr and E Hildreth. Theory of edge detection. Proceedings of the Royal Society ofLondon, 207(1167):187–217, 1980.
[26] John Canny. A Computational Approach to Edge Detection. IEEE Transactions on PatternAnalysis and Machine Intelligence, PAMI-8(6):679–698, November 1986.
[27] Djemel Ziou and Salvatore Tabbone. Edge Detection Techniques - An Overview. PATTERNRECOGNITION AND IMAGE ANALYSIS C/C OF RASPOZNAVANIYE OBRAZOV I ANALIZIZOBRAZHENII, 8:537–559, 1998.
[28] R. M. Haralick. Ridges and Valley on Digital Images. Computer Vision, Graphics, andImage Processing1, (22):28–38, 1983. (cited in Ziou, 1998).
[29] G. Giraudon. Edge Detection from Local Negative Maximum of Second Derivative.Proceed- ings of IEEE, International Conference on Computer Vision and Pattern Recog-nition, pages 643–645, 1985. (cited in Ziou, 1998).
REFERENCES 19
[30] K. Rangarajan, M. Shah, and D. van Brackle. Optimal Corner Detector. In [1988 Proceed-ings] Second International Conference on Computer Vision, pages 90–94. IEEE.
[31] Rimon Elias and Robert Laganière. JUDOCA: junction detection operator based on circum-ferential anchors. IEEE transactions on image processing : a publication of the IEEE SignalProcessing Society, 21(4):2109–18, April 2012.
[32] Pedro F. Felzenszwalb and Daniel P. Huttenlocher. Efficient Graph-Based Image Segmenta-tion. International Journal of Computer Vision, 59(2):167–181, September 2004.
[33] D. Comaniciu and P. Meer. Mean shift: a robust approach toward feature space analysis.IEEE Transactions on Pattern Analysis and Machine Intelligence, 24(5):603–619, May 2002.
[34] J. Malik. Normalized cuts and image segmentation. IEEE Transactions on Pattern Analysisand Machine Intelligence, 22(8):888–905, 2000.
[35] Jitendra Malik, Serge Belongie, Thomas Leung, and Jianbo Shi. Contour and Texture Anal-ysis for Image Segmentation. International Journal of Computer Vision, 43(1):7–27, June2001.
[36] B. Schiele and J.L. Crowley. Probabilistic object recognition using multidimensional recep-tive field histograms. In Proceedings of 13th International Conference on Pattern Recogni-tion, volume 2, pages 50–54 vol.2. IEEE, 1996. (cited in Tuytelaars, 2007).
[37] C. Schmid and R. Mohr. Local grayvalue invariants for image retrieval. IEEE Transac-tions on Pattern Analysis and Machine Intelligence, 19(5):530–535, May 1997. (cited inTuytelaars, 2007).
[38] Robert M. Haralick. A Measure for Circularity of Digital Figures. IEEE Transactions onSystems, Man, and Cybernetics, SMC-4(4):394–396, July 1974.
[39] Gianfranco Doretto and Yi Yao. Region moments: Fast invariant descriptors for detectingsmall image structures. 2010 IEEE Computer Society Conference on Computer Vision andPattern Recognition, pages 3019–3026, June 2010.
[40] Ming-Kuei Hu. Visual pattern recognition by moment invariants. Information Theory, IRETransactions on, 8(2):179–187, February 1962. (cited in Doretto, 2010).
[41] Oncel Tuzel, Fatih Porikli, and Peter Meer. Region covariance: A fast descriptor for detectionand classification. Computer Vision–ECCV 2006, 2006.
[42] David G. Lowe. Distinctive Image Features from Scale-Invariant Keypoints. InternationalJournal of Computer Vision, 60(2):91–110, November 2004.
[43] Krystian Mikolajczyk and Cordelia Schmid. Performance evaluation of local descriptors.IEEE transactions on pattern analysis and machine intelligence, 27(10):1615–30, October2005.
[44] Y. Ke and R. Sukthankar. PCA-SIFT: A more distinctive representation for local imagedescriptors. Proceedings of the Conference on Computer Vision and Pattern Recognition,(20):511–517, 2004.
[45] Y Lapierre, D Rigal, J Adam, D Josef, F Meyer, S Greber, and C Drot. The gel test: anew way to detect red cell antigen-antibody reactions. Transfusion, 30(2):109–13, February1990.