INSTITUTO SUPERIOR DE ENGENHARIA DE LISBOA§ão.pdf · Production of Surfactants from Bio-Materials...
98
INSTITUTO SUPERIOR DE ENGENHARIA DE LISBOA Departamento de Engenharia Química ISEL Production of Surfactants from Bio-Materials TIAGO GONÇALVES DA FONSECA (Licenciado) Trabalho Final de Mestrado para obtenção do grau de Mestre em Engenharia Química Orientadores: Prof. Doutor João Fernando Pereira Gomes Prof. Doutor João Moura Bordado Júri: Presidente: Prof. Doutor João Fernando Pereira Gomes Vogais: Prof. Doutor João Moura Bordado Prof. Doutor José Virgílio Prata Prof. Doutor António Jorge Velez Marques Prof. Doutor António Gonçalves da Silva Dezembro de 2009
Transcript of INSTITUTO SUPERIOR DE ENGENHARIA DE LISBOA§ão.pdf · Production of Surfactants from Bio-Materials...
INSTITUTO SUPERIOR DE ENGENHARIA DE LISBOA
Departamento de Engenharia Química
ISEL
Production of Surfactants from Bio-Materials
TIAGO GONÇALVES DA FONSECA (Licenciado)
Trabalho Final de Mestrado para obtenção do grau de Mestre em Engenharia Química
Orientadores: Prof. Doutor João Fernando Pereira Gomes Prof. Doutor João Moura Bordado
Júri: Presidente: Prof. Doutor João Fernando Pereira Gomes Vogais:
Prof. Doutor João Moura Bordado Prof. Doutor José Virgílio Prata Prof. Doutor António Jorge Velez Marques Prof. Doutor António Gonçalves da Silva
Dezembro de 2009

Production of Surfactants from Bio-Materials
2
This page was intentionally left in blank
Production of Surfactants from Bio-Materials
3
Acknowledgements
“From error to error one discovers the entire truth.” Sigmund Freud
Austrian psychologist (1856 - 1939)
As all pathways through science shows, all development comes in a
sequence of experience and error and sometimes great discoveries rise from
chance and accident. “Step by step, even the smallest creature can change the
course of the world.” (J.R.R.Tolkien, Fellowship of the Ring)
First, I want to thank to my leaders, Prof. João Gomes (ISEL) and Prof.
João Bordado (ICTPOL) for all their support, guidance, motivation, and for all
their availability. Yet, to Prof. João Bordado I want still to thank the opportunity
that he gave to me to perform this stage in ICTPOL within the European Project,
BIOPRODUCTION, which allowed me to acquire the knowledge and experience I
needed.
I want to thank to all my colleagues from ICTPOL for all their support and
friendship, especially to Inês Raposeiro and Sandro Matos for the guidance and
wise advice during the experimental work.
To the colleagues Rui Galhano and Susete Fernandes from FCUL and
IST, respectively, I want to thank for the sharing of knowledge and practical
guidelines and genuine involvement, particularly in the NMR analysis.
To my colleague Pedro Felizardo I want to thank the FAME samples of
rapeseed oil kindly shared and his support and practical guidelines for the
production of FAME from coconut oil.
A very special thank for my Companion, Joana Gonçalinho, who followed,
supported and guided me from the very first beginning with her warmth and
unconditional love and even for her contribution as illustrator and text reviewer in
the present work.
To my family I want to thank the special support, comprehension and
motivation that were of most importance to develop myself and that allowed me
to embrace the life-time opportunities that came into me and that I created.
Production of Surfactants from Bio-Materials
4
Index
Acknowledgements ............................................................................................... 3
Index ..................................................................................................................... 4
List of Abbreviations and Symbols ........................................................................ 7
List of Figures ........................................................................................................ 9
List of Tables ....................................................................................................... 12
Abstract ............................................................................................................... 14
Resumo ............................................................................................................... 15
I – Introduction .................................................................................................. 16
1 – Scope ........................................................................................................ 16
2 – Objectives .................................................................................................. 17
3 – Organization of the Dissertation Document ............................................... 18
II – Synthesis of Sugar Fatty Acid Esters ........................................................ 19
1 – Introduction ................................................................................................ 19
1.1 – Sugar Fatty Acid Esters ....................................................................... 19
1.1.1 – Synthesis of SFAE .................................................................... 20
1.1.2 – Market Overview ........................................................................... 26
1.2 - Surface Active Materials ...................................................................... 26
1.2.1 – Classification of Surface Active Materials ..................................... 28
1.2.2 – Surfactant in the Environment ...................................................... 34
1.2.3 – Technological Future .................................................................... 35
1.3 – Surfactants in Emulsion Formation and Stabilization .......................... 36
1.3.1 – Thermodynamics of Emulsion Formation and Breakdown ............ 37
1.3.2 – Mechanism of Emulsification ........................................................ 38
1.3.3 – Surfactants in Emulsification ......................................................... 39
1.3.4 – Hydrophilic-Lipophilic Balance ...................................................... 40
Production of Surfactants from Bio-Materials
5
1.3.5 – Relative Solubility number ............................................................ 42
2 – Experimental ............................................................................................. 44
2.1 – Synthesis of SFAE .............................................................................. 44
2.1.1 – Raw Materials ............................................................................... 44
2.1.2 – Experimental Apparatus ............................................................... 46
2.1.3 – Reaction Design Plan ................................................................... 47
2.2 – Characterization of SFAE ................................................................... 48
2.2.1 – FTIR ............................................................................................. 48
2.2.2 NMR ............................................................................................. 49
2.2.3 – Emulsification: Preliminary Tests .................................................. 49
2.3 – Optimization of the Production Process .............................................. 50
3 – Results and Discussion ............................................................................. 51
3.1 – Characterization of Raw-Materials ...................................................... 51
3.1.1 – Sucrose ........................................................................................ 51
3.1.2 – Glucose ........................................................................................ 51
3.1.3 – Molasses ...................................................................................... 52
3.1.4 – Acetic Anhydride .......................................................................... 52
3.1.5 – FAME ........................................................................................... 52
3.1.6 – Lauric Acid ................................................................................... 53
3.2 – Characterization of SFAE ................................................................... 53
3.2.1 – FTIR ............................................................................................. 53
3.2.2 – NMR ............................................................................................. 57
3.2.3 – HLB Number ................................................................................ 58
3.2.4 – Emulsification: Preliminary Tests .................................................. 62
3.2.5 – Preliminary Tests by some of the BIOPRODUCTION Partners ... 64
3.3 – Synthesis of the SFAE ........................................................................ 64
III – Synthesis of Functionalized Methacrylates (Preliminary Tests) ............ 68
1 – Introduction ................................................................................................ 68
1.1 – Methacrylic Ester Polymers ................................................................ 68
1.1.1 – Production .................................................................................... 68
1.1.2 – Properties ..................................................................................... 69
1.2 Free-Radical Initiators ........................................................................ 70
Production of Surfactants from Bio-Materials
6
1.2.1 – Formation and Use ....................................................................... 71
1.2.2 – Activation Parameters ................................................................... 72
1.2.3 – Organic Peroxides ........................................................................ 73
1.3 – Coating ................................................................................................ 73
2 – Experimental .............................................................................................. 74
2.1 – Synthesis of the Functionalized Methacrylates ................................... 74
2.1.1 – Raw-Materials ............................................................................... 74
2.1.2 – Experimental Apparatus ............................................................... 76
2.1.3 – Reaction Design ........................................................................... 76
2.2 – Curing of Functionalized MMA ............................................................ 77
3 – Results and Discussion ............................................................................. 78
3.1 – Characterization of Functionalized Methacrylates ............................... 78
IV - Conclusions and Future Trends ................................................................ 81
References .......................................................................................................... 84
Appendix ............................................................................................................. 89
Appendix I – FAME production process ........................................................... 90
Appendix II – FTIR spectra of the raw-materials .............................................. 91
Appendix III – NMR spectras of mono-dodecanoylglucose ............................. 94
Appendix IV – Results obtained from Ciba ...................................................... 97
Production of Surfactants from Bio-Materials
7
List of Abbreviations and Symbols
A
Specific surface area
A3
Frequency Factor
BDE
Bond Dissociation Energy
COSY
Correlation Spectroscopy
CPB
Companhia Petroquímica do Barreiro
d
Average diameter of particules
DABCO
1,4-diazabicyclo[2.2.2]octane
DAI
Sociedade de Desenvolvimento Agro-Industrial, S.A.
DE
Degree of Esterification
DEAD
Diethyl Azodicarboxylate
DMA
N,N - Dimethylaniline
DMA
Dynamic Mechanical Analysis
DMAP
N,N - Dimethylaminopyridine
DMF
Dimethyl formamide
DMP
Dimethyl pyrolidone
DMSO
Dimethyl sulphoxide
DSC
Differential Scanning Calorimetry
Ea
Activation Energy
EGDE
Ethylene glycol dimethyl ether
EO
Ethylene Oxide
EU
European Union
FAE
Fatty Acid Ester
FAME
Fatty Acid Methyl Esters
FCUL
Faculdade de Ciências da Universidade de Lisboa
FTIR
Fourier Transform Infrared Spectroscopy
GFAE
Glucose Fatty Acid Esters
HLB
Hydrophilic Lipophilic Balance
HMBC
Heteronuclear Multiple Bond Correlation
HPLC
High Pressure Liquid Chromatography
HSQC
Heteronuclear Single Quantum Correlation
ICTPOL
Instituto de Ciência e Tecnologia de Polímeros
Production of Surfactants from Bio-Materials
8
INETI
Instituto Nacional de Engenharia, Tecnologia e Inovação
IP
Integrated Project
ISEL
Instituto Superior de Engenharia de Lisboa
IST
Instituto Superior Técnico
k
Kinetic constant for the transesterification
Kc
Equilibrium constant for the transesterification
MEKP
Methyl Ethyl Ketone Peroxide
MMA
Methyl methacrylate
mmHg
Millimiters of mercury (Unit of pressure)
NMR
Nuclear Magnetic Resonance
P&G
Procter & Gamble Company
PEG
Polyethylene Glycol
pH
Cologarithm of the activity of dissolved hydrogen ions
PMMA
Poly(methyl methacrylate)
PO
Propylene Oxide
PPG
Polypropylene Glycol
ppm
part per million
PTC
Phase transfer catalysis
rpm
rotation per minute
RSN
Relative Solubility Number
SFAE
Sugar Fatty Acid Esters
SME
Small and Medium Enterprises
T
Absolute Temperature
Tg
Glass-transition temperature
TLC
Thin Layer Chromatography
TMMA
Transesterified Methyl Methacrylate
TPP
Triphenylphosphine
UNL
Universidade Nova de Lisboa
γ
Interfacial tension
Production of Surfactants from Bio-Materials
9
List of Figures
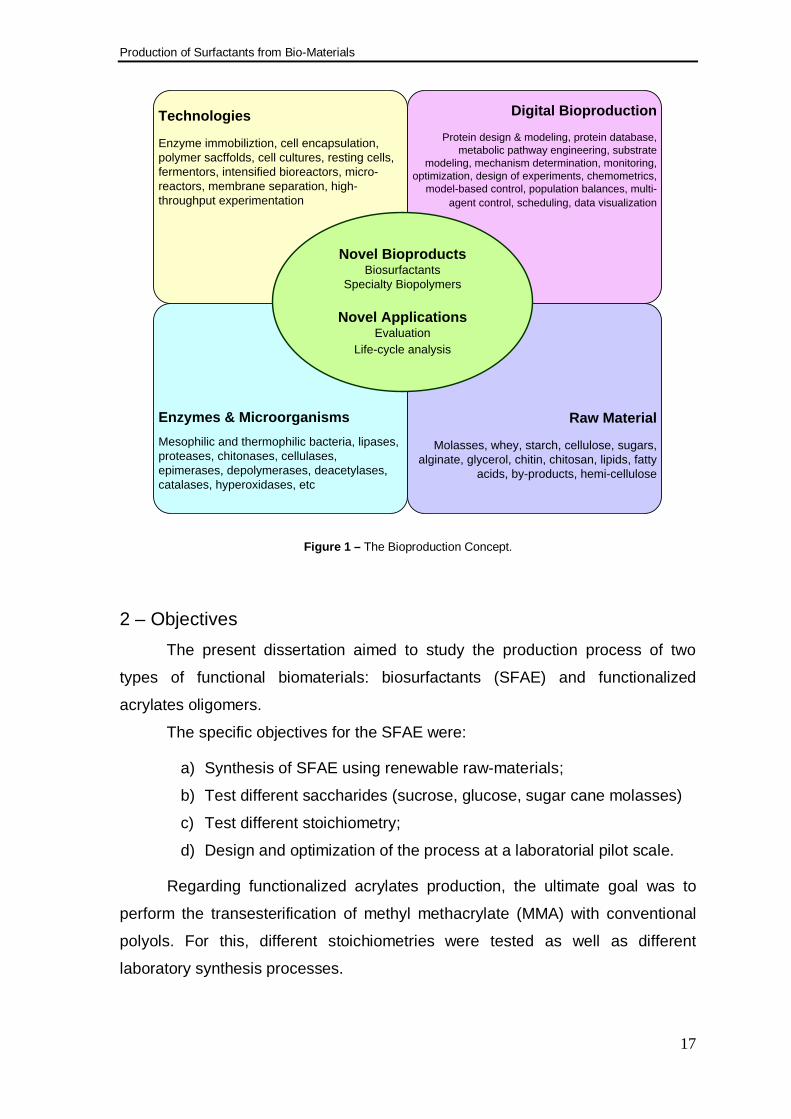
Figure 1 – The Bioproduction Concept. .................................................................... 17
Figure 2 – Molecular structure of a SFAE, in particular a di-ester. ........................ 19
Figure 3 - Common structural representation of sucrose. ...................................... 20
Figure 4 – Mutarotation of D-glucose: A) α-D-glucose; B) Fischer projection D-
glucose; C) β-D-glucose. ........................................................................................... 20
Figure 5 - FAME Production: transesterification reaction. ...................................... 21
Figure 6 - Example of an esterification reaction: Formation of ethyl acetate. ....... 22
Figure 7 - General transesterification reaction. ....................................................... 22
Figure 8 – Typical surface active material structure, showing hydrophilic and
hydrophobic portions. ................................................................................................. 27
Figure 9 – The preferential orientation of high HLB surfactant molecules. ........... 27
Figure 10 - Orientation of hydrophobic chains and hydrophilic heads. ................. 28
Figure 11 – Schematic of the various processes occurring during the emulsion
formation: a) break up of droplet; b) adsorption of surfactants; c) droplets collision
which lead to coalescence; d) droplets collision with no coalescence. Drops are
represented by thin lines and the surfactants by heavy lines and dots. ................ 38
Figure 12 - Experimental apparatus for the synthesis of SFAE. ............................ 46
Figure 13 – Schematic of emulsification test, pointing the formation and the
breakdown steps. ........................................................................................................ 49
Figure 14 - FTIR spectra of SFAE from sucrose and FAME (4 FAME : 1 sucrose)
using ATR method. ..................................................................................................... 54
Figure 15 - FTIR spectra of SFAE from molasses and FAME (4 FAME : 1 sugar)
using ATR method. ..................................................................................................... 55
Production of Surfactants from Bio-Materials
10
Figure 16 - FTIR spectra of SFAE from molasses and FAME (1 FAME : 1 sugar)
using ATR method. ......................................................................................................55
Figure 17 - FTIR spectra of SFAE from glucose and lauric acid (1 lauric acid : 1
glucose) using ATR method. ......................................................................................56
Figure 18 - W/O and O/W emulsions using SFAE from sucrose and rapeseed
FAME, with a DE of 3. .................................................................................................63
Figure 19 - W/O and O/W emulsions using SFAE from glucose and lauric acid,
with a DE of 1. .............................................................................................................63
Figure 20 - First step: octa-acetylation of the sucrose. ............................................66
Figure 21 - Second step: transesterification of the octa-acetyl sucrose with FAME
(R indicates an alkyl group). .......................................................................................66
Figure 22 - Molecular structure of a methacrylic ester. R represents a side-chain
group. ............................................................................................................................68
Figure 23 – Initiator decomposition with the formation of two radicals. .................73
Figure 24 - Schematic of the transesterification reaction from MMA with a
conventional polyol. .....................................................................................................76
Figure 25 - Transesterification reaction of vegetable oil with methanol. ................90
Figure 26 - FTIR specta of sucrose using ATR method. .........................................91
Figure 27 - FTIR spectra of glucose using ATR method. ........................................91
Figure 28 - FTIR spectra of sugar cane molasses using ATR method. .................92
Figure 29 - FTIR spectra of acetic anhydride using ATR method. .........................92
Figure 30 - FTIR spectra of FAME from rapeseed using ATR method. .................93
Figure 31 - FTIR spectra of lauric acid using ATR method. ....................................93
Figure 32 – 1H-NMR shift (δ) data for GFAE, from 0,45 to 2,85 ppm. ...................94
Figure 33 - 1H-NMR shift (δ) data for GFAE, from 3,9 to 6,3 ppm. ........................94
Figure 34 – 13C-NMR shift (δ) data for GFAE, from 10 to 95 ppm. ........................95
Production of Surfactants from Bio-Materials
11
Figure 35 - 13C-NMR shift (δ) data for GFAE, from 110 to 180 ppm. .................... 95
Figure 36 – 2D-NMR COSY shift (δ) data for GFAE. .............................................. 96
Figure 37 - 2D-NMR HSQC shift (δ) data for GFAE. .............................................. 96
Figure 38 – Comparison between standard preparation (cypermethrin) and
SFAE, where the dark track represents SFAE and the red track represents the
standard preparation. ................................................................................................. 97
Figure 39 – Particle size graph for SFAE, in oil phase, after 2 weeks in ambient
storage. ........................................................................................................................ 97
Figure 40 - Particle size graph for SFAE, in oil phase, after 2 weeks storage at 4
ºC. ................................................................................................................................ 98
Figure 41 - Particle size graph for SFAE, in oil phase, after 2 weeks storage at 54
ºC. ................................................................................................................................ 98
Production of Surfactants from Bio-Materials
12
List of Tables
Table 1 - Compositions of coconut oil and rapeseed oil. .........................................21
Table 2 - Classification of emulsion types. ................................................................36
Table 3 – Surfactant HLB and their applications. .....................................................40
Table 4 - Hydrophilic group numbers for Davies method. .......................................41
Table 5 - Lipophilic group numbers for Davies method. ..........................................41
Table 6 - Lanthanide triflates tested and their properties ........................................46
Table 7 – Values of group contribution for the Davies method used in the
calculation of the SFAE HLB. .....................................................................................58
Table 8 – Lipophilic components contribution for the SFAE from the coconut
FAME, for different DE ................................................................................................58
Table 9 - Lipophilic components contribution for the SFAE from the rapeseed
FAME, for different DE. ...............................................................................................58
Table 10 - HLB values determined for SFAE from sucrose and FAME in different
esterification degrees. .................................................................................................59
Table 11 – Possible applications for the examples of Sucrose Fatty Acid Esters.
......................................................................................................................................60
Table 12 - Lipophilic components contribution for the Glucose mono-FAE, for
rapeseed and coconut FAME. ....................................................................................60
Table 13 - HLB values for Glucose mono-FAE, for rapeseed and coconut FAME.
......................................................................................................................................60
Table 14 – Comparative HLB results for Sucrose and Glucose mono-FAE from
rapeseed and coconut FAME. ....................................................................................61
Table 15 - Emulsification behavior of the synthesized SFAE; variation with the
stoichiometry. ...............................................................................................................62
Production of Surfactants from Bio-Materials
13
Table 16 - Some properties of the polyols tested in this work (Soditas). .............. 75
Table 17 - Gel time results of MMA, varying the amount of DMA, at 40.9 ºC. ..... 78
Table 18 - Reticulation results of MMA with linseed oil, varying their proportions,
at 60 ºC. ....................................................................................................................... 79
Table 19 – Gel time results for the polymerization of TMMA and the effect of
rubber. .......................................................................................................................... 79
Production of Surfactants from Bio-Materials
14
Abstract
This Dissertation work was performed in the context of a European project,
BIOPRODUCTION, and aimed to study the development of the production
process of two types of functional biomaterials: sugar fatty acid esters (SFAE)
and functionalized methacrylates.
Synthesis at laboratorial scale of SFAE was carried out using as raw-
materials different saccharides, namely sucrose, glucose and sugar cane
molasses (polysaccharides mixture), and fatty acid methyl esters (FAME) from
vegetable oils, such as rapeseed and coconut. This synthesis includes two steps:
acetylation of sugars with acetic anhydride, and transesterification of acetylated
sugar with FAME, using lanthanide triflates as catalyst.
Different stoichiometries were tested, as well as different processes in
order to avoid sugar degradation. Emulsification preliminary tests were
performed, as well the empirical calculation of respective HLB. The product
characterization by FTIR an NMR was also performed, as well as the iterative
optimization of the synthesis process.
The modification of methyl methacrylate (MMA), at a laboratorial scale,
was carried out by their transesterification with conventional polyols, in order to
produce larger molecular weight methacrylates. The product was crosslinked with
different curing systems for subsequent application in rubber coatings.
Finally, additional characterization studies will be necessary for both
products, namely surface tension for biosurfactantes and mechanical properties
for modified MMA polymers.
Key words: biomaterials, biosurfactants, SFAE, modified MMA
Production of Surfactants from Bio-Materials
15
Resumo
Este trabalho foi desenvolvido no âmbito de um projecto europeu,
BIOPRODUCTION, tendo em vista o desenvolvimento de dois tipos de
biomaterias funcionais: ésteres de açúcares com ácidos gordos (SFAE) e
metacrilatos funcionais.
A síntese laboratorial do biosurfactante SFAE foi efectuada utilizando
como matérias-primas diferentes sacáridos, nomeadamente sacarose, glucose e
melaço de cana-de-açúcar (mistura de polissacáridos), e ésteres metílicos de
ácidos gordos (FAME) de óleos vegetais, tais como colza e coco. Esta síntese é
constituída por dois passos: acilação dos açúcares com anidrido acético, e
transesterificação do açúcar acilado com FAME, utilizando triflatos de
lantanídeos como catalisador.
Diferentes estequiometrias foram testadas, bem como diferentes
processos de modo a evitar a degradação dos açúcares. Foram efectuados
testes preliminares de emulsão e calculou-se, empiricamente, o respectivo HLB.
Procedeu-se à caracterização do produto através de FTIR e RMN e também à
optimização iterativa do processo de síntese.
A modificação, à escala laboratorial, de metacrilatos de metilo (MMA)
realizou-se recorrendo à sua transesterificação com polióis convencionais.
Efectuaram-se testes de reticulação do produto com diferentes catalisadores e
iniciadores para posterior aplicação em revestimentos de borracha.
Por fim, para ambos os produtos serão necessários estudos adicionais de
caracterização, nomeadamente tensão superficial para os biosurfactantes e
propriedades mecânicas para polímeros modificados com MMA.
Palavras-chave: biomaterias, biosurfactante, SFAE, MMA modificado
Production of Surfactants from Bio-Materials
16
I – Introduction
1 – Scope The work presented in this dissertation was performed under a trainee
program offered by Instituto de Ciências e Tecnologia de Polímeros (ICTPOL)
within the context of a European Project, named Sustainable, Microbial and
Biocatalytic Production of Advanced Functional Materials (BIOPRODUCTION).
This project comprises seven SME’s (Small and Medium Enterprises), four
large companies, six research centers and six university departments, and also
integrates scientific activities and complementary skills from fourteen EU-
countries, being partly supported by the European Commission.
The aim of the integrated project is the development of novel sustainable
biological processes of functional biopolymers and biosurfactants, made from
renewable sources. With this purpose, the scientific and technical objectives,
summarized in Figure 1, include the development of:
• Novel biocatalysts – exploration of microorganisms and/or enzymes in
order to obtain low-cost production;
• Metabolic pathway engineering of multiple reactions;
• Innovative downstream processing operation for the recovery of
bioproducts;
• Digital bioproduction and bioprocessing – application of advanced
modeling, monitoring and control methods to bioprocesses.
The synthesis of sugar fatty acid esters (SFAE) is a small part of ICTPOL
work task, embraced by the Research & Technological Development (RTD)
Activity of Advanced Functional Biomaterials (WP5). ICTPOL contribution on this
project includes the collaboration of IST, UNL and INETI. Moreover, ICTPOL
collaboration with CPB includes the scale-up of novel polymers to an industrial
scale.
It is also important to mention the cooperation of other partners in the work
performed by ICTPOL, as they kindly provide samples, share knowledge and
characterize and test products.
Production of Surfactants from Bio-Materials
17
Novel BioproductsBiosurfactants
Specialty Biopolymers
Novel ApplicationsEvaluation
Life-cycle analysis
Technologies
Enzyme immobiliztion, cell encapsulation, polymer sacffolds, cell cultures, resting cells, fermentors, intensified bioreactors, micro-reactors, membrane separation, high-throughput experimentation
Enzymes & MicroorganismsMesophilic and thermophilic bacteria, lipases, proteases, chitonases, cellulases, epimerases, depolymerases, deacetylases, catalases, hyperoxidases, etc
Raw Material
Molasses, whey, starch, cellulose, sugars, alginate, glycerol, chitin, chitosan, lipids, fatty
acids, by-products, hemi-cellulose
Digital Bioproduction
Protein design & modeling, protein database, metabolic pathway engineering, substrate
modeling, mechanism determination, monitoring, optimization, design of experiments, chemometrics,
model-based control, population balances, multi-agent control, scheduling, data visualization
Figure 1 – The Bioproduction Concept.
2 – Objectives The present dissertation aimed to study the production process of two
types of functional biomaterials: biosurfactants (SFAE) and functionalized
acrylates oligomers.
The specific objectives for the SFAE were:
a) Synthesis of SFAE using renewable raw-materials;
b) Test different saccharides (sucrose, glucose, sugar cane molasses)
c) Test different stoichiometry;
d) Design and optimization of the process at a laboratorial pilot scale.
Regarding functionalized acrylates production, the ultimate goal was to
perform the transesterification of methyl methacrylate (MMA) with conventional
polyols. For this, different stoichiometries were tested as well as different
laboratory synthesis processes.
Production of Surfactants from Bio-Materials
18
3 – Organization of the Dissertation Document This dissertation is organized in four parts. The first part presents a brief
scope and aim of this Master’s dissertation within the BIOPRODUCTION project.
Chapter II presents the description of the work performed in the synthesis
of SFAE.
Chapter III compiles the preliminary study of functionalized acrylates.
Although, chapter II and chapter III deal with different type of products, I
both cases the essential key aspect is that the transesterification has to be
performed at rather low temperature, in the case of SFAE to avoid thermal
degradation of the sugar molecule, and in the case of acrylic oligomers to avoid
the premature reaction of the double bound.
Finally, conclusions and future trends are presented at Chapter IV.
Production of Surfactants from Bio-Materials
19
II – Synthesis of Sugar Fatty Acid Esters
1 – Introduction
1.1 – Sugar Fatty Acid Esters
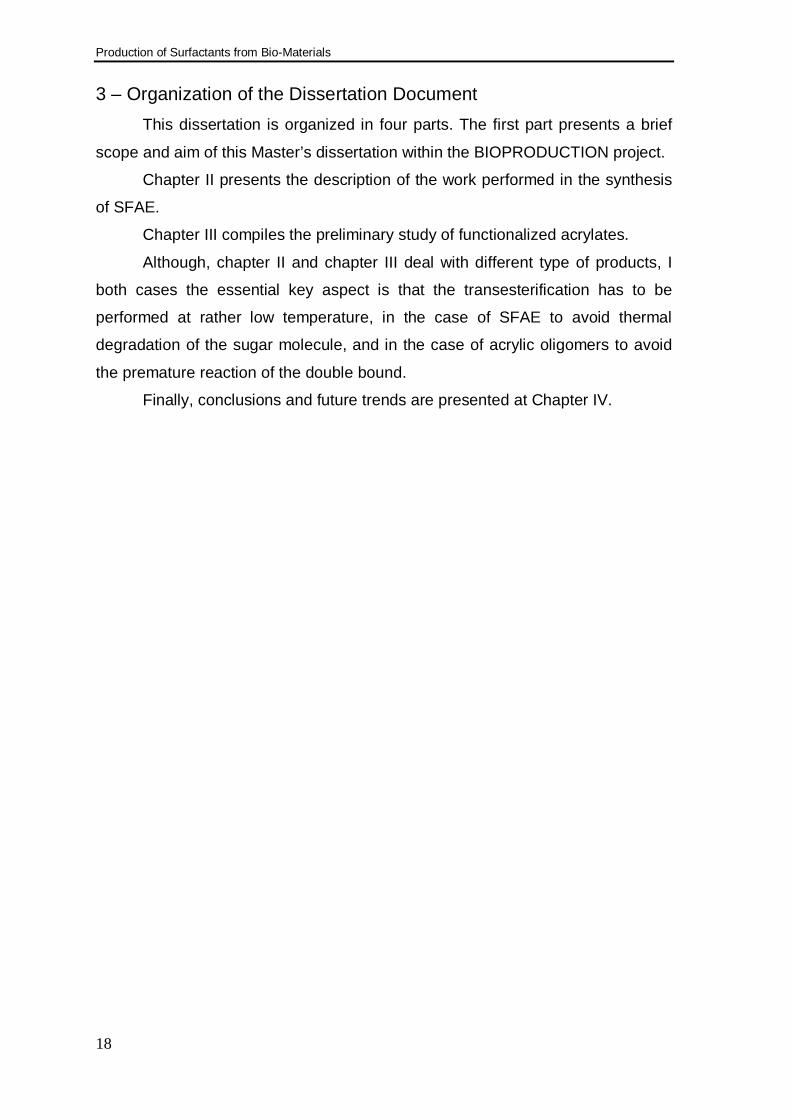
Sugar Fatty Acid Esters – SFAE (Figure 2) are non-ionic surface active
materials (surfactants) obtained from renewable resources and are an alternative
of petrochemical-based surfactants. Sucrose esters are defined in Directive
98/86/EC as the mono-, di- and tri-esters of sucrose with fatty acids occurring in
food fats and oils (Commission 1998).
OH
OH
OO
OHO
OH
OH
O
O
OH
R
O
R
O
Figure 2 – Molecular structure of a SFAE, in particular a di-ester.
These surfactants are biodegradable, non-toxic and non-allergenic
(Devulapalle, Gómez de Segura et al. 2004; Becerra, Toro et al. 2008), and their
properties may be adjusted by controlling the degree of esterification and the
nature of fatty acid and sugar (Devulapalle, Gómez de Segura et al. 2004).
SFAE can be applied in several areas, such as pharmaceuticals, cosmetic,
health care, food and detergent industries (Devulapalle, Gómez de Segura et al.
2004; Sabeder, Habulin et al. 2006; Csóka, Marton et al. 2007; Becerra, Toro et
al. 2008). They can be used as emulsifiers and foaming agents in various
products, such as, bread, ice-cream, cakes, sauces, margarine, fat substitutes
and dairy-based drinks (Husband, Sarney et al. 1998; Scotter, Castle et al. 2006),
they are also used as solubilizing agents, lubricants, penetrating enhancers
Sucrose esters have been found in plants, such as wild tomato and wild
potato species. Thus, they have been associated to aphid resistance and
presenting antifungal properties (Chortyk, Pomonis et al. 1996).
Production of Surfactants from Bio-Materials
20
1.1.1 – Synthesis of SFAE
SFAE are synthesized by esterification using carbohydrates and fatty acids
as raw materials. In this reaction, the challenge is to attach a carbohydrate
molecule to a fat and oil derivative (Hill and Rhode 1999), due to their different
natures and non-miscibility, as carbohydrates are hydrophilic and fats are
hydrophobic.
The carbohydrates tested in this work were sucrose and glucose, which
are amongst the cheapest and more abundant carbohydrates.
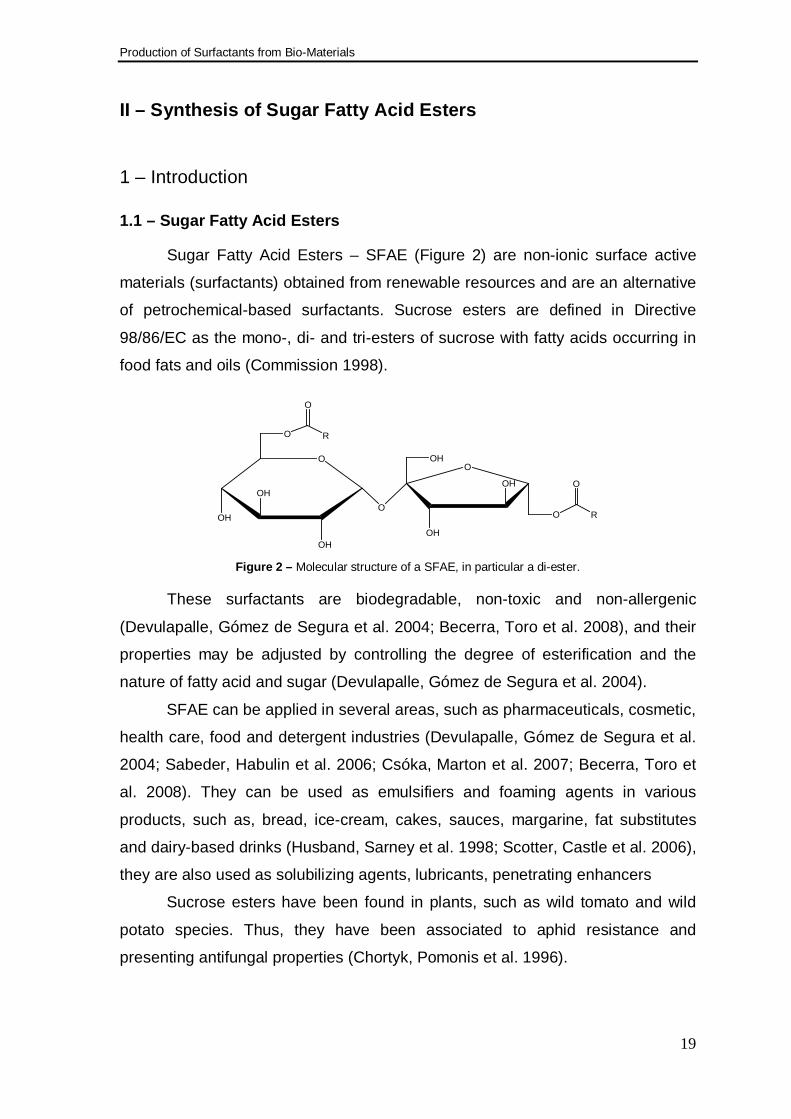
Sucrose (Figure 3) is a non-reducing disaccharide and its components, D-
glucose and D-fructose, are glycosidically linked through their anomeric carbon
atoms (Lichtenthaler and Peters 2004; Queneau, Fitremann et al. 2004). Thus,
constitutes a β-D-fructofuranosyl α- D-glucopyranoside (Lichtenthaler and Peters
2004). Sucrose is the most abundant pure organic molecule produced at the
industrial scale, over 125 Mt per year (Lichtenthaler and Peters 2004; Queneau,
Fitremann et al. 2004).
OH
OH
OO
OH O
OH
OH
OH
OH
OH
6
5
1
23
4
1'
2'
3' 4'
5'
6'
Figure 3 - Common structural representation of sucrose.
D-glucose is an aldohexose and the most abundant monosaccharide. This
compound presents different properties, according to its molecular structure.
Thus, these different properties due to the mutarotation of this monosaccharide,
which reaches an equilibrium between the open chain structure (Figure 4, B) with
the two cyclic structures (Figure 4, A and C) (Solomons 2002).
CHO
OHH
HHO
OHH
OHH
CH2OH
A
OO
C
OHOH
HOHO
HOHO
OHOH
OH
OH
B Figure 4 – Mutarotation of D-glucose: A) α-D-glucose; B) Fischer projection D-glucose; C) β-D-glucose.
Production of Surfactants from Bio-Materials
21
These two cyclic structures, designated hemiacetals, are the result of an
intramolecular reaction between the hydroxyl group in the carbon five (C5) with
aldehyde group (C1). Moreover, the hemiacetal carbon atom is called the
anomeric carbon, and the two cyclic structures are diastereomers, only differing
in the C1 configuration (Solomons 2002).
The hydrophobic reactants tested in this work were fatty acid methyl esters
(FAME), also known as biodiesel, from rapeseed oil or coconut oil. FAME, as
such natural oils, are low cost raw materials and easily available with standard
quality.
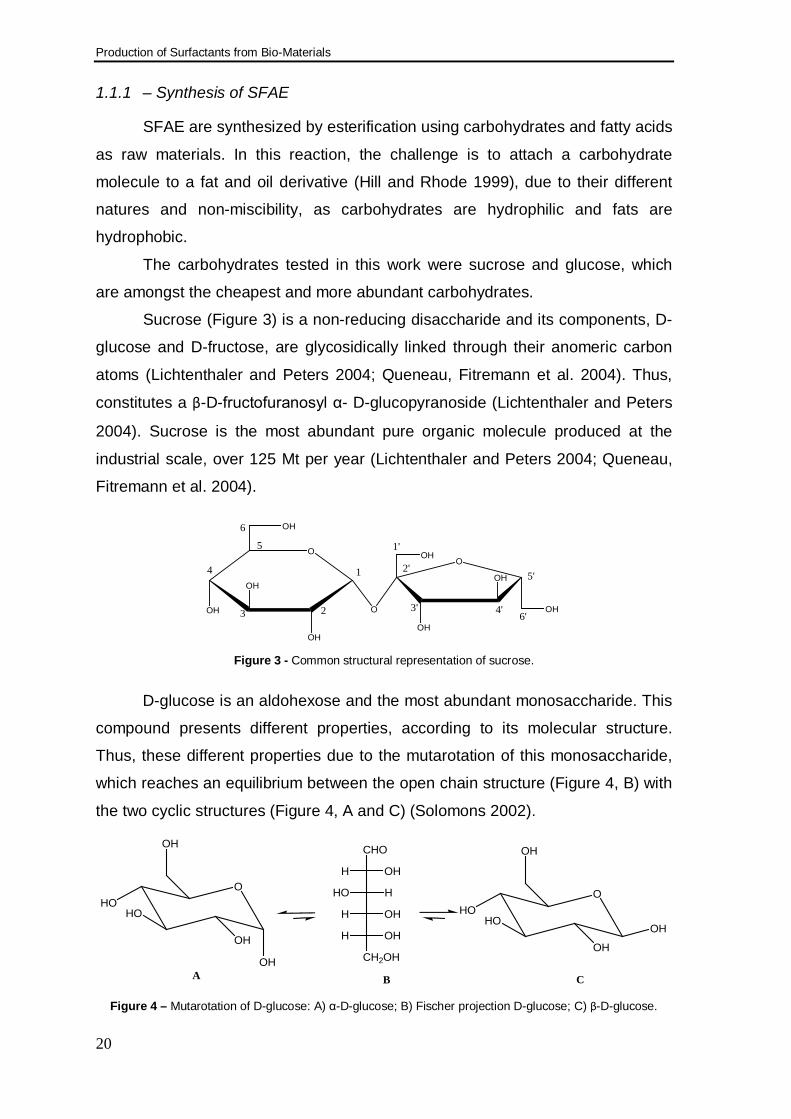
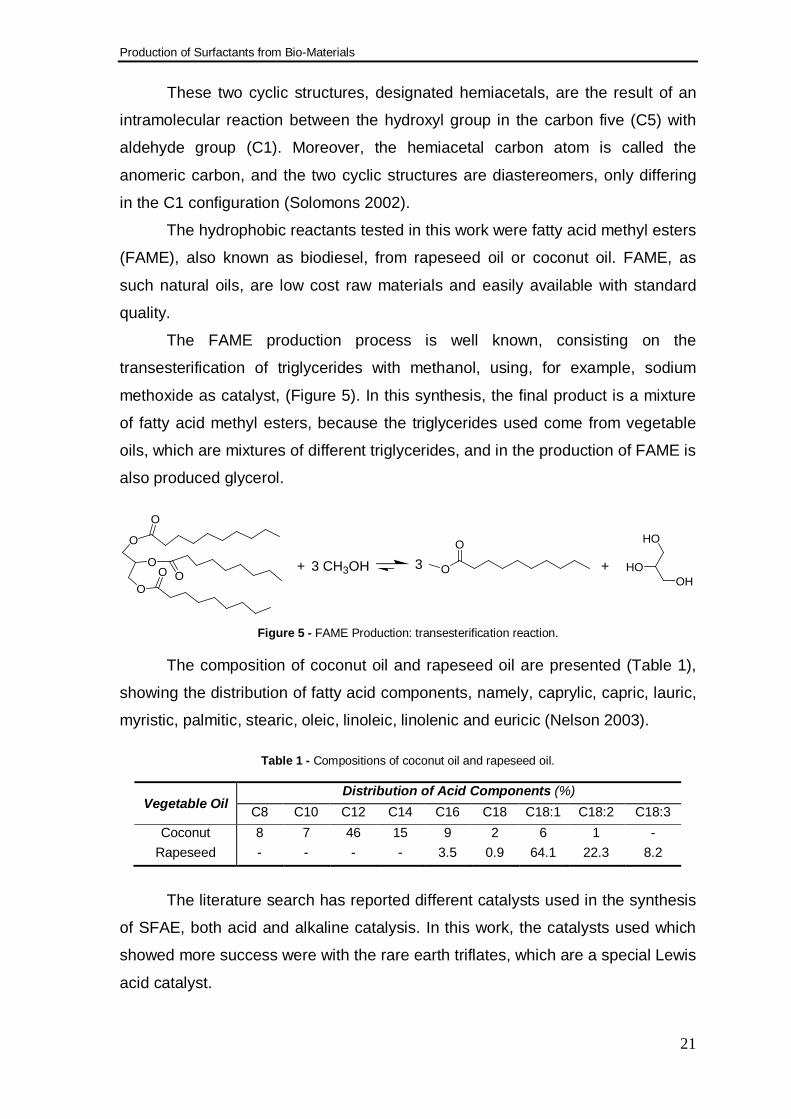
The FAME production process is well known, consisting on the
transesterification of triglycerides with methanol, using, for example, sodium
methoxide as catalyst, (Figure 5). In this synthesis, the final product is a mixture
of fatty acid methyl esters, because the triglycerides used come from vegetable
oils, which are mixtures of different triglycerides, and in the production of FAME is
also produced glycerol.
O
O
OO
O
O + 3 CH3OHO
O3
HO
HOOH
+
Figure 5 - FAME Production: transesterification reaction.
The composition of coconut oil and rapeseed oil are presented (Table 1),
showing the distribution of fatty acid components, namely, caprylic, capric, lauric,
myristic, palmitic, stearic, oleic, linoleic, linolenic and euricic (Nelson 2003).
Table 1 - Compositions of coconut oil and rapeseed oil.
Vegetable Oil Distribution of Acid Components (%)
C8 C10 C12 C14 C16 C18 C18:1 C18:2 C18:3 Coconut 8 7 46 15 9 2 6 1 -
Rapeseed - - - - 3.5 0.9 64.1 22.3 8.2
The literature search has reported different catalysts used in the synthesis
of SFAE, both acid and alkaline catalysis. In this work, the catalysts used which
showed more success were with the rare earth triflates, which are a special Lewis
acid catalyst.
Production of Surfactants from Bio-Materials
22
Recently, rare earth triflates, Ln(OTf)3, were found to be stable in water
and work efficiently as Lewis acid catalyst (Kobayashi and Hachiya 1995).
Moreover, these catalysts could be almost completely recovered after the
reaction and reused without loss of activity (Kobayashi and Manabe 2000;
Fortuna, Musumarra et al. 2006).
Lanthanide trifluoromethanesulfonates (triflates) act as stronger Lewis
acids because of the electrowithdrawing capacity of the
trifluoromethanesulfonates anion (Fortuna, Musumarra et al. 2006) and to have
strong affinity to carbonyl oxygens (Kobayashi and Hachiya 1994). These
catalysts are soluble in water and also in many organic solvents and exhibit low
toxicity (Fortuna, Musumarra et al. 2006).
1.1.1.1 – Reactions
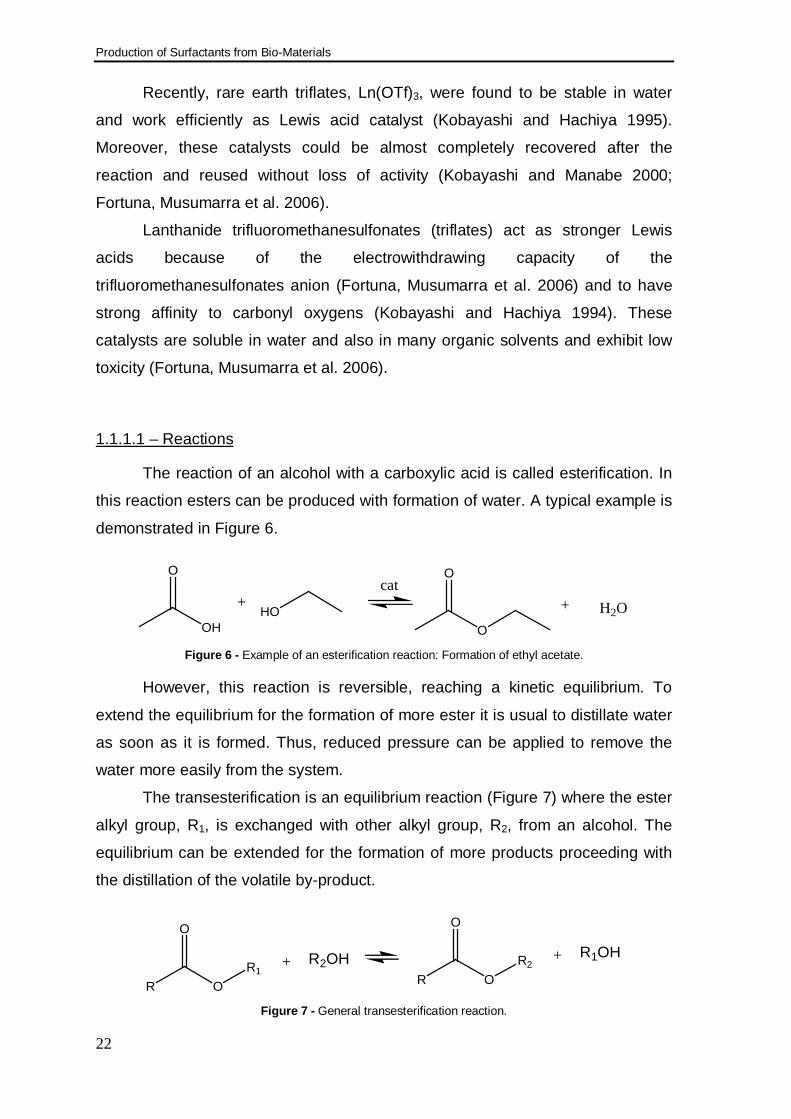
The reaction of an alcohol with a carboxylic acid is called esterification. In
this reaction esters can be produced with formation of water. A typical example is
demonstrated in Figure 6.
OH
O
HO+ + H2O
O
Ocat
Figure 6 - Example of an esterification reaction: Formation of ethyl acetate.
However, this reaction is reversible, reaching a kinetic equilibrium. To
extend the equilibrium for the formation of more ester it is usual to distillate water
as soon as it is formed. Thus, reduced pressure can be applied to remove the
water more easily from the system.
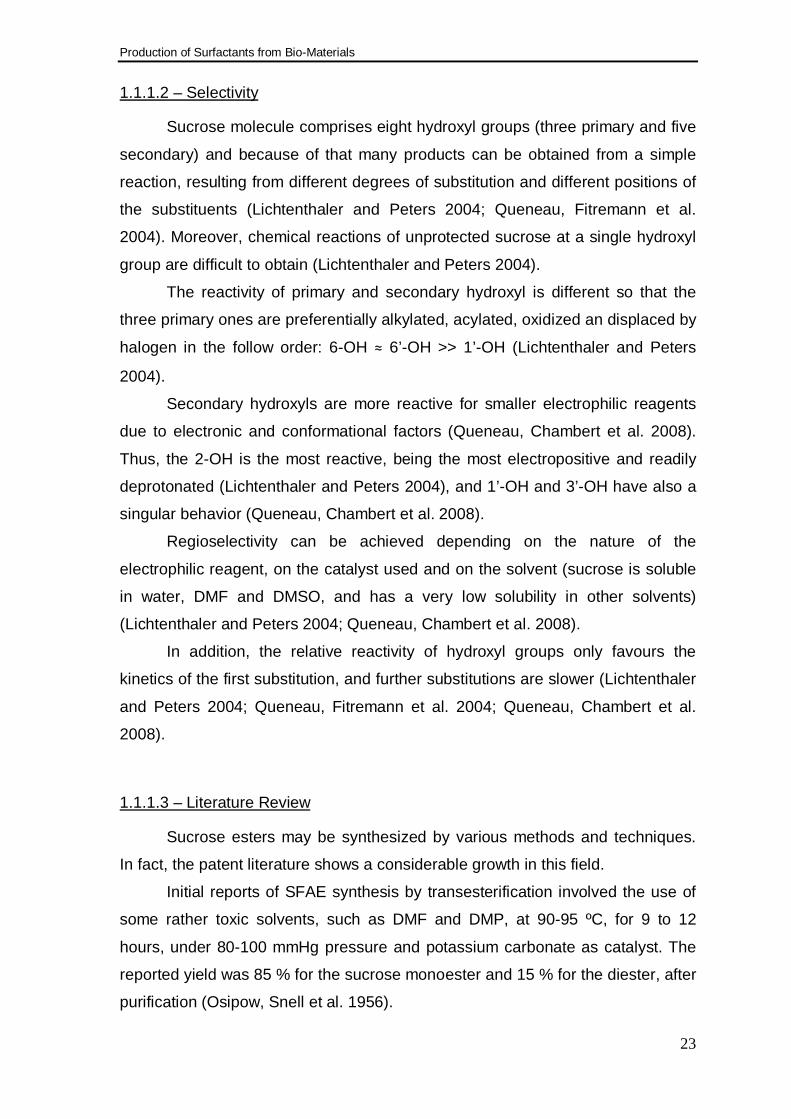
The transesterification is an equilibrium reaction (Figure 7) where the ester
alkyl group, R1, is exchanged with other alkyl group, R2, from an alcohol. The
equilibrium can be extended for the formation of more products proceeding with
the distillation of the volatile by-product.
R OR1
O
+ R2OHR O
R2
O
+ R1OH
Figure 7 - General transesterification reaction.
Production of Surfactants from Bio-Materials
23
1.1.1.2 – Selectivity
Sucrose molecule comprises eight hydroxyl groups (three primary and five
secondary) and because of that many products can be obtained from a simple
reaction, resulting from different degrees of substitution and different positions of
the substituents (Lichtenthaler and Peters 2004; Queneau, Fitremann et al.
2004). Moreover, chemical reactions of unprotected sucrose at a single hydroxyl
group are difficult to obtain (Lichtenthaler and Peters 2004).
The reactivity of primary and secondary hydroxyl is different so that the
three primary ones are preferentially alkylated, acylated, oxidized an displaced by
halogen in the follow order: 6-OH ≈ 6’-OH >> 1’-OH (Lichtenthaler and Peters
2004).
Secondary hydroxyls are more reactive for smaller electrophilic reagents
due to electronic and conformational factors (Queneau, Chambert et al. 2008).
Thus, the 2-OH is the most reactive, being the most electropositive and readily
deprotonated (Lichtenthaler and Peters 2004), and 1’-OH and 3’-OH have also a
singular behavior (Queneau, Chambert et al. 2008).
Regioselectivity can be achieved depending on the nature of the
electrophilic reagent, on the catalyst used and on the solvent (sucrose is soluble
in water, DMF and DMSO, and has a very low solubility in other solvents)
(Lichtenthaler and Peters 2004; Queneau, Chambert et al. 2008).
In addition, the relative reactivity of hydroxyl groups only favours the
kinetics of the first substitution, and further substitutions are slower (Lichtenthaler
and Peters 2004; Queneau, Fitremann et al. 2004; Queneau, Chambert et al.
2008).
1.1.1.3 – Literature Review
Sucrose esters may be synthesized by various methods and techniques.
In fact, the patent literature shows a considerable growth in this field.
Initial reports of SFAE synthesis by transesterification involved the use of
some rather toxic solvents, such as DMF and DMP, at 90-95 ºC, for 9 to 12
hours, under 80-100 mmHg pressure and potassium carbonate as catalyst. The
reported yield was 85 % for the sucrose monoester and 15 % for the diester, after
purification (Osipow, Snell et al. 1956).
Production of Surfactants from Bio-Materials
24
This process is known as the Hass-Snell process, developed in 1959 and
due the use of toxic solvents is not approved for the use of SFAE in food
technology as it yielded odorous products which contain toxic solvent residues
(Osipow, Snell et al. 1956).
A classic chemical route to synthesize SFAE is under the so-called
Mitsunobu conditions (Mitsunobu 1967; Molinier, Kouwer et al. 2006; Molinier,
Kouwer et al. 2007). Mitsunobu reaction involves the condensation of an acidic
pronucleophile (carboxylic acid) and an alcohol, promoted by triphenylphosphine
(TPP) and diethyl azodicarboxylate (DEAD) (Laven and Stawinski 2009).
Molinier et al have reported several studies on the synthesis of sucrose
monoesters via the Mitsunobu reaction. These studies reported the obtention of
two sucrose monoesters isomers in the positions 6 and 6’, approximately 85 %
and 15 %, respectively, after HPLC (Molinier, Kouwer et al. 2006) and also the
obtention of sucrose diesters isomers in the positions 1’,6’, 1’,6 and 6,6’ (Molinier,
Kouwer et al. 2007). This synthesis occurs at room temperature and DMF is
using as solvent (Molinier, Kouwer et al. 2006; Molinier, Kouwer et al. 2007).
A study was performed using a catalytic amount of DMAP together with
NaOH. This reaction was again faster and led to very good yields even in dilute
solutions, although the tendency of polysubstitution upon increasing the sucrose
concentration rises nearly as without DMAP. The yields were slightly improved
with the decreasing of the reaction temperature (Thévenet, Wernicke et al. 1999).
Another synthesis of sucrose monoester was performed with
heterogeneous catalysis in an environmentally friendly process, at low
temperature using HMS-TBD (triazabicyclo[4.4.0]dec-5-ene – TBD – anchored in
a functionalized silica). This catalyst leads to a selective esterification of sucrose
with methyl dodecanoate, under nitrogen, at 110 ºC and DMSO as solvent. The
selectivity is higher than 60 % in monoester, with more than 90 % yield, in an
equimolar proportion. Using a four times excess of sucrose the selectivity in
monoester increase to 90 %, with a similar yield (Kharchafi, Jerome et al. 2005).
SFAE was synthesized using sucrose octaacetate and FAME of vegetable
oil by an ester-ester interchange reaction with a sodium metal catalyst, on a
solvent-free process. High yields on SFAE were obtained with the reaction taking
place during 2 hours, at 105 ºC and by applying a vacuum to reduced pressure of
5 mmHg (Akoh and Swanson 1990).
Production of Surfactants from Bio-Materials
25
SFAE can be produced, in laboratory, via enzymatic synthesis in an
organic media. These reactions are conducted under mild conditions, which
minimize side reactions, especially lipases. Furthermore, enzymatic synthesis
can also be performed in non-toxic solvents (Sabeder, Habulin et al. 2006).
The most interesting lipases are immobilized from Candida antarctica and
Rhizomucor miehei (Sabeder, Habulin et al. 2006).
The yields achieved via enzymatic synthesis are low, yet. A study of
production of sucrose ester monolaurate, using Candida antarctica and
Rhizomucor miehei, and different solvents, such as 2-methyl-2-butanol, acetone
and methyl ethyl ketone, have reported yields lower than 21 %, for both enzymes
and using a temperature range of 50-70 ºC, which is the temperature that
immobilized lipases are generally more active (Walsh, Bombyk et al. 2009).
During the esterification of sugar and fatty acid, water is generated and
has to be removed from the mixture in order to increase the yield. This can be
executed by several methods, such as evacuation in vacuum, using open tubes
or even using molecular sieves (Sabeder, Habulin et al. 2006).
Recently, supercritical carbon dioxide has been investigated as a medium
for enzymatic reactions. This medium accelerates the reaction rate, reduces
mass transfer resistance and enable an easily separation of products and
reactants. However, sugars have low solubility in pure supercritical carbon
dioxide. Therefore, organic solvents expanded by supercritical carbon dioxide
could become an alternative reaction media (Tai and Brunner 2009).
There have been reported several advantages of carbon dioxide expanded
liquids (Tai and Brunner 2009):
• Abilities to alter the physical-chemical properties, such as viscosity
and dielectric constant, of the solvent;
• Comparable or better product selectivity than in neat organic solvents
or supercritical carbon dioxide;
• Milder process pressure compared to supercritical carbon dioxide;
• Increased reaction rates and turnover frequencies;
• Substantial replacement of organic solvents with dense-phase
carbon dioxide.
Although, this is purely wishful thinking, and no yield reports are available
so far.
Production of Surfactants from Bio-Materials
26
1.1.2 – Market Overview
Surfactants are an important class of chemical products not only because
their large variety of applications in household, industry and agriculture, but also
bearing in mind the market volumes. In 2002, the worldwide production of
surfactants amounted to 17-19 Mt. Thus, the expected future growth rates are 3-4
% per year globally, and 1.5-2 % in the EU (Font: BIOPRODUCTION document -
SFAE Position Paper, 2006).
Despite of environmental impact, the majority of surfactants in the market
are derived from petroleum. Thus, the industry is looking for new ways of
producing surfactants from renewable raw materials. Biosurfactants produced by
microorganisms and/or derived from renewable raw materials are under growing
relevance.
However, current regulations do not give competitive advantage for
biosurfactants versus petrochemical-based surfactants. Additional policies and
measures could increase their market share above 40 % by 2010 (Font:
BIOPRODUCTION document - SFAE Position Paper, 2006).
1.2 - Surface Active Materials
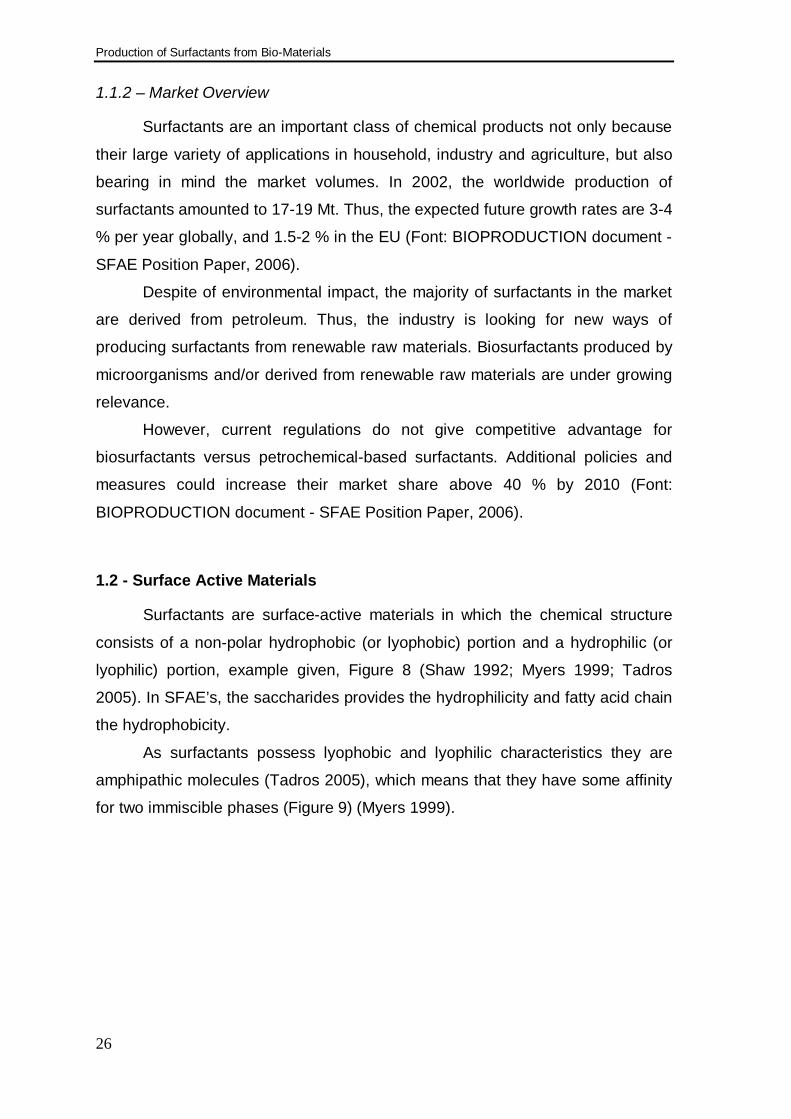
Surfactants are surface-active materials in which the chemical structure
consists of a non-polar hydrophobic (or lyophobic) portion and a hydrophilic (or
lyophilic) portion, example given, Figure 8 (Shaw 1992; Myers 1999; Tadros
2005). In SFAE’s, the saccharides provides the hydrophilicity and fatty acid chain
the hydrophobicity.
As surfactants possess lyophobic and lyophilic characteristics they are
amphipathic molecules (Tadros 2005), which means that they have some affinity
for two immiscible phases (Figure 9) (Myers 1999).
Production of Surfactants from Bio-Materials
27
Figure 8 – Typical surface active material structure, showing hydrophilic and hydrophobic portions.
This kind of molecules has the ability to be adsorbed at interphases. The
driving force for surfactant adsorption is the lowering of the free energy of the
phase border (Shaw 1992; Myers 1999; Tadros 2005).
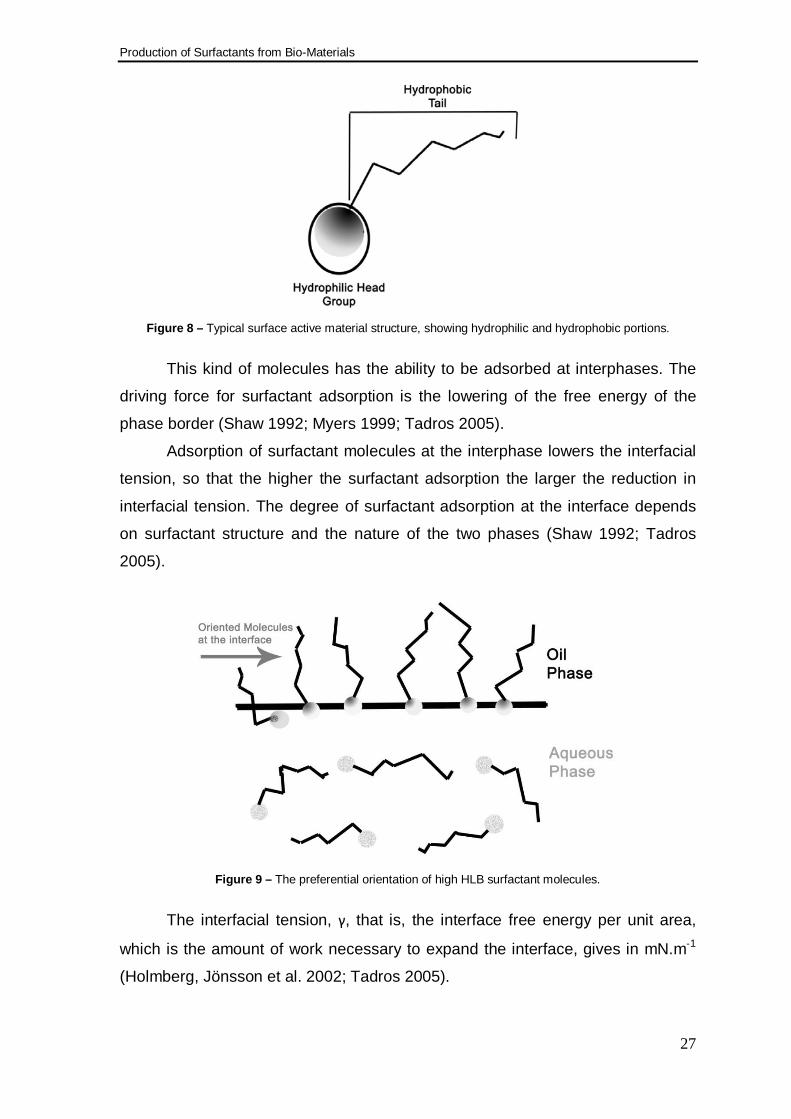
Adsorption of surfactant molecules at the interphase lowers the interfacial
tension, so that the higher the surfactant adsorption the larger the reduction in
interfacial tension. The degree of surfactant adsorption at the interface depends
on surfactant structure and the nature of the two phases (Shaw 1992; Tadros
2005).
Figure 9 – The preferential orientation of high HLB surfactant molecules.
The interfacial tension, γ, that is, the interface free energy per unit area,
which is the amount of work necessary to expand the interface, gives in mN.m-1
(Holmberg, Jönsson et al. 2002; Tadros 2005).
Production of Surfactants from Bio-Materials
28
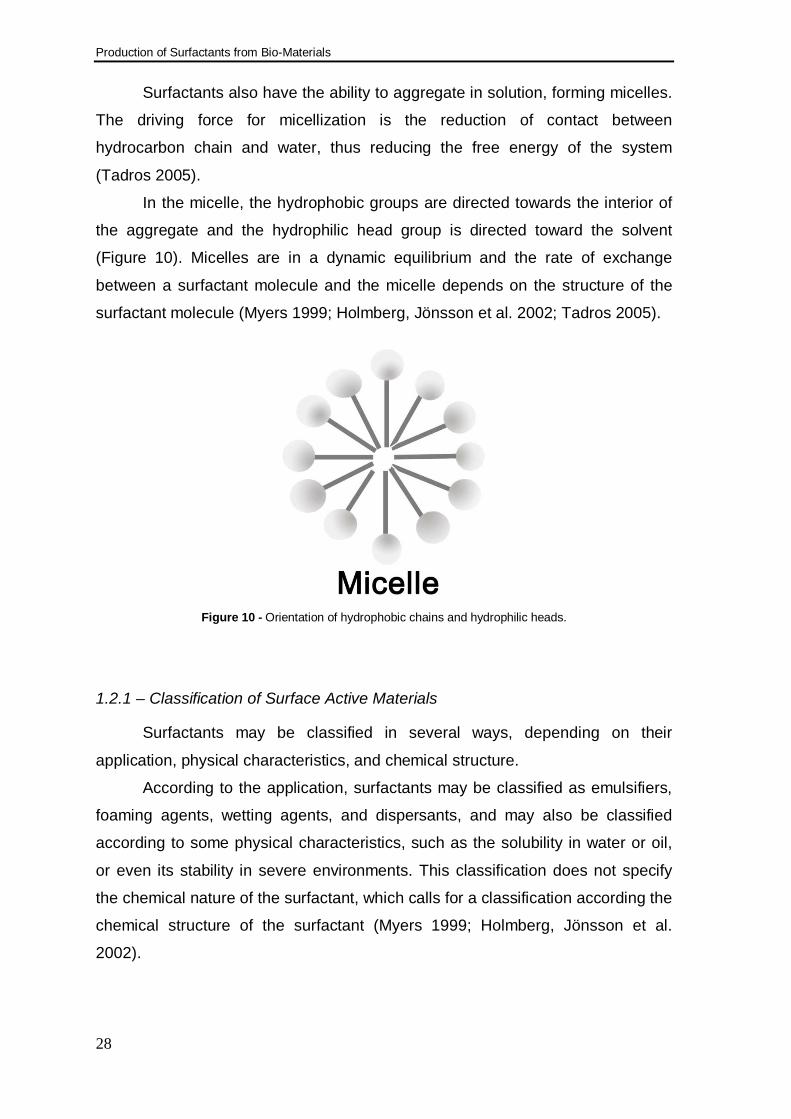
Surfactants also have the ability to aggregate in solution, forming micelles.
The driving force for micellization is the reduction of contact between
hydrocarbon chain and water, thus reducing the free energy of the system
(Tadros 2005).
In the micelle, the hydrophobic groups are directed towards the interior of
the aggregate and the hydrophilic head group is directed toward the solvent
(Figure 10). Micelles are in a dynamic equilibrium and the rate of exchange
between a surfactant molecule and the micelle depends on the structure of the
surfactant molecule (Myers 1999; Holmberg, Jönsson et al. 2002; Tadros 2005).
Figure 10 - Orientation of hydrophobic chains and hydrophilic heads.
1.2.1 – Classification of Surface Active Materials
Surfactants may be classified in several ways, depending on their
application, physical characteristics, and chemical structure.
According to the application, surfactants may be classified as emulsifiers,
foaming agents, wetting agents, and dispersants, and may also be classified
according to some physical characteristics, such as the solubility in water or oil,
or even its stability in severe environments. This classification does not specify
the chemical nature of the surfactant, which calls for a classification according the
chemical structure of the surfactant (Myers 1999; Holmberg, Jönsson et al.
2002).
Production of Surfactants from Bio-Materials
29
A simple classification based on the nature of the hydrophilic group
classify surfactants in four main classes: anionic, cationic, non-ionic, and
zwitterionic (Tadros 2005).
1.2.1.1 – Anionic Surfactants
Anionic surfactants are used in industrial applications because they
present relatively low cost manufacture, being the most widely used class of
surfactants (Tadros 2005), constituting 70-75 % of worldwide surfactant
consumption (Myers 2006).
In this class of surfactants the hydrophobic group it is a linear alkyl group,
and the most commonly hydrophilic groups are carboxylates, sulphates,
sulphonates and phosphates. A general formula could be (Tadros 2005):
Carboxylates CnH2n+1COO-X
Sulphates CnH2n+1OSO3-X
Sulphonates CnH2n+1SO3-X
Phosphates CnH2n+1OPO(OH)O-X
with “n” between 8 or 16 atoms and X as a counter ion, usually sodium.
Carboxylates, commercially known as soaps, are low cost and have low
toxicity and ready biodegradability. Generally, commercial soaps have in the
structures a mixture of fatty acids obtained from natural oils, such as coconut oil
and palm oil (Tadros 2005). In the presence of hard water, containing bivalent
ions such as Ca2+ and Mg2+, soaps precipitate. This could be avoided with the
modification of the carboxylates by introducing hydrophilic chains, which result in
modified carboxylates, such as ethoxy carboxylates and ester carboxylates
(Tadros 2005).
Sulphates are the largest and most important of these synthetic
surfactants. In the past, those were produced by reaction of an alcohol and
sulphuric acid, resulting esters of sulphuric acid. More recently, the sulphating
methods consist in using mixtures of chlorosulphonic or sulphur dioxide with air,
instead of sulphuric acid. To improve the solubility, sulphates are chemically
modified by the reaction with ethylene oxide. Because of their chemical instability
Production of Surfactants from Bio-Materials
30
(hydrolyzing to the alcohol), they are now replaced by sulphonates, which are
chemically more stable (Tadros 2005).
Sulphonates have the sulphur atom directly attached to a carbon atom of
the alkyl group, providing the stability against hydrolysis. The most common of
these surfactants are alkyl aryl sulphonates, for example, sodium alkyl benzene
sulphonate. It is usual to achieve chemical modifications with the reaction of
ethylene oxide, improving their solubility by the increase of HLB (Tadros 2005).
Phosphates, such as alkyl phosphates and alkyl ether phosphates, are
produced by treating the fatty alcohol or alcohol ethoxylates with a
phosphorylating agent, typically phosphorous pentoxide, P4O10, obtaining a
mixture of mono- and di-esters of phosphoric acid. These surfactants are used in
the metalworking industry due to their anticorrosive properties (Tadros 2005).
1.2.1.2 – Cationic Surfactants
Cationic surfactants are usually water soluble, specifically with only one
long alkyl group, generally compatible with most inorganic ions and hard water,
but they are incompatible with metasilicates, highly condensed phosphates and
protein-like materials (Tadros 2005).
These surfactants are chemically stable, can tolerate electrolytes and
stable to pH variations, both acid and alkaline, but are insoluble in hydrocarbon
oils. They are incompatible with almost anionic surfactants, although, they are
compatible with non-ionic compounds (Tadros 2005).
The most important classes of cationic surfactant are amine salts,
quaternary ammonium compounds and amine oxides (Myers 2006). An example
of a quaternary ammonium compound is dodecyl trimethyl ammonium chloride,
C12H25(CH3)3NCl. It is common to modify chemically these cationics by reaction
with ethylene oxide to further improve their water solubility (Tadros 2005).
Cationic surfactants have a tendency to adsorb when at negatively
charged surfaces, and because of that, they are used as anticorrosive agents for
steel, as flotation collectors for mineral ores, as dispersants for inorganic
pigments, as bactericides and several other applications (Tadros 2005; Myers
2006).
Production of Surfactants from Bio-Materials
31
1.2.1.3 – Non-ionic Surfactants
There are two important classes of non-ionic surfactants, those based on
ethylene oxide, referred to as ethoxylated surfactants, and those with multi-
hydroxyl groups (Tadros 2005).
The viscosity of a non-ionic surfactant solution increases gradually with an
increase in its concentration, but at a critical concentration the viscosity increases
rapidly and a gel-like structure appears due to the formation of a liquid crystalline
structure, usually detected as the “cloud point” (Tadros 2005).
Several classes can be distinguished for ethoxylated surfactants (Tadros
2005):
• Alcohol ethoxylates;
• Alkyl phenol ethoxylates;
• Fatty acid ethoxylates;
• Mono-alkanolamide ethoxylates;
• Sorbitan ester ethoxylates;
• Fatty amine ethoxylates;
• Ethylene oxide - propylene oxide copolymers (very high HLB).
Glycol esters, glycerol and polyglycerol esters, glucosides and
polyglucosides and even sucrose esters are examples of non-ionic surfactants
with multi-hydroxyl functionality (Tadros 2005).
Alcohol ethoxylates; are generally produced by the ethoxylation of a fatty
alcohol chain. A typical example is dodecyl hexaoxyethylene glycol mono-ether,
having the chemical formula C12H25O(CH2CH2O)6OH, sometimes abbreviated as
C12E6. The solubility of alcohol ethoxylates depends both on the alkyl chain
length and on the number of ethylene oxide units in the molecule (Tadros 2005).
Alkyl phenol ethoxylates are prepared by the reaction of ethylene oxide
with the appropriate alkyl phenol. The most common alkyl phenol ethoxylates are
those based on nonyl phenol. These surfactants are cheap to produce, but have
a potential toxicity and are of difficult biodegradability. Thus, the by-product of
degradation is nonyl phenol, which has a considerable toxicity. Nevertheless, it is
still used, outside European Union, because of their advantageous properties,
such as solubility in aqueous and non-aqueous media, good emulsification and
dispersion properties (Tadros 2005).
Production of Surfactants from Bio-Materials
32
Fatty acid ethoxylates are produced by the reaction of ethylene oxide with
a fatty acid and presents the following general formula RCOO-(CH2CH2O)nH.
These surfactants are generally soluble in water, but needs enough ethylene
oxide units and the alkyl chain length of the acid not too long. They are
compatible with aqueous ions. Although, these surfactants suffers hydrolysis in
highly alkaline solutions (Tadros 2005).
Sorbitan esters are produced by reacting sorbitol with a fatty acid at a high
temperature (> 200 ºC). First sorbitol dehydrates to 1,4-sorbitan and then
esterification occurs, producing a mixture of mono-, di- and tri-esters, with a low
HLB number. This surfactant is referred as Spans, an Atlas commercial trade
name (later on used by ICI). Sorbitan esters are unsoluble in water, but are
soluble in most organic solvents, and have been used in cosmetic and
pharmaceutical applications (Tadros 2005).
There is a surfactant family derivative from sorbitan ester, which is
produced by the reaction of ethylene oxide on a hydroxyl group remaining on the
Sorbitan ester. This surfactant family is commercially known as Tweens,
presenting solubility in water and high HLB number. As an alternative, the sorbitol
can be first ethoxylated and then esterified. However, this product presents
different properties then Tweens (Tadros 2005).
Natural fats and oils, such as castor oil, have been ethoxylated, producing
solubilizers for pharmaceutical applications (Tadros 2005).
Amine ethoxylates are produced by the reaction of ethylene oxide with a
primary or secondary fatty amine. When it has low ethylene oxide content and if
the pH is acid, these surfactants acquire a cationic character. Furthermore, they
are not soluble in water, but are soluble in acid solutions. Thus, at high pH theses
surfactants become soluble in water. At neutral pH and high ethylene oxide
content they act very similarly to non-ionics (Tadros 2005).
Ethylene oxide – propylene oxide copolymers (EO/PO), also known as
polymeric surfactants, are commercialized under various trade names, such as
Pluronics (Wyandotte) and Synperonic PE (ICI). There are two types: those
prepared reacting polyoxypropylene glycol (difunctional) with ethylene oxide or
mixed EO/PO, giving the following structure (EO)n(PO)m(EO)n; and those
prepared reacting polyethylene glycol (difunctional) with PO or mixed EO/PO,
giving the following structure (PO)n(EO)m(PO)n (Tadros 2005).
Production of Surfactants from Bio-Materials
33
Many surfactants derived from mono- or polysaccharides have been
synthesized by reacting with the hydroxyl groups, namely esterification of sucrose
with fatty acids, giving SFAE. In this reaction, the challenge is to graft the
hydrophobic group to the hydrophilic structure. Another sugar surfactant it is alkyl
polyglucosides, which is produced by the reaction of a fatty alcohol with glucose.
These classes of surfactants are environmental friendly, because they are
sensitive to biodegradation and the main raw materials are provided from
renewable resources (Tadros 2005).
1.2.1.4 – Zwitterionic Surfactants
Zwitterionic surfactants containing, or have the potential to form, both
cationic and anionic surfactants under specific conditions, and for that, presents
an amphoteric character (Myers 2006).
The principal classes of these surfactants are (Myers 2006):
• Imidazoline derivatives;
• Betaines and Sulfobetaines;
• Phosphatides.
These surfactants are very dependent on the pH of the solution, in which
they are dissolved. In fact, in acid pH the molecule acquires a positive charge
and act as a cationic surfactant, whereas in alkaline pH the molecule become
negatively charged and act as an anionic surfactant. There is a specific pH value
that both ionic groups show equal ionization, this is the isoelectric point of the
molecule (Tadros 2005).
These surfactants are usually soluble in water, reaching a minimum of
solubility at the isoelectric point; exhibit a great compatibility with other
surfactants, forming mixed micelles; they are chemically stable in all pH range
(Tadros 2005).
Their properties, such as wetting, detergency, foaming, and others, are
affected by changes in pH, in which way, that at the isoelectric point the
properties of zwitterionic surfactant are similar to those of non-ionics. Below and
above the isoelectric point the properties shift towards those of cationic and
anionic surfactants, respectively (Tadros 2005).

Production of Surfactants from Bio-Materials
34
Zwitterionic surfactants exhibit excellent dermatological properties. In fact,
they are frequently used in cosmetics - shampoos and other personal care
products (Tadros 2005).
1.2.2 – Surfactant in the Environment
1.2.2.1 – Biodegradability
The use of surfactants is currently growing, raising up the problems of
surfactant disposal as a very important aspect. The ecosystem has the ability to
absorb and degrade waste products, but human population generates more
waste products than the ecosystem can degrade.
Surfactants have a major impact on groundwater. Even though it may be
technologically possible to remove all residual surfactants from effluent steams,
the economic costs are totally unacceptable. To solve this problem biosurfactants
can be a major choice, instead of classical surfactants, allowing the nature to
take its course by natural biodegradation mechanisms. If biodegradation doesn’t
occur, the surfactant is stable and persists for rather long time in the environment
(Holmberg, Jönsson et al. 2002; Tadros 2005).
Biodegradation can be defined as the elimination or destruction of
chemicals through the biological activity of living organisms in nature (Holmberg,
Jönsson et al. 2002; Tadros 2005; Myers 2006). Concerning surfactants,
biodegradation can be divided into two categories:
1. Primary degradation – the elimination of any surface-active properties
by the modification of the chemical structure;
2. Ultimate degradation – the material is completely removed from the
environment as byproducts (carbon dioxide, water, inorganic salts, or
other materials) as a result of the biological activity.
The rate of biodegradation of the surfactants depends on several
variables, which are: surfactant concentration, pH and temperature. The
surfactant structure has the biggest influence on the rate of biodegradation
(Tadros 2005).
Production of Surfactants from Bio-Materials
35
1.2.2.2 – Rules for Biodegradation
After extensive research it was proposed that the nature of the
hydrophobic group determined its relative susceptibility to biological action,
whereas the nature and mode of attachment of the hydrophilic group has minor
significance (Holmberg, Jönsson et al. 2002; Myers 2006).
With this purpose, the following general rules for biodegradation were
developed (Holmberg, Jönsson et al. 2002; Myers 2006):
1. The chemical structure of the hydrophobic group is the primary factor to
control biodegradability (high degrees of substitution, especially at the
alkyl terminus, inhibit biodegradation);
2. The nature of the hydrophilic group has a minor effect on
biodegradability;
3. The greater the distance between the hydrophilic group and the
terminus of the hydrophobe, the greater the rate of primary degradation.
1.2.3 – Technological Future
Surfactants have been used at least for 2300 years. The alkali metal soaps
were used as article trade by the Phoenicians as early as 600 B.C., and were also
used by the Romans. The first synthetic surfactant was developed in Germany
during World War I, and since then surfactant consumption has increased
continuously (Myers 2006). Thus, actually, surfactants constitute a consolidated
class of industrial chemicals at expansion.
Some classes of surfactants have a large potential for growth. An example
is non-ionic surfactants, which possess characteristics, such as good
performance at lower temperatures, low foaming, and relative stability at high
temperatures and under severe chemical conditions, that are advantageous for
many technological applications (Myers 2006).
Soaps are a particular case because of their special characteristics, and
their consumption levels are expected to maintain due to population growth
(Myers 2006).
The large diversity of lyophobic and lyophilic groups and the development
of new raw-materials sources provides an exceptionally list of choices to select a
surface active material for a specific need. However, there will always be the
Production of Surfactants from Bio-Materials
36
need for new and improved surfactants, conferring a potential for research and
development (Myers 2006).
Next, some ideas to surfactant use and possible growth potential are
presented (Myers 2006):
• Multifunctional surfactants (for example, detergent and fabric softener
in one structure);
• More ecologically acceptable chemical structures;
• New surfactants based on renewable raw-materials;
• Highly biocompatible surfactants;
• Materials that allow energy savings on their manufacture or
functionality at lower temperatures.
1.3 – Surfactants in Emulsion Formation and Stabilization
Emulsions are a class of disperse systems consisting of two immiscible
liquids, in other words, one liquid phase very well dispersed in another liquid
phase which is immiscible with the first. Moreover, to disperse these two
immiscible phases one needs a third component, the emulsifier (Tadros 2005).
There are three classes which may be distinguished: oil-in-water (O/W),
water-in-oil (W/O) and oil-in-oil (O/O). Thus, emulsions may be classified
according to the nature of the emulsifier or the structure of the system (Tadros
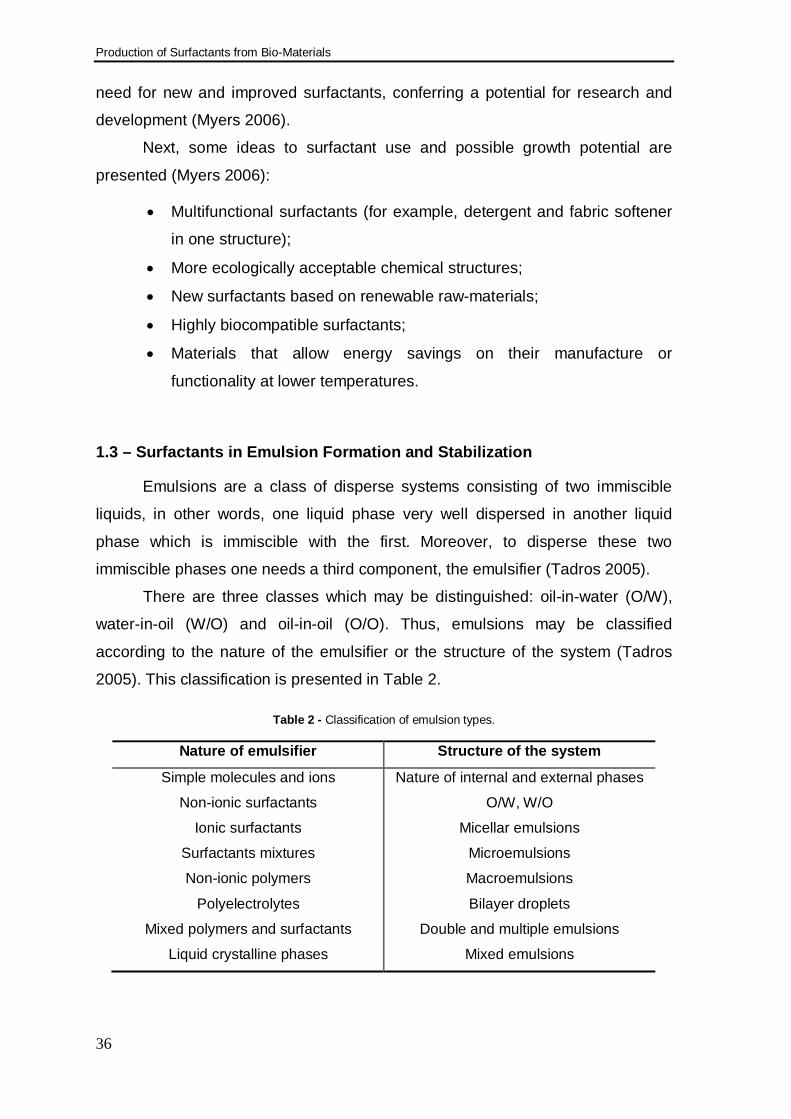
2005). This classification is presented in Table 2.
Table 2 - Classification of emulsion types.
Nature of emulsifier Structure of the system
Simple molecules and ions Nature of internal and external phases
Non-ionic surfactants O/W, W/O
Ionic surfactants Micellar emulsions
Surfactants mixtures Microemulsions
Non-ionic polymers Macroemulsions
Polyelectrolytes Bilayer droplets
Mixed polymers and surfactants Double and multiple emulsions
Liquid crystalline phases Mixed emulsions
Production of Surfactants from Bio-Materials
37
Emulsions are used in several applications in industry, such as (Goodwin
2004; Tadros 2005):
• Food emulsion – mayonnaise, salad creams, deserts;
• Personal care and cosmetics – hand creams, lotions, hair sprays,
sunscreens;
• Agrochemicals – self-emulsifiable oils which produce emulsions on
dilution with water, emulsion concentrates and crop oil sprays;
• Pharmaceuticals – anaesthetics of O/W emulsions, liquid emulsions,
double and multiple emulsions;
• Paints – emulsions of alkyd resins, latex emulsions;
• Dry cleaning formulations – water droplets emulsified in the dry
cleaning oil;
• Bitumen emulsions – stable in the containers but when applied to the
road chippings they coalesce to form a film of bitumen;
• Emulsions in the oil industry – to remove water droplets contained in
the crude oil;
• Oil stick dispersions – emulsification of oils spilled from tankers;
• Emulsification of unwanted oil – pollution control.
1.3.1 – Thermodynamics of Emulsion Formation and Breakdown
Throughout the emulsification process the interface has a large expansion
due to the free energy variation. This change in free energy comprises two terms:
a surface energy term and an entropy of dispersion term (Goodwin 2004; Tadros
2005). Thus, both terms are positive. From the second law of thermodynamics:
STAAG ∆−∆= 12γ (Eq. 1)
where γ12 refers to the interfacial tension of liquid 1 versus liquid 2.
In most cases, STA ∆>>∆ 12γ , which means that emulsion formation is non-
spontaneous and the system is thermodynamically unstable. Moreover,
emulsions will breakdown if there are no other stabilization mechanism. In the
presence of a surfactant (stabilizer) an energy barrier is created between the
droplets and the system becomes kinetically stable (Tadros 2005).
Production of Surfactants from Bio-Materials
38
1.3.2 – Mechanism of Emulsification
Emulsification is a dynamic process which needs oil, water, surfactant and
energy. Since γ is positive, the energy required to expand the interface is large
and positive. Moreover, the entropy of dispersion, TΔS, cannot compensate the
energy term (Goodwin 2004; Tadros 2005; Myers 2006).
Given that the emulsion formation is non-spontaneous, to produce the
droplets, energy is necessary. The formation of large droplets for macro-
emulsions is easy in contrast with the formation of small droplets (nano-
emulsions), which are difficult to produce and requires a large amount of
surfactant and/or energy (Goodwin 2004; Tadros 2005).
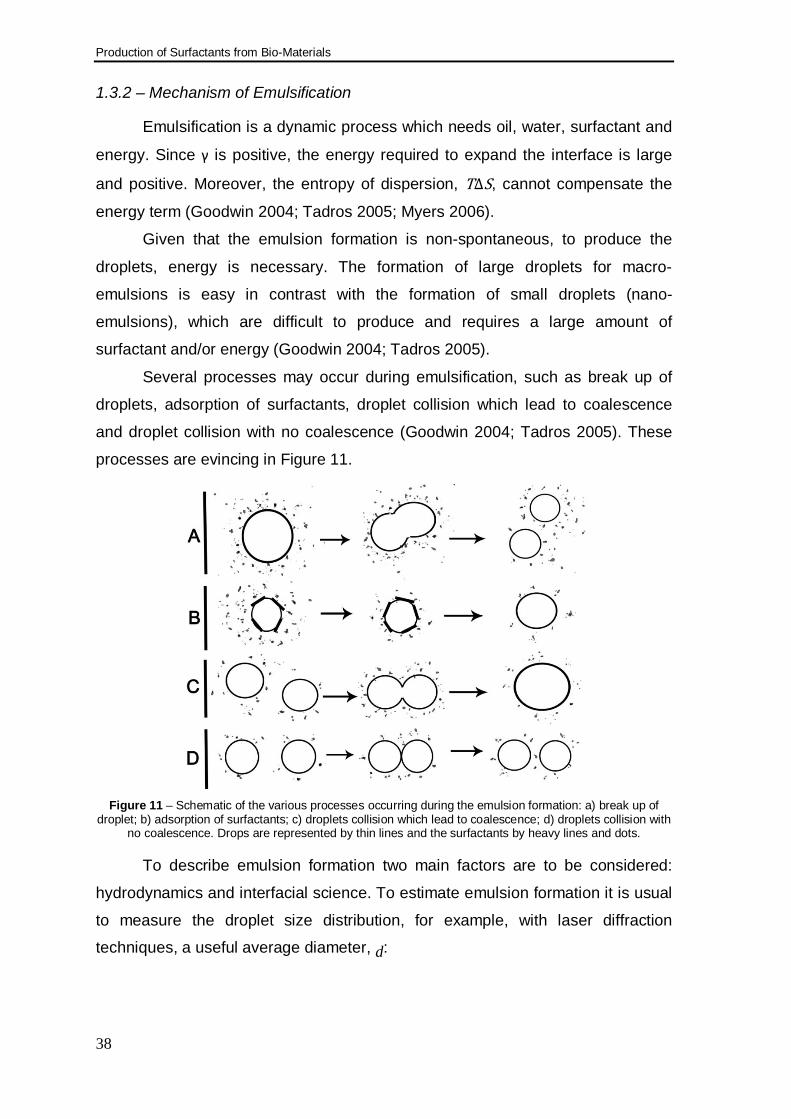
Several processes may occur during emulsification, such as break up of
droplets, adsorption of surfactants, droplet collision which lead to coalescence
and droplet collision with no coalescence (Goodwin 2004; Tadros 2005). These
processes are evincing in Figure 11.
Figure 11 – Schematic of the various processes occurring during the emulsion formation: a) break up of
droplet; b) adsorption of surfactants; c) droplets collision which lead to coalescence; d) droplets collision with no coalescence. Drops are represented by thin lines and the surfactants by heavy lines and dots.
To describe emulsion formation two main factors are to be considered:
hydrodynamics and interfacial science. To estimate emulsion formation it is usual
to measure the droplet size distribution, for example, with laser diffraction
techniques, a useful average diameter, d:
Production of Surfactants from Bio-Materials
39
( )mn
n
mnm S
Sd−
=
1
(Eq. 2)
An alternative description of emulsion quality uses the specific surface
area, A:
32
2 6d
sA φπ == (Eq. 3)
1.3.3 – Surfactants in Emulsification
Surfactants play a major role in the formation of emulsions, lowering the
interfacial tension and causing a reduction in the droplet size. Surfactants prevent
coalescence of recently formed drops (Tadros 2005).
The amount of surfactant necessary to produce the smallest drop size will
depend on its activity, , in the bulk, which determines the reduction in interfacial
tension, as given by the Gibbs adsorption equation (Goodwin 2004; Tadros
2005):
( )adRTd lnΓ=− γ (Eq. 4)
where R is the gas constant, T is the absolute temperature and Г is the surface
excess (number of moles adsorbed per unit area of the interface).
Surfactants also play major roles in deformation and break-up of droplets,
allowing the existence of interfacial tension gradients, which is crucial for the
formation of stable droplets (Goodwin 2004; Tadros 2005; Myers 2006).
In the absence of surfactants the interface is not capable of endure a
tangential stress. Thus, the liquid motion is continuous. The presence of
surfactants during emulsification has two consequences (Goodwin 2004; Tadros
2005):
1. Affect the equilibrium shape of the drop;
2. Formation of γ gradients, which slow down the motion of the liquid
inside the drop and reducing the amount of energy needed to deform
and break-up the drop.
Production of Surfactants from Bio-Materials
40
Emulsifiers prevent coalescence during emulsification due to the formation
of γ gradients, which is formed when the liquid flow out from the thin layer
between two drops (pushed together), inducing a γ gradient (Tadros 2005).
1.3.4 – Hydrophilic-Lipophilic Balance
The hydrophilic-lipophilic balance (HLB) is a concept first introduced by
Griffin in 1949 (Griffin 1949; Guo, Rong et al. 2006), which is a semi-empirical
scale based on the relative percentage of hydrophilic to Lipophilic groups in the
surfactant molecules (Griffin 1949; Goodwin 2004; Tadros 2005). Thus, the
HLB’s range varies between 0 to 20, meaning that the minimum value is the most
lipophilic and the maximum value is the most hydrophilic (Tadros 2005; Myers
2006).
Furthermore, HLB is one of the most widely used indicators of a surfactant
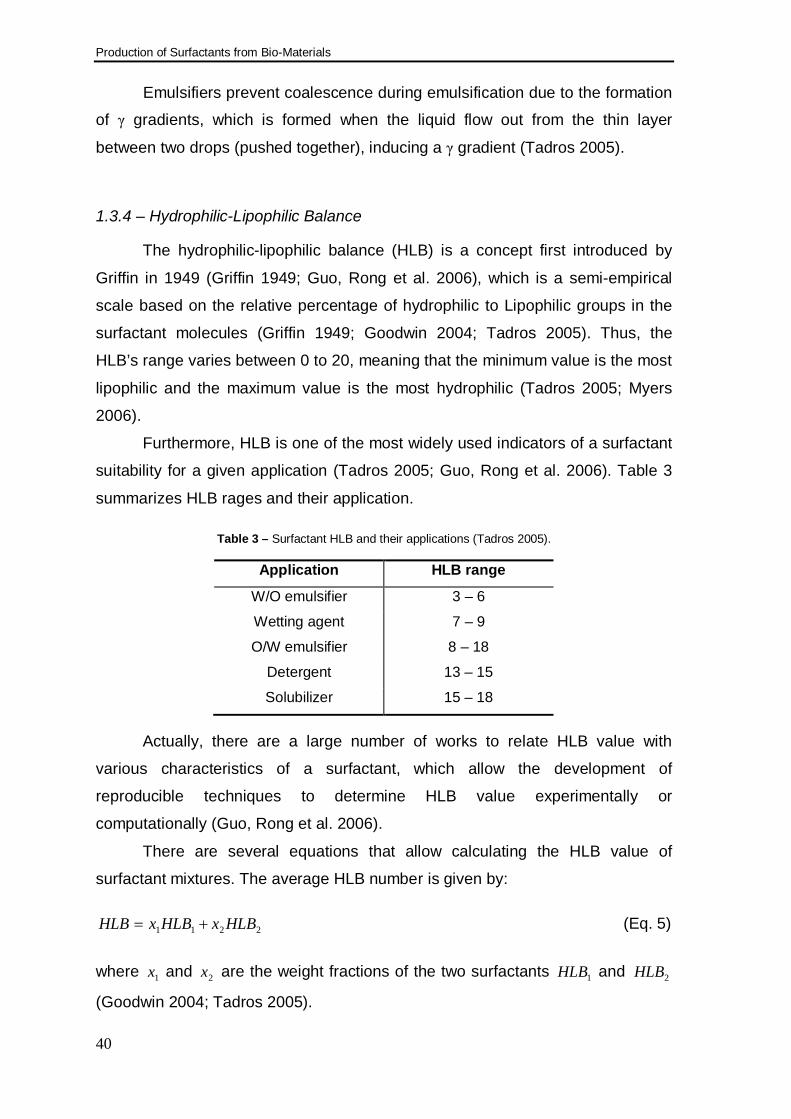
suitability for a given application (Tadros 2005; Guo, Rong et al. 2006). Table 3
summarizes HLB rages and their application.
Table 3 – Surfactant HLB and their applications (Tadros 2005).
Application HLB range
W/O emulsifier 3 – 6
Wetting agent 7 – 9
O/W emulsifier 8 – 18
Detergent 13 – 15
Solubilizer 15 – 18
Actually, there are a large number of works to relate HLB value with
various characteristics of a surfactant, which allow the development of
reproducible techniques to determine HLB value experimentally or
computationally (Guo, Rong et al. 2006).
There are several equations that allow calculating the HLB value of
surfactant mixtures. The average HLB number is given by:
2211 HLBxHLBxHLB += (Eq. 5)
where 1x and 2x are the weight fractions of the two surfactants 1HLB and 2HLB
(Goodwin 2004; Tadros 2005).
Production of Surfactants from Bio-Materials
41
Griffin developed simple equations to determine the HLB value of relatively
simple non-ionic surfactants (Tadros 2005). For example, Eq. 6 is used to
determine the HLB value of polyhydroxy fatty acid ester, where S is the
saponification number of the ester and A is the acid number.
−=
ASHLB 120 (Eq. 6)
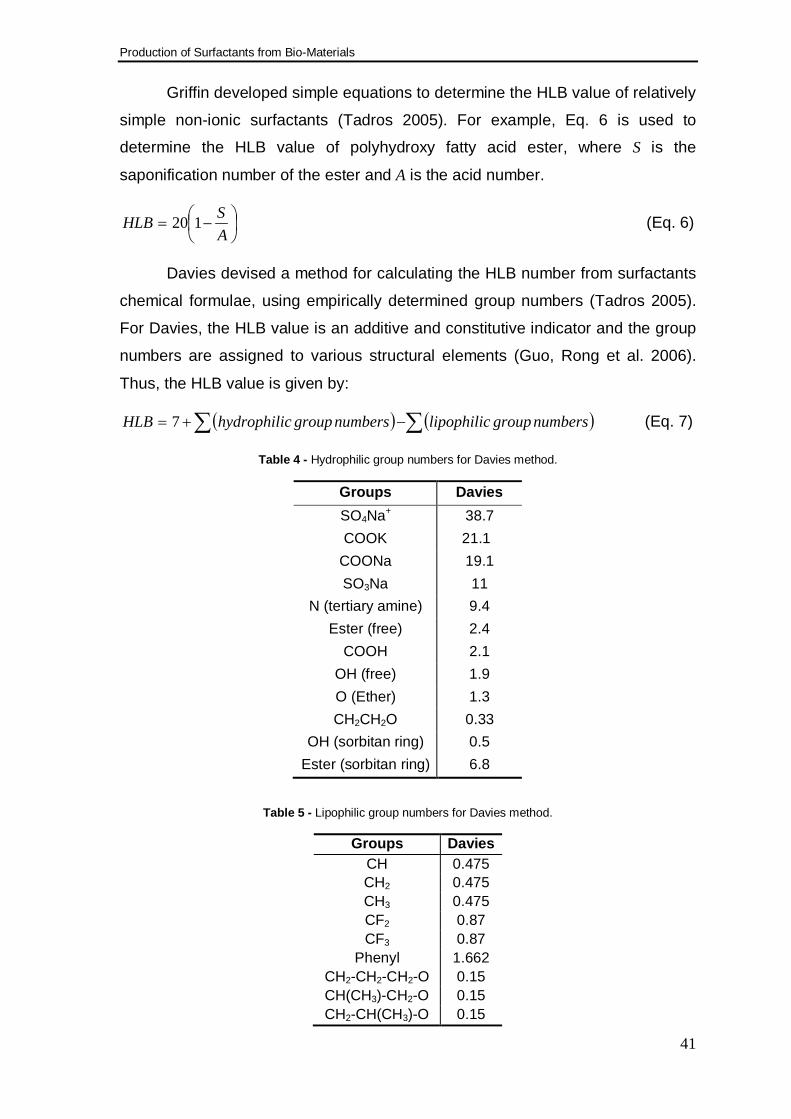
Davies devised a method for calculating the HLB number from surfactants
chemical formulae, using empirically determined group numbers (Tadros 2005).
For Davies, the HLB value is an additive and constitutive indicator and the group
numbers are assigned to various structural elements (Guo, Rong et al. 2006).
Thus, the HLB value is given by:
( ) ( )∑∑ −+= numbersgrouplipophilicnumbersgroupchydrophiliHLB 7 (Eq. 7)
Table 4 - Hydrophilic group numbers for Davies method.
Groups Davies SO4Na+ 38.7 COOK 21.1
COONa 19.1 SO3Na 11
N (tertiary amine) 9.4 Ester (free) 2.4
COOH 2.1 OH (free) 1.9 O (Ether) 1.3 CH2CH2O 0.33
OH (sorbitan ring) 0.5 Ester (sorbitan ring) 6.8
Table 5 - Lipophilic group numbers for Davies method.
Groups Davies CH 0.475 CH2 0.475 CH3 0.475 CF2 0.87 CF3 0.87
Phenyl 1.662 CH2-CH2-CH2-O 0.15 CH(CH3)-CH2-O 0.15 CH2-CH(CH3)-O 0.15
Production of Surfactants from Bio-Materials
42
1.3.5 – Relative Solubility number
The relative solubility number (RSN) has been used in surfactant industry
to assist formulation, quality control and product selection. Thus, RSN is useful in
the selection of stabilizers and demulsifiers (Wu, Xu et al. 2004).
RSN value is empirically defined as the volume in milliliters of distilled
water necessary to produce persistent turbidity in a benzene/dioxane solvent
system consisting of 1 gram of surfactant sample and 30 milliliters of solvent,
determined by titration (Wu, Xu et al. 2004).
However, the standard RSN method uses a toxic solvent system. So it has
been developed a new procedure for determination of RSN using less-toxic
solvents, such as toluene and ethylene glycol dimethyl ether (EGDE) (Wu, Xu et
al. 2004).
This method is a practical alternative to the HLB method of estimation
hydrophilic-lipophilic balance of surfactants. In fact, it was found that RSN values
determined at certain molar concentration, within the same surfactant family,
showed a good linear relationship with classic HLB values. Wu et al established
an empirical relationship between RSN and HLB, given by:
BRSNAHLB +×= (Eq. 8)
where A and B are empirical constants varying with surfactant family, depending
on characteristics of the hydrophilic and lipophilic groups (Wu, Xu et al. 2004).
HLB can be determined by experimentation and calculated from simple
equations. However, the experimental determination of the HLB value is
complicated and subjective; the applicability of these equations is limited and in
many industrial applications it is difficult to obtain sufficient structural information
to allow the calculation. Furthermore, the RSN procedure may be applied in day-
to-day industrial operations with low time consumption. Therefore, the RSN
measurement is often the chosen method in both industry and research (Wu, Xu
et al. 2004).
Like HLB, higher RSN numbers indicate a more water-soluble surfactant
and lower numbers indicate a more oil-soluble surfactant. Moreover, surfactants
with RSN < 13 are generally insoluble in water, surfactants with RSN value
between 13 and 17 are dispersible in water at low concentrations and form gels
Production of Surfactants from Bio-Materials
43
at high concentrations, and surfactants with RSN > 17 are usually soluble in
water (Wu, Xu et al. 2004).
Production of Surfactants from Bio-Materials
44
2 – Experimental
2.1 – Synthesis of SFAE
2.1.1 – Raw Materials
The following raw materials were used in the production of the SFAE:
i. Sucrose
A commercial sample of sucrose, derived from sugar cane, was kindly
offered by DAI, which come from the lot number 07082/18:16.
Some important properties of this pure sucrose are:
• Molecular weight = 342.3 g.mol-1
• Volumetric mass = 1.587 g.cm-3
• Melting point = 186 ºC
ii. Glucose
The sample of D-glucose used in this work was kindly shared by Rui
Galhano, and was purchased from VWR, with the product number 1.04074.1000
(VWR catalog). This sample has a grade of 99 % and a molecular weight of
180.16 g.mol-1.
iii. Molasses
The sample of molasses (sugar cane) used in this work was kindly offered
by DAI. Typically, sugar cane molasses has the following composition (weight):
• Sucrose: 47.1 %
• Glucose: 9.0 %
• Fructose: 12.8 %
• Moisture: 19.5 %
• Ash: 11.6 %
Production of Surfactants from Bio-Materials
45
iv. Acetic Anhydride
The used acetic anhydride was from Panreac, ACS grade (99 % purity),
from lot number 0000034127.
Some important properties of acetic anhydride are:
• Molecular weight = 102.09 g.mol-1
• Volumetric mass = 1.08 g.cm-3
• Melting point = 139.8 ºC
v. FAME
Two different samples of FAME were used, one obtained from rapeseed
oil and the other from coconut oil, which typical acid compositions are presented
on Table 1.
Both FAME samples were produced inside of the research group using the
methanolysis method and sodium methoxide as catalyst (vide Appendix I). These
samples were purified by washing with water and an aqueous acid solution (0.01
M), and then centrifuged. The water content of these samples was analyzed by
Karl Fisher method, which reveals a maximum content of residual moisture of
400 ppm.
vi. Lauric Acid
The sample of lauric acid was gently offered by Companhia Industrial de
Resinas Sintéticas, CIRES, S.A., with 99 % purity.
vii. Sodium Acetate
Used as catalyst in the first step, sodium acetate was produced inside the
research group reacting sodium hydroxide with acetic acid in excess. The
purification was carried out in the rotary evaporator applying reduced pressure to
remove water and acetic acid, obtaining a white powder as final product.
viii. Lanthanide Triflates
Three lanthanide triflates were tested, scandium, praseodymium and
gadolinium, as showed in the following table.
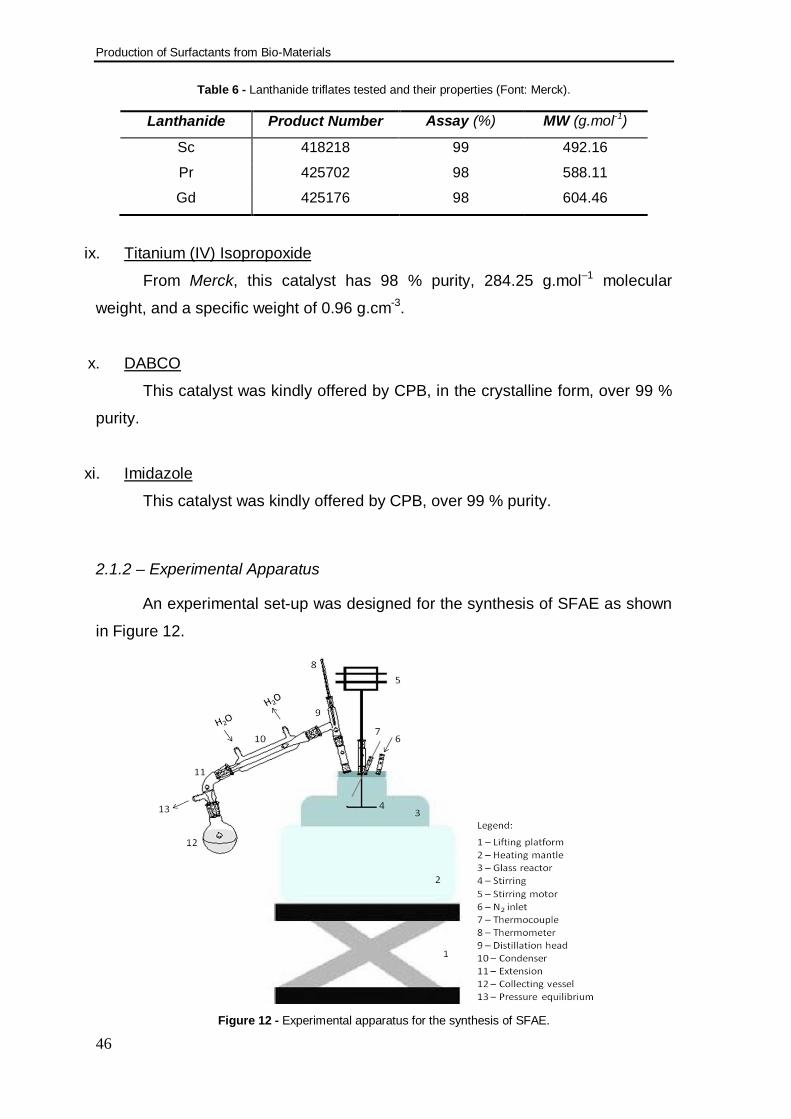
Production of Surfactants from Bio-Materials
46
Table 6 - Lanthanide triflates tested and their properties (Font: Merck).
Lanthanide Product Number Assay (%) MW (g.mol-1)
Sc 418218 99 492.16
Pr 425702 98 588.11
Gd 425176 98 604.46
ix. Titanium (IV) Isopropoxide
From Merck, this catalyst has 98 % purity, 284.25 g.mol–1 molecular
weight, and a specific weight of 0.96 g.cm-3.
x. DABCO
This catalyst was kindly offered by CPB, in the crystalline form, over 99 %
purity.
xi. Imidazole
This catalyst was kindly offered by CPB, over 99 % purity.
2.1.2 – Experimental Apparatus
An experimental set-up was designed for the synthesis of SFAE as shown
in Figure 12.
Figure 12 - Experimental apparatus for the synthesis of SFAE.
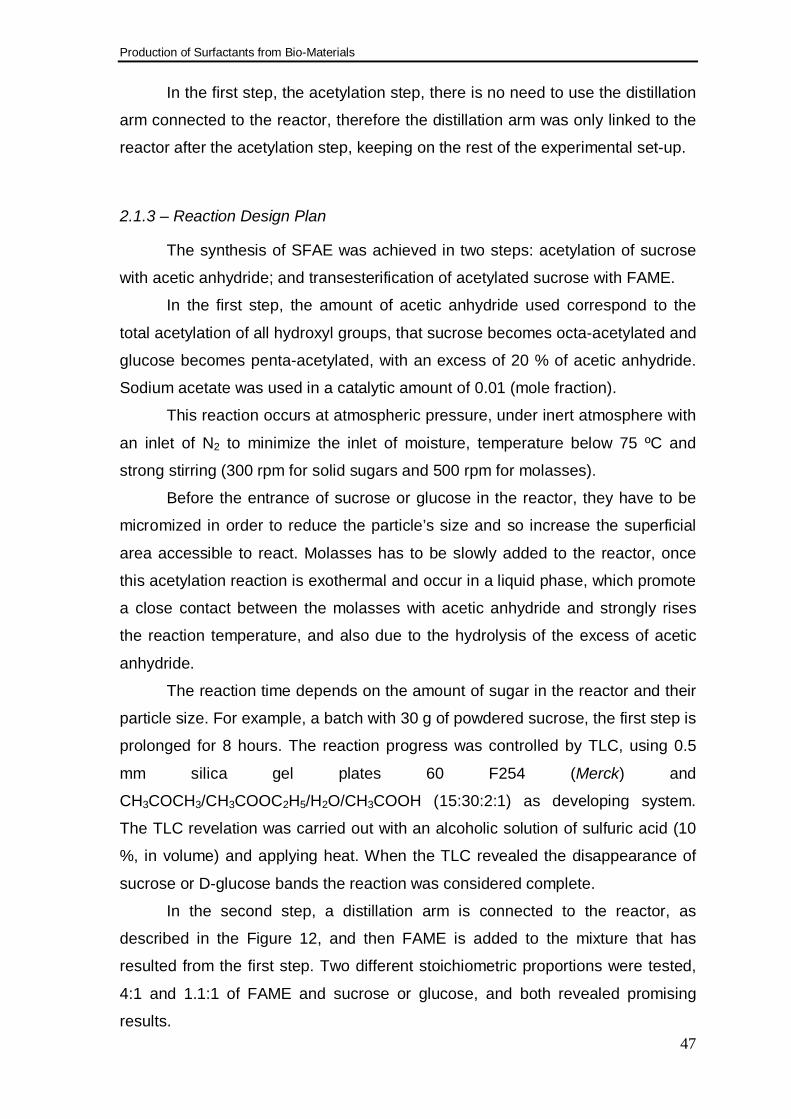
Production of Surfactants from Bio-Materials
47
In the first step, the acetylation step, there is no need to use the distillation
arm connected to the reactor, therefore the distillation arm was only linked to the
reactor after the acetylation step, keeping on the rest of the experimental set-up.
2.1.3 – Reaction Design Plan
The synthesis of SFAE was achieved in two steps: acetylation of sucrose
with acetic anhydride; and transesterification of acetylated sucrose with FAME.
In the first step, the amount of acetic anhydride used correspond to the
total acetylation of all hydroxyl groups, that sucrose becomes octa-acetylated and
glucose becomes penta-acetylated, with an excess of 20 % of acetic anhydride.
Sodium acetate was used in a catalytic amount of 0.01 (mole fraction).
This reaction occurs at atmospheric pressure, under inert atmosphere with
an inlet of N2 to minimize the inlet of moisture, temperature below 75 ºC and
strong stirring (300 rpm for solid sugars and 500 rpm for molasses).
Before the entrance of sucrose or glucose in the reactor, they have to be
micromized in order to reduce the particle’s size and so increase the superficial
area accessible to react. Molasses has to be slowly added to the reactor, once
this acetylation reaction is exothermal and occur in a liquid phase, which promote
a close contact between the molasses with acetic anhydride and strongly rises
the reaction temperature, and also due to the hydrolysis of the excess of acetic
anhydride.
The reaction time depends on the amount of sugar in the reactor and their
particle size. For example, a batch with 30 g of powdered sucrose, the first step is
prolonged for 8 hours. The reaction progress was controlled by TLC, using 0.5
mm silica gel plates 60 F254 (Merck) and
CH3COCH3/CH3COOC2H5/H2O/CH3COOH (15:30:2:1) as developing system.
The TLC revelation was carried out with an alcoholic solution of sulfuric acid (10
%, in volume) and applying heat. When the TLC revealed the disappearance of
sucrose or D-glucose bands the reaction was considered complete.
In the second step, a distillation arm is connected to the reactor, as
described in the Figure 12, and then FAME is added to the mixture that has
resulted from the first step. Two different stoichiometric proportions were tested,
4:1 and 1.1:1 of FAME and sucrose or glucose, and both revealed promising
results.
Production of Surfactants from Bio-Materials
48
For this step the temperature inside the reactor is to be kept below 80 ºC
and when the temperature reaches the value of 65 ºC the catalyst for
transesterification is added and reduced pressure is applied to the system. The
N2 tip inlet is immersed into the mixture in order to remove volatile by-products,
with the stirring as stronger as possible, typically 500 rpm.
Different catalysts were tried, but only with lanthanide triflates the results
revealed a significant better performance. The lanthanide triflates tested were
scandium triflate, praseodymium triflate and gadolinium triflate, and 0.5 % (molar)
was enough to catalyze these reactions.
Since the reaction begins a condensate appears in the top of the
distillation arm, being collected in a vessel at the end of distillation arm (Figure
12). At this point, the thermometer at the top of the distillation arm displays 36 ºC.
The terminus of this reaction is reached when the condensation of the
volatile by-product stops, even with the increase of N2 flow and increase of
temperature to 90 ºC. For the biggest batch, using 200 g of sugar, 600 g of acetic
anhydride and 250 g of FAME, approximately, in a 2 L reactor, this reaction runs
for 5 hours.
2.2 – Characterization of SFAE
To carry out FTIR and NMR experiments the product was purified in the
rotary evaporator in order to remove the acetic anhydride in excess, as well as
formed acetic acid and residual moisture.
2.2.1 – FTIR
Fourier transform infrared spectroscopy (FTIR) was used to characterize
the SFAE and the raw-materials by the identification of the main molecular
structural groups. FTIR (ATR mode) was performed in Nexus equipment from
Thermo-Nicolet using a Smart MIRacle TM ATR (Attenuated Total Reflection)
accessory, from Pike Technologies, with a ZnSe single reflection ATR heated
plate. The experiment was conducted with a resolution of 4 cm-1, 128 scans, and
measured in the range of 4000-600 cm-1.
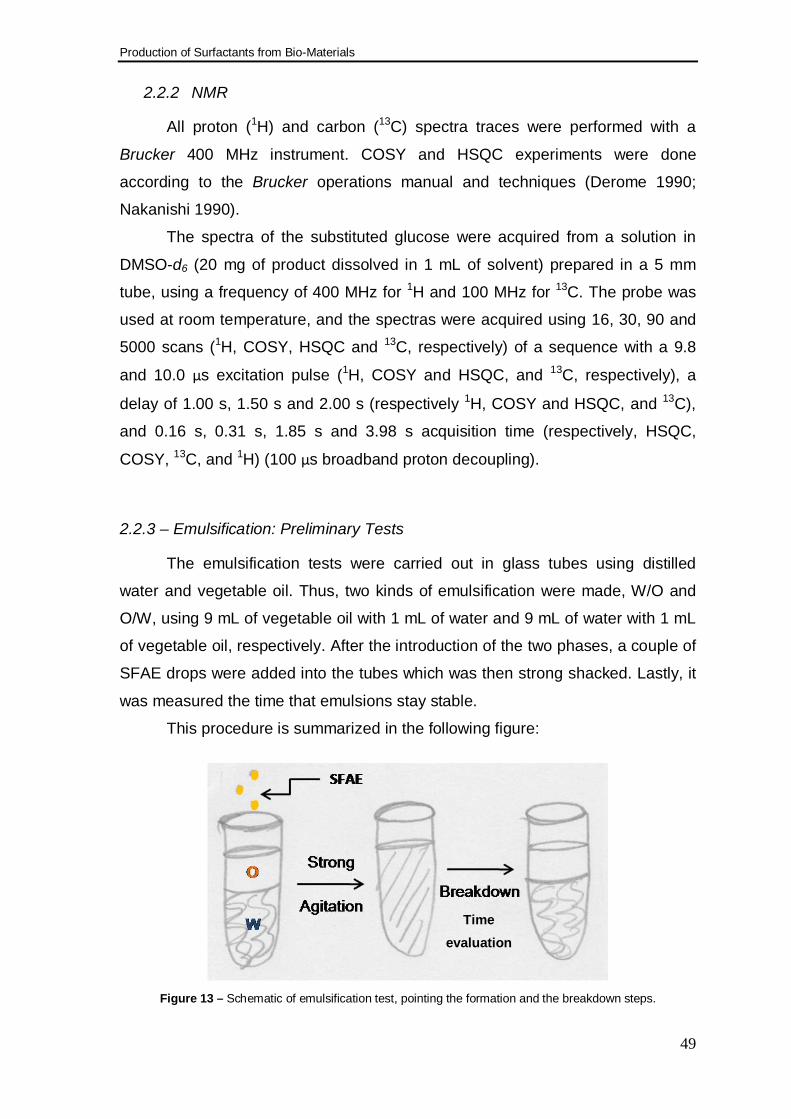
Production of Surfactants from Bio-Materials
49
2.2.2 NMR
All proton (1H) and carbon (13C) spectra traces were performed with a
Brucker 400 MHz instrument. COSY and HSQC experiments were done
according to the Brucker operations manual and techniques (Derome 1990;
Nakanishi 1990).
The spectra of the substituted glucose were acquired from a solution in
DMSO-d6 (20 mg of product dissolved in 1 mL of solvent) prepared in a 5 mm
tube, using a frequency of 400 MHz for 1H and 100 MHz for 13C. The probe was
used at room temperature, and the spectras were acquired using 16, 30, 90 and
5000 scans (1H, COSY, HSQC and 13C, respectively) of a sequence with a 9.8
and 10.0 μs excitation pulse (1H, COSY and HSQC, and 13C, respectively), a
delay of 1.00 s, 1.50 s and 2.00 s (respectively 1H, COSY and HSQC, and 13C),
and 0.16 s, 0.31 s, 1.85 s and 3.98 s acquisition time (respectively, HSQC,
COSY, 13C, and 1H) (100 μs broadband proton decoupling).
2.2.3 – Emulsification: Preliminary Tests
The emulsification tests were carried out in glass tubes using distilled
water and vegetable oil. Thus, two kinds of emulsification were made, W/O and
O/W, using 9 mL of vegetable oil with 1 mL of water and 9 mL of water with 1 mL
of vegetable oil, respectively. After the introduction of the two phases, a couple of
SFAE drops were added into the tubes which was then strong shacked. Lastly, it
was measured the time that emulsions stay stable.
This procedure is summarized in the following figure:
Figure 13 – Schematic of emulsification test, pointing the formation and the breakdown steps.
Time evaluation
Production of Surfactants from Bio-Materials
50
2.3 – Optimization of the Production Process
The production process was continuously improved in order to satisfy the
technical specifications recommended from BIOPRODUCTION project for SFAE,
such as:
• Critical Micellar Concentration lower than 100ppm;
• Able to reduce the surface tension of water below 35 mN/m;
• Cost target: < 1.3€/kg as 100% active;
• Ability to precisely control the number of C16-18 or C12-14 alkyl
chains grafted per sucrose molecule, target is 2-3 alkyl chains per
head group;
• Not producing dark colored products as those would negatively impact
the finished-product color.
Some adjustments in the molar ratio of sucrose and FAME in the reactant
mixture were performed considering the required specifications, particularly in the
number of alkyl chains grafted per head group. The use of different sugars, such
as sucrose, glucose and molasses, envisages the diversification of SFAE
applications and the cost reduction, especially with the molasses, which are the
less expensive of all.
Other adjustments were developed for in order to reduce the production
time, such as, N2 flow, stirring, reduce pressure and effective rate of volatile
products removal.
As showed in Figure 7, the transesterification is an equilibrium reaction
which can be extended to the formation of more products by removing the volatile
by-product. This can be demonstrated by the following kinetic equation:
( )[ ] [ ][ ]OHRCOORRkdtCOORRd
212 ..= (Eq. 9)
where k is the kinetic constant for the transesterification; [ ]COORR1 and [ ]OHR2
are the concentration of the antecedent ester and volatile by-product,
respectively.
Moreover, [ ]COORR1 and [ ]OHR2 are not independent due to equilibrium,
as represented by the following equation:
Production of Surfactants from Bio-Materials
51
[ ][ ][ ][ ]OHRCOORR
OHRCOORRKc21
12
..
= (Eq. 10)
where Kc is the equilibrium constant. Therefore, the equilibrium can only be
extended to the formation of more products, SFAE, with the continuously removal
of the formed volatile by-product, particularly for low concentrations of [ ]COORR1
and [ ]OHR2 , where the reverse reaction tends to dominate.
3 – Results and Discussion
3.1 – Characterization of Raw-Materials
The raw-materials (sucrose, glucose, molasses, acetic anhydride, FAME
and lauric acid) were only characterized by FTIR. For the interpretation of the
FTIR spectra a data base for frequencies was used (Coates 2000).
3.1.1 – Sucrose
A sample of sucrose was analyzed by FTIR and the obtained infrared
spectrum is presented in the Appendix II (Figure 26), where the narrow band at
3560 cm-1 corresponds to the stretching frequencies of O-H and the broad band
at 3384 cm-1 and 3329 cm-1 corresponds to normal “polymeric” stretching
frequencies of O-H. At 2941 cm-1 and 2912 cm-1, were identified C-H stretching
bands of methylene, respectively asymmetric and symmetric bands. Methylene
C-H bending band was identified at 1429 cm-1. The band at 1344 cm-1 and 1322
cm-1 can be associated with O-H bending in-plane, primary and secondary
alcohol, respectively. C-O stretching bands from alkyl substituted ether,
secondary alcohol, cyclic ether and primary alcohol were identified at 1126 cm-1,
1115 cm-1, 1066 cm-1 and 1051 cm-1, respectively. The band at 989 cm-1 was
identified as related to cyclic structure vibrations.
3.1.2 – Glucose
The FTIR spectrum of glucose is presented in the Appendix II (Figure 27),
where the broad band at 3359 cm-1 corresponds to O-H stretching of normal
Production of Surfactants from Bio-Materials
52
“polymeric” frequencies. C-H stretching bands of methylene were indentified at
2943 cm-1 and 2912 cm-1, respectively asymmetric and symmetric bands.
Methylene C-H bending band was identified at 1430 cm-1. The bands at 1340cm-1
and 1223 cm-1, were identified as O-H bending in-plane of primary and secondary
alcohols, respectively. C-O stretching bands from alkyl substituted ether,
secondary alcohol, cyclic ether and primary alcohol were identified at 1146 cm-1,
1111 cm-1, 1049 cm-1 and 1022 cm-1, respectively. The band at 995 cm-1 was
identified as related to cyclic structure vibrations.
3.1.3 – Molasses
A sample of sugar cane molasses was analyzed by FTIR and the obtained
infrared spectrum is presented in the Appendix II (Figure 28), where the broad
band at 3315 cm-1 corresponds to stretching frequencies of O-H (primary and
secondary) and some moist. C-H stretching bands were indentified at 2943 cm-1
and 2897 cm-1, respectively asymmetric and symmetric bands. At 1403 cm-1 and
1338 cm-1 were identified C-H bending frequencies, methyl and methylene,
respectively. C-O stretching bands from cyclic ether and primary alcohol, and
alkyl substituted ether and secondary alcohol, were identified at 1111 cm-1 and
1045 cm-1, respectively. The band at 991 cm-1 was identified as related to cyclic
structure vibrations. The broad band in the region lower than 900 cm-1 can be
associated with inorganic compounds that characteristic of the ash.
3.1.4 – Acetic Anhydride
The FTIR spectrum of acetic anhydride is presented in the Appendix II
(Figure 29), where the bands at 1822 cm-1 and 1751 cm-1 corresponds to a open-
chain acid anhydride. At 1429 cm-1 and 1367 cm-1, were identified as asymmetric
and symmetric C-H methyl bending, respectively. The band at 1113 cm-1 was
associated to C-O stretching.
3.1.5 – FAME
A sample of FAME from rapeseed oil was analyzed by FTIR and the
obtained infrared spectrum is presented in the Appendix II (Figure 30). In this
Production of Surfactants from Bio-Materials
53
spectrum, the following bands where indentified: C-H stretching at 2928 cm-1 and
2859 cm-1, asymmetric and symmetric vibrations, respectively; an ester band at
1747 cm-1; C-H bending vibrations at 1462 cm-1, 1438 cm-1 and 1366 cm-1
characteristics of asymmetric methyl, asymmetric methylene and symmetric
methyl, respectively; and (CH2)n rocking vibrations at 723 cm-1. Were also
identified bands associated with C=C bonds, namely C-H stretching at 3010 cm-1
and C-H bending out-of-plane at 1010 cm-1.
3.1.6 – Lauric Acid
The FTIR spectrum of lauric acid is presented in the Appendix II (Figure
31), where the bands at 2953 cm-1, 2914 cm-1, 2870 cm-1 and 2848 cm-1, were
identified as C-H stretching of methyl asymmetric, methylene asymmetric, methyl
symmetric and methylene symmetric, respectively. At 1697 cm-1, was identified a
carboxylic acid band. Methyl and methylene C-H bending vibrations were
identified at 1470 cm-1 and 1429 cm-1, respectively. C-O stretching and O-H out-
of-plane frequencies were identified at 1302 cm-1 and 935 cm-1, respectively.
Were also identified a band associated with (CH2)n rocking vibrations at 721 cm-1.
3.2 – Characterization of SFAE
For the SFAE characterization some techniques where used, namely:
• FTIR
• NMR
• Calculation of the HLB number
• Preliminary test of emulsification
The results obtained from BIOPRODUCTION project partners are also
mentioned in this point.
3.2.1 – FTIR
The presented FTIR spectra of the SFAE result from the different raw-
materials tested in this work.
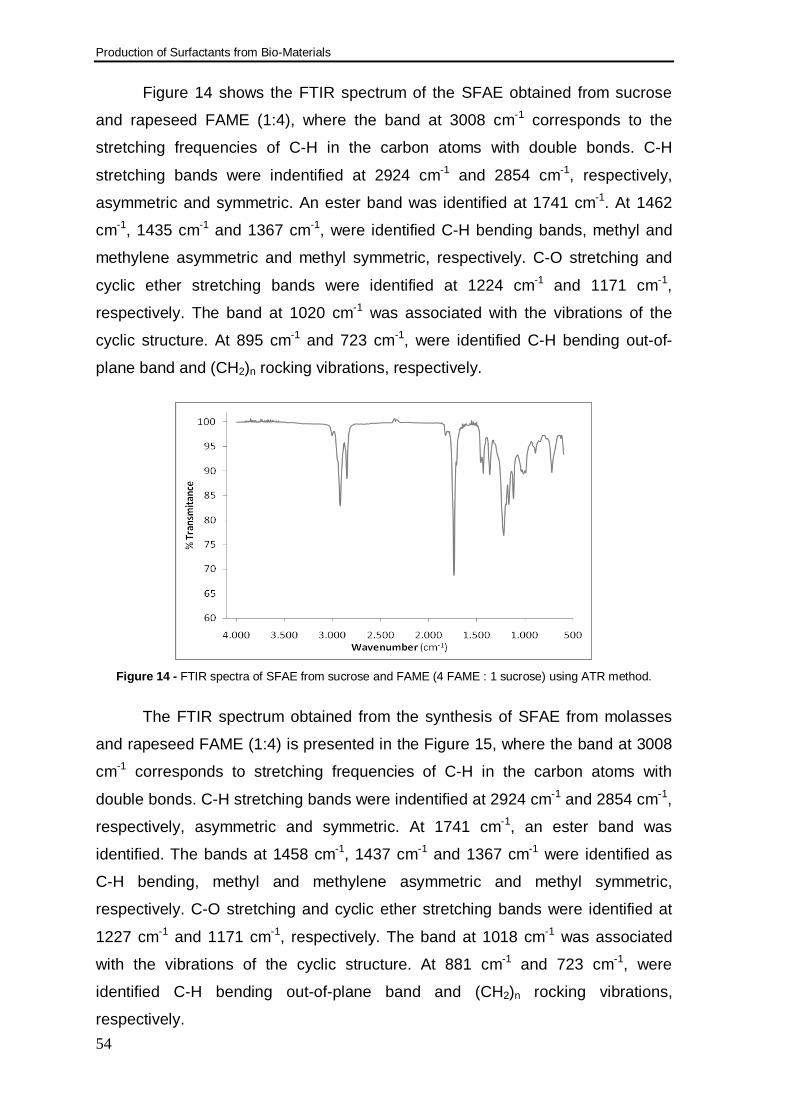
Production of Surfactants from Bio-Materials
54
Figure 14 shows the FTIR spectrum of the SFAE obtained from sucrose
and rapeseed FAME (1:4), where the band at 3008 cm-1 corresponds to the
stretching frequencies of C-H in the carbon atoms with double bonds. C-H
stretching bands were indentified at 2924 cm-1 and 2854 cm-1, respectively,
asymmetric and symmetric. An ester band was identified at 1741 cm-1. At 1462
cm-1, 1435 cm-1 and 1367 cm-1, were identified C-H bending bands, methyl and
methylene asymmetric and methyl symmetric, respectively. C-O stretching and
cyclic ether stretching bands were identified at 1224 cm-1 and 1171 cm-1,
respectively. The band at 1020 cm-1 was associated with the vibrations of the
cyclic structure. At 895 cm-1 and 723 cm-1, were identified C-H bending out-of-
plane band and (CH2)n rocking vibrations, respectively.
Figure 14 - FTIR spectra of SFAE from sucrose and FAME (4 FAME : 1 sucrose) using ATR method.
The FTIR spectrum obtained from the synthesis of SFAE from molasses
and rapeseed FAME (1:4) is presented in the Figure 15, where the band at 3008
cm-1 corresponds to stretching frequencies of C-H in the carbon atoms with
double bonds. C-H stretching bands were indentified at 2924 cm-1 and 2854 cm-1,
respectively, asymmetric and symmetric. At 1741 cm-1, an ester band was
identified. The bands at 1458 cm-1, 1437 cm-1 and 1367 cm-1 were identified as
C-H bending, methyl and methylene asymmetric and methyl symmetric,
respectively. C-O stretching and cyclic ether stretching bands were identified at
1227 cm-1 and 1171 cm-1, respectively. The band at 1018 cm-1 was associated
with the vibrations of the cyclic structure. At 881 cm-1 and 723 cm-1, were
identified C-H bending out-of-plane band and (CH2)n rocking vibrations,
respectively.
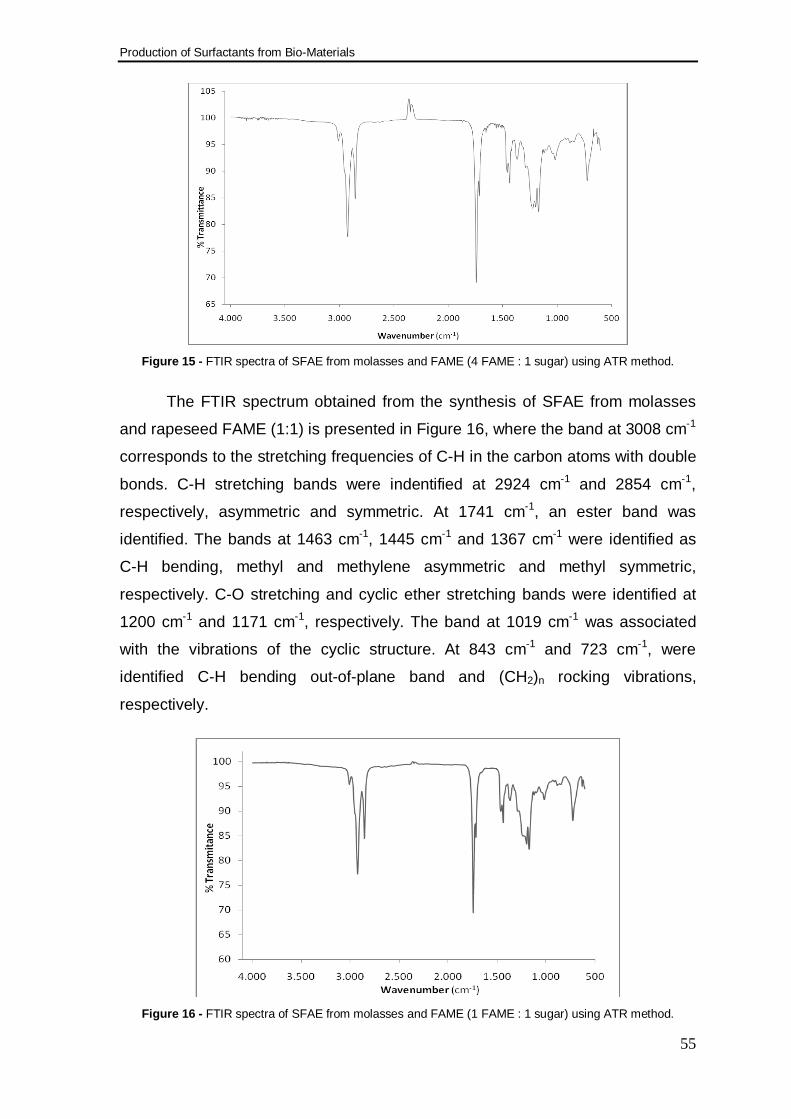
Production of Surfactants from Bio-Materials
55
Figure 15 - FTIR spectra of SFAE from molasses and FAME (4 FAME : 1 sugar) using ATR method.
The FTIR spectrum obtained from the synthesis of SFAE from molasses
and rapeseed FAME (1:1) is presented in Figure 16, where the band at 3008 cm-1
corresponds to the stretching frequencies of C-H in the carbon atoms with double
bonds. C-H stretching bands were indentified at 2924 cm-1 and 2854 cm-1,
respectively, asymmetric and symmetric. At 1741 cm-1, an ester band was
identified. The bands at 1463 cm-1, 1445 cm-1 and 1367 cm-1 were identified as
C-H bending, methyl and methylene asymmetric and methyl symmetric,
respectively. C-O stretching and cyclic ether stretching bands were identified at
1200 cm-1 and 1171 cm-1, respectively. The band at 1019 cm-1 was associated
with the vibrations of the cyclic structure. At 843 cm-1 and 723 cm-1, were
identified C-H bending out-of-plane band and (CH2)n rocking vibrations,
respectively.
Figure 16 - FTIR spectra of SFAE from molasses and FAME (1 FAME : 1 sugar) using ATR method.
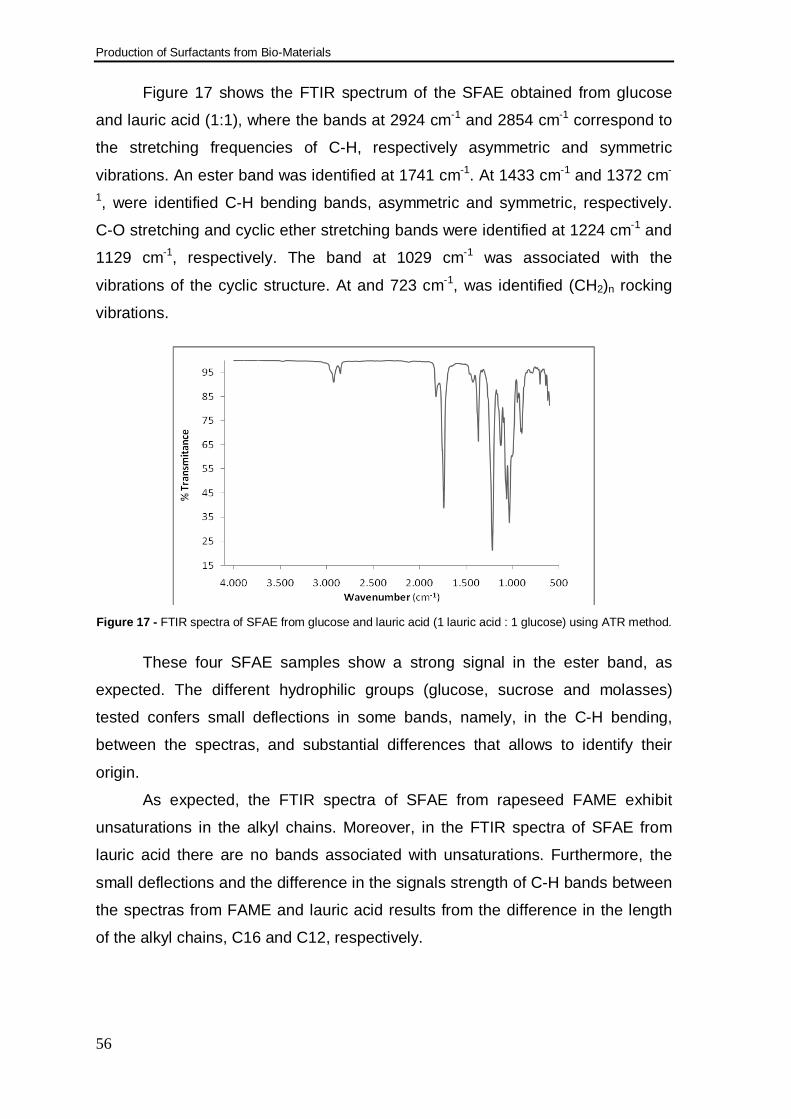
Production of Surfactants from Bio-Materials
56
Figure 17 shows the FTIR spectrum of the SFAE obtained from glucose
and lauric acid (1:1), where the bands at 2924 cm-1 and 2854 cm-1 correspond to
the stretching frequencies of C-H, respectively asymmetric and symmetric
vibrations. An ester band was identified at 1741 cm-1. At 1433 cm-1 and 1372 cm-
1, were identified C-H bending bands, asymmetric and symmetric, respectively.
C-O stretching and cyclic ether stretching bands were identified at 1224 cm-1 and
1129 cm-1, respectively. The band at 1029 cm-1 was associated with the
vibrations of the cyclic structure. At and 723 cm-1, was identified (CH2)n rocking
vibrations.
Figure 17 - FTIR spectra of SFAE from glucose and lauric acid (1 lauric acid : 1 glucose) using ATR method.
These four SFAE samples show a strong signal in the ester band, as
expected. The different hydrophilic groups (glucose, sucrose and molasses)
tested confers small deflections in some bands, namely, in the C-H bending,
between the spectras, and substantial differences that allows to identify their
origin.
As expected, the FTIR spectra of SFAE from rapeseed FAME exhibit
unsaturations in the alkyl chains. Moreover, in the FTIR spectra of SFAE from
lauric acid there are no bands associated with unsaturations. Furthermore, the
small deflections and the difference in the signals strength of C-H bands between
the spectras from FAME and lauric acid results from the difference in the length
of the alkyl chains, C16 and C12, respectively.
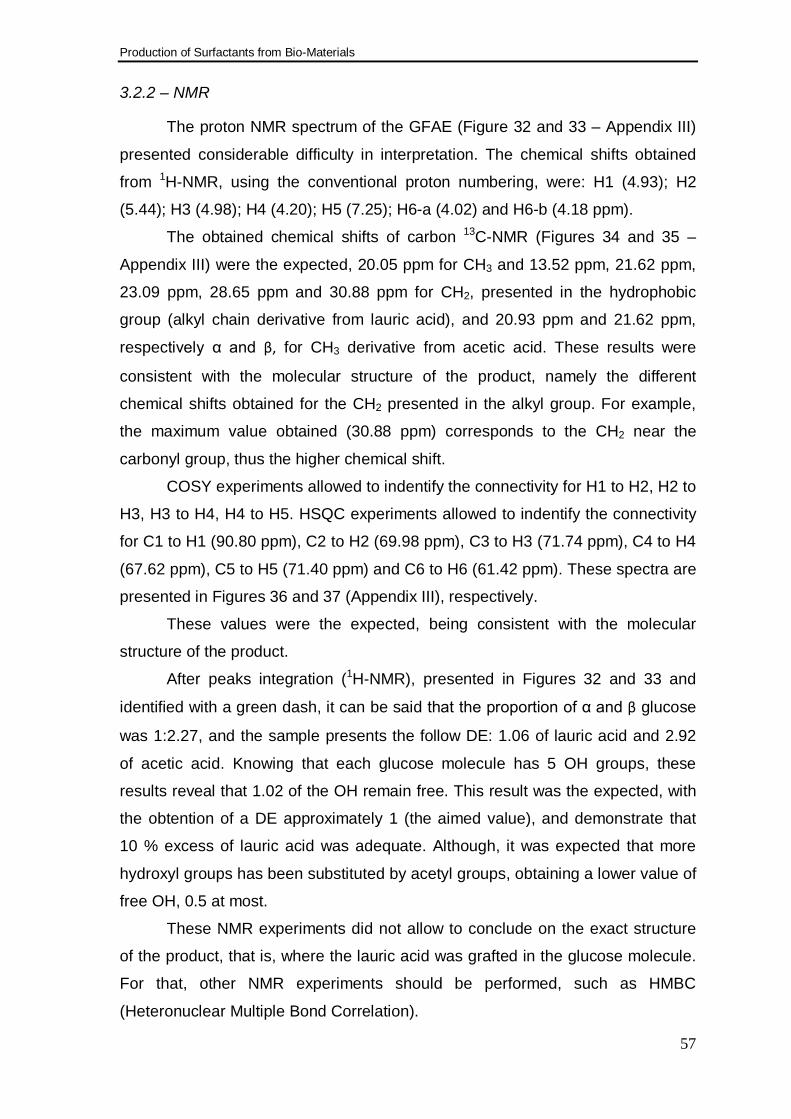
Production of Surfactants from Bio-Materials
57
3.2.2 – NMR
The proton NMR spectrum of the GFAE (Figure 32 and 33 – Appendix III)
presented considerable difficulty in interpretation. The chemical shifts obtained
from 1H-NMR, using the conventional proton numbering, were: H1 (4.93); H2
(5.44); H3 (4.98); H4 (4.20); H5 (7.25); H6-a (4.02) and H6-b (4.18 ppm).
The obtained chemical shifts of carbon 13C-NMR (Figures 34 and 35 –
Appendix III) were the expected, 20.05 ppm for CH3 and 13.52 ppm, 21.62 ppm,
23.09 ppm, 28.65 ppm and 30.88 ppm for CH2, presented in the hydrophobic
group (alkyl chain derivative from lauric acid), and 20.93 ppm and 21.62 ppm,
respectively α and β, for CH3 derivative from acetic acid. These results were
consistent with the molecular structure of the product, namely the different
chemical shifts obtained for the CH2 presented in the alkyl group. For example,
the maximum value obtained (30.88 ppm) corresponds to the CH2 near the
carbonyl group, thus the higher chemical shift.
COSY experiments allowed to indentify the connectivity for H1 to H2, H2 to
H3, H3 to H4, H4 to H5. HSQC experiments allowed to indentify the connectivity
for C1 to H1 (90.80 ppm), C2 to H2 (69.98 ppm), C3 to H3 (71.74 ppm), C4 to H4
(67.62 ppm), C5 to H5 (71.40 ppm) and C6 to H6 (61.42 ppm). These spectra are
presented in Figures 36 and 37 (Appendix III), respectively.
These values were the expected, being consistent with the molecular
structure of the product.
After peaks integration (1H-NMR), presented in Figures 32 and 33 and
identified with a green dash, it can be said that the proportion of α and β glucose
was 1:2.27, and the sample presents the follow DE: 1.06 of lauric acid and 2.92
of acetic acid. Knowing that each glucose molecule has 5 OH groups, these
results reveal that 1.02 of the OH remain free. This result was the expected, with
the obtention of a DE approximately 1 (the aimed value), and demonstrate that
10 % excess of lauric acid was adequate. Although, it was expected that more
hydroxyl groups has been substituted by acetyl groups, obtaining a lower value of
free OH, 0.5 at most.
These NMR experiments did not allow to conclude on the exact structure
of the product, that is, where the lauric acid was grafted in the glucose molecule.
For that, other NMR experiments should be performed, such as HMBC
(Heteronuclear Multiple Bond Correlation).
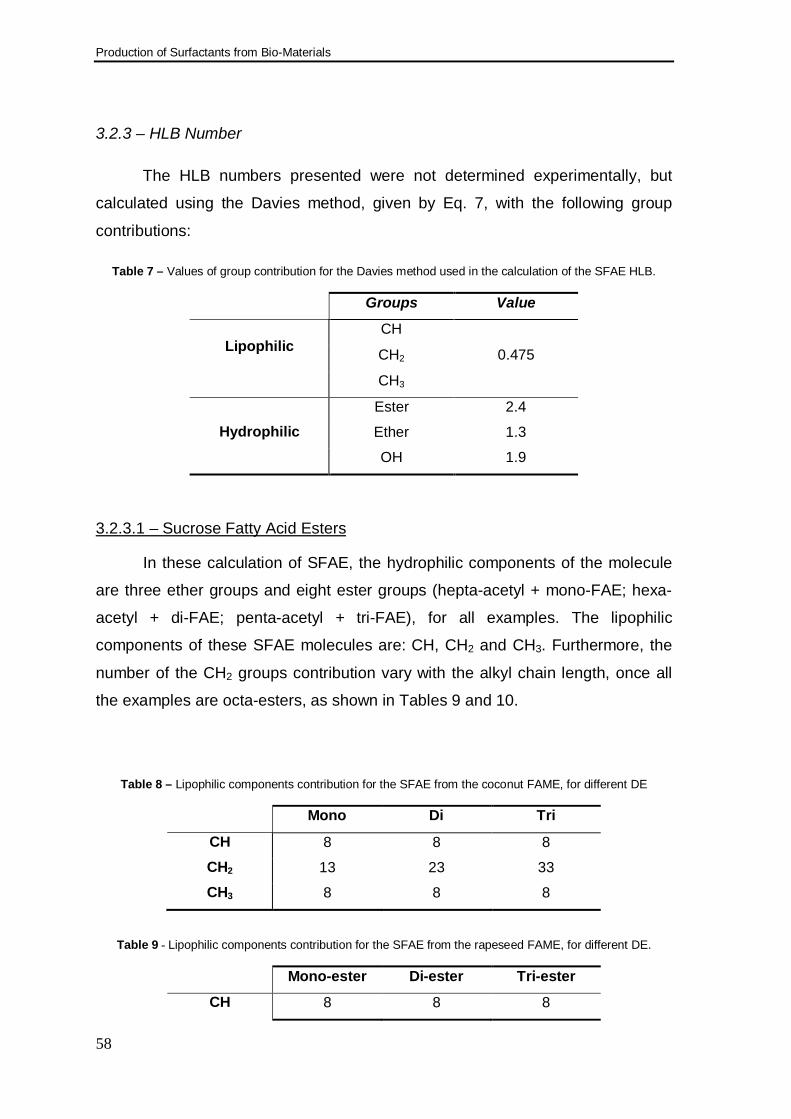
Production of Surfactants from Bio-Materials
58
3.2.3 – HLB Number
The HLB numbers presented were not determined experimentally, but
calculated using the Davies method, given by Eq. 7, with the following group
contributions:
Table 7 – Values of group contribution for the Davies method used in the calculation of the SFAE HLB.
Groups Value
Lipophilic
CH
0.475 CH2
CH3
Hydrophilic Ester 2.4
Ether 1.3
OH 1.9
3.2.3.1 – Sucrose Fatty Acid Esters
In these calculation of SFAE, the hydrophilic components of the molecule
are three ether groups and eight ester groups (hepta-acetyl + mono-FAE; hexa-
acetyl + di-FAE; penta-acetyl + tri-FAE), for all examples. The lipophilic
components of these SFAE molecules are: CH, CH2 and CH3. Furthermore, the
number of the CH2 groups contribution vary with the alkyl chain length, once all
the examples are octa-esters, as shown in Tables 9 and 10.
Table 8 – Lipophilic components contribution for the SFAE from the coconut FAME, for different DE
Mono Di Tri
CH 8 8 8
CH2 13 23 33
CH3 8 8 8
Table 9 - Lipophilic components contribution for the SFAE from the rapeseed FAME, for different DE.
Mono-ester Di-ester Tri-ester
CH 8 8 8
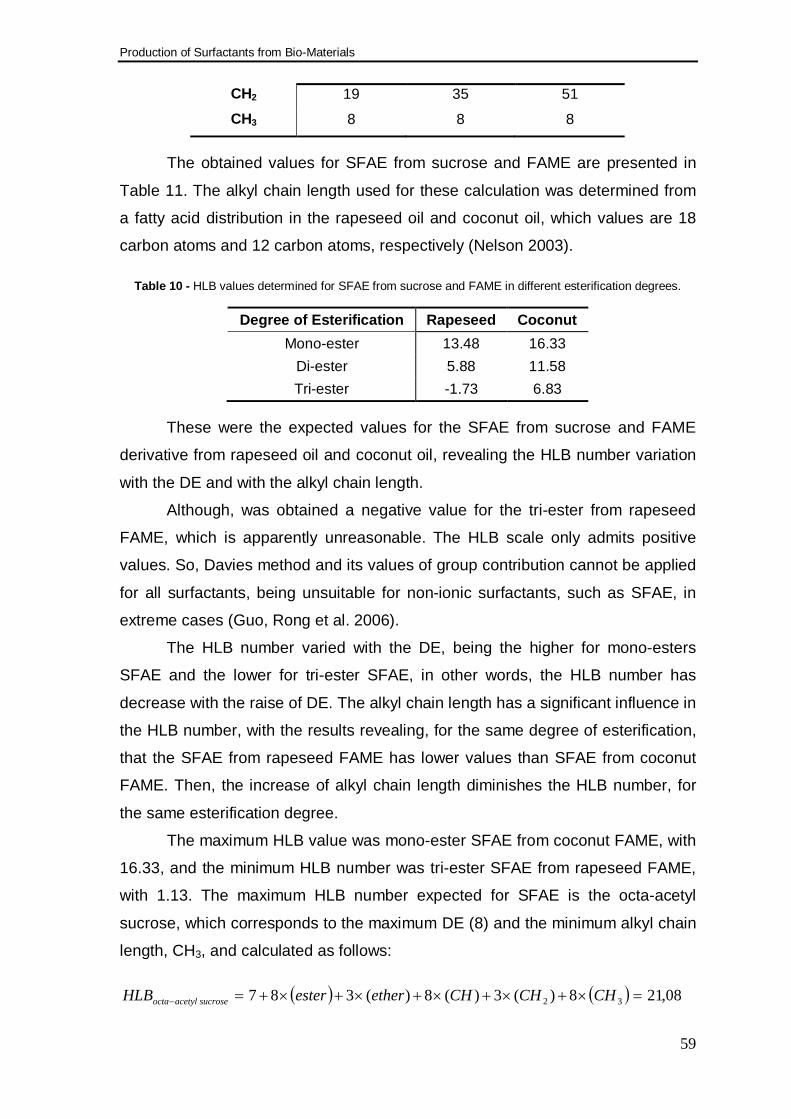
Production of Surfactants from Bio-Materials
59
CH2 19 35 51
CH3 8 8 8
The obtained values for SFAE from sucrose and FAME are presented in
Table 11. The alkyl chain length used for these calculation was determined from
a fatty acid distribution in the rapeseed oil and coconut oil, which values are 18
carbon atoms and 12 carbon atoms, respectively (Nelson 2003).
Table 10 - HLB values determined for SFAE from sucrose and FAME in different esterification degrees.
Degree of Esterification Rapeseed Coconut Mono-ester 13.48 16.33
Di-ester 5.88 11.58 Tri-ester -1.73 6.83
These were the expected values for the SFAE from sucrose and FAME
derivative from rapeseed oil and coconut oil, revealing the HLB number variation
with the DE and with the alkyl chain length.
Although, was obtained a negative value for the tri-ester from rapeseed
FAME, which is apparently unreasonable. The HLB scale only admits positive
values. So, Davies method and its values of group contribution cannot be applied
for all surfactants, being unsuitable for non-ionic surfactants, such as SFAE, in
extreme cases (Guo, Rong et al. 2006).
The HLB number varied with the DE, being the higher for mono-esters
SFAE and the lower for tri-ester SFAE, in other words, the HLB number has
decrease with the raise of DE. The alkyl chain length has a significant influence in
the HLB number, with the results revealing, for the same degree of esterification,
that the SFAE from rapeseed FAME has lower values than SFAE from coconut
FAME. Then, the increase of alkyl chain length diminishes the HLB number, for
the same esterification degree.
The maximum HLB value was mono-ester SFAE from coconut FAME, with
16.33, and the minimum HLB number was tri-ester SFAE from rapeseed FAME,
with 1.13. The maximum HLB number expected for SFAE is the octa-acetyl
sucrose, which corresponds to the maximum DE (8) and the minimum alkyl chain
length, CH3, and calculated as follows:
( ) ( ) 08,218)(3)(8)(387 32 =×+×+×+×+×+=− CHCHCHetheresterHLB sucroseacetylocta
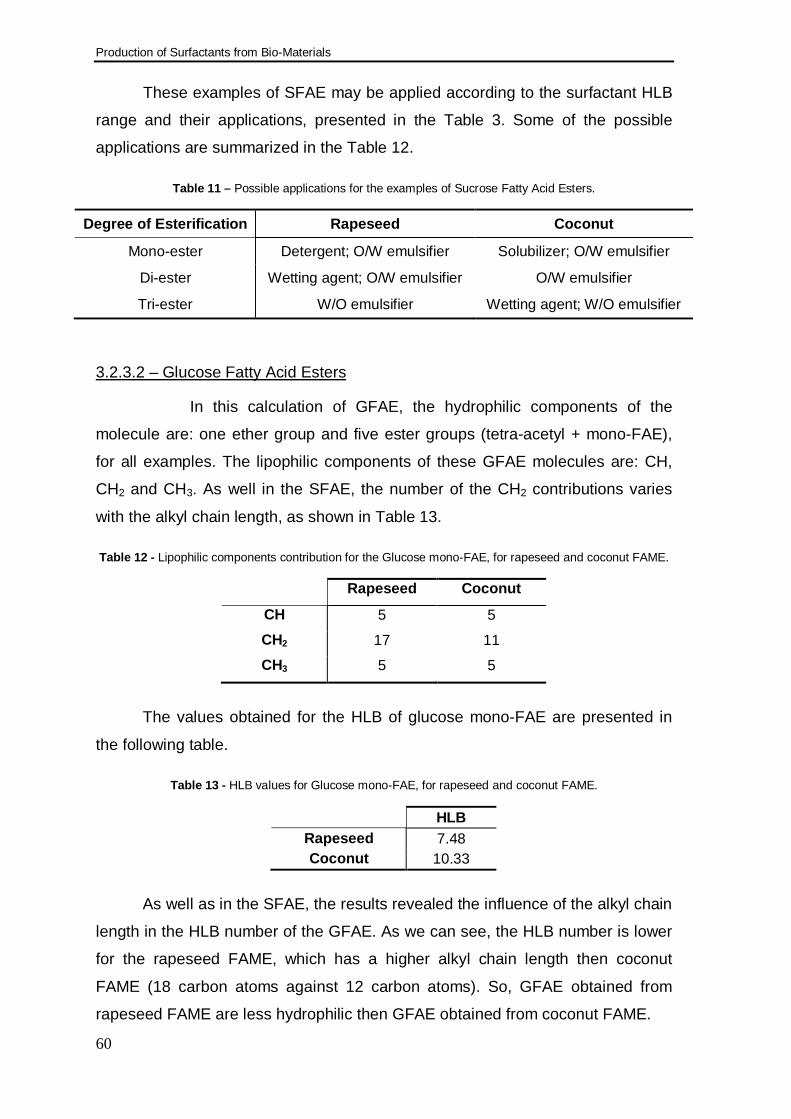
Production of Surfactants from Bio-Materials
60
These examples of SFAE may be applied according to the surfactant HLB
range and their applications, presented in the Table 3. Some of the possible
applications are summarized in the Table 12.
Table 11 – Possible applications for the examples of Sucrose Fatty Acid Esters.
Degree of Esterification Rapeseed Coconut
Mono-ester Detergent; O/W emulsifier Solubilizer; O/W emulsifier
Di-ester Wetting agent; O/W emulsifier O/W emulsifier
Tri-ester W/O emulsifier Wetting agent; W/O emulsifier
3.2.3.2 – Glucose Fatty Acid Esters
In this calculation of GFAE, the hydrophilic components of the
molecule are: one ether group and five ester groups (tetra-acetyl + mono-FAE),
for all examples. The lipophilic components of these GFAE molecules are: CH,
CH2 and CH3. As well in the SFAE, the number of the CH2 contributions varies
with the alkyl chain length, as shown in Table 13.
Table 12 - Lipophilic components contribution for the Glucose mono-FAE, for rapeseed and coconut FAME.
Rapeseed Coconut
CH 5 5
CH2 17 11
CH3 5 5
The values obtained for the HLB of glucose mono-FAE are presented in
the following table.
Table 13 - HLB values for Glucose mono-FAE, for rapeseed and coconut FAME.
HLB Rapeseed 7.48 Coconut 10.33
As well as in the SFAE, the results revealed the influence of the alkyl chain
length in the HLB number of the GFAE. As we can see, the HLB number is lower
for the rapeseed FAME, which has a higher alkyl chain length then coconut
FAME (18 carbon atoms against 12 carbon atoms). So, GFAE obtained from
rapeseed FAME are less hydrophilic then GFAE obtained from coconut FAME.
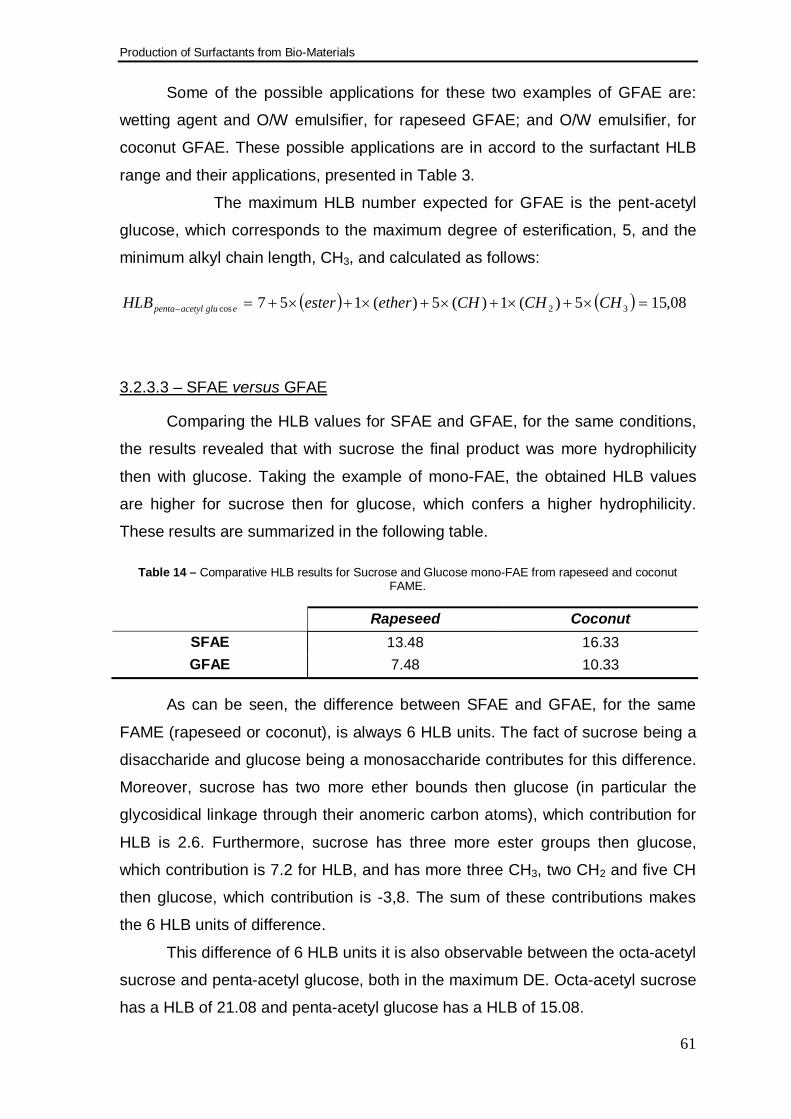
Production of Surfactants from Bio-Materials
61
Some of the possible applications for these two examples of GFAE are:
wetting agent and O/W emulsifier, for rapeseed GFAE; and O/W emulsifier, for
coconut GFAE. These possible applications are in accord to the surfactant HLB
range and their applications, presented in Table 3.
The maximum HLB number expected for GFAE is the pent-acetyl
glucose, which corresponds to the maximum degree of esterification, 5, and the
minimum alkyl chain length, CH3, and calculated as follows:
( ) ( ) 08,155)(1)(5)(157 32cos =×+×+×+×+×+=− CHCHCHetheresterHLB egluacetylpenta
3.2.3.3 – SFAE versus GFAE
Comparing the HLB values for SFAE and GFAE, for the same conditions,
the results revealed that with sucrose the final product was more hydrophilicity
then with glucose. Taking the example of mono-FAE, the obtained HLB values
are higher for sucrose then for glucose, which confers a higher hydrophilicity.
These results are summarized in the following table.
Table 14 – Comparative HLB results for Sucrose and Glucose mono-FAE from rapeseed and coconut FAME.
Rapeseed Coconut SFAE 13.48 16.33 GFAE 7.48 10.33
As can be seen, the difference between SFAE and GFAE, for the same
FAME (rapeseed or coconut), is always 6 HLB units. The fact of sucrose being a
disaccharide and glucose being a monosaccharide contributes for this difference.
Moreover, sucrose has two more ether bounds then glucose (in particular the
glycosidical linkage through their anomeric carbon atoms), which contribution for
HLB is 2.6. Furthermore, sucrose has three more ester groups then glucose,
which contribution is 7.2 for HLB, and has more three CH3, two CH2 and five CH
then glucose, which contribution is -3,8. The sum of these contributions makes
the 6 HLB units of difference.
This difference of 6 HLB units it is also observable between the octa-acetyl
sucrose and penta-acetyl glucose, both in the maximum DE. Octa-acetyl sucrose
has a HLB of 21.08 and penta-acetyl glucose has a HLB of 15.08.
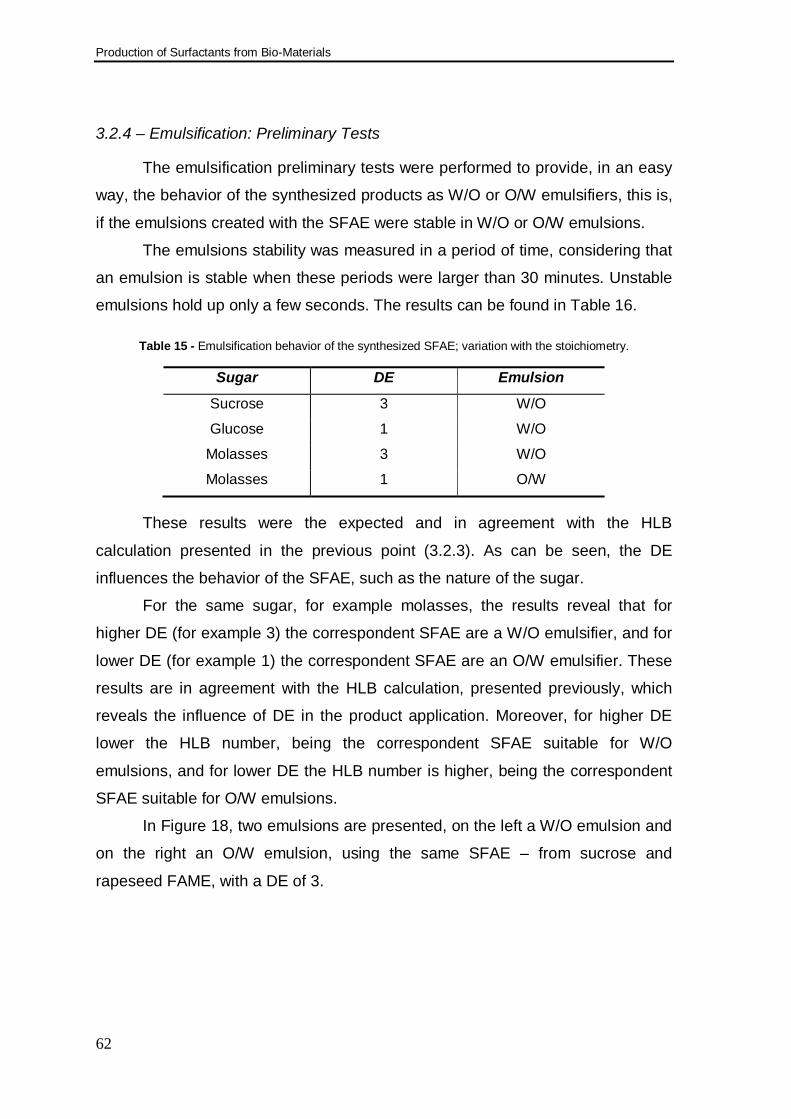
Production of Surfactants from Bio-Materials
62
3.2.4 – Emulsification: Preliminary Tests
The emulsification preliminary tests were performed to provide, in an easy
way, the behavior of the synthesized products as W/O or O/W emulsifiers, this is,
if the emulsions created with the SFAE were stable in W/O or O/W emulsions.
The emulsions stability was measured in a period of time, considering that
an emulsion is stable when these periods were larger than 30 minutes. Unstable
emulsions hold up only a few seconds. The results can be found in Table 16.
Table 15 - Emulsification behavior of the synthesized SFAE; variation with the stoichiometry.
Sugar DE Emulsion
Sucrose 3 W/O
Glucose 1 W/O
Molasses 3 W/O
Molasses 1 O/W
These results were the expected and in agreement with the HLB
calculation presented in the previous point (3.2.3). As can be seen, the DE
influences the behavior of the SFAE, such as the nature of the sugar.
For the same sugar, for example molasses, the results reveal that for
higher DE (for example 3) the correspondent SFAE are a W/O emulsifier, and for
lower DE (for example 1) the correspondent SFAE are an O/W emulsifier. These
results are in agreement with the HLB calculation, presented previously, which
reveals the influence of DE in the product application. Moreover, for higher DE
lower the HLB number, being the correspondent SFAE suitable for W/O
emulsions, and for lower DE the HLB number is higher, being the correspondent
SFAE suitable for O/W emulsions.
In Figure 18, two emulsions are presented, on the left a W/O emulsion and
on the right an O/W emulsion, using the same SFAE – from sucrose and
rapeseed FAME, with a DE of 3.
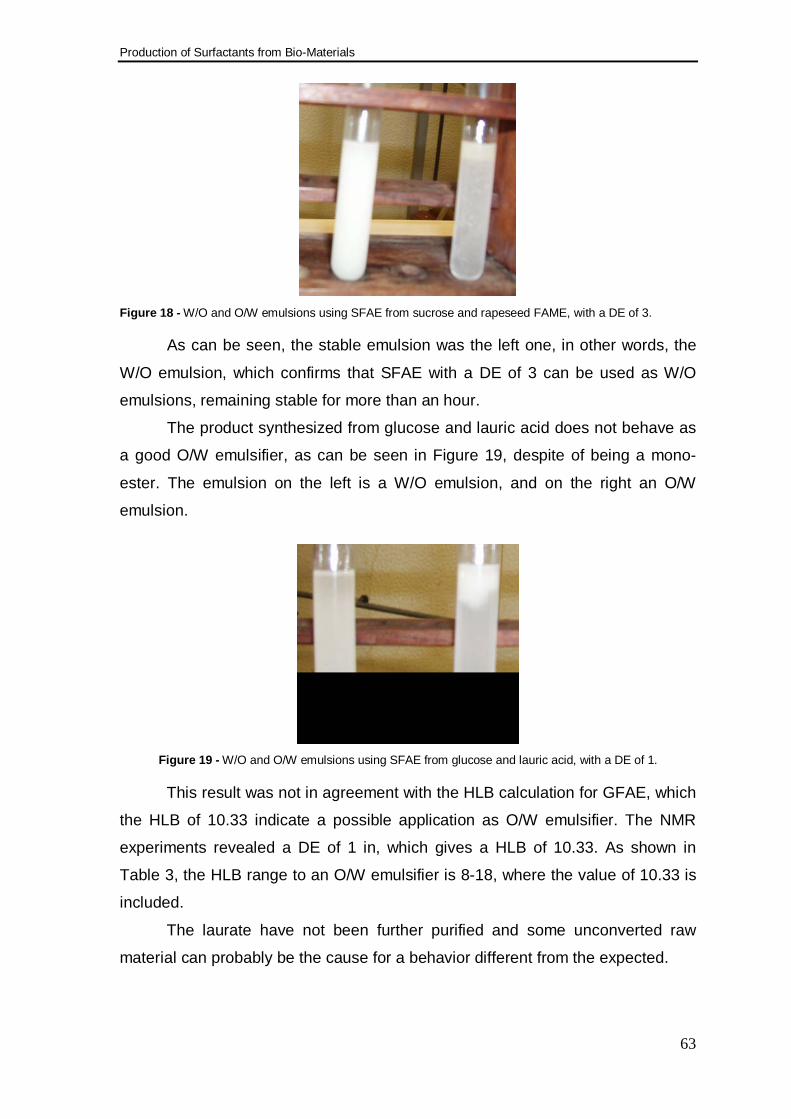
Production of Surfactants from Bio-Materials
63
Figure 18 - W/O and O/W emulsions using SFAE from sucrose and rapeseed FAME, with a DE of 3.
As can be seen, the stable emulsion was the left one, in other words, the
W/O emulsion, which confirms that SFAE with a DE of 3 can be used as W/O
emulsions, remaining stable for more than an hour.
The product synthesized from glucose and lauric acid does not behave as
a good O/W emulsifier, as can be seen in Figure 19, despite of being a mono-
ester. The emulsion on the left is a W/O emulsion, and on the right an O/W
emulsion.
Figure 19 - W/O and O/W emulsions using SFAE from glucose and lauric acid, with a DE of 1.
This result was not in agreement with the HLB calculation for GFAE, which
the HLB of 10.33 indicate a possible application as O/W emulsifier. The NMR
experiments revealed a DE of 1 in, which gives a HLB of 10.33. As shown in
Table 3, the HLB range to an O/W emulsifier is 8-18, where the value of 10.33 is
included.
The laurate have not been further purified and some unconverted raw
material can probably be the cause for a behavior different from the expected.
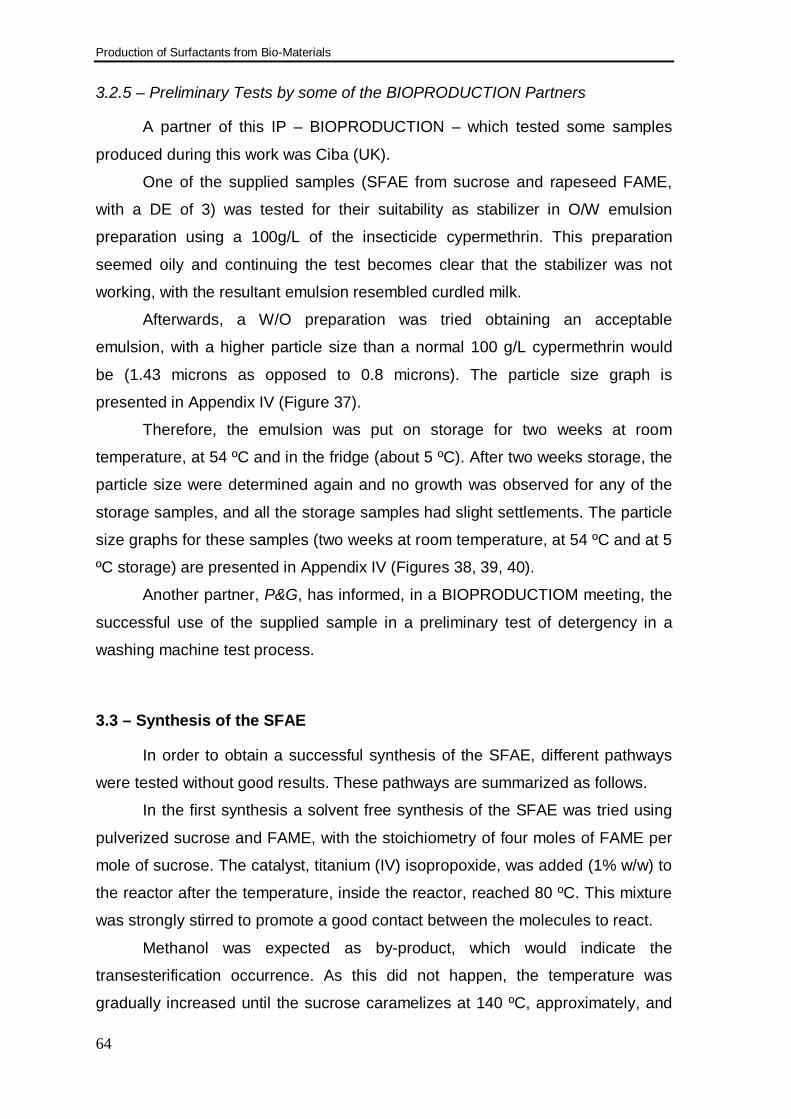
Production of Surfactants from Bio-Materials
64
3.2.5 – Preliminary Tests by some of the BIOPRODUCTION Partners
A partner of this IP – BIOPRODUCTION – which tested some samples
produced during this work was Ciba (UK).
One of the supplied samples (SFAE from sucrose and rapeseed FAME,
with a DE of 3) was tested for their suitability as stabilizer in O/W emulsion
preparation using a 100g/L of the insecticide cypermethrin. This preparation
seemed oily and continuing the test becomes clear that the stabilizer was not
working, with the resultant emulsion resembled curdled milk.
Afterwards, a W/O preparation was tried obtaining an acceptable
emulsion, with a higher particle size than a normal 100 g/L cypermethrin would
be (1.43 microns as opposed to 0.8 microns). The particle size graph is
presented in Appendix IV (Figure 37).
Therefore, the emulsion was put on storage for two weeks at room
temperature, at 54 ºC and in the fridge (about 5 ºC). After two weeks storage, the
particle size were determined again and no growth was observed for any of the
storage samples, and all the storage samples had slight settlements. The particle
size graphs for these samples (two weeks at room temperature, at 54 ºC and at 5
ºC storage) are presented in Appendix IV (Figures 38, 39, 40).
Another partner, P&G, has informed, in a BIOPRODUCTIOM meeting, the
successful use of the supplied sample in a preliminary test of detergency in a
washing machine test process.
3.3 – Synthesis of the SFAE
In order to obtain a successful synthesis of the SFAE, different pathways
were tested without good results. These pathways are summarized as follows.
In the first synthesis a solvent free synthesis of the SFAE was tried using
pulverized sucrose and FAME, with the stoichiometry of four moles of FAME per
mole of sucrose. The catalyst, titanium (IV) isopropoxide, was added (1% w/w) to
the reactor after the temperature, inside the reactor, reached 80 ºC. This mixture
was strongly stirred to promote a good contact between the molecules to react.
Methanol was expected as by-product, which would indicate the
transesterification occurrence. As this did not happen, the temperature was
gradually increased until the sucrose caramelizes at 140 ºC, approximately, and
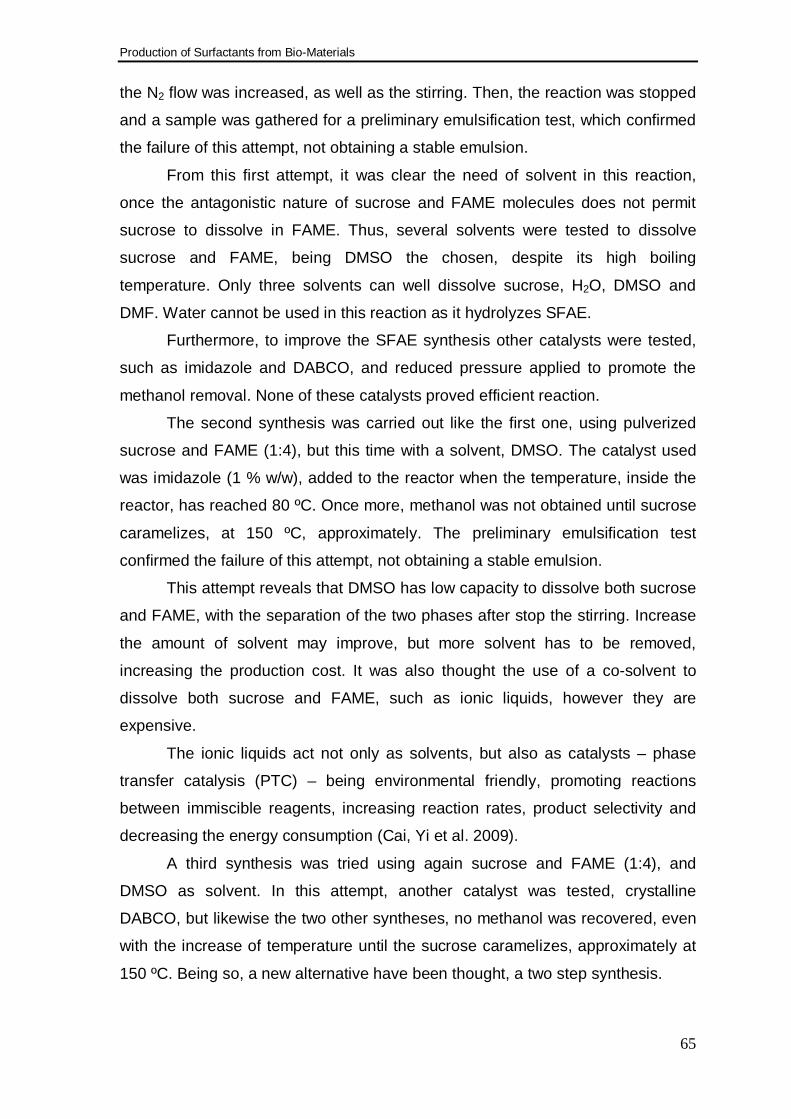
Production of Surfactants from Bio-Materials
65
the N2 flow was increased, as well as the stirring. Then, the reaction was stopped
and a sample was gathered for a preliminary emulsification test, which confirmed
the failure of this attempt, not obtaining a stable emulsion.
From this first attempt, it was clear the need of solvent in this reaction,
once the antagonistic nature of sucrose and FAME molecules does not permit
sucrose to dissolve in FAME. Thus, several solvents were tested to dissolve
sucrose and FAME, being DMSO the chosen, despite its high boiling
temperature. Only three solvents can well dissolve sucrose, H2O, DMSO and
DMF. Water cannot be used in this reaction as it hydrolyzes SFAE.
Furthermore, to improve the SFAE synthesis other catalysts were tested,
such as imidazole and DABCO, and reduced pressure applied to promote the
methanol removal. None of these catalysts proved efficient reaction.
The second synthesis was carried out like the first one, using pulverized
sucrose and FAME (1:4), but this time with a solvent, DMSO. The catalyst used
was imidazole (1 % w/w), added to the reactor when the temperature, inside the
reactor, has reached 80 ºC. Once more, methanol was not obtained until sucrose
caramelizes, at 150 ºC, approximately. The preliminary emulsification test
confirmed the failure of this attempt, not obtaining a stable emulsion.
This attempt reveals that DMSO has low capacity to dissolve both sucrose
and FAME, with the separation of the two phases after stop the stirring. Increase
the amount of solvent may improve, but more solvent has to be removed,
increasing the production cost. It was also thought the use of a co-solvent to
dissolve both sucrose and FAME, such as ionic liquids, however they are
expensive.
The ionic liquids act not only as solvents, but also as catalysts – phase
transfer catalysis (PTC) – being environmental friendly, promoting reactions
between immiscible reagents, increasing reaction rates, product selectivity and
decreasing the energy consumption (Cai, Yi et al. 2009).
A third synthesis was tried using again sucrose and FAME (1:4), and
DMSO as solvent. In this attempt, another catalyst was tested, crystalline
DABCO, but likewise the two other syntheses, no methanol was recovered, even
with the increase of temperature until the sucrose caramelizes, approximately at
150 ºC. Being so, a new alternative have been thought, a two step synthesis.
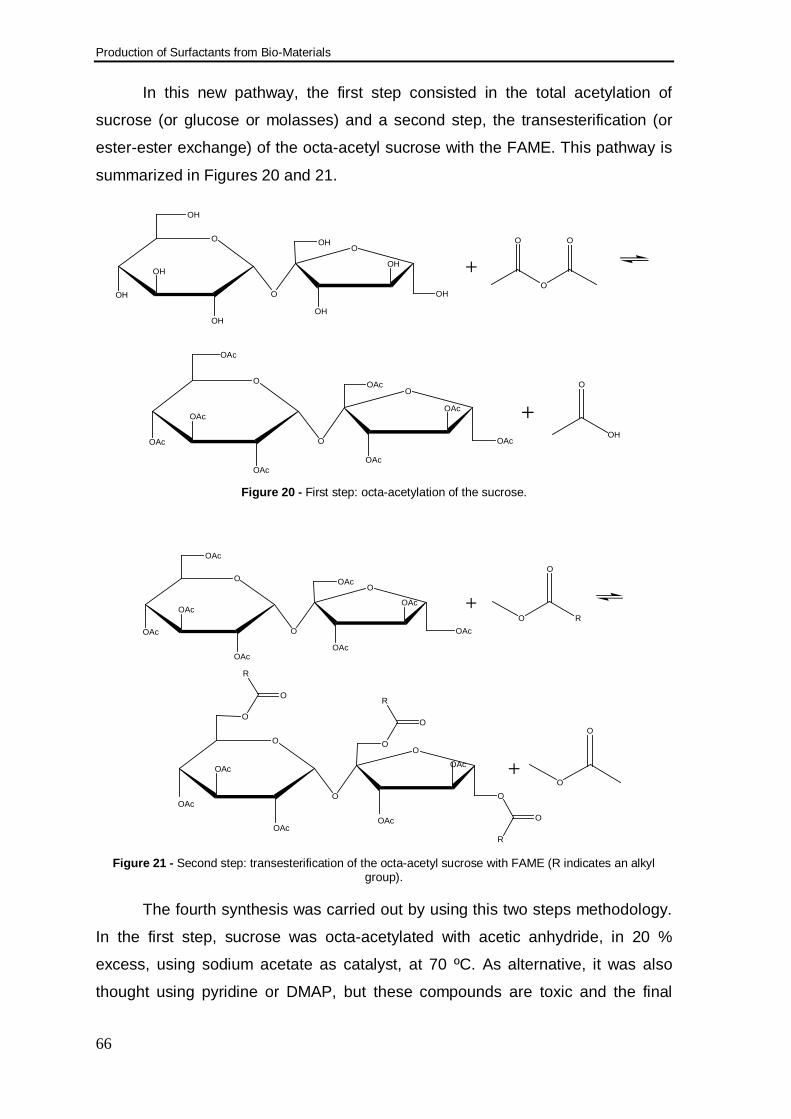
Production of Surfactants from Bio-Materials
66
In this new pathway, the first step consisted in the total acetylation of
sucrose (or glucose or molasses) and a second step, the transesterification (or
ester-ester exchange) of the octa-acetyl sucrose with the FAME. This pathway is
summarized in Figures 20 and 21.
OH
OH
OO
OH O
OH
OH
OH
OH
OH
+O
O O
OAc
OAc
OO
OAc O
OAc
OAc
OAc
OAc
OAc
+OH
O
Figure 20 - First step: octa-acetylation of the sucrose.
OO
O
O
O
O
O
O
+
OAc
OAc
OO
OAc O
OAc
OAc
OAc
OAc
+O R
O
OAc
OAc
OAc
OAc
OAcO
O
O
R
R
R
OAc
Figure 21 - Second step: transesterification of the octa-acetyl sucrose with FAME (R indicates an alkyl
group).
The fourth synthesis was carried out by using this two steps methodology.
In the first step, sucrose was octa-acetylated with acetic anhydride, in 20 %
excess, using sodium acetate as catalyst, at 70 ºC. As alternative, it was also
thought using pyridine or DMAP, but these compounds are toxic and the final
Production of Surfactants from Bio-Materials
67
product could not be applied to food and cosmetics without a complete removal,
which raises the production cost.
In the second step, octa-acetyl sucrose react with rapeseed FAME (1:4), at
80 ºC, applying reduce pressure and using scandium triflate as catalyst (1 %,
weight). A volatile by-product was recovered at a temperature of 40 ºC,
approximately, in the head of the distillation arm. This temperature matches the
boiling point of the azeotrope formed by methanol and methyl acetate, which is
36.7 ºC at 52.87 kPa, with the molar fraction of 0,6986 (Gmehling and Bolts
1996). At atmospheric pressure the boiling point of this azeotrope is 54 ºC with a
mass fraction of 0.81 (Smallwood 1996).
The product of this synthesis was tested as an emulsifier in a preliminary
test of emulsification, with the obtention of a stable W/O emulsion. This result
demonstrates that this synthesis process was promising.
In the following syntheses other lanthanide triflates were tested, namely
praseodymium and gadolinium triflate, different saccharides, such as glucose and
sugar cane molasses, lauric acid and FAME from coconut oil, and also different
DE, which allowed to obtain different products for several applications. The
emulsification preliminary tests were promising, demonstrating that the produced
SFAE can be applied as emulsifiers.
SFAE produced using molasses is less expensive, but the final product
has intense color, which does not satisfy the requisite of not producing a dark
color product.
The first syntheses were carried out in 1 L capacity reactors. Then, a
scale-up to 4 L reactors was made, with success. This is a promising result that
allows to foreseen a successful scale-up to a pilot scale, but more optimization
studies must be done.
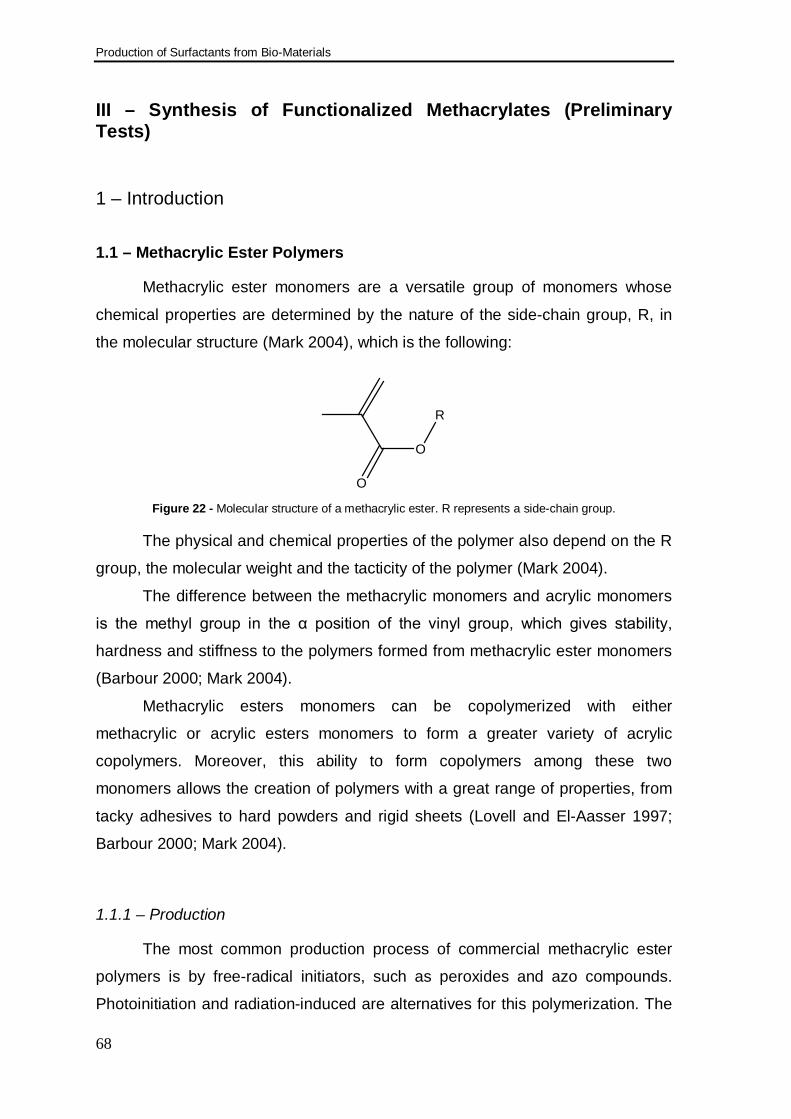
Production of Surfactants from Bio-Materials
68
III – Synthesis of Functionalized Methacrylates (Preliminary Tests)
1 – Introduction
1.1 – Methacrylic Ester Polymers
Methacrylic ester monomers are a versatile group of monomers whose
chemical properties are determined by the nature of the side-chain group, R, in
the molecular structure (Mark 2004), which is the following:
O
O
R
Figure 22 - Molecular structure of a methacrylic ester. R represents a side-chain group.
The physical and chemical properties of the polymer also depend on the R
group, the molecular weight and the tacticity of the polymer (Mark 2004).
The difference between the methacrylic monomers and acrylic monomers
is the methyl group in the α position of the vinyl group, which gives stability,
hardness and stiffness to the polymers formed from methacrylic ester monomers
(Barbour 2000; Mark 2004).
Methacrylic esters monomers can be copolymerized with either
methacrylic or acrylic esters monomers to form a greater variety of acrylic
copolymers. Moreover, this ability to form copolymers among these two
monomers allows the creation of polymers with a great range of properties, from
tacky adhesives to hard powders and rigid sheets (Lovell and El-Aasser 1997;
Barbour 2000; Mark 2004).
1.1.1 – Production
The most common production process of commercial methacrylic ester
polymers is by free-radical initiators, such as peroxides and azo compounds.
Photoinitiation and radiation-induced are alternatives for this polymerization. The
Production of Surfactants from Bio-Materials
69
polymerization of methacrylic monomers is highly exothermic, involves an
increase in the density of the forming polymeric material and produce, mainly,
atactic polymers, due to the symmetric nature of the radical species (Lovell and
El-Aasser 1997; Barbour 2000; Mark 2004).
At constant temperature, there is a first-order dependence of the
polymerization rate on monomer concentration and a one-half-order dependence
on initiator concentration (Matyjaszewski and Davis 2002; Mark 2004).
Other production process is bulk polymerization, which is used primarily for
the production of cast sheets of PMMA. Three main types of bulk polymerization
are practiced commercially: batch cell casting, continuous casting, and
continuous bulk (Mark 2004).
In this polymerization an auto-acceleration, known as the Trommsdorf or
gel effect, is observed at 20-50 % conversion, approximately. This phenomena is
attributable to an increase in viscosity as the monomer is converted to polymer.
Once the viscosity reaches the critical point, the termination begins to slow down
below the rate of propagation. Therefore, the overall rate of polymerization
increases, as well as the rate of heat generated from the reactor. (Mark 2004).
The molecular weight of the product formed after the gel-effect point is
higher than the product formed previously, due to the slowing in termination.
Moreover, the molecular weight is limited only by the diffusion of monomer to the
growing radical chain end (Mark 2004).
1.1.2 – Properties
1.1.2.1 – Glass-transition temperature
Glass transition often takes place over a large range of temperatures and
is manifested in a polymeric material as an embrittlement when expose to a
range from high to low temperatures (Barbour 2000; Mark 2004).
Methacrylic ester polymers are relatively soft and flexible, as rubbery
materials, above the Tg, and hard and brittle, as glass-like materials, below the Tg
(Mark 2004).
The Tg of a given type of polymers is affected by tacticity of the polymer
backbone. Moreover, Tg decrease in the follow order: syndiotactic > atactic >
isotactic (Barbour 2000; Mark 2004).
Production of Surfactants from Bio-Materials
70
There are a variety of techniques to measure the Tg, such as differential
scanning calorimetry (DSC) and dynamic mechanical analysis (DMA). These two
methods are currently the most commonly accepted (Barbour 2000; Mark 2004).
1.1.2.2 – Chemical Properties
Comparatively, methacrylic ester polymers have more chemical resistance
than the methacrylic esters, which are less susceptible to hydrolysis than acrylic
ester polymers (Mark 2004).
There are significant differences in the chemical resistance of different
forms of PMMA. The syndiotactic form of PMMA is the most chemically inert, with
the hydrolysis rate for syndiotactic PMMA lower than for isotactic. Radical
polymerization form more syndiotactic PMMA, which benefits the stability (Mark
2004).
Chemical species which will degrade PMMA include lower esters (ethyl
acetate, isopropyl acetate), aromatic hydrocarbons (benzene, toluene, xylene,
phenols), cresol, carbolic acid, aryl halides (chlorobenzene, bromobenzene),
aliphatic acids (butyric acid, acetic acid), alkyl polyhalides (ethylene dichloride,
methylene chloride), high concentrations of alcohols (methanol, ethanol, 2-
propanol), and high concentrations of alkalies and oxidizing agents (Mark 2004).
1.2 Free-Radical Initiators
Chemical substances that, under certain conditions, initiate chemical
reactions by producing free-radicals are denominated free-radical initiators. Thus,
radicals are reactive chemical species possessing a free electron, unbonded or
unpaired. Generally, have small lifetimes, typically half-life times less than 10-3
(Lovell and El-Aasser 1997; Matyjaszewski and Davis 2002; Mark 2004).
Initiators contain, at least, one labile bond that cleaves homolytically when
sufficient energy is supplied to the molecule. This amount of energy must be
greater than the bond dissociation energy (BDE) of the labile bond (Mark 2004).
Commercially, the principal initiators used to produce free-radicals are
peroxides and azo compounds. The emerging technologies use N-alkoxyamines
as free-radical initiators or employ group (or atom) transfer facilitated by transition
metals (Matyjaszewski and Davis 2002; Mark 2004).
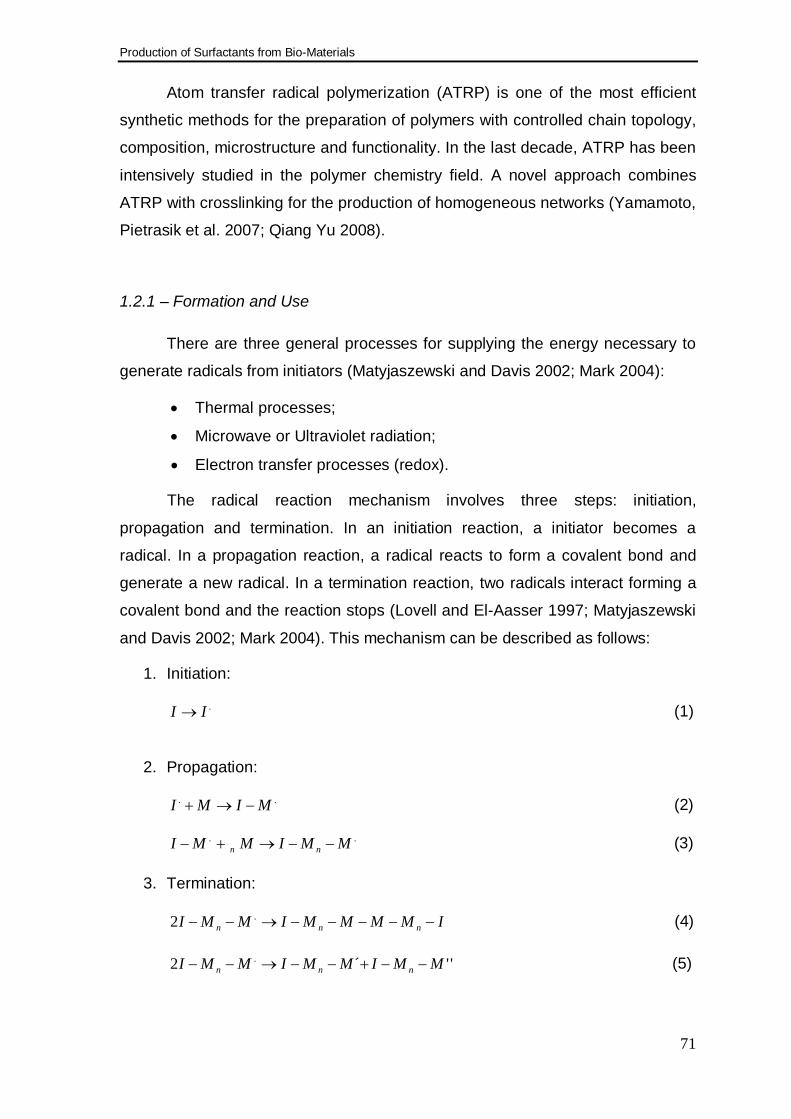
Production of Surfactants from Bio-Materials
71
Atom transfer radical polymerization (ATRP) is one of the most efficient
synthetic methods for the preparation of polymers with controlled chain topology,
composition, microstructure and functionality. In the last decade, ATRP has been
intensively studied in the polymer chemistry field. A novel approach combines
ATRP with crosslinking for the production of homogeneous networks (Yamamoto,
Pietrasik et al. 2007; Qiang Yu 2008).
1.2.1 – Formation and Use
There are three general processes for supplying the energy necessary to
generate radicals from initiators (Matyjaszewski and Davis 2002; Mark 2004):
• Thermal processes;
• Microwave or Ultraviolet radiation;
• Electron transfer processes (redox).
The radical reaction mechanism involves three steps: initiation,
propagation and termination. In an initiation reaction, a initiator becomes a
radical. In a propagation reaction, a radical reacts to form a covalent bond and
generate a new radical. In a termination reaction, two radicals interact forming a
covalent bond and the reaction stops (Lovell and El-Aasser 1997; Matyjaszewski
and Davis 2002; Mark 2004). This mechanism can be described as follows:
1. Initiation:
.II → (1)
2. Propagation:
.. MIMI −→+ (2)
.. MMIMMI nn −−→+− (3)
3. Termination:
IMMMMIMMI nnn −−−−−→−− .2 (4)
''´2 . MMIMMIMMI nnn −−+−−→−− (5)
Production of Surfactants from Bio-Materials
72
where, I is the initiator, I. is the radical intermediate, M is the vinyl monomer, I-M.
an initial monomer radical, I-Mn-M. a propagation radical, and M’ and M’’ the
polymers end groups.
The most common propagation reactions are atom abstraction, β-scission
and addition to carbon-carbon double bonds or aromatic rings, and the most
common termination reactions are coupling and disproportionation (Mark 2004).
Radicals are largely employed in the polymer industry to transform vinyl
monomers into polymers and copolymers. Two other important commercial uses
of initiators are in polymer crosslinking and polymer degradation. Thus,
crosslinking is a commercial important reaction of thermoplastics and elastomers
(Matyjaszewski and Davis 2002; Mark 2004).
In a crosslinking reaction, an atom abstraction (usually hydrogen) occurs,
followed by coupling of two polymer radicals to form a covalent cross-link –
termination (Mark 2004):
.. PHIIHP +−→+− (6)
PPP −→.2 (7)
where, P-H is a polymer with covalently attached hydrogen, I. is the initiating
radical, and P-P is a cross-linked polymer.
1.2.2 – Activation Parameters
In the obtention of radicals, thermal processes are commonly used to
break labile initiator bonds. The amount of thermal energy necessary varies with
the environment, and there are three important factors, known as the activation
parameters: temperature (T), activation energy (Ea), and the frequency factor
(A3). The Arrhenius equation (Eq. 11) associates the activation parameters with
the initiator decomposition rate (kd), where R is the gas constant (Lovell and El-
Aasser 1997; Matyjaszewski and Davis 2002; Mark 2004).
( )RTEd
aeAk −×= (Eq. 11)
The increase of temperature increases the initiator decomposition rate.
Thus, when a single labile bond is broken, the frequency factor is high, and when
multiple bonds are broken, the activated complex is restricted, the frequency
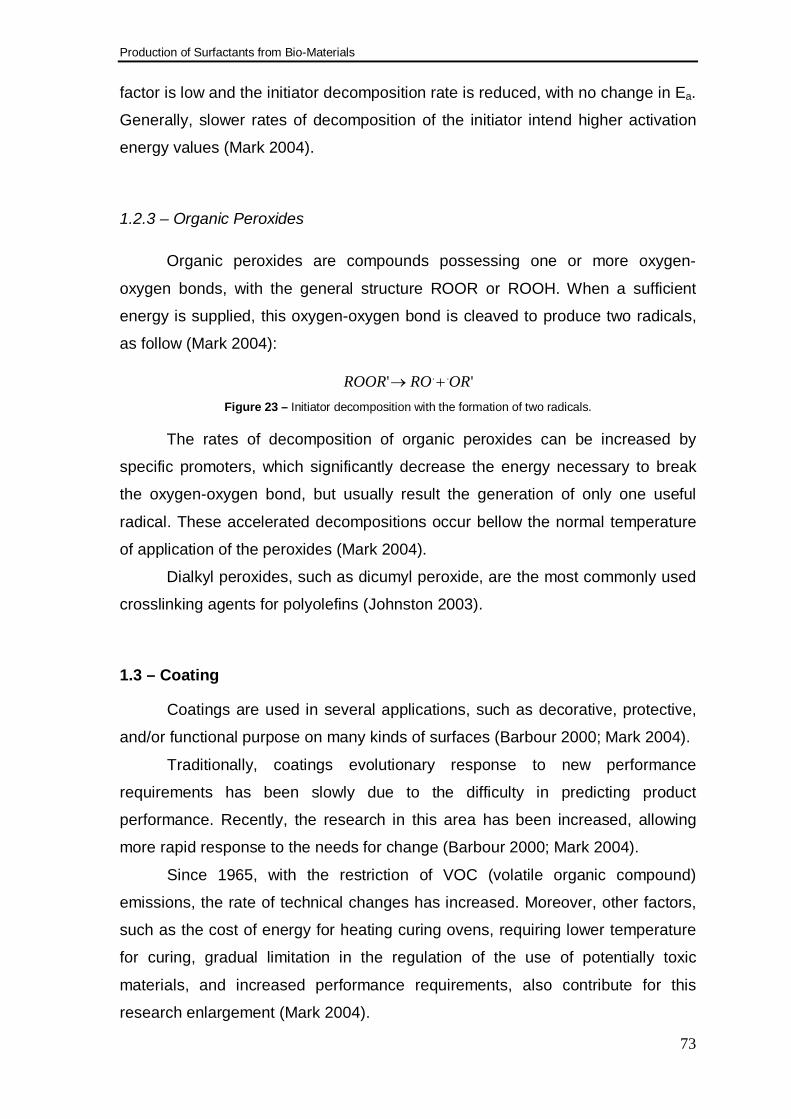
Production of Surfactants from Bio-Materials
73
factor is low and the initiator decomposition rate is reduced, with no change in Ea.
Generally, slower rates of decomposition of the initiator intend higher activation
energy values (Mark 2004).
1.2.3 – Organic Peroxides
Organic peroxides are compounds possessing one or more oxygen-
oxygen bonds, with the general structure ROOR or ROOH. When a sufficient
energy is supplied, this oxygen-oxygen bond is cleaved to produce two radicals,
as follow (Mark 2004):
'' .. ORROROOR +→ Figure 23 – Initiator decomposition with the formation of two radicals.
The rates of decomposition of organic peroxides can be increased by
specific promoters, which significantly decrease the energy necessary to break
the oxygen-oxygen bond, but usually result the generation of only one useful
radical. These accelerated decompositions occur bellow the normal temperature
of application of the peroxides (Mark 2004).
Dialkyl peroxides, such as dicumyl peroxide, are the most commonly used
crosslinking agents for polyolefins (Johnston 2003).
1.3 – Coating
Coatings are used in several applications, such as decorative, protective,
and/or functional purpose on many kinds of surfaces (Barbour 2000; Mark 2004).
Traditionally, coatings evolutionary response to new performance
requirements has been slowly due to the difficulty in predicting product
performance. Recently, the research in this area has been increased, allowing
more rapid response to the needs for change (Barbour 2000; Mark 2004).
Since 1965, with the restriction of VOC (volatile organic compound)
emissions, the rate of technical changes has increased. Moreover, other factors,
such as the cost of energy for heating curing ovens, requiring lower temperature
for curing, gradual limitation in the regulation of the use of potentially toxic
materials, and increased performance requirements, also contribute for this
research enlargement (Mark 2004).
Production of Surfactants from Bio-Materials
74
A film can be defined as a solid under determined conditions by stating the
minimum viscosity at which flow is observable in the specified time interval. Most
coatings are applied as liquids and converted to solid after application (Barbour
2000; Mark 2004).
A way to form films is to dissolve a polymer in solvents at the needed
concentration for application, then apply the coating and allow the solvent to
evaporate. As solvents evaporate, viscosity and Tg increases, and free volume
decreases (Mark 2004).
Coatings based on solutions of lower molecular weight thermosetting
resins needed less solvent. After application, the solvent evaporates and causes
crosslinking reactions. For obtaining good properties, average functionality has to
be greater than two and the amount of mono-functional resin should be minimal.
These systems present a problem in the relationship between stability during
storage and time and temperature required to cure a film after application
(Barbour 2000; Mark 2004).
Generally, it is desirable to store a coating for many months without a
significant increase in viscosity. Moreover, after application, it is desirable to have
crosslinking reactions precede rapidly at the lowest possible temperature.
Reaction rates depend on concentration, and are reduced by dilution with solvent
and increase as solvent evaporates. Crosslinking reactions, after solvent
evaporation, are initially faster than during storage. To minimize the temperature
required for curing, it is desirable to select a system for which the crosslinking
reactions rate depend strongly on temperature (Mark 2004; Youngjae Yoo 2009).
2 – Experimental
2.1 – Synthesis of the Functionalized Methacrylates
2.1.1 – Raw-Materials
The following materials were used in the production of the functionalized
acrylates:
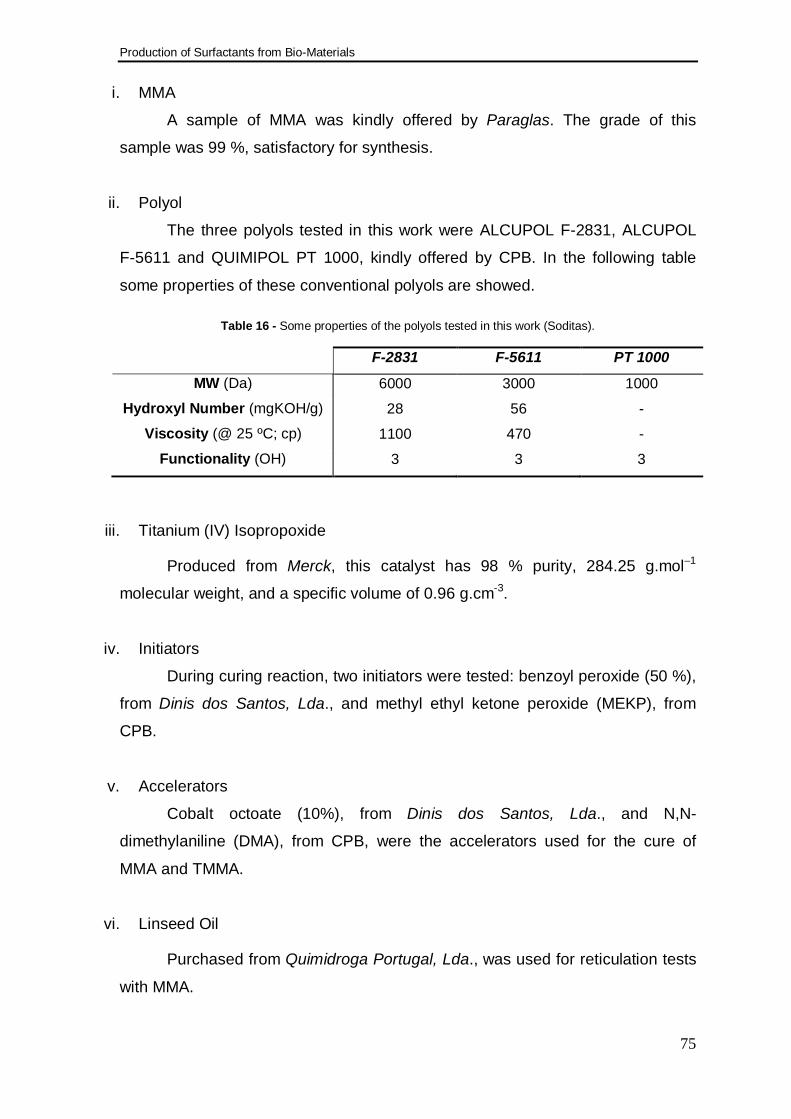
Production of Surfactants from Bio-Materials
75
i. MMA
A sample of MMA was kindly offered by Paraglas. The grade of this
sample was 99 %, satisfactory for synthesis.
ii. Polyol
The three polyols tested in this work were ALCUPOL F-2831, ALCUPOL
F-5611 and QUIMIPOL PT 1000, kindly offered by CPB. In the following table
some properties of these conventional polyols are showed.
Table 16 - Some properties of the polyols tested in this work (Soditas).
F-2831 F-5611 PT 1000
MW (Da) 6000 3000 1000
Hydroxyl Number (mgKOH/g) 28 56 -
Viscosity (@ 25 ºC; cp) 1100 470 -
Functionality (OH) 3 3 3
iii. Titanium (IV) Isopropoxide
Produced from Merck, this catalyst has 98 % purity, 284.25 g.mol–1
molecular weight, and a specific volume of 0.96 g.cm-3.
iv. Initiators
During curing reaction, two initiators were tested: benzoyl peroxide (50 %),
from Dinis dos Santos, Lda., and methyl ethyl ketone peroxide (MEKP), from
CPB.
v. Accelerators
Cobalt octoate (10%), from Dinis dos Santos, Lda., and N,N-
dimethylaniline (DMA), from CPB, were the accelerators used for the cure of
MMA and TMMA.
vi. Linseed Oil
Purchased from Quimidroga Portugal, Lda., was used for reticulation tests
with MMA.
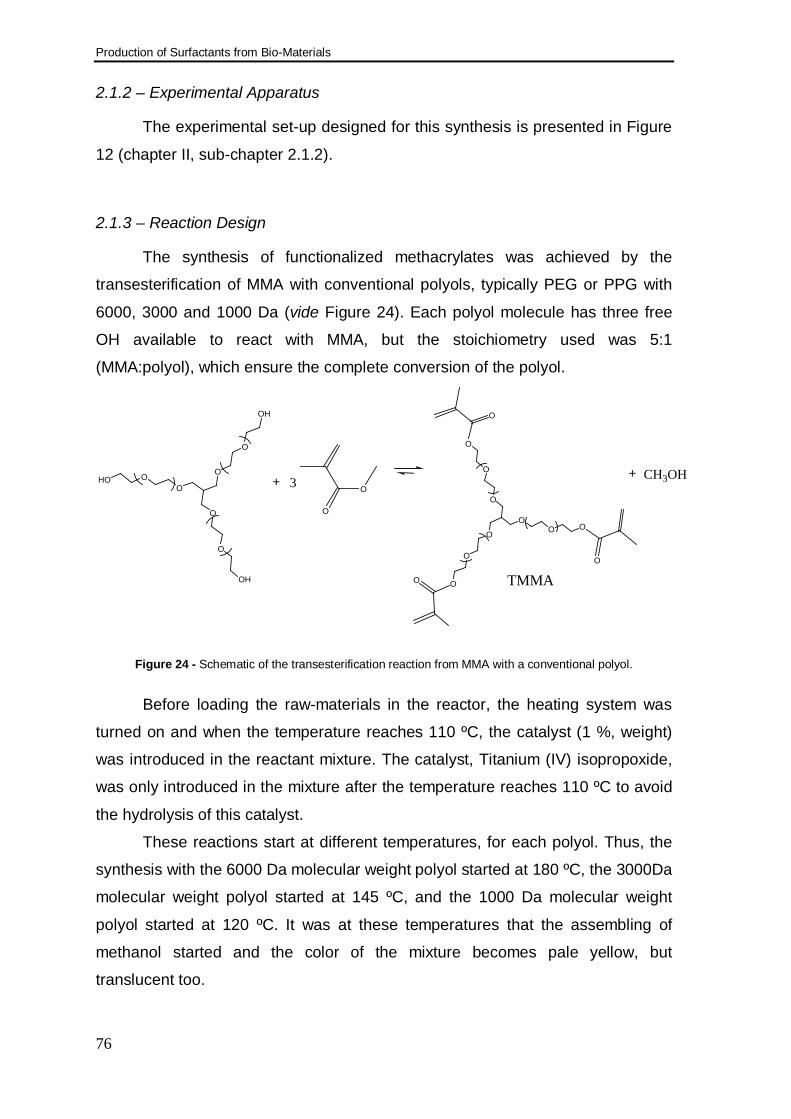
Production of Surfactants from Bio-Materials
76
2.1.2 – Experimental Apparatus
The experimental set-up designed for this synthesis is presented in Figure
12 (chapter II, sub-chapter 2.1.2).
2.1.3 – Reaction Design
The synthesis of functionalized methacrylates was achieved by the
transesterification of MMA with conventional polyols, typically PEG or PPG with
6000, 3000 and 1000 Da (vide Figure 24). Each polyol molecule has three free
OH available to react with MMA, but the stoichiometry used was 5:1
(MMA:polyol), which ensure the complete conversion of the polyol.
O
OOHO
O
O
O
OH
O
O
OH
+
O
O
O
OO O
O
O
O
O
O
O
3+ CH3OH
TMMA
Figure 24 - Schematic of the transesterification reaction from MMA with a conventional polyol.
Before loading the raw-materials in the reactor, the heating system was
turned on and when the temperature reaches 110 ºC, the catalyst (1 %, weight)
was introduced in the reactant mixture. The catalyst, Titanium (IV) isopropoxide,
was only introduced in the mixture after the temperature reaches 110 ºC to avoid
the hydrolysis of this catalyst.
These reactions start at different temperatures, for each polyol. Thus, the
synthesis with the 6000 Da molecular weight polyol started at 180 ºC, the 3000Da
molecular weight polyol started at 145 ºC, and the 1000 Da molecular weight
polyol started at 120 ºC. It was at these temperatures that the assembling of
methanol started and the color of the mixture becomes pale yellow, but
translucent too.
Production of Surfactants from Bio-Materials
77
These syntheses were carried out in a 1 L and 2 L glass vessels with a
connection to a distillation arm, which allow removing the by-product (methanol)
and extending the equilibrium to the formation of more functionalized acrylates. A
tube with N2 flow was immersed into mixture to promote the methanol removal.
The stirring was stronger as possible, typically 500 rpm.
Since the reaction begins a condensate appears in the top of the
distillation arm, being collected in a vessel at the end of distillation arm (Figure
12). At this point, the thermometer at the top of the distillation arm displays 70 ºC,
which is higher than the methanol boiling point. Being so, methanol drags some
MMA. Thus, a great excess of MMA is essential.
The terminus of this reaction was reached when the condensation of the
methanol stops, even with the increase of N2 flow and increase of temperature to
210 ºC. For a 1 L batch, using 600 g of Alcupol F-2831 and 50 g of MMA, this
reaction runs for 4 hours.
During these syntheses, the MMA can start to polymerize, due to the high
temperature and the presence of atmospheric O2 (free-radical). A signal of this
polymerization is the increase of viscosity of the mixture, displayed by the torque
of the mechanic stirrer. When the torque increases significantly, it is necessary to
introduce an inhibitor, such as hydroquinone. The amount needed of inhibitor is
0.01 % (weight).
2.2 – Curing of Functionalized MMA
The product was only characterized by gel time. Two curing systems,
initiated by free-radical initiators, were tested at different temperatures (room
temperature, 40 ºC and 60 ºC); a redox system consisting of MEKP and cobalt
octoate; and a system consisting of benzoyl peroxide and DMA.
The two curing systems were applied on the functionalized acrylates and
the accelerator amount varied in order to obtain a reasonable gel time. The gel
time was measured on Gelnorm® (Gel Instruments AG) that detects sharp
change in viscosity at the gel point by moving a probe up and down into the
sample.
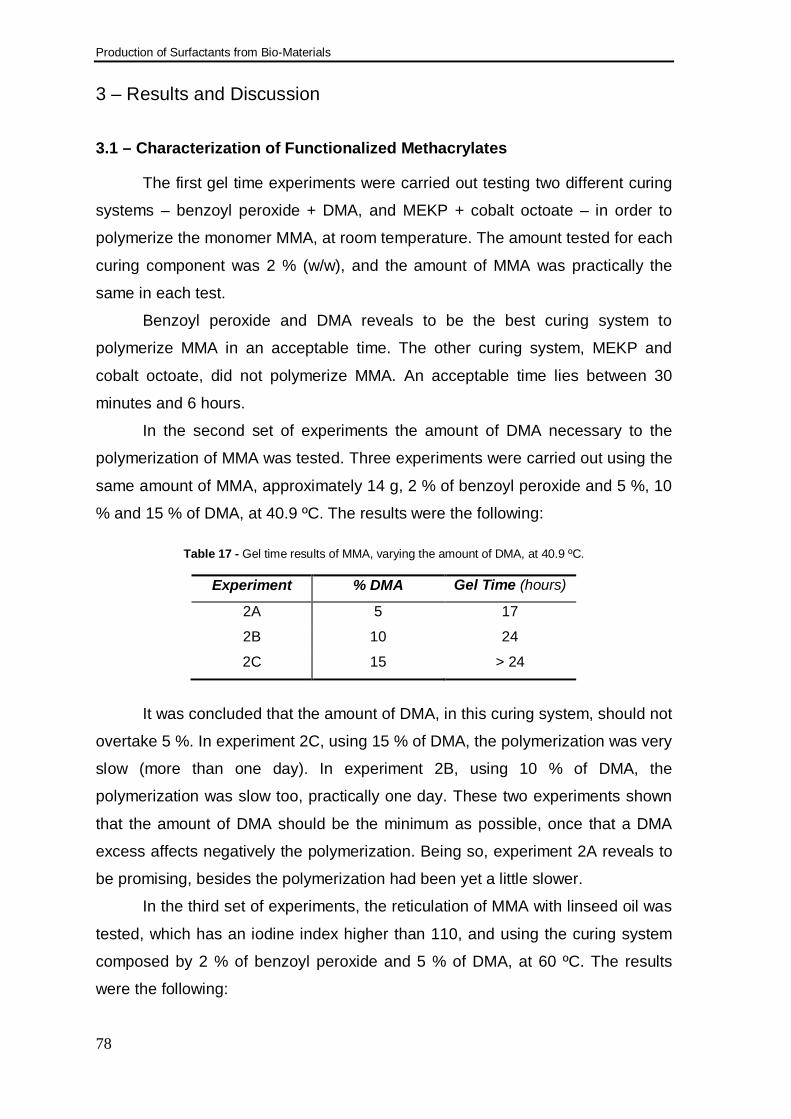
Production of Surfactants from Bio-Materials
78
3 – Results and Discussion
3.1 – Characterization of Functionalized Methacrylates
The first gel time experiments were carried out testing two different curing
systems – benzoyl peroxide + DMA, and MEKP + cobalt octoate – in order to
polymerize the monomer MMA, at room temperature. The amount tested for each
curing component was 2 % (w/w), and the amount of MMA was practically the
same in each test.
Benzoyl peroxide and DMA reveals to be the best curing system to
polymerize MMA in an acceptable time. The other curing system, MEKP and
cobalt octoate, did not polymerize MMA. An acceptable time lies between 30
minutes and 6 hours.
In the second set of experiments the amount of DMA necessary to the
polymerization of MMA was tested. Three experiments were carried out using the
same amount of MMA, approximately 14 g, 2 % of benzoyl peroxide and 5 %, 10
% and 15 % of DMA, at 40.9 ºC. The results were the following:
Table 17 - Gel time results of MMA, varying the amount of DMA, at 40.9 ºC.
Experiment % DMA Gel Time (hours)
2A 5 17
2B 10 24
2C 15 > 24
It was concluded that the amount of DMA, in this curing system, should not
overtake 5 %. In experiment 2C, using 15 % of DMA, the polymerization was very
slow (more than one day). In experiment 2B, using 10 % of DMA, the
polymerization was slow too, practically one day. These two experiments shown
that the amount of DMA should be the minimum as possible, once that a DMA
excess affects negatively the polymerization. Being so, experiment 2A reveals to
be promising, besides the polymerization had been yet a little slower.
In the third set of experiments, the reticulation of MMA with linseed oil was
tested, which has an iodine index higher than 110, and using the curing system
composed by 2 % of benzoyl peroxide and 5 % of DMA, at 60 ºC. The results
were the following:
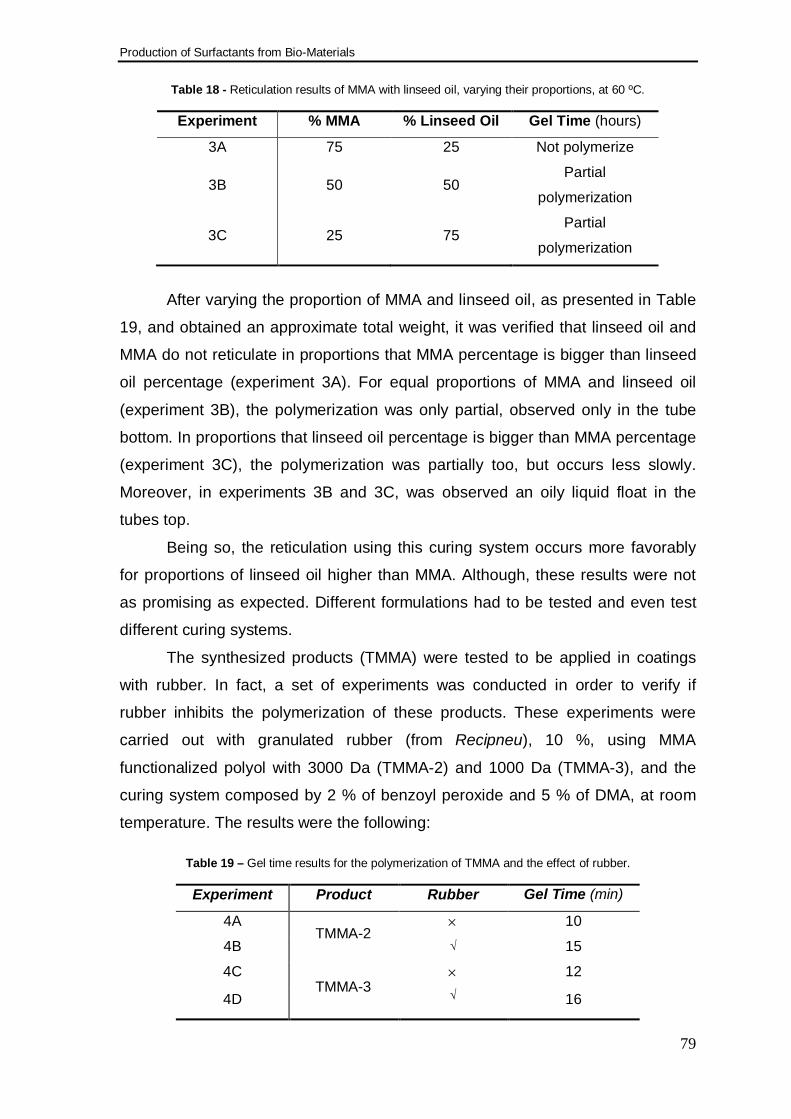
Production of Surfactants from Bio-Materials
79
Table 18 - Reticulation results of MMA with linseed oil, varying their proportions, at 60 ºC.
Experiment % MMA % Linseed Oil Gel Time (hours)
3A 75 25 Not polymerize
3B 50 50 Partial
polymerization
3C 25 75 Partial
polymerization
After varying the proportion of MMA and linseed oil, as presented in Table
19, and obtained an approximate total weight, it was verified that linseed oil and
MMA do not reticulate in proportions that MMA percentage is bigger than linseed
oil percentage (experiment 3A). For equal proportions of MMA and linseed oil
(experiment 3B), the polymerization was only partial, observed only in the tube
bottom. In proportions that linseed oil percentage is bigger than MMA percentage
(experiment 3C), the polymerization was partially too, but occurs less slowly.
Moreover, in experiments 3B and 3C, was observed an oily liquid float in the
tubes top.
Being so, the reticulation using this curing system occurs more favorably
for proportions of linseed oil higher than MMA. Although, these results were not
as promising as expected. Different formulations had to be tested and even test
different curing systems.
The synthesized products (TMMA) were tested to be applied in coatings
with rubber. In fact, a set of experiments was conducted in order to verify if
rubber inhibits the polymerization of these products. These experiments were
carried out with granulated rubber (from Recipneu), 10 %, using MMA
functionalized polyol with 3000 Da (TMMA-2) and 1000 Da (TMMA-3), and the
curing system composed by 2 % of benzoyl peroxide and 5 % of DMA, at room
temperature. The results were the following:
Table 19 – Gel time results for the polymerization of TMMA and the effect of rubber.
Experiment Product Rubber Gel Time (min)
4A TMMA-2
× 10
4B √ 15
4C TMMA-3
× 12
4D √ 16
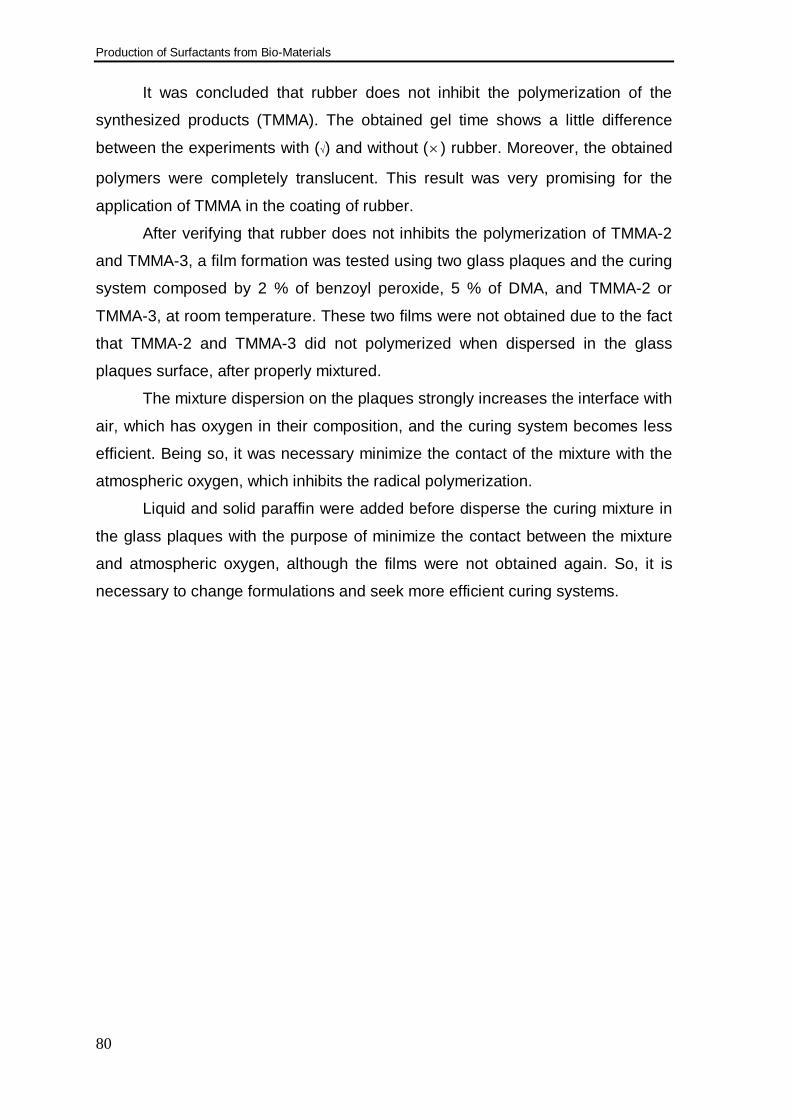
Production of Surfactants from Bio-Materials
80
It was concluded that rubber does not inhibit the polymerization of the
synthesized products (TMMA). The obtained gel time shows a little difference
between the experiments with (√) and without (× ) rubber. Moreover, the obtained
polymers were completely translucent. This result was very promising for the
application of TMMA in the coating of rubber.
After verifying that rubber does not inhibits the polymerization of TMMA-2
and TMMA-3, a film formation was tested using two glass plaques and the curing
system composed by 2 % of benzoyl peroxide, 5 % of DMA, and TMMA-2 or
TMMA-3, at room temperature. These two films were not obtained due to the fact
that TMMA-2 and TMMA-3 did not polymerized when dispersed in the glass
plaques surface, after properly mixtured.
The mixture dispersion on the plaques strongly increases the interface with
air, which has oxygen in their composition, and the curing system becomes less
efficient. Being so, it was necessary minimize the contact of the mixture with the
atmospheric oxygen, which inhibits the radical polymerization.
Liquid and solid paraffin were added before disperse the curing mixture in
the glass plaques with the purpose of minimize the contact between the mixture
and atmospheric oxygen, although the films were not obtained again. So, it is
necessary to change formulations and seek more efficient curing systems.
Production of Surfactants from Bio-Materials
81
IV - Conclusions and Future Trends
The SFAE process synthesis and the production of crude samples, which
were the main objectives of this work, were, as expected, accomplished. The
results obtained in the emulsification preliminary test and the results obtained
from BIOPRODUCTION partners, as well the product characterization by FTIR
and NMR, also support this statement.
FTIR spectra from the different synthesized SFAE revealed both the
presence of esters and bands associated with carbohydrates, which confirm the
obtention of SFAE. Moreover, the FTIR spectra from SFAE synthesized from
rapeseed FAME reveals the presence of unsaturated alkyl chain.
NMR experiments performed in the characterization of glucose mono-
laurate reveal a DE of 1.06 of lauric acid, 2.92 of acetic acid and 1.02 of free OH.
These results allow to conclude about the performance of this synthesis, which
was as expected, obtaining a glucose mono-ester from lauric acid.
The HLB number of SFAE was calculated, using the Davies method, for
different DE (mono-, di- and tri-) of sucrose and glucose with rapeseed and
coconut FAME. The HLB number varies with the DE, diminishing with the
increase of DE. The alkyl chain length also influences the HLB number. For the
same DE, the increase of alkyl chain length diminishes the HLB number.
In these calculations, the maximum HLB value was 16.33, for mono-ester
SFAE from coconut FAME, and the minimum HLB value was -1.73, for tri-ester
SFAE from rapeseed FAME. This negative value is unreasonable, making the
Davies method unsuitable for SFAE, in particular for extreme cases.
Some of the possible applications for these SFAE, synthesized using
rapeseed and coconut FAME, are:
• Mono-ester - O/W emulsifiers;
• Di-ester - O/W emulsifiers;
• Tri-ester - W/O emulsifiers.
Comparing the HLB values of SFAE from sucrose and glucose, the results
revealed that HLB values are higher for sucrose then for glucose, conferring a
higher hydrophilicity. Moreover, it was noticed a difference of 6 units between
SFAE and GFAE, for the same DE. This difference is owing to the fact that
Production of Surfactants from Bio-Materials
82
sucrose has two more ether bounds, three more ester groups and more three
CH3, two CH2 and five CH.
Regarding emulsification preliminary tests, it was verified that the DE and
the nature of the saccharides influences the behavior of the SFAE, as expected.
The results demonstrate that an increase of the DE turns the SFAE more
lipophilic, and SFAE synthesized using sucrose revealed to be more hydrophilic
than SFAE synthesized using glucose, which is in agreement with the HLB
calculation.
These emulsification preliminary tests revealed that three of the
synthesized SFAE were able to be applied in W/O emulsions, and one of the
synthesized SFAE was able to be applied in O/W emulsions.
The product synthesized from glucose and lauric acid demonstrates not be
a good W/O emulsifier, despite being a mono-ester and the HLB calculation
indicates a possible application as O/W emulsifier. A contaminant, not identified
in the FTIR spectra, has influenced the product HLB. Ciba has tested some SFAE samples and reported promising results. A
SFAE sample reveals to be suitable to use in W/O preparations. Moreover, this
sample reveals to create stable W/O emulsions at both hot and cold
environments, and also after two weeks storage.
P&G has tested a SFAE sample in a preliminary test of detergency, in a
washing machine, and reported successfully.
From all the used catalysts in the synthesis of SFAE, lanthanide triflates
were the ones who had better performance, allowing this synthesis at low
temperature and so minimize the sugar degradation.
A scale-up from 1 L to 4 L was successfully achieved. This is a promising
result for trying a larger production scale. Although, more tests should be made
before trying this scale-up.
A main objective of the BIOPRODUCTION project was to produce a non-
ionic surfactant from renewable and economical raw-materials. This objective
was accomplished with the production of SFAE from sugar cane molasses and
rapeseed FAME, which are obtained from renewable raw-materials, plenty
available and low-priced.
Moreover, this SFAE production allows the obtention of versatile products,
suitable in several applications, due to the capacity to vary the DE and also
Production of Surfactants from Bio-Materials
83
employ different saccharides. Therefore, SFAE has a promising probability as
raw material for detergents.
The main objectives were accomplished, but this work could continue to be
developed. The product characterization could be more complete, namely in their
physical properties, such as surface tension, moisturing power and foamy power.
The product purification should be developed to perform these tests, regarding
the customers and environmental requirements.
More developments could be made in the pilot scale, seeking a more
efficient process in energetic terms. Thus, kinetic studies should be performed to
optimize the process and then scale-up to an industrial scale.
According to the results obtained in the functionalized methacrylate
synthesis, we may conclude that the curing system composed by benzoyl
peroxide and DMA was better than the curing system composed by MEKP and
cobalt octoate. Moreover, DMA influence the polymerization time, being more
desirable an amount as less as possible.
It was verified that TMMA can be applied in rubber coatings, as rubber
does not inhibits the polymerization of TMMA products, although the film
formation was not obtained. Perhaps, the used curing system should not be
applied in film formations, since that atmospheric oxygen has a larger interface to
diffuse inside the curing mixture, which may preclude the polymerization.
The reticulation of MMA with linseed oil was tested and the results showed
that the amount of oil should be greater or equal than the MMA, otherwise the
reticulation not occurs.
These were preliminary tests and different formulations have to be tested
and even seeking more efficient curing systems. For a better characterization of
this product, TMMA, the Tg should be measured, which allows the obtention of
important properties related to Tg and compare with similar products. Other
properties should be measured, such as, adhesion; abrasion and photoinitiated
oxidative degradation, to better characterize this product.
Production of Surfactants from Bio-Materials
84
References
Akoh, C. C. and B. G. Swanson (1990). "Optimization of sucrose polyester synthesis: comparision of properties of sucrose polyesters, raffinose polyesters and salad oils." Journal of Food Science 55(1): 236-240.
Barbour, M. e. a. (2000). Waterborne & Solvent Based Acrylics and their End User Applications. London, Wiley - SITA.
Becerra, N., C. Toro, et al. (2008). "Characterization of micelles formed by sucrose 6-O-monoesters." Colloids and Surfaces A: Physicochemical and Engineering Aspects 327(1-3): 134-139.
Cai, C., W. B. Yi, et al. (2009). "Fluorous Lewis acids and phase transfer catalysts." Molecular Diversity 13(2): 209-239.
Chortyk, O. T., J. G. Pomonis, et al. (1996). "Syntheses and characterizations of insecticidal sucrose esters." Journal of Agricultural and Food Chemistry 44(6): 1551-1557.
Coates, J. (2000). Interpretation of Infrared Spectra, A Practical Approach. Encyclopedia of Analytical Chemistry. R. A. Meyers. Chichester, Wiley: 10815-10837.
Commission, E. (1998). "Commission Directive 98/86/EC of 11 November amendig Commission Directive 96/77/EC laying down specific purity criteria of foof additives other than colours and sweetners." Official Journal of the European Communities L334.
Csóka, G., S. Marton, et al. (2007). "Application of sucrose fatty acid esters in transdermal therapeutic systems." European Journal of Pharmaceutics and Biopharmaceutics 65(2): 233-237.
Derome, A. E. (1990). Modern NMR techniques for chemistry research. Oxford, Pergamon Press.
Devulapalle, K. S., A. Gómez de Segura, et al. (2004). "Effect of carbohydrate fatty acid esters on Streptococcus sobrinus and glucosyltransferase activity." Carbohydrate Research 339(6): 1029-1034.
Production of Surfactants from Bio-Materials
85
Fortuna, C. G., G. Musumarra, et al. (2006). "Principal properties (PPs) for lanthanide triflates as Lewis-acid catalysts." Journal of Chemometrics 20(8-10): 418-424.
Gmehling, J. and R. Bolts (1996). "Azeotropic data for binary and ternary systems at moderate pressures." Journal of Chemical and Engineering Data 41(2): 202-209.
Goodwin, J. W. (2004). Colloids and Interfaces with Surfactants and Polymers - An Introduction. Chichester (England), Wiley.
Griffin, W. C. (1949). "Classification of surfaceactive by HLB." Journal of the Society of Cosmetic Chemists 1: 311-326.
Guo, X., Z. Rong, et al. (2006). "Calculation of hydrophile-lipophile balance for polyethoxylated surfactants by group contribution method." Journal of Colloid and Interface Science 298(1): 441-450.
Hill, K. and O. Rhode (1999). "Sugar-based surfactants for consumer products and technical applications." Fett-Lipid 101(1): 25-33.
Holmberg, K., B. Jönsson, et al. (2002). Surfactants and Polymers in Aqueous Solution. Chichester, Wiley - VCH.
Husband, F. A., D. B. Sarney, et al. (1998). "Comparison of foaming and interfacial properties of pure sucrose monolaurates, dilaurate and commercial preparations." Food Hydrocolloids 12(2): 237-244.
Johnston, R. (2003). "Modelling peroxide crosslinking in polyolefins." Sealing Technology 2003(2): 6-9.
Kharchafi, F., F. Jerome, et al. (2005). "Design of well balanced hydrophilic-lipophilic catalytic surfaces for the direct and selective monoesterification of various polyols." New Journal of Chemistry 29(7): 928-934.
Kobayashi, S. and I. Hachiya (1994). "Lanthanide triflates as water-tolerant lewis-acids - activation of commercial formaldehyde solution and use in the aldol reaction of silyl enol ethers with aldehydes in aqueous-media." Journal of Organic Chemistry 59(13): 3590-3596.
Production of Surfactants from Bio-Materials
86
Kobayashi, S. and I. Hachiya (1995). "Lewis acid-catalyzed reactions in aqueous-solution." Journal of Synthetic Organic Chemistry Japan 53(5): 370-380.
Kobayashi, S. and K. Manabe (2000). "Green Lewis acid catalysis in organic synthesis." Pure and Applied Chemistry 72(7): 1373-1380.
Laven, G. and J. Stawinski (2009). "Synthetic studies on the preparation of nucleoside 5 '-H-phosphonate monoesters under the Mitsunobu reaction conditions." Arkivoc: 20-U5.
Lichtenthaler, F. W. and S. Peters (2004). "Carbohydrates as green raw materials for the chemical industry." Comptes Rendus Chimie 7(2): 65-90.
Lovell, P. A. and M. S. El-Aasser (1997). Emulsion Polymerization and Emulsion Polymers. New York, Wiley.
Mark, H. F. (2004). Coatings. Encyclopedia of Polymer Science and Technology, Wiley - VCH. 1.
Mark, H. F. (2004). Initiatiros, Free-radical. Encyclopedia of Polymer Science and Technology, WIley - VHC. 6.
Mark, H. F. (2004). Methacrylic Ester Polymers. Encyclopedia of Polymer Science and Technology, Wiley - VCH. 3.
Matyjaszewski, K. and T. P. Davis (2002). Handbook of Radical Polymerization. New York, Wiley - Interscience.
Mitsunobu, O. Y. (1967). "Preparation of Esters of Carboxylic and Phosphoric Acid via Quaternary Phosphonium Salts." Bulletin of the Chemical Society of Japan 40: 2380-2382.
Molinier, V., P. H. J. Kouwer, et al. (2006). "Self-organizing properties of monosubstituted sucrose fatty acid esters: The effects of chain length and unsaturation." Chemistry-a European Journal 12(13): 3547-3557.
Molinier, V., Paul J. J. Kouwer, et al. (2007). "Shape Dependence in the Formation of Condensed Phases Exhibited by Disubstituted Sucrose Esters." Chemistry - A European Journal 13(6): 1763-1775.
Production of Surfactants from Bio-Materials
87
Myers, D. (1999). Surfaces, Interfaces, and Colloids: Principles and Applications. New York, Wiley - VCH.
Myers, D. (2006). Surfactant Science and Technology. New Jersey, Wiley - Interscience.
Nakanishi, K. (1990). In One-dimensional and two-dimensional NMR spectra by modern pulse techniques. Mill Valley, California, University Science Books.
Nelson, R. (2003). "Dispersing powders in liquids." Chemical Nature of Surfaces and Surfactants, Tables of Properties of Surfactants Retrieved june of 2009, from http://www.erpt.org/032Q/Nelsc-04.pdf.
Osipow, L., F. D. Snell, et al. (1956). "Methods of Preparation - Fatty Acid Esters of Sucrose." Industrial and Engineering Chemistry 48(9): 1459-1462.
Qiang Yu, Z. Q. J. L. S. Z. (2008). "Diffusion-controlled atom transfer radical polymerization with crosslinking." Polymer Engineering & Science 48(7): 1254-1260.
Queneau, Y., S. Chambert, et al. (2008). "Recent progress in the synthesis of carbohydrate-based amphiphilic materials: the examples of sucrose and isomaltulose." Carbohydrate Research 343(12): 1999-2009.
Queneau, Y., J. Fitremann, et al. (2004). "The chemistry of unprotected sucrose: the selectivity issue." Comptes Rendus Chimie 7(2): 177-188.
Sabeder, S., M. Habulin, et al. (2006). "Lipase-catalyzed synthesis of fatty acid fructose esters." Journal of Food Engineering 77(4): 880-886.
Scotter, M. J., L. Castle, et al. (2006). "Estimation of sucrose esters (E473) in foods using gas chromatography-mass spectrometry." Food Additives & Contaminants: Part A 23(6): 539-546.
Shaw, D. J. (1992). Introduction to Colloid and Surface Chemistry. Oxford, Butterworth-Heinemann.
Smallwood, I. M. (1996). Handbook of Organic Solvents Properties. London, Arnold - Hodder Headline Group.
Production of Surfactants from Bio-Materials
88
Soditas, A. S. (August, 2009). Retrieved April, 2008, from http://www.soditas.com.tr/eng_index.html.
Solomons, G., Fryhle, C. (2002). Química Orgânica. Rio de Janeiro, LTC.
Tadros, T. F. (2005). Applied Surfactants: Principles and Applications. Weinheim, Wiley - VCH.
Tai, H. P. and G. Brunner (2009). "Sugar fatty acid ester synthesis in high-pressure acetone-CO2 system." The Journal of Supercritical Fluids In Press, Corrected Proof.
Thévenet, S., A. Wernicke, et al. (1999). "Esterification of unprotected sucrose with acid chlorides in aqueous medium: kinetic reactivity versus acyl- or alkyloxycarbonyl-group migrations." Carbohydrate Research 318(1-4): 52-66.
Walsh, M. K., R. A. Bombyk, et al. (2009). "Synthesis of lactose monolaurate as influenced by various lipases and solvents." Journal of Molecular Catalysis B: Enzymatic 60(3-4): 171-177.
Wu, J., Y. Xu, et al. (2004). "Development of a method for measurement of relative solubility of nonionic surfactants." Colloids and Surfaces A: Physicochemical and Engineering Aspects 232(2-3): 229-237.
Yamamoto, S.-i., J. Pietrasik, et al. (2007). "ATRP Synthesis of Thermally Responsive Molecular Brushes from Oligo(ethylene oxide) Methacrylates." Macromolecules 40(26): 9348-9353.
Youngjae Yoo, G.-H. H. S.-R. H. Y. S. K. S.-G. L. H.-J. K. J. H. L. (2009). "Preparation of acrylic copolymers and crosslinking agents and properties as a film." Journal of Applied Polymer Science 112(3): 1587-1594.

Production of Surfactants from Bio-Materials
89
Appendix
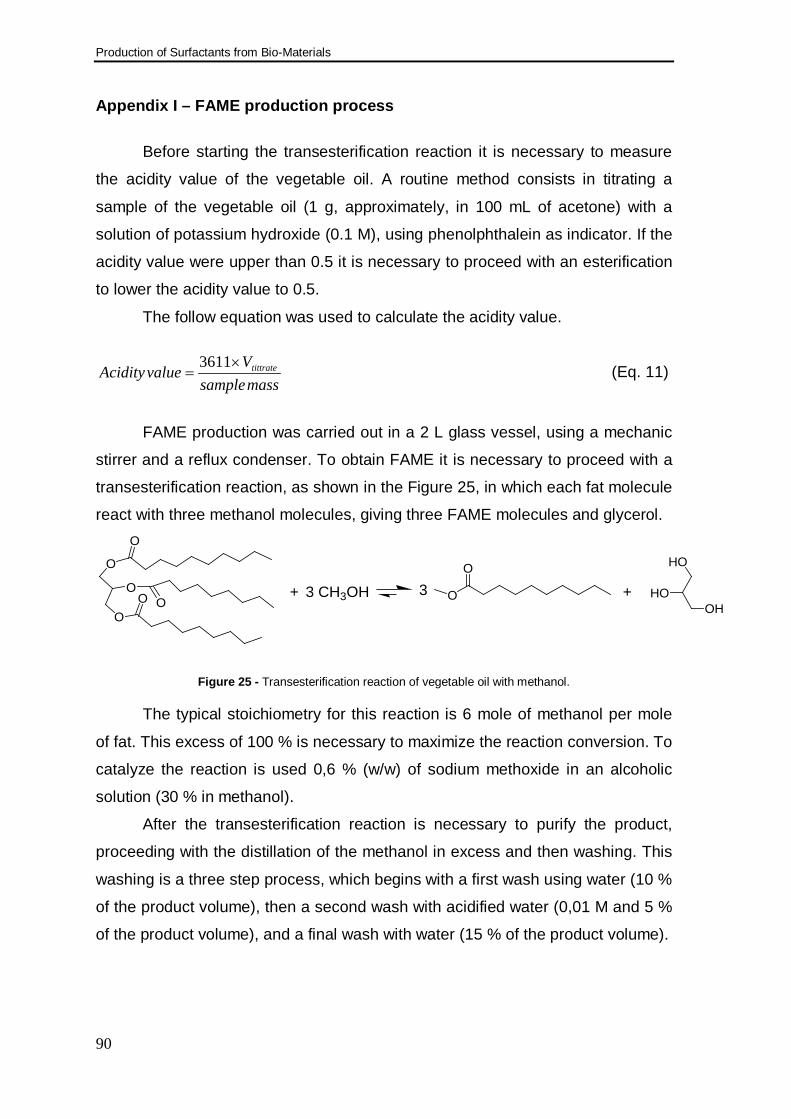
Production of Surfactants from Bio-Materials
90
Appendix I – FAME production process
Before starting the transesterification reaction it is necessary to measure
the acidity value of the vegetable oil. A routine method consists in titrating a
sample of the vegetable oil (1 g, approximately, in 100 mL of acetone) with a
solution of potassium hydroxide (0.1 M), using phenolphthalein as indicator. If the
acidity value were upper than 0.5 it is necessary to proceed with an esterification
to lower the acidity value to 0.5.
The follow equation was used to calculate the acidity value.
masssampleV
valueAcidity tittrate×=
3611 (Eq. 11)
FAME production was carried out in a 2 L glass vessel, using a mechanic
stirrer and a reflux condenser. To obtain FAME it is necessary to proceed with a
transesterification reaction, as shown in the Figure 25, in which each fat molecule
react with three methanol molecules, giving three FAME molecules and glycerol.
O
O
OO
O
O + 3 CH3OHO
O3
HO
HOOH
+
Figure 25 - Transesterification reaction of vegetable oil with methanol.
The typical stoichiometry for this reaction is 6 mole of methanol per mole
of fat. This excess of 100 % is necessary to maximize the reaction conversion. To
catalyze the reaction is used 0,6 % (w/w) of sodium methoxide in an alcoholic
solution (30 % in methanol).
After the transesterification reaction is necessary to purify the product,
proceeding with the distillation of the methanol in excess and then washing. This
washing is a three step process, which begins with a first wash using water (10 %
of the product volume), then a second wash with acidified water (0,01 M and 5 %
of the product volume), and a final wash with water (15 % of the product volume).
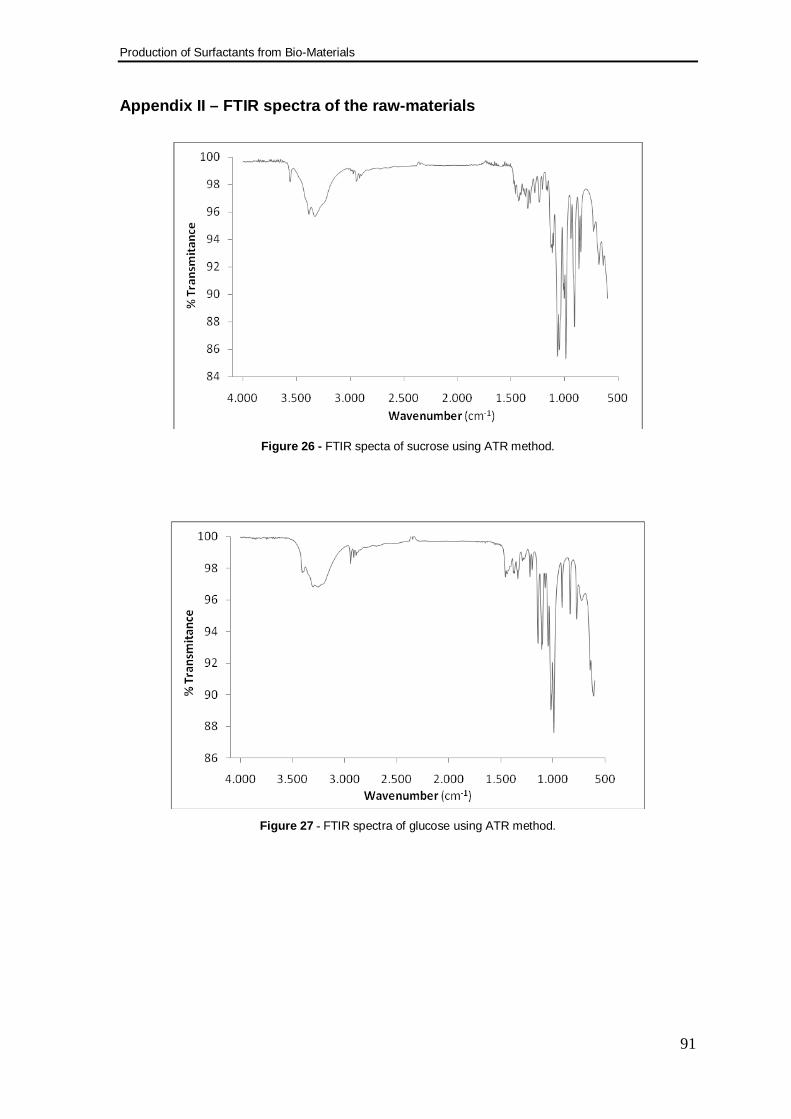
Production of Surfactants from Bio-Materials
91
Appendix II – FTIR spectra of the raw-materials
Figure 26 - FTIR specta of sucrose using ATR method.
Figure 27 - FTIR spectra of glucose using ATR method.
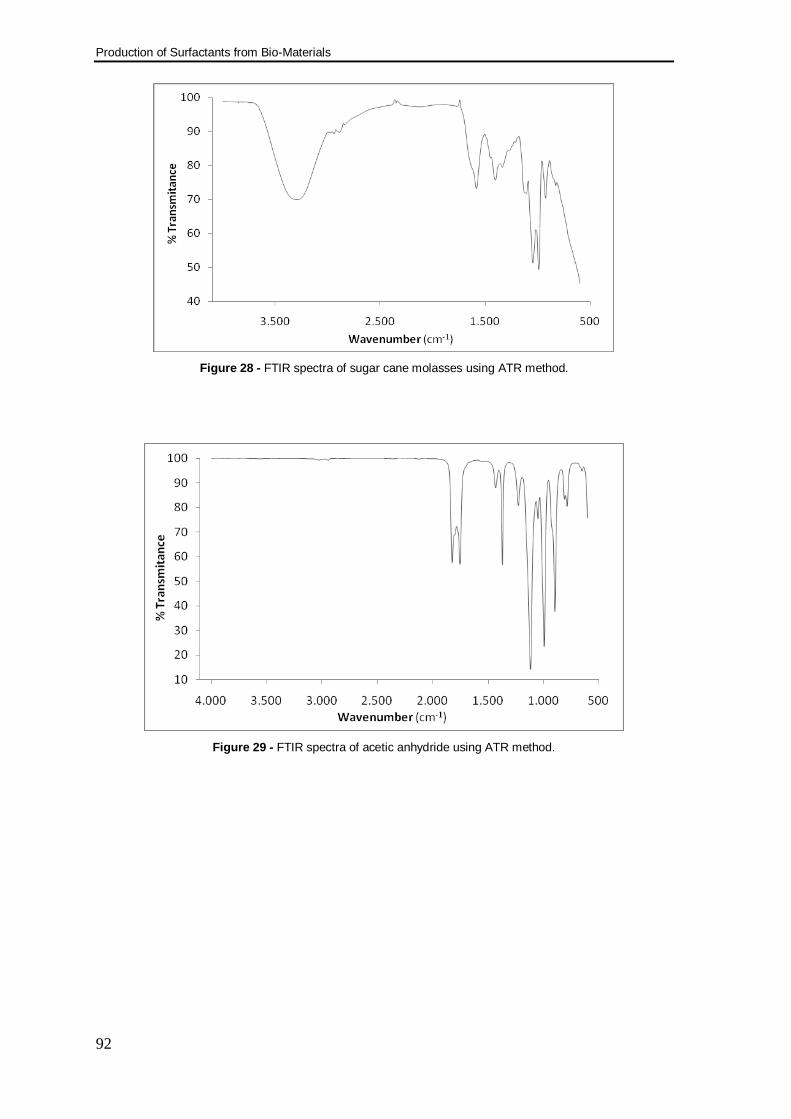
Production of Surfactants from Bio-Materials
92
Figure 28 - FTIR spectra of sugar cane molasses using ATR method.
Figure 29 - FTIR spectra of acetic anhydride using ATR method.

Production of Surfactants from Bio-Materials
93
Figure 30 - FTIR spectra of FAME from rapeseed using ATR method.
Figure 31 - FTIR spectra of lauric acid using ATR method.
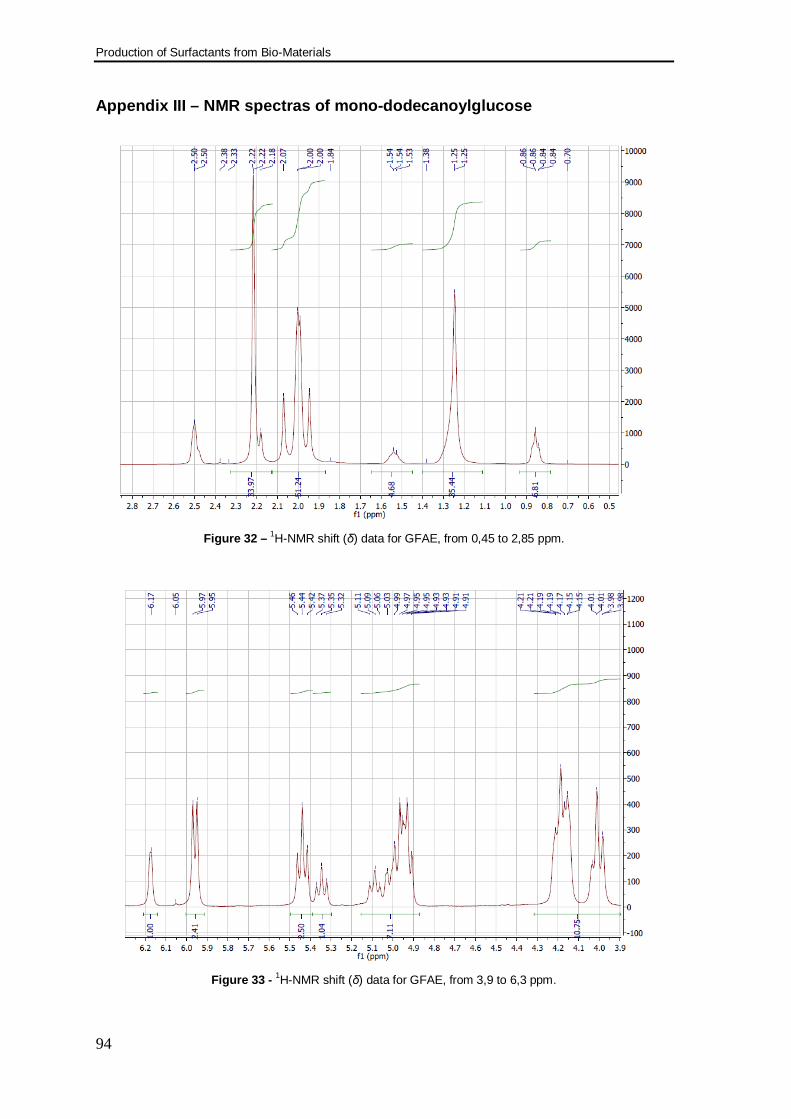
Production of Surfactants from Bio-Materials
94
Appendix III – NMR spectras of mono-dodecanoylglucose
Figure 32 – 1H-NMR shift (δ) data for GFAE, from 0,45 to 2,85 ppm.
Figure 33 - 1H-NMR shift (δ) data for GFAE, from 3,9 to 6,3 ppm.
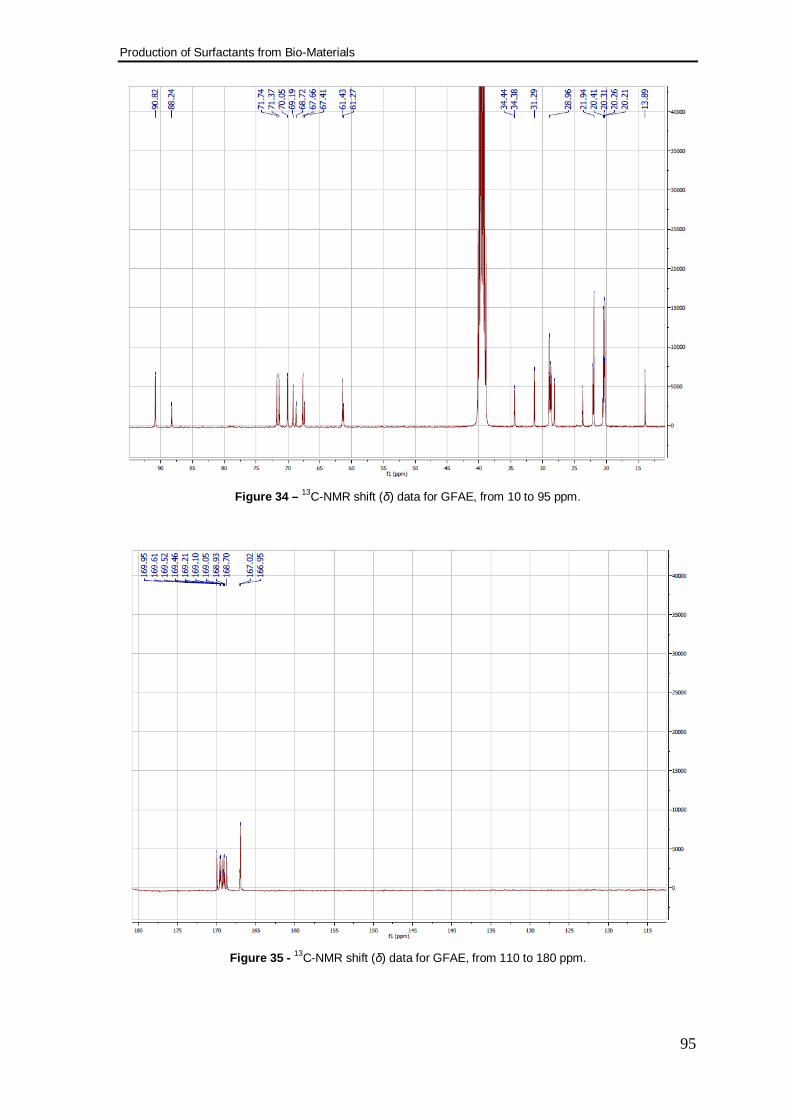
Production of Surfactants from Bio-Materials
95
Figure 34 – 13C-NMR shift (δ) data for GFAE, from 10 to 95 ppm.
Figure 35 - 13C-NMR shift (δ) data for GFAE, from 110 to 180 ppm.
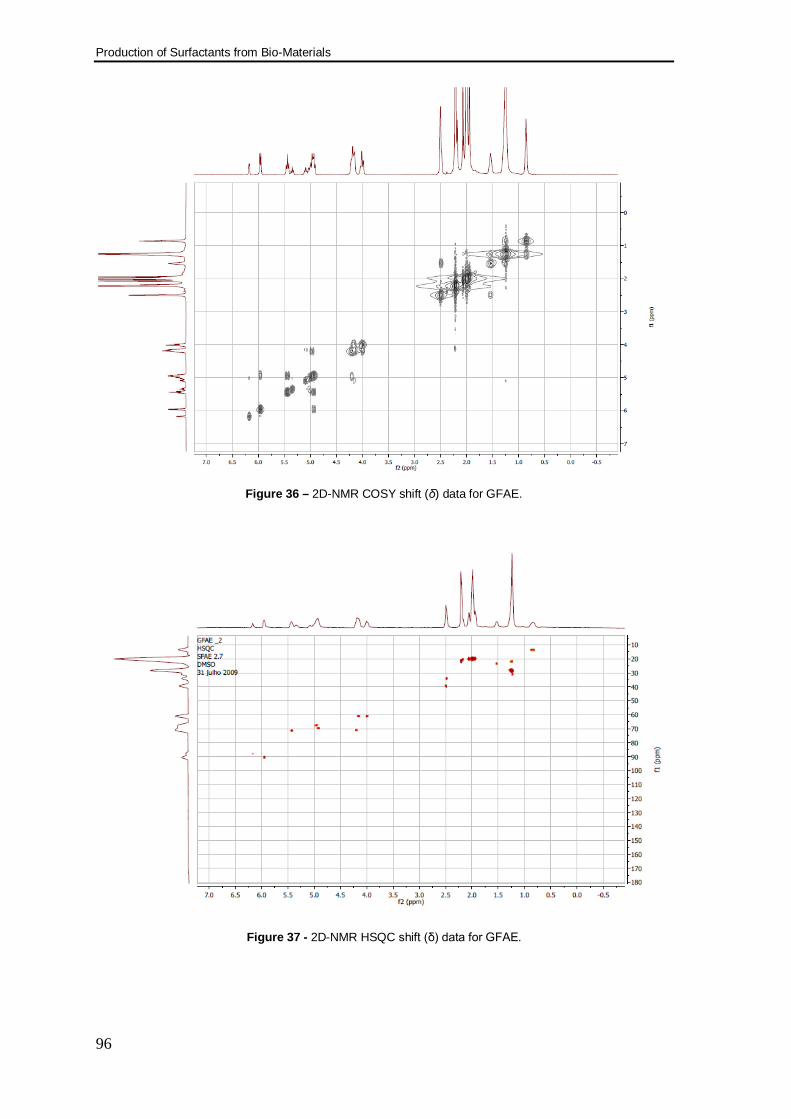
Production of Surfactants from Bio-Materials
96
Figure 36 – 2D-NMR COSY shift (δ) data for GFAE.
Figure 37 - 2D-NMR HSQC shift (δ) data for GFAE.
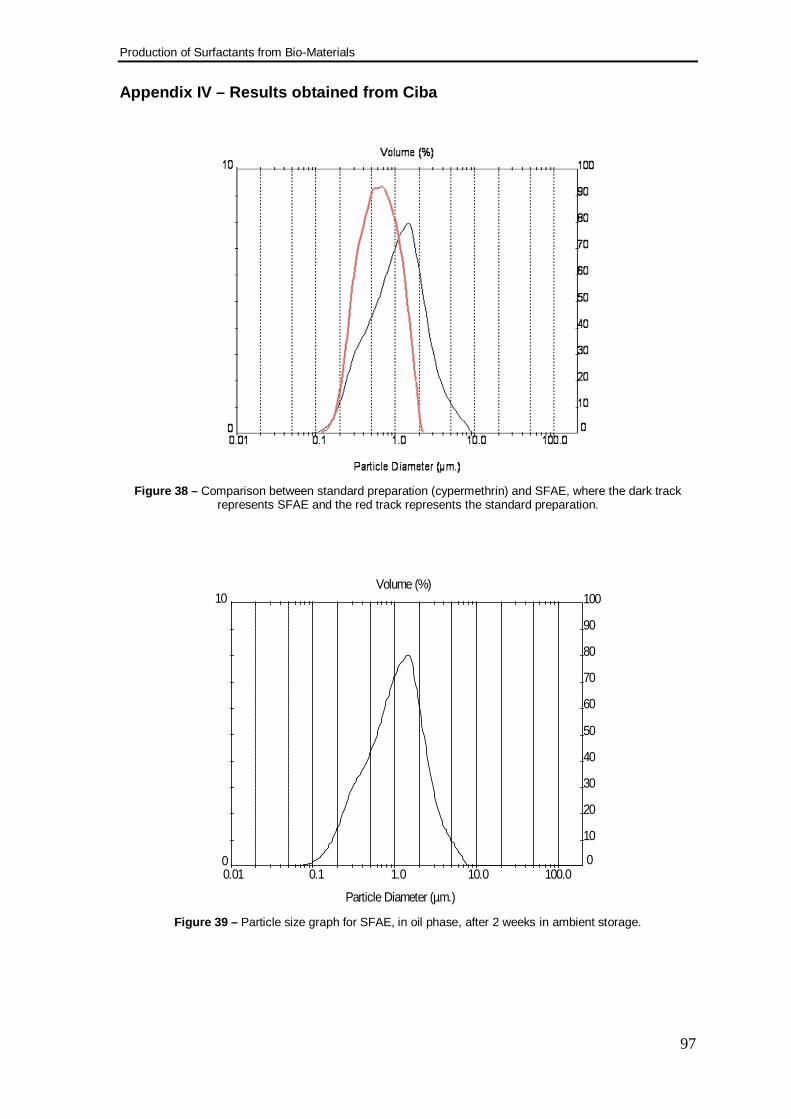
Production of Surfactants from Bio-Materials
97
Appendix IV – Results obtained from Ciba
Figure 38 – Comparison between standard preparation (cypermethrin) and SFAE, where the dark track
represents SFAE and the red track represents the standard preparation.
Particle Diameter (µm.)
Volume (%)
0
10
0
10
20
30
40
50
60
70
80
90
100
0.01 0.1 1.0 10.0 100.0
Figure 39 – Particle size graph for SFAE, in oil phase, after 2 weeks in ambient storage.
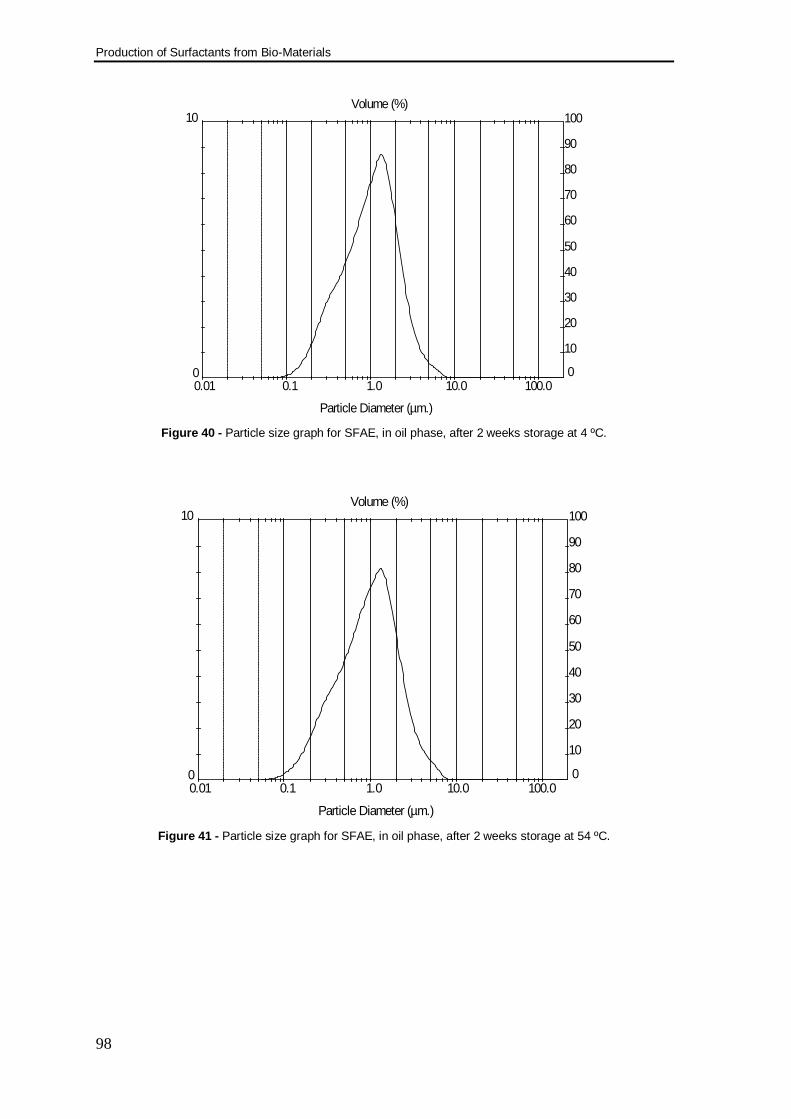
Production of Surfactants from Bio-Materials
98
Particle Diameter (µm.)
Volume (%)
0
10
0
10
20
30
40
50
60
70
80
90
100
0.01 0.1 1.0 10.0 100.0
Figure 40 - Particle size graph for SFAE, in oil phase, after 2 weeks storage at 4 ºC.
Particle Diameter (µm.)
Volume (%)
0
10
0
10
20
30
40
50
60
70
80
90
100
0.01 0.1 1.0 10.0 100.0
Figure 41 - Particle size graph for SFAE, in oil phase, after 2 weeks storage at 54 ºC.