INJEÇÃO DE CO2 PARA PRODUÇÃO ACRESCIDA DE METANO DE CARVÃO ... injection_CBM_C.Rodrigues... ·...
44
INJEÇÃO DE CO 2 PARA PRODUÇÃO ACRESCIDA DE METANO DE CARVÃO EM CAMADA CO 2 INJECTION FOR ENHANCED COALBED METHANE (ECBM) C.F. Rodrigues 1 & M.J. Lemos de Sousa 3 1 FP-ENAS, University of Fernando Pessoa, Praça de 9 de Abril, 349, 4249-004 Porto. Portugal. E-mail: cfrodrig@gmail .com 3 FP-ENAS, University of Fernando Pessoa, Praça de 9 de Abril, 349, 4249-004 Porto. Portugal and Academia das Ciências de Lisboa, Rua da Academia das Ciências, 19, 1249-122 Lisboa. Portugal. E-mail: lemosdesousa@gmail .com Workshop: Tecnologias CCUS Universidade de São Paulo, 16 Novembro 2017
Transcript of INJEÇÃO DE CO2 PARA PRODUÇÃO ACRESCIDA DE METANO DE CARVÃO ... injection_CBM_C.Rodrigues... ·...
INJEÇÃO DE CO2 PARA PRODUÇÃO ACRESCIDA DE METANO DE CARVÃO
EM CAMADA
CO2 INJECTION FOR ENHANCED COALBED METHANE (ECBM)
C.F. Rodrigues1 & M.J. Lemos de Sousa3
1 FP-ENAS, University of Fernando Pessoa, Praça de 9 de Abril, 349, 4249-004
Porto. Portugal. E-mail: [email protected]
3 FP-ENAS, University of Fernando Pessoa, Praça de 9 de Abril, 349, 4249-004
Porto. Portugal and Academia das Ciências de Lisboa, Rua da Academia das
Ciências, 19, 1249-122 Lisboa. Portugal. E-mail: [email protected]
Workshop: Tecnologias CCUS
Universidade de São Paulo, 16 Novembro 2017

WHY
CO2-ECBM?

►SECURE
►COMPETITIVE
►SUSTAINABLE ENERGY
CLIMATE STRATEGY

REAL ENERGY DEMAND
NON-RENEWABLE ENERGIES
Zero Emissions
Technologies
CCS Technologies
Clean Coal Technologies
ED 2009/31/ECGeological Storage of CO2
Coal to Liquids
ED 2003/87/EC
ED 2004/101/EC
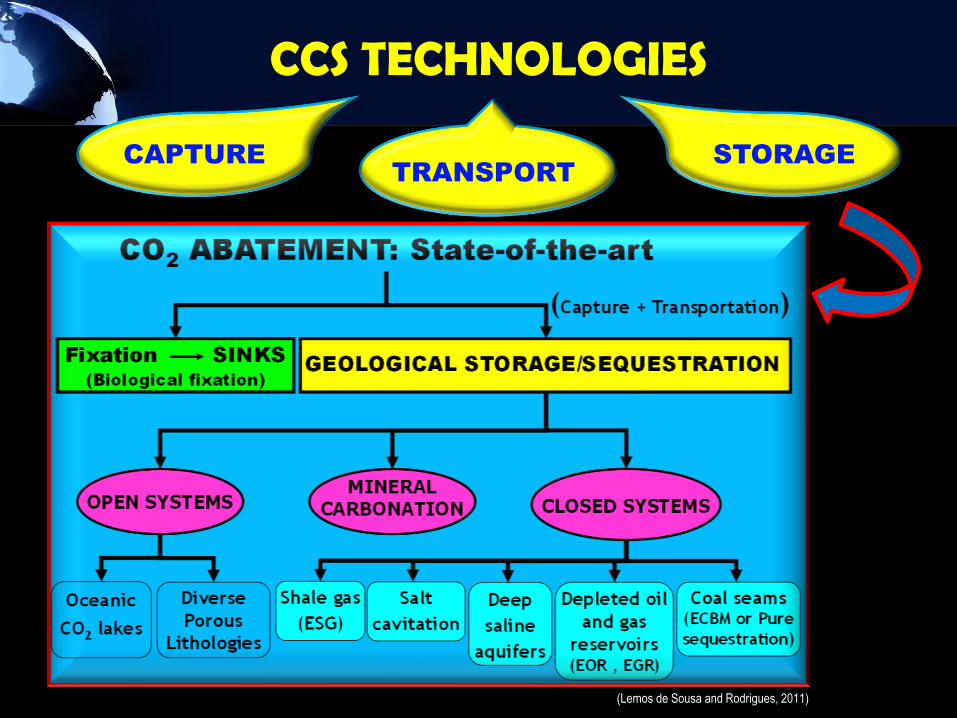
CCS TECHNOLOGIES
CAPTURE STORAGETRANSPORT
(Lemos de Sousa and Rodrigues, 2011)
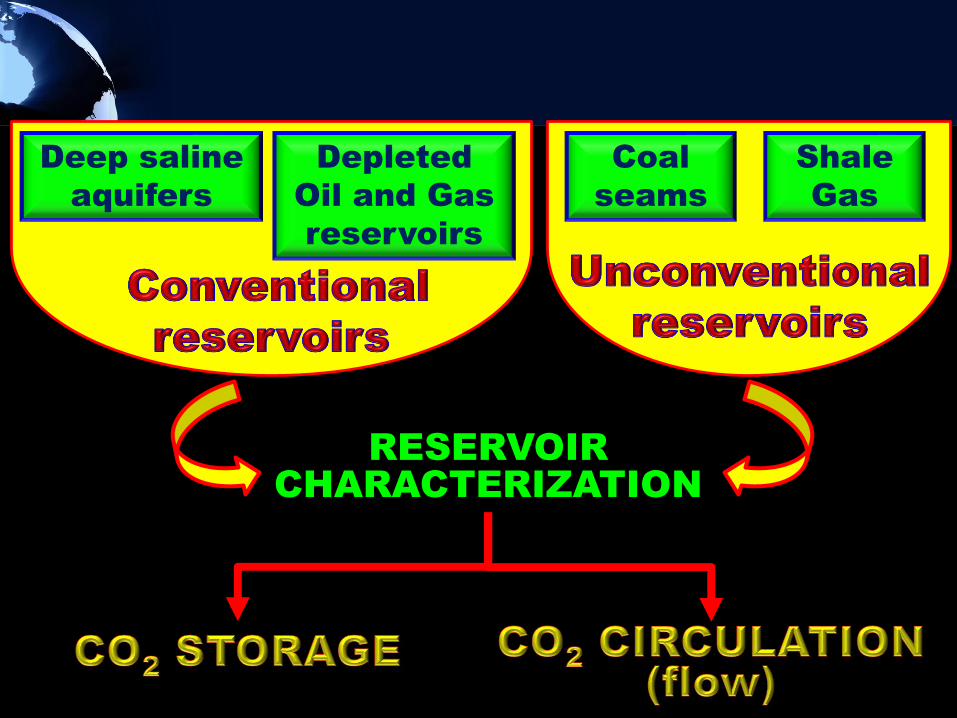
Deep saline
aquifers
Depleted
Oil and Gas
reservoirs
Coal
seams
RESERVOIR CHARACTERIZATION
Shale
Gas

No
►STORAGE
►CIRCULATION
ALL THE RESERVOIRS HAVE THE SAME PERFORMANCE IN…
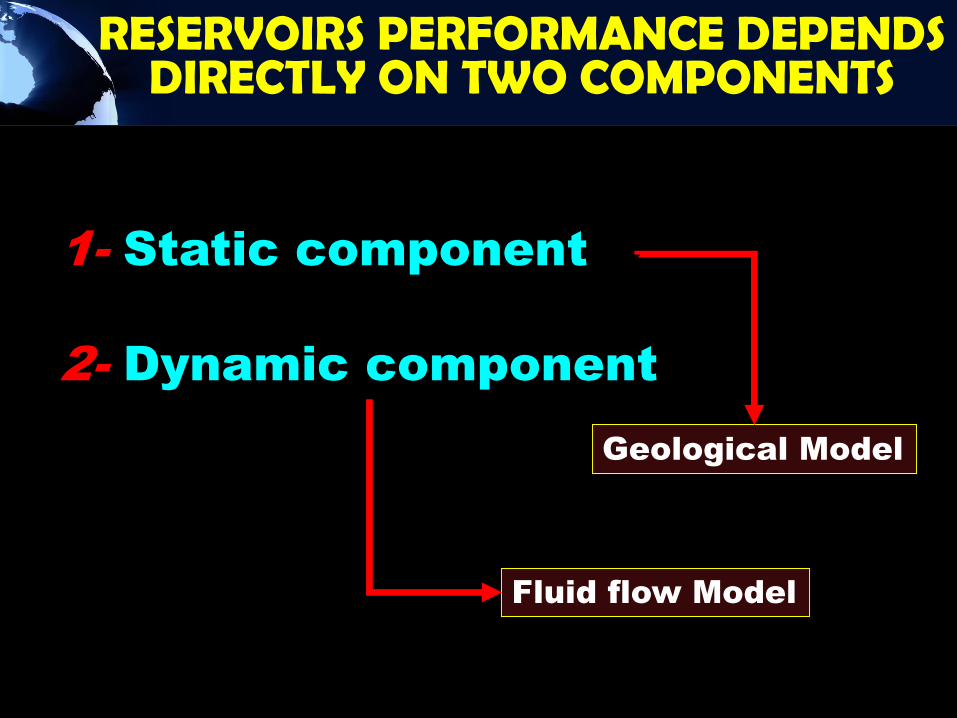
1- Static component
2- Dynamic component
Geological Model
Fluid flow Model
RESERVOIRS PERFORMANCE DEPENDS DIRECTLY ON TWO COMPONENTS

CONCEPTS NEED TO BE
UNDERSTOOD?

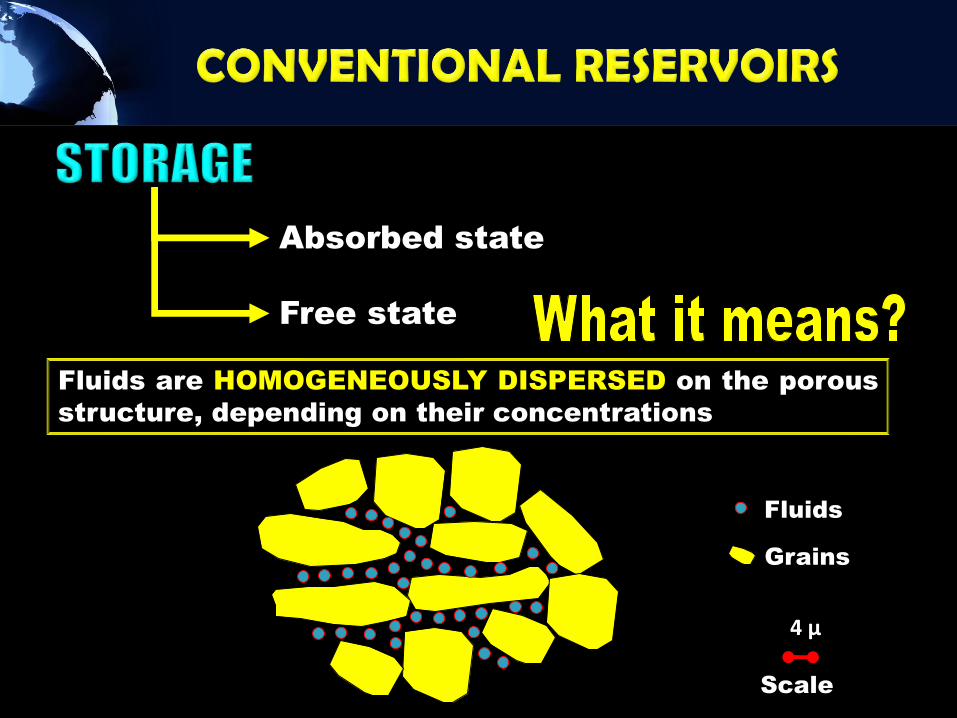
Free state
Absorbed state
Scale
4 µ
Grains
Fluids
Fluids are HOMOGENEOUSLY DISPERSED on the porous
structure, depending on their concentrations

Laminar Flow
u = flow rate (cm/s)
K = permeability (mD or D)
µ = fluid viscosity
P = pressure (atm)
Z = distance (cm)
dz
dp
m=
ku -
Fluid circulates into a specific direction depending on the
PRESSURE GRADIENT and on FLUID VISCOSITY.
Darcy Law

Free state
Absorbed state
Adsorbed state
Fluids are HETEROGENEOUSLY DISPERSED
on the porous structure.
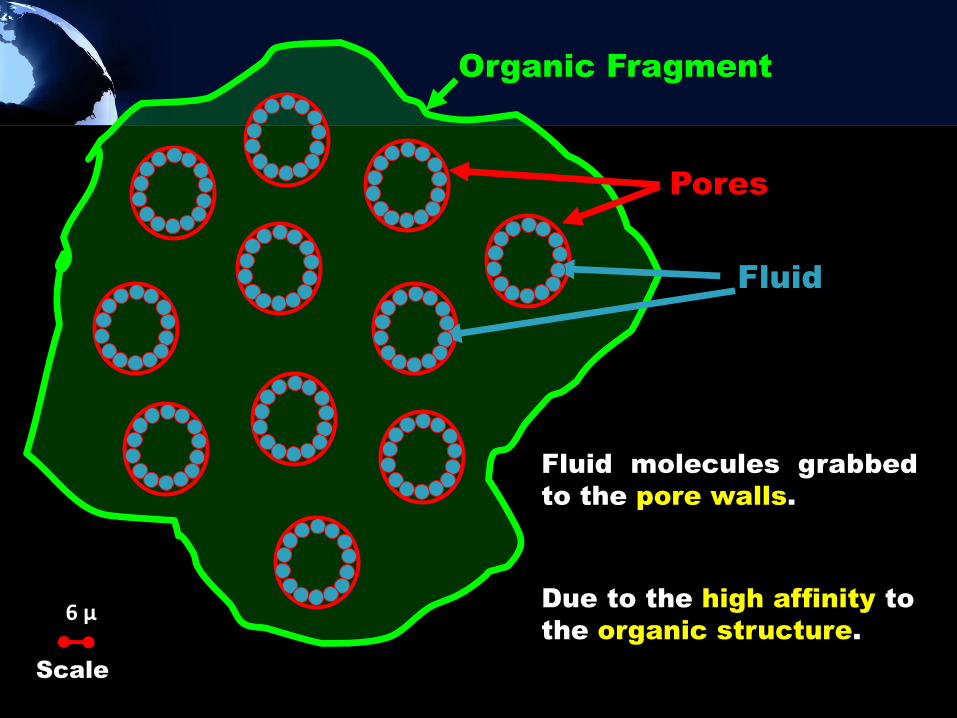
Fluid molecules grabbed
to the pore walls.
Due to the high affinity to
the organic structure.
Organic Fragment
Pores
Fluid
Scale
6 µ
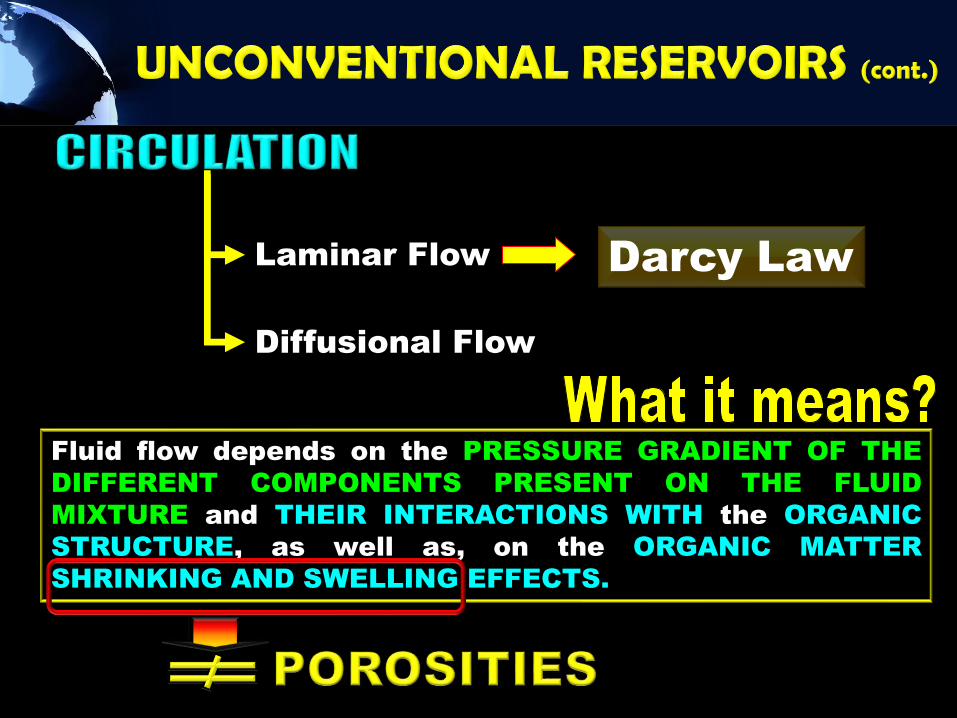
Laminar Flow
Fluid flow depends on the PRESSURE GRADIENT OF THE
DIFFERENT COMPONENTS PRESENT ON THE FLUID
MIXTURE and THEIR INTERACTIONS WITH the ORGANIC
STRUCTURE, as well as, on the ORGANIC MATTER
SHRINKING AND SWELLING EFFECTS.
Darcy Law
Diffusional Flow

CONVENTIONAL RESERVOIRSVS
UNCONVENTIONAL RESERVOIRS
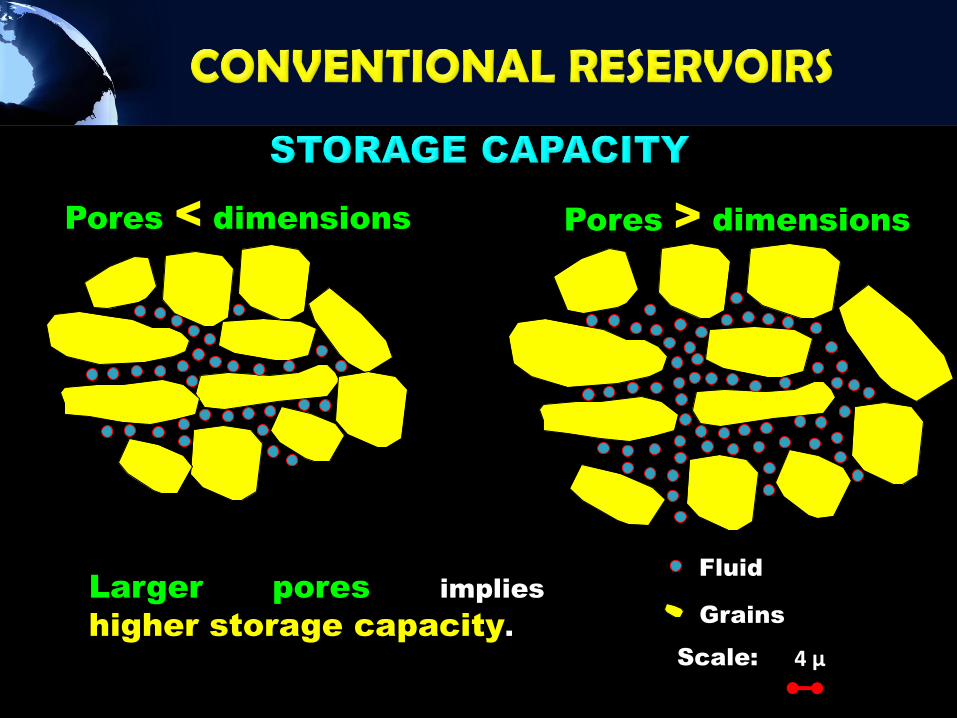
Scale: 4 µ
Grains
FluidLarger pores implies
higher storage capacity.
Pores < dimensions Pores > dimensions
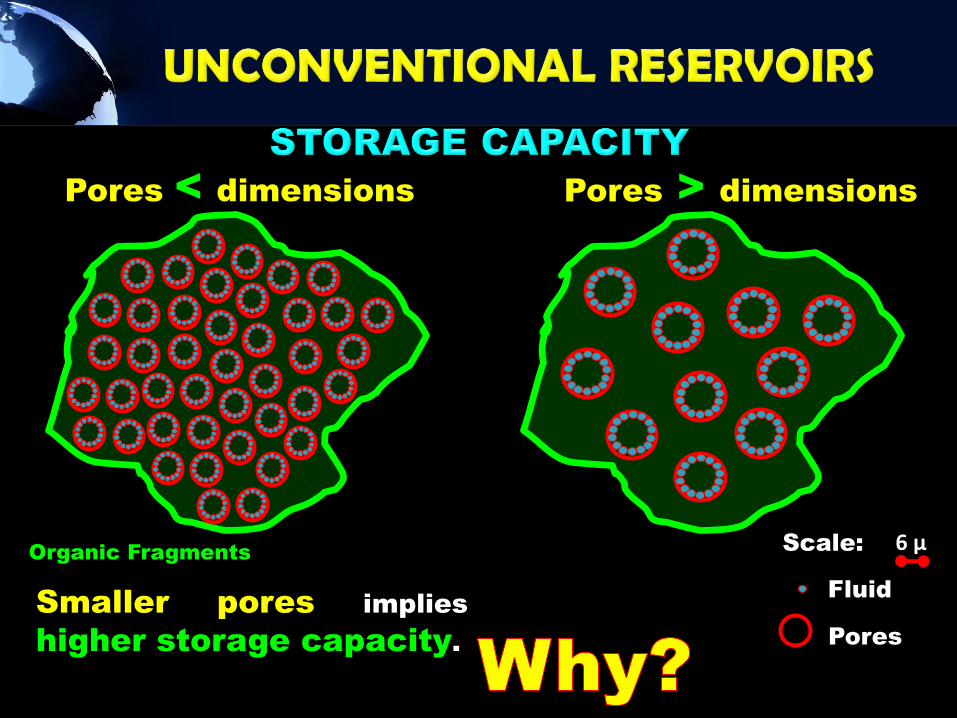
Scale: 6 µ
Pores < dimensions Pores > dimensions
Pores
FluidSmaller pores implies
higher storage capacity.
Organic Fragments
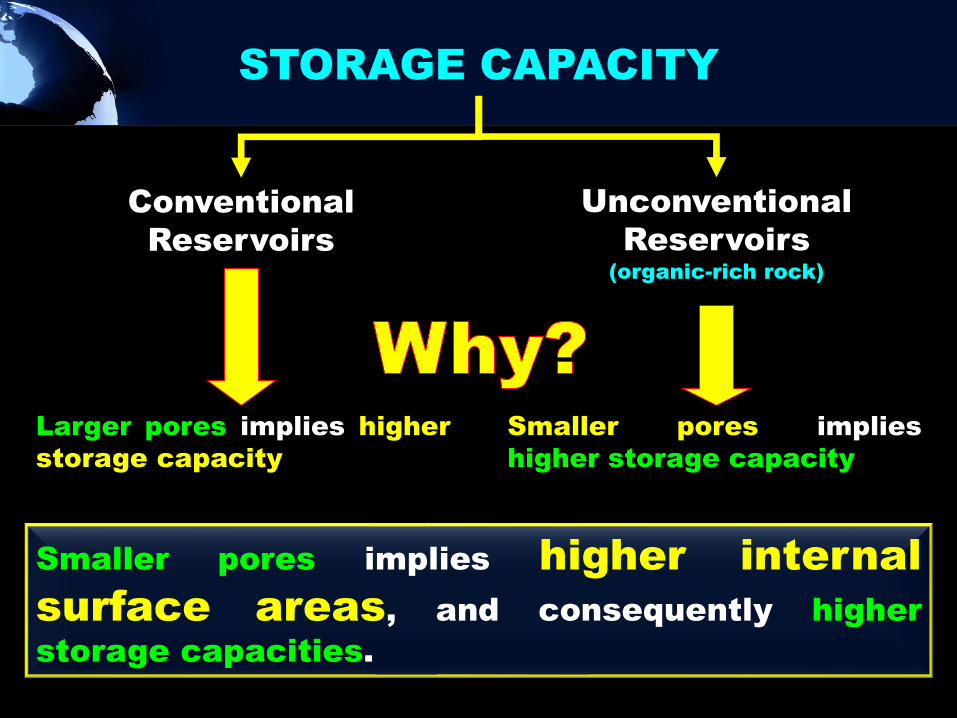
STORAGE CAPACITY
Conventional
Reservoirs
Larger pores implies higher
storage capacity
Unconventional
Reservoirs(organic-rich rock)
Smaller pores implies
higher storage capacity
Smaller pores implies higher internal
surface areas, and consequently higher
storage capacities.
CO2-ECBM
HOW IT WORKS ?

Dewatering
stage
Stableproduction
stageDecline
stage
Production
TIME
CBM PRODUCTION HISTORY
(Rice et al. 1993)
(Rodrigues, 2002)
Dewatering and reservoir
pressure depletion is a simple
but relatively inefficient
process, recovering less than
50% of the gas in place.
CBM wells initially primarily produce water;
then gas production eventually increases,
while water production declines.
Dewatering (drilling of a well) induces the
hydrostatic pressure reduction and
consequently accelerates the desorption
process.

FACTORS INFLUENCING CO2 STORAGE AND ENHANCED GAS RECOVERY IN COAL SEAMS
ECBM and storage of CO2 in coal seams processes involve:
1. CAPTURING CO2 from a flue gas stream
2. COMPRESSING CO2 for transport to an injection site
3. INJECTION of CO2 into the coal to enhance methane recovery
and/or store CO2.
► Fracture permeability
► Development history
► Gas migration
► Coal maturation
► Coal distribution
► Geologic structure
► Well completion options
► Hydrostatic pressure
► Produced water management
CBM and ECBM PRODUCTION POTENTIAL DEPENDS ON :
VARY FROM
BASIN TO BASIN

CO2 INJECTION ECBM RECOVERY:HOW IT WORKS ?
► To reduce the hydrostatic pressure, usually by dewatering the
formation and/or to reduce the partial pressure of the methane
by injecting CO2 and then the methane on the surface gets displaced by the
CO2
► Hydraulic fracturing are, normally, used to assist recovery
► Many wells at relatively close spacing must be drilled to
achieve economic gas production
Fracture (CLEAT)
system one of the
main controlling
factor
LOW PERMEABILITY IS A FACT, SO…

►CO2 is stored in coal following two process: sorption and
diffusion.
► In coal seams, ADSORPTION TRAPPING is the MAIN
SEQUESTRATION METHOD.
►The adsorption process causes the CO2 to bond to the
coal structure, which will allow to CO2 TO BE
PHYSICALLY AND “PERMANENTLY” TRAPPED on the
coal, provided sufficient pressure is maintained.
COAL IS A SAFETY AND A PERMANENT”OPTION FOR CO2 STORAGE ?
CO2 can safely remain stored
in coal for GEOLOGICALLY
SIGNIFICANT TIME PERIODS

PREDICTION OF CO2SEQUESTRATION CAPACITY
ORIGINAL GAS IN PLACE
(OGIP) VOLUMETRIC
COMPUTATION
EQUATION TO ESTIMATE
CO2 STORAGE CAPACITY IN
COAL SEAM(S)
Defined by Simplifying
This equation is applicable for 100% gas saturation in coal matrix and
adsorption process as the main and the only storage mechanism in coal seams.
CO2 STORAGE CAPACITY = CO2 density, kg/m3 x Prospective area, m2
x Coal seam(s) thickness, m x Coal bulk density, kg/m3 x Gas sorption
capacity, m3/kg

COAL PROPERTIES AT A RESERVOIR
SCALE ?

IT IS MAINLY CONTROLLED BY PHYSICAL MECHANISMS
COAL IS A
MICROPOROUS
RESERVOIR
Micropores
Mesopores
Macropores
It means
Gas in coal is mainly stored in the adsorbed
state on the INTERNAL SURFACE AREA of the
coal microporous structure.
To store a volume of gas much higher
than its pore volume capacity.
GAS STORAGE IN A COAL SEAM
It means

Was used to establish the adsorbed
volume kinetic equilibrium
LLg PPPVV =
Vg - Gas volume (m3/ton)
P - Equilibrium pressure (MPa)
VL - Langmuir Volume (m3/ton)
PL - Langmuir Pressure (MPa)
METHODOLOGY
SORPTION ISOTHERMS
2
13851.3
=
ii
s
VV
brD
D - Diffusion coefficient (cm2/sec)
b - Slope (first linear part of the data curve)
rs - Spherical particle radius (cm)
Vi - Gas content at the end of step I (cm3/ton)
Vi-1 - Gas content at the end of step I-1 (cm3/ton)
Requires precise and continuous monitoring ofchanges in pressure and gas concentration in bothcells, during the whole sorption
DETAILED STUDY OF THE CLEAT SYSTEM

►PRESSURE
►TEMPERATURE
►GAS COMPOSITION
►MOISTURE
►PETROGRAPHIC CHARACTERISTICS
►Mean Random Vitrinite Reflectance
►Vitrinite content
►Liptinite content
► Inertinite content
►Mineral Matter content
PARAMETERS CAPABLE TO INFLUENCE SORPTION BEHAVIOR

PRESSURE EFFECT
0
1
2
3
4
5
6
7
0 1 2 3 4 5 6
Pressure (MPa)
Gas
Volume (cm
3/g
)
P2
P1
G2
G1
40
80
120
160
200
240
200 400 600 800psi
P1
G1

TEMPERATURE EFFECT
0
2
4
6
8
10
12
14
0 2 4 6 8
Pressure (MPa)
Gas
Volum
e (cm
3/g
)
80
160
240
320
400
480
250 500 750 1000psi
T = 30ºC
T = 22ºC 15%
T = 30ºC
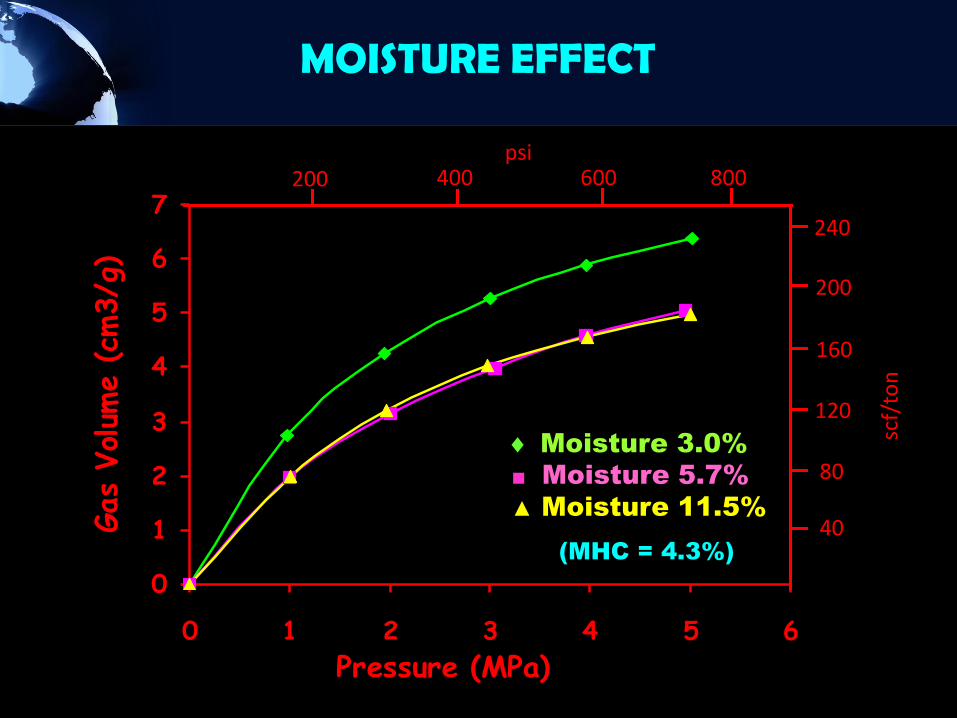
MOISTURE EFFECT
0
1
2
3
4
5
6
7
0 1 2 3 4 5 6
Pressure (MPa)
Gas
Volum
e (cm
3/g
)
Moisture 3.0%
■ Moisture 5.7%
▲ Moisture 11.5% 40
80
120
160
200
240
200 400 600 800psi
(MHC = 4.3%)
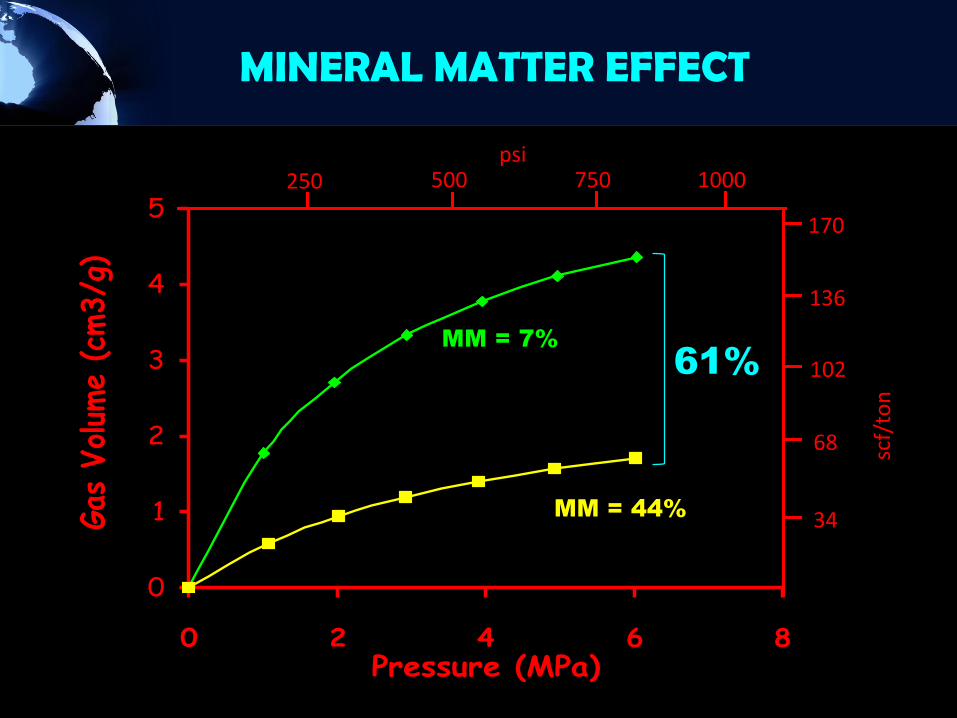
MINERAL MATTER EFFECT
0
1
2
3
4
5
0 2 4 6 8Pressure (MPa)
Gas
Volum
e (c
m3/g
)
MM = 44%
MM = 7%61%
34
68
102
136
170
250 500 750 1000psi

RANK EFFECT
0
1
2
3
4
5
6
7
0 2 4 6 8
Pressure (MPa)
Gas
Volum
e (c
m3/g
) Rr = 1.93%
Rr = 0.91%
Rr = 0.43%
63%
28%
40
80
120
160
200
240
250 500 750 1000psi
scf/
ton

PETROGRAPHIC COMPOSITION EFFECT
0
1
2
3
4
5
6
7
0 1 2 3 4 5 6
Pressure (MPa)
Gas
Volum
e (c
m3/g
)
V=72%; L=6%; I=22%
V=83%; L=6%; I=11%
40
80
120
160
200
240
200 400 600 800psi
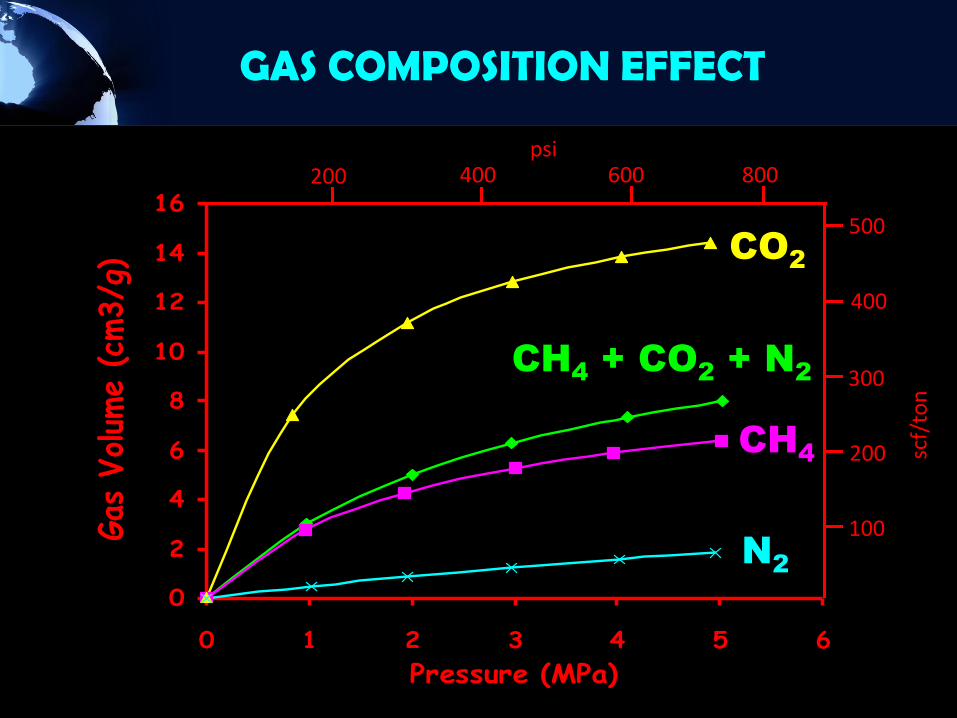
GAS COMPOSITION EFFECT
0
2
4
6
8
10
12
14
16
0 1 2 3 4 5 6
Pressure (MPa)
Gas
Volum
e (c
m3/g
) CO2
N2
CH4 + CO2 + N2
CH4
100
200
300
400
500
200 400 600 800psi
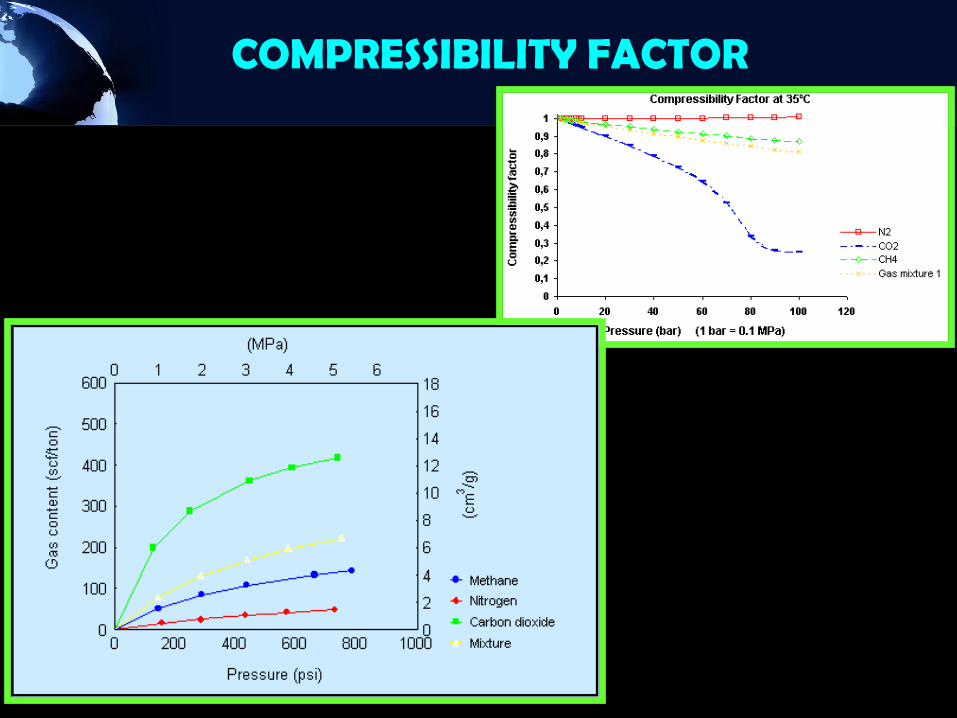
COMPRESSIBILITY FACTOR
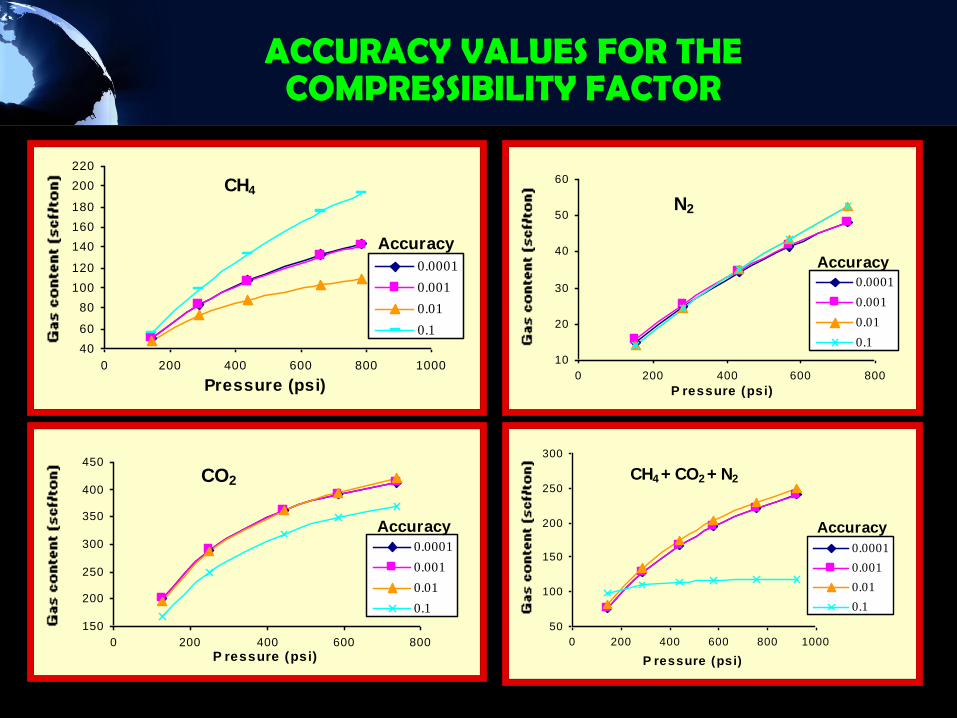
ACCURACY VALUES FOR THE COMPRESSIBILITY FACTOR
10
20
30
40
50
60
0 200 400 600 800
P ressure (psi)
0.0001
0.001
0.01
0.1
N2
Accuracy
50
100
150
200
250
300
0 200 400 600 800 1000
P ressure (psi)
0.0001
0.001
0.01
0.1
CH4 + CO2 + N2
Accuracy
40
60
80
100
120
140
160
180
200
220
0 200 400 600 800 1000
Pressure (psi)
0.0001
0.001
0.01
0.1
Accuracy
CH4
150
200
250
300
350
400
450
0 200 400 600 800
P ressure (psi)
0.0001
0.001
0.01
0.1
Accuracy
CO2
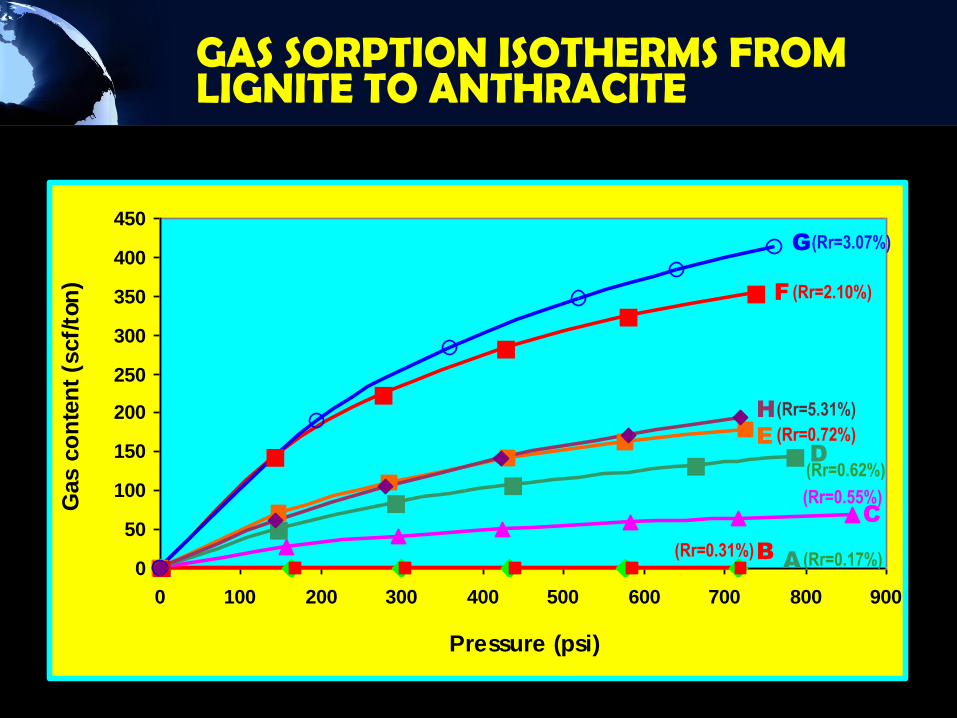
GAS SORPTION ISOTHERMS FROM LIGNITE TO ANTHRACITE
0
50
100
150
200
250
300
350
400
450
0 100 200 300 400 500 600 700 800 900
Pressure (psi)
Gas c
on
ten
t (s
cf/
ton
)
G
F
HE
D
C
B A (Rr=0.17%)(Rr=0.31%)
(Rr=0.55%)
(Rr=0.62%)
(Rr=0.72%)
(Rr=5.31%)
(Rr=2.10%)
(Rr=3.07%)

(a) cleat characteristics in plan view;
(b) cleat hierarchies in cross- section view
(Laubach et al 1998)
DETAILED STUDY OF THE CLEAT SYSTEM

► CLEAT DIRECTIONS RELATIVE TO A REFERENCE
► CLEAT FREQUENCY
► CLEAT HEIGHT
► CLEAT LENGTH
► CLEAT SPACING
► CLEAT APERTURE
► NUMBER OF CLEATS FILLED BY MINERALS
► NUMBER OF CLEAT INTERSECTIONS
(CONNECTIVITY INDEX)
COAL CLEAT CHARACTERISTICS
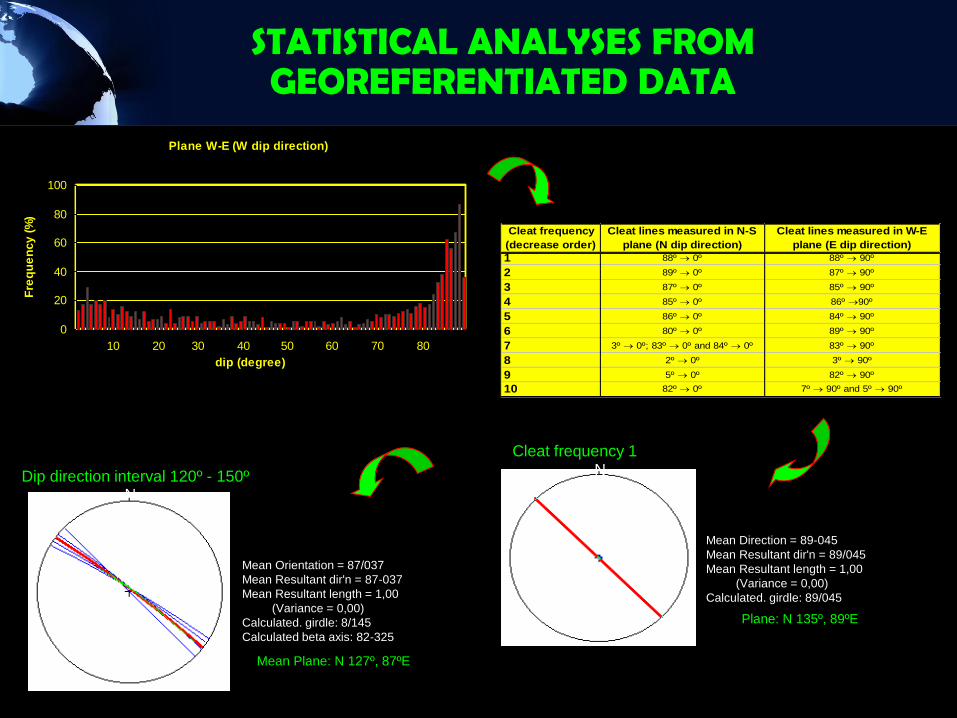
Plane W-E (W dip direction)
0
20
40
60
80
100
dip (degree)
Fre
qu
en
cy (
%)
10 20 30 40 50 60 70 80
Cleat frequency
(decrease order)
Cleat lines measured in N-S
plane (N dip direction)
Cleat lines measured in W-E
plane (E dip direction)
1 88º ® 0º 88º ® 90º
2 89º ® 0º 87º ® 90º
3 87º ® 0º 85º ® 90º
4 85º ® 0º 86º ®90º
5 86º ® 0º 84º ® 90º
6 80º ® 0º 89º ® 90º
7 3º ® 0º; 83º ® 0º and 84º ® 0º 83º ® 90º
8 2º ® 0º 3º ® 90º
9 5º ® 0º 82º ® 90º
10 82º ® 0º 7º ® 90º and 5º ® 90º
Mean Direction = 89-045
Mean Resultant dir'n = 89/045
Mean Resultant length = 1,00
(Variance = 0,00)
Calculated. girdle: 89/045
N
Plane: N 135º, 89ºE
Mean Orientation = 87/037
Mean Resultant dir'n = 87-037
Mean Resultant length = 1,00
(Variance = 0,00)
Calculated. girdle: 8/145
Calculated beta axis: 82-325
N
Mean Plane: N 127º, 87ºE
Dip direction interval 120º - 150º
Cleat frequency 1
STATISTICAL ANALYSES FROM GEOREFERENTIATED DATA
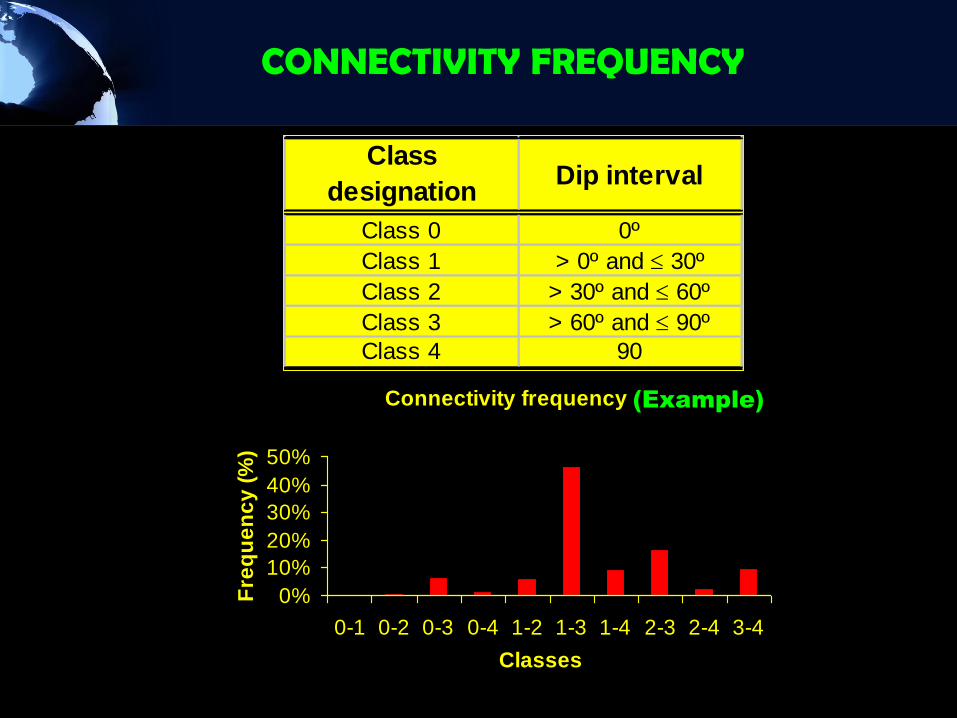
Class
designationDip interval
Class 0 0º
Class 1 > 0º and £ 30º
Class 2 > 30º and £ 60º
Class 3 > 60º and £ 90º
Class 4 90
Connectivity frequency
0%
10%
20%
30%
40%
50%
0-1 0-2 0-3 0-4 1-2 1-3 1-4 2-3 2-4 3-4
Classes
Fre
qu
en
cy
(%
)
CONNECTIVITY FREQUENCY
(Example)

Thank you