
Monitorização e Controlo Inteligente de Consumos Energéticos em ...

Docentes
• Tânia Sousa– [email protected]
• Mário Costa– [email protected]
• Tiago Domingos– [email protected]
Avaliação
• 3 Testes ou 1 Exame (média dos 3 testes ou
exame têm nota mínima de 9.5val.)– Repescagem de 1 teste na data de exame
• Trabalho individual de auditoria aos consumos
energéticos domésticos que pode valer no
máximo 2 valores (opcional)– Preparation an Planning
– Facility inspection
– Field work
– Data analysis
– Reporting
– Energy Action Plan
Aulas
• Slides das aulas teóricas e exercícios das aulas
práticas serão postos no fénix
• Aulas práticas começam dia 21 de Fevereiro
Objectivos da UC
1. Compreender e modelar os fluxos energéticos
à escala do país, à escala sectorial e em
sistemas industriais, em edifícios ou
equipamentos complexos.
2. Definir acções que permitam racionalizar o
uso da energia, quantificando os benefícios
económicos e ambientais destas acções.

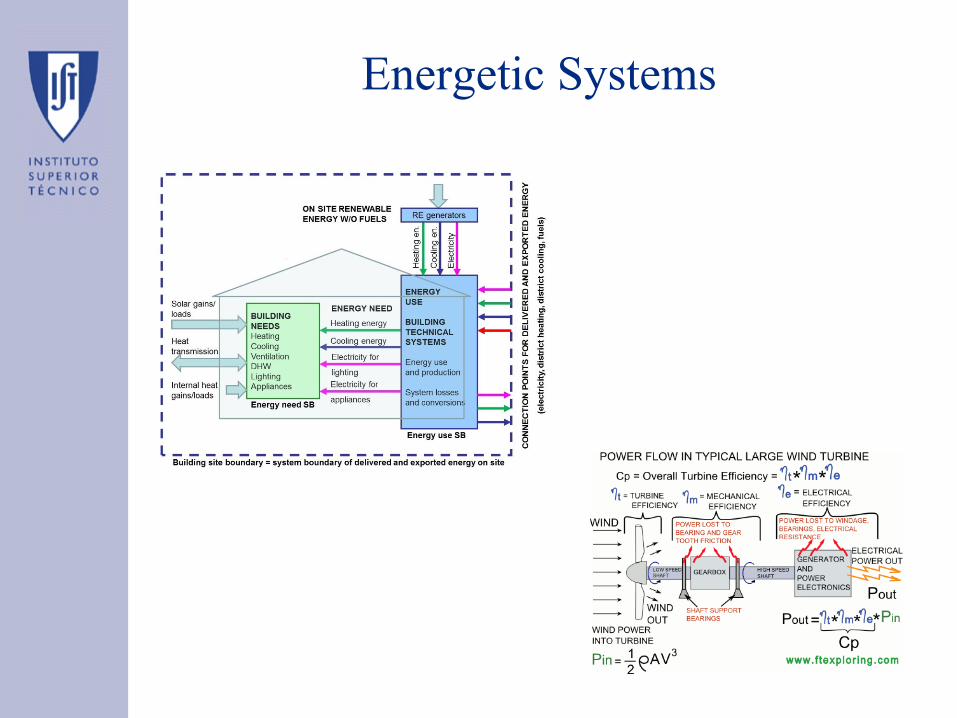
Sistema Energético
• Tem como objectivos satisfazer necessidades
energéticas da sociedade:
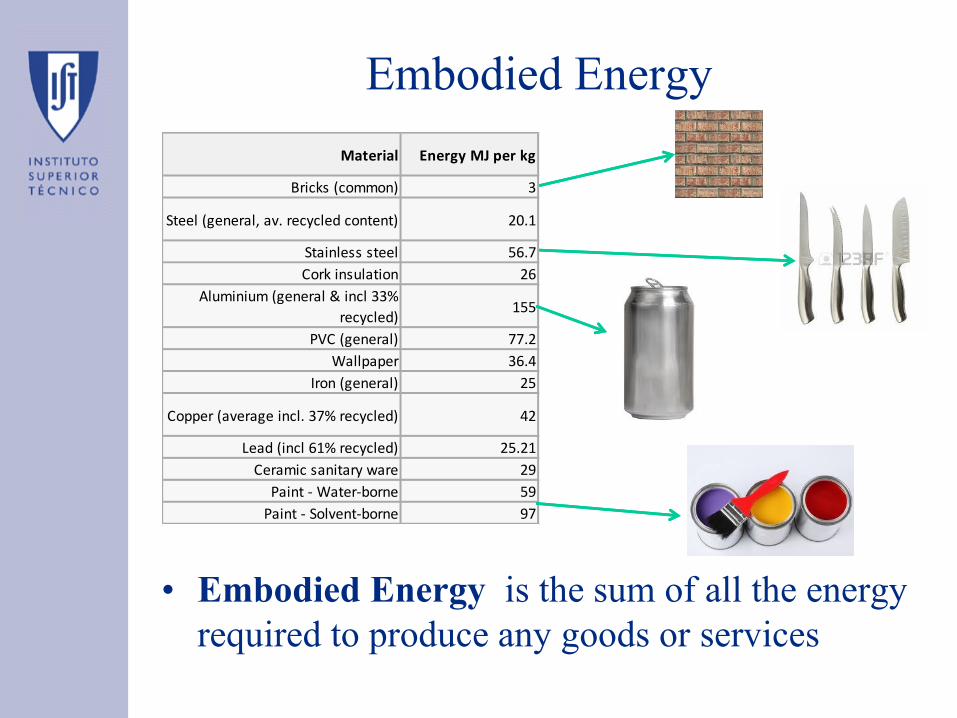
• Embodied Energy is the sum of all the energy
required to produce any goods or services
Embodied Energy
Material Energy MJ per kg
Bricks (common) 3
Steel (general, av. recycled content) 20.1
Stainless steel 56.7
Cork insulation 26
Aluminium (general & incl 33%
recycled)155
PVC (general) 77.2
Wallpaper 36.4
Iron (general) 25
Copper (average incl. 37% recycled) 42
Lead (incl 61% recycled) 25.21
Ceramic sanitary ware 29
Paint - Water-borne 59
Paint - Solvent-borne 97
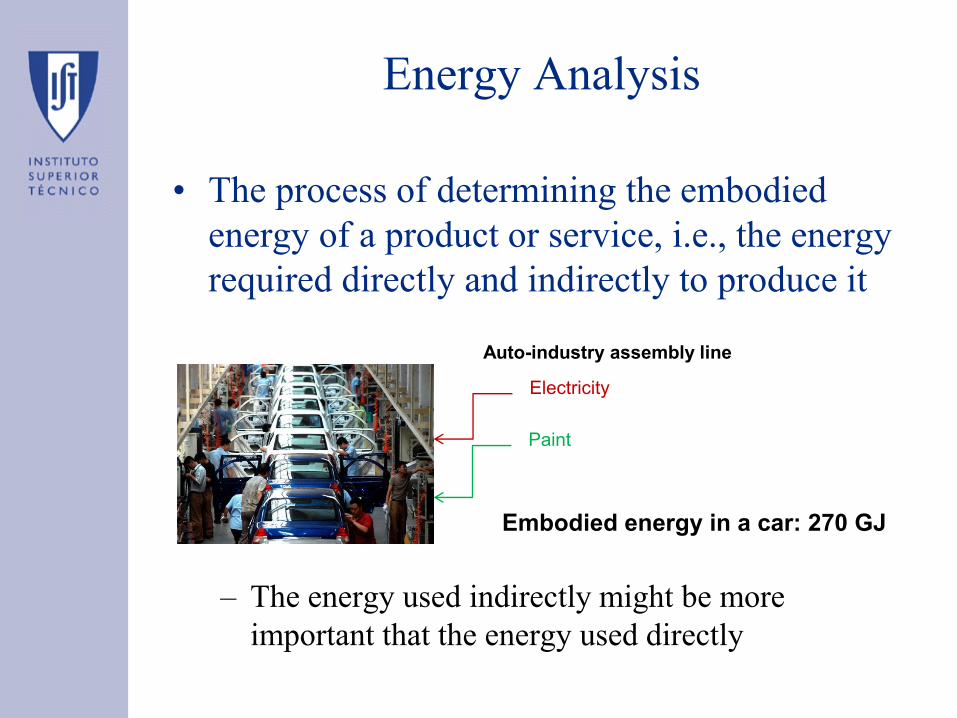
Energy Analysis
• The process of determining the embodied
energy of a product or service, i.e., the energy
required directly and indirectly to produce it
– The energy used indirectly might be more
important that the energy used directly
Auto-industry assembly line
Electricity
Paint
Embodied energy in a car: 270 GJ

Sistema Energético
• Formas de energia útil:
Cullen and Allwood, 2010

From useful energy to energy services
• Passive systems: where useful energy is
delivered into and mostly lost as unwanted
heat, in exchange for energy services such as
thermal comfort, illumination and transport
(Cullen et al., 2011).
10
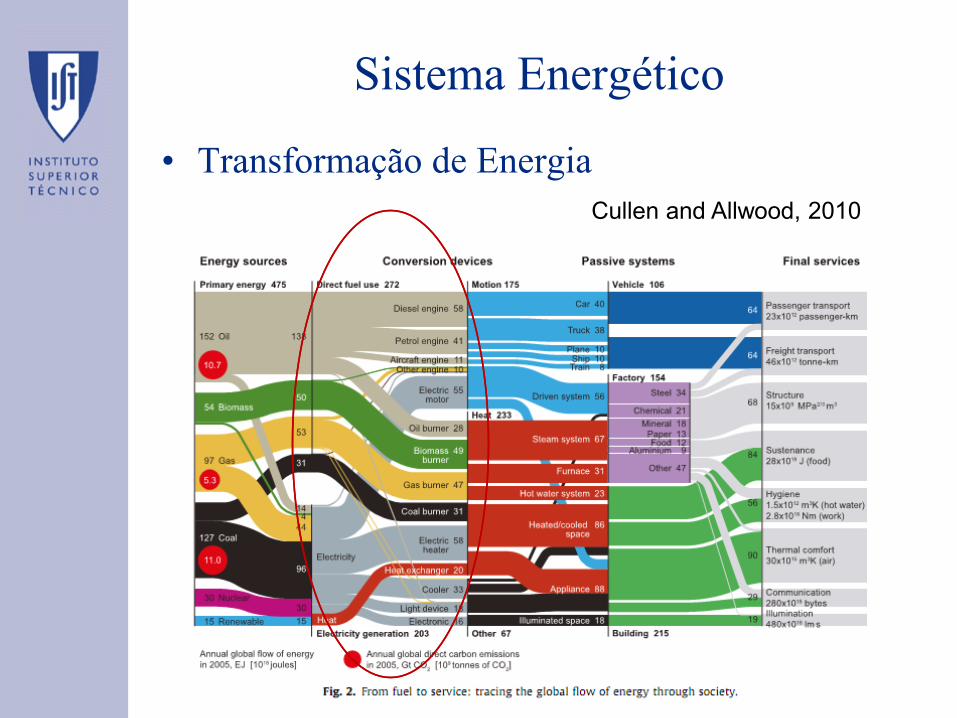
Sistema Energético
• Transformação de Energia
Cullen and Allwood, 2010

Energy efficiencies
• First Law Efficiency
Relevant energy output Relevant energy input
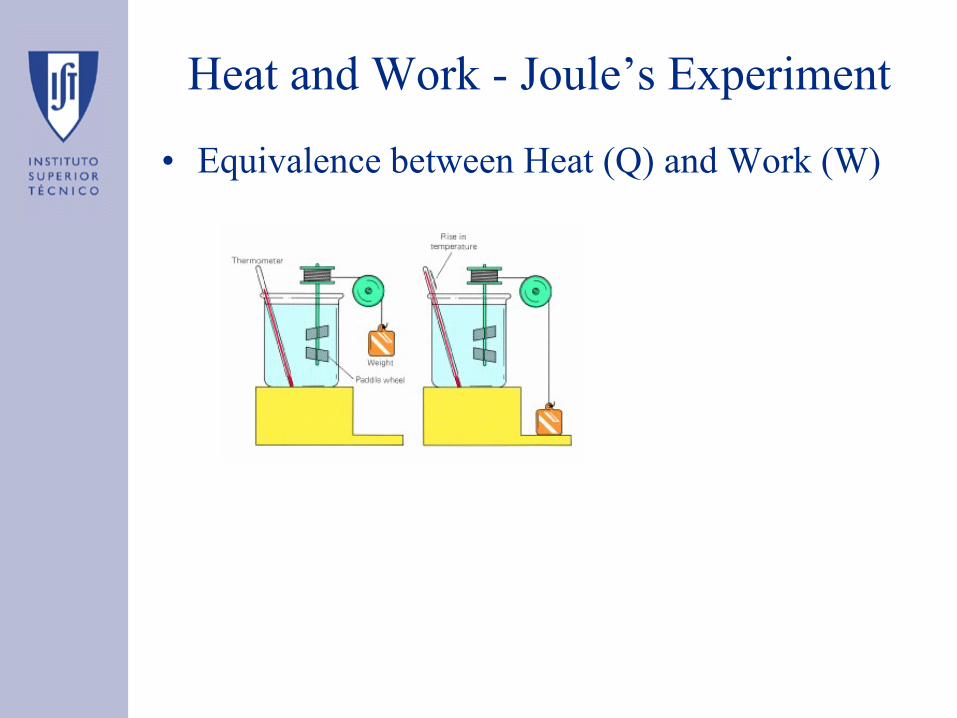
Heat and Work - Joule’s Experiment
• Equivalence between Heat (Q) and Work (W)
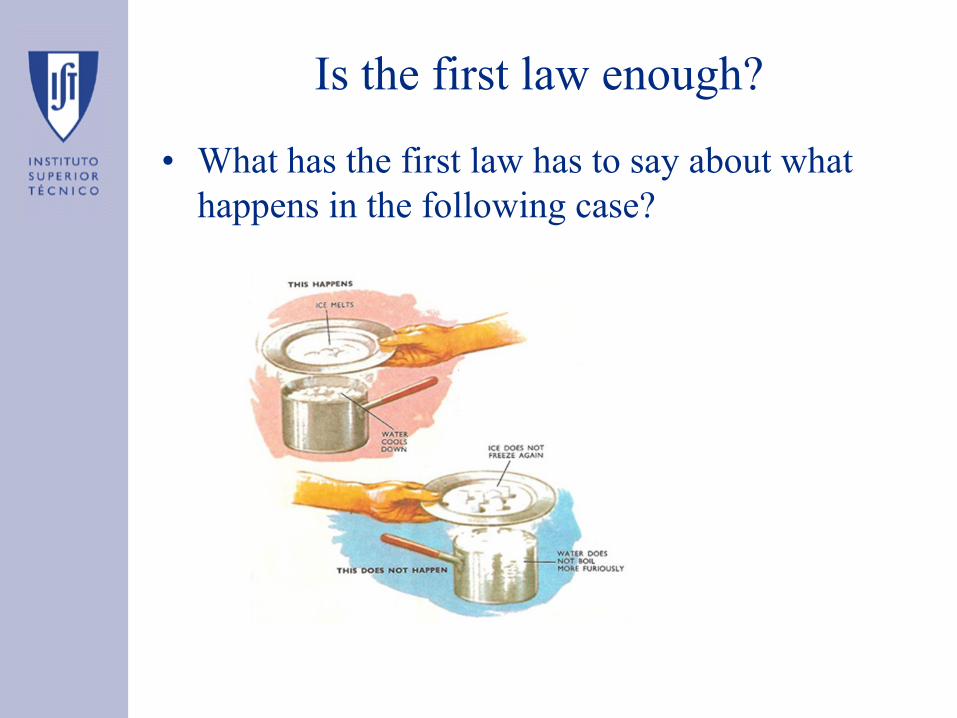
Is the first law enough?
• What has the first law has to say about what
happens in the following case?

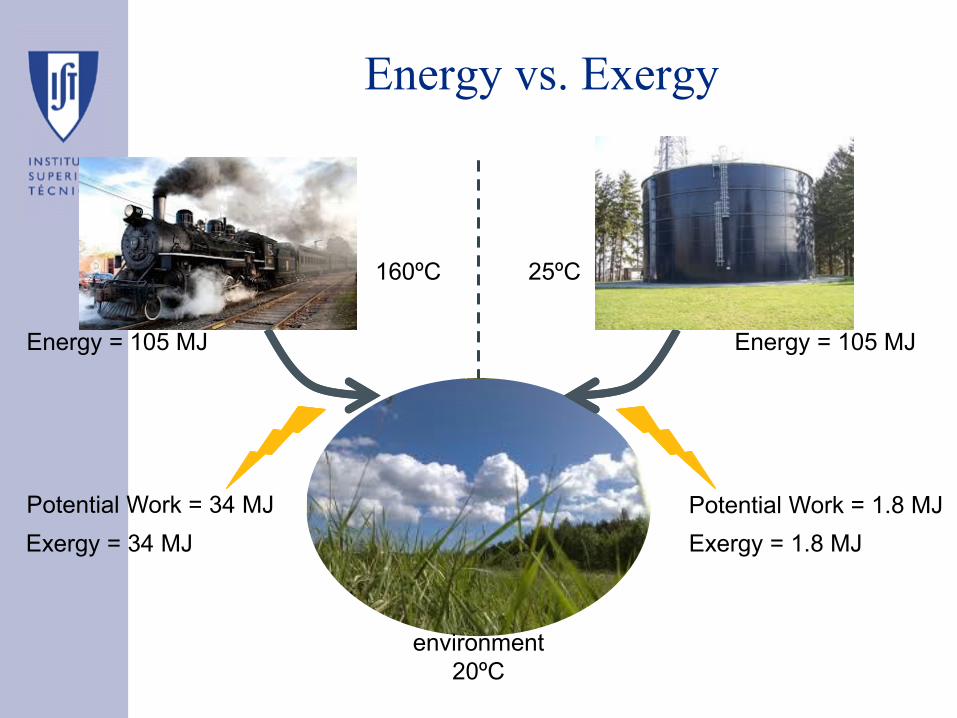
Energy vs. Exergy
160ºC 25ºC
Potential Work = 34 MJ Potential Work = 1.8 MJ
environment
20ºC
Energy = 105 MJ Energy = 105 MJ
Exergy = 34 MJ Exergy = 1.8 MJ
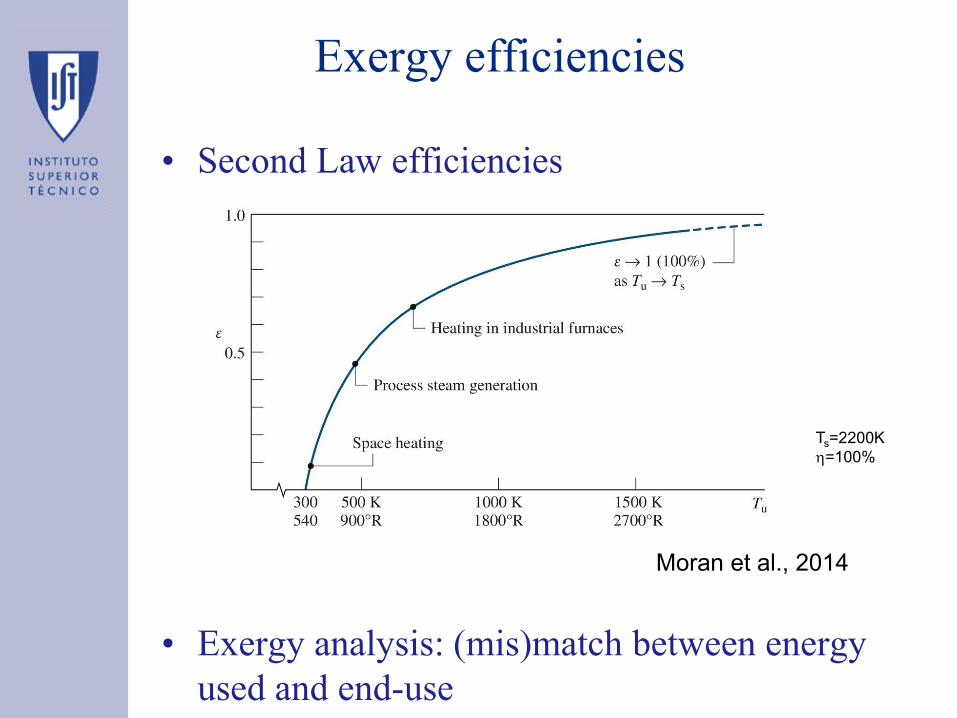
Exergy efficiencies
• Second Law efficiencies
• Exergy analysis: (mis)match between energy
used and end-use
Moran et al., 2014
Ts=2200K
=100%

From Primary Energy to Energy
Services
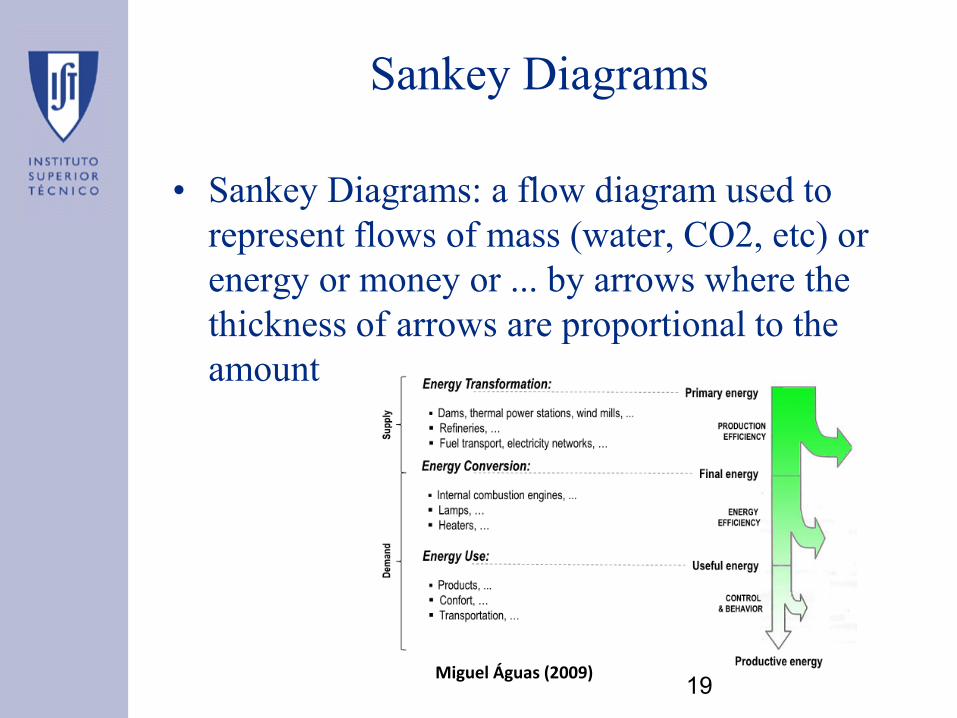
Sankey Diagrams
• Sankey Diagrams: a flow diagram used to
represent flows of mass (water, CO2, etc) or
energy or money or ... by arrows where the
thickness of arrows are proportional to the
amount
Miguel Águas (2009)19
Energetic Systems

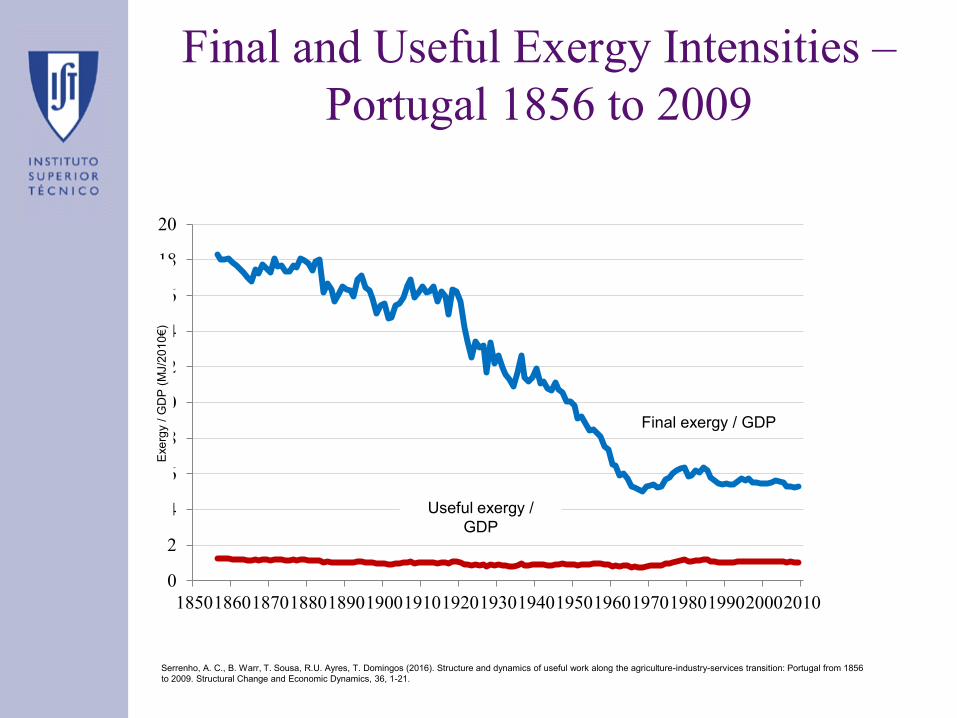
0
2
4
6
8
10
12
14
16
18
20
18501860187018801890190019101920193019401950196019701980199020002010
Final exergy / GDP
Useful exergy /
GDP
Exe
rgy /
GD
P (
MJ/2
01
0€
)
Serrenho, A. C., B. Warr, T. Sousa, R.U. Ayres, T. Domingos (2016). Structure and dynamics of useful work along the agriculture-industry-services transition: Portugal from 1856
to 2009. Structural Change and Economic Dynamics, 36, 1-21.
Final and Useful Exergy Intensities –
Portugal 1856 to 2009
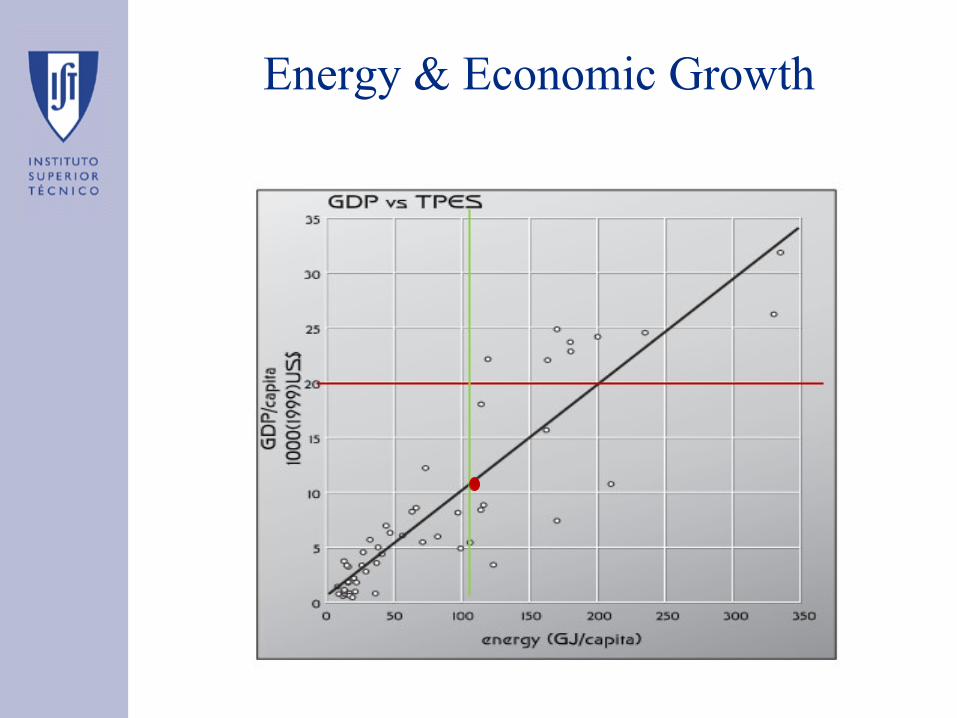
Energy & Economic Growth
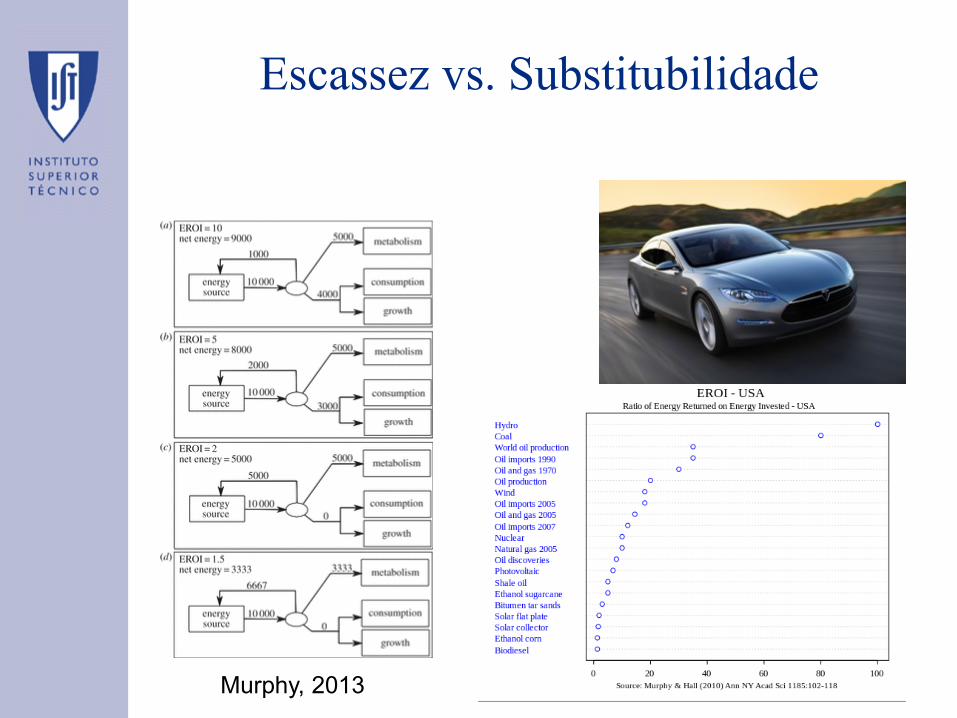
Escassez vs. Substitubilidade
Murphy, 2013
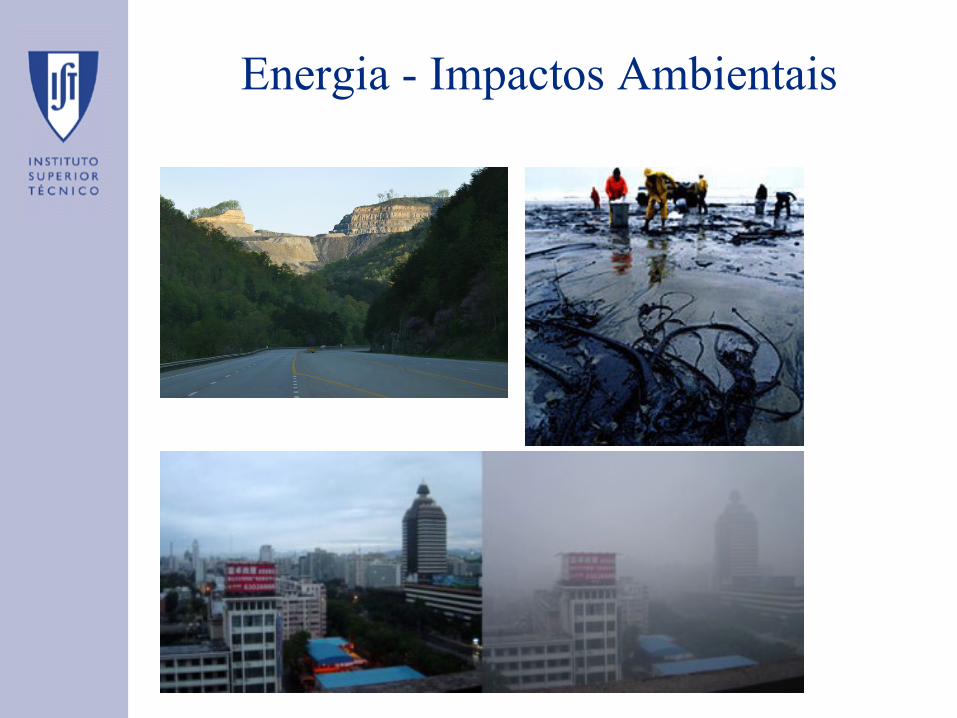
Energia - Impactos Ambientais

Densidade Energética

Energy Management
Class # 9 : Energy Economics
Links Energy-Economy-Environment
• What will the economy in the future look like?
More self-reliant local economies
and ways of life
Global Economy dependent on
renewable energies
Similar to the present but biggerModels will help us understand
the impact of energy supply &
technological innovations &
policy measures on the
environment and the economy?
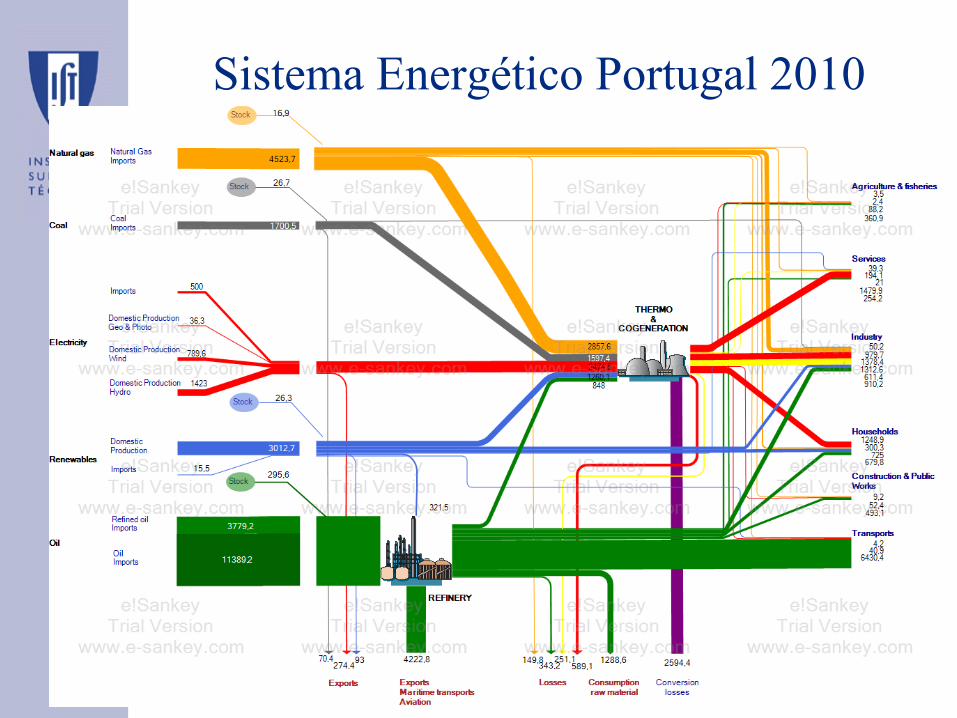
Sistema Energético Portugal 2010
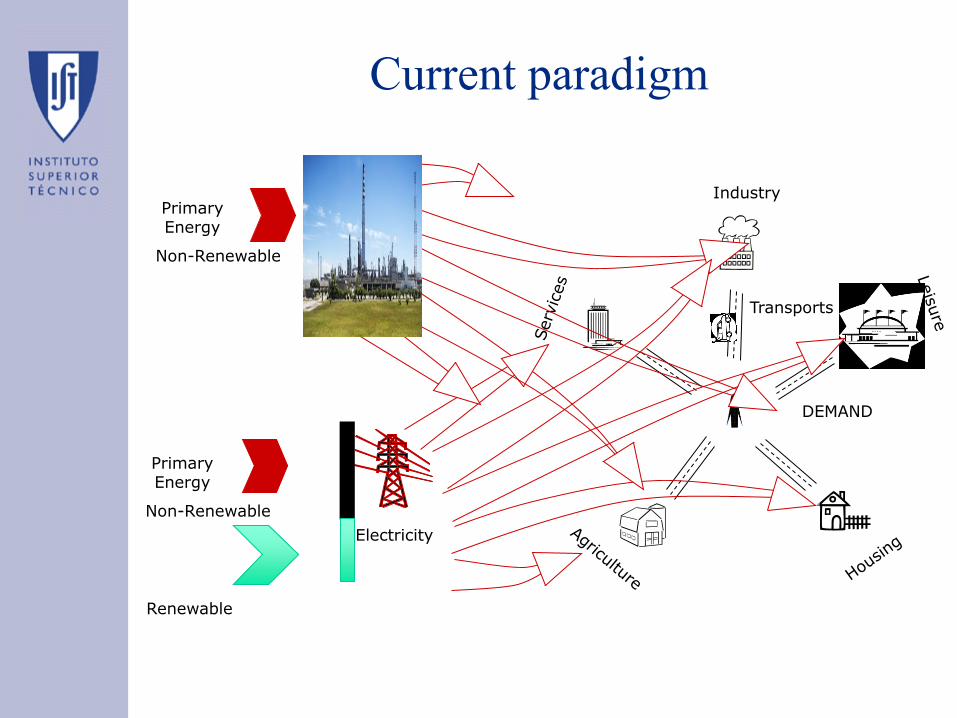
Industry
DEMAND
Transports
Electricity
PrimaryEnergy
Non-Renewable
Current paradigm
PrimaryEnergy
Non-Renewable
Renewable
Industry
DEMAND
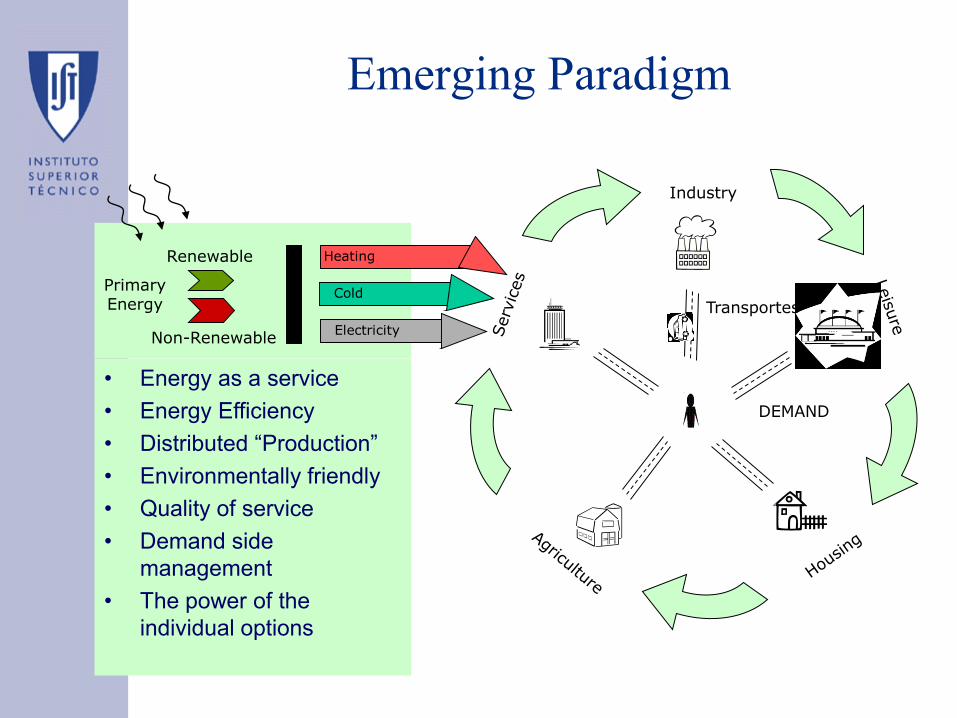
PrimaryEnergy
Non-Renewable
Renewable Heating
Cold
Electricity
Transportes
• Energy as a service
• Energy Efficiency
• Distributed “Production”
• Environmentally friendly
• Quality of service
• Demand side
management
• The power of the
individual options
Emerging Paradigm
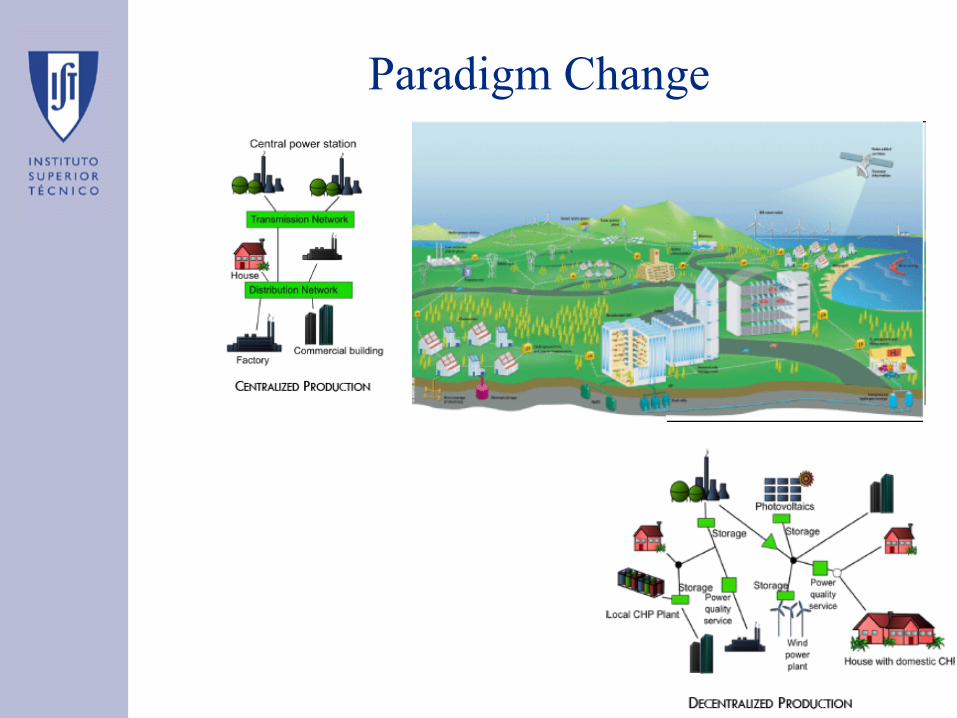
Paradigm Change

Energy use in Industry
• Industrial energy intensity for materials
Gutowski TG, Sahni S, Allwood JM, Ashby MF,Worrell E. 2013 The energy required to produce
materials: constraints on energy-intensity improvements, parameters of demand. Phil Trans R Soc A
371: 20120003.
http://dx.doi.org/10.1098/rsta.2012.0003
Steel
Cement
Paper
Aluminium
Plastics

Gestão de Energia
Slide 33 of 53
Energy use in Buildings
Foam insulation
The most highly insulated houses
have a heat transfer coefficient of
U=0.1-0.2 W/m2/K
Blown-in cellulose
insulation (fills the gaps)
Vaccum insulation panels
Cork 0.06-0.07 W/m/K

Energy use in Transport
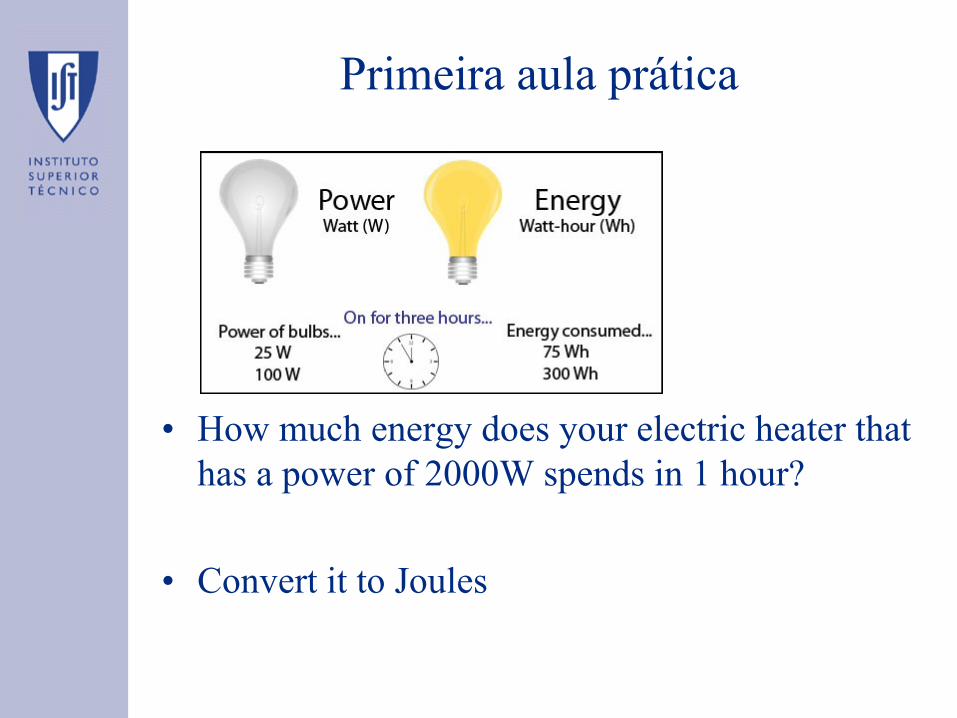
Primeira aula prática
• How much energy does your electric heater that
has a power of 2000W spends in 1 hour?
• Convert it to Joules

Per capita energy use
kW/capita GJ/capita
Region 1990 2008 1990 2008
USA 10.2 10.0 320.5 314.0
EU-27 4.6 4.7 144.9 147.0
Middle East 2.2 4.0 69.9 125.2
China 1.0 2.1 31.8 67.0
Latin America 1.3 1.6 40.6 51.9
Africa 0.8 0.9 25.5 28.1
India 0.5 0.7 15.9 22.6
Others* 2.9 2.7 90.8 85.9
The World 2.2 2.4 69.9 76.6

Electricity tarifs


![[Habilitações Académicas] Estudo e Sugestões de Melhorias de … · 2017. 4. 6. · Consumos energéticos das linhas de produção ..... 58 4.2.2. Consumo eléctrico das câmaras](https://static.fdocumentos.tips/doc/165x107/60e2ca1641faab7fa6484547/habilitaes-acadmicas-estudo-e-sugestes-de-melhorias-de-2017-4-6-consumos.jpg)