final - IAS
49
1 CHAPTER 1 INTRODUCTION TO CUSTOMER LOYALTY 1.1 BACKGROUND The term Customer loy alty is used to describe the behavi or of repeat customers, as well as those that offer good ratings, reviews, or testimonials. Some customers do a particular company a great service by offering favorable word of mouth publicity regarding a product, telling friends and family, thus adding them to the number of loyal customers. However, customer loyalty includes much more. It is a process, a program, or a group of programs geared toward keeping a client happy so he or she will provide more business. Customer loyalty is when an organization receives the ultimate reward for the way it interacts with its customers. Loyal customers buy more, buy longer and tell more people - that's true customer loyalty. Competitive advantage can be achieved through customer loyalty. This is the way to gain the best kind of customers, repeat customers. Repeat customers tend to spend more money and provide the best word-of-mouth advertising. Organizations that use loyalty schemes are constantly looking at the customer lifetime value (LTV) and other customer data. This information combined with providing customer service excellence can lead to long term loyalty.
-
Upload
kalai-selvan -
Category
Documents
-
view
230 -
download
0
Transcript of final - IAS
8/8/2019 final - IAS
http://slidepdf.com/reader/full/final-ias 1/49
1
CHAPTER 1
INTRODUCTION TO CUSTOMER LOYALTY
1.1 BACKGROUND
The term Customer loyalty is used to describe the behavior of repeat
customers, as well as those that offer good ratings, reviews, or testimonials. Some
customers do a particular company a great service by offering favorable word of mouth
publicity regarding a product, telling friends and family, thus adding them to the number
of loyal customers. However, customer loyalty includes much more. It is a process, a
program, or a group of programs geared toward keeping a client happy so he or she will
provide more business.
Customer loyalty is when an organization receives the ultimate reward for the
way it interacts with its customers. Loyal customers buy more, buy longer and tell more
people - that's true customer loyalty.
Competitive advantage can be achieved through customer loyalty. This is the
way to gain the best kind of customers, repeat customers. Repeat customers tend to
spend more money and provide the best word-of-mouth advertising.
Organizations that use loyalty schemes are constantly looking at the customer
lifetime value (LTV) and other customer data. This information combined with providing
customer service excellence can lead to long term loyalty.
8/8/2019 final - IAS
http://slidepdf.com/reader/full/final-ias 2/49
2
1.2 THEORETICAL BACKGROUND
Customer loyalty describes the tendency of a customer to choose one business
or product over another for a particular need. In the packaged goods industry,
customers may be described as being "brand loyal" because they tend to choose a
certain brand of soap more often than others. Note the use of the word "choose"
though; customer loyalty becomes evident when choices are made and actions taken by
customers. Customers may express high satisfaction levels with a company in a
survey, but satisfaction does not equal loyalty. Loyalty is demonstrated by the actions
of the customer; customers can be very satisfied and still not be loyal.
Customer loyalty is the result of well-managed customer retention programs;
customers who are targeted by a retention program demonstrate higher loyalty to a
business. All customer retention programs rely on communicating with customers,
giving them encouragement to remain active and choosing to do business with a
company.
Customer data and models based on the data collected can tell you which
customers are most likely to respond and become loyal, no matter what kind of front-
end marketing program you are running or how you "wrap it up" and present it to thecustomer. The data will tell you who to promote to, and how to save precious marketing
dollars in the process of creating customers who are loyal to you longer.
Customer Loyalty has become a catch-all term for the end result of many
marketing approaches where customer data is used. You can say Relationship
Marketing or Database Marketing or Permission Marketing or CRM, and what you are
really talking about is trying to increase customer loyalty - getting customers to choose
to buy or visit more. Increased customer loyalty is the end result, the desired benefit of
these programs. All of the above approaches have two elements in common - they
increase both customer retention and the Lifetime Value of customers.
8/8/2019 final - IAS
http://slidepdf.com/reader/full/final-ias 3/49
3
Customer loyalty can be achieved in some cases by offering a quality product
with a firm guarantee. Customer loyalty is also achieved through free offers, coupons,
low interest rates on financing, high value trade-ins, extended warranties, rebates, and
other rewards and incentive programs. The ultimate goal of customer loyalty
programs is happy customers who will return to purchase again and persuade others to
use that company's products or services. This equates to profitability, as well as happy
stakeholders.
Customer loyalty may be a one-time program or incentive, or an ongoing group
of programs to entice consumers. Buy-one-get-one-free programs are very popular, as
are purchases that come with rebates or free gifts. Another good incentive for
achieving customer loyalty is offering a risk free trial period for a product or service. Alsoknown as brand name loyalty, these types of incentives are meant to ensure that
customers will return, not only to buy the same product again and again, but also to try
other products or services offered by the company.
Excellent customer service is another key element in gaining customer loyalty. If
a client has a problem, the company should do whatever it takes to make things right. If
a product is faulty, it should be replaced or the customer's money should be refunded.
This should be standard procedure for any reputable business, but those who wish to
develop customer loyalty on a large-scale basis may also go above and beyond the
standard. They may offer even more by way of free gifts or discounts to appease
the customer.
FACTORS OF CUSTOMER LOYALTY
Price. Customers are more price sensitive now than they have ever been. In
the new, post-recession economy, I think that price will continue to be a
primary driving factor that will determine how loyal our clients and customers
are to our business.
Product. There is no substitute for delivering a quality product. With so
many options in the marketplace, if your product or service doesn’t live up
8/8/2019 final - IAS
http://slidepdf.com/reader/full/final-ias 4/49
4
expectations, or is less than perfect, customers won’t come back. I know that
for me, one bad meal in a restaurant is all it takes for me to not return.
Delivery
The experience of receiving a product or service encompasses the
entire corporate promise to the customer. It includes every aspect of what the
customer sees, feels, touches, and experiences.
Service
Customer’s expectations about service are continually increasing. To
some degree, we’ve become spoiled by immediacy of information that
technology provides. When we have questions or problems, we expect to be
able to get answers and solutions now – and in the format we want it.
Recognition.
We all want to be recognized – for who we are, for what we do. We
love it when people know and remember our names. We all like to feel
important to someone. A key factor in building customer loyalty is in finding a
way to provide that recognition, and provide it consistently.
Core Offering
The companies that boast the highest levels of fiercely loyal
customers have built that loyalty not on card programmes or gimmicks, but ona solid, dependable, core offering that appeals to their customers. These
companies have focused intently on what they know appeals to the type of
customers they want to attract, and have determinedly concentrated on
delivering what is expected every time. North American retailer, Nordstrom
(www.nordstrom.com), is well known for the loyalty of its customers. It built
this loyalty by understanding what its customers wanted and then
empowering its employees to deliver those needs consistently.
Clearly, the data from a good loyalty programme should help the operator to
improve this core offering by tailoring and moulding it more closely to the
customers' needs and desires.
8/8/2019 final - IAS
http://slidepdf.com/reader/full/final-ias 5/49
5
Elements of the core offering that have a large role in building customer loyalty
include:
Location and premises
Location and premises clearly play a part in engendering loyalty. The Three L's of
retail - "location, location and location" - are undoubtedly important, and attractive
and functional premises are equally so.
Satisfaction
Clearly, satisfaction is important; indeed essential. But, taken in isolation,
the level of satisfaction is not a good measure of loyalty. Many auto
manufacturers claim satisfaction levels higher than 90%, yet few have
repurchase levels of even half that. The situation is stacked against the business:
if customer satisfaction levels are low, there will be very little loyalty. However,
customer satisfaction levels can be quite high without a corresponding level of
loyalty. Customers have come to expect satisfaction as part and parcel of the
general deal, and the fact that they are satisfied doesn't prevent them from
defecting in droves to a competitor who offers something extra. The point is that,
while high levels of customer satisfaction are needed in order to develop loyalcustomers, the measure of customer satisfaction is not a good measure of the
level of loyalty. The two are not measuring the same thing.
Elasticity level
Elasticity expresses the importance and weight of a purchasing decision
- effectively the level of involvement or indifference. This applies to both the
customer and the business.
Involvement
The customer's involvement in the category is important: the more important
your product or service is to the customer, the more trouble they have probably taken in
their decision to do business with you, and the more likely they are to stick with what
they have decided. Most customers would be highly involved in the category when
choosing a new car, a new jacket, or a bottle of wine. However, when choosing a new
8/8/2019 final - IAS
http://slidepdf.com/reader/full/final-ias 6/49
6
pair of shoelaces, involvement is not usually high. Businesses dealing in commoditised
products and services cannot expect high involvement and need to earn loyalty in other
ways.
Ambivalence
The customer's level of ambivalence is also important. Few decisions are clear
cut. There are usually advantages and disadvantages to be balanced, and vacillation is
unstable. Again, we see that the more commoditised a product or service, the more
difficult it is to cultivate loyalty. It is only when points of differentiation are introduced that
the customer has a valid reason for consistently preferring one particular supplier.
The marketplace
The marketplace is a key factor in the development of loyalty. The elements most
closely involved are:
Opportunity to switch
If the number of competing suppliers is high and little effort is required to switch,
switching is clearly more likely. Conversely, the more time and effort invested in the
relationship, the more unlikely switching becomes. The level and quality of competition
has a significant effect on how easy it is for a customer to switch from any one
particular supplier. When competitors are offering very similar products at similar
prices, with similar levels of service, some means of useful differentiation has to be
found in order to give customers a reason to be loyal.
Inertia loyalty
This is the opposite of ease of switching. Most banks enjoy a high level of
inertia loyalty simply because it's often so difficult and time-consuming to change to a
new bank and transfer direct debits and standing orders.
Demographics
According to Jan Hofmeyr and Butch Rice, developers of The Conversion Model
8/8/2019 final - IAS
http://slidepdf.com/reader/full/final-ias 7/49
7
(which enables users to segment customers not only by their commitment to staying
with a brand but also to segment non-users by their openness to switching to the
brand), more affluent and better educated customers are less likely to be committed to a
specific brand. They say that the commitment of less affluent consumers to the brands
they use is often unusually strong - possibly because they cannot afford to take the risk
of trying a brand that might not suit them as well. They also suggest that younger
consumers are less committed to brands than older consumers.
Share of wallet
As markets become saturated and customers have so much more to choose from,
share of wallet becomes increasingly important. It is cheaper and more profitable to
increase your share of what the customer spends in your sector, than to acquire new
customers. After all, that's what loyalty is really about. Totally loyal customers would
give you a 100% share of their spend in your sector.
1.3 REVIEW OF LITERATURE
8/8/2019 final - IAS
http://slidepdf.com/reader/full/final-ias 8/49
8
1. Caruana, Albert (2004)1, a study on The impact of switching costs on customer
loyalty: A study among corporate customers of mobile telephony. Switching
costs are known to influence customer loyalty. This paper primarily
investigates which dimensions of switching costs affect which dimensions
of customer loyalty. Data are collected among corporate customers of a
mobile phone operator and canonical correlation analysis is undertaken to
investigate these relationships. Managerial implications are discussed,
limitations are noted and future research directions are indicated.
2. Roger Hallowell (1996)2, have conducted a study on The relationships of
customer satisfaction, customer loyalty, and profitability: an empirical study. This
study Presents the findings of a study performed on data from a large bank’sretail-banking operations. Illustrates the relationship of customer satisfaction to
customer loyalty, and customer loyalty to profitability, using multiple measures of
satisfaction, loyalty, and profitability. An estimate of the effects of increased
customer satisfaction on profitability (assuming hypothesized causality) suggests
that attainable increases in satisfaction could dramatically improve profitability.
3. Lloyd C. Harris and Mark M. H. Goode (2004)3 have conducted a study on The
four levels of loyalty and the pivotal role of trust: a study of online service
dynamics. A four-dimension scale of loyalty that reflects Oliver’s [Satisfaction, a
Behavioral Perspective on the Consumer, McGraw-Hill, New York, 1997]
conceptualization of a sequential loyalty chain is proposed, operationalized, and
tested. Further, through both synthesizing and building on existing research into
loyalty, trust, satisfaction, value, and service quality, a framework is proposed
and tested that positions trust as a pivotal driver of loyalty. Data is collected and
1 Caruana, Albert (2004), “The impact of switching costs on customer loyalty: A study among corporatecustomers of mobile telephony ", Journal of Targeting, Measurement and Analysis for Marketing, Vol. 12,pp.256 – 258.
2 Roger Hallowell (1996), “The relationships of customer satisfaction, customer loyalty, and profitability:an empirical study", International of Journal Service Management, Vol. 7, Issue.4, pp.27 - 42
3 Lloyd C. Harris and Mark M. H. Goode (2004), “The four levels of loyalty and the pivotal role of trust: astudy of online service dynamics ", Journal of Retailing, Vol. 80, Issue. 2, pp. No. 139 - 158.
8/8/2019 final - IAS
http://slidepdf.com/reader/full/final-ias 9/49
8/8/2019 final - IAS
http://slidepdf.com/reader/full/final-ias 10/49
10
5. Annette Giering, Christian Homburg, (2001)5 a study on Personal characteristics
as moderators of the relationship between customer satisfaction and loyalty—an
empirical analysis. Previous empirical research on the relationship between
customer satisfaction and loyalty has largely neglected the issue of moderator
variables. In a consumer-durables context the authors analyze the moderating
effect of selected personal characteristics on the satisfaction–loyalty link. The
empirical findings, which are based on multiple-group causal analysis, show that
the strength of the relationship between customer satisfaction and loyalty is
strongly influenced by characteristics of the customer. Specifically, variety
seeking, age, and income are found to be important moderators of the
satisfaction–loyalty relationship.
6. Anne W. Mägi (2003)6, a study on Share of wallet in retailing: the effects of
customer satisfaction, loyalty cards and shopper characteristics. In retailing,
consumers typically patronize multiple outlets. Thus, an important issue is why
consumers vary in how they divide their purchases across outlets and how
outlets can get a greater share of consumer expenditures. Two potential avenues
for increasing customer share are to raise customer satisfaction, and increase
repeat purchase through loyalty cards. This study examines the effects of
customer satisfaction and loyalty cards as well as consumer characteristics oncustomer share spent on the primary grocery store. The findings suggest that
customer satisfaction has a positive, albeit modest, effect on share while
consumer economic shopping orientation has a negative direct effect on share.
The economic orientation of shoppers, their felt importance of a personal
relationship with store personnel, and the level of their aggregate purchase
volume moderate the effect of satisfaction on customer share. Finally, the results
provide mixed support for the impact of loyalty cards on customer behavior.
5Annette Giering, Christian Homburg, (2001), “Personal characteristics as moderators of the relationshipbetween customer satisfaction and loyalty—an empirical analysis", Psychology and Marketing, Vol. 18,Issue. 1, pp. No 43-66.
6Anne W. Mägi (2003), a study on Share of wallet in retailing: the effects of customer satisfaction, loyaltycards and shopper characteristics ", Journal of Retailing, Vol. 79, Issue. 2, pp.97 – 106.
8/8/2019 final - IAS
http://slidepdf.com/reader/full/final-ias 11/49
11
7. David Jafen (2002)7 a study on Customer loyalty in E-Commerce. The high cost
of attracting new customers on the Internet and the relative difficulty in retaining
them make customer loyalty an essential asset for many online vendors. In the
non-Internet marketplace, customer loyalty is primarily the product of superior
service quality and the trust that such service entails. This study examines
whether the same applies with online vendors even though their service is
provided by a website interface notably lacking a human service provider. As
hypothesized, customer loyalty to a specific online vendor increased with
perceived better service quality both directly and through increased trust.
However, the data suggest that the five dimensions of service quality in
SERVQUAL collapse to three with online service quality: (1) tangibles, (2) a
combined dimension of responsiveness, reliability, and assurance, and (3)
empathy. The first dimension is the most important one in increasing customer
loyalty, and the second in increasing customer trust. Implications are discussed.
8. Anna S. Mattila (2001)8 a study on The Impact of Relationship Type on Customer
Loyalty in a Context of Service Failures. This article examines the impact of
relationship type (true service relationship, pseudorelationship, and service
encounter) on customers’ behavioral intentions in a context of service failures.
Overall, the results from the two scenario-based experiments indicate that
building a true service relationship with the customer might be a critical factor in
7David Jafen (2002), “Customer loyalty in E-Commerce ", Journal of the association for Informationsystem, Vol. 3, No. 2, pp. No 27 - 51.
8Anna S. Mattila (2001),“The Impact of Relationship Type on Customer Loyalty in a Context of ServiceFailures”,Journal of the association for Information system, Vol. 4, No. 2, pp. No 91 - 101.
8
8/8/2019 final - IAS
http://slidepdf.com/reader/full/final-ias 12/49
12
ensuring customer loyalty with a failed recovery attempt. Moreover, the findings
suggest that bonding the customer to the company might reduce customer
resistance to premium prices.
9. Yi-Ting Yu, Alison Dean (2001)9, a study on The contribution of emotional
satisfaction to consumer loyalty. Many customer satisfaction studies have
concluded that there is a significant relationship between customer satisfaction
and loyalty, but this finding has been questioned in that most of the studies focus
on measuring the cognitive component of customer satisfaction. This study
includes the cognitive component, but focuses on the affective component. It
explores the role of emotions in satisfaction, and then compares the predictive
ability of the cognitive and affective elements. Key findings are that both positive
and negative emotions, and the cognitive component of satisfaction correlate
with loyalty. Regression analysis indicates that the affective component serves
as a better predictor of customer loyalty than the cognitive component. Further,
the best predictor of both overall loyalty and the most reliable dimension of
loyalty, positive word of mouth, is positive emotions. Thhe theoretical and
practical implications of these findings are discussed.
10. Leanne H. Y. Too; Anne L.Souchon & Peter C.Thirkell (1998)10 a study on
Relationship Marketing and Customer Loyalty in a Retail Setting: A Dyadic
Exploration. Customer loyalty is increasingly seen to be crucial to the
success of business organisations, with the growing realisation that
attracting new customers is far more expensive than retaining existing
ones. It has been suggested that a way of increasing customer retention is
through secure relationships between buyers and sellers. Surprisingly,
however, and despite the growing body of literature on relationship9
109Yi-Ting Yu, Alison Dean (2001), “The contribution of emotional satisfaction to consumer loyalty",
International Journal of Service Industry Management, Vol. 12, Iss: 3, pp.234 - 250.
10Leanne H. Y. Too; Anne L. Souchon; Peter C. Thirkell (1998), “Relationship Marketing and Customer
Loyalty in a Retail Setting: A Dyadic Exploration”, Journal of Marketing, Vol. 17, Iss: 3, pp.287 - 319.
8/8/2019 final - IAS
http://slidepdf.com/reader/full/final-ias 13/49
13
marketing issues, little empirical research has been conducted on the link
between relationship marketing and customer loyalty in a retailing context.
This paper attempts to address this gap by presenting and testing a
conceptual model of the process by which the implementation of
relationship marketing can enhance such loyalty. A dyadic exploratory
study of clothing store managers and their customers was conducted.
Findings reveal that customers' perceptions of clothing stores' relationship
marketing efforts are crucial to enhanced commitment and loyalty.
Implications are drawn from these results, and future research directions
are discussed.
1.4 STATEMENT OF THE PROBLEM
The Satisfaction of the Customers is very important to promote the
products. The factor leading to customer loyalty is different from the factors that
influence customers. The Company wants to take necessary steps to increase
sales. The problem in the perception of customers is the delay in delivery of
products. This study conducts analysis of customer perception which will help the
company to know the satisfaction level of customers and customer loyalty
towards the organization and also help the company to improve services.
1.5 OBJECTIVES OF THE STUDY
To know about the factors which are satisfying the customer’s while purchasing
in Pankaja Mills.
To study the customer loyalty towards Pankaja Mills, Coimbatore.
To know about the reasons for purchasing in Pankaja Mills.
To provide valuable suggestion to Pankaja Mills in order to retain the customer.
8/8/2019 final - IAS
http://slidepdf.com/reader/full/final-ias 14/49
14
1.6 SCOPE OF THE STUDY
Customer loyalty plays a vital role for any organization success. It plays
much vital role in the industries like textiles where the competition is high. The
study has covered customers of Pankaja Mill in and around Coimbatore and
analyzed the level of customer’s loyalty. The study also identified the factors that
contribute the customer satisfaction. As only a satisfied customer will be loyal to
the organization, the study also finds the specific reasons that make customers
look for Pankaja Mill.
1.7 RESEARCH METHODOLOGY
TYPE OF STUDY
The study is Descriptive Research design. It attempts to describe and
explain conditions of the present by using many subjects and questionnaires to
fully describe a phenomenon. Survey research design /survey methodology is
one of the most popular for dissertation research.
DATA COLLECTION METHOD
Primary data collection method is used in this study. It is collected using
questionnaires.
SAMPLING design
8/8/2019 final - IAS
http://slidepdf.com/reader/full/final-ias 15/49
15
Sampling is the act, process, or technique of selecting a suitable sample, or a
representative part of a population for the purpose of determining parameters or
characteristics of the whole population.
Convenient Sampling technique was used in this study to draw a sample of 70
customers.
TOOLS FOR ANALYSIS
The tools used for this study are
Percentage Analysis
Chi- square
Percentage Analysis:
Simple percentage analysis refers to a ratio with the help of absolute
figures. It will be difficult to interpret any meaning from the collected data but when
percentage are found out then it becomes easy to find the relative difference between
two or more attributes.
Percentage = Number of respondents
Total number of respondents
Chi- square:
8/8/2019 final - IAS
http://slidepdf.com/reader/full/final-ias 16/49
16
The chi –square test is used to determine whether there is a significant
difference between the expected frequencies and the observed frequencies in one or
more categories.
X2= (O-E) 2
E
Where,
O is the observed frequency in each category.
E is the Expected Frequency in the corresponding category.
1.8 LIMITATIONS OF THE STUDY
The study is restricted to 70 due to time constraint and customer of Pankaja Mill is
being limited in and around Coimbatore.
Data collection was done through questionnaire, filled by the respondents, which
may be affected by personal bias.
The study is based entirely on the feedback received from the respondents.
1.9 CHAPTER SCHEME
Chapter 1: INTRODUCTION
This chapter gives an introduction about the research conducted. It deals with the
background study, theoretical background of the study, review of literature, statement of
the problem, objectives of the study, scope of the study, research methodology adopted
and the limitations of the study.
Chapter 2: ORGANIZATIONAL PROFILE
8/8/2019 final - IAS
http://slidepdf.com/reader/full/final-ias 17/49
17
The chapter organization profile deals with the history of the organization, the
management, organization structure, product profile and the market potential,
competitive strengths of the company, future plans and the description about various
functional areas.
Chapter 3: MACRO-MICRO ECONOMIC ANALYSIS
The chapter micro-macro analysis gives an insight about the industry in the
Global scenario as well as the Indian scenario.
Chapter 4: DATA ANALYSIS AND INTERPRETATION
Analysis and interpretation deals with the analysis of the data collected for the
study and the interpretation of the results obtained.
Chapter 5: CONCLUSION
This chapter deals with the discussions on the findings and the suggested
recommendations based on the findings.
CHAPTER 2
ORGANIZATION PROFILE
The Company:
Pankaja Mills, one of the oldest mills in the city of Coimbatore, was incorporated
in the year 1933 with a commissioned capacity of 15000 spindles. The mill, due to
various managerial inefficiencies coupled with financial irregularities, ceased its
operations intermittently and was taken over by the TamilNadu Textile Corporation
8/8/2019 final - IAS
http://slidepdf.com/reader/full/final-ias 18/49
18
Limited under the Industries Development and Regulation Act on 22/11/1972 and
started functioning again from 14/01/1973.
Subsequently, the mill was nationalized under Sick Textiles Undertakings
(Nationalization) Act, 1974 with effect from 01/04/1974 and became a unit of National
Textile Corporation Limited (Tamilnadu and Pondicherry) Limited, a subsidiary company
of National Textile Corporation Limited, New Delhi. Upon merger of subsidiary
companies by the holding company, the mill is now placed under the control of Southern
Regional Office at Coimbatore.
The mill has been identified as one of the viable unit of the Corporation and
hence a revival package has been worked out for this mill as at an outlay of Rs.17.69
Crores. The package, inter alia, includes acquisition of new production machinery,
augmenting working capital and compensation for surplus workmen who would be
retired under voluntary scheme of the Corporation.
The commissioned capacity of the mills which is at present 30000 spindles
would go up to 32000 spindles after modernization. The mill is capable of producing
super fine cotton combed yarn and medium/coarse polyester cotton and polyester
viscose blended yarn.
After modernization, the mill is projected to produce 26.26 lakhs kilograms of
yarn annually with a turnover of more than Rs. 37 Crores. Taking advantage of the
comprehensive modernization of the production machinery, the mill is focusing on
production of value added yarn for exports as well as domestic markets.
The mill, as a prelude to the export of yarn, has started implementing ISO
9001:2000 Quality Management System and obtained ISO certificate in 2009.
2.2 MANAGEMENT TEAM
The Management Team at Pankaja Mills,
Mr. J. Murugan, General Manager
Mr. C. Shanmugavel. M.A., Assistant Manager
8/8/2019 final - IAS
http://slidepdf.com/reader/full/final-ias 19/49
19
Mr. R. Karthikeyan. B.E., Factory Manager
Mr. R. Natarajan, Deputy Manager
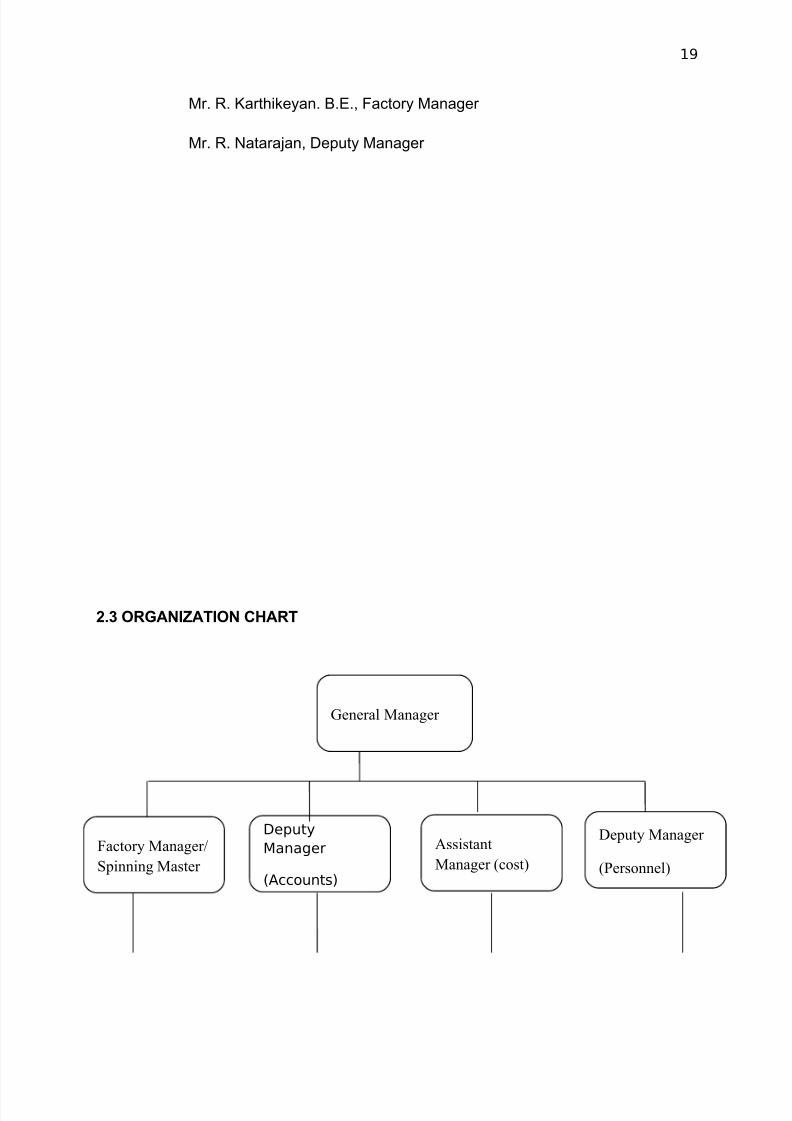
2.3 ORGANIZATION CHART
Factory Manager/
Spinning Master
Deputy
Manager
(Accounts)
Assistant
Manager (cost)
Deputy Manager
(Personnel)
General Manager
8/8/2019 final - IAS
http://slidepdf.com/reader/full/final-ias 20/49
20
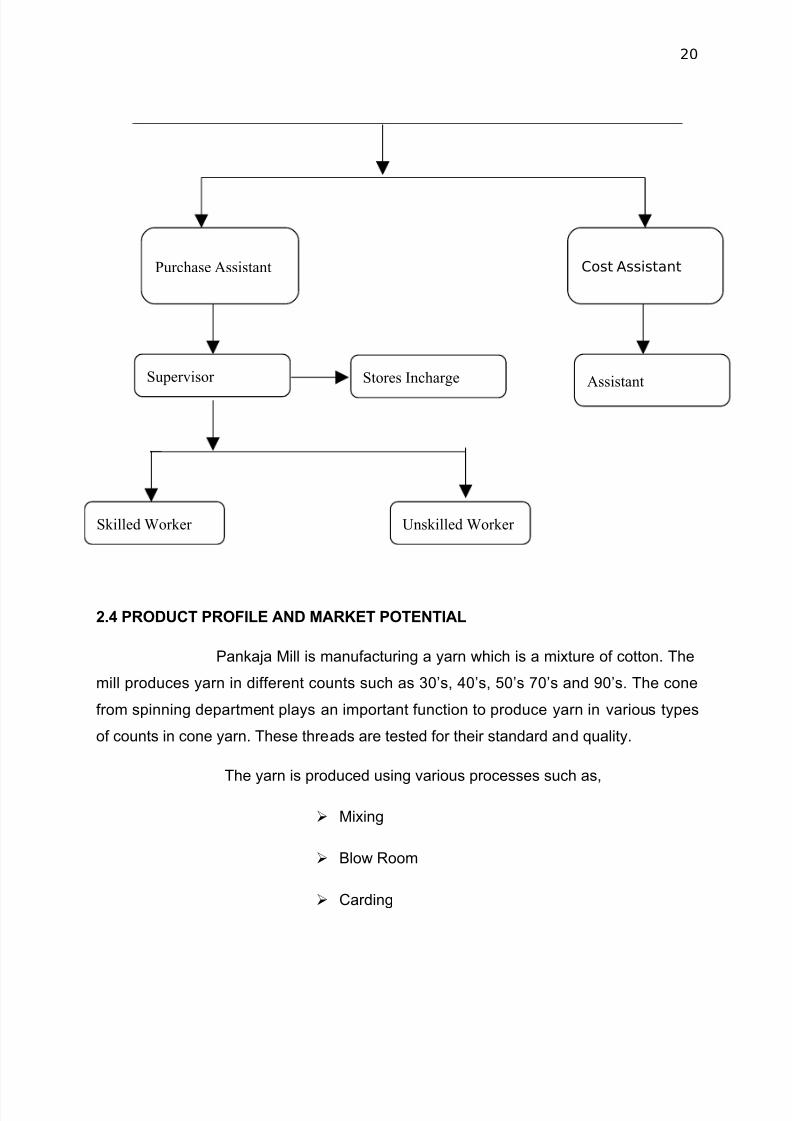
2.4 PRODUCT PROFILE AND MARKET POTENTIAL
Pankaja Mill is manufacturing a yarn which is a mixture of cotton. The
mill produces yarn in different counts such as 30’s, 40’s, 50’s 70’s and 90’s. The cone
from spinning department plays an important function to produce yarn in various types
of counts in cone yarn. These threads are tested for their standard and quality.
The yarn is produced using various processes such as,
Mixing
Blow Room
Carding
Purchase Assistant Cost Assistant
AssistantSupervisor Stores Incharge
Unskilled Worker Skilled Worker
8/8/2019 final - IAS
http://slidepdf.com/reader/full/final-ias 21/49
21
Drawing
Simplex
Spinning
Winding
Packaging
2.5 COMPETITIVE STRENGTH OF THE COMPANY
SWOT ANALYSIS
Strengths
Credit Sales
Affordable Price Compared to that of Competitors
Weakness
Concentrated on single product
Unskilled Workers
Less Market Share
Opportunities
Product Development
Availability of New Market
8/8/2019 final - IAS
http://slidepdf.com/reader/full/final-ias 22/49
8/8/2019 final - IAS
http://slidepdf.com/reader/full/final-ias 23/49
23
Marketing
The final department in the organization is marketing department.
The process of spinning comes to completion only after the produced goods are
sold in the market.
The marketing department will analyze the market condition on various areas
and sell their product.
The marketing department had already created a good will for the product, which
help them to market the product easily.
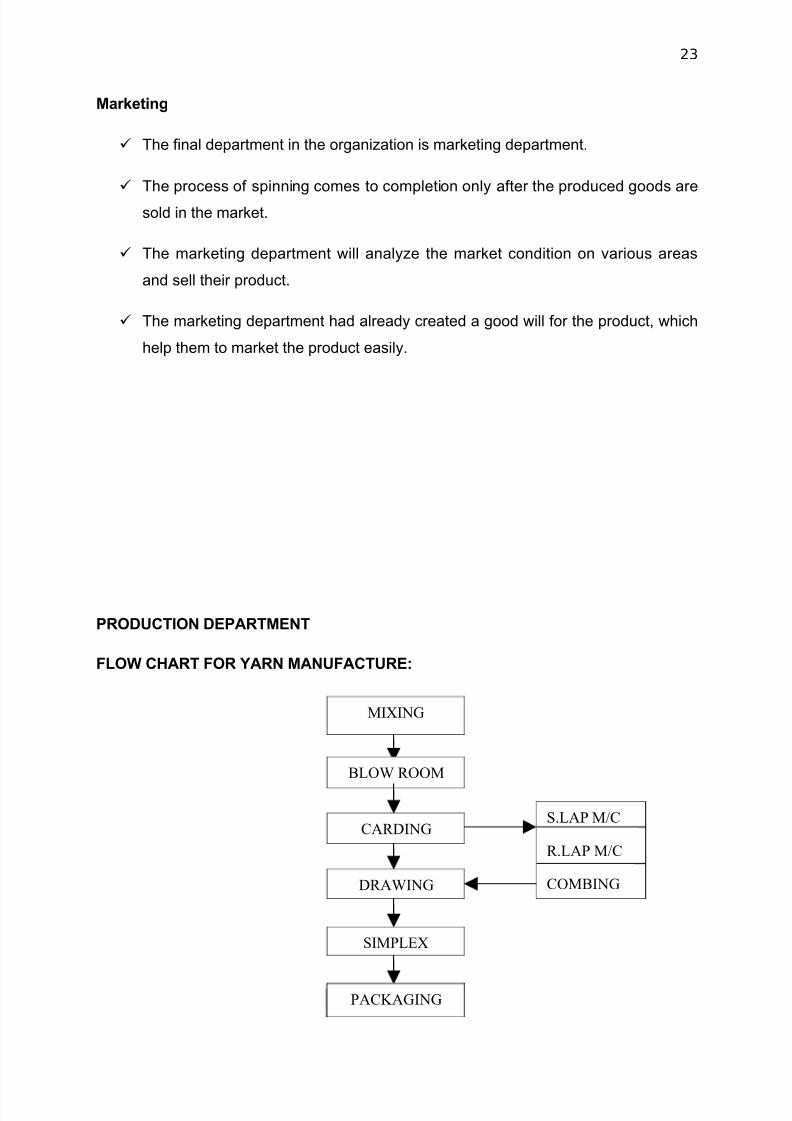
PRODUCTION DEPARTMENT
FLOW CHART FOR YARN MANUFACTURE:
MIXING
BLOW ROOM
CARDINGS.LAP M/C
R.LAP M/C
COMBINGDRAWING
SIMPLEX
SPINNINGWINDINGPACKAGING
8/8/2019 final - IAS
http://slidepdf.com/reader/full/final-ias 24/49
24
Mixing:
Cottons of different varieties, in different proportions, are hand opened and laid
into different layers according to the quality of cotton and depending on the end use
(yarn quality requirement).
Blow Room:
The cotton is well opened and cleaned to remove the foreign matter such as seed
bits, leaf bits etc, and a thin uniform sheet of 40’’ width and rolled in lengths of about 40
meters, known as LAP.
Carding:
The laps received from blow room is further opened and cleaned and a clean rope
like material, known as Card Sliver is produced and stored in cans.
Combing:
It is an optional special process to remove short fibers, neos etc from the Card
Sliver to improve the quality of yarn, in order to produce a COMBED YARN.
Drawing:
The Card Sliver or Combed Slivers (6 to 8 No’s) are passed through this machine,
to make the fibers in the silver in parallel and more even, in order to improve the quality
of yarn.
8/8/2019 final - IAS
http://slidepdf.com/reader/full/final-ias 25/49
25
Simplex:
The drawing silver is thinned and made to a Strand of required size, known as ROVE
and wound into bobbins of 1 to 1.5 kg weight. The thinning process of material is known
as Drafting.
Ring Spinning:
The Roving Bobbins received from Simplex, is fed in ring spinning frames, where the
material is further down, twisted and yarn is formed which is wound on small cops of 50
to 60 gms.
Cone Winding:
The yarn in small Cops is wound into bigger packages known as Cones of required
weight (1.25 kg cotton, 1.50 kg polyester cotton) after cleaning the impurities from Ring
Spinning yarn.
Cone Packaging: The yarn is packed in pre-stitched polywoven bags with 40 cones of
1.25 kg to produce 50 kg bags or according to the market requirement, in order to
dispatch to various market centers/depots for sale.
CHAPTER 3
MACRO AND MICRO ANALYSIS OF SPINNING MILL
3.1 MACRO ECONOMIC ANALYSIS
GLOBAL TRADE IN TEXTILE AND CLOTHING
World trade in textiles and clothing amounted to US $ 385 billion in 2003, of
which textiles accounted for 43 percent (US $ 169 bn) and the remaining 57 percent
(US $ 226 bn) for clothing. Developed countries accounted for little over one-third of
world exports in textiles and clothing. The shares of developed countries in textiles and
clothing trade were estimated to be 47 percent (US $ 79 bn) and 29 percent, (US $ 61
bn) respectively.
8/8/2019 final - IAS
http://slidepdf.com/reader/full/final-ias 26/49
26
POTENTIAL GAINS
It may be noted that clothing sector would offer higher gains than the textile
sector, in the post MFA regime. Countries like Mexico, CBI countries, many of the
African countries emerged as exporters of readymade garments without having much of
textile base, utilizing the preferential tariff arrangement under the quota regime.
Besides, countries like Bangladesh, Sri Lanka, and Cambodia emerged as garment
exporters due to cost factors, in addition to the quota benefits. Thus, it may be
concluded that these countries are likely to lose their market share in the future
scenario.
It may be said that countries like China, USA, India, Pakistan, Uzbekistan and
Turkey have resource based advantages in cotton; China, India, Vietnam and Brazil
have resource based advantages in silk; Australia, China, New Zealand and India have
resource based advantages in wool; China, India, Indonesia, Taiwan, Turkey, USA,
Korea and few CIS countries have resource based advantages in manmade fibers. In
addition, China, India, Pakistan, USA, Indonesia have capacity based advantages in the
textile spinning and weaving.
China is cost competitive with regard to manufacture of textured yarn, knittedyarn fabric and woven textured fabric. Brazil is cost competitive with regard to
manufacture of woven ring yarn. India is cost competitive with regard to manufacture of
ring-yarn, O-E yarn, woven O-E yarn fabric, knitted ring yarn fabric and knitted O-E yarn
fabric. According to Werner Management Consultants, USA, the hourly wage costs in
textile industry is very high for many of the developed countries. Even in developing
economies like Argentina, Brazil, Mexico, Turkey and Mauritius, the hourly wage is
higher as compared to India, China, Pakistan and Indonesia.
The market losers in the long term (by 2014) would include high cost producers,
like EU, USA, Canada, Mexico, Japan and many east Asian countries. The
determinants of increase / decrease in market share in the medium term would however
depend upon the cost, quality and timely Review of Indian Textiles and Clothing
8/8/2019 final - IAS
http://slidepdf.com/reader/full/final-ias 27/49
27
Industry The textiles and garments industry is one of the largest and most prominent
sectors of Indian economy, in terms of output, foreign exchange earnings and
employment generation. Indian textile industry is multi-fiber based, using delivery. In the
long run, there are possibilities of contraction in intra-EU trade in textile and garments,
reduction of market share of Turkey in EU and market share of Mexico and Canada in
USA, and thus provide more opportunities for developing countries like India.
It is estimated that in the short term, both China and India would gain additional
market share proportionate to their current market share. In the medium term, however,
India and China would have a cumulative market share of 50 percent, in both textiles
and garment imports by USA. It is estimated that India would have a market share of
13.5 percent in textiles and 8 percent in garments in the USA market. With regard toEU, it is estimated that the benefits are mainly in the garments sector, with China taking
a major share of 30 percent and India gaining a market share of 8 percent. The potential
gain in the textile sector is limited in the EU market considering the proposed further
enlargement of EU. It is estimated that India would have a market share of 8 percent in
EU textiles market as against the China’s market share of 12 percent.
The global economic crisis is set to hit the cotton trade across the globe. Cotton
imports at the global level are expected to decrease 12% to 7.3 million tonne in the
current cotton year beginning October 2008. This has been projected by the
International Cotton Advisory Committee (ICAC) after assuming curtailment in
production by textile mills all over the globe during the year.
ICAC estimates that hit by competition from chemical fibres amid slower global
economic growth, cotton consumption by textile mills would for the first time witness a
negative growth in the current year. Against this backdrop, ICAC assumes cottonconsumption by textile mills would decline 6% to about 24.9 million tonne in the current
season, which will subsequently lead to a decline in cotton imports in coming days.
Apart from the economic downturn, the projected decline in the income of
developed economies in 2009, tightening credit availability for spinning mills and
8/8/2019 final - IAS
http://slidepdf.com/reader/full/final-ias 28/49
28
uncertainty regarding the prevalence of the global financial crisis are the other factors
that will lead to a cutback in global demand for cotton, said ICAC in its latest report on
the world cotton outlook.
The Washington-based global body is an association of governments which have
an interest in production, consumption, export and import of cotton. India, which is the
second largest producer of cotton after China, is also a member of the association.
World cotton trade would plummet this year due to lower-than-expected imports by
China. Indications are that China's cotton imports may fall by 24% to 1.9 million tonne.
Imports by the rest of the world are expected to decline 7% to 5.4 million tonne, said the
report.
Cotton production across the globe is also expected to decline in the current
season. According to ICAC, world cotton production is expected to decline by 6% to
24.6 million tonne in 2008-09 due to shrinkage in the area under cotton cultivation.
Though India is expected to increase its production by 3% to 5.5 million tonne, a 30%
fall in US production would drive down world cotton production.
3.2 MICRO ECONOMIC ANALYSIS
INDIAN SCENARIO OF SPINNING INDUSTRY
India Spinning Industry has gone from strength to strength since a very long time
now as it was the hub of cotton manufacturing. Cotton is not only consumed to the
highest extent in India but it has also become one of the most profitable textiles in the
export industry.
Spinning in India can be classified into 2 categories: medium and long staple. But
there was a shortfall in the 'extra-long' category that continued for many years. There
was a massive downfall in the cotton spinning in India during 2004-2005. Theproduction rate of cotton was about 4 lakh bales that was less by 5 lakh bales from the
required rate which was 9 lakh bales. Mr. P. D. Patodia, the Chairman of the Standing
Committee on Cotton, CITI-CDRA said that the manufacturing of cotton will rise to 11-
12 lakh bales in 2010.
8/8/2019 final - IAS
http://slidepdf.com/reader/full/final-ias 29/49
29
The present downfall in the cotton production has witnessed a 50% increase in
the price of Indian varieties of ELS, which is detrimental for the spinning industry in
India. Spinning mills require domestic accessibility of ELS cotton in increased quantity
and of better fibre qualities.
To survive this downfall in the cotton trade which is a highly profitable textile in
the India Spinning Industry, CITI-CDRA is conducting a conference with various
research organizations such as CICR (Nagpur), JNKVV (Khandwa), UAS (Dharwad),
and Regional Textile Mills' Association in R&D activities. It conducted a discussion
pertaining to the development of new varieties of seeds and adopting the advanced
procedure of cultivation which will add to the profit in the cotton textile sector of the
spinning industry. The most important and efficient step towards the resurgence of cotton manufacturing would be to develop the ELS varieties with lesser duration crops
and yield to cost-effectiveness and consistency in cultivation. This will not only motivate
the farmers but will also make them stick to the desired sector of cotton crop.
The yarn spinning industry covers almost 25 percent of the total industrial
production of one of the world's 10 largest economies. Trends are reviewed every year
in accordance with the need and fashion. An elaborate and detailed assessment is
made on various sectors of the yarn spinning such as, production, consumption, and
materials. The legislative and the political consequences are also reviewed at the same
time. In addition to it, other areas that are being reviewed in the yarn spinning sector are
exports, imports, prices, advertising, and sales promotion patterns.
Some of the popular companies engaged in the India Spinning Industry are listed
below:
• Bhilwara Spinners Ltd. (LNG Group) - polyester, viscose, wool-blended fabrics
and high-end products like lycra and linen. BSL Suitings and Mayur Suitings are the
two brands under Bhilwara Spinners Ltd.
• Nitin Spinners Ltd. - manufactures single and multi-fold yarns in the range
from Ne 4 to Ne 40 appropriate for various applications such as Knitted Fabrics,
8/8/2019 final - IAS
http://slidepdf.com/reader/full/final-ias 30/49
30
Woven Fabrics, Terry Towels, Denims, Furnishing Fabrics, carpets and other
Industrial Fabrics.
• Sangam (India) Ltd. (Sangam Group of Companies) - Largest producer of
dyed yarn in India with a capacity of 64032 spindles in one location.
• Ajay Group of Industries - Manufacturer and seller of polyester viscose,
polyester woolen and uniform fabrics.
The Spinning Industry in India is on set to hit the global market with other fabrics
as well like the cotton textiles with its enthusiasm and consistency in work. It has
already reached a phenomenal status in India by beating the obstacles that caused a
downfall since past few years and is now on its way to cover a wider area in the
spinning sector.
CHAPTER 4
DATA ANALYSIS AND INTERPRETATION
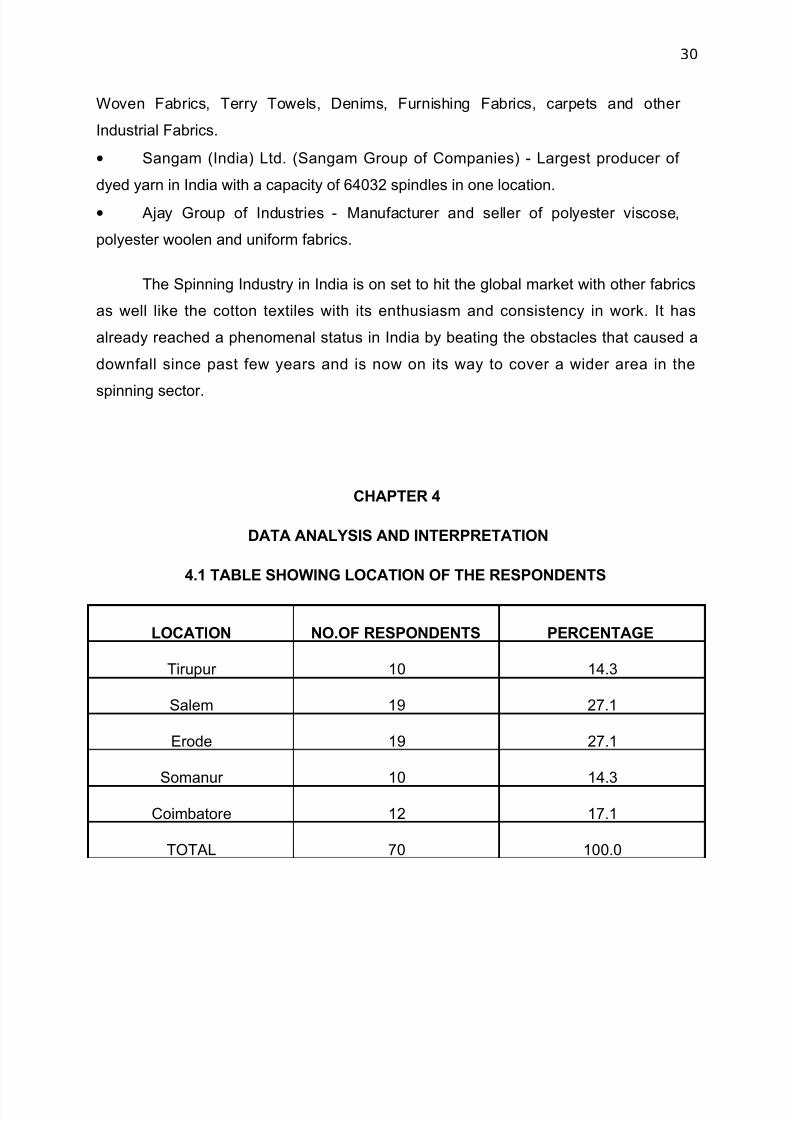
4.1 TABLE SHOWING LOCATION OF THE RESPONDENTS
LOCATION NO.OF RESPONDENTS PERCENTAGE
Tirupur 10 14.3
Salem 19 27.1
Erode 19 27.1
Somanur 10 14.3
Coimbatore 12 17.1
TOTAL 70 100.0
8/8/2019 final - IAS
http://slidepdf.com/reader/full/final-ias 31/49
31
From the above table it has been known that out of total respondents taken for study,
14% of the respondents are from Tirupur, 27% of the respondents are from Salem, 27%
of the respondents are from Erode, 14% of the respondents are from Somanur, 17% of
the respondents are from Coimbatore. Majority of the respondents (27%) are from the
location Salem and Erode.
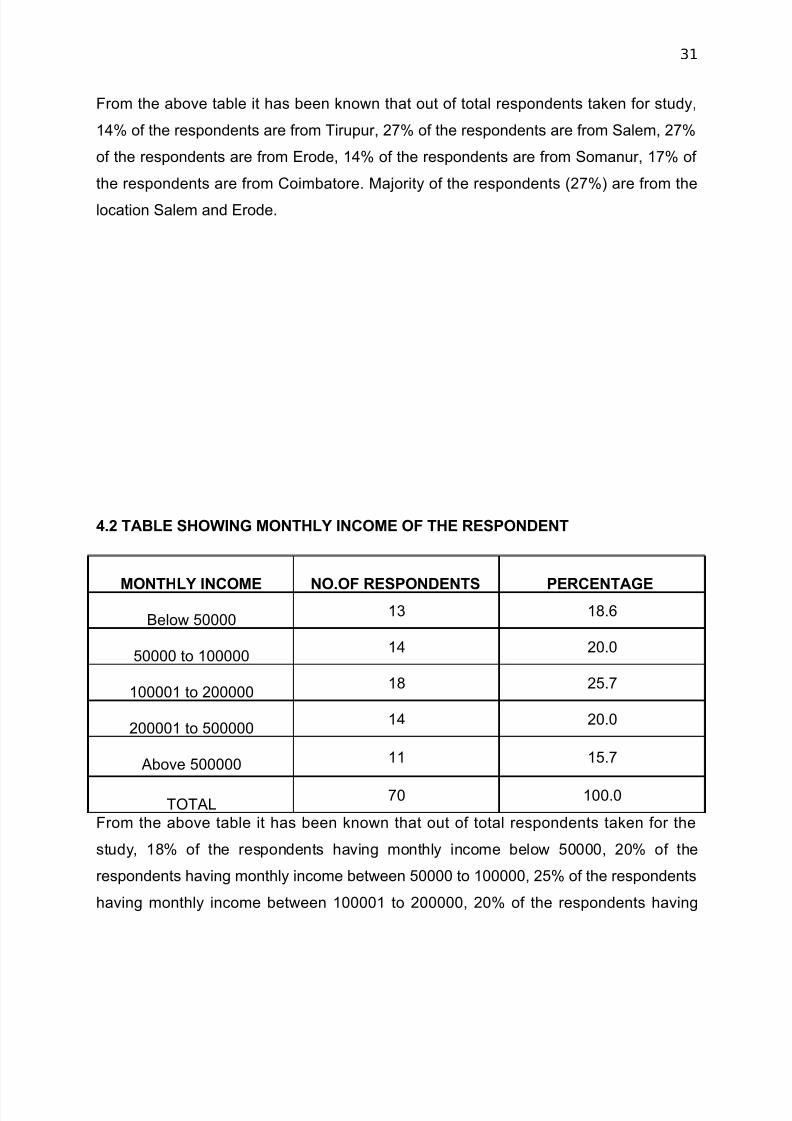
4.2 TABLE SHOWING MONTHLY INCOME OF THE RESPONDENT
MONTHLY INCOME NO.OF RESPONDENTS PERCENTAGE
Below 5000013 18.6
50000 to 10000014 20.0
100001 to 20000018 25.7
200001 to 50000014 20.0
Above 500000 11 15.7
TOTAL70 100.0
From the above table it has been known that out of total respondents taken for the
study, 18% of the respondents having monthly income below 50000, 20% of the
respondents having monthly income between 50000 to 100000, 25% of the respondents
having monthly income between 100001 to 200000, 20% of the respondents having
8/8/2019 final - IAS
http://slidepdf.com/reader/full/final-ias 32/49
32
monthly income between 200001 to 500000, 15% of the respondents having monthly
income above 500000. Most of the respondents (25%) having monthly income between
100001 to 200000.
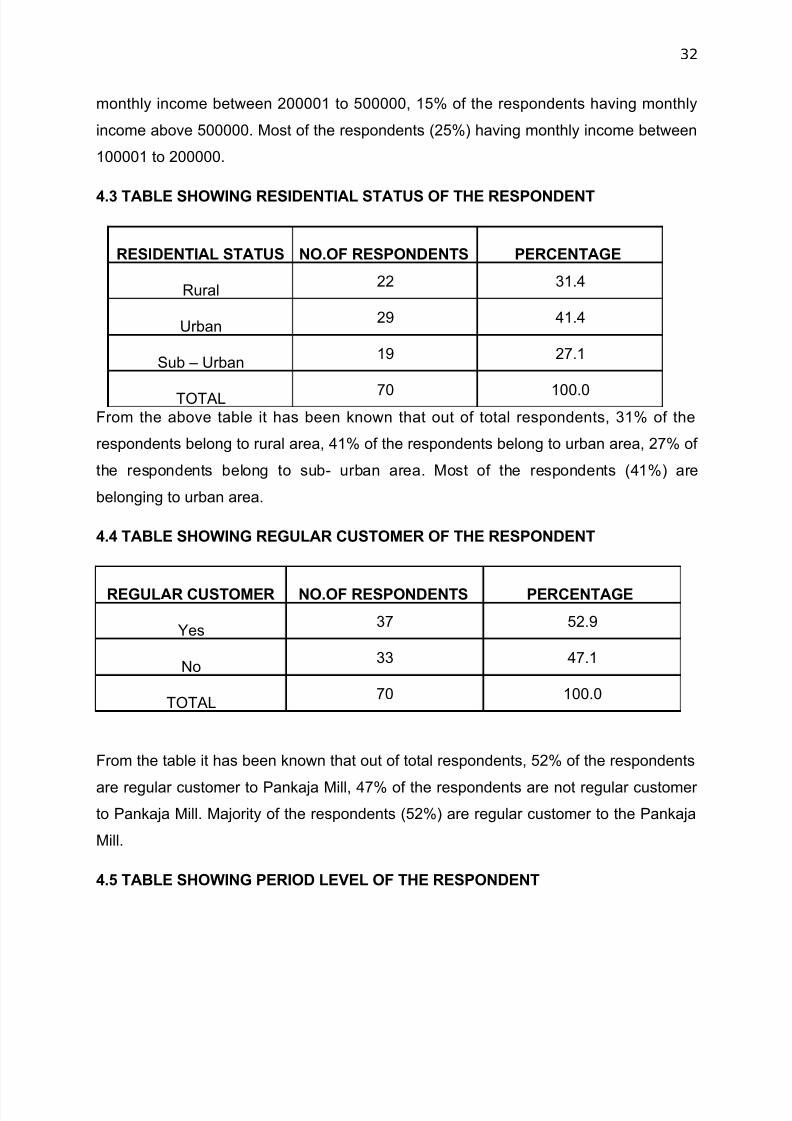
4.3 TABLE SHOWING RESIDENTIAL STATUS OF THE RESPONDENT
RESIDENTIAL STATUS NO.OF RESPONDENTS PERCENTAGE
Rural22 31.4
Urban29 41.4
Sub – Urban19 27.1
TOTAL 70 100.0From the above table it has been known that out of total respondents, 31% of the
respondents belong to rural area, 41% of the respondents belong to urban area, 27% of
the respondents belong to sub- urban area. Most of the respondents (41%) are
belonging to urban area.
4.4 TABLE SHOWING REGULAR CUSTOMER OF THE RESPONDENT
REGULAR CUSTOMER NO.OF RESPONDENTS PERCENTAGE
Yes37 52.9
No33 47.1
TOTAL70 100.0
From the table it has been known that out of total respondents, 52% of the respondents
are regular customer to Pankaja Mill, 47% of the respondents are not regular customer
to Pankaja Mill. Majority of the respondents (52%) are regular customer to the Pankaja
Mill.
4.5 TABLE SHOWING PERIOD LEVEL OF THE RESPONDENT
8/8/2019 final - IAS
http://slidepdf.com/reader/full/final-ias 33/49
33
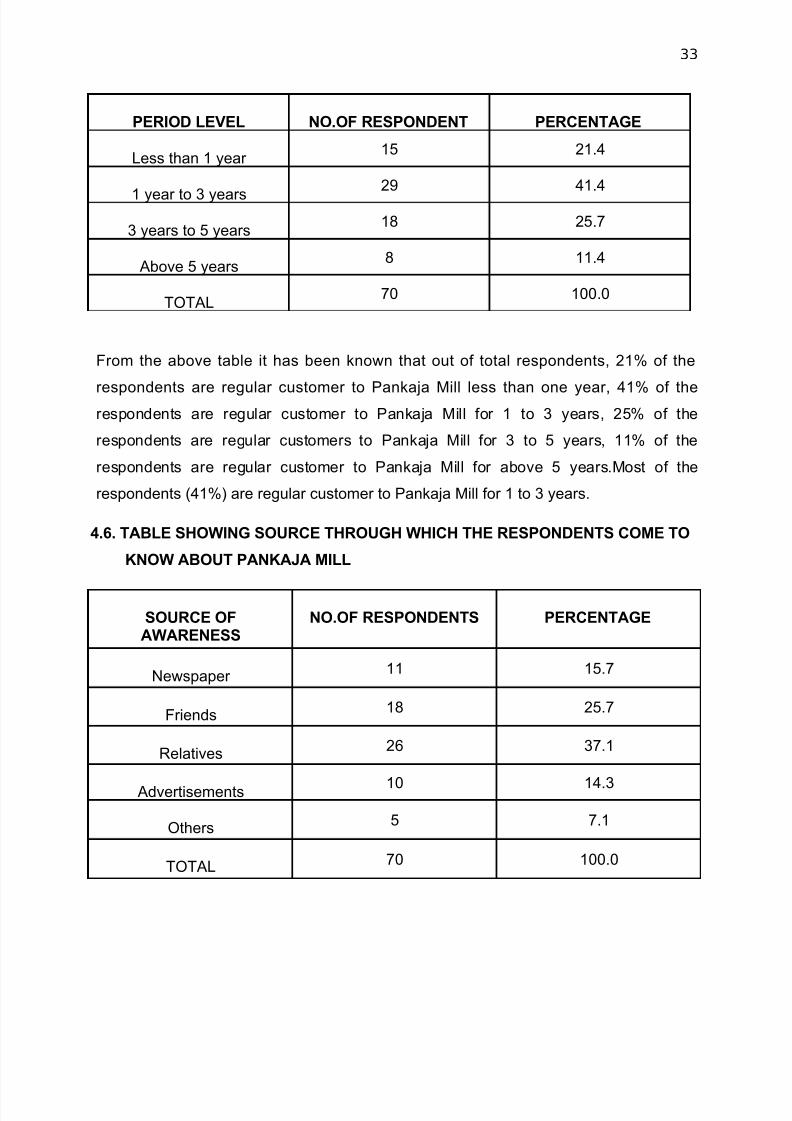
PERIOD LEVEL NO.OF RESPONDENT PERCENTAGE
Less than 1 year 15 21.4
1 year to 3 years29 41.4
3 years to 5 years18 25.7
Above 5 years8 11.4
TOTAL70 100.0
From the above table it has been known that out of total respondents, 21% of the
respondents are regular customer to Pankaja Mill less than one year, 41% of therespondents are regular customer to Pankaja Mill for 1 to 3 years, 25% of the
respondents are regular customers to Pankaja Mill for 3 to 5 years, 11% of the
respondents are regular customer to Pankaja Mill for above 5 years.Most of the
respondents (41%) are regular customer to Pankaja Mill for 1 to 3 years.
4.6. TABLE SHOWING SOURCE THROUGH WHICH THE RESPONDENTS COME TO
KNOW ABOUT PANKAJA MILL
SOURCE OFAWARENESS
NO.OF RESPONDENTS PERCENTAGE
Newspaper 11 15.7
Friends18 25.7
Relatives26 37.1
Advertisements 10 14.3
Others5 7.1
TOTAL 70 100.0
8/8/2019 final - IAS
http://slidepdf.com/reader/full/final-ias 34/49
34
From the above table it has been known that, out of the total respondents, 15% of the
respondents came to know about Pankaja Mill through Newspaper, 25% of the
respondents came to know about Pankaja Mill through Friends, 37% of the respondents
came to know through Relatives, 7% of them came to know through other sources.Most
of the respondents (37%) came to know Pankaja Mill from Relatives etc.
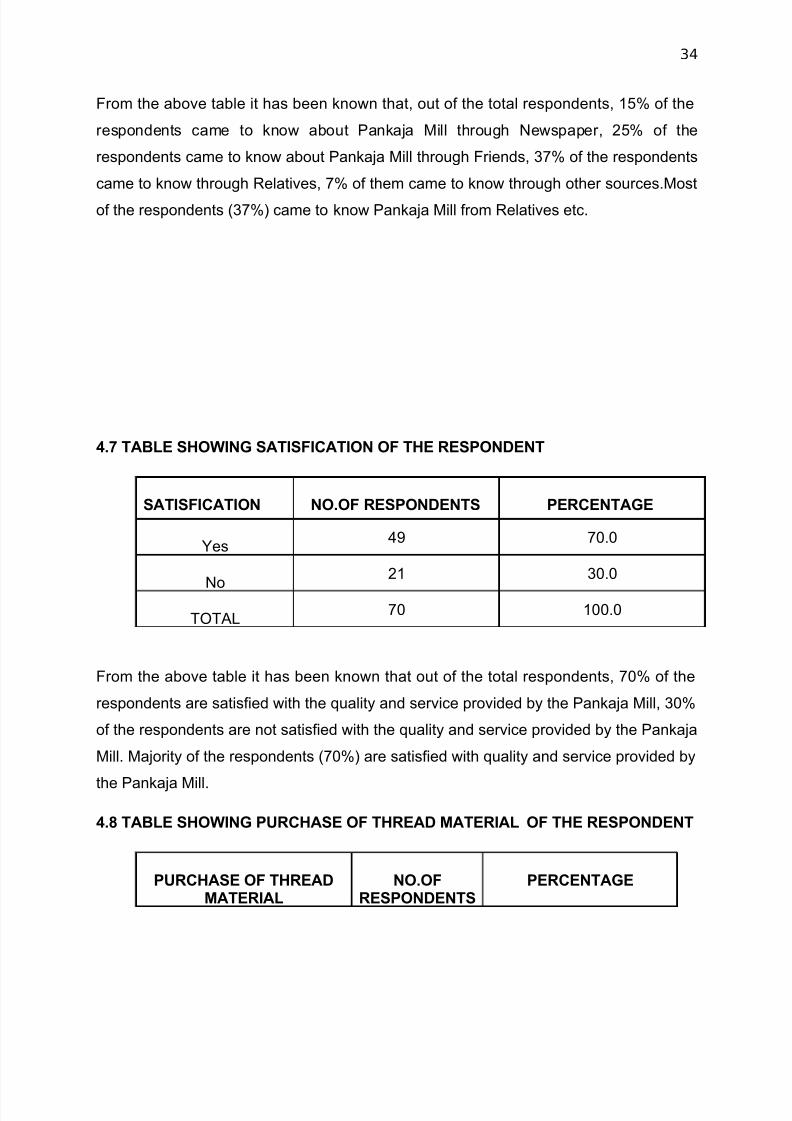
4.7 TABLE SHOWING SATISFICATION OF THE RESPONDENT
SATISFICATION NO.OF RESPONDENTS PERCENTAGE
Yes49 70.0
No
21 30.0
TOTAL70 100.0
From the above table it has been known that out of the total respondents, 70% of the
respondents are satisfied with the quality and service provided by the Pankaja Mill, 30%
of the respondents are not satisfied with the quality and service provided by the Pankaja
Mill. Majority of the respondents (70%) are satisfied with quality and service provided by
the Pankaja Mill.
4.8 TABLE SHOWING PURCHASE OF THREAD MATERIAL OF THE RESPONDENT
PURCHASE OF THREADMATERIAL
NO.OFRESPONDENTS
PERCENTAGE
8/8/2019 final - IAS
http://slidepdf.com/reader/full/final-ias 35/49
35
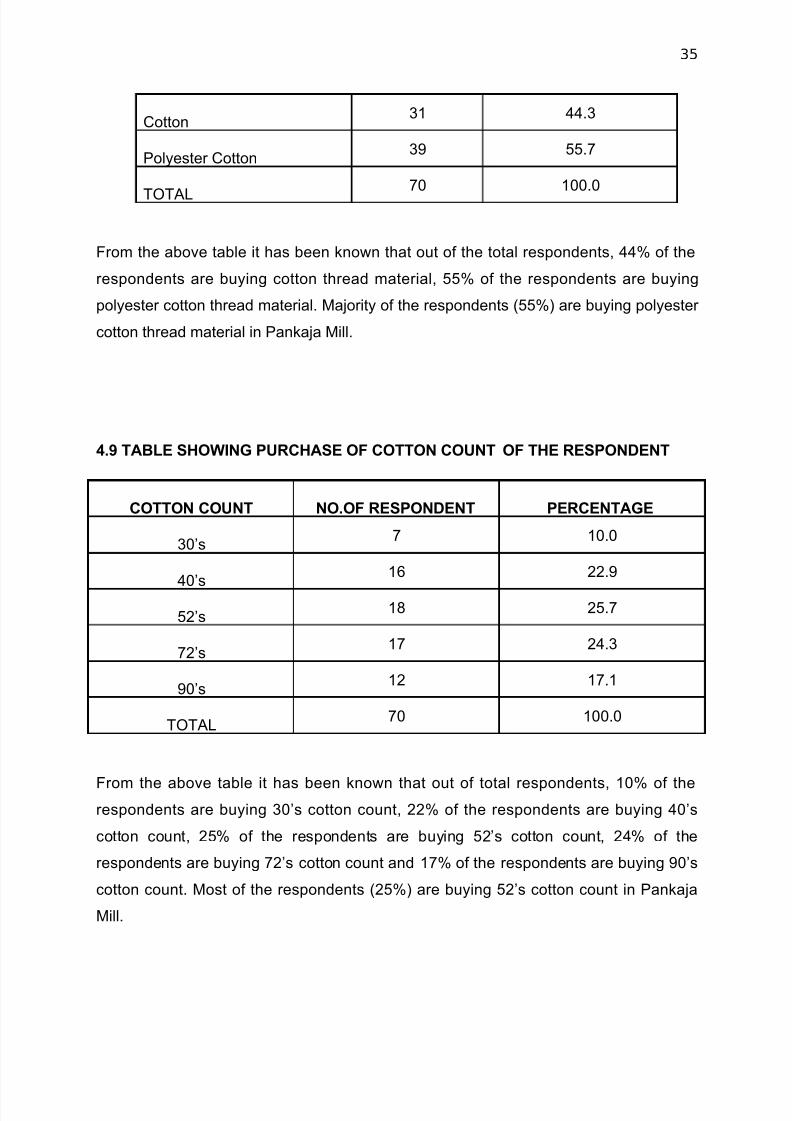
Cotton31 44.3
Polyester Cotton39 55.7
TOTAL70 100.0
From the above table it has been known that out of the total respondents, 44% of the
respondents are buying cotton thread material, 55% of the respondents are buying
polyester cotton thread material. Majority of the respondents (55%) are buying polyester
cotton thread material in Pankaja Mill.
4.9 TABLE SHOWING PURCHASE OF COTTON COUNT OF THE RESPONDENT
COTTON COUNT NO.OF RESPONDENT PERCENTAGE
30’s7 10.0
40’s16 22.9
52’s18 25.7
72’s17 24.3
90’s12 17.1
TOTAL70 100.0
From the above table it has been known that out of total respondents, 10% of therespondents are buying 30’s cotton count, 22% of the respondents are buying 40’s
cotton count, 25% of the respondents are buying 52’s cotton count, 24% of the
respondents are buying 72’s cotton count and 17% of the respondents are buying 90’s
cotton count. Most of the respondents (25%) are buying 52’s cotton count in Pankaja
Mill.
8/8/2019 final - IAS
http://slidepdf.com/reader/full/final-ias 36/49
36
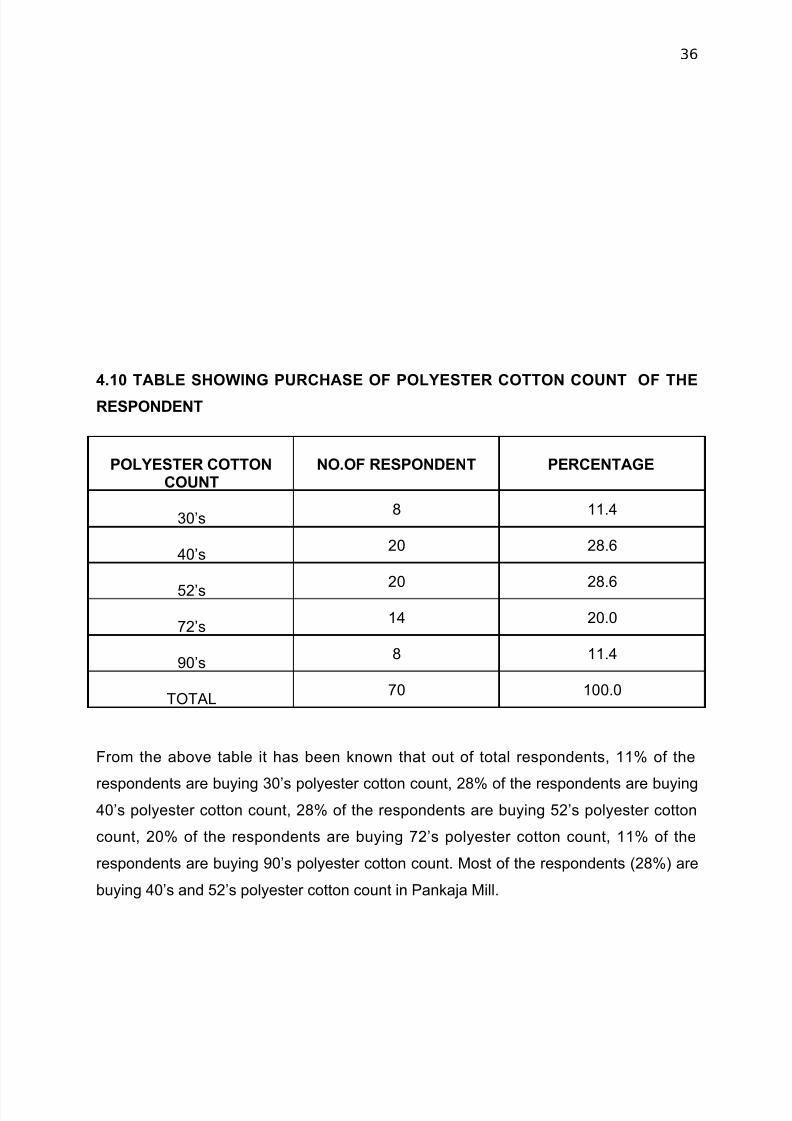
4.10 TABLE SHOWING PURCHASE OF POLYESTER COTTON COUNT OF THE
RESPONDENT
POLYESTER COTTONCOUNT
NO.OF RESPONDENT PERCENTAGE
30’s8 11.4
40’s20 28.6
52’s 20 28.6
72’s14 20.0
90’s8 11.4
TOTAL70 100.0
From the above table it has been known that out of total respondents, 11% of the
respondents are buying 30’s polyester cotton count, 28% of the respondents are buying40’s polyester cotton count, 28% of the respondents are buying 52’s polyester cotton
count, 20% of the respondents are buying 72’s polyester cotton count, 11% of the
respondents are buying 90’s polyester cotton count. Most of the respondents (28%) are
buying 40’s and 52’s polyester cotton count in Pankaja Mill.
8/8/2019 final - IAS
http://slidepdf.com/reader/full/final-ias 37/49
37
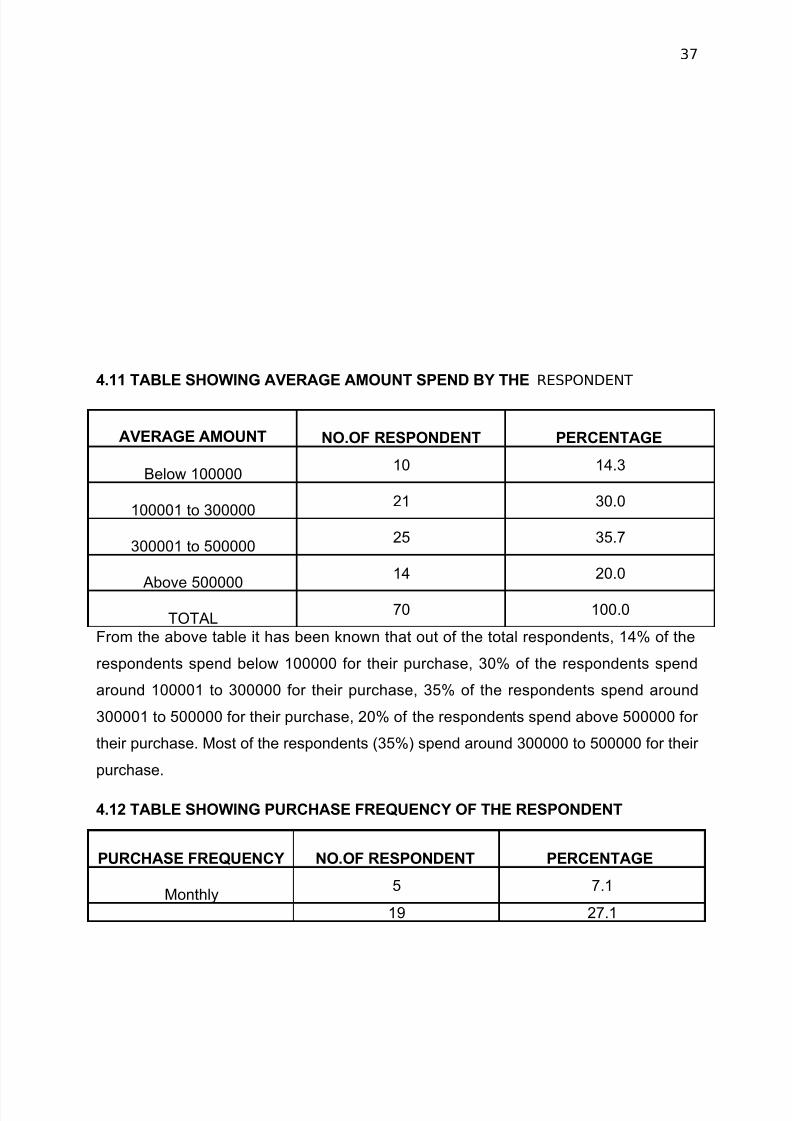
4.11 TABLE SHOWING AVERAGE AMOUNT SPEND BY THE RESPONDENT
AVERAGE AMOUNT NO.OF RESPONDENT PERCENTAGE
Below 10000010 14.3
100001 to 30000021 30.0
300001 to 50000025 35.7
Above 500000
14 20.0
TOTAL70 100.0
From the above table it has been known that out of the total respondents, 14% of the
respondents spend below 100000 for their purchase, 30% of the respondents spend
around 100001 to 300000 for their purchase, 35% of the respondents spend around
300001 to 500000 for their purchase, 20% of the respondents spend above 500000 for
their purchase. Most of the respondents (35%) spend around 300000 to 500000 for their
purchase.
4.12 TABLE SHOWING PURCHASE FREQUENCY OF THE RESPONDENT
PURCHASE FREQUENCY NO.OF RESPONDENT PERCENTAGE
Monthly5 7.1
19 27.1
8/8/2019 final - IAS
http://slidepdf.com/reader/full/final-ias 38/49
38
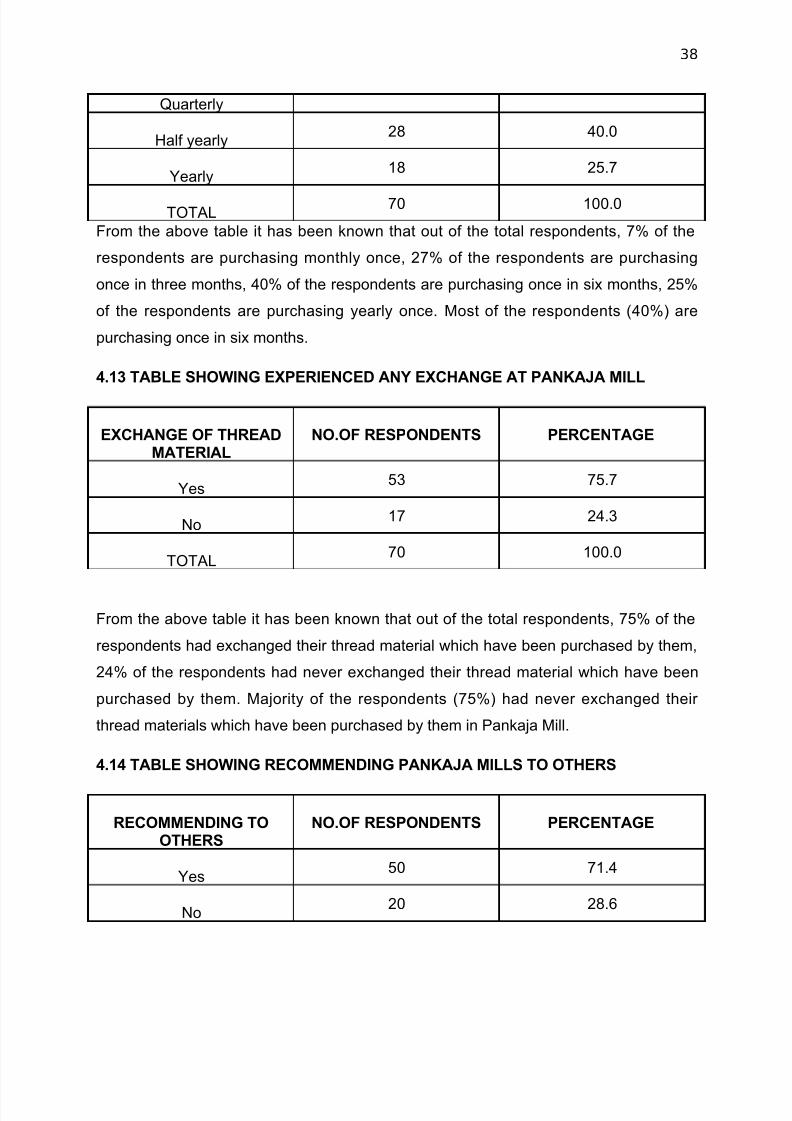
Quarterly
Half yearly28 40.0
Yearly18 25.7
TOTAL70 100.0
From the above table it has been known that out of the total respondents, 7% of the
respondents are purchasing monthly once, 27% of the respondents are purchasing
once in three months, 40% of the respondents are purchasing once in six months, 25%
of the respondents are purchasing yearly once. Most of the respondents (40%) are
purchasing once in six months.
4.13 TABLE SHOWING EXPERIENCED ANY EXCHANGE AT PANKAJA MILL
EXCHANGE OF THREADMATERIAL
NO.OF RESPONDENTS PERCENTAGE
Yes53 75.7
No17 24.3
TOTAL70 100.0
From the above table it has been known that out of the total respondents, 75% of the
respondents had exchanged their thread material which have been purchased by them,
24% of the respondents had never exchanged their thread material which have been
purchased by them. Majority of the respondents (75%) had never exchanged their
thread materials which have been purchased by them in Pankaja Mill.
4.14 TABLE SHOWING RECOMMENDING PANKAJA MILLS TO OTHERS
RECOMMENDING TOOTHERS
NO.OF RESPONDENTS PERCENTAGE
Yes50 71.4
No20 28.6
8/8/2019 final - IAS
http://slidepdf.com/reader/full/final-ias 39/49
39
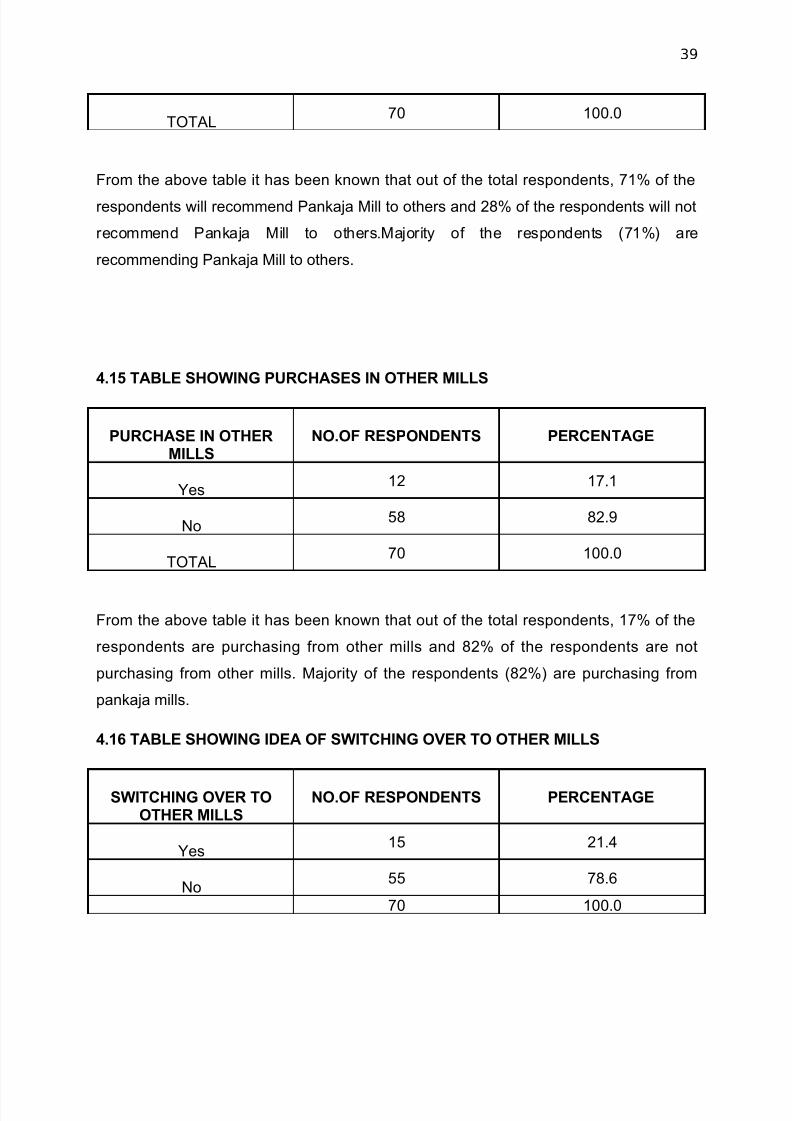
TOTAL70 100.0
From the above table it has been known that out of the total respondents, 71% of the
respondents will recommend Pankaja Mill to others and 28% of the respondents will not
recommend Pankaja Mill to others.Majority of the respondents (71%) are
recommending Pankaja Mill to others.
4.15 TABLE SHOWING PURCHASES IN OTHER MILLS
PURCHASE IN OTHERMILLS
NO.OF RESPONDENTS PERCENTAGE
Yes12 17.1
No58 82.9
TOTAL70 100.0
From the above table it has been known that out of the total respondents, 17% of the
respondents are purchasing from other mills and 82% of the respondents are not
purchasing from other mills. Majority of the respondents (82%) are purchasing from
pankaja mills.
4.16 TABLE SHOWING IDEA OF SWITCHING OVER TO OTHER MILLS
SWITCHING OVER TOOTHER MILLS
NO.OF RESPONDENTS PERCENTAGE
Yes15 21.4
No55 78.6
70 100.0
8/8/2019 final - IAS
http://slidepdf.com/reader/full/final-ias 40/49
40
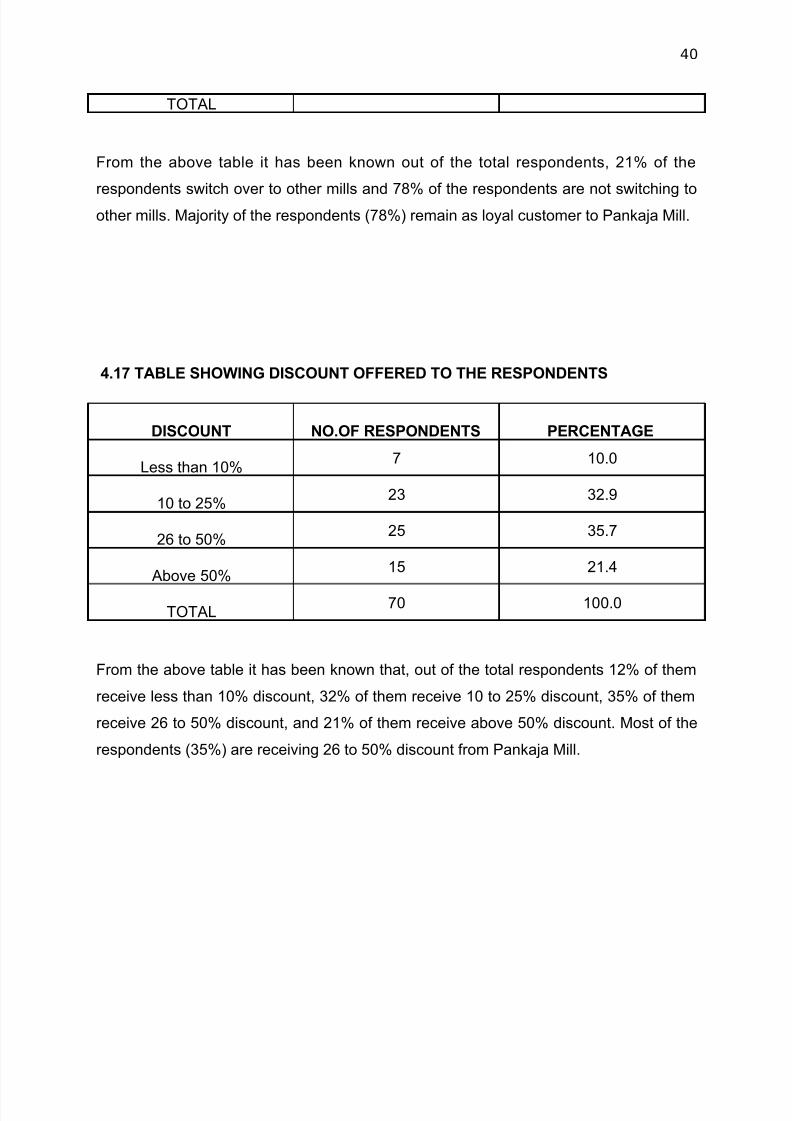
TOTAL
From the above table it has been known out of the total respondents, 21% of the
respondents switch over to other mills and 78% of the respondents are not switching toother mills. Majority of the respondents (78%) remain as loyal customer to Pankaja Mill.
4.17 TABLE SHOWING DISCOUNT OFFERED TO THE RESPONDENTS
DISCOUNT NO.OF RESPONDENTS PERCENTAGE
Less than 10%7 10.0
10 to 25%23 32.9
26 to 50%25 35.7
Above 50%15 21.4
TOTAL70 100.0
From the above table it has been known that, out of the total respondents 12% of them
receive less than 10% discount, 32% of them receive 10 to 25% discount, 35% of them
receive 26 to 50% discount, and 21% of them receive above 50% discount. Most of the
respondents (35%) are receiving 26 to 50% discount from Pankaja Mill.
8/8/2019 final - IAS
http://slidepdf.com/reader/full/final-ias 41/49
41
Chi-Square Tests
Value Df
Asymp. Sig. (2-
sided)
Pearson Chi-Square 8.404a 12 .753
N of Valid Cases 70
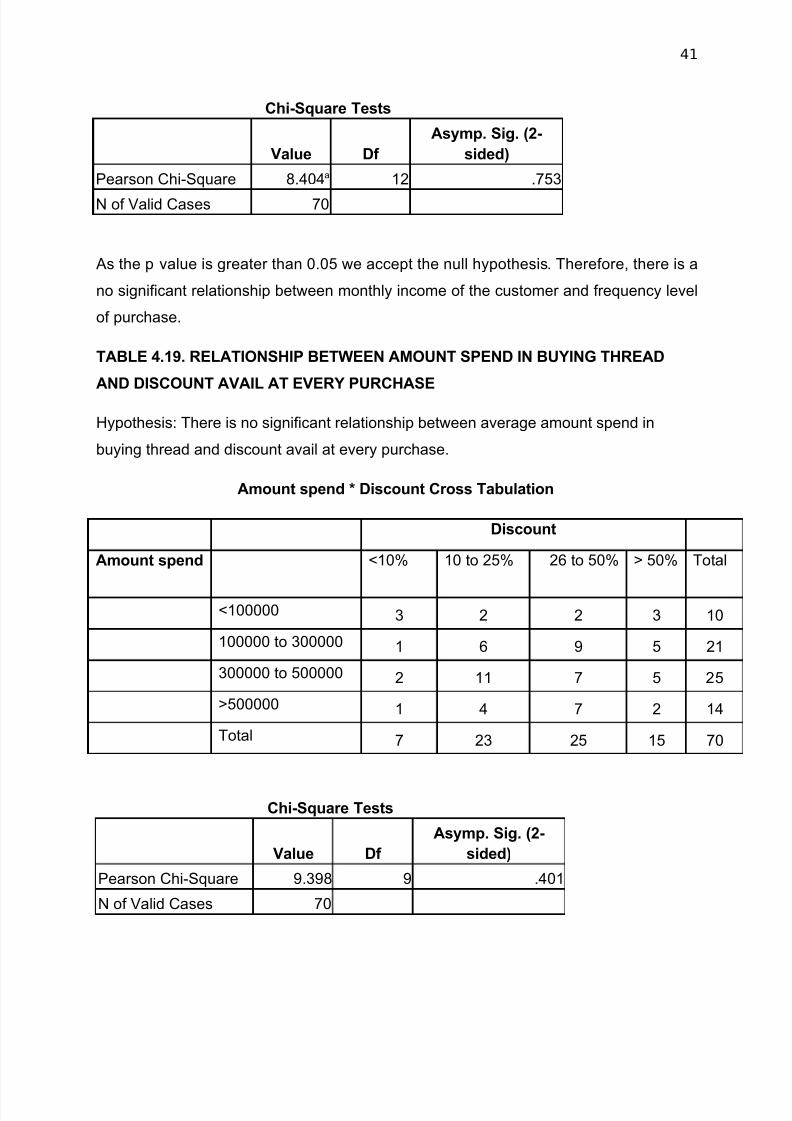
As the p value is greater than 0.05 we accept the null hypothesis. Therefore, there is a
no significant relationship between monthly income of the customer and frequency level
of purchase.
TABLE 4.19. RELATIONSHIP BETWEEN AMOUNT SPEND IN BUYING THREAD
AND DISCOUNT AVAIL AT EVERY PURCHASE
Hypothesis: There is no significant relationship between average amount spend in
buying thread and discount avail at every purchase.
Amount spend * Discount Cross Tabulation
Discount
Amount spend <10% 10 to 25% 26 to 50% > 50% Total
<100000 3 2 2 3 10
100000 to 300000 1 6 9 5 21
300000 to 500000 2 11 7 5 25
>500000 1 4 7 2 14
Total 7 23 25 15 70
Chi-Square Tests
Value Df
Asymp. Sig. (2-
sided)
Pearson Chi-Square 9.398 9 .401
N of Valid Cases 70
8/8/2019 final - IAS
http://slidepdf.com/reader/full/final-ias 42/49
42
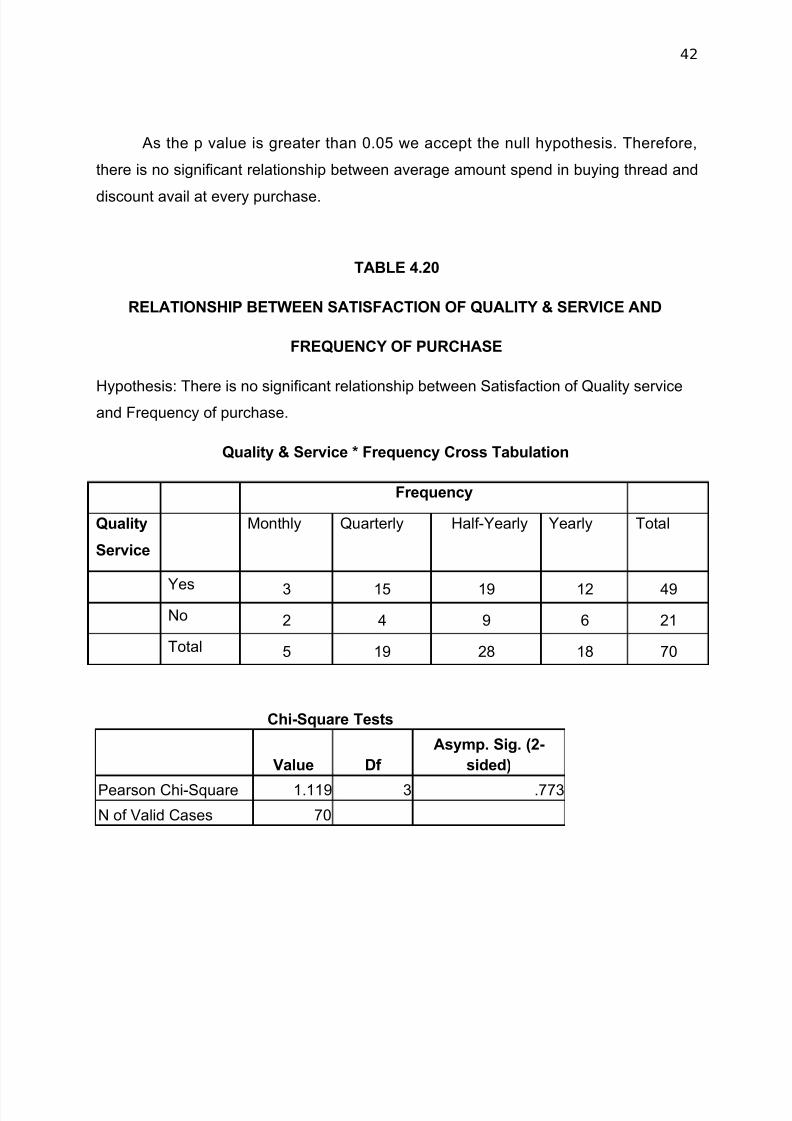
As the p value is greater than 0.05 we accept the null hypothesis. Therefore,
there is no significant relationship between average amount spend in buying thread and
discount avail at every purchase.
TABLE 4.20
RELATIONSHIP BETWEEN SATISFACTION OF QUALITY & SERVICE AND
FREQUENCY OF PURCHASE
Hypothesis: There is no significant relationship between Satisfaction of Quality serviceand Frequency of purchase.
Quality & Service * Frequency Cross Tabulation
Frequency
Quality
Service
Monthly Quarterly Half-Yearly Yearly Total
Yes 3 15 19 12 49
No 2 4 9 6 21
Total 5 19 28 18 70
Chi-Square Tests
Value Df
Asymp. Sig. (2-
sided)
Pearson Chi-Square 1.119 3 .773
N of Valid Cases 70
8/8/2019 final - IAS
http://slidepdf.com/reader/full/final-ias 43/49
43
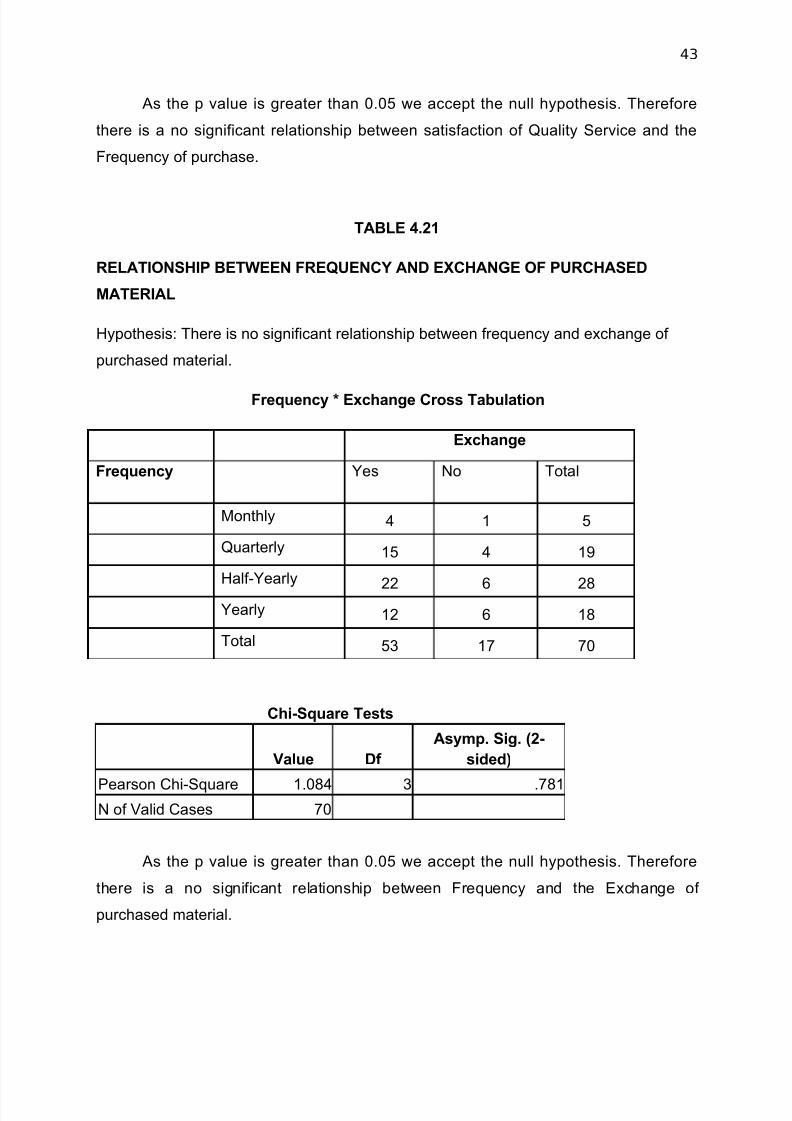
As the p value is greater than 0.05 we accept the null hypothesis. Therefore
there is a no significant relationship between satisfaction of Quality Service and the
Frequency of purchase.
TABLE 4.21
RELATIONSHIP BETWEEN FREQUENCY AND EXCHANGE OF PURCHASED
MATERIAL
Hypothesis: There is no significant relationship between frequency and exchange of
purchased material.
Frequency * Exchange Cross Tabulation
Exchange
Frequency Yes No Total
Monthly 4 1 5
Quarterly 15 4 19
Half-Yearly22 6 28
Yearly 12 6 18
Total 53 17 70
Chi-Square Tests
Value Df
Asymp. Sig. (2-
sided)
Pearson Chi-Square 1.084 3 .781N of Valid Cases 70
As the p value is greater than 0.05 we accept the null hypothesis. Therefore
there is a no significant relationship between Frequency and the Exchange of
purchased material.
8/8/2019 final - IAS
http://slidepdf.com/reader/full/final-ias 44/49
44
CHAPTER 5
CONCLUSION
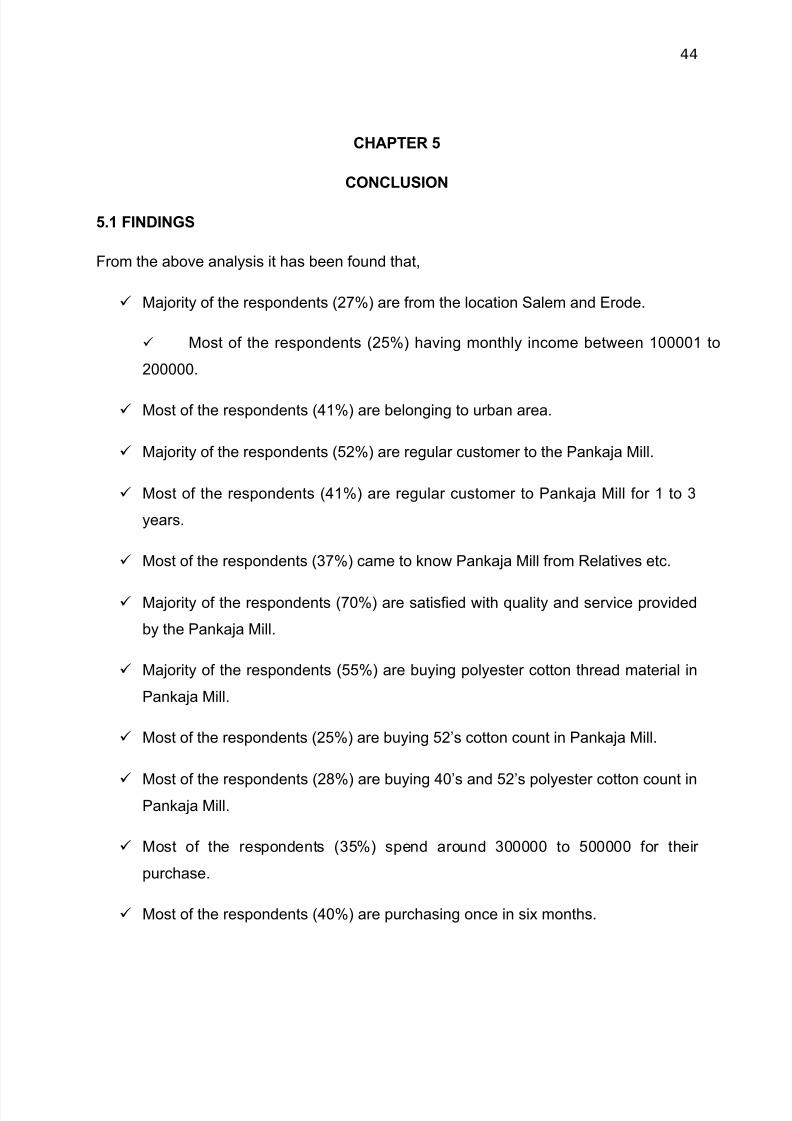
5.1 FINDINGS
From the above analysis it has been found that,
Majority of the respondents (27%) are from the location Salem and Erode.
Most of the respondents (25%) having monthly income between 100001 to
200000.
Most of the respondents (41%) are belonging to urban area.
Majority of the respondents (52%) are regular customer to the Pankaja Mill.
Most of the respondents (41%) are regular customer to Pankaja Mill for 1 to 3
years.
Most of the respondents (37%) came to know Pankaja Mill from Relatives etc.
Majority of the respondents (70%) are satisfied with quality and service provided
by the Pankaja Mill.
Majority of the respondents (55%) are buying polyester cotton thread material in
Pankaja Mill.
Most of the respondents (25%) are buying 52’s cotton count in Pankaja Mill.
Most of the respondents (28%) are buying 40’s and 52’s polyester cotton count inPankaja Mill.
Most of the respondents (35%) spend around 300000 to 500000 for their
purchase.
Most of the respondents (40%) are purchasing once in six months.
8/8/2019 final - IAS
http://slidepdf.com/reader/full/final-ias 45/49
45
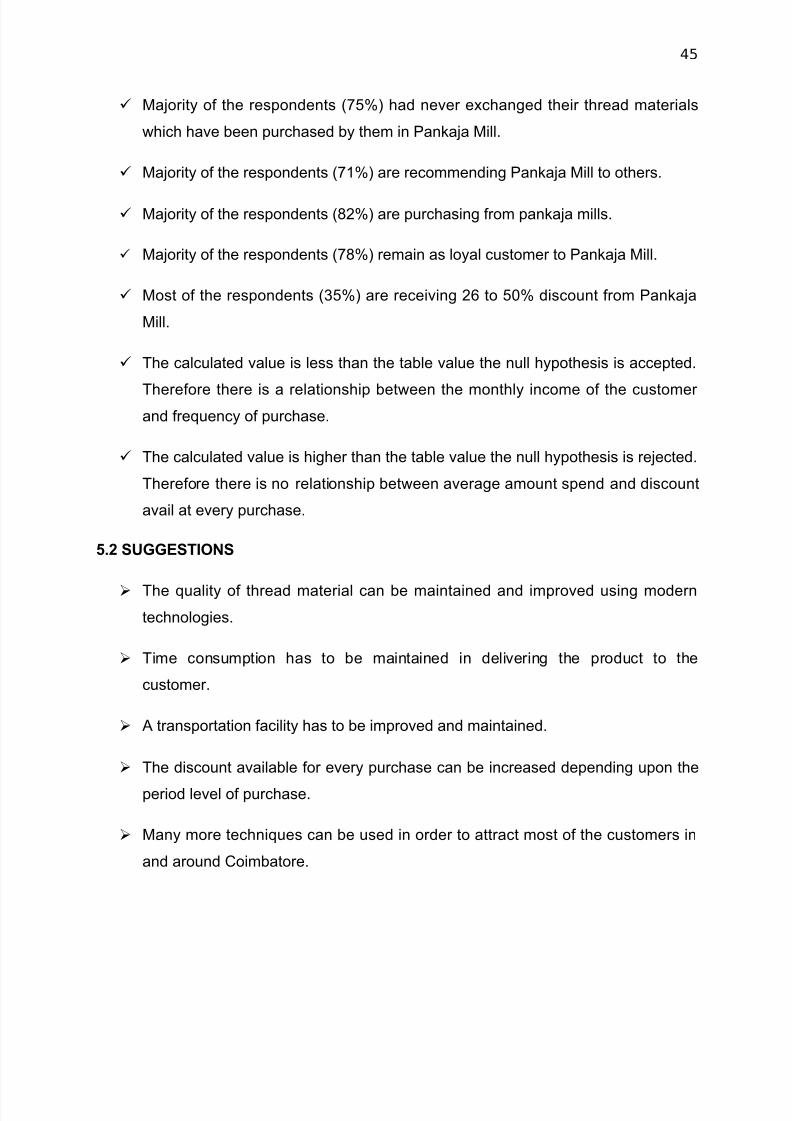
Majority of the respondents (75%) had never exchanged their thread materials
which have been purchased by them in Pankaja Mill.
Majority of the respondents (71%) are recommending Pankaja Mill to others.
Majority of the respondents (82%) are purchasing from pankaja mills.
Majority of the respondents (78%) remain as loyal customer to Pankaja Mill.
Most of the respondents (35%) are receiving 26 to 50% discount from Pankaja
Mill.
The calculated value is less than the table value the null hypothesis is accepted.
Therefore there is a relationship between the monthly income of the customer and frequency of purchase.
The calculated value is higher than the table value the null hypothesis is rejected.
Therefore there is no relationship between average amount spend and discount
avail at every purchase.
5.2 SUGGESTIONS
The quality of thread material can be maintained and improved using modern
technologies.
Time consumption has to be maintained in delivering the product to the
customer.
A transportation facility has to be improved and maintained.
The discount available for every purchase can be increased depending upon the
period level of purchase.
Many more techniques can be used in order to attract most of the customers in
and around Coimbatore.
8/8/2019 final - IAS
http://slidepdf.com/reader/full/final-ias 46/49
46
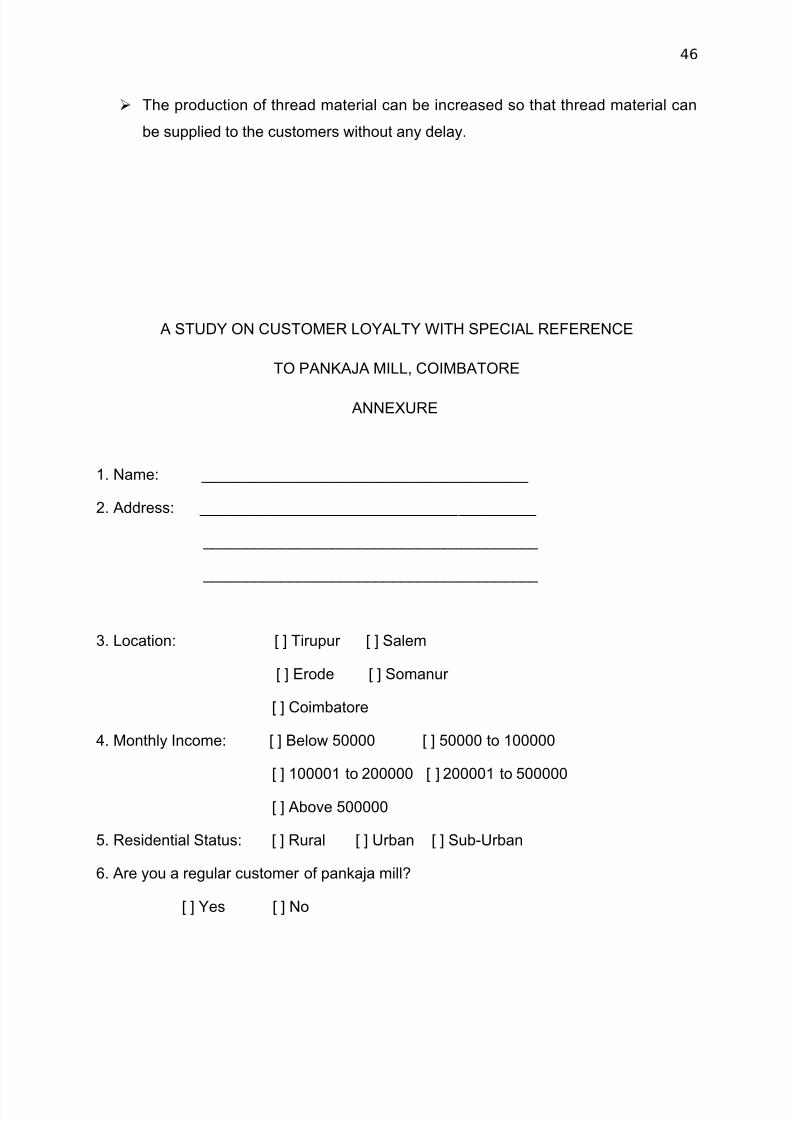
The production of thread material can be increased so that thread material can
be supplied to the customers without any delay.
A STUDY ON CUSTOMER LOYALTY WITH SPECIAL REFERENCE
TO PANKAJA MILL, COIMBATORE
ANNEXURE
1. Name: ______________________________________
2. Address: _______________________________________
_______________________________________
_______________________________________
3. Location: [ ] Tirupur [ ] Salem
[ ] Erode [ ] Somanur
[ ] Coimbatore
4. Monthly Income: [ ] Below 50000 [ ] 50000 to 100000
[ ] 100001 to 200000 [ ] 200001 to 500000
[ ] Above 500000
5. Residential Status: [ ] Rural [ ] Urban [ ] Sub-Urban
6. Are you a regular customer of pankaja mill?
[ ] Yes [ ] No
8/8/2019 final - IAS
http://slidepdf.com/reader/full/final-ias 47/49
47
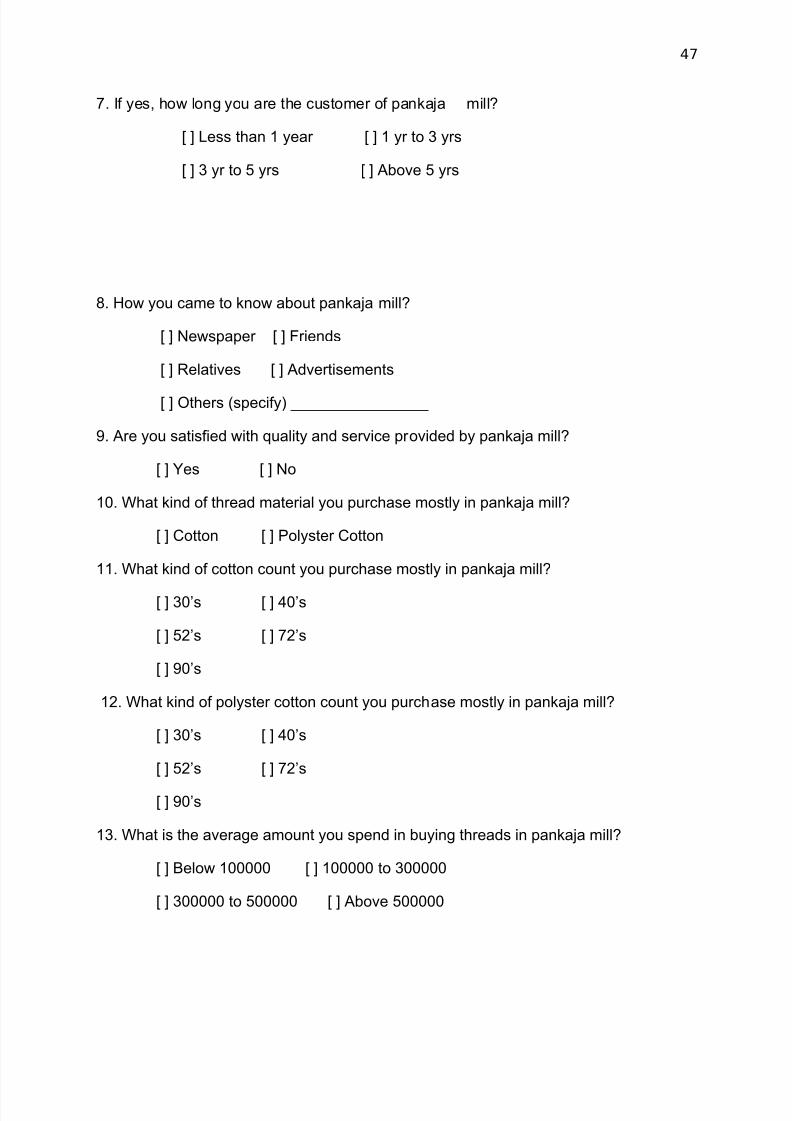
7. If yes, how long you are the customer of pankaja mill?
[ ] Less than 1 year [ ] 1 yr to 3 yrs
[ ] 3 yr to 5 yrs [ ] Above 5 yrs
8. How you came to know about pankaja mill?
[ ] Newspaper [ ] Friends
[ ] Relatives [ ] Advertisements
[ ] Others (specify) ________________
9. Are you satisfied with quality and service provided by pankaja mill?
[ ] Yes [ ] No
10. What kind of thread material you purchase mostly in pankaja mill?
[ ] Cotton [ ] Polyster Cotton
11. What kind of cotton count you purchase mostly in pankaja mill?
[ ] 30’s [ ] 40’s
[ ] 52’s [ ] 72’s
[ ] 90’s
12. What kind of polyster cotton count you purchase mostly in pankaja mill?
[ ] 30’s [ ] 40’s
[ ] 52’s [ ] 72’s
[ ] 90’s
13. What is the average amount you spend in buying threads in pankaja mill?
[ ] Below 100000 [ ] 100000 to 300000
[ ] 300000 to 500000 [ ] Above 500000
8/8/2019 final - IAS
http://slidepdf.com/reader/full/final-ias 48/49
48
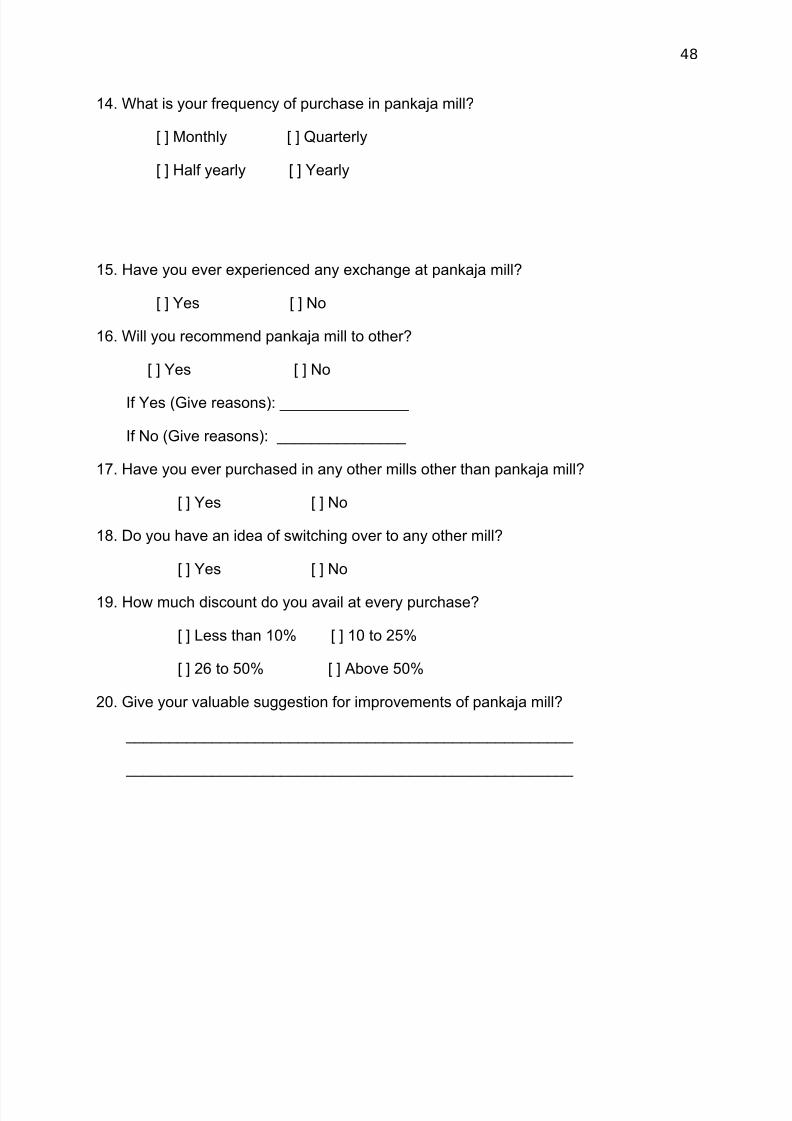
14. What is your frequency of purchase in pankaja mill?
[ ] Monthly [ ] Quarterly
[ ] Half yearly [ ] Yearly
15. Have you ever experienced any exchange at pankaja mill?
[ ] Yes [ ] No
16. Will you recommend pankaja mill to other?
[ ] Yes [ ] No
If Yes (Give reasons): _______________
If No (Give reasons): _______________
17. Have you ever purchased in any other mills other than pankaja mill?
[ ] Yes [ ] No
18. Do you have an idea of switching over to any other mill?
[ ] Yes [ ] No
19. How much discount do you avail at every purchase?
[ ] Less than 10% [ ] 10 to 25%
[ ] 26 to 50% [ ] Above 50%
20. Give your valuable suggestion for improvements of pankaja mill?
____________________________________________________
____________________________________________________
8/8/2019 final - IAS
http://slidepdf.com/reader/full/final-ias 49/49
49
REFERENCES
Books:
Philip Kotler, “Marketing Management”, Pearson Education( Singapore) Pvt
Ltd.,2003
R. Nandagopal, “Research Methods in Business”, First Edition, Excell Books,New Delhi,2007.
Kothari C.R, “ Research Methodology” , Wishwa Prakasham, Second Edition,
New Delhi, 1997.
Gupta, S.P, “Statistical Methods”, Sultan Chand & Sons Company, 35 Edition,
New Delhi.
Websites:
http://www.google.com
http://www.wisegeek.com/what-is-customerloyalty.html
http://en.wikipedia.org/customer-loyalty
http://insearch.yhaoo.com/search?ei=utf-8&fr=yfp-t-
&type=ds&p=customer+loyalty