
Estudo de enzimas modificadoras de tRNA e codon Pascoal ...
114
Universidade de Aveiro 2015 Departamento de Biologia Carlos António Pascoal Marques Estudo de enzimas modificadoras de tRNA e codon usage bias em cancro Study of tRNA modifying enzymes and codon usage bias in cancer
Transcript of Estudo de enzimas modificadoras de tRNA e codon Pascoal ...

Universidade de Aveiro
2015
Departamento de Biologia
Carlos António Pascoal Marques
Estudo de enzimas modificadoras de tRNA e codon usage bias em cancro Study of tRNA modifying enzymes and codon usage bias in cancer


Universidade de Aveiro
2015
Departamento de Biologia
Carlos António Pascoal Marques
Estudo de enzimas modificadoras de tRNA e codon usage bias em cancro Study of tRNA modifying enzymes and codon usage bias in cancer
Dissertação apresentada à Universidade de Aveiro para cumprimento dos requisitos necessários à obtenção do grau de Mestre em Biologia Molecular e Celular, realizada sob a orientação científica da Doutora Ana Raquel Santos Calhôa Mano Soares, Investigadora de Pós-Doutoramento da Universidade de Aveiro


DECLARAÇÃO
Declaro que este relatório é integralmente da minha autoria, estando devidamente referenciadas as fontes e obras consultadas, bem como identificadas de modo claro as citações dessas obras. Não contém, por isso, qualquer tipo de plágio quer de textos publicados, qualquer que seja o meio dessa publicação, incluindo meios eletrónicos, quer de trabalhos académicos.


o júri
presidente Prof. Doutora Maria Helena Abreu Silva professora auxiliar do Departamento de Biologia da Universidade de Aveiro
Prof. Doutor Joel Perdiz Arrais professor auxiliar convidado do Departamento de Engenharia Informática da Faculdade de Ciências e Tecnologia da Universidade de Coimbra
Doutora Ana Raquel Santos Calhôa Mano Soares investigadora de pós-doutoramento do Instituto de Biomedicina da Universidade de Aveiro


agradecimentos
Em primeiro lugar gostaria de agradecer à minha orientadora Dra. Ana Raquel Soares por todos os ensinamentos, conhecimentos, bem como por todo o apoio e empenho que depositou em mim. Agradeço também ao Prof. Dr. Manuel Santos por me ter dado esta oportunidade de trabalho no seu laboratório e por todos os conhecimentos transmitidos. A todos os membros do laboratório de Biologia do RNA por toda a ajuda que me deram, pelo companheirismo e pela forma como me receberam. Gostaria também de agradecer à Dra. Gabriela Moura por todos os conhecimentos e conversas sobre bioinformática. À Prof. Dra. Adelaide Freitas pela preciosa ajuda, disponibilidade, empenho demonstrado e todos os conhecimentos e conselhos sobre estatística. Quero ainda agradecer ao Dr. Sérgio Matos pela disponibilidade, pelos conselhos técnicos e conhecimentos de programação. A todos os meus amigos. À minha família e a todos os que fazem e fizeram parte da minha vida. À Ana, por tudo o que representa para mim por fazer parte da minha vida, pelo apoio incondicional e, principalmente, por estar presente e proporcionar estabilidade nos momentos essenciais. Obrigado por todo o carinho, compreensão e amizade. À minha mãe, por ser quem é, pelo carinho, pelo amor, pelo esforço incondicional que a tem pautado. Nenhum conjunto de palavras irá alguma vez descrever o agradecimento que tento fazer, serão sempre demasiado ocas. Deixo para os actos. Ao que foi, é e será sempre o meu mentor.


palavras-chave
Expressão génica, microarrays, meta-análise, codon usage, cancro, tRNA, enzimas modificadoras de tRNA.
resumo
Estudos recentes indicam que as modificações de tRNAs e as enzimas modificadoras de tRNAs desempenham papéis importantes em doenças Humanas complexas como são exemplos: cancro, doenças neurológicas e mitocondriais.
Conjecturamos que a desregulação na expressão das enzimas modificadoras de tRNAs afecta o nível de modificações dos tRNAs e, consequentemente, as suas funções e eficiência de tradução dos codões correspondentes aos tRNAs que afectam. Devido à degeneração do código genético, a maior parte dos aminoácidos são codificados por dois a seis codões sinónimos. Esta degeneração e o uso tendencioso de codões sinónimos causam alterações que podem ir desde problemas de enovelamento proteico a um aumento de eficiência de tradução de um grupo de genes específico.
Neste trabalho, focámo-nos no cancro e fizemos um estudo de meta-análise para comparar perfis de expressão génica de microarrays, onde foram encontradas enzimas modificadoras de tRNA desreguladas e analisar o codon usage dos diferentes tipos de cancro nestes dados, reportados em estudos anteriores.
Encontrámos um total de 36 diferentes enzimas modificadoras de tRNAs que se encontram desreguladas na maior parte das datasets de cancro analisadas. A análise de codon usage revelou uma preferência, por parte dos genes sobre-expressos, por codões acabados em AU e uma preferência por codões acabados em GC, em genes sub-expressos. Uma subsequente análise de PCA biplot veio mostrar esta mesma tendência. Analisámos também o codon usage de datasets onde a enzima modificadora de tRNA CTU2 se encontrava desregulada uma vez que esta enzima afecta a posição “wobble” (posição 34) de tRNAs específicos.
Os nossos dados apontam para um padrão de codon usage distinto entre genes sobre-expressos e sub-expressos em cancro, que pode ser causado pela desregulação de enzimas modificadores de tRNA específicas. Esta tendência de codon usage pode aumentar a transcrição e eficiência de tradução de alguns genes que, de outra forma, numa situação normal, seriam traduzidos de forma menos eficiente.


keywords
Gene expression, microarrays, meta-analysis, codon usage, cancer, tRNA, tRNA modifying enzymes.
abstract
Recent evidences indicate that tRNA modifications and tRNA modifying
enzymes may play important roles in complex human diseases such as cancer, neurological disorders and mitochondrial-linked diseases.
We postulate that expression deregulation of tRNA modifying enzymes affects the level of tRNA modifications and, consequently, their function and the translation efficiency of their tRNA corresponding codons. Due to the degeneracy of the genetic code, most amino acids are encoded by two to six synonymous codons. This degeneracy and the biased usage of synonymous codons cause alterations that can span from protein folding to enhanced translation efficiency of a select gene group.
In this work, we focused on cancer and performed a meta-analysis study to compare microarray gene expression profiles, reported by previous studies and evaluate the codon usage of different types of cancer where tRNA modifying enzymes were found de-regulated.
A total of 36 different tRNA modifying enzymes were found de-regulated in most cancer datasets analyzed. The codon usage analysis revealed a preference for codons ending in AU for the up-regulated genes, while the down-regulated genes show a preference for GC ending codons. Furthermore, a PCA biplot analysis showed this same tendency. We also analyzed the codon usage of the datasets where the CTU2 tRNA modifying enzyme was found deregulated as this enzyme affects the wobble position (position 34) of specific tRNAs.
Our data points to a distinct codon usage pattern between up and down-regulated genes in cancer, which might be caused by the deregulation of specific tRNA modifying enzymes. This codon usage bias may augment the transcription and translation efficiency of some genes that otherwise, in a normal situation, would be translated less efficiently.


Table of contents
Chapter I
1. Introduction .................................................................................................. 21
1.1. Central dogma ....................................................................................... 21
1.2. Gene translation .................................................................................... 22
1.3. The genetic code ................................................................................... 27
1.4. Codon usage bias ................................................................................. 29
1.5. Transfer RNAs ....................................................................................... 29
1.6. tRNA modifications ............................................................................... 32
1.6.1. Types of tRNA modifications ......................................................... 33
1.6.2. Functions ........................................................................................ 33
1.7. tRNA modifying enzymes and Human diseases................................. 34
1.8. DNA microarrays ................................................................................... 36
1.9. Meta-analysis ......................................................................................... 37
1.10. Dataset rearrangements – Specific studies: Colorectal cancer gene
set and CTU2 case study gene set ................................................................ 38
1.11. Aims of the study ............................................................................... 39
Chapter II
2. Methodology ................................................................................................ 43
2.1. Dataset collection and preprocessing ................................................. 43
2.2. Dataset retrieving .................................................................................. 44
2.3. GO enrichment analysis ....................................................................... 45
2.4. Sequence retrieving .............................................................................. 45
2.5. Sequence analysis ................................................................................ 46
2.6. Statistical analysis ................................................................................ 46


Chapter III
3. Results .......................................................................................................... 51
3.1. Data overview ........................................................................................ 51
3.2. GO enrichment analysis ....................................................................... 52
3.3. Codon usage analysis .......................................................................... 56
3.3.1. Codon usage of all cancer datasets .............................................. 56
3.3.2. Codon usage of colorectal cancer datasets ................................. 61
3.3.3. Codon usage of cancer datasets with deregulated CTU2 ........... 66
3.4. Covariance biplot analysis ................................................................... 70
3.4.1. Covariance biplot of all cancer datasets ...................................... 70
3.4.2. Covariance biplot of colorectal cancer datasets ......................... 73
3.4.3. Covariance biplot of cancer datasets with deregulated CTU2.... 75
Chapter IV
4. Discussion .................................................................................................... 81
4.1. Overview ................................................................................................ 81
4.2. Codon bias variation ............................................................................. 82
4.3. GO enrichment analysis ....................................................................... 83
4.4. Covariance biplot .................................................................................. 85
Chapter V
5. Final Remarks .............................................................................................. 91
References .......................................................................................................... 93
Supplementary Material ................................................................................... 104


Chapter I
Introduction


Chapter I
21
1. Introduction
Cells are the fundamental units of life and their genetic information is stored in
the genome in the form of double stranded molecules of deoxyribonucleic acid
(DNA) (Alberts et al., 2008). This information is used to produce proteins - long
unbranched polymer chains, formed by stringing together monomeric building
blocks, named amino acids - that are crucial to construct and maintain life (Alberts
et al., 2008; Brown, 2007). In order to do so, the information carried in DNA is
transcribed into a molecule of messenger ribonucleic acid (mRNA), through a
process designated as transcription. This molecule is then translated into a protein
by a process called translation. In this process, the information in the mRNA is
interpreted by a second type of RNA called transfer RNA (tRNA) with the aid of a
third type of RNA, ribosomal RNA (rRNA), and its associated proteins (Lodish,
2008) composing the structure known as the ribosome.
1.1. Central dogma
Crick postulated that the genetic information follows a sequential transition
from DNA to mRNA and from mRNA to protein and this concept constitutes the
central dogma of molecular biology (Crick, 1970). This dogma also states that
such information cannot be transferred back from protein to nucleic acid (Figure 1)
(Crick, 1970).
Figure 1 – Central dogma of molecular biology. Solid arrows show general transfers and dotted arrows show special transfers (Crick, 1970).

Introduction
22
1.2. Gene translation
Translation is the process by which the nucleotide sequence of an mRNA is
translated to amino acids, which bond in a polypeptide chain (Lodish, 2008). In
eukaryotic cells, the translation of an mRNA molecule into protein takes place in
the cytosol on a large ribonucleoprotein assembly called ribosome (Alberts et al.,
2008). The ribosome is called a ribonucleoprotein because it is composed of rRNA
and proteins. Each ribosome comprises two subunits. In Eukaryotes, these are the
40S small subunit and 60S large subunit (Brown, 2007). The ribosomes coordinate
protein synthesis by placing mRNA, aminoacyl-tRNAs and associated protein
factors in their correct position relative to one another (Brown, 2007).
The translation process can be divided into three main stages: initiation,
elongation and termination (Allison, 2007), which are described below. Each stage
of protein synthesis involves multiple accessory factors and energy from GTP
hydrolysis.
Initiation is the most complex and the most tightly controlled step in protein
synthesis, involving the assembly of the ternary complex eIF2-GTP-Met-tRNAMet-i,
comprised of eukaryotic initiation factor 2 (eIF2), GTP and the amino acid-charged
tRNA (met-tRNA; bound at the ribosome P site) at the initiation codon (Allison,
2007) (Figure 2).
Figure 2 – Formation of the ternary complex (adapted from Jackson et al., 2010).
This complex binds to the 40S ribosomal subunit, in association with initiation
factors eIF1, eIF1A and eIF3 (Brown, 2007) to form the 43S complex. Two
features of the eukaryotic mRNA become important at this point: the 5’ cap and
the 3’-poly(A) tail (Allison, 2007). The eIF4F complex (eIF4A, eIF4E and eIF4G)
(Brown, 2007) assembles on the 5’ cap of the mRNA and unwinds the structures
found in the 5’ untranslated region (UTR) using the ATP dependent action of the

Chapter I
23
eIF4A subunit (Kapp and Lorsch, 2004). The eIF4F along eIF3 and the poly(A)
binding protein (PAB) bound to the 3’-poly(A) tail, loads the mRNA onto the 43S
complex (Figure 3) (Kapp and Lorsch, 2004). Once the mRNA is loaded, the 43S
complex begins scanning down the message in the 5’ to 3’ direction, searching the
initiation codon (Allison, 2007).
When the 43S complex encounters the initiation codon, usually embedded in a
favorable short consensus sequence referred as Kozak sequence, codon-
anticodon base pairing takes place between the initiation codon and the initiator
tRNA in the ternary complex and the scanning stops (Brown, 2007; Kapp and
Lorsch, 2004; Lodish, 2008). Recognition of the start codon leads to the arrest of
the ribosomal complex forming a stable 48S complex (Allison, 2007). It also leads
to the hydrolysis of the GTP associated with eIF2, (Kapp and Lorsch, 2004;
Lodish, 2008). After GTP hydrolysis eIF2·GDP releases the met-tRNAi into the P
site, dissociating from the complex, along with eIF1, eIF3 and eIF5 (Jackson et al.,
2010; Kapp and Lorsch, 2004). Then, eIF5B·GTP binds to the complex and
facilitates the joining of the 60S ribosomal subunit (Kapp and Lorsch, 2004). This
event triggers GTP hydrolysis by eIF5B and it dissociates from the complex along
with eIF1A, forming the 80S complex (Figure 3) (Allison, 2007; Jackson et al.,
2010; Kapp and Lorsch, 2004).

Introduction
24
Figure 3 – Overview of the translation initiation process that is divided into eight stages (2-9) (Jackson et al., 2010).
Chapter I
25
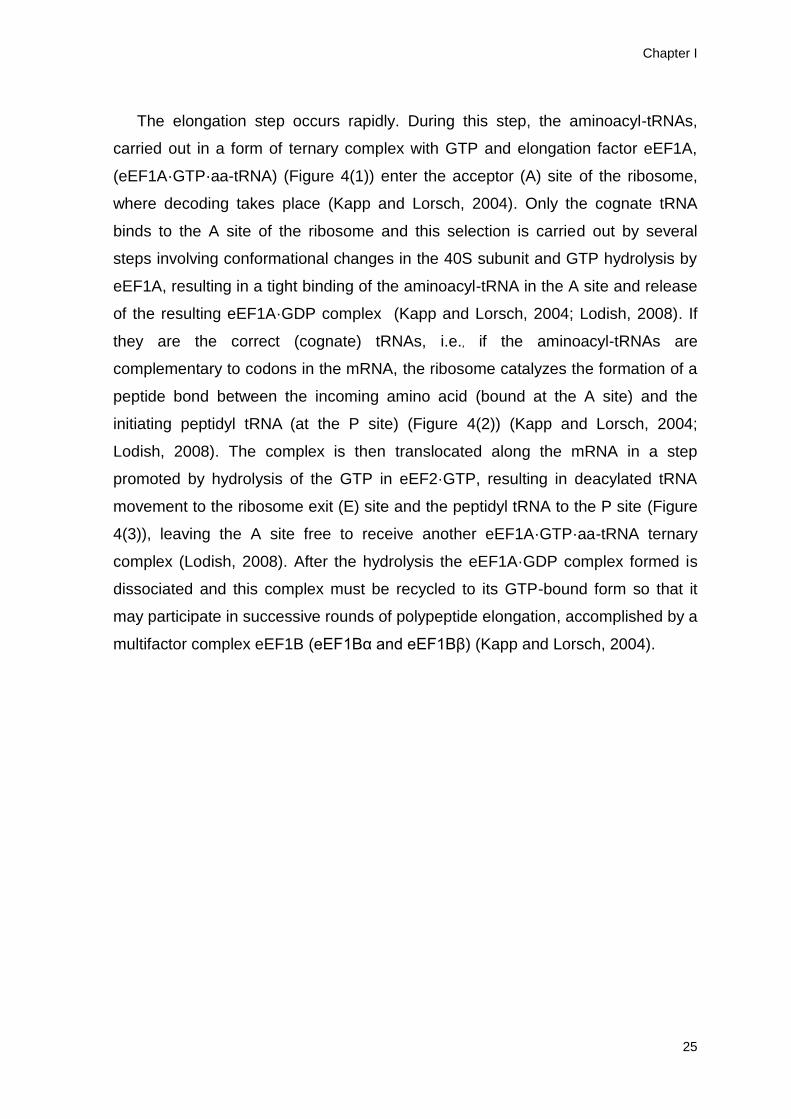
The elongation step occurs rapidly. During this step, the aminoacyl-tRNAs,
carried out in a form of ternary complex with GTP and elongation factor eEF1A,
(eEF1A·GTP·aa-tRNA) (Figure 4(1)) enter the acceptor (A) site of the ribosome,
where decoding takes place (Kapp and Lorsch, 2004). Only the cognate tRNA
binds to the A site of the ribosome and this selection is carried out by several
steps involving conformational changes in the 40S subunit and GTP hydrolysis by
eEF1A, resulting in a tight binding of the aminoacyl-tRNA in the A site and release
of the resulting eEF1A·GDP complex (Kapp and Lorsch, 2004; Lodish, 2008). If
they are the correct (cognate) tRNAs, i.e., if the aminoacyl-tRNAs are
complementary to codons in the mRNA, the ribosome catalyzes the formation of a
peptide bond between the incoming amino acid (bound at the A site) and the
initiating peptidyl tRNA (at the P site) (Figure 4(2)) (Kapp and Lorsch, 2004;
Lodish, 2008). The complex is then translocated along the mRNA in a step
promoted by hydrolysis of the GTP in eEF2·GTP, resulting in deacylated tRNA
movement to the ribosome exit (E) site and the peptidyl tRNA to the P site (Figure
4(3)), leaving the A site free to receive another eEF1A·GTP·aa-tRNA ternary
complex (Lodish, 2008). After the hydrolysis the eEF1A·GDP complex formed is
dissociated and this complex must be recycled to its GTP-bound form so that it
may participate in successive rounds of polypeptide elongation, accomplished by a
multifactor complex eEF1B (eEF1Bα and eEF1Bβ) (Kapp and Lorsch, 2004).

Introduction
26
Figure 4 – The eukaryotic translation elongation cycle that is divided into three stages
(1-3) (Schneider-Poetsch et al., 2010).
The termination of translation takes place when a stop codon is encountered
by the ribosome in the A site, which leads to the hydrolysis of the ester bond
linking the polypeptide chain to the P site and release of the completed
polypeptide (Kapp and Lorsch, 2004). The recognition of all three stop codons,
namely UAA, UAG and UGA is due to the release factor eRF1, which binds in the
A site and stimulates the release factor eRF3, a GTPase that triggers the release
of eRF1 from the ribosome following peptidyl-tRNA hydrolysis (Figure 5) (Kapp
and Lorsch, 2004).
The final step in termination is the process of recycling of the ribosomal
subunits so that they can be used in another round of initiation. This process is not
well understood in eukaryotes (Allison, 2007). However, the closed-loop model of
eukaryotic mRNAs has suggested the possibility that termination and recycling
Chapter I
27
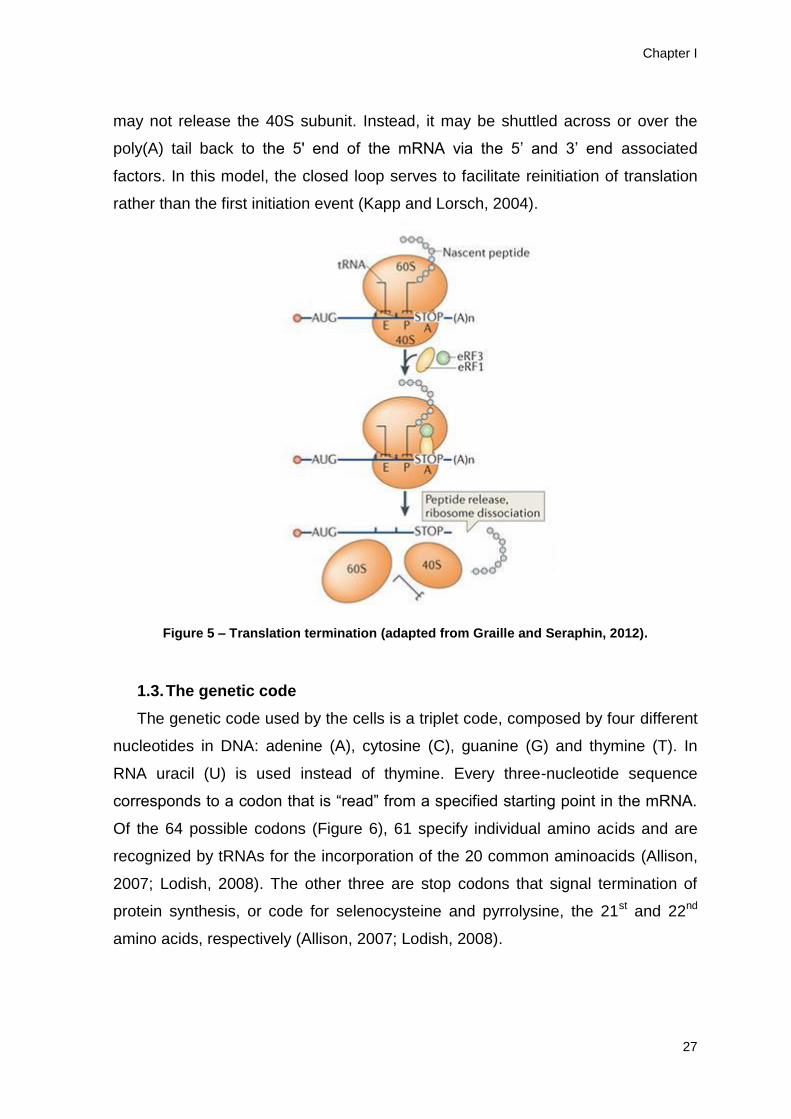
may not release the 40S subunit. Instead, it may be shuttled across or over the
poly(A) tail back to the 5' end of the mRNA via the 5’ and 3’ end associated
factors. In this model, the closed loop serves to facilitate reinitiation of translation
rather than the first initiation event (Kapp and Lorsch, 2004).
Figure 5 – Translation termination (adapted from Graille and Seraphin, 2012).
1.3. The genetic code
The genetic code used by the cells is a triplet code, composed by four different
nucleotides in DNA: adenine (A), cytosine (C), guanine (G) and thymine (T). In
RNA uracil (U) is used instead of thymine. Every three-nucleotide sequence
corresponds to a codon that is “read” from a specified starting point in the mRNA.
Of the 64 possible codons (Figure 6), 61 specify individual amino acids and are
recognized by tRNAs for the incorporation of the 20 common aminoacids (Allison,
2007; Lodish, 2008). The other three are stop codons that signal termination of
protein synthesis, or code for selenocysteine and pyrrolysine, the 21st and 22nd
amino acids, respectively (Allison, 2007; Lodish, 2008).

Introduction
28
Figure 6 – Historical presentation of the genetic code, each “codon box” is composed of four three-letter codes, 64 in all (Agris et al., 2007).
The genetic code is said to be degenerated because most amino acids are
encoded by two to six synonymous codons (Chen et al., 2014). This means that
some tRNAs recognize more than one codon. Francis Crick proposed a
mechanism to explain how tRNAs can read more than one codon - the Wobble
Hypothesis (Crick, 1966). Briefly, this hypothesis states that the third position of
the codon and the first position of the anticodon present a looser connection than
the other pair, which may lead to unusual base combinations (Lehninger et al.,
2005).
However, even though synonymous codons encode the same amino acids, it
has been shown for a wide variety of organisms that different synonymous codons
are used with different frequencies. This unique feature has been termed codon
bias (Hershberg and Petrov, 2008).
Because there is a difference in codon usage, homologous sequences of the
individual members of protein families may be coded in different ways within the
same genome. Likewise, classes of genes within the same genome that are
physiologically regulated to different expression levels may have class-specific
codon preferences (Kurland, 1991). Codon usage preferences are also closely
correlated to abundance of the correspondent tRNA (Gustafsson et al., 2004;
Ikemura, 1985; Novoa et al., 2012; Percudani et al., 1997).

Chapter I
29
1.4. Codon usage bias
The codon usage bias varies significantly between organisms. Thus, the most
frequent or most rare codon in a gene varies both between and within species
depending on the gene (Novoa et al., 2012).
There are two main lines of thought about codon usage bias: the selectionist
and the mutational explanations (Hershberg and Petrov, 2008). According to the
selectionist explanation, codon bias contributes to the efficiency and accuracy of
amino acid sequence and this bias is maintained by selection (Bulmer, 1991). By
contrast, the mutational theory suggests that codon bias exists because of non-
randomness in the mutational patterns, whereby some codons would be more
mutable and, therefore, would have lower equilibrium frequencies (Akashi, 1994).
According to this latter theory, genomic G+C composition is thought to be a major
factor affecting codon usage variation (Chen et al., 2004).
A clear association exists between the expression level of a gene and its codon
composition. This observation holds for organisms ranging from bacteria to
mammals (Novoa and Ribas de Pouplana, 2012). For example, codon usage bias
has been linked to the control of cell cycle development (Chartier et al., 2012) and
stress-mediated specific responses (Frenkel-Morgenstern et al., 2012). Specific
tRNAs and, consequently, certain codon compositions are crucial components in
the activation of some genetic programs (Begley et al., 2007), suggesting a novel
layer of genomic regulation that is only now starting to be explored (Novoa and
Ribas de Pouplana, 2012)
1.5. Transfer RNAs
Transfer RNAs (tRNAs) are a family of non-coding RNAs of approximately 70-
100 nucleotides in length that fold into a “clover leaf” secondary structure and a L-
shaped tertiary structure (Figure 7) (Kim et al., 1973; Torres et al., 2014).
The secondary structure consists of a series of double-stranded and single-
stranded stems stabilized by Watson-Crick base pairing (Sprinzl et al., 1998). The
overall structure is composed of four stems: an aminoacyl stem, D-arm, T-arm and
anticodon arm (Figure 7). In all tRNAs, the 3’ end of the unlooped amino acid
acceptor stem has the sequence CCA, which in most cases is added after

Introduction
30
synthesis and processing of the tRNA are complete (Lodish, 2008). Some of the A,
C, G, and U residues are modified in most tRNAs. Dihydrouridine (D) is nearly
always present in the D loop. Likewise, ribothymidine (T) and pseudouridine () are
almost always present in the T loop. These stems owe their name to the
corresponding conserved modifications found in them (Björk et al., 1999).
Figure 7 – Structure of tRNA: (A) clover leaf structure of tRNA; the numbers show the positions of the nucleotides and (B) L-shaped tRNA structure: transfer RNA forms an L-shaped structure, in which the D- and T-arms interact by tertiary base pairs (Hori, 2014).
These molecules are present in all living organisms and act as adaptors that
link amino acids to codons in messenger RNAs (mRNA) (Novoa et al., 2012).
Therefore, tRNAs are central to the decoding process and interact with most
components of the translation apparatus.
Despite their recognized importance in the decoding process of translation,
tRNAs play important roles in other cellular processes non-related to translation.
An example of these processes is the use of aminoacylated tRNAs as amino
acid donors for N-terminal conjugation of amino acids to proteins, targeting the
recipient proteins for degradation (Mogk et al., 2007; Varshavsky, 1997).
Another one concerns the role of uncharged tRNAs in signal transduction
pathways responding to nutrient deprivation (Dever and Hinnebusch, 2005).

Chapter I
31
tRNAs have also been implicated recently in regulation of apoptosis in mammalian
cells (Mei et al., 2010). These studies showed that tRNAs bind cytochrome c,
thereby preventing the interaction of cytochrome c with the caspase activator
Apaf-1 and preventing its activation. Also, recent reports have emerged
suggesting that tRNA cleavage products inhibit translation. These cleavage
products result from multiple tRNA degradation pathways and mechanisms
(Phizicky and Hopper, 2010).
Conversely, inappropriate regulation of tRNA (tRNAiMet) transcription can
promote cell proliferation and immortalization as well as tumors in mice (Marshall
et al., 2008). These results provide new ways to think about how tRNA cellular
levels influence cell growth and oncogenesis.
Recent studies have also implicated tRNAs as elements of control of their
cognate aaRS expression (Ryckelynck et al., 2005).
tRNA genes are highly transcribed leading to the production in yeast of ∼3
million tRNAs per generation (Waldron and Lacroute, 1975), compared with about
60,000 mRNAs (Ares et al., 1999).
After maturation, tRNAs are charged with their cognate amino acid at the 3’-
end, in a reaction called aminoacylation and catalyzed by aminoacyl-tRNA
synthetases (Attardi, 1967) and, through their anticodon loop nucleobases located
at positions 34, 35 and 36 pair specifically with codons in mRNA (Figure 8).
Figure 8 – Codon-anticodon base pairing (adapted from El Yacoubi et al., 2012).
Therefore, the tRNA decodes the genetic message with the help of the
aminoacyl-tRNA synthetases (Schimmel and Söll, 1979; Swanson et al., 1988)

Introduction
32
Position 34 can wobble and pair with different nucleotides at the third position
of the mRNA codon via non-Watson-Crick interactions (A/U, U/A, G/C, C/G)
(Crick, 1966; Ladner et al., 1975). Wobbling at position 34 of tRNA is important
because it allows some tRNAs to decode different sets of codons coding for the
same amino acid and some codons to be recognized by more than one anticodon
sequence (Agris et al., 2007).
Because tRNAs decipher the genetic material, proper decoding by these
molecules is crucial for cell survival (El Yacoubi et al., 2012). Whereas
polypeptides use a chemical diverse set of building blocks (the 20 proteogenic
aminoacids), tRNA molecules are limited to four ribonucleotides incorporated
during transcription. However, the chemical diversity of tRNAs are greatly
augmented by the addition of posttranscriptional modifications, one of the multiple
steps in tRNA maturation (Johansson and Byström, 2002).
1.6. tRNA modifications
Modified tRNAs are found universally in all living organisms, some conserved
across all the life domains (Björk, 1986). All types of cellular RNAs contain
modified nucleotides, but the largest number and greatest variety are found in
tRNAs (McCloskey and Crain, 1998). The modified nucleotides are derivatives of
the four major nucleotides and these modifications are catalyzed by tRNA
modifying enzymes (Björk and Hagervall, 2014). Some modifications are constant
features of all tRNA molecules, while others are specific to certain tRNAs or
groups of tRNAs (Lewin et al., 2011). Modifications consist of simple chemical
alterations of nucleosides (e.g. methylation of base or ribose, base isomerisation,
reduction, thiolation or deamination) or more complex hypermodifications. The
type of chemical alteration of a nucleoside as well as the pattern of tRNA
modification depends on the origin of the tRNA molecule (Roovers et al., 2004).
The tRNA modifying enzymes vary greatly in specificity. In some cases, a
single enzyme acts to make a specific modification at a unique position, while in
other cases an enzyme may modify bases at several different positions.
Additionally, some enzymes are able to undertake the reaction with individual
tRNAs, while others have a range of substrate molecules. It is probable that this

Chapter I
33
class of enzymes can recognize structural features surrounding the site of
modification (Lewin et al., 2011). Cells apply a great amount of resources to the
modification of tRNA. In fact, considerably more genetic information is allocated to
tRNA modifications than to tRNA genes (Bjork, 1995). Furthermore, it is estimated
that 1% to 10% of the genes in a given genome encode enzymes involved in tRNA
modification (El Yacoubi et al., 2012).
1.6.1. Types of tRNA modifications
Currently, there are over 100 post-translation modifications that have been
identified in tRNAs (Liu and Pan, 2015) Among the vast amount of tRNA
modifications there are deaminations, isomerizations, glycosylations, thiolation,
transglycosylations and methylations (Jackman and Alfonzo, 2013). The core
group of modified nucleotides is generally characterized by relatively simple
chemical structures, such as: the addition of one (or two) methyl groups to various
positions of the nucleotide bases and or ribose sugars (methylation), replacement
of oxygen with sulfur (isomerization) or reduction of the uridine base to
pseudouridine or dihydrouridine (Jackman and Alfonzo, 2013). One of the most
common modification is methylation and they are spread all over the tRNA
molecule (Müller et al., 2015). There are other modifications that are more specific.
Many of these are currently well cataloged at the RNA Modification Database
(http://mods.rna.albany.edu/mods/).
1.6.2. Functions
Chemical posttranscriptional modifications are crucial for tRNA structure,
function and stability. In general, hypomodified tRNAs are targeted for
degradation, so, a primary role of tRNA modifications is to prevent tRNAs from
entering specific degradation pathways (Torres et al., 2014). From a functional
point of view, specific modifications in the anticodon loop are generally used to
tune decoding capacity and to control decoding accuracy, whereas modifications
outside the anticodon loop are generally used to maintain tRNA stability or to
modulate tRNA folding (Liu and Pan, 2015). Nucleotide modifications ensure that
the decoding process is stringent enough to discriminate between closely related

Introduction
34
codons and yet relaxed enough to allow decoding of more than one codon (El
Yacoubi et al., 2012). Some aminoacyl-tRNA synthetases recognize their cognate
tRNA’s identity through the structure and chemistry contributed by modified
nucleotides, particularly within the anticodon domain (Giegé et al., 1998).
Modifications at position 34 contribute to translation fidelity by ensuring codon
discrimination by tRNAs. In fact, all tRNA decoding strategies depend heavily on
modifications at position 34 (Grosjean et al., 2010). Position 37 is also often
modified. As a rule, when position 36 is an A or U, position 37 is modified. These
modifications stabilize the first base pair of the codon-anticodon interaction,
especially A:U and U:A pairs, and thereby contributes to accurate decoding by
reducing frameshifts (Grosjean et al., 1976).
The tRNAs most affected by individual and combinations of modifications
correspond to codons in mixed codon boxes where distinction of the third codon
base is important for discriminating between the correct cognate or wobble codons
and the incorrect near‐cognate codons (e.g. AAA/G for lysine versus AAU/C
asparagine) (Agris, 2004).
In Saccharomyces cerevisiae, a specific tRNA modifying enzyme (tRNA
methyltransferase 9 (Trm9)) was identified as a potential enhancer of the DNA
damage response(Begley et al., 2002, 2004). Therefore, tRNA modifying enzymes
may also be implicated in genome integrity functions.
1.7. tRNA modifying enzymes and Human diseases
Only a limited number of tRNA modifying enzymes have been biochemically
characterized, and most of these are from Escherichia coli and S. cerevisiae
(Garcia and Goodenough-Lashua, 1998). tRNA modifying enzymes are
characterized and usually named after the type of modification that they catalyze.
Previous studies have focused on these modifications as well as the proteins
responsible for such modifications and their encoding genes (Torres et al., 2014).
Recent evidence (Abbott et al., 2014; Torres et al., 2014) indicates that tRNA
modifications and tRNA modifying enzymes may play important roles in complex
human diseases, namely cancer, neurological disorders and mitochondrial-linked
disorders (Figure 9).

Chapter I
35
Figure 9 – Human diseases associated with tRNA modifications (Torres et al., 2014).
Several tRNA methyltransferases are fused to DNA repair enzymes, which
means that these enzymes are directly related to DNA repair and carcinogenesis
(Begley et al., 2007; Fu et al., 2010; Shimada et al., 2009).
Some diseases like intellectual disability are associated with mutations in
genes that encode tRNA modifying enzymes. Others, like cancer, are associated
with aberrant expression of tRNA modifying enzymes (Torres et al., 2014). For
example, FtsJ RNA methyltransferase homolog 1 (FTSJ1) is a gene encoding a
methyltransferase acting at positions 32 and 34 on some tRNAs (Torres et al.,
2014) that is mutated in patients with non-syndromic X-linked mental retardation
(Takano et al., 2008). NSUN2 is a gene encoding a methyltransferase (cytosine-5
tRNA methyltransferase) that is expressed at low levels in normal tissues, but it is
abundant in a range of Human tumor types (Frye and Watt, 2006). Another
example of a pathology linked to mutations in NSUN2 is microcephaly. This
mutation leads to a site-specific loss of m5C modification in tRNAs (Blanco et al.,
2014). The loss of NSUN2 orthologue in Drosophila causes severe short-term
memory deficits (Abbasi-Moheb et al., 2012). The deletion of cytosine-5 tRNA
methyltransferases in yeast, flies, fish and mice is not lethal, nevertheless, loss of
certain tRNA modifications (e.g. Trm9 and Dnmt2) can increase sensitivity to

Introduction
36
stress stimuli, including drugs, DNA damage or environmental cues (Begley et al.,
2007; Jablonowski et al., 2006; Schaefer et al., 2010). Moreover, Trm9 has also
been hypothesized as essential for translation fidelity in yeast, as Trm9 deficient
cells showed an increase in translation infidelity (Patil et al., 2012). Additionally,
other methyltransferases, Trm4 (which is homologue of human NSUN2 (Okamoto
et al., 2014)) and Trm8, are found to be essential for cell viability under heat
stress. tRNAs without modifications by Trm4 and Trm8 are found by the tRNA
surveillance system and follow a rapid tRNA degradation pathway to decay these
non-modified tRNAs, leading to cell death (Alexandrov et al., 2006; Whipple et al.,
2011). Lack of translation fidelity is connected to aberrant protein production,
which is connected to cell death and disease phenotype (Abbott et al., 2014).
As introduced above, the modifications in the anticodon loop are especially
important in translation. This notion is particularly significant given that these tRNA
modifications might affect the translation of only a subset of transcripts enriched in
certain types of codons. Therefore, codon usage may differ in diseases that are
associated with deregulations in these tRNA modifying enzymes.
1.8. DNA microarrays
The DNA microarray technology is a high-capacity system capable of
monitoring the expression of many genes in parallel (Schena et al., 1995).
Generally, this is achieved by arraying a large number of cDNA fluorescent probes
to the surface of a small glass microscope slide, each matching a unique (part of
a) gene in the genome, to which one or more labeled cDNA samples from cells or
tissues of interest are hybridized (van Bakel and Holstege, 2008). By examining
the expression of so many genes simultaneously, it is possible to identify and
study the gene expression patterns that underlie cell physiology. For example, it is
possible to assess which genes are switched on (or off) as cells grow, divide,
differentiate, or respond to hormones or to toxins (Alberts et al., 2008).
Furthermore, this high-throughput technique has been currently adopted in the
evaluation of gene expression in cancer cells (Alberts et al., 2008; Begley et al.,
2013; Chin et al., 2011; Corley, 2004; Rhodes et al., 2004; Venet et al., 2011).

Chapter I
37
The analysis of microarray data is computationally intensive (Corley, a guide to
methods biomedical sciences). Nevertheless, nowadays, the statistical
methodology for microarray analysis has suffered a great progress, from the
development of novel algorithms to the cluster analysis, which allows the
identification of genes that share its expression patterns, i.e., that are coordinately
regulated (Alberts et al., 2008).
1.9. Meta-analysis
Improvements in microarray technology and its increasing use led to the
generation of many highly complex datasets that often try to address similar
biological questions (Ramasamy et al., 2008). Gene expression profiling with
microarrays has become a standard method for identifying the genes and
biological pathways that are associated with various complex diseases (Bauer et
al., 2009; Kim et al., 2014). Thus, it is important to use and make sense of all the
high throughput data publicly available from such studies.
The classical definition of meta-analysis is the use of statistical techniques to
combine results from independent but related studies. However, the classical
definition has evolved and the term meta-analysis is also widely used to describe
the whole study process, from the information gathering to data processing
techniques (Ramasamy et al., 2008).
The meta-analysis is a relatively inexpensive option, since it makes
comprehensive use of already available data that has the potential to increase
both the statistical power and reliability of results.
For all these advantages, the meta-analysis, and particularly the meta-analysis
of gene expression microarray datasets, has become an essential tool for
interpreting the biological data generated by high throughput techniques such as
microarrays (Kim et al., 2007; Lee et al., 2004; Rhodes et al., 2004).
The first step to do a meta-analysis is to formulate the objectives and obtain
the information for our study. In this particular case we need to obtain the gene
expression information and, for that, we must search a variety of public available
microarray data repositories. The information must then be extracted from the
elected repository (or repositories) and the individual datasets prepared in order to
comprise the information. The preparation of individual datasets includes all the
Introduction
38
procedures to reduce the technical defects created by the technique in order to
minimize these defects and assure a quality study. Identification and removal of
any arrays with poor quality, aggregation of any technical replicates and filter out
probes with poor quality in the arrays are normal procedures for dataset quality
control (Ramasamy et al., 2008). It is useful to inspect the datasets for annotations
as annotations like GeneID are important for further analysis and cross data
between computer tools and databases. Once all the information is gathered and
prepared, one can proceed to perform several bioinformatics and statistical
analysis using computer tools in order to get some insight regarding the objectives
formulated at the beginning of the study. To complete the meta-analysis, one must
interpret the results, always considering the strength of evidence and limitations of
the current findings (Ramasamy et al., 2008).
1.10. Dataset rearrangements – Specific studies: Colorectal cancer gene
set and CTU2 case study gene set
Like described before, the first step of a meta-analysis is to formulate the
objectives and obtain the information. Based on these principles we can establish
guidelines and construct an experimental design. Our meta-analysis is based on
microarray gene expression datasets of cancer. From all the diseases connected
to deregulation of tRNA modifying enzymes, cancer stood out as the disease with
more available public datasets on various repositories and it has also dedicated
bioinformatic tools and repositories to cross-link these studies.
However, every study is singular, and although guidelines can be drawn, we
must adapt them to take into account the information that we obtain. In our specific
case, we took that into consideration and created two additional arrays of
datasets. One of those arrays is comprised of colorectal datasets that were
obtained from our search. Colorectal cancer was the most represented type of
cancer on our datasets. Moreover, this type of cancer is the third cause of death
by cancer in the world and it is the second more incident cancer in Portugal with a
high mortality rate (Ferlay et al., 2015).
The other array is comprised of datasets where a specific tRNA modifying
enzyme (CTU2) was found deregulated. The CTU2 is responsible for modifying

Chapter I
39
the wobble base (U34) of lysine (Lys), glutamic acid (Glu) and glutamine (Gln)
(Schlieker et al., 2008). The uridine at the wobble base of these tRNAs is
universally modified by thiolation to 5-methyl-2-thiouridine derivatives which
enhance codon reading accuracy (Björk et al., 2007).
This thiolation of the wobble uridine (S2U) at position 34 in tRNA-Lys UUU,
tRNA-Glu UUC, and tRNA-Gln UUG is conserved in nearly all species (Ikeuchi et
al., 2006). Lysine, glutamic acid and glutamine are encoded by two degenerate
codons ending in purine in the two-codon boxes. The codons on these boxes
specify two aminoacids difference in the third bases in the genetic code. The
corresponding tRNAs decode codons of the type NAA and wobble onto NAG. The
thiolation of the wobble base on position 2, together with the addition of
methoxycarbonylmethyl on position 5 (mcm5S2U), was proposed to facilitate and
restrict base pairing with purines and to prevent incorrect decoding (Ikeuchi et al.,
2006; Krüger et al., 1998; Yarian et al., 2002)
We focused on CTU2 because it affects specific tRNAs in human and we found
many dataset where this enzyme was deregulated. For its specific action on the
wobble position and for its importance on the decoding stringency and therefore
fidelity, it stands as a good case study to analyze the codon usage on the
mentioned datasets.
1.11. Aims of the study
The present study was thought to bridge the current knowledge about the tRNA
modifying enzymes and certain human diseases, namely cancer, that are linked to
gene expression deregulations of those enzymes. We seek a relationship between
the deregulation of tRNA modifying enzymes on cancer and codon usage bias and
patterns of the remaining deregulated genes. For this matter, we assessed a wide
number of datasets of various types of cancer through the adoption of
computational tools and statistical meta-analysis.
This work can lead to new insights on codon usage patterns and preferences in
cancer and shed new light on a time when we need to find effective ways to make
some sense of high throughput data that, otherwise, will never reach their full
potential.


Chapter II
Methodology


Chapter II
43
2. Methodology
2.1. Dataset collection and preprocessing
A list of genes encoding Human tRNA modifying enzymes was elaborated
based on previous studies describing tRNA modifications and their possible
implications in Human diseases (Abbott et al., 2014; Torres et al., 2014).
Once that information was gathered, we searched each gene of that list on
OncomineTM (http://www.oncomine.com), a cancer microarray database that
combines three general data layers: data input, data analysis and data
visualization (Figure 10).
Figure 10 – OncomineTM
layout (adapted from Rhodes et al., 2007).
The OncomineTM uses the stored datasets collected from cancer microarray
studies from published literature and allow us to search datasets for a specific
gene of interest and see if it is deregulated and in which type or subtype of cancer
that deregulation occurs. The analysis can be performed focused on a specific
tissue and comparison type (e.g., breast cancer vs normal) and/or a particular
analysis type (e.g., differential expression). These tools allow us to perform a

Methodology
44
differential analysis of various types and subtypes of cancer and that can be done
for a specific gene or dataset of interest. It is therefore a very useful tool that
facilitates the answer of targeted biological questions of the collective
transcriptome dataset (Rhodes et al., 2007). The OncomineTM platform was used
as a mean to narrow our search. With this method we managed to retain only
datasets where tRNA modifying enzymes were deregulated and a list comprising
those enzymes was created. We carried out a differential analysis, Cancer vs.
Normal Analysis, intending to evaluate the differences in expression between
numerous cancer types and normal tissues.
The lists of datasets as well as deregulated enzymes in cancer resulted from
this search were used in posterior analysis.
2.2. Dataset retrieving
The datasets that contain deregulations on genes encoding tRNA modifying
enzymes were assessed on Gene Expression Omnibus (GEO)
(http://www.ncbi.nlm.nih.gov/geo/) and analyzed using the GEO2R (GEO’s online
tool for analyzing GEO data (available at http://www.nci.nlm.nih.gov/geo/geo2r/).
GEO2R is an interactive online tool for R-based analysis of GEO data and it’s
used to identify genes that are differentially expressed across experimental
conditions. The Benjamini & Hochberg false discovery rate method is used to
apply P-value adjustment for multiple-testing correction. The same analytical tool
was used for each dataset individually to maintain consistency during individual
analysis.
The test samples were selected according to the same selection done by the
OncomineTM and computed into two groups, a group containing normal tissue
samples and another one composed of cancer tissue. This measure was applied
to certify that the generated GEO2R results corresponded exactly to the ones on
OncomineTM. The output processed by GEO2R was then stripped of eventual
background “noise” values, for that, the expression values, whose p-value was
higher than 0.05, were discarded.
After these analyses we merged all gene expression data for all the datasets
and extracted a list of genes corresponding to both up-regulated gene expression

Chapter II
45
data and down-regulated data. These lists were comprised only by genes up-
regulated or down-regulated present on most of the datasets. The criterion used
for the selection of each gene was its presence in at least 90% of the datasets. We
considered any gene whose expression exceeded an M-value of 0.5 to be up-
regulated and, conversely, any gene whose expression was below the value of -
0.5. Moreover, all genes whose statistical significance was above p-value 0.1 were
excluded.
In parallel, we merged all gene expression data for the colorectal datasets in
one array of datasets and we also merged all datasets where CTU2 tRNA
modifying enzyme was found deregulated. For both cases we adopted the same
methodology described above and below.
2.3. GO enrichment analysis
A preliminary gene ontology (GO) enrichment analysis was performed to
evaluate if there were any GO enriched categories on each of those groups. For
this analysis we used the Database for Annotation, Visualization and Integrated
Discovery (DAVID) v6.7 (http://david.abcc.ncifcrf.gov/home.jsp). In this work we
only used the functional annotation tool and we focused on the GO, therefore, all
the other default checked category boxes were unchecked. The function
annotation tool was always used as a view tool for selected annotation.
2.4. Sequence retrieving
The up-regulated and down-regulated gene sequences were downloaded from
Ensembl (http://www.ensembl.org) Biomart tool, using the Ensembl gene release
78. Ensembl is a genomic interpretation system providing the most up-to-date
annotations, querying tools and access methods for chordates and key model
organisms (Cunningham et al., 2015).
The coding sequences were retrieved by submitting the associated gene name
as the external reference ID input list. The filters and attributes were applied in
order to exclude all the associated transcript ID and sequences information.

Methodology
46
2.5. Sequence analysis
All downloaded sequences for every group and type of analysis were loaded
and analyzed on ANACONDA® (version 2.0), which is a software package
developed for gene primary structure analysis (Moura et al., 2005, 2008). It uses
gene sequences downloaded from public databases and applies a set of statistical
and visualization methods in different ways, to reveal information about codon
context, codon usage, nucleotide repeats within open reading frames (ORFeome)
and others.
The ORFeome analysis gives information regarding codon usage; codon
frequency; amino acid properties; among others, for every codon in each gene. A
normalized codon frequency ratio was calculated for each codon of every gene,
and that information was clustered using a hierarchical clustering method (single
linkage) implemented in Cluster 3.0 software
(http://bonsai.hgc.jp/~mdehoon/software/cluster). The cluster results were
visualized by the TreeView program (http://rana.lbl.gov/EisenSoftware.htm).
The codon usage bias was measured by using codon adaptation index (CAI),
and the frequency of the nucleotide G+C at the synonymous third codon position
(GC3).
CAI (Sharp and Li, 1987) is used to estimate the degree of bias toward codons
in highly expressed genes and thus assesses the effective selection which helps in
shaping the codon usage pattern (Naya et al., 2001). The CAI ranges from 0 to 1,
for a gene in which all synonymous codons are used equally, the value would be 0
for no bias while only optimal codons are used, value will be 1 for strongest bias
(Sharp and Li, 1987).
GC3 is a good indicator of the extent of base composition bias (Zhou et al.,
2005). Since base composition bias, namely GC, has a major influence on codon
bias in human (Palidwor et al., 2010), this indicator can be used as a codon usage
index.
2.6. Statistical analysis
The statistical analysis was performed on R (https://www.r-project.org/). R is a
language and environment for statistical computing and graphics that is available

Chapter II
47
as free software and provides a wide variety of statistical and graphical techniques
(R Development Core Team, 2013).
A covariance biplot was performed according to Gabriel (1971). The
covariance biplot is a visualization technique that, as the standard Principal
Component Analysis (PCA), projects complex sets of data in a narrow dimensional
space and facilitates pattern visualization. However, when data are binary, like
those obtained in the analysis of molecular information, standard PCA is not
suitable because the response along the dimensions is linear (Demey et al.,
2008). Thus, the covariance biplot gives a better answer to binary data where
there is a variable dependent group clustering.
The covariance biplot was performed with the information of the ORFeome
analysis. The computed information excluded all the stop codons since they have
no associated tRNA and thus should not exhibit codon usage bias (Heizer et al.,
2006).


Chapter III
Results


Chapter III
51
3. Results
3.1. Data overview
A total of 37 main datasets were used in this study and, since some of those
contained different subtypes of cancer, a new dataset was generated for each
cancer subtype, leading to an expansion of the original number to 70 datasets.
Our data is comprised of 17 different types of cancer, namely, bladder, brain,
cervical, colorectal, esophageal, gastric, head and neck, kidney, leukemia, liver,
lung, lymphoma, melanoma, myeloma, ovarian, sarcoma and other types of
cancer that have been included on a category by the same designation (Table 1).
The colorectal cancer is the more representative cancer amongst our datasets
(Table 1).
Table 1 – Cancer types and number of datasets used in the study.
From these 70 datasets, a total of 36 different tRNA modifying enzymes were
found deregulated, scattered by all the 17 different types of cancer. In general,
cervical and colorectal cancer datasets presented the highest number of
deregulated tRNA modifying enzymes. On the other hand, sarcoma and
Cancer Types Number of Datasets
Bladder cancer 2
Brain and CNS cancer 5
Cervical cancer 4
Colorectal cancer 16
Esophageal cancer 2
Gastric cancer 5
Head and neck 2
Kidney 6
Leukemia 3
Liver cancer 3
Lung cancer 4
Lymphoma 2
Melanoma 2
Myeloma 4
Other cancer 3
Ovarian cancer 1
Sarcoma 6
Total 70

Results
52
esophageal cancer datasets showed the opposite pattern concerning deregulated
tRNA modifying enzymes (Figure 11). Additional information concerning each
dataset and its corresponding GEO accession code is provided on the
supplementary material (Suppl. Table I).
Figure 11 – Number of deregulated tRNA modifying enzymes in each cancer type dataset. Each bar corresponds to a cancer type and the cancer type with the highest number of deregulated enzymes is colorectal cancer. Conversely, the cancer type with the lowest
number of deregulated enzymes is esophageal cancer. Apart from colorectal cancer, the cancer types with more deregulated enzymes are cervical cancer and myeloma.
3.2. GO enrichment analysis
The data collected pointed to different GO enriched categories between up-
regulated and down-regulated genes. These results were observed both among
the datasets corresponding to all different types of cancer, datasets corresponding
only to colorectal cancer and datasets where CTU2 was found deregulated. In the
up-regulated genes (Tables 2, 4 and 6) the most enriched GO groups are related
to cell proliferation (e.g. cell cycle processes, mitosis, cell division) and the most
enriched GO groups on down-regulated genes are related to cell differentiation
functions (e.g. cell homeostasis and ion homeostasis) (Tables 3, 5 and 7).
0
10
20
30
40

Chapter III
53
Table 2 – GO enrichment analysis of up-regulated genes from all cancer datasets. The most enriched GO groups are related to cell proliferation functions (e.g. cell cycle, mitosis and
cell division).
Table 3 – GO enrichment analysis of down-regulated genes from all cancer datasets. The most enriched GO groups on down-regulated genes are related to cell differentiation
functions (e.g. chemical homeostasis and ion homeostasis).
Cluster A Enrichment Score: 52.8
Term Count % PValue List Total Fold Enrichment FDR
GO:0007049~cell cycle 81 48.21 5.88E-59 153 9.23 9.38E-56
GO:0000279~M phase 61 36.31 1.04E-57 153 16.39 1.66E-54
GO:0022403~cell cycle phase 65 38.69 4.55E-57 153 13.88 7.25E-54
GO:0000278~mitotic cell cycle 61 36.31 1.76E-54 153 14.58 2.80E-51
GO:0022402~cell cycle process 69 41.07 1.95E-53 153 10.80 3.11E-50
GO:0007067~mitosis 51 30.36 1.16E-52 153 20.50 1.84E-49
GO:0000280~nuclear division 51 30.36 1.16E-52 153 20.50 1.84E-49
GO:0000087~M phase of mitotic cell cycle 51 30.36 3.10E-52 153 20.13 4.95E-49
GO:0048285~organelle fission 51 30.36 1.04E-51 153 19.69 1.65E-48
GO:0051301~cell division 50 29.76 2.02E-44 153 14.99 3.22E-41
Cluster B Enrichment Score: 26.4
Term Count % PValue List Total Fold Enrichment FDR
GO:0006260~DNA replication 35 20.83 1.11E-31 153 16.29 1.78E-28
GO:0006259~DNA metabolic process 47 27.98 1.53E-29 153 8.21 2.44E-26
GO:0005654~nucleoplasm 47 27.98 3.40E-20 140 4.87 4.29E-17
Cluster A Enrichment Score: 5.4
Term Count % PValue List Total Fold Enrichment FDR
GO:0005576~extracellular region 46 26.14 1.43E-06 143 2.05 1.82E-03
GO:0044421~extracellular region part 29 16.48 1.93E-06 143 2.70 2.45E-03
GO:0005615~extracellular space 22 12.50 2.14E-05 143 2.87 2.72E-02
Cluster B Enrichment Score: 3.1
Term Count % PValue List Total Fold Enrichment FDR
GO:0048878~chemical homeostasis 19 10.80 8.27E-06 145 3.46 1.37E-02
GO:0030003~cellular cation homeostasis 13 7.39 1.71E-05 145 4.78 2.84E-02
GO:0006873~cellular ion homeostasis 15 8.52 4.53E-05 145 3.74 7.53E-02
GO:0006875~cellular metal ion homeostasis 11 6.25 4.63E-05 145 5.24 7.68E-02
GO:0055082~cellular chemical homeostasis 15 8.52 5.38E-05 145 3.68 8.94E-02
GO:0055080~cation homeostasis 13 7.39 5.48E-05 145 4.24 9.10E-02
GO:0055065~metal ion homeostasis 11 6.25 6.75E-05 145 5.01 1.12E-01
GO:0050801~ion homeostasis 15 8.52 1.18E-04 145 3.42 1.96E-01
GO:0030005~cellular di-, tri-valent inorganic cation homeostasis 11 6.25 1.57E-04 145 4.52 2.60E-01
GO:0055066~di-, tri-valent inorganic cation homeostasis 11 6.25 2.38E-04 145 4.29 3.95E-01
GO:0042592~homeostatic process 20 11.36 3.83E-04 145 2.48 6.34E-01
GO:0019725~cellular homeostasis 15 8.52 4.49E-04 145 3.00 7.43E-01
GO:0006874~cellular calcium ion homeostasis 9 5.11 7.58E-04 145 4.59 1.25E+00
GO:0055074~calcium ion homeostasis 9 5.11 9.03E-04 145 4.47 1.49E+00
GO:0051480~cytosolic calcium ion homeostasis 5 2.84 3.72E-02 145 3.95 4.68E+01
GO:0008015~blood circulation 6 3.41 4.87E-02 145 3.01 5.63E+01
GO:0003013~circulatory system process 6 3.41 4.87E-02 145 3.01 5.63E+01
GO:0008016~regulation of heart contraction 4 2.27 4.89E-02 145 4.85 5.65E+01
GO:0051241~negative regulation of multicellular organismal process 4 2.27 2.54E-01 145 2.28 9.92E+01
GO:0007186~G-protein coupled receptor protein signaling pathway 11 6.25 7.66E-01 145 0.91 1.00E+02

Results
54
Table 4 – GO enrichment analysis of up-regulated genes from colorectal cancer datasets. The most enriched GO groups are related to cell proliferation functions (e.g. cell cycle
phase, mitosis and nuclear division).
Table 5 – GO enrichment analysis of down-regulated genes from colorectal cancer datasets. The most enriched GO groups on down-regulated genes are related to cell differentiation
functions (e.g. positive regulation of signal transduction and ion homeostasis).
Cluster A Enrichment Score: 18.8
Term Count % PValue List Total Fold Enrichment FDR
GO:0031981~nuclear lumen 162 18.60 9.15E-26 619 2.31 1.30E-22
GO:0043233~organelle lumen 185 21.24 8.29E-25 619 2.10 1.18E-21
GO:0070013~intracellular organelle lumen 182 20.90 1.11E-24 619 2.11 1.59E-21
GO:0031974~membrane-enclosed lumen 187 21.47 1.19E-24 619 2.08 1.70E-21
GO:0005730~nucleolus 85 9.76 3.69E-15 619 2.51 5.22E-12
GO:0043228~non-membrane-bounded organelle 204 23.42 4.45E-14 619 1.62 6.35E-11
GO:0043232~intracellular non-membrane-bounded organelle 204 23.42 4.45E-14 619 1.62 6.35E-11
GO:0005654~nucleoplasm 94 10.79 3.66E-13 619 2.20 5.22E-10
Cluster B Enrichment Score: 15.7
Term Count % PValue List Total Fold Enrichment FDR
GO:0022403~cell cycle phase 71 8.15 4.10E-20 671 3.46 7.30E-17
GO:0000279~M phase 62 7.12 1.11E-19 671 3.80 1.96E-16
GO:0022402~cell cycle process 83 9.53 3.87E-19 671 2.96 6.88E-16
GO:0007049~cell cycle 96 11.02 5.53E-17 671 2.49 9.84E-14
GO:0000278~mitotic cell cycle 61 7.00 1.67E-16 671 3.32 4.00E-13
GO:0000280~nuclear division 44 5.05 5.66E-15 671 4.03 1.01E-11
GO:0007067~mitosis 44 5.05 5.66E-15 671 4.03 1.01E-11
GO:0000087~M phase of mitotic cell cycle 44 5.05 1.11E-14 671 3.96 1.97E-11
GO:0048285~organelle fission 44 5.05 2.51E-14 671 3.87 4.46E-11
GO:0051301~cell division 49 5.63 2.23E-13 671 3.35 3.96E-10
Cluster A Enrichment Score: 4.0
Term Count % PValue List Total Fold Enrichment FDR
GO:0010627~regulation of protein kinase cascade 30 3.70 1.16E-06 586 2.78 2.07E-03
GO:0009967~positive regulation of signal transduction 31 3.82 1.23E-05 586 2.43 2.18E-02
GO:0010647~positive regulation of cell communication 31 3.82 9.54E-05 586 2.18 1.70E-01
GO:0010740~positive regulation of protein kinase cascade 20 2.47 1.11E-04 586 2.76 1.97E-01
GO:0043122~regulation of I-kappaB kinase/NF-kappaB cascade 13 1.60 2.23E-03 586 2.80 3.90E+00
GO:0043123~positive regulation of I-kappaB kinase/NF-kappaB cascade 12 1.48 3.07E-03 586 2.86 5.34E+00
Cluster B Enrichment Score: 3.1
Term Count % PValue List Total Fold Enrichment FDR
GO:0050801~ion homeostasis 39 4.81 7.46E-06 586 2.20 1.33E-02
GO:0055082~cellular chemical homeostasis 36 4.44 2.06E-05 586 2.19 3.66E-02
GO:0006873~cellular ion homeostasis 35 4.32 3.52E-05 586 2.16 6.27E-02
GO:0055080~cation homeostasis 29 3.58 4.70E-05 586 2.34 8.36E-02
GO:0048878~chemical homeostasis 43 5.30 5.10E-05 586 1.94 9.07E-02
GO:0019725~cellular homeostasis 40 4.93 6.10E-05 586 1.98 1.09E-01
GO:0042592~homeostatic process 55 6.78 1.56E-04 586 1.69 2.77E-01
GO:0030003~cellular cation homeostasis 25 3.08 2.76E-04 586 2.27 4.91E-01
GO:0006875~cellular metal ion homeostasis 19 2.34 2.13E-03 586 2.24 3.72E+00
GO:0055065~metal ion homeostasis 19 2.34 3.46E-03 586 2.14 5.99E+00
GO:0055066~di-, tri-valent inorganic cation homeostasis 21 2.59 3.69E-03 586 2.03 6.37E+00
GO:0030005~cellular di-, tri-valent inorganic cation homeostasis 20 2.47 4.57E-03 586 2.03 7.84E+00
GO:0006874~cellular calcium ion homeostasis 15 1.85 2.77E-02 586 1.89 3.94E+01
GO:0055074~calcium ion homeostasis 15 1.85 3.38E-02 586 1.84 4.58E+01
GO:0007204~elevation of cytosolic calcium ion concentration 10 1.23 4.87E-02 586 2.10 5.89E+01
GO:0051480~cytosolic calcium ion homeostasis 10 1.23 6.97E-02 586 1.96 7.24E+01

Chapter III
55
Table 6 – GO enrichment analysis of up-regulated genes from cancer datasets where CTU2 was found deregulated. The most enriched GO groups are related to cell proliferation
functions (e.g. cell cycle phase, mitosis and cell division).
Table 7 – GO enrichment analysis of down-regulated genes from cancer datasets where CTU2 was found deregulated. The most enriched GO groups on down-regulated genes are
related to cell differentiation functions (e.g. chemical homeostasis and homeostatic process).
Cluster A Enrichment Score: 16.3
Term Count % PValue List Total Fold Enrichment FDR
GO:0022403~cell cycle phase 56 9.79 3.80E-19 447 4.09 6.60E-16
GO:0007049~cell cycle 78 13.64 8.89E-19 447 3.04 1.54E-15
GO:0000278~mitotic cell cycle 51 8.92 8.51E-18 447 4.17 1.48E-14
GO:0022402~cell cycle process 63 11.01 2.68E-17 447 3.37 4.65E-14
GO:0000279~M phase 47 8.22 4.98E-17 447 4.32 8.64E-14
GO:0007067~mitosis 38 6.64 1.58E-16 447 5.23 1.89E-13
GO:0000280~nuclear division 38 6.64 1.58E-16 447 5.23 1.89E-13
GO:0000087~M phase of mitotic cell cycle 38 6.64 2.88E-16 447 5.13 5.77E-13
GO:0048285~organelle fission 38 6.64 7.10E-16 447 5.02 1.15E-12
GO:0051301~cell division 42 7.34 4.09E-15 447 4.31 7.14E-12
Cluster B Enrichment Score: 15.4
Term Count % PValue List Total Fold Enrichment FDR
GO:0031981~nuclear lumen 118 20.63 3.35E-22 413 2.52 4.70E-19
GO:0070013~intracellular organelle lumen 128 22.38 1.36E-19 413 2.23 1.90E-16
GO:0043233~organelle lumen 129 22.55 3.27E-19 413 2.19 4.59E-16
GO:0031974~membrane-enclosed lumen 130 22.73 6.10E-19 413 2.17 8.56E-16
GO:0043232~intracellular non-membrane-bounded organelle 147 25.70 3.00E-13 413 1.75 4.21E-10
GO:0043228~non-membrane-bounded organelle 147 25.70 3.00E-13 413 1.75 4.21E-10
GO:0005730~nucleolus 61 10.66 2.25E-12 413 2.70 3.16E-09
GO:0005654~nucleoplasm 66 11.54 2.14E-10 413 2.32 3.00E-07
Cluster A Enrichment Score: 5.7
Term Count % PValue List Total Fold Enrichment FDR
GO:0050801~ion homeostasis 70 4.45 8.97E-09 1125 2.06 1.64E-05
GO:0048878~chemical homeostasis 82 5.22 9.53E-09 1125 1.93 1.74E-05
GO:0055082~cellular chemical homeostasis 66 4.20 1.41E-08 1125 2.09 2.57E-05
GO:0006873~cellular ion homeostasis 65 4.13 1.79E-08 1125 2.09 3.26E-05
GO:0055080~cation homeostasis 53 3.37 5.33E-08 1125 2.23 9.73E-05
GO:0030003~cellular cation homeostasis 48 3.05 1.35E-07 1125 2.27 2.46E-04
GO:0006875~cellular metal ion homeostasis 38 2.42 1.75E-06 1125 2.33 3.19E-03
GO:0055065~metal ion homeostasis 39 2.48 2.02E-06 1125 2.29 3.69E-03
GO:0019725~cellular homeostasis 69 4.39 3.03E-06 1125 1.78 5.54E-03
GO:0030005~cellular di-, tri-valent inorganic cation homeostasis 41 2.61 4.07E-06 1125 2.17 7.44E-03
GO:0055066~di-, tri-valent inorganic cation homeostasis 42 2.67 6.17E-06 1125 2.11 1.13E-02
GO:0042592~homeostatic process 98 6.23 6.57E-06 1125 1.57 1.20E-02
GO:0006874~cellular calcium ion homeostasis 33 2.10 4.27E-05 1125 2.17 7.79E-02
GO:0055074~calcium ion homeostasis 33 2.10 7.31E-05 1125 2.11 1.33E-01
GO:0051480~cytosolic calcium ion homeostasis 20 1.27 3.84E-03 1125 2.04 6.79E+00
GO:0007204~elevation of cytosolic calcium ion concentration 18 1.15 9.12E-03 1125 1.97 1.54E+01
Cluster B Enrichment Score: 4.3
Term Count % PValue List Total Fold Enrichment FDR
GO:0006811~ion transport 109 6.93 2.56E-08 1125 1.71 4.68E-05
GO:0006812~cation transport 79 5.03 2.16E-06 1125 1.72 3.95E-03
GO:0030001~metal ion transport 66 4.20 2.06E-05 1125 1.71 3.76E-02
GO:0006814~sodium ion transport 27 1.72 2.07E-05 1125 2.50 3.78E-02
GO:0031402~sodium ion binding 24 1.53 1.38E-04 1119 2.38 2.22E-01
GO:0015672~monovalent inorganic cation transport 46 2.93 2.85E-04 1125 1.74 5.19E-01
GO:0031420~alkali metal ion binding 34 2.16 2.14E-03 1119 1.73 3.39E+00
GO:0055085~transmembrane transport 61 3.88 3.27E-02 1125 1.29 4.55E+01

Results
56
3.3. Codon usage analysis
3.3.1. Codon usage of all cancer datasets
Following the Anaconda analysis, the heat maps corresponding to the codon
usage pattern of the up-regulated and down-regulated genes were obtained by
Cluster 3.0 and are depicted in Figures 12 and 14.
The codons are clustered according to their frequency of incorporation; higher
incorporated codons are represented by different intensity of red colors, the higher
the frequency, the higher the color intensity. Conversely, the lower incorporated
codons are represented by different intensity of green colors, the lower the
frequency, the higher the color intensity. The black spots correspond to values of
codon frequency considered null. The pattern formed by those colors represents
the codon usage preference of each gene from these datasets. The sets of genes
cluster into groups that form the distinct patterns that can be observed on the
following Figures (12 and 14). In Figure 12, corresponding to up-regulated genes
in all cancer datasets, we can observe a distribution of codons (columns)
characterized by codons ending in A and U nucleotides on the left side of the
panel and, conversely, by codons ending in G and C nucleotides on the right side
of the panel. A deeper look in this figure shows a higher number of genes that
incorporate more codons ending in A and U (left side – red) than codons ending in
G and C (right side-green) and a lower number of genes that incorporate more
codons ending in G and C (right side – red) than codons ending in A and U (left
side-green).

Chapter III
57
Figure 12 – Heat map of codon frequencies of up-regulated genes from all cancer datasets. The green code corresponds to low frequency codons and the red code corresponds to
high frequency codons. The rank order correlation was used to determine clusters among codons (columns) and genes (rows). Codons ending in A and U nucleotides are clustered
on the left side of the panel and codons ending in G and C nucleotides are clustered on the right side. There is a higher number of genes that incorporate more codons ending in A and
U than codons ending in G and C.

Results
58
Considering the GC3 indicator for the same set of genes, the resulted
histogram reveals a GC percentage at the third position lower than 50%, resulting
in a prevalence of AU ending codons (Figure 13).
Figure 13 – Percentage of GC in third position of up-regulated genes in all cancer datasets. There is a prevalence of codons with AU nucleotides at the third position in these genes.
In Figure 14 (down-regulated genes in all cancer datasets), a distribution of
codons (columns) is observed, characterized by codons ending in A and U
nucleotides, generally on the left side of the panel and, conversely, by codons
ending in G and C nucleotides, generally on the right side of the panel.
Additionally, sporadic strips of different patterns are distributed along the panel,
corresponding to clusters of codons that, even though belonging to groups of
codons segregated on the sides, have been clustered in a different way, leading to
a scattered disposition on the heat map. Nevertheless, this scattered position
follow the same color pattern, showing the same tendency as the codons
segregated by each side of the panel. A deeper look in this figure shows a lower
number of genes that incorporate more codons ending in A and U (left side – red)
than codons ending in G and C (right side-green) and a higher number of genes
that incorporate more codons ending in G and C (right side – red) than codons
ending in A and U (left side-green).

Chapter III
59
Figure 14 – Heat map of codon frequencies of down-regulated genes from all cancer
datasets. The green code corresponds to low frequency codons and the red code corresponds to high frequency codons. The rank order correlation was used to determine
clusters among codons (columns) and genes (rows). Codons ending in A and U nucleotides are, generally, clustered on the left side of the panel and codons ending in G and C
nucleotides are clustered on the right side. The codons ending in A and U nucleotides are the higher frequency codons. There is a higher number of genes that incorporate more
codons ending in A and U than codons ending in G and C

Results
60
Considering the GC3 indicator for the same set of genes, the resulted
histogram reveals a GC percentage at the third position higher than 50%, resulting
in a prevalence of GC ending codons (Figure 15).
Figure 15 – Percentage of GC in third position of down-regulated genes in all cancer datasets. There is a preference for GC ending codons on the third codon position in these
genes.
Figure 16 – CAI of up-regulated genes in all cancer datasets. The majority of up-regulated
genes have a CAI between 0.6 and 0.7.

Chapter III
61
In what regards the CAI analysis, the up-regulated genes revealed a lower
value of CAI (majority of genes with a CAI between 0.6 and 0.7) (Figure 16) when
compared with the down-regulated genes (majority of genes with a CAI between
0.65 and 0.8) (Figure 17).
Figure 17 – CAI of down-regulated genes in all cancer datasets. The majority of down-regulated genes have a CAI between 0.65 and 0.8.
3.3.2. Codon usage of colorectal cancer datasets
The codon usage analysis of the colorectal cancer datasets demonstrated
similar tendencies of codon usage patterns (Figures 18 and 20) and CAI (Figures
19 and 21), when compared to the same analysis on all cancer datasets.
However, as up-regulated genes shows a higher number of genes that incorporate
more codons ending in A and U (Figure 18), there is no clear preference by down-
regulated colorectal genes in what regards the majority of gene preference on last
codon position (Figure 20).

Results
62
Figure 18 – Heat map of codon frequencies of up-regulated genes from colorectal cancer
datasets. The green code corresponds to low frequency codons and the red code corresponds to high frequency codons. The rank order correlation was used to determine
clusters among codons (columns) and genes (rows). Codons ending in A and U nucleotides are clustered on the left side of the panel and codons ending in G and C nucleotides are
clustered on the right side. There is a higher number of genes that incorporate more codons ending in A and U than codons ending in G and C.

Chapter III
63
Figure 19 – CAI of up-regulated genes in colorectal cancer datasets. The majority of down-regulated genes have a CAI between 0.6 and 0.8. The vast majority have a CAI between 0.65
and 0.75.

Results
64
Figure 20 – Heat map of codon frequencies of down-regulated genes from colorectal cancer datasets. The green code corresponds to low frequency codons and the red code
corresponds to high frequency codons. The rank order correlation was used to determine clusters among codons (columns) and genes (rows). Codons ending in A and U nucleotides
are clustered on the left side of the panel and codons ending in G and C nucleotides are clustered on the right side. There is no clear preference in what regards the majority of gene
preference on last codon position.

Chapter III
65
Figure 21 – CAI of down-regulated genes in colorectal cancer datasets. The majority of
down-regulated genes have a CAI between 0.6 and 0.8. The vast majority have CAIs between 0.65 and 0.75.
However, the GC percentage on the third position on both up-regulated and
down-regulated genes is higher than 50% (Figures 22 and 23). Nevertheless, the
tendency to a higher percentage of GC on the third position in the case of down-
regulated genes when compared to up-regulated genes remained noticeable
(Figures 22 and 23).
Figure 22 – Percentage of GC in third position of up-regulated genes in colorectal cancer datasets. There is a preference for codons ending with GC nucleotides at the last codon
position. However, the percentage of GC at the third position is lower when compared with colorectal cancer down-regulated genes.
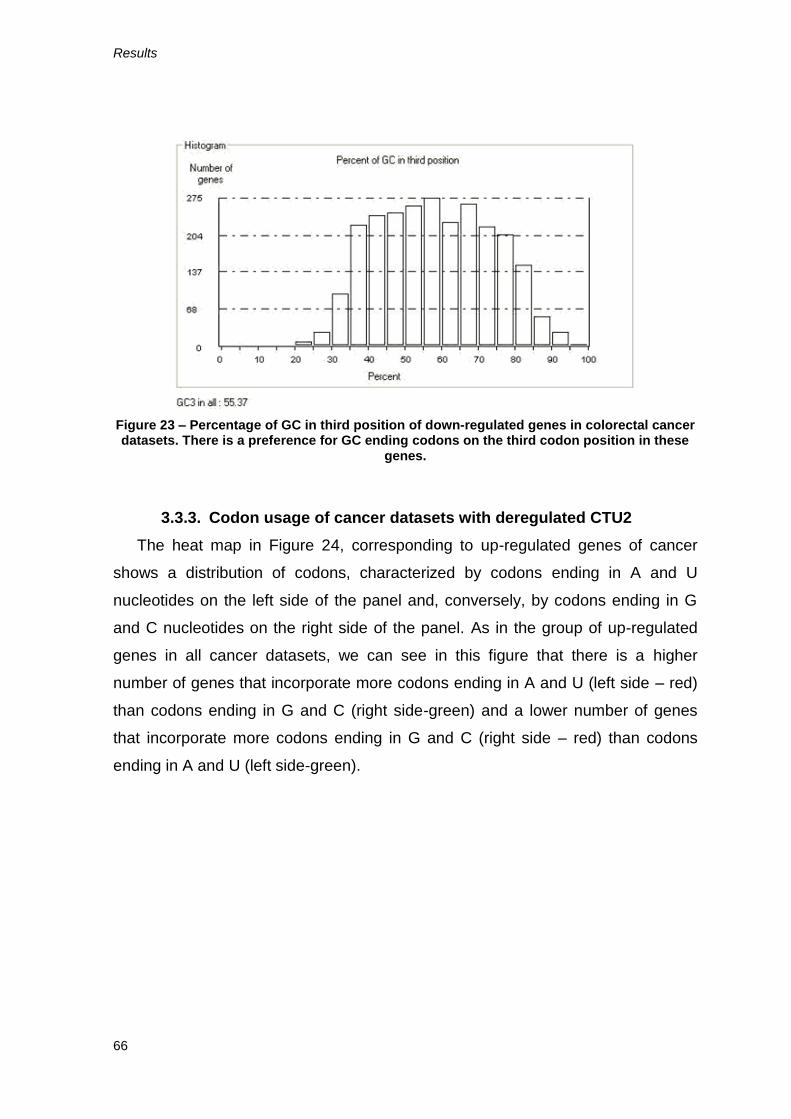
Results
66
Figure 23 – Percentage of GC in third position of down-regulated genes in colorectal cancer datasets. There is a preference for GC ending codons on the third codon position in these
genes.
3.3.3. Codon usage of cancer datasets with deregulated CTU2
The heat map in Figure 24, corresponding to up-regulated genes of cancer
shows a distribution of codons, characterized by codons ending in A and U
nucleotides on the left side of the panel and, conversely, by codons ending in G
and C nucleotides on the right side of the panel. As in the group of up-regulated
genes in all cancer datasets, we can see in this figure that there is a higher
number of genes that incorporate more codons ending in A and U (left side – red)
than codons ending in G and C (right side-green) and a lower number of genes
that incorporate more codons ending in G and C (right side – red) than codons
ending in A and U (left side-green).

Chapter III
67
Figure 24 – Heat map of codon frequencies of up-regulated genes in cancer datasets where CTU2 tRNA modifying enzyme was found deregulated. The green code corresponds to low frequency codons and the red code corresponds to high frequency codons. The rank order
correlation was used to determine clusters among codons (columns) and genes (rows). Codons ending in A and U nucleotides are clustered on the left side of the panel and
codons ending in G and C nucleotides are clustered on the right side. There is a higher number of genes that incorporate more codons ending in A and U than codons ending in G
and C.

Results
68
Figure 25 – Percentage of GC in third position of up-regulated genes in cancer datasets where CTU2 tRNA modifying enzyme was found deregulated. There is a preference for AU
ending codons on the third codon position in these genes.
Figure 26 – CAI of up-regulated genes in cancer datasets where CTU2 tRNA modifying enzyme was found deregulated. The majority of up-regulated genes have a CAI between 0.6
and 0.75. The vast majority have CAIs between 0.6 and 0.7.

Chapter III
69
Figure 27 – Heat map of codon frequencies of down-regulated genes in cancer datasets where CTU2 tRNA modifying enzyme was found deregulated. The green code corresponds
to low frequency codons and the red code corresponds to high frequency codons. The rank order correlation was used to determine clusters among codons (columns) and genes
(rows). Codons ending in A and U nucleotides are clustered on the left side of the panel and codons ending in G and C nucleotides are clustered on the right side. There is a higher
number of genes that incorporate more codons ending in G and C than codons ending in A and U.

Results
70
Figure 28 – Percentage of GC in third position of down-regulated genes in cancer datasets where CTU2 tRNA modifying enzyme was found deregulated. There is a preference for GC
ending codons on the third codon position in these genes.
Figure 29 – CAI of down-regulated genes in cancer datasets where CTU2 tRNA modifying enzyme was found deregulated. The majority of down-regulated genes have a CAI between
0.6 and 0.8. The vast majority have CAIs between 0.65 and 0.75.
3.4. Covariance biplot analysis
3.4.1. Covariance biplot of all cancer datasets
The covariance biplot corresponding to the deregulated genes of all cancer
datasets revealed the existence of two groups, one composed by up-regulated
genes (red-left side) and another group composed by down-regulated genes
(green-right side) (Figure 30). Furthermore, the codons (variables) ending in A and

Chapter III
71
U nucleotides, which are represented by arrows, stretch in the direction of the up-
regulated group of genes. Conversely, the codons ending in G and C nucleotides
stretch in the direction of the up-regulated group of genes.
Figure 30 – Covariance biplot of deregulated genes in cancer datasets. Red dots represent up-regulated genes and green dots represent down-regulated genes. Each vector
corresponds to a different codon and are represented in gray. The majority of up-regulated genes show a preference for codons ending in A and U nucleotides and the majority of
down-regulated genes show a preference for codons ending in G and C nucleotides.
We can depict in the Figure 31, a representation of the previous biplot (Figure
31(A)), as well as two frequency histograms that show the distribution of up-
regulated genes (Figure 31(B)) and down-regulated genes (Figure 31(C)).
-20 -10 0 10 20 30
-20
-10
01
02
03
0
Covariance Biplot Merged All Cancers
Dim 1 ( 20.4 % )
Dim
2 (
6.2
%
)
AAA AAC
AAG
AAU
ACA
ACC
ACG
ACU
AGA
AGC
AGG
AGU
AUA
AUC
AUG
AUU
CAA
CAC
CAG
CAU
CCA
CCCCCG
CCU
CGACGC
CGG
CGU
CUA
CUC
CUG
CUU
GAA
GAC
GAG
GAU
GCA
GCC
GCG
GCU
GGA
GGCGGG
GGU
GUA
GUC
GUG
GUU
UACUAU
UCA
UCC
UCG
UCU
UGCUGG
UGU
UUAUUC
UUGUUU
Up Enriched
Down Enriched

Results
72
Figure 31 – (A) Covariance biplot of deregulated genes in cancer datasets. Red dots represent up-regulated genes and green dots represent down-regulated genes. Each vector corresponds to a different codon and is represented in gray. Distribution of up-regulated (B) and down-regulated (C) genes on the first dimension of the covariance biplot; the black bars divide the histograms in positive (right side) and negative (left side) sides, according to the
relative position on the biplot. The majority of up-regulated genes show a preference for codons ending in A and U nucleotides and the majority of down-regulated genes show a
preference for codons ending in G and C nucleotides.
The histograms (Figure 31(B) and (C)) help identifying the two distinct groups
of genes formed by up-regulated and down-regulated genes. Histogram B (Figure
31(B)) shows that 77.5% of up-regulated genes are grouped on the left side of the
biplot according to the 1st dimension of the covariance. Conversely, histogram C
(Figure 31(C)) shows that 67.5% of the down-regulated genes are grouped on the
right side of the biplot.
-20 -10 0 10 20 30
-20
-10
010
20
30
Covariance Biplot Merged All Cancers
Dim 1 ( 20.4 % )
Dim
2
( 6.2
%
)
AAA AAC
AAG
AAU
ACA
ACC
ACG
ACU
AGA
AGC
AGGAGU
AUA
AUCAUG
AUU
CAA
CAC
CAGCAU
CCA
CCCCCG
CCU
CGA CGCCGG
CGUCUA
CUCCUG
CUU
GAA
GAC
GAG
GAU
GCA
GCC
GCG
GCU
GGA
GGCGGG
GGU
GUA
GUC
GUG
GUU
UACUAU
UCAUCC
UCG
UCU
UGCUGGUGUUUA UUC
UUGUUU
UP Enriched
Dim 1 (Positive= 32.5 %)
Fre
quency
-5 0 5 10
020
40
60
80
Down Enriched
Dim 1 (Positive= 67.5 %)
Fre
quency
-5 0 5 10
010
20
30
40
50
A B
C

Chapter III
73
3.4.2. Covariance biplot of colorectal cancer datasets
The covariance biplot corresponding to the deregulated gene of colorectal
cancer datasets also revealed the existence of two groups: one composed by up-
regulated genes (red-left side) and another group composed by down-regulated
genes (green-right side).
Figure 32 – Covariance biplot of deregulated genes in colorectal cancer datasets. Red dots represent up-regulated genes and green dots represent down-regulated genes. Each vector corresponds to a different codon and are represented in gray. The majority of up-regulated genes show a preference for codons ending in A and U nucleotides and, in down-regulated
genes, there is a preference for codons ending in G and C nucleotides.
-30 -20 -10 0 10 20 30 40
-30
-20
-10
01
02
03
04
0
Covariance Biplot Merged All Colon Cancer
Dim 1 ( 21 % )
Dim
2 (
4.4
%
)
AAA
AAC
AAG
AAUACA
ACCACG
ACU
AGA AGCAGG
AGU
AUA
AUC
AUG
AUU
CAA
CACCAG
CAU
CCA
CCC
CCGCCU
CGACGCCGG
CGU
CUA CUCCUG
CUUGAA
GAC
GAGGAU
GCA
GCC
GCGGCU
GGA
GGC
GGG
GGU
GUA
GUC
GUG
GUU
UAC
UAU
UCA
UCC
UCG
UCU
UGC
UGGUGU
UUA
UUC
UUG
UUU
Up Enriched
Down Enriched
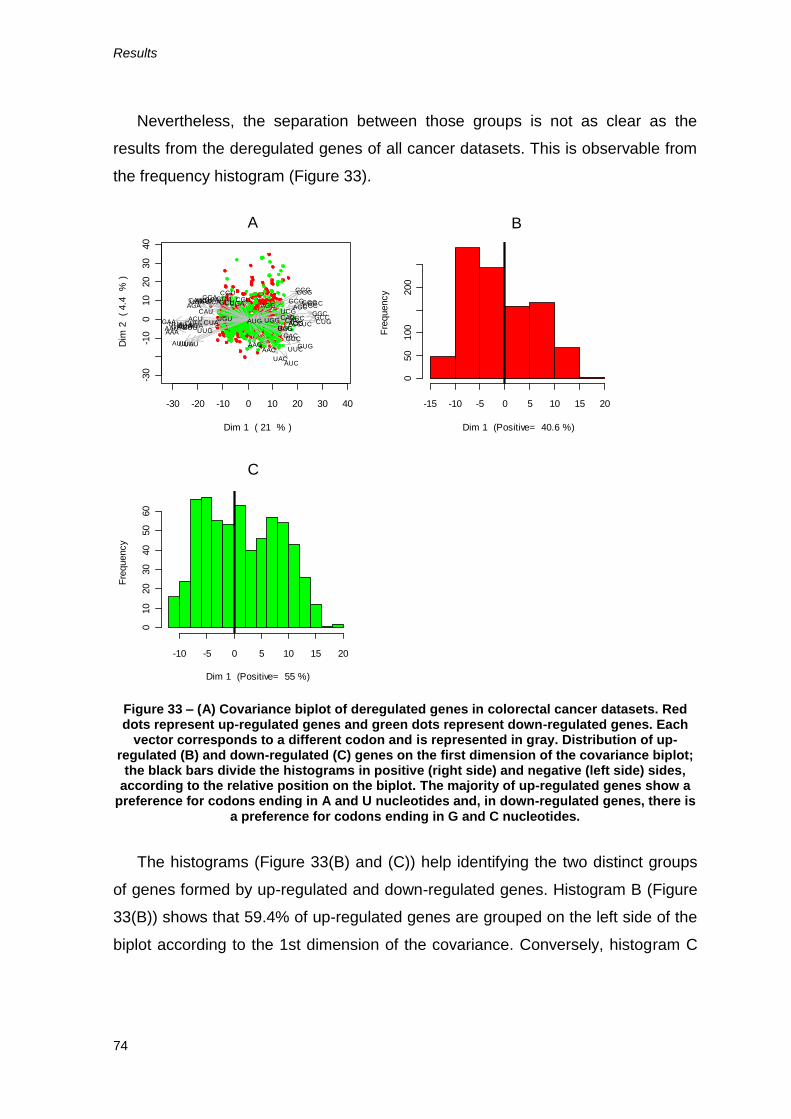
Results
74
Nevertheless, the separation between those groups is not as clear as the
results from the deregulated genes of all cancer datasets. This is observable from
the frequency histogram (Figure 33).
Figure 33 – (A) Covariance biplot of deregulated genes in colorectal cancer datasets. Red dots represent up-regulated genes and green dots represent down-regulated genes. Each
vector corresponds to a different codon and is represented in gray. Distribution of up-regulated (B) and down-regulated (C) genes on the first dimension of the covariance biplot;
the black bars divide the histograms in positive (right side) and negative (left side) sides, according to the relative position on the biplot. The majority of up-regulated genes show a
preference for codons ending in A and U nucleotides and, in down-regulated genes, there is a preference for codons ending in G and C nucleotides.
The histograms (Figure 33(B) and (C)) help identifying the two distinct groups
of genes formed by up-regulated and down-regulated genes. Histogram B (Figure
33(B)) shows that 59.4% of up-regulated genes are grouped on the left side of the
biplot according to the 1st dimension of the covariance. Conversely, histogram C
-30 -20 -10 0 10 20 30 40
-30
-10
010
20
30
40
Covariance Biplot Merged All Colon Cancer
Dim 1 ( 21 % )
Dim
2
( 4.4
%
)
AAA
AACAAG
AAU ACA ACCACGACU
AGA AGCAGGAGU
AUA
AUC
AUG
AUU
CAA
CACCAGCAU
CCACCC
CCGCCU
CGA CGCCGGCGU
CUA CUC CUGCUUGAA
GACGAGGAU
GCA
GCC
GCGGCUGGA
GGC
GGGGGU
GUA
GUCGUG
GUU
UAC
UAU
UCA
UCCUCG
UCU
UGC
UGGUGUUUA
UUC
UUG
UUU
UP Enriched
Dim 1 (Positive= 40.6 %)
Fre
quency
-15 -10 -5 0 5 10 15 200
50
100
200
Down Enriched
Dim 1 (Positive= 55 %)
Fre
quency
-10 -5 0 5 10 15 20
010
20
30
40
50
60
A B
C

Chapter III
75
(Figure 33(C)) shows that 55% of the down-regulated genes are grouped on the
right side of the biplot.
3.4.3. Covariance biplot of cancer datasets with deregulated CTU2
The covariance biplot corresponding to the deregulated genes of all cancer
datasets where CTU2 was found deregulated revealed the existence of two
groups, one composed by up-regulated genes (red-right side) and another group
composed by down-regulated genes (green-left side). Furthermore, only codons
corresponding to the tRNAs specifically modified by the CTU2 were used in this
analysis. The codons (variables) ending in A nucleotides, which are represented
by arrows, stretch in the direction of the up-regulated group of genes. Conversely,
the codons ending in G nucleotides stretch in the direction of the down-regulated
group of genes (Figure 34). This defines the preference of up-regulated genes for
codons ending in A (AAA, CAA and GAA) and the preference of down-regulated
genes for codons ending in G (AAG CAG GAG).

Results
76
Figure 34 – Covariance biplot of deregulated genes in cancer datasets where CTU2 tRNA modifying enzyme was found deregulated. Each vector corresponds to Lys (AAA AAG), Glu
(GAA GAG) and Gln (CAA CAG) codons. CTU2 modifies the tRNA wobble positions of tRNA(Lys), tRNA(Glu) and tRNA(Gln). The majority of up-regulated genes show a preference
for codons ending in A nucleotides and the majority of down-regulated genes show a preference for codons ending in G nucleotides.
-10 0 10 20
-10
01
02
0Covariance Biplot CTU2
Dim 1 ( 39.8 % )
Dim
2 (
21
.3 %
)
AAA
AAG
CAA
CAGGAA
GAG
Up Enriched
Down Enriched
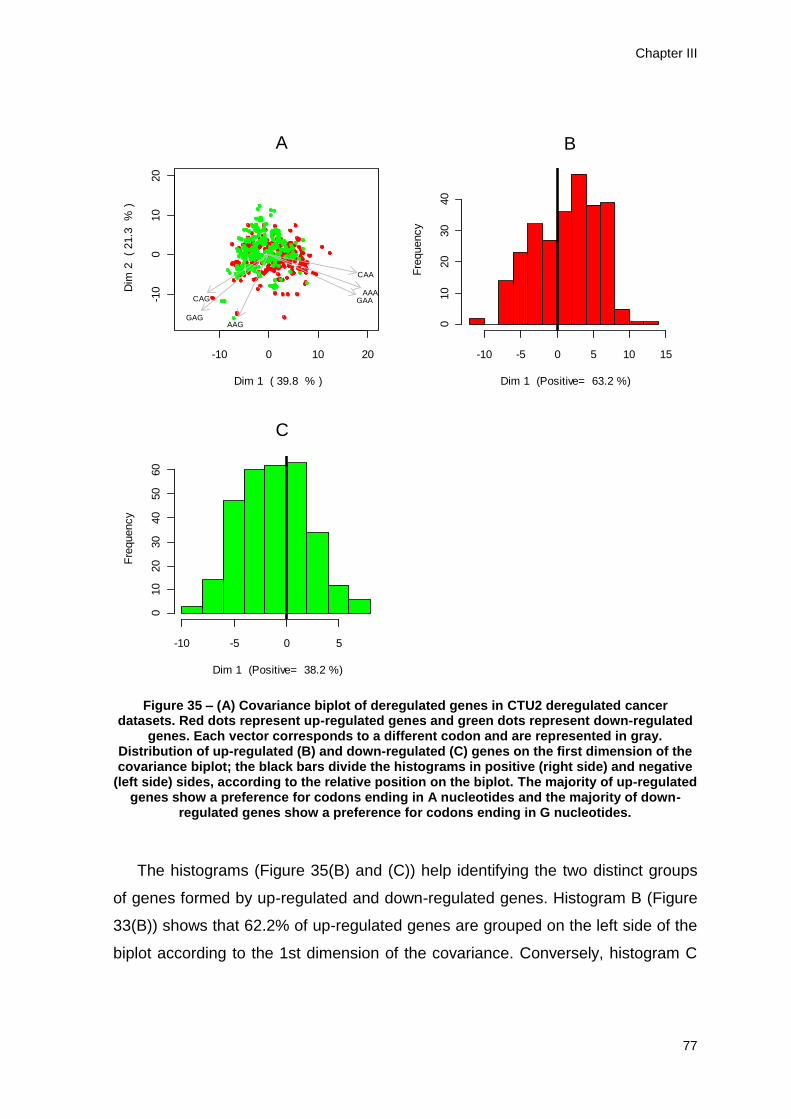
Chapter III
77
Figure 35 – (A) Covariance biplot of deregulated genes in CTU2 deregulated cancer datasets. Red dots represent up-regulated genes and green dots represent down-regulated
genes. Each vector corresponds to a different codon and are represented in gray. Distribution of up-regulated (B) and down-regulated (C) genes on the first dimension of the covariance biplot; the black bars divide the histograms in positive (right side) and negative
(left side) sides, according to the relative position on the biplot. The majority of up-regulated genes show a preference for codons ending in A nucleotides and the majority of down-
regulated genes show a preference for codons ending in G nucleotides.
The histograms (Figure 35(B) and (C)) help identifying the two distinct groups
of genes formed by up-regulated and down-regulated genes. Histogram B (Figure
33(B)) shows that 62.2% of up-regulated genes are grouped on the left side of the
biplot according to the 1st dimension of the covariance. Conversely, histogram C
-10 0 10 20
-10
010
20
Covariance Biplot Merged All Cancers
Dim 1 ( 39.8 % )
Dim
2
( 21.3
%
)
AAA
AAG
CAA
CAG GAA
GAG
UP
Dim 1 (Positive= 63.2 %)
Fre
quency
-10 -5 0 5 10 15
010
20
30
40
Down
Dim 1 (Positive= 38.2 %)
Fre
quency
-10 -5 0 5
010
20
30
40
50
60
A B
C

Results
78
(Figure 33(C)) shows that 61.8% of the down-regulated genes are grouped on the
right side of the biplot.

Chapter IV
Discussion


Chapter IV
81
4. Discussion
4.1. Overview
tRNA modifying enzymes are essential to the normal function of cells.
Mutations on genes encoding these enzymes, as well as deregulations at their
expression levels can compromise cellular fitness, ultimately leading to disease
phenotypes (Abbott et al., 2014; Torres et al., 2014).
Aberrant expression of tRNA modifying enzymes has been associated with
cancer (Torres et al., 2014). Nevertheless, the underlying mechanisms and their
relationship with this disease are far from being fully understood.
To the author’s knowledge, this is the first study assessing the relationship
between deregulated tRNA modifying enzymes and their potential influence as
modulator factors of codon usage in cancer. Furthermore, this study combines
publicly available microarray datasets of various cancer types that were thus
analyzed by the same analytical, statistical and meta-analysis tools. We identified
and analyzed 37 studies and 70 microarray datasets of various different types and
subtypes of cancer.
There are several reasons for the discordance of these studies: differences in
microarray platforms, quality of microarray results, methods of analysis and
tissues used for analysis. To compensate, we analyzed every dataset individually
before proceeding to the meta-analysis tools and, for that, we used the same tool,
GEO2R, for each and all datasets. We also divided some datasets that contained
more than one type/subtype of cancer or more than one tissue type to minimize
the discrepancy between samples. All this proceedings were adopted to minimize
discordances in the microarray data and to assure a certain degree of confidence
in the results.
We decided to create the additional colorectal and CTU2 alternative arrays of
datasets, in one hand because the colorectal cancer was the most represented
type of cancer on our datasets, on the other hand because colorectal cancer is the
third cause of death by cancer in the world and it is the second more incident
cancer in Portugal with a high mortality rate (Ferlay et al., 2015).
Additionally, in what regards the CTU2 datasets, we intend with this work to
shed a new light on the relationship between tRNA modifying enzymes with cancer

Discussion
82
and how codon usage can be influenced by those enzymes. As the CTU2 tRNA
modifying enzyme modifies the wobble position of specific tRNAs (tRNA-Lys,
tRNA-Glu and tRNA-Gln) it is a good starting point to evaluate the codon usage of
the corresponding codons where that enzyme is deregulated.
4.2. Codon bias variation
In the present study, a comprehensive analysis of the GC composition in 70
cancer datasets revealed that there are differences in GC content at the third
codon position between up-regulated and down-regulated gene sets and this
seems to influence codon usage bias. In a triplet, the GC contents at the three
positions are different because these positions have different selective constraints
(RoyChoudhury and Mukherjee, 2010).
As GC content is correlated with various genomic features, we can infer repeat
element distribution and, for instance, methylation pattern (Jabbari and Bernardi,
1998). Since different genomes have their own characteristic patterns of
synonymous codon usage, it has not been easy to provide a satisfactory
explanation for the particular pattern that is found in a given genome (Chen et al.,
2014; Grantham et al., 1980).
It is suggested that the distribution of GC content in mammals could have
some functional relevance (Galtier et al., 2001). In fact, that was observed in our
study, there seems to be a correlation between the GC content and gene function.
We observed, from our GO enrichment analysis, that clusters of genes involved in
cell proliferation functions tend to have a lesser GC content on the third codon
position and those clusters of genes involved in cell differentiation functions tend
to have a higher GC content of the same codon position. Furthermore, a similar
tendency was reported in a recent study (Gingold et al., 2014).
The GC content of synonymous sites correlates positively with levels of gene
expression (Hershberg and Petrov, 2008) and this indeed seems to be the case in
our study, as we observe higher levels of CAI in gene sets with higher percentage
of GC content on the third position. Conversely, our results show lower levels of
CAI in gene sets with lower percentage of GC content on the third position.

Chapter IV
83
CAI is an index of codon adaptation that is used to estimate the degree of bias
toward codons. The higher the values of this index, the higher will be the bias on
the respective codon usage. High values of CAI, aside from a higher codon usage
bias, also indicates that those genes are closer (in terms of codon usage and
expression levels) to those highly expressed genes used as reference for this
index (Stenico et al., 1994). Therefore, one should expect a higher CAI in genes
associated with high expression.
Our results point to a relationship between higher levels of CAI and high
percentage of GC content on the third position. One can infer, based on the
previous observations, that, at least in this particular study, the gene sets that
present higher numbers of CAI and higher percentage of GC on the third position
are closer, in terms of codon usage and codon composition, to highly expressed
human genes. However, all our results show that the gene sets corresponding to
up-regulated genes have lower CAI and GC content on the third position when
compared to down-regulated gene sets. In addition, it is known that codon bias is
positively correlated with gene expression level (Ikemura, 1981). Moreover, highly
expressed genes may also undergo selection for increased GC content (Lercher et
al., 2003). Our results show a converse tendency to these principles since the
gene set that shows higher CAI comprise genes that are down-regulated.
However, the difference in CAI between the up-regulated and down-regulated
gene sets is not very high, thus this tendency requires further analysis to prove
this conclusion.
Nevertheless, these results demonstrate that, in cancer, the most expressed
genes follow a different pattern of codon usage when compared to normal tissue.
4.3. GO enrichment analysis
Given a set of genes that are up-regulated or down-regulated under certain
conditions, an enrichment analysis will find which GO terms are over-represented
(or under-represented) using annotations for that gene set. This analysis start by
mapping a large number of interesting genes in a list to the associated biological
annotation (e.g. Gene Ontology Terms), and then statistically highlight the most
over-represented (enriched) biological annotation out of thousands of linked terms

Discussion
84
and contents. Generically, the term enrichment means that the quantity of genes
belonging to the specific biological function is more “concentrated” than expected
by chance. GO enrichment analysis is a particularly important tool when
processing the vast amount of information in a meta-analysis study as it increases
the likelihood for investigators to identify biological processes most pertinent to the
biological phenomena under study (Huang et al., 2009).
Our results revealed that, the genes that constitute the up-regulated gene sets,
corresponding to every group of datasets that were made for our meta-analysis,
are involved in proliferation processes. Not only was it a consistent result, the
enrichment score of whole most relevant gene clusters formed by the up-regulated
genes was very high. A higher enrichment score for a group of genes indicates
that the members (genes) are involved in more important (enriched) roles (Huang
et al., 2007).
In fact, it was an expected result. It is well documented, in gene expression
studies, a generalized increase in expression of genes related with proliferation in
cancer (Perou et al., 2000; Rosenwald et al., 2003; Venet et al., 2011; Whitfield et
al., 2006; Yu et al., 2012).
Furthermore, the genes that constitute the down-regulated gene sets,
corresponding to every group of datasets that were made for our meta-analysis,
are involved in differentiation processes. These results are found consistently
throughout our different arrays of datasets. However, enrichment scores of down-
regulated gene sets are lower when compared to those observed in up-regulated
gene sets. Despite pointing to consistent results about biological processes, these
values of enrichment score suggest a more random spread of down-regulated
genes throughout various biological processes. It has been suggested that codon-
mediated translational control may play an important role in the differentiation and
regulation of tissue-specific gene products in humans (Plotkin et al., 2004). If in
fact that is the case, this may explain why we can see these differences in gene
function between up-regulated and down-regulated genes.

Chapter IV
85
4.4. Covariance biplot
The covariance biplot is a powerful visualization technique that facilitates
pattern visualization between variables and cases. In our study, the variables are
codons and the cases are genes. This technique gives a better answer to our set
of data, since it is binary data, where there is a variable dependent group
clustering.
The covariance biplot corresponding to the deregulated genes of all cancer
datasets revealed the existence of two groups, one composed by up-regulated
genes (red-right side) and another group composed by down-regulated genes
(green-left side). Furthermore, the codons ending in A/U and codons ending in
G/C exhibit a distinct separation behavior, leading to the direction of up-regulated
genes group and down-regulated genes group, respectively. This defines the
preference of up-regulated genes for codons ending in A and U and the
preference of down-regulated genes for codons ending in G and C.
We can also infer the relationship between a pair of variables by the angle
cosine formed by the two corresponding arrows. In this case, we can infer the
relationship between two codons by the angle cosine formed by the arrows
corresponding to the codons. From this perspective, almost all the codons ending
in A and U formed angles close to 90° with codons ending in G and C in almost
every example that we can take. Since the cosine of an angle of 90° is 0, we can
infer that there is no relationship between codons ending in A and U and codons
ending in G and C. From the same point of view, we can select some codons pairs
ending In A and U that show higher relationship between both of them and the
same is valid for codons ending in G and C.
The covariance biplot corresponding to the deregulated gene of colorectal
cancer datasets also revealed the existence of two groups one composed by up-
regulated genes (red-right side) and another group composed by down-regulated
genes (green-left side). Nevertheless, the separation between those groups is not
as clear as the results from the deregulated genes of all cancer datasets. This is
observable from the frequency histogram (Figure 33). This can be explained by
the higher number of genes that make the gene set when compared with the
previous array. The colorectal gene sets have a higher number of genes because

Discussion
86
the datasets correspond to only one type of cancer and the proximity of genes and
their corresponding expression is higher than all the other cases. This also
explains why there was a less clear tendency of codon usage pattern on the
previous analysis.
In what regards to the codons (variables) analysis, the direction preference
remains the same as in the deregulated genes analysis biplot of all datasets.
The covariance biplot corresponding to the deregulated genes of all cancer
datasets where CTU2 was found deregulated revealed the existence of two
groups, one composed by up-regulated genes (red-right side) and another group
composed by down-regulated genes (green-left side). Furthermore, the codons
(variables) ending in A and U nucleotides, which are represented by arrows,
stretch in the direction of the up-regulated group of genes. Conversely, the codons
ending in G and C nucleotides stretch in the direction of the up-regulated group of
genes.
The results of the gene set analysis of the datasets where CTU2 enzyme was
found deregulated showed the formation of the same two groups of genes (up-
regulated and down-regulated genes) and the same tendencies of A/U and G/C
codons of the other arrays of datasets. Since we only focused on the codons
corresponding to the tRNAs modified by CTU2 tRNA modifying enzyme, these
patterns are clearer on the plot. This leaves a place to assume a relationship
between CTU2 and codon usage preferences on deregulated enriched GO gene
sets. In this particular case it was important to assess the codon usage of genes in
the gene sets where CTU2 was found deregulated because this enzyme catalyzes
an important modification on the wobble position of specific tRNAs. The wobble
modifications play critical roles in modulating codon recognition by restricting,
expanding, or altering the decoding properties of the tRNAs (Ikeuchi et al., 2006).
The CTU2 is up-regulated in all datasets analyzed. The up-regulation of CTU2
may ultimately lead to an increase in modified tRNAs that, with their altered
decoding properties, will set a preference for the last codon position (e.g. A/U
instead of G/C).
Aside from the described importance of this enzyme for the fidelity of
translation, cancer-induced tRNAs typically correspond perfectly or via wobbling to

Chapter IV
87
codons enriched among the proliferation-processes genes (Gingold et al., 2014). If
this is in fact the case, we can speculate based on our results that, since there is a
preference for synonymous codon usage for these specific amino acids the tRNAs
corresponding to the preferred codons are also altered. It is known that tRNA
pools are altered in cancer (Waldman et al., 2009). This may be happening as a
mechanism to enhance translation efficiency of specific genes enriched on these
preferred codons. We may not yet conclude this because there is still controversy
about the methods to study translation efficiency in humans. Diverse studies have
defined some measures of codon usage bias found in highly expressed genes
(e.g. high CAI) as a links to translation efficiency (Lavner and Kotlar, 2005; dos
Reis et al., 2004). However, recent studies suggest that this is plausible, yet
indirect. Therefore, to study translation efficiency, a more suitable approach would
be combining codon usage bias to tRNA pool co-adaptation and mRNA structure
(Pop et al., 2014; Waldman et al., 2010).
It is noteworthy that all the results from the covariance biplot of all the different
arrays of datasets are concordant with the codon usage analysis described before.
The usage of synonymous codons is not uniform and there is a strong
preference toward certain codons in highly expressed genes when compared with
other genes (Lavner and Kotlar, 2005). We cannot clearly conclude that tRNA
modifications and tRNA modifying enzymes can alter the expression on human
genes in cancer because we lack the additional data to draw this conclusion.
Factors such as mRNA secondary structure, relative abundance of wobble base
pairs, clustering of rare codons, interactions with modified tRNAs, ribosomal
density, or presence of Shine-Dalgarno-like features in coding sequences can
further contribute to the regulation of gene expression through synonymous codon
bias and tRNA dynamics (Kudla et al., 2009; Li et al., 2012; Novoa et al., 2012;
Parmley and Huynen, 2009; Stadler and Fire, 2011; Tuller et al., 2010).
However, our results point to a clear distinction on synonymous codon usage
preferences when comparing groups of up-regulated and down-regulated genes
(e.g. in covariance biplot of deregulated genes in cancer datasets (Figure 30) the
codons CCU and CCC are synonymous codons that code proline. However,
assuming the angle that the two vectors corresponding to these codons make,

Discussion
88
there is no relationship in which regards codon usage of the two codons.
Furthermore, there is a preference for CCU codon in up-regulated genes and there
is a preference for CCC codon in down-regulated genes. In addition, the same
behavior can be seen between another two synonymous codons GGU and GGC
that code glycine. Interestingly, the codons CCU and GGU are closely related in
which regards codon usage and this is also verified for CCC and GGC codons).
Since synonymous changes for non-optimal codons can alter the expression of
human genes (Kimchi-Sarfaty et al., 2007), we can assume a possible role of
tRNA modifying enzymes on transcription regulation.

Chapter V
Final Remarks

Chapter V
91
5. Final Remarks
tRNA modifications are crucial for tRNA function, stability and codon:anticodon
interactions. The levels of these modifications and its corresponding enzymes are
altered in complex human diseases such as cancer, neurological disorders and
mitochondrial-linked diseases. However, the molecular mechanisms behind these
connections remain unknown.
Overall, our data indicates a distinct codon usage and codon preference
between up-regulated and down-regulated genes in cancer. This codon usage
bias might be caused by the deregulation of specific tRNA modifying enzymes, as
our analysis on CTU2 data indicates. Furthermore, our results suggest that the
modification catalyzed by the CTU2 exerted a positive selection, causing a bias
towards specific codons that are read by these modified tRNAs. However, it is
difficult to draw clear conclusions between specific tRNA modifying enzymes and
cancer because there are many enzymes deregulated at a given dataset. With the
performed analyses other useful gene expression information was also extracted.
The biological dichotomy of processes that we have noticed between up-regulated
and down-regulated genes on our study, although known, is important in a gene
expression analysis study. The distinct codon usage bias may augment the
translation efficiency of some genes that otherwise, in a normal situation, would be
translated less efficiently. In addition, this study suggests that codon usage bias in
cancer shall be a strategy for regulating gene expression.
Cancer is a multifactorial disease with a wide impact in human population and
there is still a long way to go in what concerns the understanding of the genetic
features of this disease as well as effective treatments. This study brings further
support to the implication of tRNA modifying enzymes in cancer and the
acquisition of the so called hallmarks of cancer as controlling agents of gene
expression.


93
References
Abbasi-Moheb, L., Mertel, S., Gonsior, M., Nouri-Vahid, L., Kahrizi, K., Cirak, S.,
Wieczorek, D., Motazacker, M.M., Esmaeeli-Nieh, S., Cremer, K., et al. (2012).
Mutations in NSUN2 cause autosomal-recessive intellectual disability. Am. J.
Hum. Genet. 90, 847–855.
Abbott, J.A., Francklyn, C.S., and Robey-Bond, S.M. (2014). Transfer RNA and
human disease. Front. Genet. 5, 158.
Agris, P.F. (2004). Decoding the genome: a modified view. Nucleic Acids Res. 32,
223–238.
Agris, P.F., Vendeix, F.A.P., and Graham, W.D. (2007). tRNA’s wobble decoding
of the genome: 40 years of modification. J. Mol. Biol. 366, 1–13.
Akashi, H. (1994). Synonymous codon usage in Drosophila melanogaster: natural
selection and translational accuracy. Genetics 136, 927–935.
Alberts, B., Johnson, A., Lewis, J., Raff, M., Roberts, K., and Walter, P. (2008).
Molecular biology of the cell (Garland Science Pub). 5th Edition. pp. 1392
Alexandrov, A., Chernyakov, I., Gu, W., Hiley, S.L., Hughes, T.R., Grayhack, E.J.,
and Phizicky, E.M. (2006). Rapid tRNA decay can result from lack of nonessential
modifications. Mol. Cell 21, 87–96.
Allison, L.A. (2007). Fundamental molecular biology (Blackwell Pub.). pp 752.
Ares, M., Grate, L., and Pauling, M.H. (1999). A handful of intron-containing genes
produces the lion’s share of yeast mRNA. RNA 5, 1138–1139.
Attardi, G. (1967). The mechanism of protein synthesis. Annu. Rev. Microbiol. 21,
383–416.
van Bakel, H., and Holstege, F.C.P. (2008). A tutorial for DNA microarray
expression profiling. Cell Press 22–28.
Bauer, J.W., Bilgic, H., and Baechler, E.C. (2009). Gene-expression profiling in
rheumatic disease: tools and therapeutic potential. Nat Rev Rheumatol 5, 257–
265.
Begley, T.J., Rosenbach, A.S., Ideker, T., and Samson, L.D. (2002). Damage
recovery pathways in Saccharomyces cerevisiae revealed by genomic
phenotyping and interactome mapping. Mol. Cancer Res. 1, 103–112.
Begley, T.J., Rosenbach, A.S., Ideker, T., and Samson, L.D. (2004). Hot spots for
modulating toxicity identified by genomic phenotyping and localization mapping.

94
Mol. Cell 16, 117–125.
Begley, U., Dyavaiah, M., Patil, A., Rooney, J.P., DiRenzo, D., Young, C.M.,
Conklin, D.S., Zitomer, R.S., and Begley, T.J. (2007). Trm9 catalyzed tRNA
modifications link translation to the DNA damage response. Mol. Cell 28, 860–870.
Begley, U., Sosa, M.S., Avivar-Valderas, A., Patil, A., Endres, L., Estrada, Y.,
Chan, C.T.Y., Su, D., Dedon, P.C., Aguirre-Ghiso, J.A., et al. (2013). A human
tRNA methyltransferase 9-like protein prevents tumour growth by regulating LIN9
and HIF1-α. EMBO Mol. Med. 5, 366–383.
Bjork, G.R. (1995). Genetic dissection of synthesis and function of modified
nucleosides in bacterial transfer RNA. Prog. Nucleic Acid Res. Mol. Biol. 50, 263–
338.
Björk, G.R. (1986). Transfer RNA modification in different organisms. Chem Scr.
26, 91–95.
Björk, G.R., and Hagervall, T.G. (2014). Transfer RNA modification: presence,
synthesis, and function. EcoSal Plus.
Björk, G.R., Durand, J.M.B., Hagervall, T.G., Leipuvien, R., Lundgren, H.K.,
Nilsson, K., Chen, P., Qian, Q., and Urbonavičius, J. (1999). Transfer RNA
modification: influence on translational frameshifting and metabolism. FEBS Lett.
452, 47–51.
Björk, G.R., Huang, B., Persson, O.P., and Byström, A.S. (2007). A conserved
modified wobble nucleoside (mcm(5)s(2)U) in lysyl-tRNA is required for viability in
yeast. RNA 13, 1245–1255.
Blanco, S., Dietmann, S., Flores, J. V, Hussain, S., Kutter, C., Humphreys, P.,
Lukk, M., Lombard, P., Treps, L., Popis, M., et al. (2014). Aberrant methylation of
tRNAs links cellular stress to neuro-developmental disorders. EMBO J. 33, 2020–
2039.
Brown, T.A. (2007). Genomes 3 (Garland Science Pub). 3rd Edition. pp. 713
Bulmer, M. (1991). The selection-mutation-drift theory of synonymous codon
usage. Genetics 129, 897–907.
Chartier, M., Gaudreault, F., and Najmanovich, R. (2012). Large-scale analysis of
conserved rare codon clusters suggests an involvement in co-translational
molecular recognition events. Bioinformatics 28, 1438–1445.
Chen, H., Sun, S., Norenburg, J.L., and Sundberg, P. (2014). Mutation and
selection cause codon usage and bias in mitochondrial genomes of ribbon worms
(Nemertea). PLoS One 9, e85631.

95
Chen, S.L., Lee, W., Hottes, A.K., Shapiro, L., and McAdams, H.H. (2004). Codon
usage between genomes is constrained by genome-wide mutational processes.
Proc. Natl. Acad. Sci. U. S. A. 101, 3480–3485.
Chin, L., Hahn, W.C., Getz, G., and Meyerson, M. (2011). Making sense of cancer
genomic data. Genes Dev. 25, 534–555.
Corley, R.B. (2004). A guide to methods in the biomedical sciences (Springer US).
Crick, F. (1970). Central dogma of molecular biology. Nature 227, 561–563.
Crick, F.H.C. (1966). Codon-anticodon pairing: the wobble hypothesis. J. Mol. Biol.
19, 548–555.
Cunningham, F., Amode, M.R., Barrell, D., Beal, K., Billis, K., Brent, S., Carvalho-
Silva, D., Clapham, P., Coates, G., Fitzgerald, S., et al. (2015). Ensembl 2015.
Nucleic Acids Res. 43 , D662–D669.
Demey, J.R., Vicente-Villardón, J.L., Galindo-Villardón, M.P., and Zambrano, A.Y.
(2008). Identifying molecular markers associated with classification of genotypes
by external logistic biplots. Bioinformatics 24, 2832–2838.
Dever, T.E., and Hinnebusch, A.G. (2005). GCN2 whets the appetite for amino
acids. Mol. Cell 18, 141–142.
Ferlay, J., Soerjomataram, I., Dikshit, R., Eser, S., Mathers, C., Rebelo, M.,
Parkin, D.M., Forman, D., and Bray, F. (2015). Cancer incidence and mortality
worldwide: sources, methods and major patterns in GLOBOCAN 2012. Int. J.
Cancer 136, E359–E386.
Frenkel-Morgenstern, M., Danon, T., Christian, T., Igarashi, T., Cohen, L., Hou, Y.-
M., and Jensen, L.J. (2012). Genes adopt non-optimal codon usage to generate
cell cycle-dependent oscillations in protein levels. Mol. Syst. Biol. 8, 572.
Frye, M., and Watt, F.M. (2006). The RNA methyltransferase misu (NSUN2)
mediates Myc-induced proliferation and is upregulated in tumors. Curr. Biol. 16,
971–981.
Fu, D., Brophy, J.A.N., Chan, C.T.Y., Atmore, K.A., Begley, U., Paules, R.S.,
Dedon, P.C., Begley, T.J., and Samson, L.D. (2010). Human AlkB homolog ABH8
is a tRNA methyltransferase required for wobble uridine modification and DNA
damage survival. Mol. Cell. Biol. 30, 2449–2459.
Gabriel, K.R. (1971). The biplot graphic display of matrices with application to
principal component analysis. Biometrika 58, 453–467.
Galtier, N., Piganeau, G., Mouchiroud, D., and Duret, L. (2001). GC-content
evolution in mammalian genomes: the biased gene conversion hypothesis.

96
Genetics 159, 907–911.
Garcia, G.A., and Goodenough-Lashua, D.M. (1998). Mechanisms of RNA-
modifying and -editing enzymes. In Modification and Editing of RNA, (American
Society of Microbiology), pp. 135–168.
Giegé, R., Sissler, M., and Florentz, C. (1998). Universal rules and idiosyncratic
features in tRNA identity. Nucleic Acids Res. 26, 5017–5035.
Gingold, H., Tehler, D., Christoffersen, N.R., Nielsen, M.M., Asmar, F., Kooistra,
S.M., Christophersen, N.S., Christensen, L.L., Borre, M., Sørensen, K.D., et al.
(2014). A dual program for translation regulation in cellular proliferation and
differentiation. Cell 158, 1281–1292.
Graille, M., and Seraphin, B. (2012). Surveillance pathways rescuing eukaryotic
ribosomes lost in translation. Nat Rev Mol Cell Biol 13, 727–735.
Grantham, R., Gautier, C., and Gouy, M. (1980). Codon frequencies in 119
individual genes confirm consistent choices of degenerate bases according to
genome type. Nucleic Acids Res. 8, 1893–1912.
Grosjean, H., Söll, D.G., and Crothers, D.M. (1976). Studies of the complex
between transfer RNAs with complementary anticodons. J. Mol. Biol. 103, 499–
519.
Grosjean, H., de Crécy-Lagard, V., and Marck, C. (2010). Deciphering
synonymous codons in the three domains of life: co-evolution with specific tRNA
modification enzymes. FEBS Lett. 584, 252–264.
Gustafsson, C., Govindarajan, S., and Minshull, J. (2004). Codon bias and
heterologous protein expression. Trends Biotechnol. 22, 346–353.
Heizer, E.M., Raiford, D.W., Raymer, M.L., Doom, T.E., Miller, R. V, and Krane,
D.E. (2006). Amino acid cost and codon-usage biases in 6 prokaryotic genomes: a
whole-genome analysis. Mol. Biol. Evol. 23, 1670–1680.
Hershberg, R., and Petrov, D.A. (2008). Selection on codon bias. Annu. Rev.
Genet. 42, 287–299.
Hori, H. (2014). Methylated nucleosides in tRNA and tRNA methyltransferases .
Front. Genet. 5, 144.
Huang, D.W., Sherman, B.T., Tan, Q., Collins, J.R., Alvord, W.G., Roayaei, J.,
Stephens, R., Baseler, M.W., Lane, H.C., and Lempicki, R.A. (2007). The DAVID
gene functional classification tool: a novel biological module-centric algorithm to
functionally analyze large gene lists. Genome Biol. 8, R183–R183.
Huang, D.W., Sherman, B.T., and Lempicki, R.A. (2009). Systematic and

97
integrative analysis of large gene lists using DAVID bioinformatics resources. Nat.
Protoc. 4, 44–57.
Ikemura, T. (1981). Correlation between the abundance of Escherichia coli
transfer RNAs and the occurrence of the respective codons in its protein genes: a
proposal for a synonymous codon choice that is optimal for the E. coli translational
system. J. Mol. Biol. 151, 389–409.
Ikemura, T. (1985). Codon usage and tRNA content in unicellular and multicellular
organisms. Mol. Biol. Evol. 2 , 13–34.
Ikeuchi, Y., Shigi, N., Kato, J., Nishimura, A., and Suzuki, T. (2006). Mechanistic
insights into sulfur relay by multiple sulfur mediators involved in thiouridine
biosynthesis at tRNA wobble positions. Mol. Cell 21, 97–108.
Jabbari, K., and Bernardi, G. (1998). CpG doublets, CpG islands and Alu repeats
in long human DNA sequences from different isochore families. Gene 224, 123–
128.
Jablonowski, D., Zink, S., Mehlgarten, C., Daum, G., and Schaffrath, R. (2006).
tRNAGlu wobble uridine methylation by Trm9 identifies Elongator’s key role for
zymocin-induced cell death in yeast. Mol. Microbiol. 59, 677–688.
Jackman, J.E., and Alfonzo, J.D. (2013). Transfer RNA modifications: nature’s
combinatorial chemistry playground. Wiley Interdiscip. Rev. RNA 4, 35–48.
Jackson, R.J., Hellen, C.U.T., and Pestova, T. V (2010). The mechanism of
eukaryotic translation initiation and principles of its regulation. Nat Rev Mol Cell
Biol 11, 113–127.
Johansson, M.J.O., and Byström, A.S. (2002). Dual function of the
tRNA(m5U54)methyltransferase in tRNA maturation. RNA 8, 324–335.
Kapp, L.D., and Lorsch, J.R. (2004). The molecular mechanisms of eukaryotic
translation. Annu. Rev. Biochem. 73, 657–704.
Kim, S.H., Quigley, G.J., Suddath, F.L., McPherson, A., Sneden, D., Kim, J.J.,
Weinzierl, J., and Rich, A. (1973). Three-dimensional structure of yeast
phenylalanine transfer RNA: folding of the polynucleotide chain. Science (80-. ).
179, 285–288.
Kim, S.-Y., Kim, J.-H., Lee, H.-S., Noh, S.-M., Song, K.-S., Cho, J.-S., Jeong, H.-
Y., Kim, W.H., Yeom, Y.-I., Kim, N.-S., et al. (2007). Meta- and gene set analysis
of stomach cancer gene expression data. Mol. Cells 24, 200–209.
Kim, T.-H., Choi, S.J., Lee, Y.H., Song, G.G., and Ji, J.D. (2014). Gene expression
profile predicting the response to anti-TNF treatment in patients with rheumatoid
98
arthritis; analysis of GEO datasets. Joint. Bone. Spine 81, 325–330.
Kimchi-Sarfaty, C., Oh, J.M., Kim, I.-W., Sauna, Z.E., Calcagno, A.M., Ambudkar,
S. V, and Gottesman, M.M. (2007). A “silent” polymorphism in the MDR1 gene
changes substrate specificity. Science (80-. ). 315, 525–528.
Krüger, M.K., Pedersen, S., Hagervall, T.G., and Sørensen, M.A. (1998). The
modification of the wobble base of tRNAGlu modulates the translation rate of
glutamic acid codons in vivo. J. Mol. Biol. 284, 621–631.
Kudla, G., Murray, A.W., Tollervey, D., and Plotkin, J.B. (2009). Coding-sequence
determinants of gene expression in Escherichia coli. Science (80-. ). 324, 255–
258.
Kurland, C.G. (1991). Codon bias and gene expression. FEBS Lett. 285, 165–169.
Ladner, J.E., Jack, A., Robertus, J.D., Brown, R.S., Rhodes, D., Clark, B.F., and
Klug, A. (1975). Structure of yeast phenylalanine transfer RNA at 2.5 A resolution.
Proc. Natl. Acad. Sci. U. S. A. 72, 4414–4418.
Lavner, Y., and Kotlar, D. (2005). Codon bias as a factor in regulating expression
via translation rate in the human genome. Gene 345, 127–138.
Lee, H.K., Hsu, A.K., Sajdak, J., Qin, J., and Pavlidis, P. (2004). Coexpression
analysis of human genes across many microarray data sets. Genome Res. 14,
1085–1094.
Lehninger, A.L., Nelson, D.L., and Cox, M.M. (2005). Lehninger Principles of
Biochemistry (W. H. Freeman). 4th Edition. pp. 1119.
Lercher, M.J., Urrutia, A.O., Pavlíček, A., and Hurst, L.D. (2003). A unification of
mosaic structures in the human genome. Hum. Mol. Genet. 12 , 2411–2415.
Lewin, B., Krebs, J.E., Goldstein, E.S., and Kilpatrick, S.T. (2011). Lewin’s
essential genes (Jones & Bartlett Learning). 2nd Edition. pp. 809.
Li, G.-W., Oh, E., and Weissman, J.S. (2012). The anti-Shine-Dalgarno sequence
drives translational pausing and codon choice in bacteria. Nature 484, 538–541.
Liu, N., and Pan, T. (2015). RNA epigenetics. Transl. Res. 165, 28–35.
Lodish, H.F. (2007). Molecular cell biology (W. H. Freeman). 6th Edition. pp. 973.
Marshall, L., Kenneth, N.S., and White, R.J. (2008). Elevated tRNAiMet synthesis
can drive cell proliferation and oncogenic transformation. Cell 133, 78–89.
McCloskey, J.A., and Crain, P.F. (1998). The RNA modification database. Nucleic
Acids Res. 26, 196–197.

99
Mei, Y., Yong, J., Liu, H., Shi, Y., Meinkoth, J., Dreyfuss, G., and Yang, X. (2010).
tRNA binds to cytochrome c and inhibits caspase activation. Mol. Cell 37, 668–
678.
Mogk, A., Schmidt, R., and Bukau, B. (2007). The N-end rule pathway for
regulated proteolysis: prokaryotic and eukaryotic strategies. Trends Cell Biol. 17,
165–172.
Moura, G., Pinheiro, M., Silva, R., Miranda, I., Afreixo, V., Dias, G., Freitas, A., and
Oliveira, J.L. (2005). Comparative context analysis of codon pairs on an ORFeome
scale. 6, R28.
Moura, G., Pinheiro, M., Freitas, A., Oliveira, J., and Santos, M.S. (2008).
Computational and statistical methodologies for ORFeome primary structure
analysis. In Comparative Genomics, N. Bergman, ed. (Humana Press), pp. 449–
462.
Müller, M., Hartmann, M., Schuster, I., Bender, S., Thüring, K.L., Helm, M., Katze,
J.R., Nellen, W., Lyko, F., and Ehrenhofer-Murray, A.E. (2015). Dynamic
modulation of Dnmt2-dependent tRNA methylation by the micronutrient queuine.
Nucleic Acids Res.
Naya, H., Romero, H., Carels, N., Zavala, A., and Musto, H. (2001). Translational
selection shapes codon usage in the GC-rich genome of Chlamydomonas
reinhardtii. FEBS Lett. 501, 127–130.
Novoa, E.M., and Ribas de Pouplana, L. (2012). Speeding with control: codon
usage, tRNAs, and ribosomes. Trends Genet. 28, 574–581.
Novoa, E.M., Pavon-Eternod, M., Pan, T., and Ribas de Pouplana, L. (2012). A
role for tRNA modifications in genome structure and codon usage. Cell 149, 202–
213.
Okamoto, M., Fujiwara, M., Hori, M., Okada, K., Yazama, F., Konishi, H., Xiao, Y.,
Qi, G., Shimamoto, F., Ota, T., et al. (2014). tRNA modifying enzymes, NSUN2
and METTL1, determine sensitivity to 5-fluorouracil in HeLa cells. PLoS Genet. 10,
e1004639.
Palidwor, G.A., Perkins, T.J., and Xia, X. (2010). A general model of codon bias
due to GC mutational bias. PLoS One 5, e13431.
Parmley, J.L., and Huynen, M.A. (2009). Clustering of codons with rare cognate
tRNAs in human genes suggests an extra level of expression regulation. PLoS
Genet 5, e1000548.
Patil, A., Chan, C.T.Y., Dyavaiah, M., Rooney, J.P., Dedon, P.C., and Begley, T.J.
(2012). Translational infidelity-induced protein stress results from a deficiency in

100
Trm9-catalyzed tRNA modifications. RNA Biol. 9, 37–41.
Percudani, R., Pavesi, A., and Ottonello, S. (1997). Transfer RNA gene
redundancy and translational selection in Saccharomyces cerevisiae. J. Mol. Biol.
268, 322–330.
Perou, C.M., Sorlie, T., Eisen, M.B., van de Rijn, M., Jeffrey, S.S., Rees, C.A.,
Pollack, J.R., Ross, D.T., Johnsen, H., Akslen, L.A., et al. (2000). Molecular
portraits of human breast tumours. Nature 406, 747–752.
Phizicky, E.M., and Hopper, A.K. (2010). tRNA biology charges to the front. Genes
Dev. 24 , 1832–1860.
Plotkin, J.B., Robins, H., and Levine, A.J. (2004). Tissue-specific codon usage and
the expression of human genes. Proc. Natl. Acad. Sci. United States Am. 101 ,
12588–12591.
Pop, C., Rouskin, S., Ingolia, N.T., Han, L., Phizicky, E.M., Weissman, J.S., and
Koller, D. (2014). Causal signals between codon bias, mRNA structure, and the
efficiency of translation and elongation. Mol. Syst. Biol. 10, 770.
R Development Core Team (2013). R: A language and environment for statistical
computing. R Foundation for Statistical Computing, Vienna, Austria. URL
http://www.R-project.org/. R Found. Stat. Comput. Vienna, Austria.
Ramasamy, A., Mondry, A., Holmes, C.C., and Altman, D.G. (2008). Key issues in
conducting a meta-analysis of gene expression microarray datasets. PLoS Med. 5,
e184.
dos Reis, M., Savva, R., and Wernisch, L. (2004). Solving the riddle of codon
usage preferences: a test for translational selection. Nucleic Acids Res. 32, 5036–
5044.
Rhodes, D.R., Yu, J., Shanker, K., Deshpande, N., Varambally, R., Ghosh, D.,
Barrette, T., Pandey, A., and Chinnaiyan, A.M. (2004). Large-scale meta-analysis
of cancer microarray data identifies common transcriptional profiles of neoplastic
transformation and progression. Proc. Natl. Acad. Sci. U. S. A. 101, 9309–9314.
Rhodes, D.R., Kalyana-Sundaram, S., Mahavisno, V., Varambally, R., Yu, J.,
Briggs, B.B., Barrette, T.R., Anstet, M.J., Kincead-Beal, C., Kulkarni, P., et al.
(2007). Oncomine 3.0: genes, pathways, and networks in a collection of 18,000
cancer gene expression profiles. Neoplasia 9, 166–180.
Roovers, M., Wouters, J., Bujnicki, J.M., Tricot, C., Stalon, V., Grosjean, H., and
Droogmans, L. (2004). A primordial RNA modification enzyme: the case of tRNA
(m1A) methyltransferase. Nucleic Acids Res. 32 , 465–476.

101
Rosenwald, A., Wright, G., Wiestner, A., Chan, W.C., Connors, J.M., Campo, E.,
Gascoyne, R.D., Grogan, T.M., Muller-Hermelink, H.K., Smeland, E.B., et al.
(2003). The proliferation gene expression signature is a quantitative integrator of
oncogenic events that predicts survival in mantle cell lymphoma. Cancer Cell 3,
185–197.
RoyChoudhury, S., and Mukherjee, D. (2010). A detailed comparative analysis on
the overall codon usage pattern in herpesviruses. Virus Res. 148, 31–43.
Ryckelynck, M., Giegé, R., and Frugier, M. (2005). tRNAs and tRNA mimics as
cornerstones of aminoacyl-tRNA synthetase regulations. Biochimie 87, 835–845.
Schaefer, M., Pollex, T., Hanna, K., Tuorto, F., Meusburger, M., Helm, M., and
Lyko, F. (2010). RNA methylation by Dnmt2 protects transfer RNAs against stress-
induced cleavage. Genes Dev. 24, 1590–1595.
Schena, M., Shalon, D., Davis, R.W., and Brown, P.O. (1995). Quantitative
monitoring of gene expression patterns with a complementary DNA microarray.
Science (80-. ). 270, 467–470.
Schimmel, P.R., and Söll, D. (1979). Aminoacyl-tRNA synthetases: general
features and recognition of transfer RNAs. Annu. Rev. Biochem. 48, 601–648.
Schlieker, C.D., Van der Veen, A.G., Damon, J.R., Spooner, E., and Ploegh, H.L.
(2008). A functional proteomics approach links the ubiquitin-related modifier Urm1
to a tRNA modification pathway. Proc. Natl. Acad. Sci. U. S. A. 105, 18255–18260.
Schneider-Poetsch, T., Usui, T., Kaida, D., and Yoshida, M. (2010). Garbled
messages and corrupted translations. Nat Chem Biol 6, 189–198.
Sharp, P.M., and Li, W.H. (1987). The codon adaptation index - a measure of
directional synonymous codon usage bias, and its potential applications. Nucleic
Acids Res. 15, 1281–1295.
Shimada, K., Nakamura, M., Anai, S., De Velasco, M., Tanaka, M., Tsujikawa, K.,
Ouji, Y., and Konishi, N. (2009). A novel Human AlkB homologue, ALKBH8,
contributes to Human bladder cancer progression. Cancer Res. 69, 3157–3164.
Sprinzl, M., Horn, C., Brown, M., Ioudovitch, A., and Steinberg, S. (1998).
Compilation of tRNA sequences and sequences of tRNA genes. Nucleic Acids
Res. 26 , 148–153.
Stadler, M., and Fire, A. (2011). Wobble base-pairing slows in vivo translation
elongation in metazoans. RNA 17, 2063–2073.
Stenico, M., Lloyd, A.T., and Sharp, P.M. (1994). Codon usage in Caenorhabditis
elegans: delineation of translational selection and mutational biases. Nucleic Acids

102
Res. 22, 2437–2446.
Swanson, R., Hoben, P., Sumner-Smith, M., Uemura, H., Watson, L., and Soll, D.
(1988). Accuracy of in vivo aminoacylation requires proper balance of tRNA and
aminoacyl-tRNA synthetase. Science (80-. ). 242, 1548–1551.
Takano, K., Nakagawa, E., Inoue, K., Kamada, F., Kure, S., Goto, Y.I., Inazawa,
J., Kato, M., Kubota, T., Kurosawa, K., et al. (2008). A loss-of-function mutation in
the FTSJ1 gene causes nonsyndromic x-linked mental retardation in a Japanese
family. Am. J. Med. Genet. Part B Neuropsychiatr. Genet. 147, 479–484.
Torres, A.G., Batlle, E., and Ribas de Pouplana, L. (2014). Role of tRNA
modifications in human diseases. Trends Mol. Med. 20, 306–314.
Tuller, T., Carmi, A., Vestsigian, K., Navon, S., Dorfan, Y., Zaborske, J., Pan, T.,
Dahan, O., Furman, I., and Pilpel, Y. (2010). An evolutionarily conserved
mechanism for controlling the efficiency of protein translation. Cell 141, 344–354.
Varshavsky, A. (1997). The N-end rule pathway of protein degradation. Genes to
Cells 2, 13–28.
Venet, D., Dumont, J.E., and Detours, V. (2011). Most random gene expression
signatures are significantly associated with breast cancer outcome. PLoS Comput
Biol 7, e1002240.
Waldman, Y.Y., Tuller, T., Sharan, R., and Ruppin, E. (2009). TP53 cancerous
mutations exhibit selection for translation efficiency. Cancer Res. 69, 8807–8813.
Waldman, Y.Y., Tuller, T., Shlomi, T., Sharan, R., and Ruppin, E. (2010).
Translation efficiency in humans: tissue specificity, global optimization and
differences between developmental stages. Nucleic Acids Res. 38 , 2964–2974.
Waldron, C., and Lacroute, F. (1975). Effect of growth rate on the amounts of
ribosomal and transfer ribonucleic acids in yeast. J. Bacteriol. 122 , 855–865.
Whipple, J.M., Lane, E.A., Chernyakov, I., D’Silva, S., and Phizicky, E.M. (2011).
The yeast rapid tRNA decay pathway primarily monitors the structural integrity of
the acceptor and T-stems of mature tRNA. Genes Dev. 25, 1173–1184.
Whitfield, M.L., George, L.K., Grant, G.D., and Perou, C.M. (2006). Common
markers of proliferation. Nat Rev Cancer 6, 99–106.
El Yacoubi, B., Bailly, M., and de Crécy-Lagard, V. (2012). Biosynthesis and
function of posttranscriptional modifications of transfer RNAs. Annu. Rev. Genet.
46, 69–95.
Yarian, C., Townsend, H., Czestkowski, W., Sochacka, E., Malkiewicz, A.J.,
Guenther, R., Miskiewicz, A., and Agris, P.F. (2002). Accurate translation of the
103
genetic code depends on tRNA modified nucleosides. J. Biol. Chem. 277, 16391–
16395.
Yu, X., Zhang, X., Dhakal, I., Beggs, M., Kadlubar, S., and Luo, D. (2012).
Induction of cell proliferation and survival genes by estradiol-repressed microRNAs
in breast cancer cells. BMC Cancer 12, 29.
Zhou, T., Gu, W., Ma, J., Sun, X., and Lu, Z. (2005). Analysis of synonymous
codon usage in H5N1 virus and other influenza A viruses. Biosystems 81, 77–86.

104
Supplementary Material
Table I – List of cancer microarray datasets used in this study and their GEO accession code (Part I).
Dataset GEO accession
Dyrskjot Bladder 3 Superficial Bladder Cancer GSE3167
Dyrskjot Bladder Infiltrating Bladder Urothelial Carcinoma GSE89
Lee Brain Glioblastoma GSE4536
Sun Brain Anaplastic Astrocytoma GSE4290
Sun Brain Glioblastoma GSE4290
Sun Brain Oligodendroglioma GSE4290
Bredel Brain 2 Glioblastoma GSE2223
Biewenga Cervix Cervical Squamous Cell Carcinoma GSE7410
Pyeon Multi-cancer Cervical Cancer GSE6791
Pyeon Multi-cancer Cervical Squamous Cell Carcinoma GSE6791
Scotto Cervix 2 Cervical Squamous Cell Carcinoma GSE9750
Gaedcke Colorectal Rectal Adenocarcinoma GSE20842
Hong Colorectal Colorectal Carcinoma GSE9348
Kaiser Colon Cecum Adenocarcinoma GSE5206
Kaiser Colon Colon Adenocarcinoma GSE5206
Kaiser colon Colon Mucinous Adenocarcinoma GSE5206
Kaiser colon Rectal Adenocarcinoma GSE5206
Kaiser Colon Rectal Mucinous Adenocarcinoma GSE5206
Kaiser Colon Rectosigmoid Adenocarcinoma GSE5206
Sabates-Bellver Colon Colon Adenoma GSE8671
Sabates-Bellver Colon Rectal Adenoma GSE8671
Skrzypczak Colorectal 2 Colon Adenoma Epithelia GSE20916
Skrzypczak Colorectal 2 Colon Adenoma GSE20916
Skrzypczak Colorectal 2 Colon Carcinoma Epithelia GSE20916
Skrzypczak Colorectal 2 Colon Carcinoma GSE20916
Skrzypczak Colorectal Colorectal Adenocarcinoma GSE20916
Skrzypczak Colorectal Colorectal Carcinoma GSE20916
Hu Esophagus Esophageal Squamous Cell Carcinoma GSE20347
Su Esophagus 2 Esophageal Squamous Cell Carcinoma GSE23400
Cho Gastric Diffuse Gastric Adenocarcinoma GSE13861
Cho Gastric Gastric Intestinal Type Adenocarcinoma GSE13861
Cho Gastric Gastric Mixed Adenocarcinoma GSE13861
DErrico Gastric Diffuse Gastric Adenocarcinoma GSE13911
DErrico Gastric Gastric Intestinal Type Adenocarcinoma GSE13911
Estilo Head-Neck Tongue Squamous Cell Carcinoma GSE13601
Sengupta Head-Neck Nasopharyngeal Carcinoma GSE12452
Beroukhim Renal Non-Hereditary Clear Cell Renal Cell Carcinoma GSE14994
Jones Renal Chromophobe Renal Cell Carcinoma GSE15641
Jones Renal Clear Cell Renal Cell Carcinoma GSE15641
Jones Renal Papillary Renal Cell Carcinoma GSE15641
Jones Renal Renal Oncocytoma GSE15641
Jones Renal Renal Pelvis Urothelial Carcinoma GSE15641
Choi Leukemia Chronic Adult T-Cell Leukemia-Lymphoma GSE1466
Coustan-Smith Leukemia B-Cell Childhood Acute Lymphoblastic Leukemia GSE28497

105
Table II – List of cancer microarray datasets used in this study and their GEO accession code (Part II).
Dataset GEO accession
Coustan-Smith Leukemia T-Cell Childhood Acute Lymphoblastic Leukemia GSE28497
Mas Liver Hepatocellular Carcinoma GSE14323
Roessler Liver Hepatocellular Carcinoma GSE14520
Wurmbach Liver Hepatocellular Carcinoma GSE6764
Hou Lung Large Cell Lung Carcinoma GSE19188
Hou Lung Squamous Cell Lung Carcinoma GSE19188
Selamat Lung Lung Adenocarcinoma GSE32863
Su Lung Lung Adenocarcinoma GSE7670
Brune Lymphoma Diffuse Large B-Cell Lymphoma GSE12453
Compagno Lymphoma Germinal Center B-Cell-Like Diffuse Large B-Cell Lymphoma GSE12195
Riker Melanoma Skin Basal Cell Carcinoma GSE7553
Riker Melanoma Skin Squamous Cell Carcinoma GSE7553
Agnelli Myeloma 3 Multiple Myeloma GSE13591
Agnelli Myeloma 3 Plasma Cell Leukemia GSE13591
Zhan Myeloma 3 Monoclonal Gammopathy of Undetermined Significance GSE5900
Zhan Myeloma 3 Smoldering Myeloma GSE5900
Pyeon Multi-cancer Floor of the Mouth Carcinoma GSE6791
Pyeon Multi-cancer Tongue Carcinoma GSE6791
Santegoets Vulva Vulvar Intraepithelial Neoplasia GSE5563
Bonome Ovarian Ovarian Carcinoma GSE26712
Barretina Sarcoma Dedifferentiated Liposarcoma GSE21122
Barretina Sarcoma Leiomyosarcoma GSE21122
Barretina Sarcoma Myxofibrosarcoma GSE21122
Barretina Sarcoma Myxoid-Round Cell Liposarcoma GSE21122
Barretina Sarcoma Pleomorphic Liposarcoma GSE21122
Detwiller Sarcoma Malignant Fibrous Histiocytoma GSE2719

106
Table III – List of tRNA modifying enzymes used in this study.
tRNA Modifying enzymes
ADAT3
IKBKAP
Elp2
Elp3
Elp4
Elp5
Elp6
KIAA1456
KTI12
TRIT1
URM1
CTU2
CTU1
PUS1
PUS3
TRMT1
TRMT2A
TRMT2B
NSUN2
ALKBH8
TRMT10A
TRMT11
TYW1
TRMT12
LCMT2
TRMU
TRMT5
FTSJ1
TRMT61A
QTRT1
TRDMT1
TRMT112
TRMT1L
TRMT10C
PUSL1
PUS7L

107
Table IV - List of cancer microarray datasets used in this study and the deregulation value (M-value) of tRNA modifying enzymes (Part I).
Cancer Datasets ADAT3 ALKBH8 CTU1 CTU2 ELP2 ELP3 ELP4 ELP5 ELP6
Dyrskjot Bladder 3 Superficial Bladder Cancer
Dyrskjot Bladder Infiltrating Bladder Urothelial Carcinoma
Lee Brain Glioblastoma -0.58 -1.26 -0.63
Sun Brain Anaplastic Astrocytoma 0.78 0.54
Sun Brain Glioblastoma 0.54
Sun Brain Oligodendroglioma 1.07 0.55
Bredel Brain 2 Glioblastoma
Biewenga Cervix Cervical Squamous Cell Carcinoma
Pyeon Multi-cancer Cervical Cancer -0.51 0.92 -0.59 0.69 0.65 1.10
Pyeon Multi-cancer Cervical Squamous Cell Carcinoma -0.51 0.92 -0.59 0.69 0.65 1.10
Scotto Cervix 2 Cervical Squamous Cell Carcinoma 1.06
Gaedcke Colorectal Rectal Adenocarcinoma 0.73 0.81
Hong Colorectal Colorectal Carcinoma 0.88 -0.70 -0.64 1.27
Kaiser Colon Cecum Adenocarcinoma 0.83
Kaiser Colon Colon Adenocarcinoma 0.78 -0.52
Kaiser Colon Colon Mucinous Adenocarcinoma 0.77 0.51
Kaiser Colon Rectal Adenocarcinoma 0.79 -0.81
Kaiser Colon Rectal Mucinous Adenocarcinoma -0.57 0.53 0.61 0.56 -0.82
Kaiser Colon Rectosigmoid Adenocarcinoma 0.89
Sabates-Bellver Colon Colon Adenoma 1.21 0.87 0.78
Sabates-Bellver Colon Rectal Adenoma 0.76 0.73 -0.58
Skrzypczak Colorectal 2 Colon Adenoma Epithelia 1.14 -1.00 0.79 0.99
Skrzypczak Colorectal 2 Colon Adenoma 0.90 1.10 0.56 0.58
Skrzypczak Colorectal 2 Colon Carcinoma Epithelia 0.99 -0.70 -0.89
Skrzypczak Colorectal 2 Colon Carcinoma 0.90 1.10 0.56 0.58
Skrzypczak Colorectal Colorectal Adenocarcinoma 0.72
Skrzypczak Colorectal Colorectal Carcinoma 0.77 0.54
Hu Esophagus Esophageal Squamous Cell Carcinoma
Su Esophagus 2 Esophageal Squamous Cell Carcinoma
Cho Gastric Diffuse Gastric Adenocarcinoma
Cho Gastric Gastric Intestinal Type Adenocarcinoma
Cho Gastric Gastric Mixed Adenocarcinoma
DErrico Gastric Diffuse Gastric Adenocarcinoma -1.14 -0.97
DErrico Gastric Gastric Intestinal Type Adenocarcinoma -0.74 -0.73 0.54 0.66
Estilo Head-Neck Tongue Squamous Cell Carcinoma
Sengupta Head-Neck Nasopharyngeal Carcinoma 0.54 0.51
Beroukhim Renal Non-Hereditary Clear Cell Renal Cell Carcinoma
Jones Renal Chromophobe Renal Cell Carcinoma 1.71
Jones Renal Clear Cell Renal Cell Carcinoma 0.55 0.66
Jones Renal Papillary Renal Cell Carcinoma 1.47
Jones Renal Renal Oncocytoma 0.68 1.81
Jones Renal Renal Pelvis Urothelial Carcinoma 1.33
Choi Leukemia Chronic Adult T-Cell Leukemia-Lymphoma -0.81
Coustan-Smith Leukemia B-Cell Childhood Acute Lymphoblastic Leukemia

108
Table V - List of cancer microarray datasets used in this study and the deregulation value (M-value) of tRNA modifying enzymes (Part II).
Cancer Datasets ADAT3 ALKBH8 CTU1 CTU2 ELP2 ELP3 ELP4 ELP5 ELP6
Coustan-Smith Leukemia T-Cell Childhood Acute Lymphoblastic Leukemia
Mas Liver Hepatocellular Carcinoma
Roessler Liver Hepatocellular Carcinoma
Wurmbach Liver Hepatocellular Carcinoma -0.81
Hou Lung Large Cell Lung Carcinoma 0.56
Hou Lung Squamous Cell Lung Carcinoma -1.17 -0.68
Selamat Lung Lung Adenocarcinoma
Su Lung Lung Adenocarcinoma
Brune Lymphoma Diffuse Large B-Cell Lymphoma 0.60 0.69 0.69 0.57
Compagno Lymphoma Germinal Center B-Cell-Like Diffuse Large B-Cell Lymphoma -2.26 -2.83
Riker Melanoma Skin Basal Cell Carcinoma -0.67 0.77 -0.86 0.77 1.45
Riker Melanoma Skin Squamous Cell Carcinoma -0.90 -0.82 1.62
Agnelli Myeloma 3 Multiple Myeloma
Agnelli Myeloma 3 Plasma Cell Leukemia
Zhan Myeloma 3 Monoclonal Gammopathy of Undetermined Significance 0.99 1.59
Zhan Myeloma 3 Smoldering Myeloma 1.60 1.31 0.73 0.60
Pyeon Multi-cancer Floor of the Mouth Carcinoma 0.54 0.66 0.68 0.71
Pyeon Multi-cancer Tongue Carcinoma 0.82
Santegoets Vulva Vulvar Intraepithelial Neoplasia
Bonome Ovarian Ovarian Carcinoma -0.67 0.82
Barretina Sarcoma Dedifferentiated Liposarcoma
Barretina Sarcoma Leiomyosarcoma
Barretina Sarcoma Myxofibrosarcoma
Barretina Sarcoma Myxoid-Round Cell Liposarcoma
Barretina Sarcoma Pleomorphic Liposarcoma
Detwiller Sarcoma Malignant Fibrous Histiocytoma
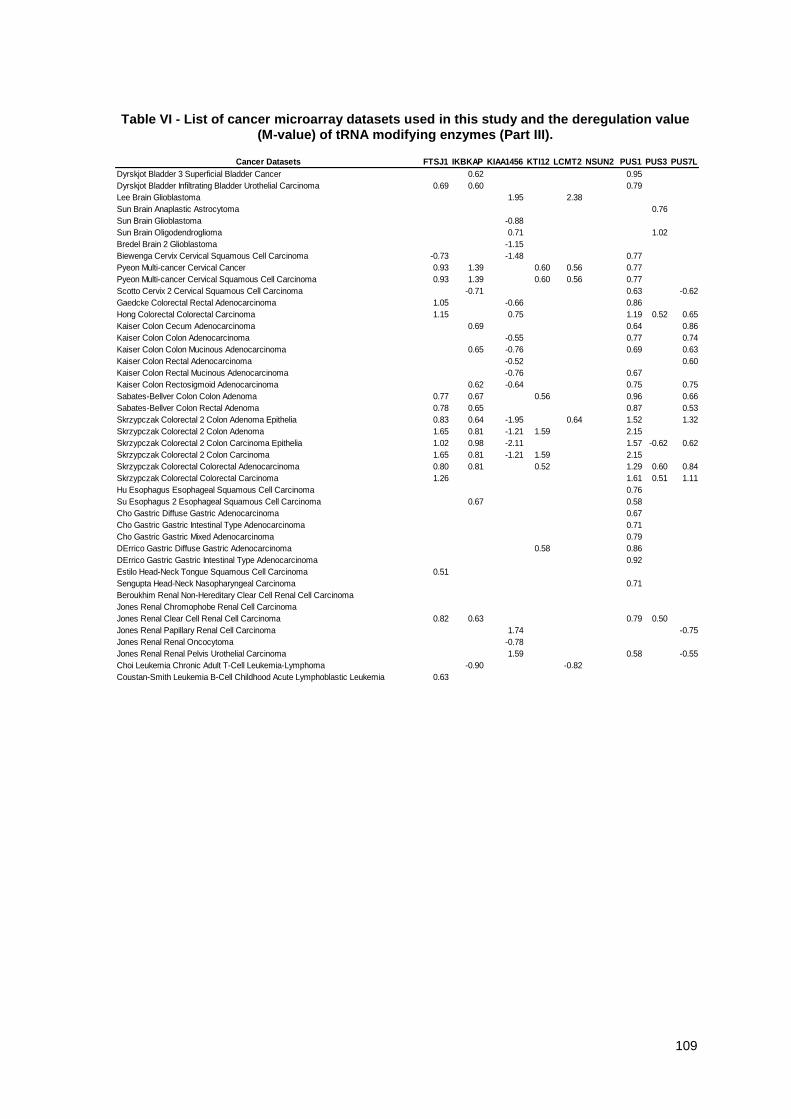
109
Table VI - List of cancer microarray datasets used in this study and the deregulation value (M-value) of tRNA modifying enzymes (Part III).
Cancer Datasets FTSJ1 IKBKAP KIAA1456 KTI12 LCMT2 NSUN2 PUS1 PUS3 PUS7L
Dyrskjot Bladder 3 Superficial Bladder Cancer 0.62 0.95
Dyrskjot Bladder Infiltrating Bladder Urothelial Carcinoma 0.69 0.60 0.79
Lee Brain Glioblastoma 1.95 2.38
Sun Brain Anaplastic Astrocytoma 0.76
Sun Brain Glioblastoma -0.88
Sun Brain Oligodendroglioma 0.71 1.02
Bredel Brain 2 Glioblastoma -1.15
Biewenga Cervix Cervical Squamous Cell Carcinoma -0.73 -1.48 0.77
Pyeon Multi-cancer Cervical Cancer 0.93 1.39 0.60 0.56 0.77
Pyeon Multi-cancer Cervical Squamous Cell Carcinoma 0.93 1.39 0.60 0.56 0.77
Scotto Cervix 2 Cervical Squamous Cell Carcinoma -0.71 0.63 -0.62
Gaedcke Colorectal Rectal Adenocarcinoma 1.05 -0.66 0.86
Hong Colorectal Colorectal Carcinoma 1.15 0.75 1.19 0.52 0.65
Kaiser Colon Cecum Adenocarcinoma 0.69 0.64 0.86
Kaiser Colon Colon Adenocarcinoma -0.55 0.77 0.74
Kaiser Colon Colon Mucinous Adenocarcinoma 0.65 -0.76 0.69 0.63
Kaiser Colon Rectal Adenocarcinoma -0.52 0.60
Kaiser Colon Rectal Mucinous Adenocarcinoma -0.76 0.67
Kaiser Colon Rectosigmoid Adenocarcinoma 0.62 -0.64 0.75 0.75
Sabates-Bellver Colon Colon Adenoma 0.77 0.67 0.56 0.96 0.66
Sabates-Bellver Colon Rectal Adenoma 0.78 0.65 0.87 0.53
Skrzypczak Colorectal 2 Colon Adenoma Epithelia 0.83 0.64 -1.95 0.64 1.52 1.32
Skrzypczak Colorectal 2 Colon Adenoma 1.65 0.81 -1.21 1.59 2.15
Skrzypczak Colorectal 2 Colon Carcinoma Epithelia 1.02 0.98 -2.11 1.57 -0.62 0.62
Skrzypczak Colorectal 2 Colon Carcinoma 1.65 0.81 -1.21 1.59 2.15
Skrzypczak Colorectal Colorectal Adenocarcinoma 0.80 0.81 0.52 1.29 0.60 0.84
Skrzypczak Colorectal Colorectal Carcinoma 1.26 1.61 0.51 1.11
Hu Esophagus Esophageal Squamous Cell Carcinoma 0.76
Su Esophagus 2 Esophageal Squamous Cell Carcinoma 0.67 0.58
Cho Gastric Diffuse Gastric Adenocarcinoma 0.67
Cho Gastric Gastric Intestinal Type Adenocarcinoma 0.71
Cho Gastric Gastric Mixed Adenocarcinoma 0.79
DErrico Gastric Diffuse Gastric Adenocarcinoma 0.58 0.86
DErrico Gastric Gastric Intestinal Type Adenocarcinoma 0.92
Estilo Head-Neck Tongue Squamous Cell Carcinoma 0.51
Sengupta Head-Neck Nasopharyngeal Carcinoma 0.71
Beroukhim Renal Non-Hereditary Clear Cell Renal Cell Carcinoma
Jones Renal Chromophobe Renal Cell Carcinoma
Jones Renal Clear Cell Renal Cell Carcinoma 0.82 0.63 0.79 0.50
Jones Renal Papillary Renal Cell Carcinoma 1.74 -0.75
Jones Renal Renal Oncocytoma -0.78
Jones Renal Renal Pelvis Urothelial Carcinoma 1.59 0.58 -0.55
Choi Leukemia Chronic Adult T-Cell Leukemia-Lymphoma -0.90 -0.82
Coustan-Smith Leukemia B-Cell Childhood Acute Lymphoblastic Leukemia 0.63

110
Table VII - List of cancer microarray datasets used in this study and the deregulation value (M-value) of tRNA modifying enzymes (Part IV).
Cancer Datasets FTSJ1 IKBKAP KIAA1456 KTI12 LCMT2 NSUN2 PUS1 PUS3 PUS7L
Coustan-Smith Leukemia T-Cell Childhood Acute Lymphoblastic Leukemia 0.65 0.81 0.73
Mas Liver Hepatocellular Carcinoma -0.80 -0.69 -0.70 -0.76
Roessler Liver Hepatocellular Carcinoma 0.57 0.75 0.93
Wurmbach Liver Hepatocellular Carcinoma 0.65 -0.72 0.99
Hou Lung Large Cell Lung Carcinoma 0.75 0.83
Hou Lung Squamous Cell Lung Carcinoma -0.60 0.82 0.76
Selamat Lung Lung Adenocarcinoma 0.66
Su Lung Lung Adenocarcinoma 0.52 -0.56 0.83
Brune Lymphoma Diffuse Large B-Cell Lymphoma -0.52 0.52 0.91
Compagno Lymphoma Germinal Center B-Cell-Like Diffuse Large B-Cell Lymphoma -2.68 -1.76
Riker Melanoma Skin Basal Cell Carcinoma 0.56 1.43 0.53 1.05
Riker Melanoma Skin Squamous Cell Carcinoma 0.61 -1.87 0.57 0.54
Agnelli Myeloma 3 Multiple Myeloma 0.72
Agnelli Myeloma 3 Plasma Cell Leukemia 0.51 0.92 0.76
Zhan Myeloma 3 Monoclonal Gammopathy of Undetermined Significance -0.64 -0.54 0.76
Zhan Myeloma 3 Smoldering Myeloma 0.62 -1.03 0.72 0.87 0.58
Pyeon Multi-cancer Floor of the Mouth Carcinoma 0.55 1.27 -0.55 0.73 1.07
Pyeon Multi-cancer Tongue Carcinoma 0.65 0.59 -0.54 0.88
Santegoets Vulva Vulvar Intraepithelial Neoplasia 0.58 1.00 0.86 0.53
Bonome Ovarian Ovarian Carcinoma 0.51 -1.49 -0.68
Barretina Sarcoma Dedifferentiated Liposarcoma 0.73
Barretina Sarcoma Leiomyosarcoma 0.51 0.91
Barretina Sarcoma Myxofibrosarcoma 1.45 1.38
Barretina Sarcoma Myxoid-Round Cell Liposarcoma 1.11
Barretina Sarcoma Pleomorphic Liposarcoma 0.73 1.09
Detwiller Sarcoma Malignant Fibrous Histiocytoma 0.95

111
Table VIII - List of cancer microarray datasets used in this study and the deregulation value (M-value) of tRNA modifying enzymes (Part V).
Cancer Datasets PUSL1 QTRT1 TRDMT1 TRIT1 TRMT1 TRMT10A TRMT10C TRMT11 TRMT112
Dyrskjot Bladder 3 Superficial Bladder Cancer 0.82 0.78 0.77
Dyrskjot Bladder Infiltrating Bladder Urothelial Carcinoma 0.82 1.08
Lee Brain Glioblastoma 1.02 -0.73
Sun Brain Anaplastic Astrocytoma 0.77
Sun Brain Glioblastoma
Sun Brain Oligodendroglioma
Bredel Brain 2 Glioblastoma -0.54
Biewenga Cervix Cervical Squamous Cell Carcinoma -1.09
Pyeon Multi-cancer Cervical Cancer 0.83 0.60 0.65 1.79 1.87
Pyeon Multi-cancer Cervical Squamous Cell Carcinoma 0.83 0.60 0.65 1.79 1.87
Scotto Cervix 2 Cervical Squamous Cell Carcinoma 1.16 -1.20 -0.83
Gaedcke Colorectal Rectal Adenocarcinoma 0.58 0.74 1.07
Hong Colorectal Colorectal Carcinoma 0.67 0.67 0.52 1.95 -0.75 0.92
Kaiser Colon Cecum Adenocarcinoma 0.53 0.58 0.73
Kaiser Colon Colon Adenocarcinoma 0.60 0.55 0.94
Kaiser Colon Colon Mucinous Adenocarcinoma 0.54 0.90
Kaiser Colon Rectal Adenocarcinoma -0.60 0.75
Kaiser Colon Rectal Mucinous Adenocarcinoma 0.66 0.67 0.81
Kaiser Colon Rectosigmoid Adenocarcinoma 0.51 -0.53 0.80
Sabates-Bellver Colon Colon Adenoma 1.11 0.80 1.63 0.71 0.76 0.81
Sabates-Bellver Colon Rectal Adenoma 0.58 0.74 0.57 1.31 0.63 0.74
Skrzypczak Colorectal 2 Colon Adenoma Epithelia 1.03 0.84 1.26 1.90 -0.88 0.76 0.80 1.15
Skrzypczak Colorectal 2 Colon Adenoma 1.82 0.95 2.73 -0.53 1.15 1.17 1.64
Skrzypczak Colorectal 2 Colon Carcinoma Epithelia 0.82 0.56 1.56 1.03 1.29 1.31
Skrzypczak Colorectal 2 Colon Carcinoma 1.82 0.95 2.73 -0.53 1.15 1.17 1.64
Skrzypczak Colorectal Colorectal Adenocarcinoma 0.61 1.01 0.93 0.90 0.75 0.69 0.76
Skrzypczak Colorectal Colorectal Carcinoma 0.93 0.73 1.02 0.95 0.98 1.19
Hu Esophagus Esophageal Squamous Cell Carcinoma 0.53 0.54
Su Esophagus 2 Esophageal Squamous Cell Carcinoma 0.50 0.60
Cho Gastric Diffuse Gastric Adenocarcinoma 0.53
Cho Gastric Gastric Intestinal Type Adenocarcinoma
Cho Gastric Gastric Mixed Adenocarcinoma 0.60
DErrico Gastric Diffuse Gastric Adenocarcinoma 0.65 1.20 0.68
DErrico Gastric Gastric Intestinal Type Adenocarcinoma 0.52 -0.75 1.21 0.55
Estilo Head-Neck Tongue Squamous Cell Carcinoma -0.74 0.56
Sengupta Head-Neck Nasopharyngeal Carcinoma 0.52 0.60
Beroukhim Renal Non-Hereditary Clear Cell Renal Cell Carcinoma 0.68
Jones Renal Chromophobe Renal Cell Carcinoma -0.57
Jones Renal Clear Cell Renal Cell Carcinoma 0.60 0.68 1.00 0.52 1.21
Jones Renal Papillary Renal Cell Carcinoma 0.64
Jones Renal Renal Oncocytoma 0.50 0.61
Jones Renal Renal Pelvis Urothelial Carcinoma 0.69 0.86
Choi Leukemia Chronic Adult T-Cell Leukemia-Lymphoma -0.96
Coustan-Smith Leukemia B-Cell Childhood Acute Lymphoblastic Leukemia 1.01

112
Table IX - List of cancer microarray datasets used in this study and the deregulation value (M-value) of tRNA modifying enzymes (Part VI).
Cancer Datasets PUSL1 QTRT1 TRDMT1 TRIT1 TRMT1 TRMT10A TRMT10C TRMT11 TRMT112
Coustan-Smith Leukemia T-Cell Childhood Acute Lymphoblastic Leukemia 1.20 0.72
Mas Liver Hepatocellular Carcinoma -0.82 -0.90
Roessler Liver Hepatocellular Carcinoma 0.84 0.62
Wurmbach Liver Hepatocellular Carcinoma 0.66 -0.68
Hou Lung Large Cell Lung Carcinoma 0.81 0.85 0.65
Hou Lung Squamous Cell Lung Carcinoma -0.72 0.66 -0.57 0.54
Selamat Lung Lung Adenocarcinoma 0.69
Su Lung Lung Adenocarcinoma 1.27 0.57
Brune Lymphoma Diffuse Large B-Cell Lymphoma 0.54 0.78 0.54 1.13
Compagno Lymphoma Germinal Center B-Cell-Like Diffuse Large B-Cell Lymphoma -1.98
Riker Melanoma Skin Basal Cell Carcinoma -1.12 0.52
Riker Melanoma Skin Squamous Cell Carcinoma 0.52
Agnelli Myeloma 3 Multiple Myeloma 0.60 0.56
Agnelli Myeloma 3 Plasma Cell Leukemia 0.81 0.70 0.72
Zhan Myeloma 3 Monoclonal Gammopathy of Undetermined Significance 0.85 0.53
Zhan Myeloma 3 Smoldering Myeloma 0.60 1.09 0.60 0.86 0.65
Pyeon Multi-cancer Floor of the Mouth Carcinoma 0.57 1.10 0.94 0.57 0.93
Pyeon Multi-cancer Tongue Carcinoma 0.62 0.57 0.84
Santegoets Vulva Vulvar Intraepithelial Neoplasia 1.04 0.55
Bonome Ovarian Ovarian Carcinoma 0.84 0.63 -0.66
Barretina Sarcoma Dedifferentiated Liposarcoma 0.60
Barretina Sarcoma Leiomyosarcoma 0.71 0.86
Barretina Sarcoma Myxofibrosarcoma 0.94
Barretina Sarcoma Myxoid-Round Cell Liposarcoma 0.64 1.10 0.71
Barretina Sarcoma Pleomorphic Liposarcoma 0.91 0.61
Detwiller Sarcoma Malignant Fibrous Histiocytoma 1.15 1.59

113
Table X - List of cancer microarray datasets used in this study and the deregulation value (M-value) of tRNA modifying enzymes (Part VII).
Cancer Datasets TRMT12 TRMT1L TRMT2A TRMT2B TRMT5 TRMT61A TRMU TYW1 URM1
Dyrskjot Bladder 3 Superficial Bladder Cancer 0.78 0.57
Dyrskjot Bladder Infiltrating Bladder Urothelial Carcinoma 0.86
Lee Brain Glioblastoma -0.93 -0.62
Sun Brain Anaplastic Astrocytoma 1.04 0.76
Sun Brain Glioblastoma
Sun Brain Oligodendroglioma 0.92
Bredel Brain 2 Glioblastoma -0.91 -1.79
Biewenga Cervix Cervical Squamous Cell Carcinoma 0.59
Pyeon Multi-cancer Cervical Cancer 0.94 0.99 1.38
Pyeon Multi-cancer Cervical Squamous Cell Carcinoma 0.94 0.99 1.38
Scotto Cervix 2 Cervical Squamous Cell Carcinoma -0.58
Gaedcke Colorectal Rectal Adenocarcinoma 0.65 0.62
Hong Colorectal Colorectal Carcinoma 0.50 0.97 0.61 0.60
Kaiser Colon Cecum Adenocarcinoma 0.59 0.58
Kaiser Colon Colon Adenocarcinoma 0.81
Kaiser Colon Colon Mucinous Adenocarcinoma 0.63 0.70
Kaiser Colon Rectal Adenocarcinoma -0.53
Kaiser Colon Rectal Mucinous Adenocarcinoma 0.75 0.79
Kaiser Colon Rectosigmoid Adenocarcinoma 0.82
Sabates-Bellver Colon Colon Adenoma 0.79 1.40 0.65 0.58
Sabates-Bellver Colon Rectal Adenoma 0.56 0.54 0.72 0.54 0.68
Skrzypczak Colorectal 2 Colon Adenoma Epithelia 1.66 0.52 0.50
Skrzypczak Colorectal 2 Colon Adenoma 0.54 0.82 0.76
Skrzypczak Colorectal 2 Colon Carcinoma Epithelia 0.50 -0.78 0.53
Skrzypczak Colorectal 2 Colon Carcinoma 0.54 0.82 0.76
Skrzypczak Colorectal Colorectal Adenocarcinoma 1.21
Skrzypczak Colorectal Colorectal Carcinoma 1.04
Hu Esophagus Esophageal Squamous Cell Carcinoma 0.88
Su Esophagus 2 Esophageal Squamous Cell Carcinoma
Cho Gastric Diffuse Gastric Adenocarcinoma
Cho Gastric Gastric Intestinal Type Adenocarcinoma 0.63
Cho Gastric Gastric Mixed Adenocarcinoma 0.73
DErrico Gastric Diffuse Gastric Adenocarcinoma
DErrico Gastric Gastric Intestinal Type Adenocarcinoma 0.61 0.54
Estilo Head-Neck Tongue Squamous Cell Carcinoma 0.58
Sengupta Head-Neck Nasopharyngeal Carcinoma -0.58
Beroukhim Renal Non-Hereditary Clear Cell Renal Cell Carcinoma
Jones Renal Chromophobe Renal Cell Carcinoma -0.51 0.99
Jones Renal Clear Cell Renal Cell Carcinoma 0.52 0.79 0.72 0.87 2.90 0.82
Jones Renal Papillary Renal Cell Carcinoma 2.48
Jones Renal Renal Oncocytoma
Jones Renal Renal Pelvis Urothelial Carcinoma 2.33
Choi Leukemia Chronic Adult T-Cell Leukemia-Lymphoma -0.57 -1.42
Coustan-Smith Leukemia B-Cell Childhood Acute Lymphoblastic Leukemia 0.51 1.99 -1.04

114
Table XI - List of cancer microarray datasets used in this study and the deregulation value (M-value) of tRNA modifying enzymes (Part VIII).
Cancer Datasets TRMT12 TRMT1L TRMT2A TRMT2B TRMT5 TRMT61A TRMU TYW1 URM1
Coustan-Smith Leukemia T-Cell Childhood Acute Lymphoblastic Leukemia 1.65 -0.71
Mas Liver Hepatocellular Carcinoma -0.60 0.67
Roessler Liver Hepatocellular Carcinoma
Wurmbach Liver Hepatocellular Carcinoma 0.83 0.60
Hou Lung Large Cell Lung Carcinoma 0.53 0.61 0.72 0.52
Hou Lung Squamous Cell Lung Carcinoma 0.92
Selamat Lung Lung Adenocarcinoma
Su Lung Lung Adenocarcinoma 0.85 0.72
Brune Lymphoma Diffuse Large B-Cell Lymphoma 0.79
Compagno Lymphoma Germinal Center B-Cell-Like Diffuse Large B-Cell Lymphoma
Riker Melanoma Skin Basal Cell Carcinoma 0.71 0.56 0.51
Riker Melanoma Skin Squamous Cell Carcinoma -0.75 1.49
Agnelli Myeloma 3 Multiple Myeloma
Agnelli Myeloma 3 Plasma Cell Leukemia 0.54
Zhan Myeloma 3 Monoclonal Gammopathy of Undetermined Significance 0.89 0.53
Zhan Myeloma 3 Smoldering Myeloma 1.31 0.91 0.61 0.51
Pyeon Multi-cancer Floor of the Mouth Carcinoma 1.04 1.10 0.52
Pyeon Multi-cancer Tongue Carcinoma 0.74
Santegoets Vulva Vulvar Intraepithelial Neoplasia 0.60 0.88 0.75
Bonome Ovarian Ovarian Carcinoma 0.58 -1.73 0.57 -0.70
Barretina Sarcoma Dedifferentiated Liposarcoma 0.72
Barretina Sarcoma Leiomyosarcoma 0.80
Barretina Sarcoma Myxofibrosarcoma 0.80 0.96
Barretina Sarcoma Myxoid-Round Cell Liposarcoma 0.99
Barretina Sarcoma Pleomorphic Liposarcoma 1.03
Detwiller Sarcoma Malignant Fibrous Histiocytoma 0.50


![Estrutura Tonal - Harmonia -Pascoal[1]](https://static.fdocumentos.tips/doc/165x107/5571f37149795947648e0827/estrutura-tonal-harmonia-pascoal1.jpg)