Eficiência Energética na Indústria de Cimento · 2019-10-14 · Increased coating formation in...
37
Realização 20 a 22 de Junho de 2016 - São Paulo/SP Eficiência Energética na Indústria de Cimento Mauricio Henriques Jr. Instituto Nacional de Tecnologia (INT)
Transcript of Eficiência Energética na Indústria de Cimento · 2019-10-14 · Increased coating formation in...
Realização
20 a 22 de Junho de 2016 - São Paulo/SP
Eficiência Energética
na Indústria de
Cimento
Mauricio Henriques Jr.
Instituto Nacional de Tecnologia (INT)
20 a 22 de Junho de 2016
Sumário
Introdução
Evolução do uso de energia e do consumo específico no
setor
Comparação internacional
Tecnologias de uso eficiente de energia (Best Available
Tecnologies) e discussão de alguns cases
Compilação das tecnologias aplicáveis no parque brasileiro,
e comentário finais
20 a 22 de Junho de 2016
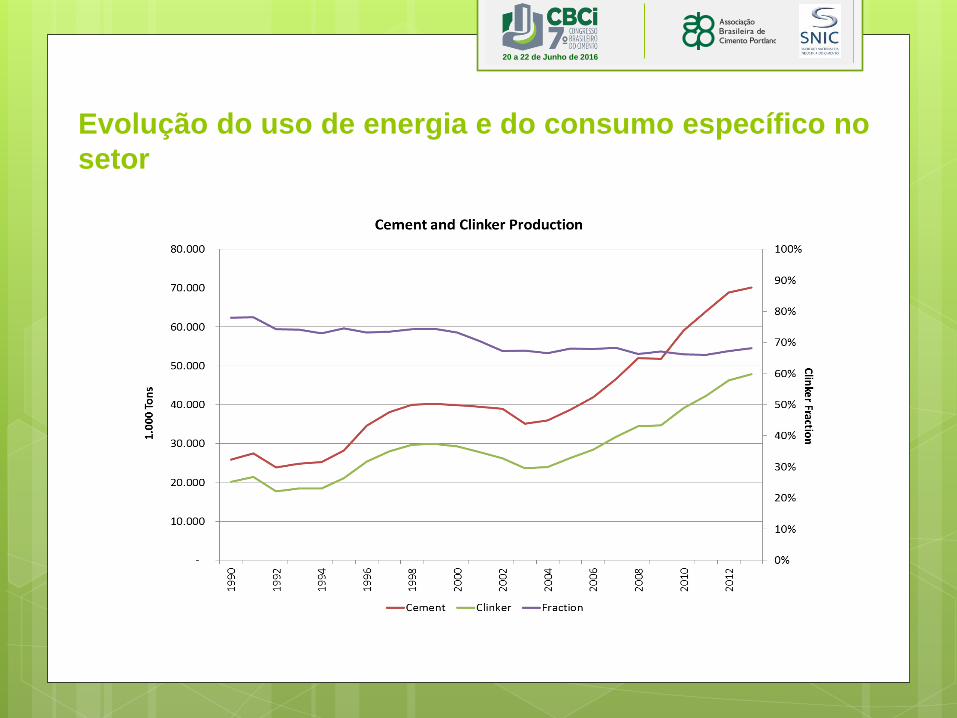
Evolução do uso de energia e do consumo específico no
setor
20 a 22 de Junho de 2016
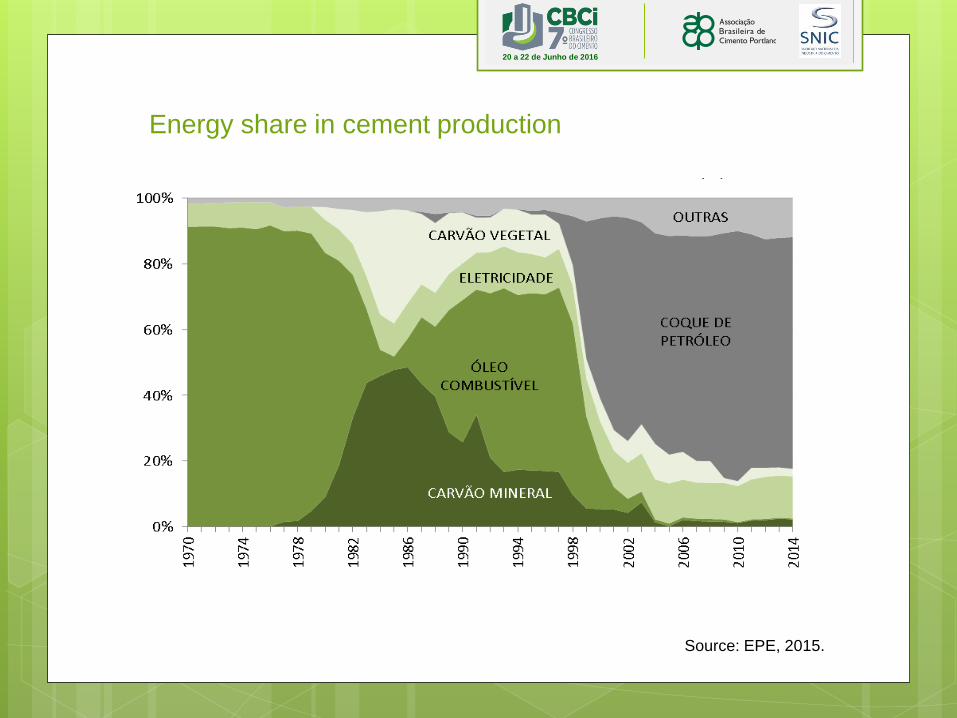
Energy share in cement production
Source: EPE, 2015.
20 a 22 de Junho de 2016
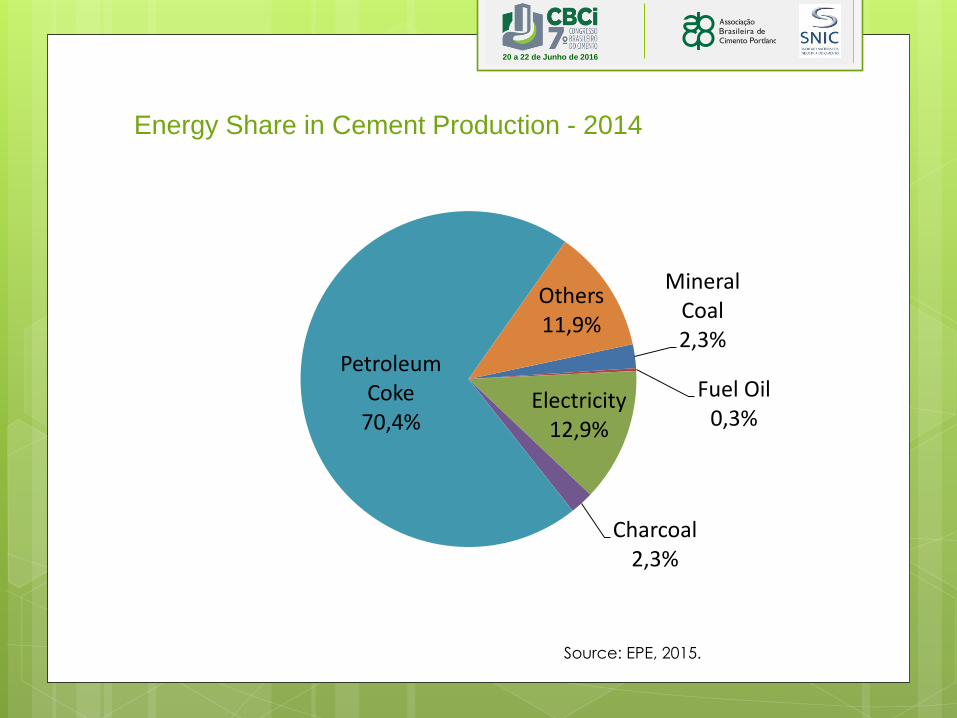
Mineral Coal 2,3%
Fuel Oil 0,3%
Electricity 12,9%
Charcoal 2,3%
Petroleum Coke
70,4%
Others 11,9%
Energy Share in Cement Production - 2014
Source: EPE, 2015.
20 a 22 de Junho de 2016
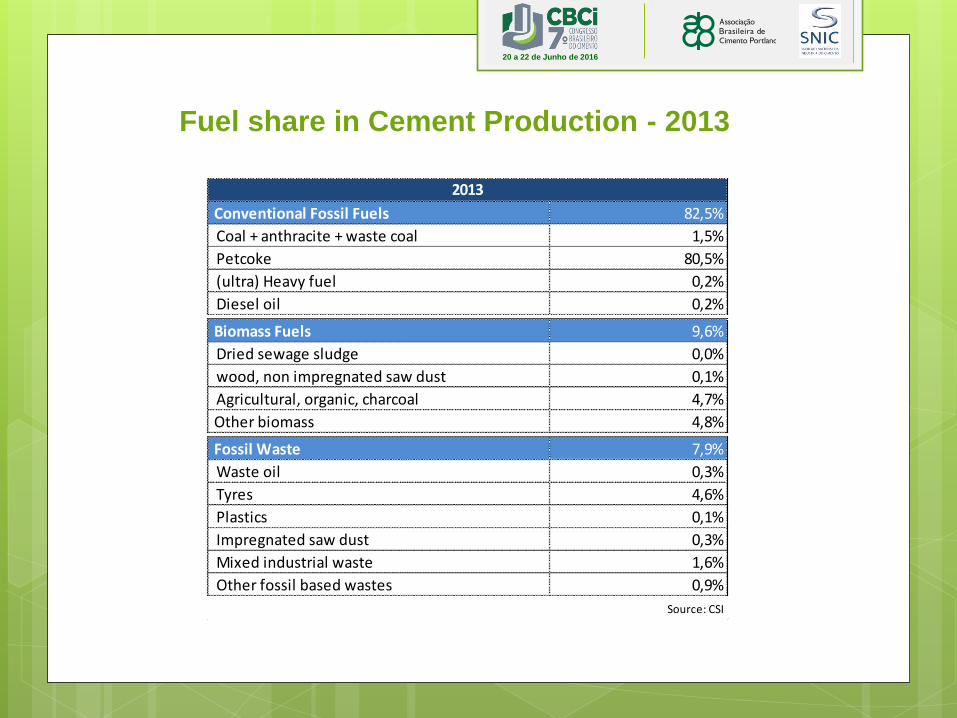
Fuel share in Cement Production - 2013
Conventional Fossil Fuels 82,5%
Coal + anthracite + waste coal 1,5%
Petcoke 80,5%
(ultra) Heavy fuel 0,2%
Diesel oil 0,2%
Biomass Fuels 9,6%
Dried sewage sludge 0,0%
wood, non impregnated saw dust 0,1%
Agricultural, organic, charcoal 4,7%
Other biomass 4,8%
Fossil Waste 7,9%
Waste oil 0,3%
Tyres 4,6%
Plastics 0,1%
Impregnated saw dust 0,3%
Mixed industrial waste 1,6%
Other fossil based wastes 0,9%
2013
Source: CSI
20 a 22 de Junho de 2016
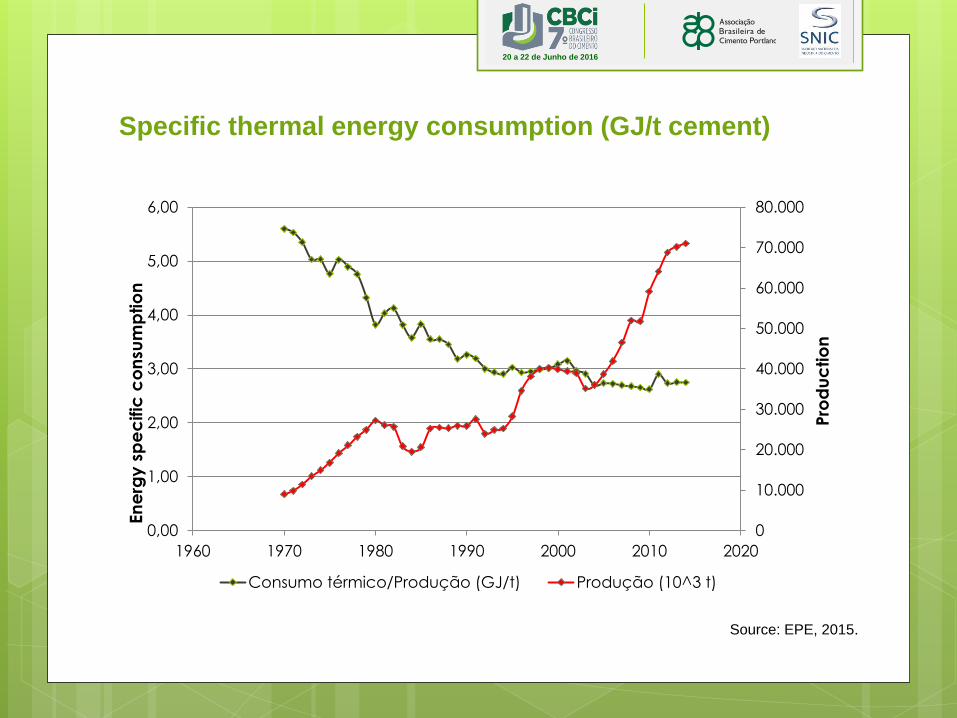
Specific thermal energy consumption (GJ/t cement)
Source: EPE, 2015.
0
10.000
20.000
30.000
40.000
50.000
60.000
70.000
80.000
0,00
1,00
2,00
3,00
4,00
5,00
6,00
1960 1970 1980 1990 2000 2010 2020
Pro
du
ctio
n
En
erg
y s
pe
cific
co
nsu
mp
tio
n
Consumo térmico/Produção (GJ/t) Produção (10^3 t)
20 a 22 de Junho de 2016
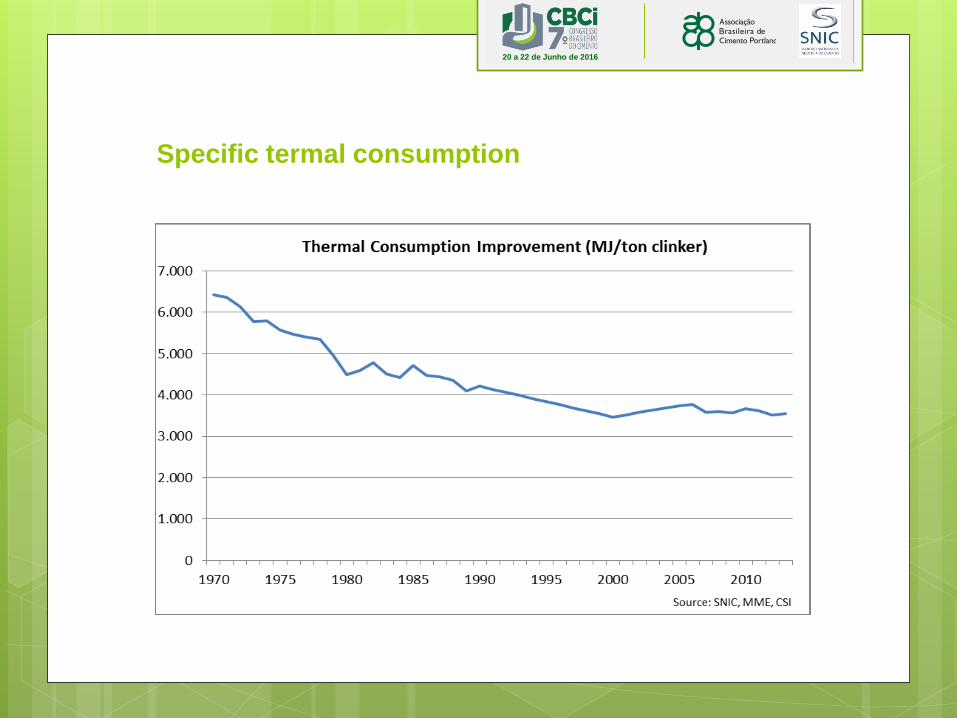
Specific termal consumption
20 a 22 de Junho de 2016
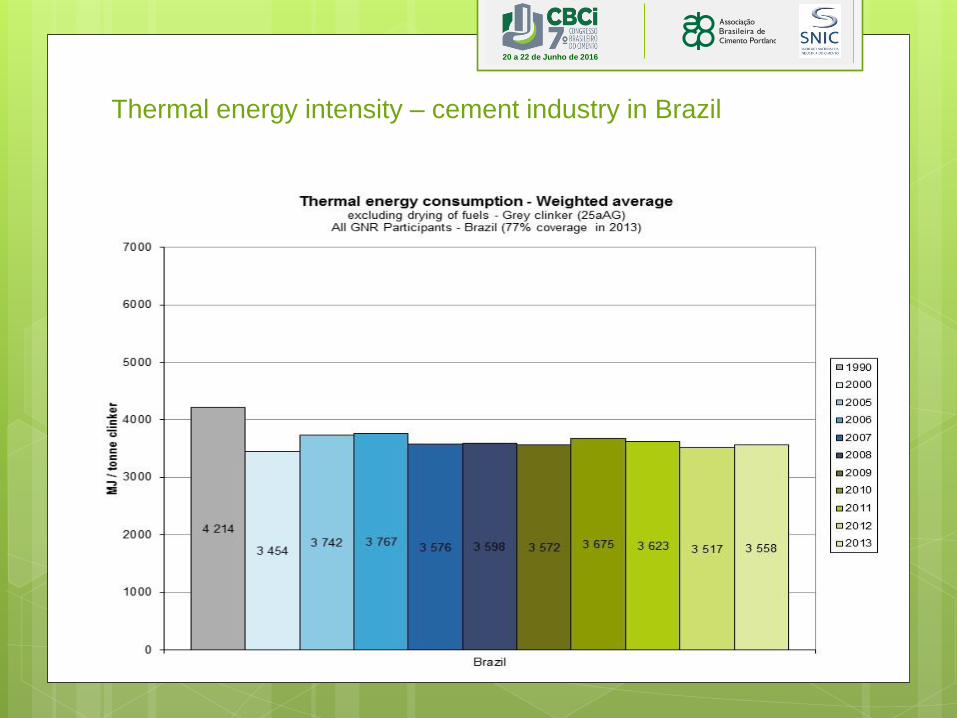
Thermal energy intensity – cement industry in Brazil
Fonte: CSI (2014)
20 a 22 de Junho de 2016
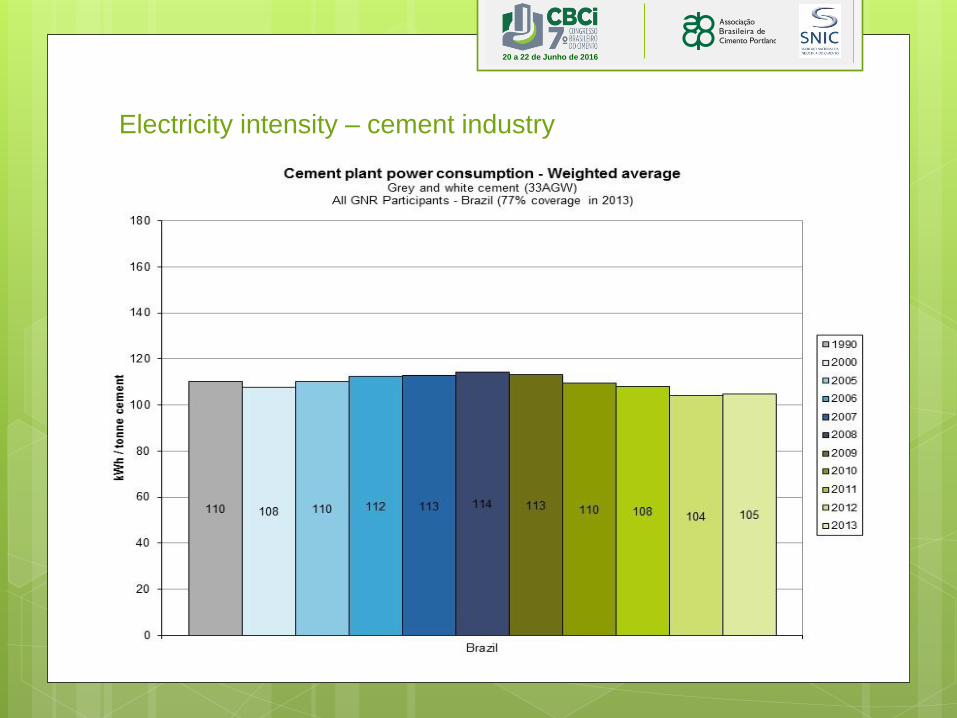
Electricity intensity – cement industry
Fonte: CSI (2014)
20 a 22 de Junho de 2016
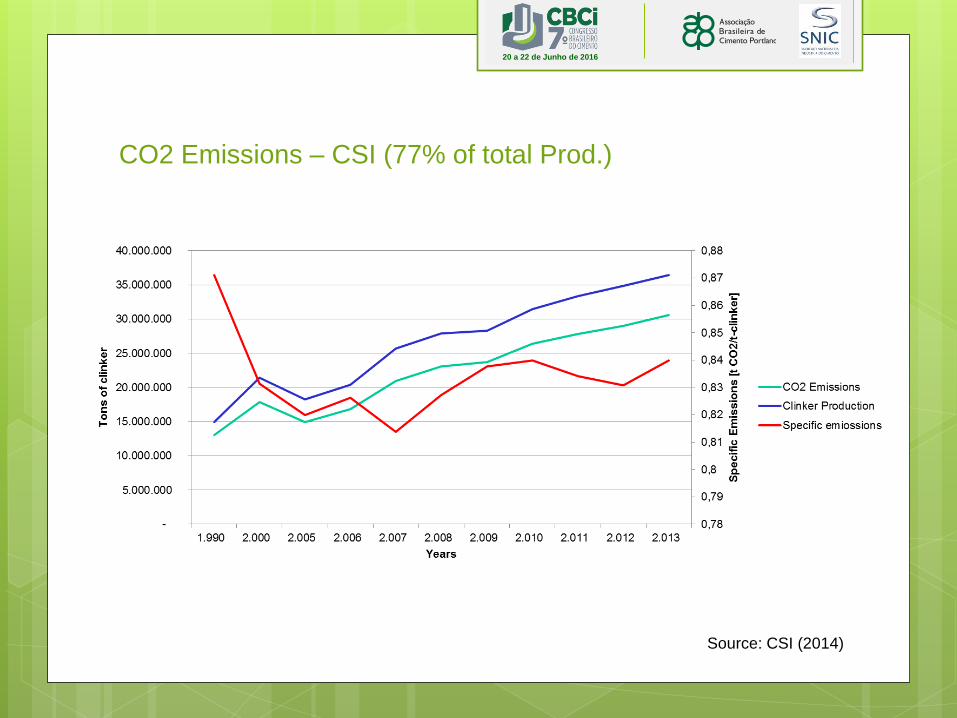
CO2 Emissions – CSI (77% of total Prod.)
Source: CSI (2014)
20 a 22 de Junho de 2016
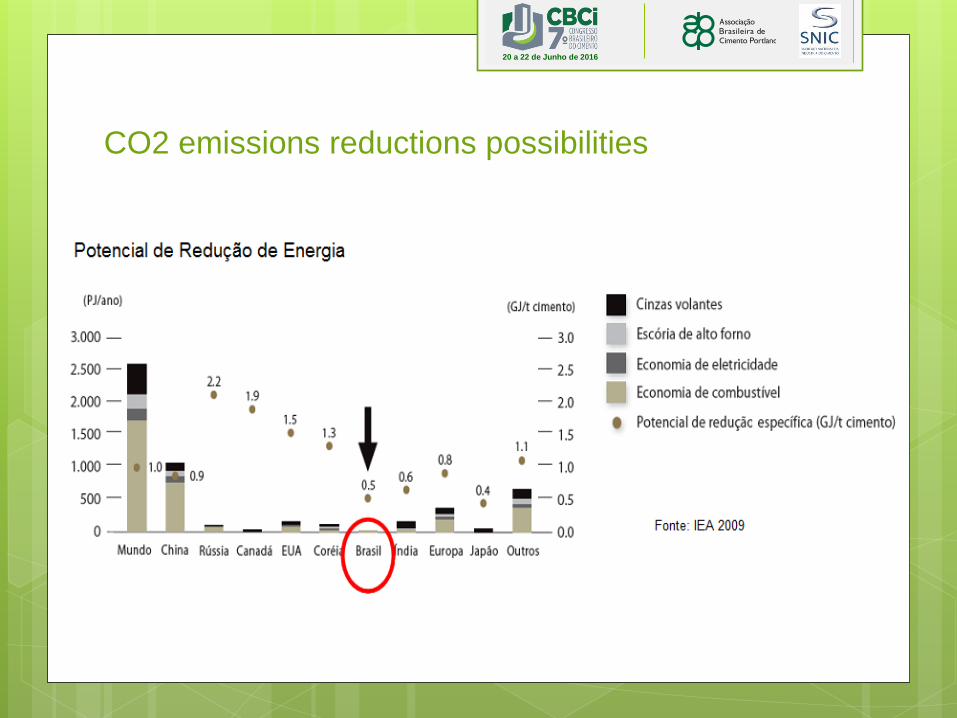
CO2 emissions reductions possibilities
20 a 22 de Junho de 2016
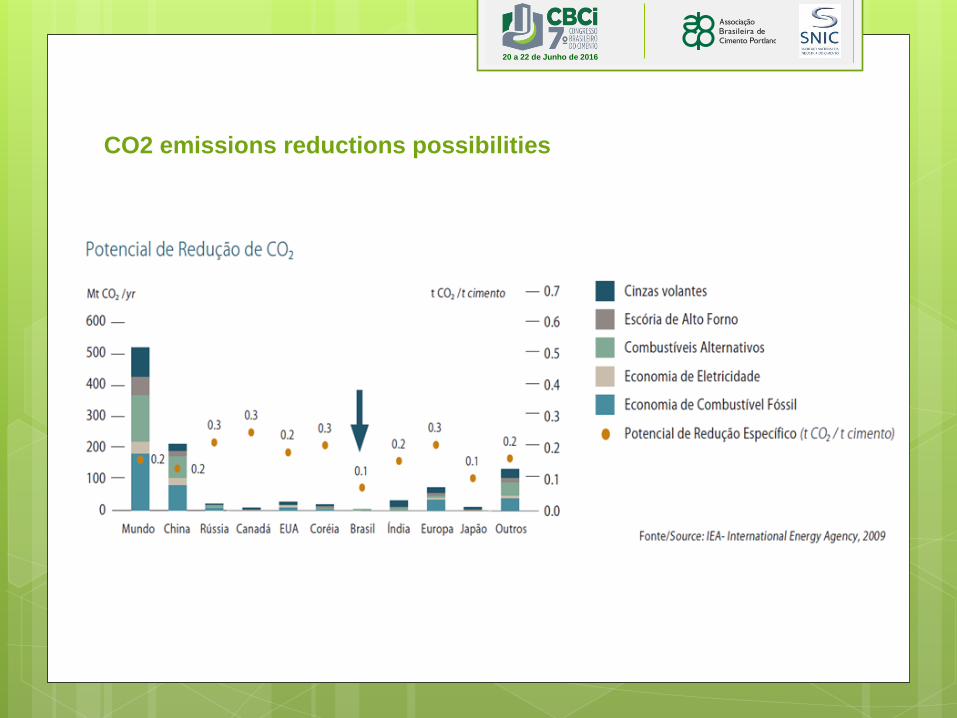
CO2 emissions reductions possibilities
20 a 22 de Junho de 2016
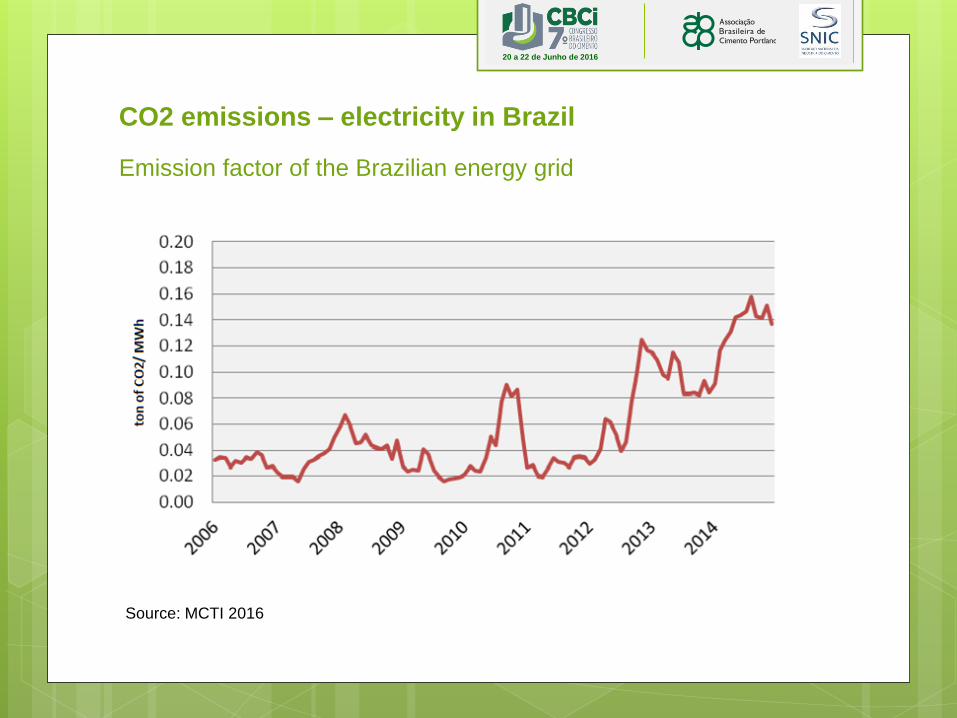
CO2 emissions – electricity in Brazil
Source: MCTI 2016
Emission factor of the Brazilian energy grid
20 a 22 de Junho de 2016
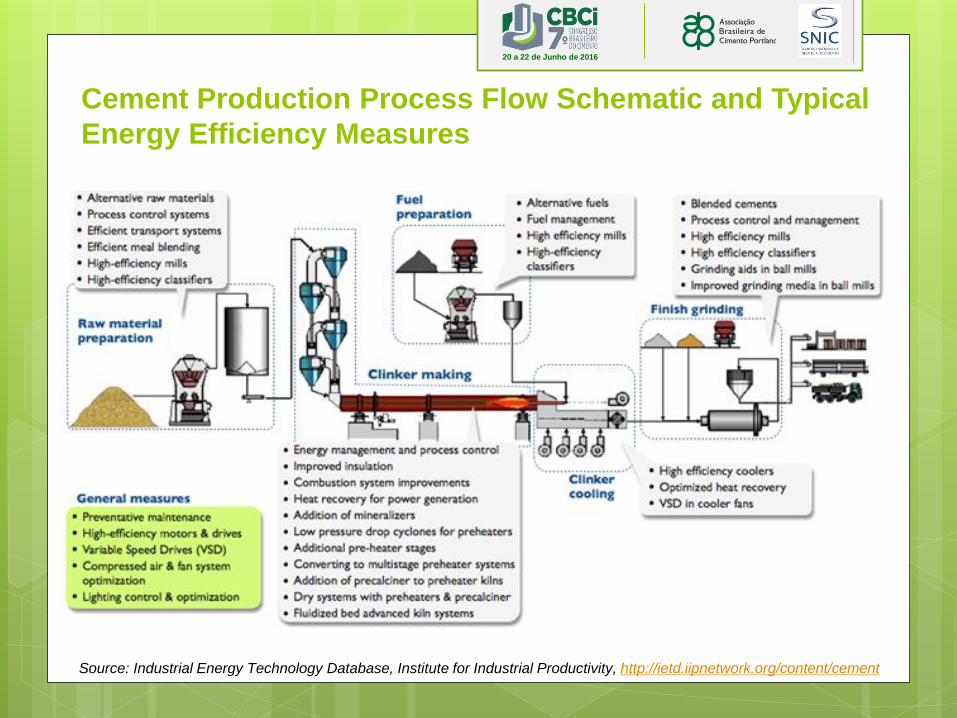
Cement Production Process Flow Schematic and Typical
Energy Efficiency Measures
Source: Industrial Energy Technology Database, Institute for Industrial Productivity, http://ietd.iipnetwork.org/content/cement
20 a 22 de Junho de 2016
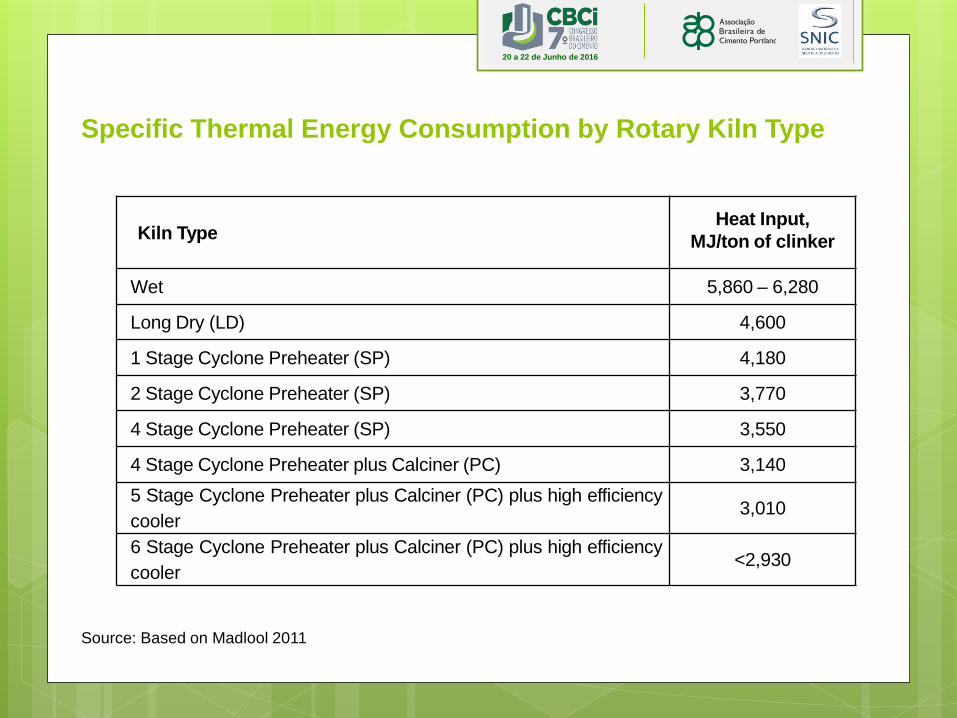
Specific Thermal Energy Consumption by Rotary Kiln Type
Kiln Type Heat Input,
MJ/ton of clinker
Wet 5,860 – 6,280
Long Dry (LD) 4,600
1 Stage Cyclone Preheater (SP) 4,180
2 Stage Cyclone Preheater (SP) 3,770
4 Stage Cyclone Preheater (SP) 3,550
4 Stage Cyclone Preheater plus Calciner (PC) 3,140
5 Stage Cyclone Preheater plus Calciner (PC) plus high efficiency
cooler 3,010
6 Stage Cyclone Preheater plus Calciner (PC) plus high efficiency
cooler <2,930
Source: Based on Madlool 2011
20 a 22 de Junho de 2016
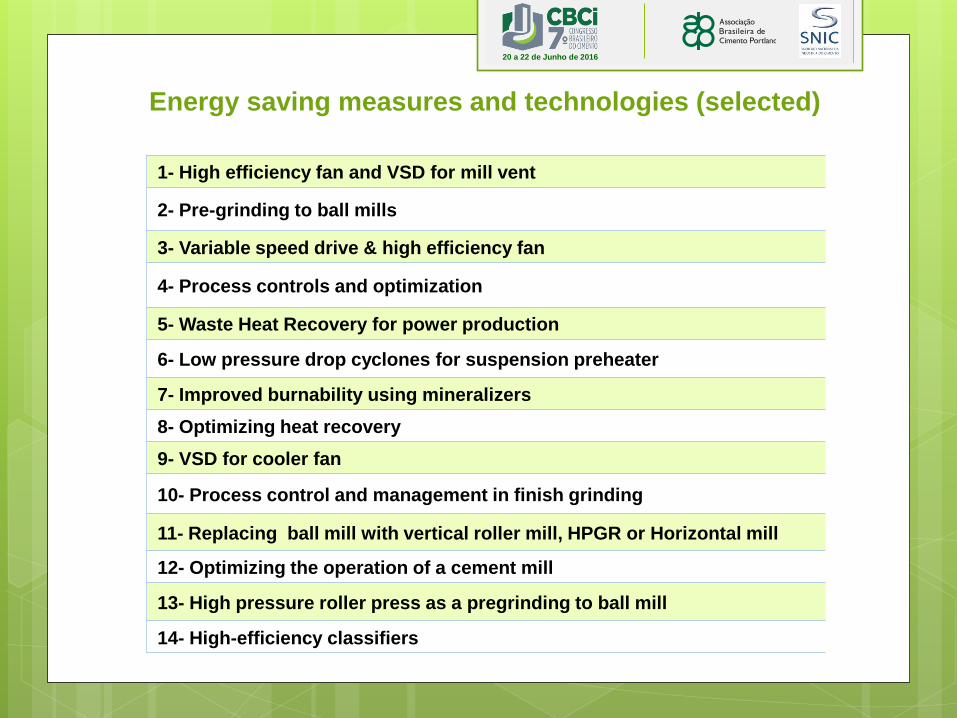
Energy saving measures and technologies (selected)
1- High efficiency fan and VSD for mill vent
2- Pre-grinding to ball mills
3- Variable speed drive & high efficiency fan
4- Process controls and optimization
5- Waste Heat Recovery for power production
6- Low pressure drop cyclones for suspension preheater
7- Improved burnability using mineralizers
8- Optimizing heat recovery
9- VSD for cooler fan
10- Process control and management in finish grinding
11- Replacing ball mill with vertical roller mill, HPGR or Horizontal mill
12- Optimizing the operation of a cement mill
13- High pressure roller press as a pregrinding to ball mill
14- High-efficiency classifiers
20 a 22 de Junho de 2016
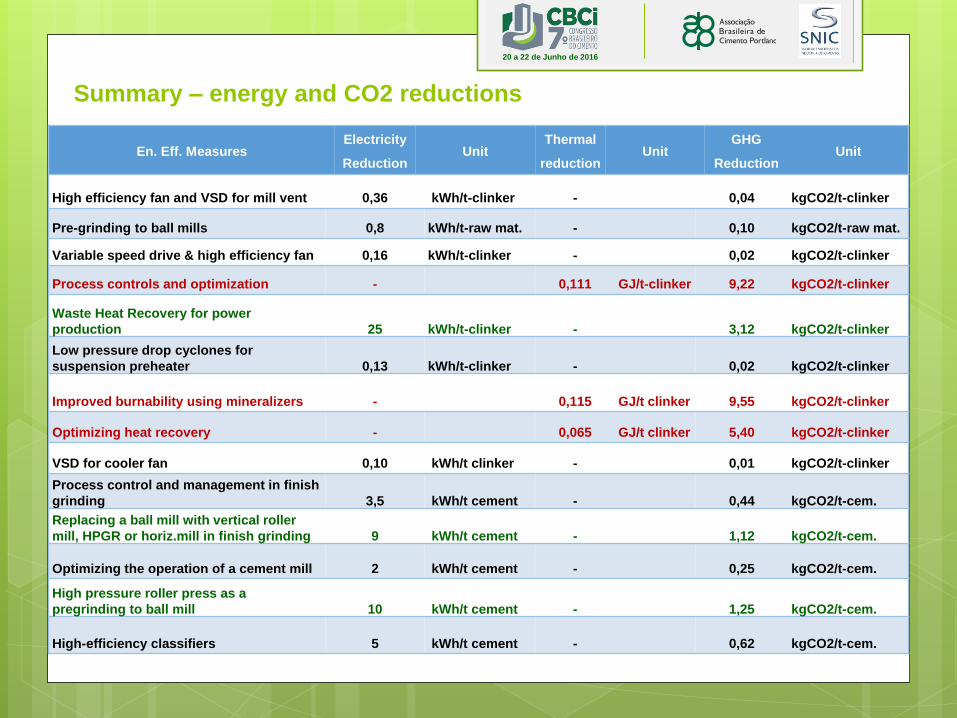
Summary – energy and CO2 reductions
En. Eff. Measures Electricity
Reduction Unit
Thermal
reduction Unit
GHG
Reduction Unit
High efficiency fan and VSD for mill vent 0,36 kWh/t-clinker - 0,04 kgCO2/t-clinker
Pre-grinding to ball mills 0,8 kWh/t-raw mat. - 0,10 kgCO2/t-raw mat.
Variable speed drive & high efficiency fan 0,16 kWh/t-clinker - 0,02 kgCO2/t-clinker
Process controls and optimization - 0,111 GJ/t-clinker 9,22 kgCO2/t-clinker
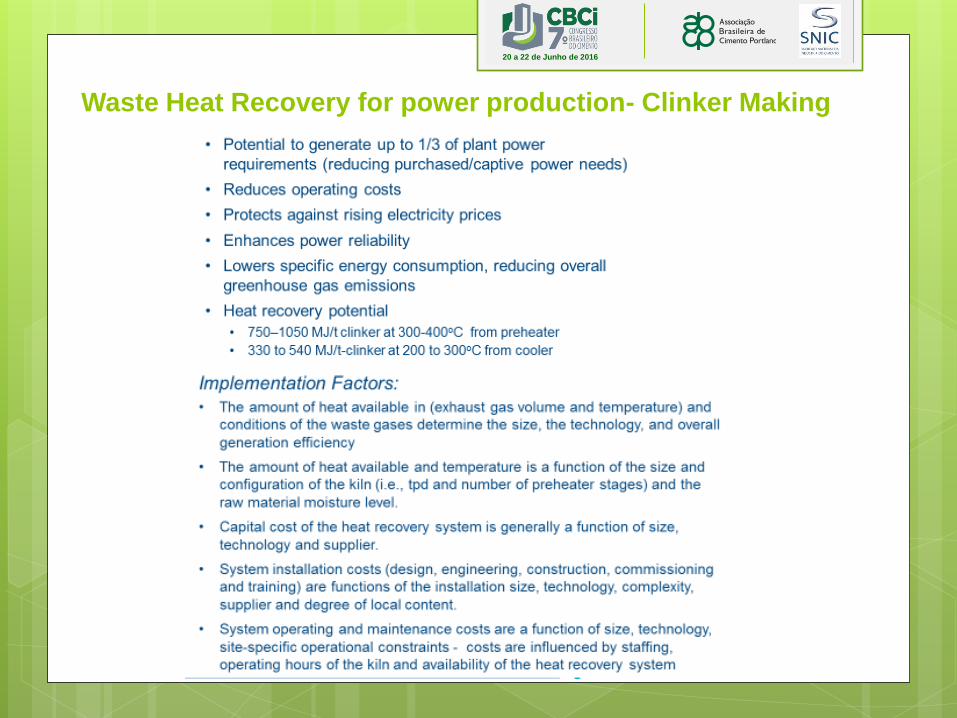
Waste Heat Recovery for power
production 25 kWh/t-clinker - 3,12 kgCO2/t-clinker
Low pressure drop cyclones for
suspension preheater 0,13 kWh/t-clinker - 0,02 kgCO2/t-clinker
Improved burnability using mineralizers - 0,115 GJ/t clinker 9,55 kgCO2/t-clinker
Optimizing heat recovery - 0,065 GJ/t clinker 5,40 kgCO2/t-clinker
VSD for cooler fan 0,10 kWh/t clinker - 0,01 kgCO2/t-clinker
Process control and management in finish
grinding 3,5 kWh/t cement - 0,44 kgCO2/t-cem.
Replacing a ball mill with vertical roller
mill, HPGR or horiz.mill in finish grinding 9 kWh/t cement - 1,12 kgCO2/t-cem.
Optimizing the operation of a cement mill 2 kWh/t cement - 0,25 kgCO2/t-cem.
High pressure roller press as a
pregrinding to ball mill 10 kWh/t cement - 1,25 kgCO2/t-cem.
High-efficiency classifiers 5 kWh/t cement - 0,62 kgCO2/t-cem.
20 a 22 de Junho de 2016
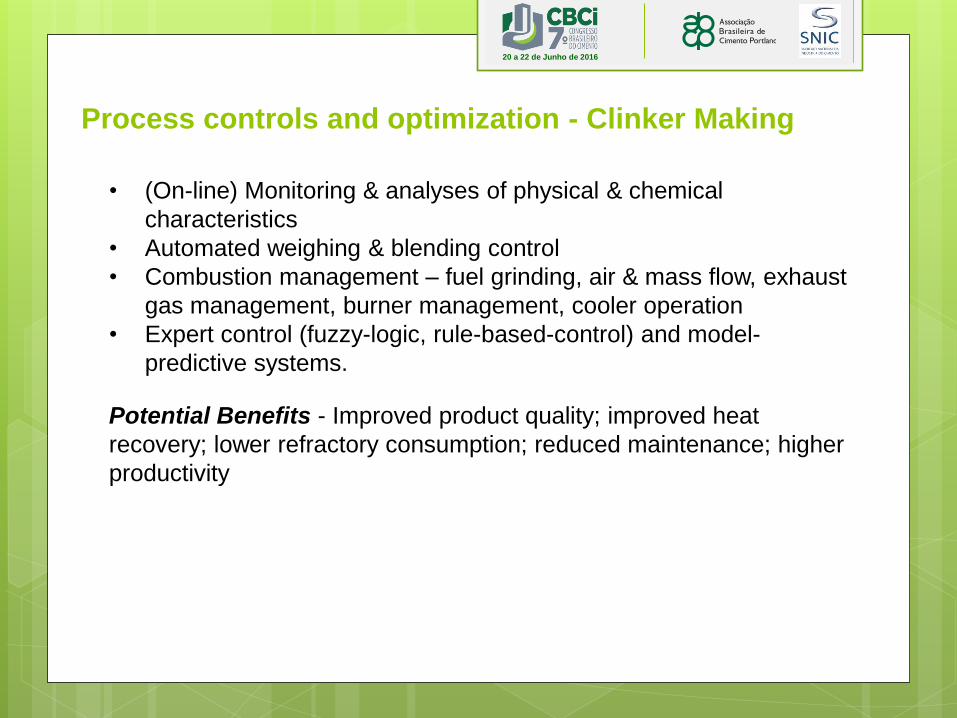
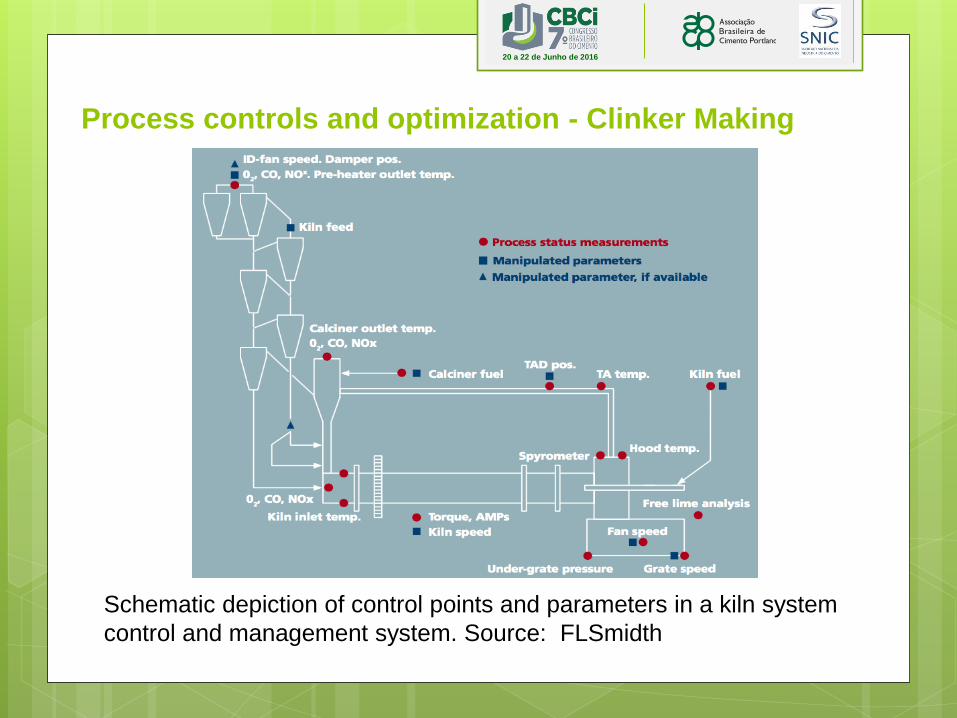
• (On-line) Monitoring & analyses of physical & chemical
characteristics
• Automated weighing & blending control
• Combustion management – fuel grinding, air & mass flow, exhaust
gas management, burner management, cooler operation
• Expert control (fuzzy-logic, rule-based-control) and model-
predictive systems.
Potential Benefits - Improved product quality; improved heat
recovery; lower refractory consumption; reduced maintenance; higher
productivity
Process controls and optimization - Clinker Making
20 a 22 de Junho de 2016
Process controls and optimization - Clinker Making
Schematic depiction of control points and parameters in a kiln system
control and management system. Source: FLSmidth
20 a 22 de Junho de 2016
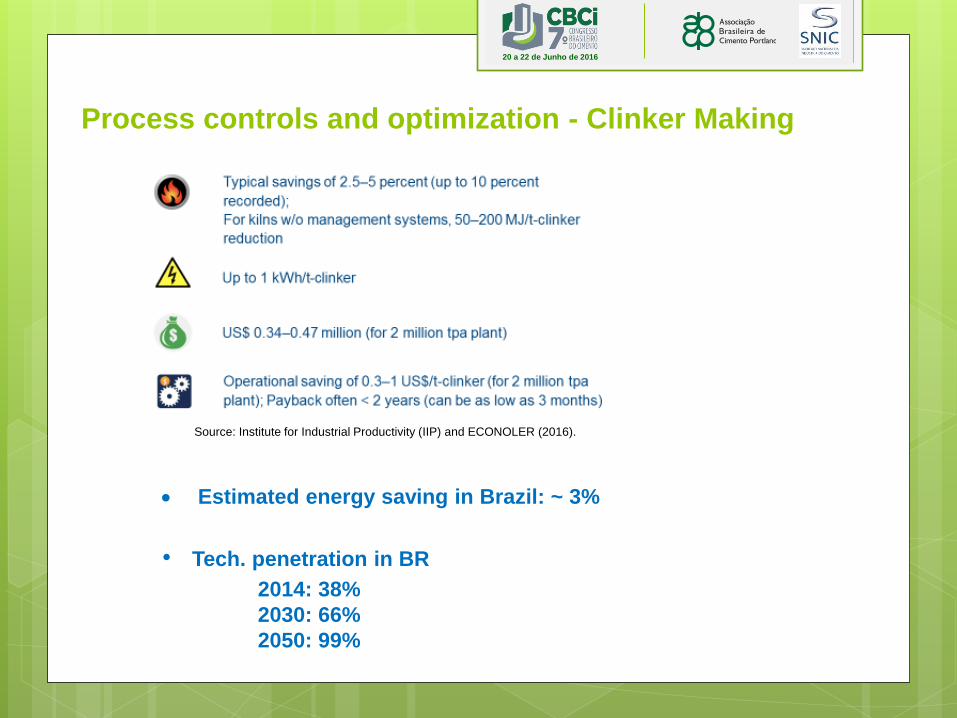
Process controls and optimization - Clinker Making
Estimated energy saving in Brazil: ~ 3%
• Tech. penetration in BR
2014: 38%
2030: 66%
2050: 99%
Source: Institute for Industrial Productivity (IIP) and ECONOLER (2016).
20 a 22 de Junho de 2016
Waste Heat Recovery for power production- Clinker Making
20 a 22 de Junho de 2016
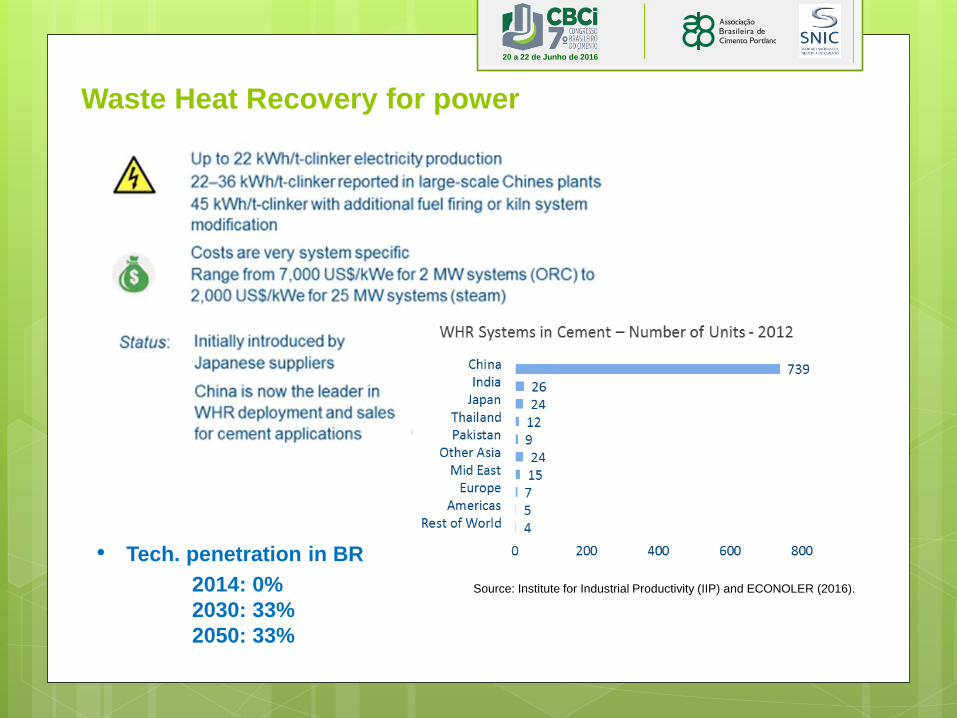
Waste Heat Recovery for power
Source: Institute for Industrial Productivity (IIP) and ECONOLER (2016).
• Tech. penetration in BR
2014: 0%
2030: 33%
2050: 33%
20 a 22 de Junho de 2016
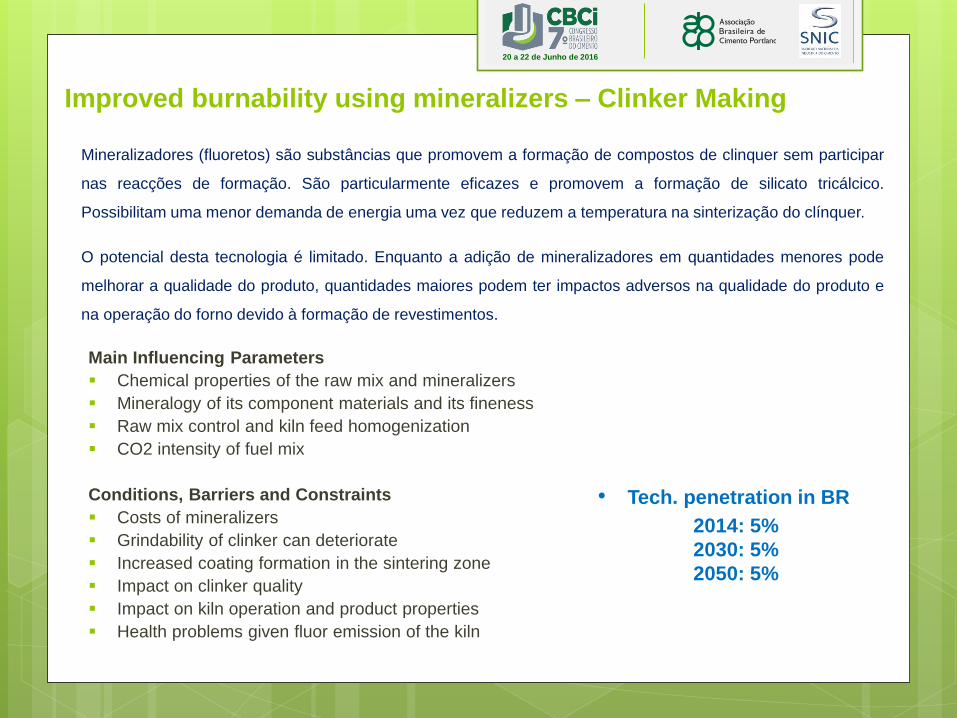
Improved burnability using mineralizers – Clinker Making
Main Influencing Parameters
Chemical properties of the raw mix and mineralizers
Mineralogy of its component materials and its fineness
Raw mix control and kiln feed homogenization
CO2 intensity of fuel mix
Conditions, Barriers and Constraints
Costs of mineralizers
Grindability of clinker can deteriorate
Increased coating formation in the sintering zone
Impact on clinker quality
Impact on kiln operation and product properties
Health problems given fluor emission of the kiln
Mineralizadores (fluoretos) são substâncias que promovem a formação de compostos de clinquer sem participar
nas reacções de formação. São particularmente eficazes e promovem a formação de silicato tricálcico.
Possibilitam uma menor demanda de energia uma vez que reduzem a temperatura na sinterização do clínquer.
O potencial desta tecnologia é limitado. Enquanto a adição de mineralizadores em quantidades menores pode
melhorar a qualidade do produto, quantidades maiores podem ter impactos adversos na qualidade do produto e
na operação do forno devido à formação de revestimentos.
• Tech. penetration in BR
2014: 5%
2030: 5%
2050: 5%
20 a 22 de Junho de 2016
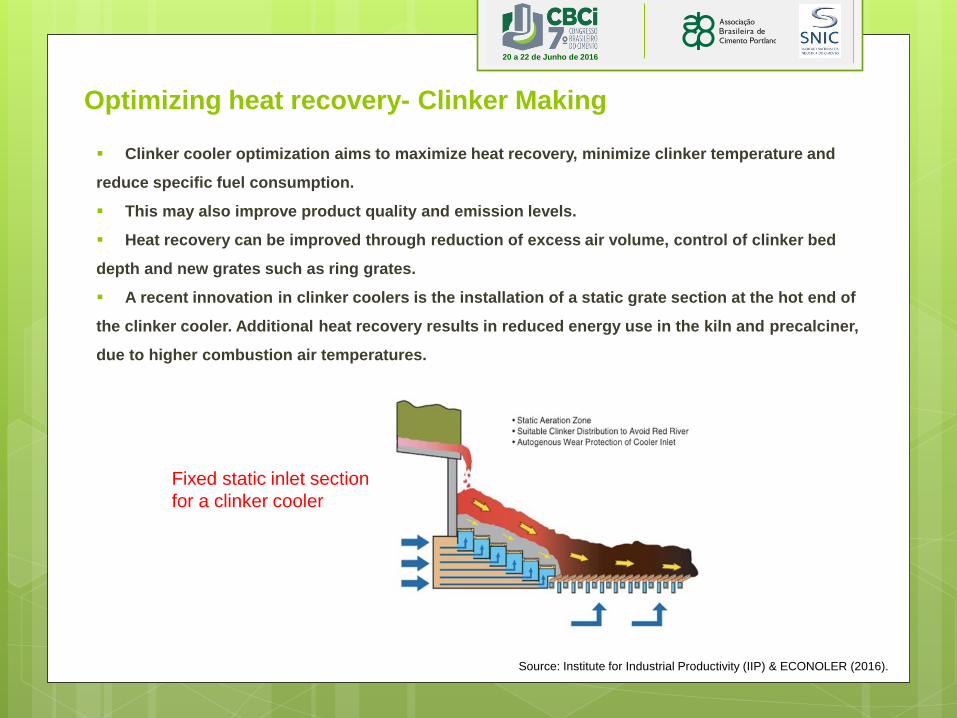
Optimizing heat recovery- Clinker Making
Clinker cooler optimization aims to maximize heat recovery, minimize clinker temperature and
reduce specific fuel consumption.
This may also improve product quality and emission levels.
Heat recovery can be improved through reduction of excess air volume, control of clinker bed
depth and new grates such as ring grates.
A recent innovation in clinker coolers is the installation of a static grate section at the hot end of
the clinker cooler. Additional heat recovery results in reduced energy use in the kiln and precalciner,
due to higher combustion air temperatures.
Fixed static inlet section
for a clinker cooler
Source: Institute for Industrial Productivity (IIP) & ECONOLER (2016).
20 a 22 de Junho de 2016
Optimizing heat recovery- Clinker Making
Energy Performance
0.05 to 0.08 GJ/t-clinker savings are reported through the improved operation of the grate
cooler, and savings of 0.16 GJ/t-clinker are reported for retrofitting a grate cooler.
Fixed static inlet section for a clinker coolered by an increase in electricity use of 2.0 kWh/t
clinker.
Installation of a static grate section could improve the heat recovery rates by 2 to 5 percent.
• Tech. penetration in BR
2014: 64%
2030: 99%
2050: 99%
20 a 22 de Junho de 2016
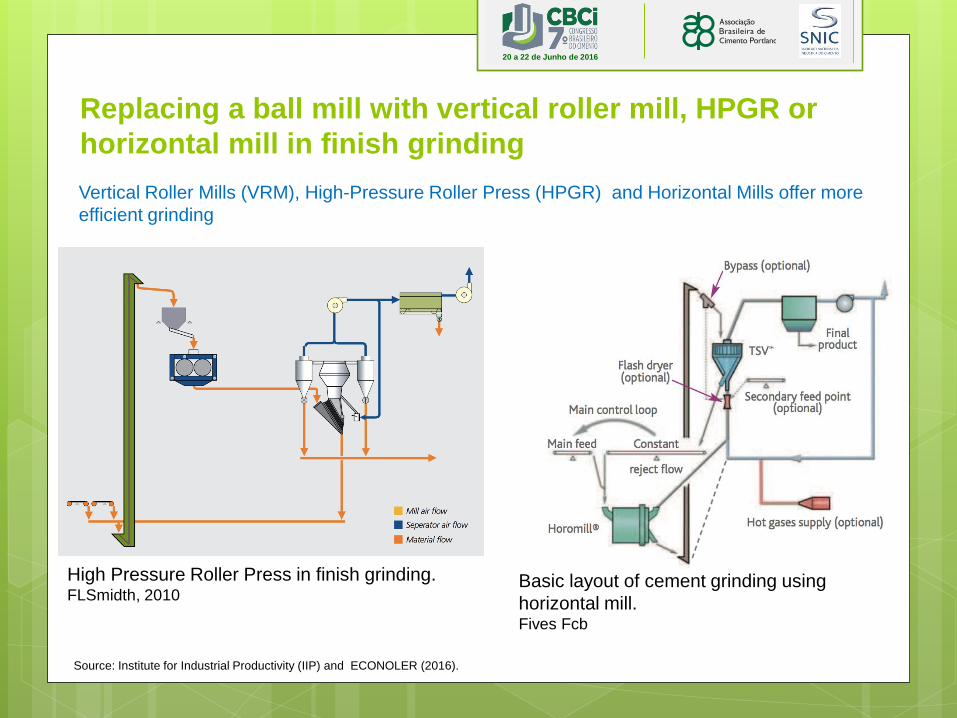
Replacing a ball mill with vertical roller mill, HPGR or
horizontal mill in finish grinding
Basic layout of cement grinding using
horizontal mill. Fives Fcb
High Pressure Roller Press in finish grinding. FLSmidth, 2010
Vertical Roller Mills (VRM), High-Pressure Roller Press (HPGR) and Horizontal Mills offer more
efficient grinding
Source: Institute for Industrial Productivity (IIP) and ECONOLER (2016).
20 a 22 de Junho de 2016
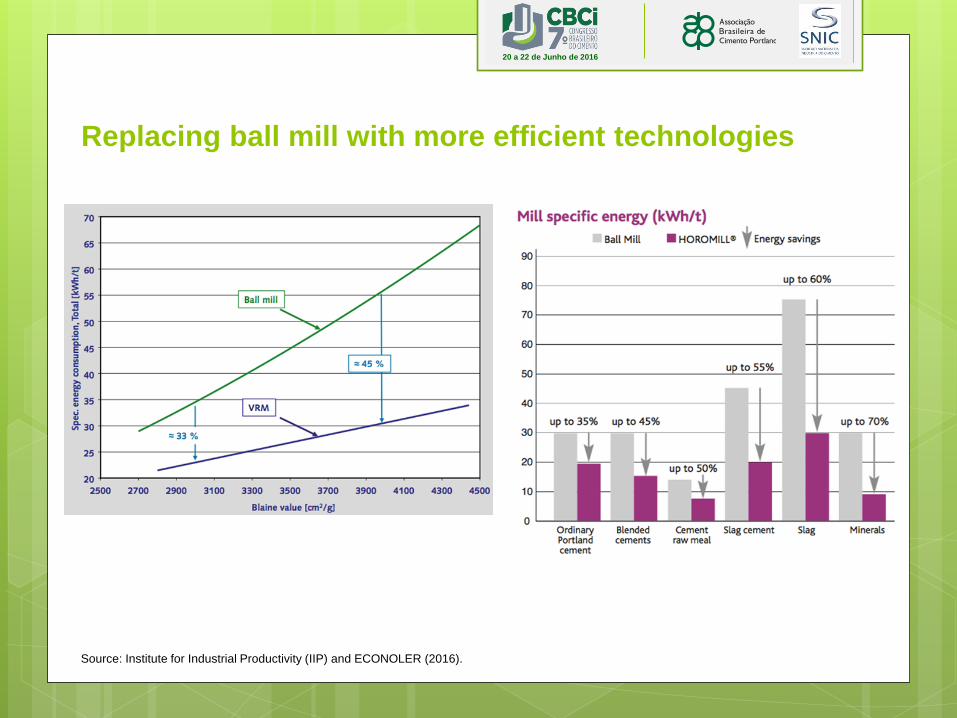
Replacing ball mill with more efficient technologies
Source: Institute for Industrial Productivity (IIP) and ECONOLER (2016).
20 a 22 de Junho de 2016
Replacing ball mill with more efficient technologies
• In Brazil - power savings are estimated in 9 kWh/ton cement using
roller mill
• Costs (Brazil): US$ 70/t cement capacity
• Tech. penetration in BR
2014: 13%
2030: 13%
2050: 13%
Source: Institute for Industrial Productivity (IIP) and ECONOLER (2016).
20 a 22 de Junho de 2016
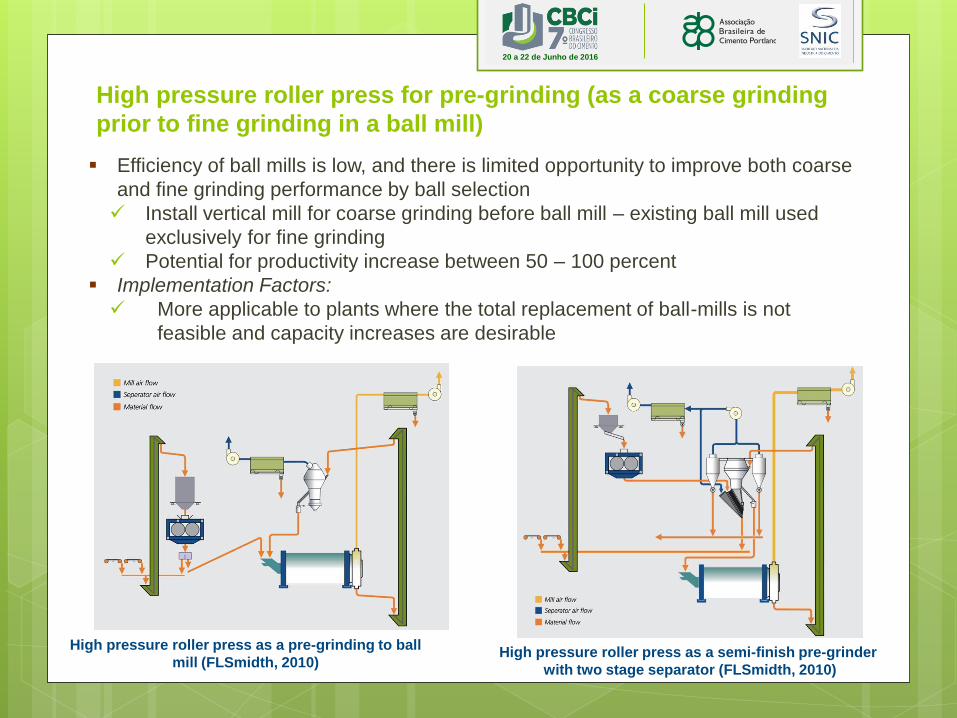
High pressure roller press for pre-grinding (as a coarse grinding
prior to fine grinding in a ball mill)
Efficiency of ball mills is low, and there is limited opportunity to improve both coarse
and fine grinding performance by ball selection
Install vertical mill for coarse grinding before ball mill – existing ball mill used
exclusively for fine grinding
Potential for productivity increase between 50 – 100 percent
Implementation Factors:
More applicable to plants where the total replacement of ball-mills is not
feasible and capacity increases are desirable
High pressure roller press as a pre-grinding to ball
mill (FLSmidth, 2010) High pressure roller press as a semi-finish pre-grinder
with two stage separator (FLSmidth, 2010)
20 a 22 de Junho de 2016
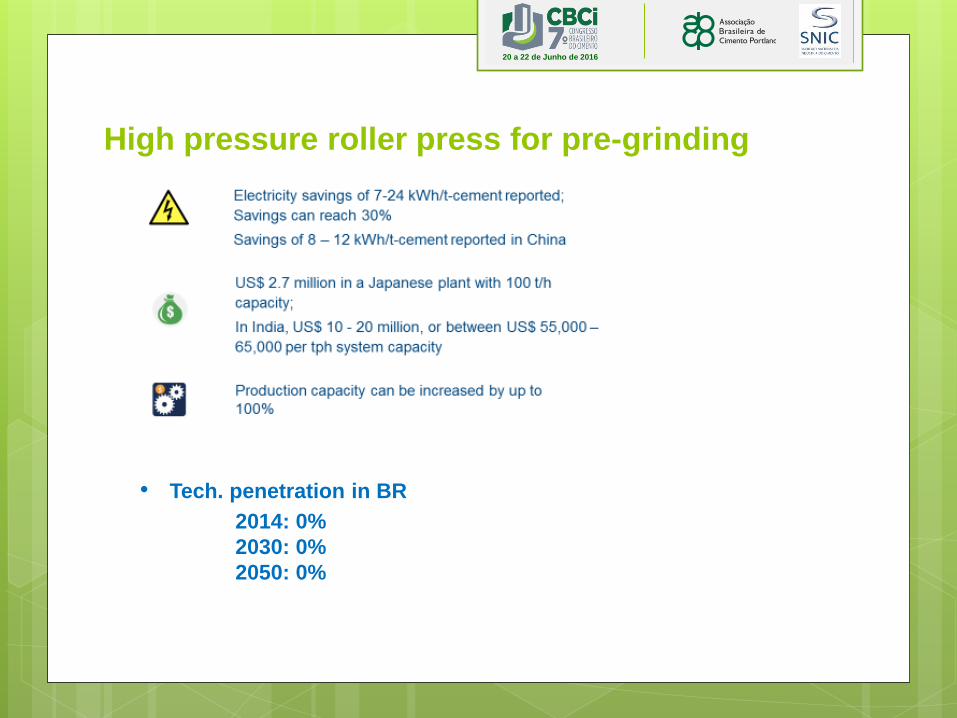
High pressure roller press for pre-grinding
• Tech. penetration in BR
2014: 0%
2030: 0%
2050: 0%
20 a 22 de Junho de 2016
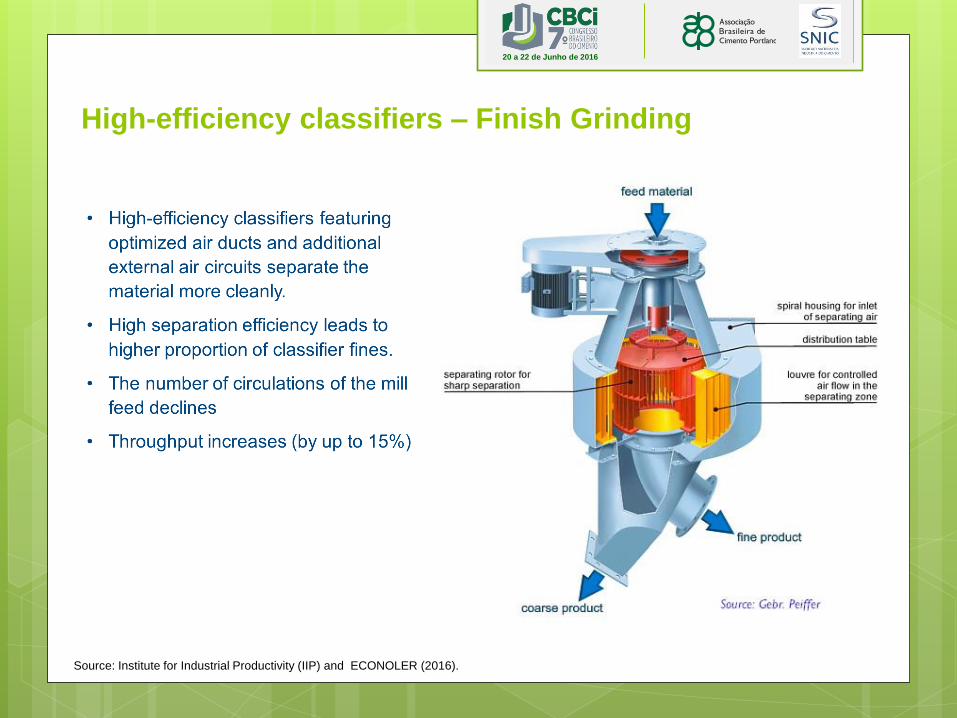
High-efficiency classifiers – Finish Grinding
Source: Institute for Industrial Productivity (IIP) and ECONOLER (2016).
20 a 22 de Junho de 2016
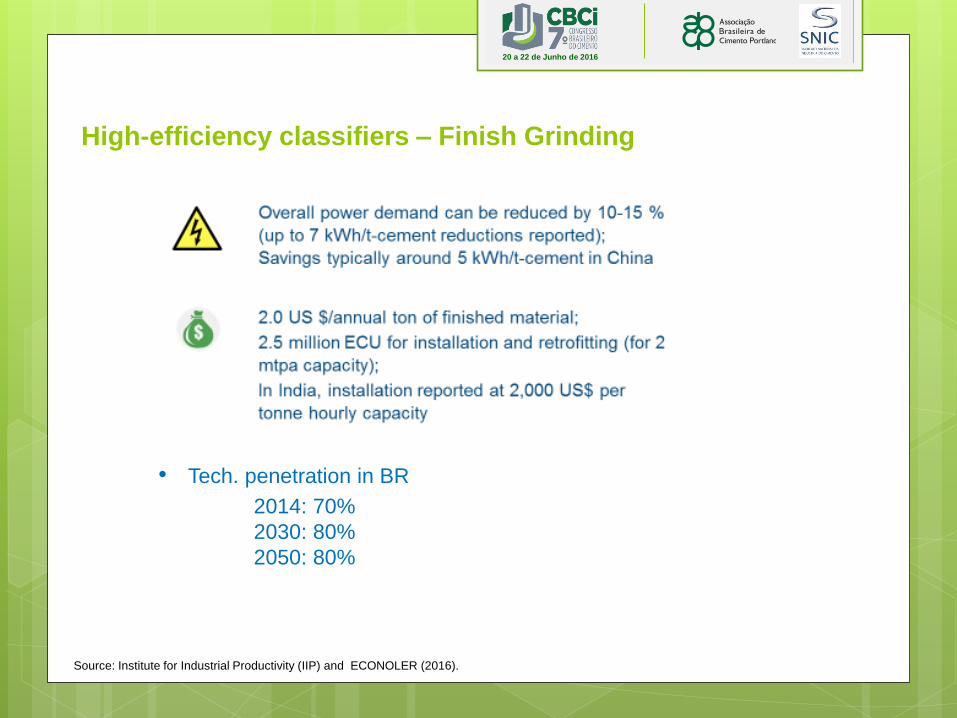
High-efficiency classifiers – Finish Grinding
• Tech. penetration in BR
2014: 70%
2030: 80%
2050: 80%
Source: Institute for Industrial Productivity (IIP) and ECONOLER (2016).
20 a 22 de Junho de 2016
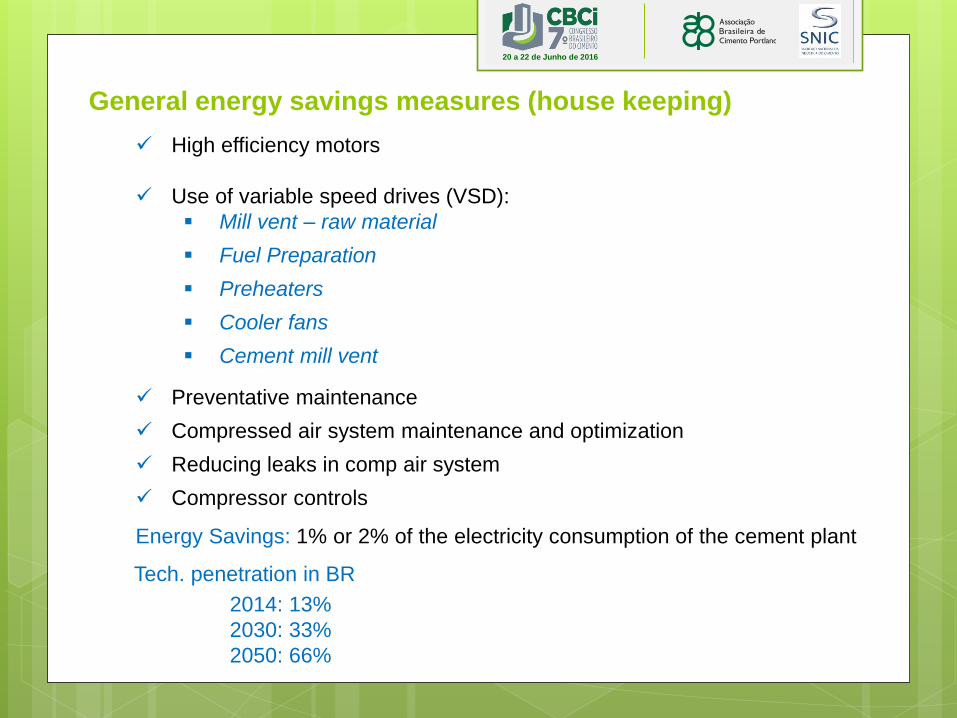
General energy savings measures (house keeping)
High efficiency motors
Use of variable speed drives (VSD):
Mill vent – raw material
Fuel Preparation
Preheaters
Cooler fans
Cement mill vent
Preventative maintenance
Compressed air system maintenance and optimization
Reducing leaks in comp air system
Compressor controls
Energy Savings: 1% or 2% of the electricity consumption of the cement plant
Tech. penetration in BR
2014: 13%
2030: 33%
2050: 66%
20 a 22 de Junho de 2016
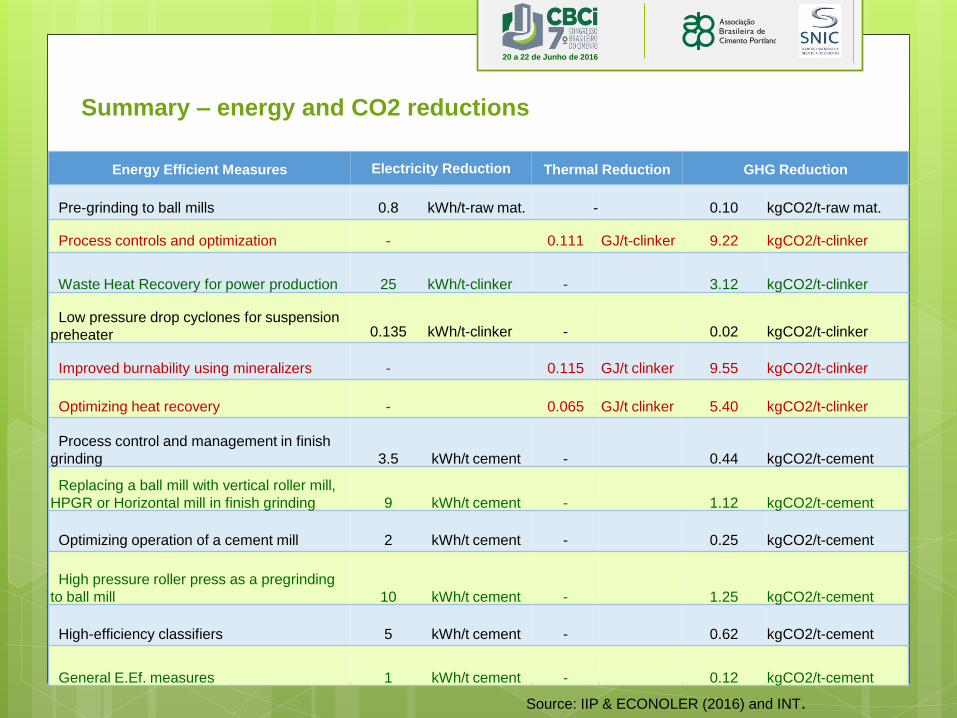
Energy Efficient Measures Electricity Reduction Thermal Reduction GHG Reduction
Pre-grinding to ball mills 0.8 kWh/t-raw mat. - 0.10 kgCO2/t-raw mat.
Process controls and optimization - 0.111 GJ/t-clinker 9.22 kgCO2/t-clinker
Waste Heat Recovery for power production 25 kWh/t-clinker - 3.12 kgCO2/t-clinker
Low pressure drop cyclones for suspension
preheater 0.135 kWh/t-clinker - 0.02 kgCO2/t-clinker
Improved burnability using mineralizers - 0.115 GJ/t clinker 9.55 kgCO2/t-clinker
Optimizing heat recovery - 0.065 GJ/t clinker 5.40 kgCO2/t-clinker
Process control and management in finish
grinding 3.5 kWh/t cement - 0.44 kgCO2/t-cement
Replacing a ball mill with vertical roller mill,
HPGR or Horizontal mill in finish grinding 9 kWh/t cement - 1.12 kgCO2/t-cement
Optimizing operation of a cement mill 2 kWh/t cement - 0.25 kgCO2/t-cement
High pressure roller press as a pregrinding
to ball mill 10 kWh/t cement - 1.25 kgCO2/t-cement
High-efficiency classifiers 5 kWh/t cement - 0.62 kgCO2/t-cement
General E.Ef. measures 1 kWh/t cement - 0.12 kgCO2/t-cement
Summary – energy and CO2 reductions
Source: IIP & ECONOLER (2016) and INT.
20 a 22 de Junho de 2016
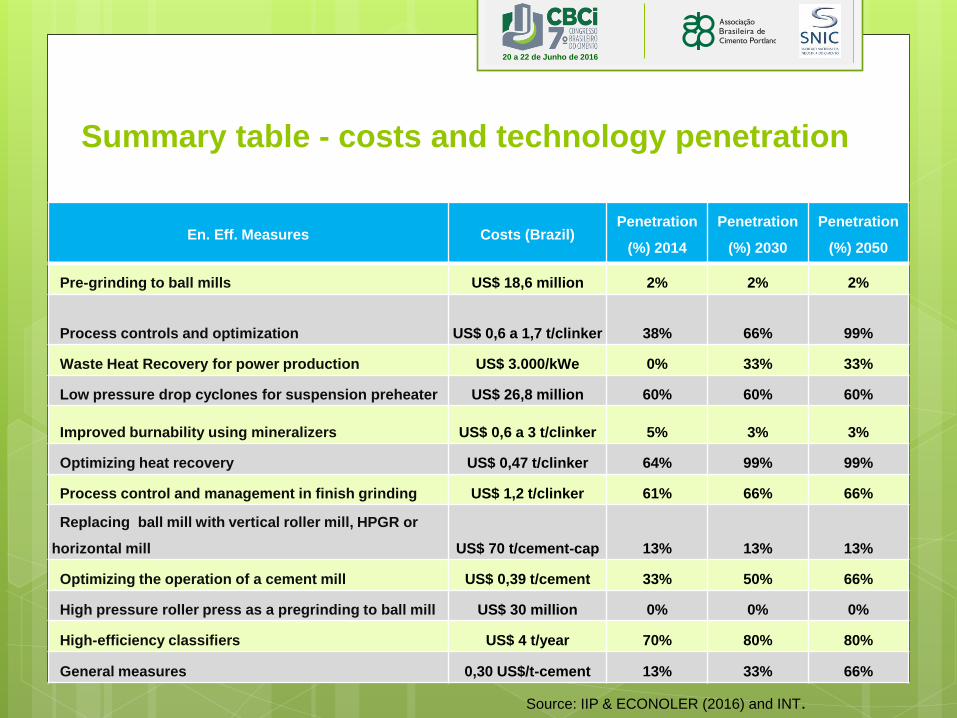
Summary table - costs and technology penetration
En. Eff. Measures Costs (Brazil) Penetration
(%) 2014
Penetration
(%) 2030
Penetration
(%) 2050
Pre-grinding to ball mills US$ 18,6 million 2% 2% 2%
Process controls and optimization US$ 0,6 a 1,7 t/clinker 38% 66% 99%
Waste Heat Recovery for power production US$ 3.000/kWe 0% 33% 33%
Low pressure drop cyclones for suspension preheater US$ 26,8 million 60% 60% 60%
Improved burnability using mineralizers US$ 0,6 a 3 t/clinker 5% 3% 3%
Optimizing heat recovery US$ 0,47 t/clinker 64% 99% 99%
Process control and management in finish grinding US$ 1,2 t/clinker 61% 66% 66%
Replacing ball mill with vertical roller mill, HPGR or
horizontal mill US$ 70 t/cement-cap 13% 13% 13%
Optimizing the operation of a cement mill US$ 0,39 t/cement 33% 50% 66%
High pressure roller press as a pregrinding to ball mill US$ 30 million 0% 0% 0%
High-efficiency classifiers US$ 4 t/year 70% 80% 80%
General measures 0,30 US$/t-cement 13% 33% 66%
Source: IIP & ECONOLER (2016) and INT.

20 a 22 de Junho de 2016
Muito Obrigado
Mauricio F. Henriques Jr.
Instituto Nacional de Tecnologia – INT
21 2123.1256