![Nabo Forrageiro [Modo de Compatibilidade] · • Variedades disponíveis: AL 1000 e IPR 116 – Paraná • Ensaio de 2005: picos de 1400 kg/há, média 1230 kg/ha com M4média 1230](https://static.fdocumentos.tips/doc/165x107/5f95d72dd822f00f7c4fa4ee/nabo-forrageiro-modo-de-compatibilidade-a-variedades-disponveis-al-1000-e.jpg)
e-ISSN:1806-1230 Original Article Food consumption markers ...
12
Food consumption markers by gender e-ISSN:1806-1230 Original Article DOI: 10.5020/18061230.2017.6165 Received on: 02/06/2017 Revised on: 08/08/2017 Accepted on: 09/08/2017 Este artigo publicado em acesso aberto (Open Access) sob a licença Creative Commons, que permite uso, distribuição e reprodução em qualquer meio, sem restrições, desde que o trabalho seja corretamente citado. DIFFERENCES IN FOOD CONSUMPTION BETWEEN MEN AND WOMEN INTERVIEWED BY VIGITEL TELEPHONE SURVEY Diferenças no consumo de alimentos entre homens e mulheres entrevistados pelo inquérito telefônico VIGITEL Diferencias del consumo de alimentos entre hombres y mujeres entrevistados por la encuesta telefónica VIGITEL Gabriela Dalcin Durante Federal University of Mato Grosso (Universidade Federal de Mato Grosso - UFMT) - Cuiabá (MT) - Brazil Lenir Vaz Guimarães Federal University of Mato Grosso (Universidade Federal de Mato Grosso - UFMT) - Cuiabá (MT) - Brazil Neuber José Segri Federal University of Mato Grosso (Universidade Federal de Mato Grosso - UFMT) - Cuiabá (MT) - Brazil Maria Silvia Amicucci Soares Martins Federal University of Mato Grosso (Universidade Federal de Mato Grosso - UFMT) - Cuiabá (MT) - Brazil Deborah Carvalho Malta Federal University of Minas Gerais (Universidade Federal de Minas Gerais - UFMG) - Belo Horizonte (MG) - Brazil ABSTRACT Objective: To analyze the frequency of consumption of healthy and unhealthy diet markers among adult men and women and the associated demographic and socioeconomic factors. Methods: Cross-sectional population-based study with data from the Telephone-based Surveillance of Risk and Protective Factors for Chronic Diseases (VIGITEL). A total of 1,005 adults (400 men and 605 women) aged 20 to 59 years living in Cuiabá, Mato Grosso, were interviewed between February and December 2014. The study variables were the consumption of healthy and unhealthy diet markers, and demographic and socioeconomic variables. Data underwent bivariate analysis using the chi-squared test (Rao- Scott) and linear trend test. Results: Participants’ mean age was 37.9 years for women and 36.3 years for men. In all, 50.9% (n=605) of the participants were women, 60.0% (n=455) were young adults aged 20 to 39 years, and black or parda ethnicity (69.7%; n= 569). Higher regular consumption of fruit and vegetables was observed among women (p=0.01), among those with higher levels of education and white ethnicity, and higher consumption of beans was found among men (p=0.04). The consumption of meat with excess fat was higher among men (p <0.01), and the regular consumption of sweets (p=0.02) and replacement of meals with snacks (p = 0.01) were higher among women, both directly associated with education. Conclusion: Significant differences were observed in food consumption between men and women living in Cuiabá, Mato Grosso. Education and ethnicity/skin color were variables that were associated with most of the food consumption markers. Descriptors: Food Consumption; Epidemiological Surveys; Public Health Surveillance. RESUMO Objetivo: Analisar a frequência de consumo de alimentos marcadores de dieta saudável e não saudável entre homens e mulheres adultos e os fatores demográficos e socioeconômicos associados. Métodos: Estudo de corte transversal, de base populacional, com dados do Sistema de Vigilância de Fatores de Risco e Proteção para Doenças Crônicas não Transmissíveis por Inquérito Telefônico (VIGITEL). Foram incluídos 1.005 adultos (400 homens e 605 mulheres), de 20 a 59 anos, residentes em Cuiabá, Mato Grosso, entrevistados entre fevereiro e dezembro de 2014. As variáveis do estudo foram o consumo de alimentos marcadores de dieta saudável e não saudável e variáveis demográficas e socioeconômicas. Na análise de dados, utilizou-se análise bivariada por meio do teste de qui-quadrado (Rao-Scott) e teste de tendência linear. Resultados: A média de idade dos participantes foi de 37,9 anos para mulheres e 36,3 anos para os homens, dos quais 50,9% (n=605) eram mulheres, 60,0% (n=455) eram adultos jovens, de 20 a 39 anos, e de raça/cor preta ou parda (69,7%; n= 569). Maior consumo regular de frutas e hortaliças foi observado entre mulheres (p=0,01), entre aquelas de maior escolaridade e da raça/cor branca, e maior consumo de feijão foi observado entre os homens (p=0,04). O consumo de carnes com excesso de gordura foi maior entre os homens (p<0,01), assim como o consumo regular de doces (p=0,02) e a substituição das refeições principais por lanches foi maior entre as mulheres (p=0,01), ambos
Transcript of e-ISSN:1806-1230 Original Article Food consumption markers ...
Food consumption markers by gender
Rev Bras Promoç Saúde, Fortaleza, 30(3): 1-12, jul./set., 2017 1
Food consumption markers by gendere-ISSN:1806-1230 Original Article
DOI: 10.5020/18061230.2017.6165
Received on: 02/06/2017Revised on: 08/08/2017
Accepted on: 09/08/2017
Este artigo publicado em acesso aberto (Open Access) sob a licença Creative Commons, que permite uso, distribuição e reprodução em qualquer meio, sem restrições, desde que o trabalho seja corretamente citado.
DIFFERENCES IN FOOD CONSUMPTION BETWEEN MEN AND WOMEN INTERVIEWED BY VIGITEL TELEPHONE SURVEY Diferenças no consumo de alimentos entre homens e mulheres entrevistados pelo inquérito telefônico VIGITELDiferencias del consumo de alimentos entre hombres y mujeres entrevistados por la encuesta telefónica VIGITEL
Gabriela Dalcin DuranteFederal University of Mato Grosso (Universidade Federal de Mato Grosso - UFMT) - Cuiabá (MT) - Brazil
Lenir Vaz GuimarãesFederal University of Mato Grosso (Universidade Federal de Mato Grosso - UFMT) - Cuiabá (MT) - Brazil
Neuber José SegriFederal University of Mato Grosso (Universidade Federal de Mato Grosso - UFMT) - Cuiabá (MT) - Brazil
Maria Silvia Amicucci Soares MartinsFederal University of Mato Grosso (Universidade Federal de Mato Grosso - UFMT) - Cuiabá (MT) - Brazil
Deborah Carvalho MaltaFederal University of Minas Gerais (Universidade Federal de Minas Gerais - UFMG) - Belo Horizonte (MG) - Brazil
ABSTRACT
Objective: To analyze the frequency of consumption of healthy and unhealthy diet markers among adult men and women and the associated demographic and socioeconomic factors. Methods: Cross-sectional population-based study with data from the Telephone-based Surveillance of Risk and Protective Factors for Chronic Diseases (VIGITEL). A total of 1,005 adults (400 men and 605 women) aged 20 to 59 years living in Cuiabá, Mato Grosso, were interviewed between February and December 2014. The study variables were the consumption of healthy and unhealthy diet markers, and demographic and socioeconomic variables. Data underwent bivariate analysis using the chi-squared test (Rao-Scott) and linear trend test. Results: Participants’ mean age was 37.9 years for women and 36.3 years for men. In all, 50.9% (n=605) of the participants were women, 60.0% (n=455) were young adults aged 20 to 39 years, and black or parda ethnicity (69.7%; n= 569). Higher regular consumption of fruit and vegetables was observed among women (p=0.01), among those with higher levels of education and white ethnicity, and higher consumption of beans was found among men (p=0.04). The consumption of meat with excess fat was higher among men (p <0.01), and the regular consumption of sweets (p=0.02) and replacement of meals with snacks (p = 0.01) were higher among women, both directly associated with education. Conclusion: Signifi cant differences were observed in food consumption between men and women living in Cuiabá, Mato Grosso. Education and ethnicity/skin color were variables that were associated with most of the food consumption markers.
Descriptors: Food Consumption; Epidemiological Surveys; Public Health Surveillance.
RESUMO
Objetivo: Analisar a frequência de consumo de alimentos marcadores de dieta saudável e não saudável entre homens e mulheres adultos e os fatores demográfi cos e socioeconômicos associados. Métodos: Estudo de corte transversal, de base populacional, com dados do Sistema de Vigilância de Fatores de Risco e Proteção para Doenças Crônicas não Transmissíveis por Inquérito Telefônico (VIGITEL). Foram incluídos 1.005 adultos (400 homens e 605 mulheres), de 20 a 59 anos, residentes em Cuiabá, Mato Grosso, entrevistados entre fevereiro e dezembro de 2014. As variáveis do estudo foram o consumo de alimentos marcadores de dieta saudável e não saudável e variáveis demográfi cas e socioeconômicas. Na análise de dados, utilizou-se análise bivariada por meio do teste de qui-quadrado (Rao-Scott) e teste de tendência linear. Resultados: A média de idade dos participantes foi de 37,9 anos para mulheres e 36,3 anos para os homens, dos quais 50,9% (n=605) eram mulheres, 60,0% (n=455) eram adultos jovens, de 20 a 39 anos, e de raça/cor preta ou parda (69,7%; n= 569). Maior consumo regular de frutas e hortaliças foi observado entre mulheres (p=0,01), entre aquelas de maior escolaridade e da raça/cor branca, e maior consumo de feijão foi observado entre os homens (p=0,04). O consumo de carnes com excesso de gordura foi maior entre os homens (p<0,01), assim como o consumo regular de doces (p=0,02) e a substituição das refeições principais por lanches foi maior entre as mulheres (p=0,01), ambos
Durante GD, Guimarães LV, Segri NJ, Martins MSAS, Malta DC
Rev Bras Promoç Saúde, Fortaleza, 30(3): 1-12, jul./set., 20172
diretamente associados à escolaridade. Conclusão: Verificaram-se diferenças importantes no consumo de alimentos entre homens e mulheres residentes em Cuiabá, Mato Grosso. A escolaridade e a raça/cor foram variáveis que se associaram à maioria dos marcadores de consumo alimentar.
Descritores: Consumo de Alimentos; Inquéritos Epidemiológicos; Vigilância em Saúde Pública.
RESUMEN
Objetivo: Analizar la frecuencia del consumo de alimentos marcadores de dieta saludable y no saludable entre hombres y mujeres adultos y los factores demográficos y socioeconómicos asociados. Métodos: Estudio de corte transversal, de base poblacional con datos del Sistema de Vigilancia de Factores de Riesgo y Protección para Enfermedades Crónicas no Transmisibles a través de encuesta telefónica (VIGITEL). Fueron incluidos 1.005 adultos (400 hombres e 605 mujeres), entre 20 y 59 años que vivían en Cuiabá, Mato Grosso, entrevistados entre febrero y diciembre de 2014. Las variables del estudio fueron el consumo de alimentos marcadores de dieta saludable y no saludable y las variables demográficas y socioeconómicas. Para el análisis de los datos se utilizó el análisis bivariado a través de la prueba Chi-cuadrado (Rao-Scott) y la prueba de tendencia linear. Resultados: La media de edad de los participantes fue de 37,9 años para las mujeres y de 36,3 años para los hombres de los cuales el 50,9% (n=605) eran mujeres, el 60,0% (n=455) eran adultos jóvenes entre 20 y 39 años y de raza/color negro o parda (69,7%; n= 569). Fue observado mayor consumo regular de frutas y hortalizas entre las mujeres (p=0,01) con más escolaridad y de la raza/color blanco y más consumo de frijoles entre los hombres (p=0,04). El consumo de carnes con mucha grasa fue mayor entre los hombres (p<0,01) así como el consumo regular de dulces (p=0,02) y la sustitución de las comidas principales por meriendas fue mayor entre las mujeres (p=0,01), los dos directamente asociados con la escolaridad. Conclusión: Se verificaron diferencias importantes en el consumo de alimentos entre los hombres y mujeres residentes de Cuiabá, Mato Grosso. La escolaridad y la raza/color fueron las variables que se asociaron con la mayoría de los marcadores de consumo alimentario.
Descriptores: Consumo de Alimentos; Encuestas Epidemiológicas; Vigilancia en Salud Pública.
INTRODUCTION
Significant changes have happened in the dietary habits of the world population and in diet quality, with increased consumption of ultra-processed and industrialized foods with high energy density, rich in refined sugars, sodium and fats, especially trans fats and saturated fats, and poor in fibers to the detriment of the consumption of natural foods, such as fruits, vegetables, legumes and whole grains(1,2). In Brazil, there has been a decrease in the availability of traditional staple foods, such as rice and beans, in the household(3).
Unhealthy diets, physical inactivity, harmful use of alcohol and smoking are the main risk factors for the development of noncommunicable diseases (NCDs)(4), such as cardiovascular diseases, cancers, diabetes and chronic respiratory diseases(5,6).
The proportion of adults with excess weight has been increasing steadily. In Brazil, this increase has been confirmed in all the national surveys conducted since the 1970s(5). In this context, the population of the city of Cuiabá, capital of the state of Mato Grosso – Brazil, has presented with a high prevalence of adults of both genders with excess weight, especially obese individuals(7).
Given the relevance of NCDs in the epidemiological profile of the Brazilian population and the fact that their main risk factors are preventable, the Ministry of Health included in 2006 the telephone-based surveillance of risk and protective factors for chronic diseases (Vigilância de fatores de risco e proteção para doenças crônicas por inquérito telefônico – VIGITEL)(8) in the System for the Surveillance of Risk Factors for Non-Communicable Diseases (NCDs) – a potentially simple, low-cost and quick measure(9). The constant monitoring of risk and protective factors for NCDs contributes to the development of health promotion policies and healthy eating habits in Brazil, since part of the VIGITEL questionnaire addresses the frequency of consumption of foods considered markers of healthy and unhealthy diet.
Thus, the present study aimed to analyze the frequency of consumption of healthy and unhealthy diet markers among adult men and women and the associated demographic and socioeconomic factors.
METHODS
This is a cross-sectional population-based epidemiological study with individual data on adults living in Cuiabá, capital of the State of Mato Grosso – Brazil, who were interviewed in the VIGITEL telephone-based survey.
The sampling procedures used in VIGITEL aim to obtain probability samples of the adult population (≥ 18 years old) living in households served by at least one fixed telephone line in each of the capitals of the 26 Brazilian states and in the Federal District. The system establishes a minimum sample size of approximately 1,500 individuals in each city to estimate the frequency of any risk factor in the adult population, with a 95% confidence coefficient and a maximum error of circa 3%.
Food consumption markers by gender
Rev Bras Promoç Saúde, Fortaleza, 30(3): 1-12, jul./set., 2017 3
The criteria for inclusion in the study were: age between 20 and 59 years, living in Cuiabá and having been interviewed for the VIGITEL from February to December 2014. Women who checked “yes” or “I do not know” in the question about being pregnant at the time of the interview were excluded from the study.
In 2014, 1,509 telephone interviews (575 men and 934 women) were conducted by VIGITEL in Cuiabá(8). Of these, 1,019 individuals aged between 20 and 59 years (400 men and 619 women) were eligible for the study sample, but 14 women were excluded (9 said they did not know whether they were pregnant and 5 confirmed being pregnant at the time of the interview. Thus, the sample used in the present study consisted of 1,005 individuals aged 20 to 59 years old (400 men and 605 women).
VIGITEL 2014 telephone interviews were conducted by a specialized company through computers. The questions were read from a computer screen and the answers were recorded electronically(8).
The present study used only part of the questions in the VIGITEL 2014 questionnaire, specifically those which address demographic and socioeconomic characteristics of individuals and characteristics of food consumption.
The socioeconomic and demographic variables investigated were: gender, age, education, marital status and race/skin color. Age was recorded in full years and grouped into age groups (20-39 years, 40-59 years) and education was recorded in complete years of study and grouped in 3 categories: 0 to 8; 9 to 11 or ≥ 12 years of study. Marital status included the following options: single, legally married, common-law marriage for more than 6 months, widowed, separated or divorced. The variable was later dichotomized into “with partner” or “without partner” [single, widowed or separated/divorced]. Race/skin color data were collected as white, black, parda (mixed-race Brazilians), yellow (Eastern ancestry) and red (Indigenous ancestry) and later grouped into “white” and “black or pardo”. Self-declared yellow (n=43) or red (n=13) individuals were excluded from the study due to the low frequency of such classifications.
Food consumption was assessed using healthy and unhealthy diet markers according to the nomenclature used in VIGITEL(8). Regular consumption of fruits and vegetables (5 or more days/week), recommended consumption of fruits and vegetables (consumption of 5 servings in at least 5 days/week) and regular consumption of beans (5 or more days/week) are considered healthy diet markers.
Unhealthy diet markers included consumption of meat with excess fat (red meat with apparent fat and chicken with skin); consumption of full fat milk (answers such as “whole milk”, “both types” or “do not know” were considered); regular consumption of sweets, such as ice cream, chocolates, cakes, cookies or candies (5 or more days/week); regular consumption of soft drinks or powdered drink mix/artificial juice (5 or more days/week); replacement of main meals (lunch and dinner) with snacks, such as sandwiches, salads, pizza or other snacks (7 or more times/week); and the self-reported consumption of high or very high amounts of salt (by adding it to freshly prepared food and processed foods).
The weighting factors that take into account the complex character of the sample were used for all analyses. The data were analyzed in Stata(10) version 13 using the survey command to apply the weighting factors. Relative frequencies of the variables with their respective 95% confidence intervals were estimated and the Chi-squared test (Rao-Scott) was used to carry out a bivariate analysis between food consumption variables and socioeconomic and demographic variables for men and women. Whenever suitable, the linear trend test was performed. Results with p <0.05 were considered statistically significant.
The present study is part of a research project entitled “Association between markers of food consumption and excess weight in adults from Cuiabá, Mato Grosso, VIGITEL 2014”, which was approved by the Research Ethics Committee of the Júlio Muller University Hospital – Federal University of Mato Grosso (Hospital Universitário Júlio Muller – Universidade Federal de Mato Grosso – HUJM/UFMT) under Approval No. 1.443.713, of March 3, 2016). The VIGITEL project was approved by the National Committee for Research Ethics (Comissão Nacional de Ética em Pesquisa – CONEP-MS) under Approval No. 355.590, of June 26, 2013).
RESULTS
The mean age of the participants was 37.9 years (95%CI 36.9; 39.0) for women and 36.3 years (95%CI 35.0; 37.6) for men. In all, 50.9% (n=605) of the interviewees were women, and the majority were young adults aged 20 to 39 years (60.0%; n=455). Self-declared black skin color or pardos (69.7%; n=569) and individuals who lived with a partner (52.4%; n=559) predominated. Most of the interviewees had 9 or more complete years of study (70.9%; n=803) and 37.0% (n=276) of the women and 29.6% (n=148) of the men had 12 or more complete years of study.
Table I shows the frequency of consumption of healthy and unhealthy diet markers by gender. There were significant differences in the regular consumption of beans and meat with excess fat – higher among men – and in the regular consumption of fruits and vegetables, regular consumption of sweets and in the habit of replacing main meals with snacks, which were higher among women.
Durante GD, Guimarães LV, Segri NJ, Martins MSAS, Malta DC
Rev Bras Promoç Saúde, Fortaleza, 30(3): 1-12, jul./set., 20174
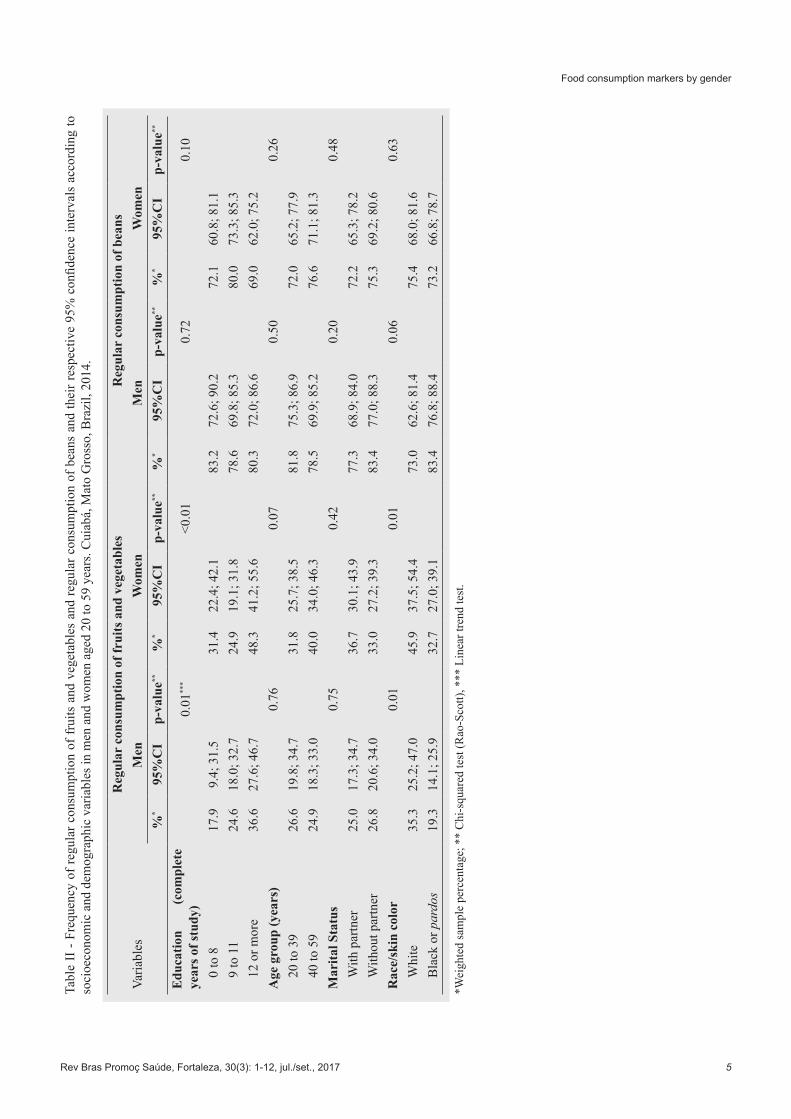
Tables II and III show the frequencies of consumption of dietary markers according to demographic and socioeconomic variables stratified by gender. Only the food consumption markers that were significantly different between the genders were analyzed (p<0.05), as shown in Table I.
Table I - Food consumption frequency and respective 95% confidence interval (95%CI) in men and women aged 20 to 59 years. Cuiabá, Mato Grosso, Brazil, 2014.
Food consumption markerTotal Men Women
p-value**
%* 95%CI %* 95%CI %* 95%CIRegular consumption of fruits and vegetables 30.7 27.4; 34.3 26.0 20.9; 31.7 35.2 30.8; 39.9 0.01Recommended consumption of fruits and vegetables 18.8 16.0; 21.9 15.8 11.8; 20.9 21.7 18.1; 25.8 0.06Regular consumption of beans 77.2 73.9; 80.2 80.6 75.5; 84.8 73.9 69.4; 77.9 0.04Consumption of meat with excess fat 46.6 42.8; 50.6 56.4 50.4; 62.3 37.3 32.6; 42.2 <0.01Consumption of fat milk 51.0 47.1; 54.9 54.9 48.8; 60.9 47.3 42.5; 52.2 0.06Regular consumption of sweet foods 16.7 14.1; 19.7 13.0 9.5; 17.7 20.3 16.7; 24.4 0.02Regular consumption of soft drinks 29.3 25.7; 33.1 32.1 26.6; 38.1 26.6 22.3; 31.3 0.14Replacement of main meals with snacks 12.3 10.1; 14.8 9.0 6.2; 12.7 15.4 12.3; 19.2 0.01Consumption of high or very high amounts of salt 18.0 15.2; 21.2 19.5 15.2; 24.6 16.7 13.2; 20.7 0.36
*Weighted sample percentage; ** Chi-squared test (Rao-Scott).
Regular consumption of fruits and vegetables among women was associated with higher levels of education and white race/skin color. Among men, the frequency of regular consumption of fruits and vegetables increased at an average rate of 9.3% according to the increase in the level of education (p=0.01) and was associated with white race/skin color. However, there were no significant associations between regular consumption of beans and demographic and socioeconomic variables for both genders (Table II).
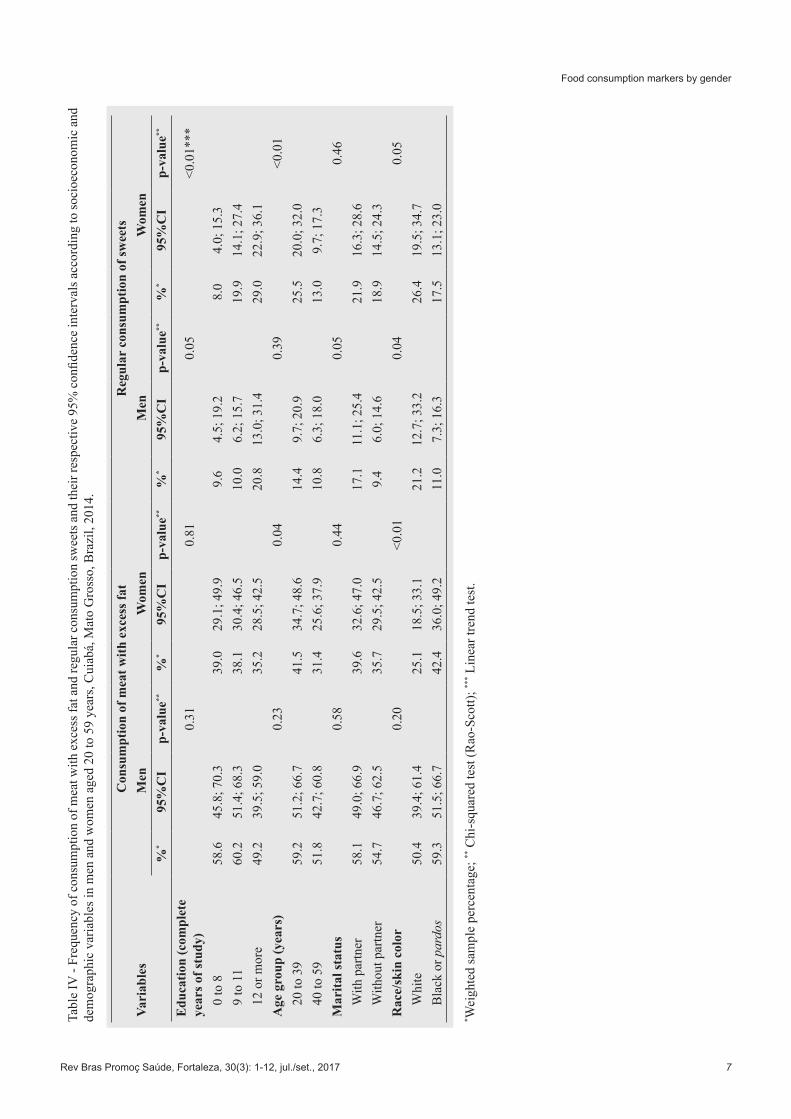
The self-reported consumption of meat with excess fat among men was not associated with demographic and socioeconomic variables. However, among women, the consumption of meat with excess fat was associated with the youngest age group (20-39 years) and black race/skin color or pardos (Table IV). The frequency of regular consumption of sweets among women increased at an average rate of 10.4% according to the increase in the level of education (p<0.01) and predominated in the younger age group (20-39 years). Regular consumption of sweets was higher in the white race/skin color in both genders (p<0.05) (Table IV).
The habit of replacing main meals with snacks 7 or more times per week was higher among women, with an increase proportional to the increase in the level of education (8.2%, p<0.01), and in women of white race/skin color. Among men, not having a partner was associated with the habit of replacing the main meals with snacks (Table III).
Food consumption markers by gender
Rev Bras Promoç Saúde, Fortaleza, 30(3): 1-12, jul./set., 2017 5
Tabl
e II
- Fr
eque
ncy
of re
gula
r con
sum
ptio
n of
frui
ts a
nd v
eget
able
s an
d re
gula
r con
sum
ptio
n of
bea
ns a
nd th
eir r
espe
ctiv
e 95
% c
onfid
ence
inte
rval
s ac
cord
ing
to
soci
oeco
nom
ic a
nd d
emog
raph
ic v
aria
bles
in m
en a
nd w
omen
age
d 20
to 5
9 ye
ars.
Cui
abá,
Mat
o G
ross
o, B
razi
l, 20
14.
Varia
bles
Reg
ular
con
sum
ptio
n of
frui
ts a
nd v
eget
able
sR
egul
ar c
onsu
mpt
ion
of b
eans
Men
Wom
enM
enW
omen
%*
95%
CI
p-va
lue**
%*
95%
CI
p-va
lue**
%*
95%
CI
p-va
lue**
%*
95%
CI
p-va
lue**
Edu
catio
n (c
ompl
ete
year
s of s
tudy
)0.
01**
*<0
.01
0.72
0.10
0 to
817
.99.
4; 3
1.5
31.4
22.4
; 42.
183
.272
.6; 9
0.2
72.1
60.8
; 81.
19
to 1
124
.618
.0; 3
2.7
24.9
19.1
; 31.
878
.669
.8; 8
5.3
80.0
73.3
; 85.
312
or m
ore
36.6
27.6
; 46.
748
.341
.2; 5
5.6
80.3
72.0
; 86.
669
.062
.0; 7
5.2
Age
gro
up (y
ears
)0.
760.
070.
500.
2620
to 3
926
.619
.8; 3
4.7
31.8
25.7
; 38.
581
.875
.3; 8
6.9
72.0
65.2
; 77.
940
to 5
924
.918
.3; 3
3.0
40.0
34.0
; 46.
378
.569
.9; 8
5.2
76.6
71.1
; 81.
3M
arita
l Sta
tus
0.75
0.42
0.20
0.48
With
par
tner
25.0
17.3
; 34.
736
.730
.1; 4
3.9
77.3
68.9
; 84.
072
.265
.3; 7
8.2
With
out p
artn
er26
.820
.6; 3
4.0
33.0
27.2
; 39.
383
.477
.0; 8
8.3
75.3
69.2
; 80.
6R
ace/
skin
col
or0.
010.
010.
060.
63W
hite
35.3
25.2
; 47.
045
.937
.5; 5
4.4
73.0
62.6
; 81.
475
.468
.0; 8
1.6
Bla
ck o
r par
dos
19.3
14.1
; 25.
932
.727
.0; 3
9.1
83.4
76.8
; 88.
473
.266
.8; 7
8.7
*Wei
ghte
d sa
mpl
e pe
rcen
tage
; **
Chi
-squ
ared
test
(Rao
-Sco
tt), *
** L
inea
r tre
nd te
st.

Durante GD, Guimarães LV, Segri NJ, Martins MSAS, Malta DC
Rev Bras Promoç Saúde, Fortaleza, 30(3): 1-12, jul./set., 20176
Tabl
e II
I - F
requ
ency
of r
epla
cem
ent o
f mai
n m
eals
with
snac
ks a
nd th
e re
spec
tive
95%
con
fiden
ce in
terv
al a
ccor
ding
soci
oeco
nom
ic a
nd d
emog
raph
ic v
aria
bles
in m
en a
nd
wom
en a
ged
20 to
59
year
s. C
uiab
á, M
ato
Gro
sso,
Bra
zil,
2014
.
Vari
able
sR
epla
cem
ent o
f mai
n m
eals
with
snac
ksM
enW
omen
%*
95%
CI
p-va
lue**
%*
95%
CI
p-va
lue**
Edu
catio
n (c
ompl
ete
year
s of s
tudy
)0.
09<0
.01**
*
0 to
83.
81.
2; 1
0.8
5.5
2.6;
11.
6
9 to
11
12.1
7.2;
19.
615
.510
.5; 2
2.5
12 o
r mor
e10
.96.
4; 1
8.2
22.1
16.7
; 28.
6
Age
gro
up (y
ears
)0.
280.
11
20 to
39
10.3
6.6;
15.
717
.613
.0 2
3.4
40 to
59
6.8
3.7;
12.
312
.59.
1; 1
6.8
Mar
ital s
tatu
s0.
020.
32
With
par
tner
13.0
8.3;
19.
8 17
.212
.3; 2
3.5
With
out p
artn
er5.
42.
9; 9
.7
13.7
10.1
; 18.
4
Rac
e/sk
in c
olor
0.35
0.06
Whi
te11
.96.
7; 2
0.3
20.0
13.9
; 28.
0
Bla
ck o
r par
dos
8.4
5.1;
13.
6 12
.79.
1; 1
7.5
* Wei
ghte
d sa
mpl
e pe
rcen
tage
; ** C
hi-s
quar
ed te
st (R
ao-S
cott)
; *** L
inea
r tre
nd te
st.
Food consumption markers by gender
Rev Bras Promoç Saúde, Fortaleza, 30(3): 1-12, jul./set., 2017 7
Tabl
e IV
- Fr
eque
ncy
of c
onsu
mpt
ion
of m
eat w
ith e
xces
s fat
and
regu
lar c
onsu
mpt
ion
swee
ts a
nd th
eir r
espe
ctiv
e 95
% c
onfid
ence
inte
rval
s acc
ordi
ng to
soci
oeco
nom
ic a
nd
dem
ogra
phic
var
iabl
es in
men
and
wom
en a
ged
20 to
59
year
s, C
uiab
á, M
ato
Gro
sso,
Bra
zil,
2014
.
Vari
able
sC
onsu
mpt
ion
of m
eat w
ith e
xces
s fat
Reg
ular
con
sum
ptio
n of
swee
tsM
enW
omen
Men
Wom
en%
*95
%C
Ip-
valu
e**%
*95
%C
Ip-
valu
e**%
*95
%C
Ip-
valu
e**%
*95
%C
Ip-
valu
e**
Edu
catio
n (c
ompl
ete
year
s of s
tudy
)0.
310.
810.
05<0
.01*
**
0 to
858
.645
.8; 7
0.3
39.0
29.1
; 49.
99.
64.
5; 1
9.2
8.0
4.0;
15.
39
to 1
160
.251
.4; 6
8.3
38.1
30.4
; 46.
510
.06.
2; 1
5.7
19.9
14.1
; 27.
412
or m
ore
49.2
39.5
; 59.
035
.228
.5; 4
2.5
20.8
13.0
; 31.
429
.022
.9; 3
6.1
Age
gro
up (y
ears
)0.
230.
040.
39<0
.01
20 to
39
59.2
51.2
; 66.
741
.534
.7; 4
8.6
14.4
9.7;
20.
925
.520
.0; 3
2.0
40 to
59
51.8
42.7
; 60.
831
.425
.6; 3
7.9
10.8
6.3;
18.
013
.09.
7; 1
7.3
Mar
ital s
tatu
s0.
580.
440.
050.
46W
ith p
artn
er58
.149
.0; 6
6.9
39.6
32.6
; 47.
017
.111
.1; 2
5.4
21.9
16.3
; 28.
6W
ithou
t par
tner
54.7
46.7
; 62.
535
.729
.5; 4
2.5
9.4
6.0;
14.
618
.914
.5; 2
4.3
Rac
e/sk
in c
olor
0.20
<0.0
10.
040.
05W
hite
50.4
39.4
; 61.
425
.118
.5; 3
3.1
21.2
12.7
; 33.
226
.419
.5; 3
4.7
Bla
ck o
r par
dos
59.3
51.5
; 66.
742
.436
.0; 4
9.2
11.0
7.3;
16.
317
.513
.1; 2
3.0
* Wei
ghte
d sa
mpl
e pe
rcen
tage
; ** C
hi-s
quar
ed te
st (R
ao-S
cott)
; *** L
inea
r tre
nd te
st.
Durante GD, Guimarães LV, Segri NJ, Martins MSAS, Malta DC
Rev Bras Promoç Saúde, Fortaleza, 30(3): 1-12, jul./set., 20178
DISCUSSION
The results of the present study revealed differences in the consumption of markers healthy and unhealthy dietary patterns between men and women. The consumption of healthy diet markers was characterized by higher regular consumption of fruits and vegetables among women and by higher regular consumption of beans among men. With regard to unhealthy diet markers, consumption of meat with excess fat predominated among men and regular consumption of sweets and replacement of main meals with snacks predominated among women.
With regard to healthy eating practices, the WHO(11) recommends a minimum daily consumption of 5 servings of fruits and vegetables, which corresponds to 400 grams daily of these foods. Fruits and vegetables are rich in vitamins, minerals and fiber and have a low energy density(12). Additionally, the adequate consumption of these foods helps to prevent NCDs and excessive weight gain(13), which is a risk factor for these diseases(12,13).
Only 18.8% of the study population reported meeting the recommended intake of fruits and vegetables, with no difference between the genders. These data are consistent with other studies carried out worldwide(14,15) and in other regions of Brazil(16,17), where a large part of the population consume fruits and vegetables less than recommended. The analysis of the regular consumption of fruits and vegetables revealed that 30.7% of the individuals reported consuming fruits and vegetables 5 or more days a week. Although it represents a little more than 1/3 of the population, this figure was higher than that found in studies carried out in other regions of Brazil(16-18).
In a cross-sectional study carried out in Pelotas, Rio Grande do Sul(18) with a sample of 972 individuals aged 20-69, the authors found that only one-fifth of the respondents (20.9%) reported regular consumption of fruits and vegetables. This frequency was substantially higher among women (26.9%) compared with men (12.9%). This difference was also found in the present study. The greater consumption of fruits and vegetables by women seems to be related to the better perception of the health benefits of such consumption and its role in the prevention/control of diseases(19) and the association with a healthier diet(20).
In addition, regular consumption of fruits and vegetables was more frequent among women with 12 or more years of study in the present study, and it increased proportionally to the increase in the level of education among men. There was a higher frequency of regular consumption of fruits and vegetables among individuals of white race/skin color in both genders. In a cross-sectional study(15) conducted in Canada with 93,719 people aged 18-69 years to assess the frequency of daily fruit and vegetable consumption and associated factors, the authors also found that groups of individuals of lower socioeconomic status (low income and education) consumed fruits and vegetables less frequently than those with better income and higher levels of education(15). In Pelotas, Rio Grande do Sul(18), there was a higher regular consumption of fruits and vegetables among individuals of better socioeconomic status (Classes A and B), with no differences between races/skin color.
The variable race/skin color can be understood as a marker of social inequality(21), and in Brazil, despite the advances in income distribution, there is a greater proportion of black individuals or pardos in the lower income strata(22). Consumption of fruits and vegetables is directly influenced by their price and purchasing power in such a way that individuals with higher income generally spend more on food and buy more fruits and vegetables(19,23).
There was a high regular consumption of beans among individuals of both genders; however it was higher among men, which corroborates other national studies(24,25). There were no significant differences in the consumption of beans according to the demographic and socioeconomic variables for both genders, which suggests that this consumption is a characteristic of the Brazilian diet. The consumption of beans in combination with rice is part of the traditional Brazilian diet, and this combination is considered nutritionally adequate for it combines essential amino acids(12). However, the results of the Household Budget Survey (Pesquisa de Orçamentos Familiares – POF)(3), which assessed food availability in households, showed that there was a reduction in the average per capita amount of beans, going from 12.4 Kg in 2002-2003 to 9.1 Kg in 2008-2009, which represents a reduction of 26.4% in the acquisition of this food. Importantly, the data do not include the consumption of beans outside the home; therefore, the consumption of beans may be higher since. However, recent VIGITEL data show that the consumption of beans remained stable in the last decade, with Cuiabá ranking fourth in consumption of beans among the Brazilian capitals(8).
As for unhealthy diet markers, 46.6% of the interviewees reported consuming meats with excess fat and 51.0% said they consumed fat milk. Foods of animal origin, including meat, poultry, fish, eggs, milk and dairy products, are important sources of proteins with a high biological value, iron and vitamins(12). However, such foods are also rich in saturated fat, which has been linked to an increased risk of developing cardiovascular diseases(26). The Dietary Guidelines for the Brazilian Population (Guia Alimentar para a População Brasileira)(12) recommends that adults should, whenever possible, choose milk and dairy derivatives with lower amounts of fats. In addition, adults should choose lean meats and remove all apparent fat before preparation.
The higher consumption of meat among men has been reported in other national studies(21,25,27,28). In the present study, there were no significant differences in consumption of meat with excess fat among men according to demographic and socioeconomic variables. However, a higher consumption was observed among women in the youngest age group (20-39 years) and those of black race or pardos. Data from a cross-sectional study(21) with 45,448 adults from the Brazilian capitals and the Federal District interviewed by VIGITEL in 2012 also found that self-declared black or pardo women consumed more meat with excess fat than

Food consumption markers by gender
Rev Bras Promoç Saúde, Fortaleza, 30(3): 1-12, jul./set., 2017 9
their white peers. In a population-based study(28) conducted in the urban area of Pelotas, Rio Grande do Sul, in 2010 with 2,732 adults aged 20 years and over to describe the frequency of meat consumption and the habit of consuming them with excess fat, the authors found that meat with excess fat was consumed by 52.3% of the adults, mainly men (66.7%), and by people aged between 30 and 39 years with low levels of education and of low economic status (classes D and E). However, data stratified by gender were not presented, which prevented comparisons with the findings of the present study. Data from the 2013 National Health Survey show that the state of Mato Grosso presents the second highest prevalence of meat consumption with excess fat in the country, demonstrating that it is a traditional regional habit(29).
The WHO(2) recommends that the intake of free sugars should be reduced to less than 10% of the total daily energy intake, which is equivalent to 50g for a normal weight person who consumes about 2,000 calories per day. Free sugars are all sugars added to foods or drinks and also those naturally present in honey, syrups, natural fruit juices and concentrates. The intake of sugars can be reduced by limiting the consumption of sugary drinks, soft drinks and sweets in general(2). The population of the present study presented a high regular consumption of sweets and soft drinks, which are sources of free sugars. Of all the participants, 16.7% said they regularly consume sweets and 29.3% reported regular consumption of soft drinks. The consumption of sweets, such as ice cream, chocolates, cakes, cookies or candies, 5 or more days a week was significantly higher among women (20.3%) and was directly associated with higher levels of education and more frequent among younger and white women.
In a population-based survey(30) of 3,136 individuals aged 20 years or older living in the urban area of Pelotas using a pre-coded questionnaire on the 10 Steps to Healthy Eating, which is based on the recommendations of the Dietary Guidelines for the Brazilian Population(12), the lowest rates of adherence to step 6 (consumption of sweets, cakes, cookies and other foods rich in sugar up to two days a week) among women were found in the youngest age group (20-39 years old) and in those with higher levels of education. These data are similar to the results found in the present study.
The difference in the consumption of sweets between men and women has been described in other studies(25,29,31,32). In a cross-sectional study(32) conducted with data from 37,181 French people aged ≥ 20 years who completed online questionnaires, the authors investigated the association between liking for salty and sweet tastes and sociodemographic, psychological, and lifestyle characteristics. The study showed that salt liking increased with age, especially in men, while sweet liking decreased with age, especially among women. This result corroborates the higher consumption of sweets among women aged 20 to 39 years in the present study. Smokers and drinkers were more likely to like salt(32). In general, men drink and smoke more than women(31), which could partly explain their lower consumption of sweets. In addition, the authors found that sweet liking was higher in women who were emotional eaters, which is the propensity to overeat in relation to negative mood states(32).
Different hypotheses can be raised to explain the preference for sweets by women with higher levels of education. In addition to the aforementioned characteristics, which are related to the higher sweet liking among women, the stress to which women are subjected, resulting from the overload of activities/work, the greater purchasing power to buy a large variety of foods(23) – and, consequently, processed and ultra-processed foods, which have an increasing supply, and advertisements and sales that stimulate the purchasing of these foods(33) could be related to the greater consumption of sweets in this population group.
The habit of replacing meals with snacks such as sandwiches, salads, pizza or other snacks 7 or more times a week was observed in 12.3% of the study population. This habit predominated among women and its frequency increased proportionally to the increase in the level of education. Among men, the highest frequency of replacing main meals with snacks was observed in those who lived without a partner (single, separated/divorced and widowed individuals).
The frequent replacement of lunch and/or dinner with snacks is probably due to factors related to changes in people’s lifestyles over the years. There is a tendency towards “convenience and practicality” and meals are mostly eaten outside the home, mainly due to the rhythm of life in the urban centers, the insertion of women in the labor market, lack of time for food preparation, and loss of cooking skills, which stimulates the demand for ultra-processed foods rich in salt, fats and preservatives(33-35), which increase the risk of excessive weight gain and other chronic diseases(12,26,35).
The 2014 Dietary Guidelines for the Brazilian Population(33) emphasize the preference of natural or minimally processed foods and food preparations over ultra-processed foods. The recommendations include eating regularly and carefully, trying to have daily meals at similar times and avoiding “nibbles” in the intervals between meals. The time of meals should also be valued and the person should eat in appropriate environments in company of someone else and share the household activities that precede or succeed the consumption of meals. These guidelines should be part of the recommendations provided by health professionals in order to rescue food preparation, local cooking, the pleasure of sharing food with family, friends, co-workers or schoolmates(33).
Self-reported use of very high salt amounts in food preparations was significant in the study population (18.0%), with no statistically significant differences between the genders. In a cross-sectional study(36) of data from the National Health Survey (Pesquisa Nacional de Saúde – PNS) and the 2013 VIGITEL, the authors found that in Brazil the overall prevalence of adults who reported high salt intake was 14.2% and 15.0% (VIGITEL) in the capitals, being higher among men.
Durante GD, Guimarães LV, Segri NJ, Martins MSAS, Malta DC
Rev Bras Promoç Saúde, Fortaleza, 30(3): 1-12, jul./set., 201710
The authors point out that the results of the study are not an accurate figure of the actual salt intake by the adult population of the country, since data from the National Food Survey of 2008-2009 POF showed an inadequate and excessive intake of sodium by 89.3 % of men and 70% of women in the country(37). Additionally, high salt intake was found in 16.1% of men and 12.5% of women participating in the PNS(36). The comparison shows that the population’s ability to recognize their salt intake is far below ideal.
In the present study, differences between methods for assessing diet and defining and categorizing the frequency of food consumption hinder comparison with other studies on food consumption by the population. In addition, all the information obtained were self-reported, which may lead to memory biases or even tendentious statements that represent what is desirable. However, studies comparing estimates for self-reported chronic conditions between household and telephone-based surveys have shown that both provide similar results(38,39), including with regard to nutritional markers(40).
Telephone coverage is one of the main limitations of telephone surveys. Such coverage is clearly not universal(9) and it may be particularly poor in least developed cities and in population groups of lower socioeconomic status(8). However, the use of post-stratification weights allows matching the sociodemographic composition estimated for the adult population with telephone included in the VIGITEL sample in each city to the sociodemographic composition estimated for the total adult population of the same city and in the same year of the survey(8,9). Public policies aimed at nutrition education and the promotion of healthy eating are urgent and necessary.
CONCLUSION
In the present study, there were important differences in food consumption among men and women living in Cuiabá, Mato Grosso, Brazil. Regular consumption of fruits and vegetables was higher among women and regular consumption of beans was higher among men. Men reported higher consumption of meats with excess fat, and women reported higher regular consumption of sweets and the habit of replacing main meals with snacks. Education and race/skin color were variables that were associated with most food consumption markers.
REFERENCES
1. Louzada MLC, Martins APB, Canella DS, Levy RB, Claro RM, Moubarac JC, et al. Alimentos ultraprocessados e perfil nutricional da dieta no Brasil. Rev Saude Publica. 2015;49:38.
2. World Health Organization. Media Centre. Healthy diet: Fact sheet nº 394 [Internet]. Geneva: WHO; 2015 [accessed on 2017 Jan 28]. Available from: http://www.who.int/mediacentre/factsheets/fs394/en/
3. Instituto Brasileiro de Geografia e Estatística (BR). Pesquisa de orçamentos familiares (POF) 2008-2009: aquisição alimentar domiciliar per capita Brasil e Grandes Regiões. Rio de Janeiro: IBGE; 2010.
4. World Health Organization. Noncommunicable diseases country profiles 2011. Geneva: WHO; 2011.
5. Ministério da Saúde (BR), Secretaria de Vigilância em Saúde, Departamento de Análise de Situação de Saúde. Plano de ações estratégicas para o enfrentamento das doenças crônicas não transmissíveis (DCNT) no Brasil 2011-2022. Brasília: Ministério da Saúde; 2011. (Série B. Textos Básicos de Saúde).
6. Ministério da Saúde (BR), Secretaria de Vigilância em Saúde, Departamento de Análise de Situação de Saúde. VIGITEL Brasil 2013: vigilância de fatores de risco e proteção para doenças crônicas por inquérito telefônico. Brasília: Ministério da Saúde; 2014. (Série G. Estatística e Informação em Saúde).
7. Serra-Majem L, Bautista-Castaño I. Etiology of obesity: two “key issues” and other emerging factors. Nutr Hosp. 2013;28(Suppl 5):32-43.
8. Ministério da Saúde (BR), Secretaria de Vigilância em Saúde, Departamento de Análise de Situação de Saúde. VIGITEL Brasil 2014: vigilância de fatores de risco e proteção para doenças crônicas por inquérito telefônico. Brasília: Ministério da Saúde; 2015. (Série G. Estatística e Informação em Saúde).
9. Gubert MB, Santos LMP, Moura EC. Estratégias de diagnóstico nutricional rápido em populações. In: Taddei JAAC, Lang RMF, Longo-Silva G, Toloni MHA, editores. Nutrição em Saúde Pública. Rio de Janeiro: Rubio; 2011. p. 151-64.
10. StataCorp. Stata statistical software: release 13. College Station: StataCorp LP; 2013.
11. World Health Organization. Diet, nutrition and the prevention of chronic diseases. Report of a Joint WHO/FAO Expert Consultation. Geneva: WHO; 2003.

Food consumption markers by gender
Rev Bras Promoç Saúde, Fortaleza, 30(3): 1-12, jul./set., 2017 11
12. Ministério da Saúde (BR), Secretaria de Atenção à Saúde, Departamento de Atenção Básica, Coordenação-Geral da Política de Alimentação e Nutrição. Guia alimentar para a população brasileira: promovendo a alimentação saudável. Brasília: Ministério da Saúde; 2006. (Série A. Normas e Manuais Técnicos).
13. Boeing H, Bechthold A, Bub A, Ellinger S, Haller D, Kroke A, et al. Critical review: vegetables and fruit in the prevention of chronic diseases. Eur J Nutr. 2012;51(6):637-63.
14. Hall JN, Moore S, Harper SB, Lynch JW. Global variability in fruit and vegetable consumption. Am J Prev Med. 2009;36(5):402-9.
15. Azagba S, Sharaf MF. Disparities in the frequency of fruit and vegetable consumption by socio-demographic and lifestyle characteristics in Canada. Nutr J. 2011;10:118.
16. Mondini L, Moraes SA, Freitas ICM, Gimeno SGA. Consumo de frutas e hortaliças por adultos em Ribeirão Preto, SP. Rev Saúde Pública. 2010;44(4):686-94.
17. Azevedo ECC, Diniz AS, Monteiro JS, Cabral PC. Padrão alimentar de risco para as doenças crônicas não transmissíveis e sua associação com a gordura corporal: uma revisão sistemática. Ciênc Saúde Coletiva. 2014;19(5):1447-58.
18. Neutzling MB, Rombaldi AJ, Azevedo MR, Hallal PC. Fatores associados ao consumo de frutas, legumes e verduras em adultos de uma cidade no Sul do Brasil. Cad Saúde Pública. 2009;25(11):2365-74.
19. Figueira TR, Lopes ACS, Modena CM. Barreiras e fatores promotores do consumo de frutas e hortaliças entre usuários do Programa Academia da Saúde. Rev Nutr. 2016;29(1):85-95.
20. Figueira TR, Lopes ACS, Modena CM. Avaliação do consumo de frutas e hortaliças entre famílias de usuários do Programa Academia da Saúde (PAS). Rev Bras Promoç Saúde. 2014;27(4):518-26.
21. Malta DC, Moura L, Bernal RTI. Diferenciais dos fatores de risco de Doenças Crônicas não Transmissíveis na perspectiva de raça/cor. Ciênc Saúde Coletiva. 2015;20(3):713-25.
22. Instituto de Pesquisa Econômica Aplicada (BR). Retrato das desigualdades de gênero e raça. 4ª ed. Brasília: IPEA; 2011.
23. Pechey R, Monsivais P. Socioeconomic inequalities in the healthiness of food choices: Exploring the contributions of food expenditures. Prev Med. 2016;88:203-9.
24. Velásquez-Meléndez G, Mendes LL, Pessoa MC, Sardinha LMV, Yokota RTC, Bernal RTI, et al. Tendências da frequência do consumo de feijão por meio de inquérito telefônico nas capitais brasileiras, 2006 a 2009. Ciênc Saúde Coletiva. 2012;17(12):3363-70.
25. Souza AM, Pereira RA, Yokoo EM, Levy RB, Sichieri R. Alimentos mais consumidos no Brasil: Inquérito Nacional de Alimentação 2008-2009. Rev Saúde Pública. 2013;47(Supl 1):190S-9S.
26. Mozaffarian D, Micha R, Wallace S. Effects on coronary heart disease of increasing polyunsaturated fat in place of saturated fat: a systematic review and meta-analysis of randomized controlled trials. PLoS Med. 2010;7(3):e1000252.
27. Carvalho AM, César CLG, Fisberg RM, Marchioni DML. Excessive meat consumption in Brazil: diet quality and environmental impacts. Public Health Nutr. 2013;16(10):1893-9.
28. Schneider BC, Duro SMS, Assunção MCF. Consumo de carnes por adultos do sul do Brasil: um estudo de base populacional. Ciênc Saúde Coletiva. 2014;19(8):3583-92.
29. Claro RM, Santos MAS, Oliveira TP, Pereira CA, Szwarcwald CL, Malta DC. Consumo de alimentos não saudáveis relacionados a doenças crônicas não transmissíveis no Brasil: Pesquisa Nacional de Saúde, 2013. Epidemiol Serv Saúde. 2015;24(2):257-65.
30. Vinholes DB, Assunção MCF, Neutzling MB. Frequência de hábitos saudáveis de alimentação medidos a partir dos 10 Passos da Alimentação Saudável do Ministério da Saúde. Pelotas, Rio Grande do Sul, Brasil. Cad Saúde Pública. 2009;25(4):791-9.
31. Malta DC, Campos MO, Oliveira MM, Iser BPM, Bernal RTI, Claro RM, et al. Prevalência de fatores de risco e proteção para doenças crônicas não transmissíveis em adultos residentes em capitais brasileiras, 2013. Epidemiol Serv Saúde. 2015;24(3):373-87.
32. Lampuré A, Schlich P, Deglaire A, Castetbon K, Péneau S, Hercberg S, et al. Sociodemographic, psychological, and lifestyle characteristics are associated with a liking for salty and sweet tastes in French adults. J Nutr. 2015 Mar;145(3):587-94.
Durante GD, Guimarães LV, Segri NJ, Martins MSAS, Malta DC
Rev Bras Promoç Saúde, Fortaleza, 30(3): 1-12, jul./set., 201712
33. Ministério da Saúde (BR), Secretaria de Atenção à Saúde, Departamento de Atenção Básica. Guia alimentar para a população brasileira. 2ª ed. Brasília: Ministério da Saúde; 2014.
34. Bezerra IN, Cavalcante JB, Moreira TMV, Mota CC, Sicheiri R. Alimentação fora de casa e excesso de peso: uma análise dos mecanismos explicativos. Rev Bras Promoç Saúde. 2016;29(3):455-61.
35. Bezerra IN, Souza AM, Pereira RA, Sichieri R. Contribution of foods consumed away from home to energy intake in Brazilian urban areas: the 2008–9 Nationwide Dietary Survey. Br J Nutr. 2013;109(7):1276-83.
36. Oliveira MM, Malta DC, Santos MAS, Oliveira TP, Nilson EAF, Claro RM. Consumo elevado de sal autorreferido em adultos: dados da Pesquisa Nacional de Saúde, 2013. Epidemiol Serv Saúde. 2015;24(2):249-56.
37. Araujo MC, Bezerra IN, Barbosa FS, Junger WL, Yokoo EM, Pereira RA, et al. Consumo de macronutrientes e ingestão inadequada de micronutrientes em adultos. Rev Saúde Pública. 2013;47(Supl 1):177S-89S.
38. Francisco PMSB, Barros MBA, Segri NJ, Alves MCGP, Cesar CLG, Malta DA. Comparação de estimativas para o auto-relato de condições crônicas entre inquérito domiciliar e telefônico - Campinas (SP), Brasil. Rev Bras Epidemiol. 2011;14(Supl 1):5-15.
39. Francisco PMSB, Barros MBA, Segri NJ, Alves MCGP. Comparação de estimativas de inquéritos de base populacional. Rev Saúde Pública. 2013;47(1):60-8.
40. Monteiro CA, Moura EC, Jaime PC, Claro RM. Validade de indicadores do consumo de alimentos e bebidas obtidos por inquérito telefônico. Rev Saúde Pública. 2008;42(4):582-9.
Mailing address:Gabriela Dalcin DuranteUniversidade Federal de Mato GrossoCampus Cuiabá, Bloco CCBS III, Nesan - Grupo de Pesquisa Epidemiologia em Saúde e NutriçãoAv. Fernando Corrêa da Costa, 2367Bairro: Boa EsperançaCEP: 78060-900 - Cuiabá - MT - BrasilE-mail: [email protected]


![[PT] trendwatching.com’s GUILT-FREE CONSUMPTION](https://static.fdocumentos.tips/doc/165x107/54bf9a4e4a7959982c8b4587/pt-trendwatchingcoms-guilt-free-consumption.jpg)