DOI: 10.5433/1679-0359.2020v41n3p847 Tracing the origin of ...
18
847 Semina: Ciências Agrárias, Londrina, v. 41, n. 3, p. 847-864, maio/jun. 2020 DOI: 10.5433/1679-0359.2020v41n3p847 Received: June 04, 2019 - Approved: Jan. 20, 2020 Tracing the origin of reservoir sediments using magnetic properties in Southeastern Brazil Traçando a origem de sedimentos de reservatórios usando propriedades magnéticas no Sudeste do Brasil Pedro Luiz Terra Lima 1* ; Marx Leandro Naves Silva 2 ; John Norman Quinton 3 ; Alona Armstrong 4 ; Alberto Vasconcellos Inda 5 ; Pedro Velloso Gomes Batista 6 ; Giovana Clarice Poggere 7 ; Nilton Curi 2 Highlights: A magnetic tracing analysis to link upstream areas to reservoir sedimentation is used in a subtropical environment. Tropical weathering conditions promote magnetic variability between soils. Magnetic parameters can identify possible sediment sources in a tropical environment in order to reduce water erosion impacts. Abstract Determining the origin of eroded soil is essential to design effective soil erosion control strategies which preserve the soil resource, enhance agricultural productivity, and reduce the negative impacts of soil erosion, in-field and off-field. Magnetic properties have been widely used in temperate environments to identify sediment sources, pathways and links, but there have been very few applications in tropical and subtropical environments. Therefore, in this paper we investigated reservoir sediment sources in the Upper Grande River Basin, Southeastern Brazil, using sediment tracing techniques based on magnetic parameters (low and high frequency magnetic susceptibility, frequency dependent susceptibility). The different parent materials and subtropical weathering conditions resulted in soils having different Fe oxide minerals and Fe oxide contents, promoting magnetic variability that allowed comparison and identification of possible sources of reservoir sediments in order to reduce water erosion impacts. The results indicate the suitability of magnetic properties as a tracer for soil erosion studies in tropical environments. Key words: Natural resources. Sediment sources. Soil erosion. Tropical environment. 1 Researcher Dr., University of California Davis, Department of Plant Sciences, Davis, CA, United States of America. E-mail: [email protected] 2 Profs. Drs., Universidade Federal de Lavras, UFLA, Departamento de Ciência do Solo, Lavras, MG, Brasil. E-mail: marx@ufla. br; niltcuri@ufla.br 3 Prof. Dr., Lancaster University, Lancaster Environmental Centre, Lancaster, United Kingdom. E-mail: [email protected] 4 Prof. Dr., Lancaster University, Energy Lancaster, Lancaster Environmental Centre, Lancaster, United Kingdom. E-mail: [email protected] 5 Prof. Dr., Universidade Federal do Rio Grande do Sul, UFRGS, Departamento de Ciência do Solo, Porto Alegre, RS, Brasil. E-mail: [email protected] 6 Researcher Dr., University of Basel, Department of Environmental Geosciences, Basel, Switzerland. E-mail: pbatista.ufla@ gmail.com 7 Prof. Dr., Universidade Tecnológica Federal do Paraná, UTFPR, Departamento de Ciências Biológicas e Ambientais, Medianeira, PR, Brasil. E-mail: [email protected] * Author for correspondence
Transcript of DOI: 10.5433/1679-0359.2020v41n3p847 Tracing the origin of ...
847Semina: Ciências Agrárias, Londrina, v. 41, n. 3, p. 847-864, maio/jun. 2020
DOI: 10.5433/1679-0359.2020v41n3p847
Received: June 04, 2019 - Approved: Jan. 20, 2020
Tracing the origin of reservoir sediments using magnetic properties in Southeastern Brazil
Traçando a origem de sedimentos de reservatórios usando propriedades magnéticas no Sudeste do Brasil
Pedro Luiz Terra Lima1*; Marx Leandro Naves Silva2; John Norman Quinton3; Alona Armstrong4; Alberto Vasconcellos Inda5; Pedro Velloso Gomes Batista6;
Giovana Clarice Poggere7; Nilton Curi2
Highlights:A magnetic tracing analysis to link upstream areas to reservoir sedimentation is used in a subtropical environment.Tropical weathering conditions promote magnetic variability between soils.Magnetic parameters can identify possible sediment sources in a tropical environment in order to reduce water erosion impacts.
Abstract
Determining the origin of eroded soil is essential to design effective soil erosion control strategies which preserve the soil resource, enhance agricultural productivity, and reduce the negative impacts of soil erosion, in-field and off-field. Magnetic properties have been widely used in temperate environments to identify sediment sources, pathways and links, but there have been very few applications in tropical and subtropical environments. Therefore, in this paper we investigated reservoir sediment sources in the Upper Grande River Basin, Southeastern Brazil, using sediment tracing techniques based on magnetic parameters (low and high frequency magnetic susceptibility, frequency dependent susceptibility). The different parent materials and subtropical weathering conditions resulted in soils having different Fe oxide minerals and Fe oxide contents, promoting magnetic variability that allowed comparison and identification of possible sources of reservoir sediments in order to reduce water erosion impacts. The results indicate the suitability of magnetic properties as a tracer for soil erosion studies in tropical environments.Key words: Natural resources. Sediment sources. Soil erosion. Tropical environment.
1 Researcher Dr., University of California Davis, Department of Plant Sciences, Davis, CA, United States of America. E-mail: [email protected]
2 Profs. Drs., Universidade Federal de Lavras, UFLA, Departamento de Ciência do Solo, Lavras, MG, Brasil. E-mail: [email protected]; [email protected]
3 Prof. Dr., Lancaster University, Lancaster Environmental Centre, Lancaster, United Kingdom. E-mail: [email protected] Prof. Dr., Lancaster University, Energy Lancaster, Lancaster Environmental Centre, Lancaster, United Kingdom. E-mail:
[email protected] Prof. Dr., Universidade Federal do Rio Grande do Sul, UFRGS, Departamento de Ciência do Solo, Porto Alegre, RS, Brasil.
E-mail: [email protected] Researcher Dr., University of Basel, Department of Environmental Geosciences, Basel, Switzerland. E-mail: pbatista.ufla@
gmail.com7 Prof. Dr., Universidade Tecnológica Federal do Paraná, UTFPR, Departamento de Ciências Biológicas e Ambientais, Medianeira,
PR, Brasil. E-mail: [email protected]* Author for correspondence
848Semina: Ciências Agrárias, Londrina, v. 41, n. 3, p. 847-864, maio/jun. 2020
Lima, P. L. T. et al.
Resumo
Determinar a origem de solos erodidos é essencial para projetar estratégias efetivas de controle da erosão do solo que preservem os recursos do solo, aumentem a produtividade agrícola e reduzam os impactos negativos da erosão do solo, em campo e fora dele. As propriedades magnéticas têm sido amplamente utilizadas em ambientes temperados para identificar fontes, vias e elos de sedimentos, mas existem pouquíssimas aplicações em ambientes tropicais. Portanto, neste trabalho investigamos fontes de sedimentos de reservatórios na Bacia do Alto Rio Grande, Sudeste do Brasil, utilizando técnicas de rastreamento de sedimentos baseadas em parâmetros magnéticos (suscetibilidade magnética de baixa e alta freqüência, susceptibilidade dependente da freqüência). Os diferentes materiais de origem e condições de intemperismo tropical resultaram em solos com diferentes minerais de óxido de Fe e teores de óxidos de Fe, promovendo variabilidade magnética que permitiu a comparação e identificação de possíveis fontes de sedimentos de reservatórios para reduzir os impactos da erosão hídrica. Os resultados indicam a adequação das propriedades magnéticas como um traçador para estudos de erosão do solo em ambientes tropicais.Palavras-chave: Ambiente tropical. Erosão do solo. Fontes de sedimentos. Recursos naturais.
Introduction
Soil erosion by water is a major consequence of land degradation and results in a consequent reduction in agricultural productivity worldwide (Pimentel et al., 1995). Negative effects of water-driven soil erosion include off-field impacts such as changes in water quality, disruption to biological processes, and siltation of streams and reservoirs (Jain & Singh, 2003; Batista et al., 2017; Bostanmaneshrad et al., 2018).
In Brazil, water erosion has increased exponentially due to agricultural expansion (Oliveira, Nearing, & Wendland, 2015; Anache, Wendland, Oliveira, Flanagan, & Nearing, 2017). Hence, consequent sedimentation due to accelerated erosion of fine-grained sediment leads to a reduction in water availability and a deterioration in water quality (Araujo, Güntner, & Bronstert, 2006; Batista et al., 2017). Furthermore, finding the origin of the eroded soil and sediments can contribute to the preservation of natural resources and mitigate the off-field impacts by enabling targeted soil erosion and sediment control strategies (Collins, Walling, Sichingabula, & Leeks, 2001).
Research into soil and sediment losses by erosion have traditionally used standard erosion plots for
monitoring water-driven erosion (Wischmeier & Smith, 1978; Anache et al., 2017). Certainly, erosion rate quantification using these methods is an essential part of monitoring agricultural practices in order to determine how soil management systems affect water and sediment runoff (Zhang, Nearing, Garbrecht, & Steiner, 2004; Bispo et al., 2017; Le Gall et al., 2017; Saran, Meneghine, Célico, Pinheiro, & Alves, 2017). However, although capable of providing useful information, such plots have limitations in terms of data representativeness, spatial and temporal resolution, and cost (Armstrong, Quinton, & Maher, 2012; Guzmán, Quinton, Nearing, Mabit, & Gómez, 2013; Deasy, Titman, & Quinton, 2014; Batista, Davies, Silva & Quinton, 2019).
Alternatively, soil tracers can be used to identify eroding areas (Guzmán et al., 2013; Collins et al., 2017). Tracer methodologies are used to determine soil loss ratio or sediment production and to track soil redistribution through the landscape (Guzmán et al., 2013). One of the main groups of tracing studies is based on the principle that suspended sediments retain some of the properties acquired at their origin, such that a sediment sample transported through the landscape can be compared to potential sources within the watershed. This technique is
849Semina: Ciências Agrárias, Londrina, v. 41, n. 3, p. 847-864, maio/jun. 2020
Tracing the origin of reservoir sediments using magnetic properties in Southeastern Brazil
called “fingerprinting” (Collins & Walling, 2002; Armstrong et al., 2012; Walling, 2013; Collins et al., 2017).
Various sediment properties have been used in sediment tracing and finger-printing studies, including chemical (organic C, inorganic C, total C, C/N, pH, extractable Ca, extractable Mg, extractable K, extractable Na, δ13C, δ15N, total Si, Al, Ag, Bi, Cd, Cr, Hg, Fe, Ca, Mg, Mn, Na, K, Ti, P, Zn, Sr, Pb, Ni, Cu, As, Mo, Sn, U, Pb, Sb, Sn, inorganic P, organic P, total P, 204Pb, 206Pb, 207Pb, 208Pb), physical (sand, clay and silt fraction, water dispersible clay, aggregation index, 137Cs, 40K, 226Ra, unsupported 210Pb), biological (sterol rations, E. coli, Enterococci bacterial signatures) and magnetic properties (Guzmán et al., 2013).
As a low cost alternative, magnetic properties are widely used in temperate environments to identify sediment sources, pathways and links. In fact, different natural materials display different magnetic properties, often enabling magnetic mineral identification, helping soil classification and identification of soil-forming processes, as well as attribution of the eroded sediment source (Walden, Oldfield, & Smith, 1999). Several factors can directly influence the magnetic variables that can be used for tracing sediments: soil parent material influences the primary, detrital mineralogy type and content of iron oxides: relief, landscape position, vegetation, weathering conditions and climate can all subsequently influence the pedogenic magnetic characteristics of the soil (Maher, 1998; Blundell, Dearing, Boyle, & Hannam, 2009). Consequently, soils, sediments and rocks from different locations in a catchment are characterized by different magnetic properties that can be relatively easily quantified (Maher, Watkins, Brunskill, Alexander, & Fielding, 2009).
Soil magnetic properties as sediment fingerprints have been widely applied in temperate zones (Royall, 2003; Hatfield & Maher, 2009; Armstrong et al., 2012). However, there have been very few
applications of magnetic sediment tracing in the tropics. In Brazil, magnetic sediment fingerprinting has been successfully applied to investigate environmental processes, indicating the potential for the technique to improve soil and sediment erosion control. In addition, magnetic mineralogy fingerprinting was applied in Southern Brazil and detected a shift in sediment delivery at the estuary of the Paraná River from distinct sources of sediments, from fine-grained magnetite to coarse-grained hematite derived from basalt (Mathias, Nagai, Trindade, & Mahiques, 2014). Moreover, magnetic susceptibility was also successfully used as a predictor of erodibility factors in the modeling process for large tropical areas (Barbosa et al., 2019).
Therefore, this research aims to add to our knowledge of how magnetic sediment tracing performs in subtropical environments. In this work, we have, for the first time in Brazil, used magnetic properties as a tracer to characterize soil and to link upstream areas to reservoir sedimentation. Specifically, the objectives were to identify the origin of sediments at the Upper Grande River Basin, a tributary of the Paraná River, Southeastern Brazil, by sampling sediments from the bottom of small reservoirs and comparing magnetic characteristics to those of highly eroded potential soils in upstream areas.
Materials and Methods
The study area is in the Upper Grande River Basin, one of the main tributaries of the Paraná River, at Lavras, Minas Gerais State, Brazil (21.13° S, 44.58° E) (Figure 1A). The area’s climate is classified as Cwb, a subtropical highland climate or monsoon-influenced temperate oceanic climate with a dry winter and a rainy summer, according to the Kӧppen classification system (Alvares et al., 2013). The average annual rainfall is 1,530 mm and the mean annual temperature 19.4 ºC (Dantas, Carvalho, & Ferreira, 2007).
850Semina: Ciências Agrárias, Londrina, v. 41, n. 3, p. 847-864, maio/jun. 2020
Lima, P. L. T. et al.
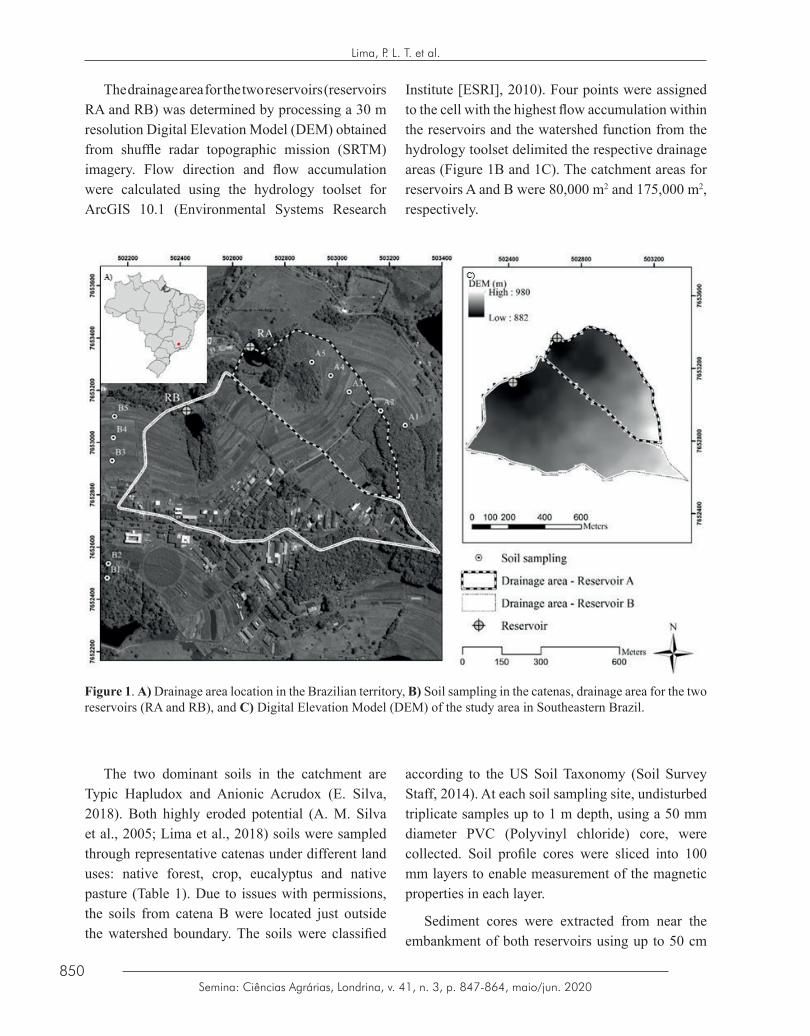
The drainage area for the two reservoirs (reservoirs RA and RB) was determined by processing a 30 m resolution Digital Elevation Model (DEM) obtained from shuffle radar topographic mission (SRTM) imagery. Flow direction and flow accumulation were calculated using the hydrology toolset for ArcGIS 10.1 (Environmental Systems Research
Institute [ESRI], 2010). Four points were assigned to the cell with the highest flow accumulation within the reservoirs and the watershed function from the hydrology toolset delimited the respective drainage areas (Figure 1B and 1C). The catchment areas for reservoirs A and B were 80,000 m2 and 175,000 m2, respectively.
Figure 1. A) Drainage area location in the Brazilian territory, B) Soil sampling in the catenas, drainage area for the two reservoirs (RA and RB), and C) Digital Elevation Model (DEM) of the study area in Southeastern Brazil.
The two dominant soils in the catchment are Typic Hapludox and Anionic Acrudox (E. Silva, 2018). Both highly eroded potential (A. M. Silva et al., 2005; Lima et al., 2018) soils were sampled through representative catenas under different land uses: native forest, crop, eucalyptus and native pasture (Table 1). Due to issues with permissions, the soils from catena B were located just outside the watershed boundary. The soils were classified
according to the US Soil Taxonomy (Soil Survey Staff, 2014). At each soil sampling site, undisturbed triplicate samples up to 1 m depth, using a 50 mm diameter PVC (Polyvinyl chloride) core, were collected. Soil profile cores were sliced into 100 mm layers to enable measurement of the magnetic properties in each layer.
Sediment cores were extracted from near the embankment of both reservoirs using up to 50 cm
851Semina: Ciências Agrárias, Londrina, v. 41, n. 3, p. 847-864, maio/jun. 2020
Tracing the origin of reservoir sediments using magnetic properties in Southeastern Brazil
deep, 50 mm diameter PVC cores. The sediment cores from each reservoir were then sliced into 20 mm layers to enable the measurement of the magnetic properties in each layer, resulting in 15 samples for reservoir A and 18 for reservoir B.
Standardized soil color notation, using Munsell soil-color charts (Munsell Color Company, 1946), were used in order to determine colors of the sediments from reservoirs in order to ensure a non-iron oxides reducing environment.
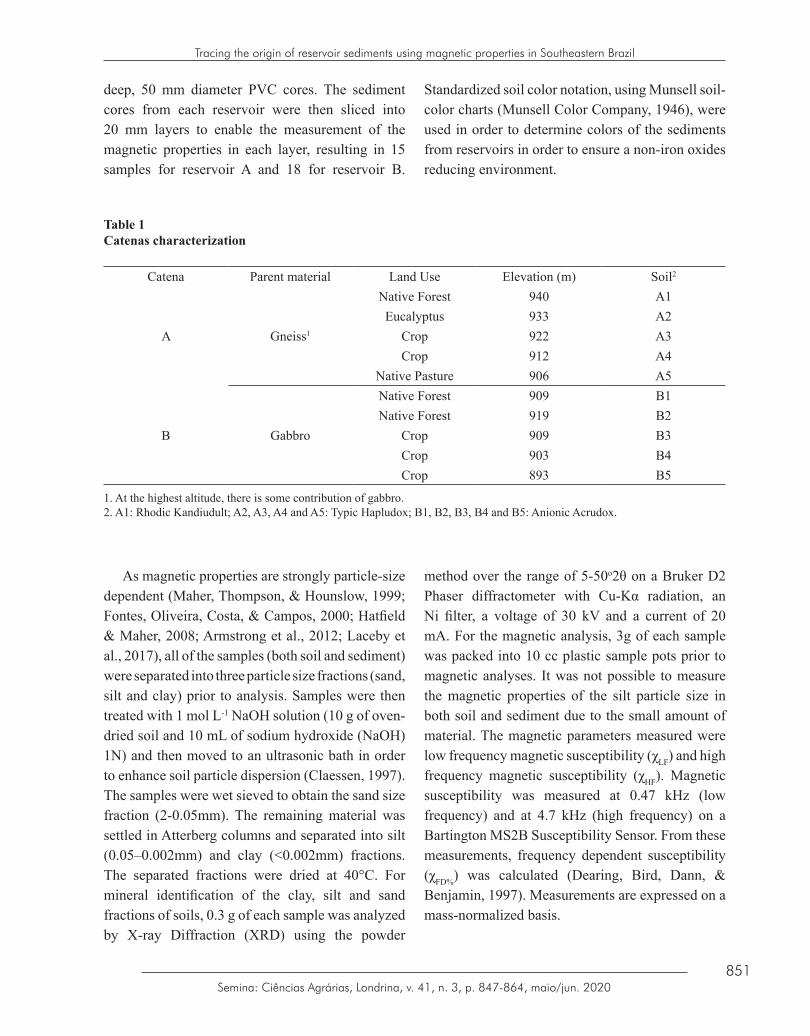
Table 1Catenas characterization
Catena Parent material Land Use Elevation (m) Soil2
A Gneiss1
Native Forest 940 A1Eucalyptus 933 A2
Crop 922 A3Crop 912 A4
Native Pasture 906 A5
B Gabbro
Native Forest 909 B1Native Forest 919 B2
Crop 909 B3Crop 903 B4Crop 893 B5
1. At the highest altitude, there is some contribution of gabbro.2. A1: Rhodic Kandiudult; A2, A3, A4 and A5: Typic Hapludox; B1, B2, B3, B4 and B5: Anionic Acrudox.
As magnetic properties are strongly particle-size dependent (Maher, Thompson, & Hounslow, 1999; Fontes, Oliveira, Costa, & Campos, 2000; Hatfield & Maher, 2008; Armstrong et al., 2012; Laceby et al., 2017), all of the samples (both soil and sediment) were separated into three particle size fractions (sand, silt and clay) prior to analysis. Samples were then treated with 1 mol L-1 NaOH solution (10 g of oven-dried soil and 10 mL of sodium hydroxide (NaOH) 1N) and then moved to an ultrasonic bath in order to enhance soil particle dispersion (Claessen, 1997). The samples were wet sieved to obtain the sand size fraction (2-0.05mm). The remaining material was settled in Atterberg columns and separated into silt (0.05–0.002mm) and clay (<0.002mm) fractions. The separated fractions were dried at 40°C. For mineral identification of the clay, silt and sand fractions of soils, 0.3 g of each sample was analyzed by X-ray Diffraction (XRD) using the powder
method over the range of 5-50o2θ on a Bruker D2 Phaser diffractometer with Cu-Kα radiation, an Ni filter, a voltage of 30 kV and a current of 20 mA. For the magnetic analysis, 3g of each sample was packed into 10 cc plastic sample pots prior to magnetic analyses. It was not possible to measure the magnetic properties of the silt particle size in both soil and sediment due to the small amount of material. The magnetic parameters measured were low frequency magnetic susceptibility (χLF) and high frequency magnetic susceptibility (χHF). Magnetic susceptibility was measured at 0.47 kHz (low frequency) and at 4.7 kHz (high frequency) on a Bartington MS2B Susceptibility Sensor. From these measurements, frequency dependent susceptibility (χFD%) was calculated (Dearing, Bird, Dann, & Benjamin, 1997). Measurements are expressed on a mass-normalized basis.
852Semina: Ciências Agrárias, Londrina, v. 41, n. 3, p. 847-864, maio/jun. 2020
Lima, P. L. T. et al.
Results and Discussion
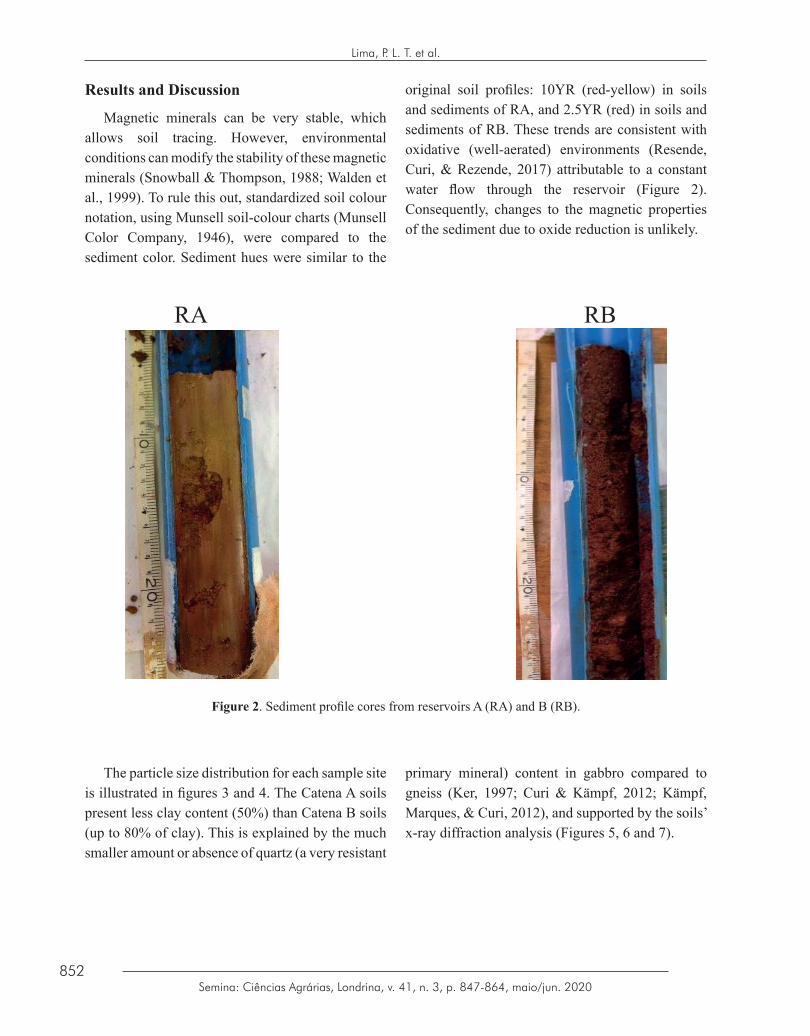
Magnetic minerals can be very stable, which allows soil tracing. However, environmental conditions can modify the stability of these magnetic minerals (Snowball & Thompson, 1988; Walden et al., 1999). To rule this out, standardized soil colour notation, using Munsell soil-colour charts (Munsell Color Company, 1946), were compared to the sediment color. Sediment hues were similar to the
original soil profiles: 10YR (red-yellow) in soils and sediments of RA, and 2.5YR (red) in soils and sediments of RB. These trends are consistent with oxidative (well-aerated) environments (Resende, Curi, & Rezende, 2017) attributable to a constant water flow through the reservoir (Figure 2). Consequently, changes to the magnetic properties of the sediment due to oxide reduction is unlikely.
Figure 2. Sediment profile cores from reservoirs A (RA) and B (RB).
attributable to a constant water flow through the reservoir (Figure 2). Consequently, changes to the magnetic
properties of the sediment due to oxide reduction is unlikely.
RA RB
Figure 2. Sediment profile cores from reservoirs A (RA) and B (RB).
The particle size distribution for each sample site is illustrated in figures 3 and 4. The Catena A
soils present less clay content (50%) than Catena B soils (up to 80% of clay). This is explained by the much
smaller amount or absence of quartz (a very resistant primary mineral) content in gabbro compared to gneiss
(Ker, 1997; Curi & Kämpf, 2012; Kämpf, Marques, & Curi, 2012), and supported by the soils’ x-ray
diffraction analysis (Figures 5, 6 and 7).
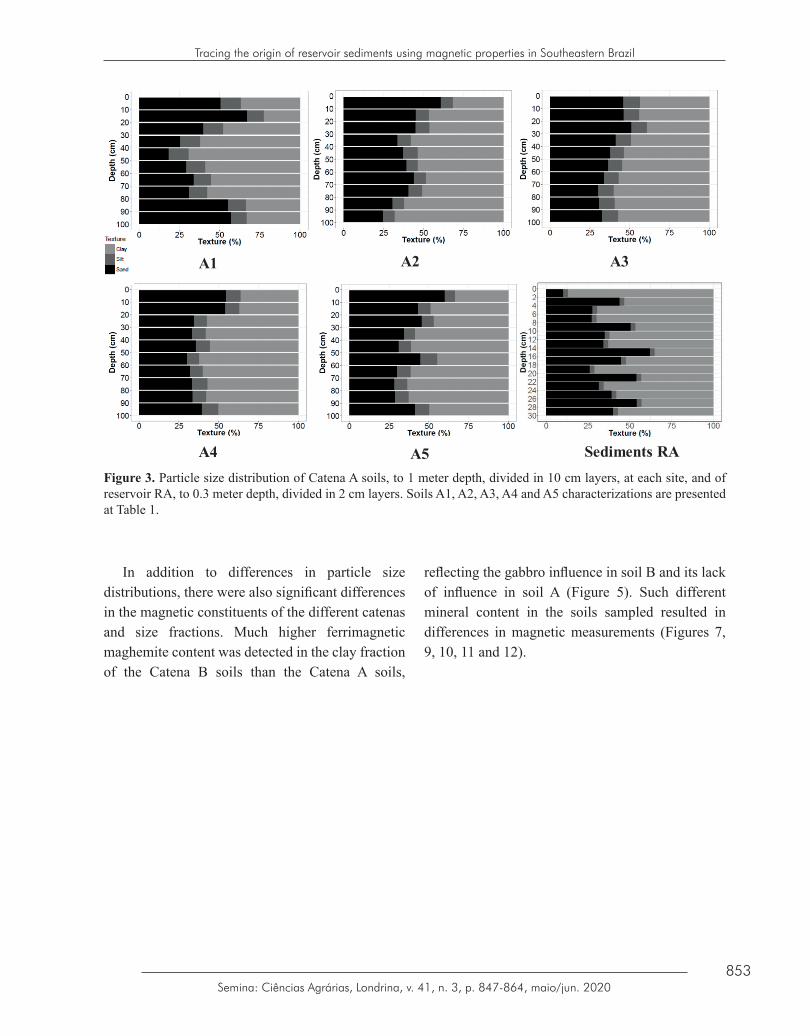
Figure 3. Particle size distribution of Catena A soils, to 1 meter depth, divided in 10 cm layers, at each site, and of reservoir RA, to 0.3 meter depth, divided in 2 cm layers. Soils A1, A2, A3, A4 and A5 characterizations are presented at Table 1.
A1 A3
A4
A2
A5 Sediments RA
The particle size distribution for each sample site is illustrated in figures 3 and 4. The Catena A soils present less clay content (50%) than Catena B soils (up to 80% of clay). This is explained by the much smaller amount or absence of quartz (a very resistant
primary mineral) content in gabbro compared to gneiss (Ker, 1997; Curi & Kämpf, 2012; Kämpf, Marques, & Curi, 2012), and supported by the soils’ x-ray diffraction analysis (Figures 5, 6 and 7).
853Semina: Ciências Agrárias, Londrina, v. 41, n. 3, p. 847-864, maio/jun. 2020
Tracing the origin of reservoir sediments using magnetic properties in Southeastern Brazil
Figure 3. Particle size distribution of Catena A soils, to 1 meter depth, divided in 10 cm layers, at each site, and of reservoir RA, to 0.3 meter depth, divided in 2 cm layers. Soils A1, A2, A3, A4 and A5 characterizations are presented at Table 1.
attributable to a constant water flow through the reservoir (Figure 2). Consequently, changes to the magnetic
properties of the sediment due to oxide reduction is unlikely.
RA RB
Figure 2. Sediment profile cores from reservoirs A (RA) and B (RB).
The particle size distribution for each sample site is illustrated in figures 3 and 4. The Catena A
soils present less clay content (50%) than Catena B soils (up to 80% of clay). This is explained by the much
smaller amount or absence of quartz (a very resistant primary mineral) content in gabbro compared to gneiss
(Ker, 1997; Curi & Kämpf, 2012; Kämpf, Marques, & Curi, 2012), and supported by the soils’ x-ray
diffraction analysis (Figures 5, 6 and 7).
Figure 3. Particle size distribution of Catena A soils, to 1 meter depth, divided in 10 cm layers, at each site, and of reservoir RA, to 0.3 meter depth, divided in 2 cm layers. Soils A1, A2, A3, A4 and A5 characterizations are presented at Table 1.
A1 A3
A4
A2
A5 Sediments RA
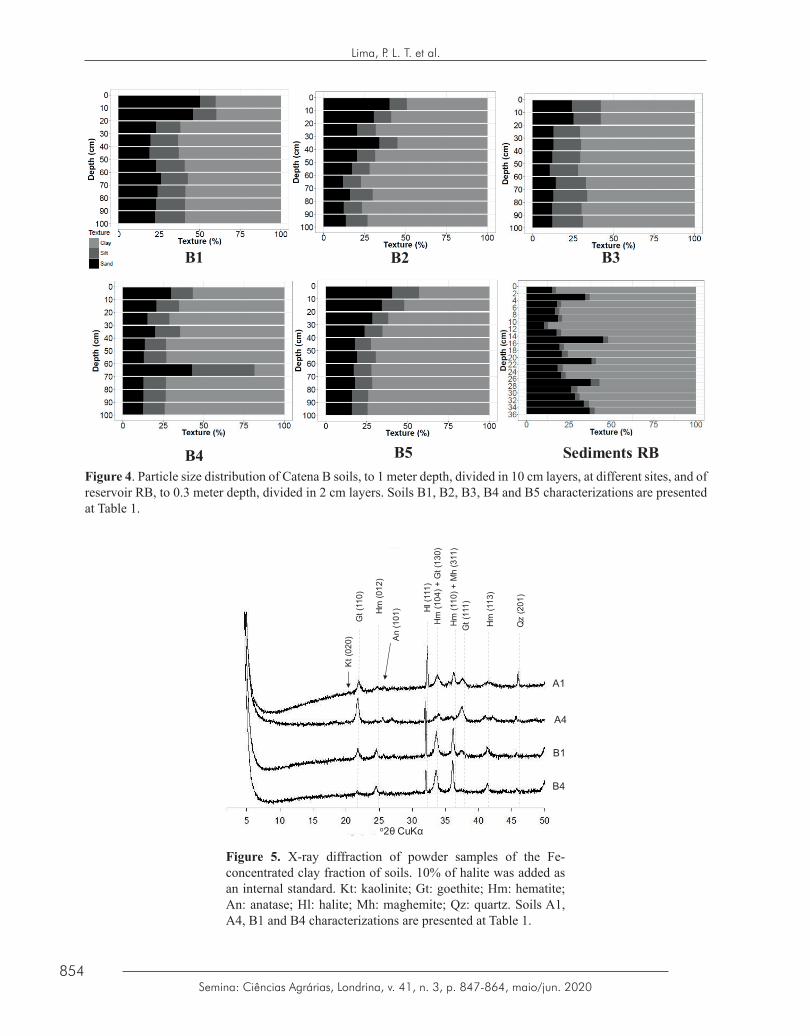
In addition to differences in particle size distributions, there were also significant differences in the magnetic constituents of the different catenas and size fractions. Much higher ferrimagnetic maghemite content was detected in the clay fraction of the Catena B soils than the Catena A soils,
reflecting the gabbro influence in soil B and its lack of influence in soil A (Figure 5). Such different mineral content in the soils sampled resulted in differences in magnetic measurements (Figures 7, 9, 10, 11 and 12).
854Semina: Ciências Agrárias, Londrina, v. 41, n. 3, p. 847-864, maio/jun. 2020
Lima, P. L. T. et al.
Figure 5. X-ray diffraction of powder samples of the Fe-concentrated clay fraction of soils. 10% of halite was added as an internal standard. Kt: kaolinite; Gt: goethite; Hm: hematite; An: anatase; Hl: halite; Mh: maghemite; Qz: quartz. Soils A1, A4, B1 and B4 characterizations are presented at Table 1.
In addition to differences in particle size distributions, there were also significant differences in the
magnetic constituents of the different catenas and size fractions. Much higher ferrimagnetic maghemite
content was detected in the clay fraction of the Catena B soils than the Catena A soils, reflecting the gabbro
influence in soil B and its lack of influence in soil A (Figure 5). Such different mineral content in the soils
sampled resulted in differences in magnetic measurements (Figures 7, 9, 10, 11 and 12).
Figure 4. Particle size distribution of Catena B soils, to 1 meter depth, divided in 10 cm layers, at different sites, and of reservoir RB, to 0.3 meter depth, divided in 2 cm layers. Soils B1, B2, B3, B4 and B5 characterizations are presented at Table 1.
Figure 5. X-ray diffraction of powder samples of the Fe-concentrated clay fraction of soils. 10% of halite was added as an internal standard. Kt: kaolinite; Gt: goethite; Hm: hematite; An: anatase; Hl: halite; Mh: maghemite; Qz: quartz. Soils A1, A4, B1 and B4 characterizations are presented at Table 1.
B1 B3
B4
B2
B5 Sediments RB
Hm
(012
)
Gt(
110)
K
t(02
0) An
(101
) Hl (
111)
Hm
(104
) + G
t(13
0)
Hm
(110
) + M
h(3
11)
Gt(
111)
Hm
(113
)
Qz
(201
)
B4
B1
A4
A1
o2θ CuKα
Figure 4. Particle size distribution of Catena B soils, to 1 meter depth, divided in 10 cm layers, at different sites, and of reservoir RB, to 0.3 meter depth, divided in 2 cm layers. Soils B1, B2, B3, B4 and B5 characterizations are presented at Table 1.
In addition to differences in particle size distributions, there were also significant differences in the
magnetic constituents of the different catenas and size fractions. Much higher ferrimagnetic maghemite
content was detected in the clay fraction of the Catena B soils than the Catena A soils, reflecting the gabbro
influence in soil B and its lack of influence in soil A (Figure 5). Such different mineral content in the soils
sampled resulted in differences in magnetic measurements (Figures 7, 9, 10, 11 and 12).
Figure 4. Particle size distribution of Catena B soils, to 1 meter depth, divided in 10 cm layers, at different sites, and of reservoir RB, to 0.3 meter depth, divided in 2 cm layers. Soils B1, B2, B3, B4 and B5 characterizations are presented at Table 1.
Figure 5. X-ray diffraction of powder samples of the Fe-concentrated clay fraction of soils. 10% of halite was added as an internal standard. Kt: kaolinite; Gt: goethite; Hm: hematite; An: anatase; Hl: halite; Mh: maghemite; Qz: quartz. Soils A1, A4, B1 and B4 characterizations are presented at Table 1.
Maghemite was identified in the silt fraction of Catena B soils (Figure 6) and magnetite was found
B1 B3
B4
B2
B5 Sediments RBH
m (0
12)
Gt(
110)
K
t(02
0) An
(101
) Hl (
111)
Hm
(104
) + G
t(13
0)
Hm
(110
) + M
h(3
11)
Gt(
111)
Hm
(113
)
Qz
(201
)
B4
B1
A4
A1
o2θ CuKα
855Semina: Ciências Agrárias, Londrina, v. 41, n. 3, p. 847-864, maio/jun. 2020
Tracing the origin of reservoir sediments using magnetic properties in Southeastern Brazil
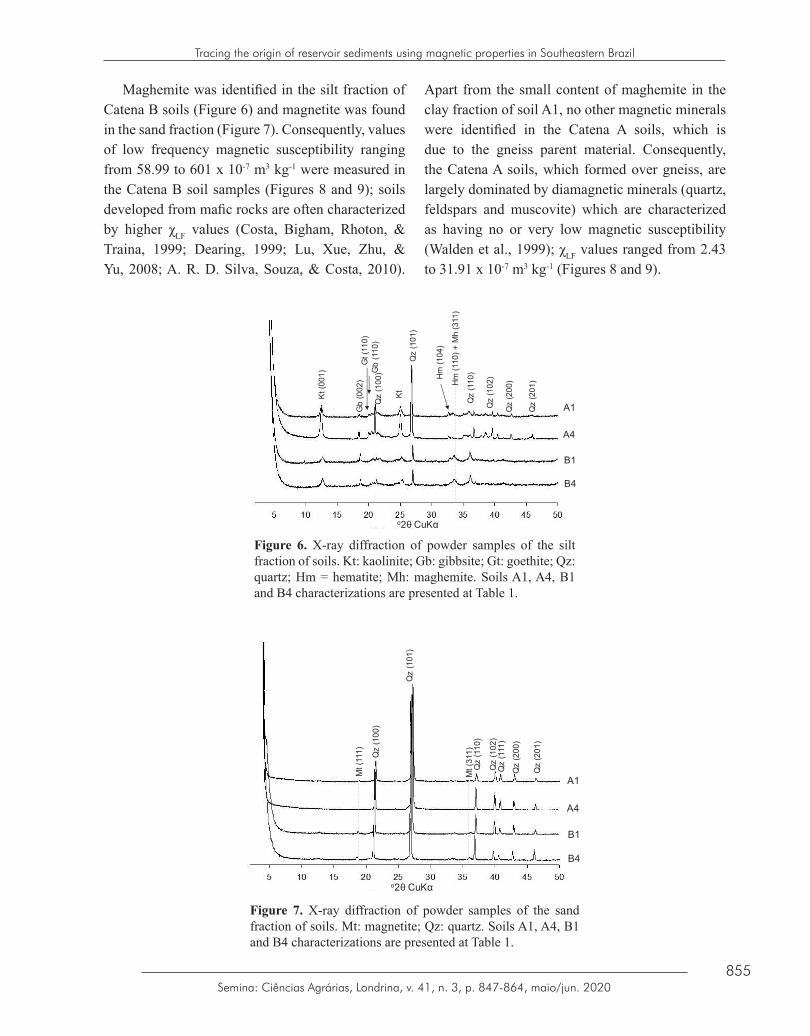
Figure 6. X-ray diffraction of powder samples of the silt fraction of soils. Kt: kaolinite; Gb: gibbsite; Gt: goethite; Qz: quartz; Hm = hematite; Mh: maghemite. Soils A1, A4, B1 and B4 characterizations are presented at Table 1.
Maghemite was identified in the silt fraction of Catena B soils (Figure 6) and magnetite was found in the sand fraction (Figure 7). Consequently, values of low frequency magnetic susceptibility ranging from 58.99 to 601 x 10-7 m3 kg-1 were measured in the Catena B soil samples (Figures 8 and 9); soils developed from mafic rocks are often characterized by higher χLF values (Costa, Bigham, Rhoton, & Traina, 1999; Dearing, 1999; Lu, Xue, Zhu, & Yu, 2008; A. R. D. Silva, Souza, & Costa, 2010).
Apart from the small content of maghemite in the clay fraction of soil A1, no other magnetic minerals were identified in the Catena A soils, which is due to the gneiss parent material. Consequently, the Catena A soils, which formed over gneiss, are largely dominated by diamagnetic minerals (quartz, feldspars and muscovite) which are characterized as having no or very low magnetic susceptibility (Walden et al., 1999); χLF values ranged from 2.43 to 31.91 x 10⁻⁷ m3 kg-1 (Figures 8 and 9).
Figure 7. X-ray diffraction of powder samples of the sand fraction of soils. Mt: magnetite; Qz: quartz. Soils A1, A4, B1 and B4 characterizations are presented at Table 1.
Maghemite was identified in the silt fraction of Catena B soils (Figure 6) and magnetite was found
in the sand fraction (Figure 7). Consequently, values of low frequency magnetic susceptibility ranging from
58.99 to 601 x 10-7 m3 kg-1 were measured in the Catena B soil samples (Figures 8 and 9); soils developed
from mafic rocks are often characterized by higher χLF values (Costa, Bigham, Rhoton, & Traina, 1999;
Dearing, 1999; Lu, Xue, Zhu, & Yu, 2008; A. R. D. Silva, Souza, & Costa, 2010). Apart from the small
content of maghemite in the clay fraction of soil A1, no other magnetic minerals were identified in the
Catena A soils, which is due to the gneiss parent material. Consequently, the Catena A soils, which formed
over gneiss, are largely dominated by diamagnetic minerals (quartz, feldspars and muscovite) which are
characterized as having no or very low magnetic susceptibility (Walden et al., 1999); χLF values ranged from
2.43 to 31.91 x 10⁻⁷ m3 kg-1 (Figures 8 and 9).
Figure 6. X-ray diffraction of powder samples of the silt fraction of soils. Kt: kaolinite; Gb: gibbsite; Gt: goethite; Qz: quartz; Hm = hematite; Mh: maghemite. Soils A1, A4, B1 and B4 characterizations are presented at Table 1.
Figure 7. X-ray diffraction of powder samples of the sand fraction of soils. Mt: magnetite; Qz: quartz. Soils A1, A4, B1 and B4 characterizations are presented at Table 1.
The difference in low frequency magnetic susceptibility between Catena B samples and Catena A
samples, due to the greater content of magnetic minerals in Catena B samples, makes low frequency
magnetic susceptibility an effective basis for source differentiation, as found in other studies (Pulley &
Rowntree, 2016). Low frequency magnetic susceptibility is mainly associated with the Fe oxides assemblage
and content within a soil: magnetite (Fe3O4) χLF values can be found in literature ranging from 4,000 to
Gb
(002
)
Qz
(100
)
Qz
(101
)
Qz
(110
)
Qz
(102
)
Qz
(200
)
Qz
(201
)
Kt(
001)
Kt
Gb
(110
)
Hm
(104
)
Gt(
110)
B4
B1
A4
A1
Hm
(110
) + M
h(3
11)
o2θ CuKα
B4
B1
A4
A1
Mt(
111) Qz
(100
)
Qz
(101
)
Qz
(110
)
Qz
(102
)
Qz
(200
)
Qz
(201
)
Mt(
311)
Qz
(111
)
o2θ CuKα
Maghemite was identified in the silt fraction of Catena B soils (Figure 6) and magnetite was found
in the sand fraction (Figure 7). Consequently, values of low frequency magnetic susceptibility ranging from
58.99 to 601 x 10-7 m3 kg-1 were measured in the Catena B soil samples (Figures 8 and 9); soils developed
from mafic rocks are often characterized by higher χLF values (Costa, Bigham, Rhoton, & Traina, 1999;
Dearing, 1999; Lu, Xue, Zhu, & Yu, 2008; A. R. D. Silva, Souza, & Costa, 2010). Apart from the small
content of maghemite in the clay fraction of soil A1, no other magnetic minerals were identified in the
Catena A soils, which is due to the gneiss parent material. Consequently, the Catena A soils, which formed
over gneiss, are largely dominated by diamagnetic minerals (quartz, feldspars and muscovite) which are
characterized as having no or very low magnetic susceptibility (Walden et al., 1999); χLF values ranged from
2.43 to 31.91 x 10⁻⁷ m3 kg-1 (Figures 8 and 9).
Figure 6. X-ray diffraction of powder samples of the silt fraction of soils. Kt: kaolinite; Gb: gibbsite; Gt: goethite; Qz: quartz; Hm = hematite; Mh: maghemite. Soils A1, A4, B1 and B4 characterizations are presented at Table 1.
Figure 7. X-ray diffraction of powder samples of the sand fraction of soils. Mt: magnetite; Qz: quartz. Soils A1, A4, B1 and B4 characterizations are presented at Table 1.
The difference in low frequency magnetic susceptibility between Catena B samples and Catena A
samples, due to the greater content of magnetic minerals in Catena B samples, makes low frequency
magnetic susceptibility an effective basis for source differentiation, as found in other studies (Pulley &
Rowntree, 2016). Low frequency magnetic susceptibility is mainly associated with the Fe oxides assemblage
Gb
(002
)
Qz
(100
)
Qz
(101
)
Qz
(110
)
Qz
(102
)
Qz
(200
)
Qz
(201
)
Kt(
001)
Kt
Gb
(110
)
Hm
(104
)
Gt(
110)
B4
B1
A4
A1
Hm
(110
) + M
h(3
11)
o2θ CuKα
B4
B1
A4
A1
Mt(
111) Qz
(100
)
Qz
(101
)
Qz
(110
)
Qz
(102
)
Qz
(200
)
Qz
(201
)
Mt(
311)
Qz
(111
)
o2θ CuKα
856Semina: Ciências Agrárias, Londrina, v. 41, n. 3, p. 847-864, maio/jun. 2020
Lima, P. L. T. et al.
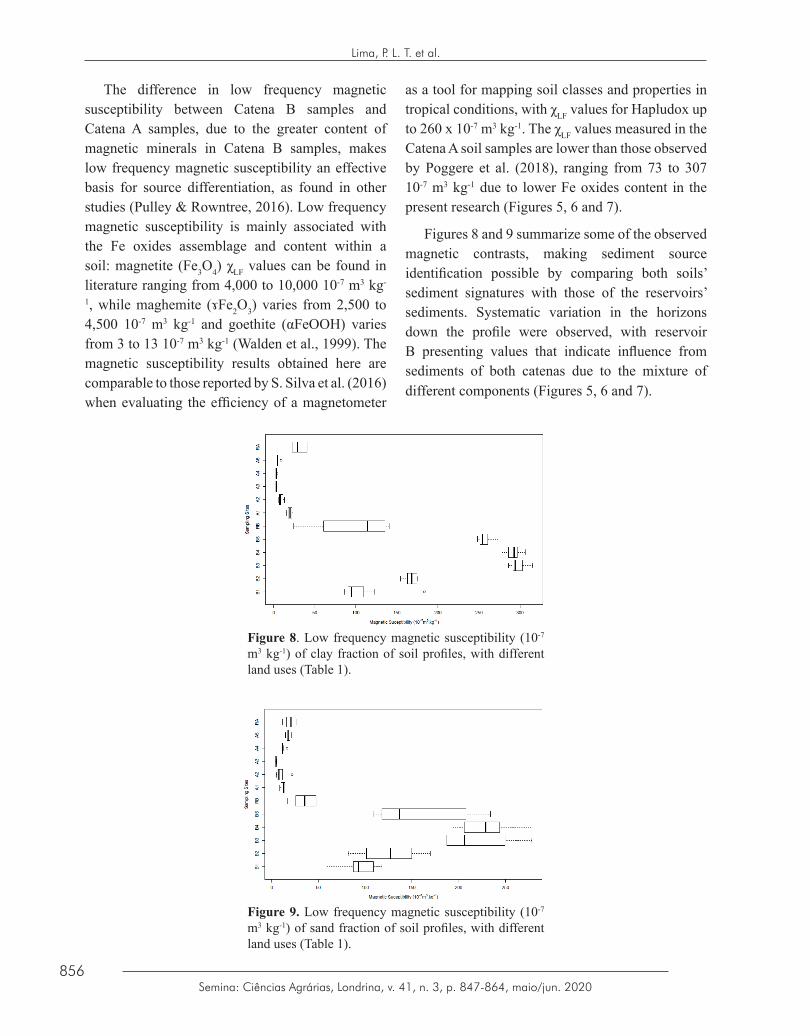
Figure 8. Low frequency magnetic susceptibility (10-7 m3 kg-1) of clay fraction of soil profiles, with different land uses (Table 1).
Figure 9. Low frequency magnetic susceptibility (10-7 m3 kg-1) of sand fraction of soil profiles, with different land uses (Table 1).
and content within a soil: magnetite (Fe3O4) χLF values can be found in literature ranging from 4,000 to
10,000 10-7 m3 kg-1, while maghemite (ɤFe2O3) varies from 2,500 to 4,500 10-7 m3 kg-1 and goethite
(αFeOOH) varies from 3 to 13 10-7 m3 kg-1 (Walden et al., 1999). The magnetic susceptibility results
obtained here are comparable to those reported by S. Silva et al. (2016) when evaluating the efficiency of a
magnetometer as a tool for mapping soil classes and properties in tropical conditions, with χLF values for
Hapludox up to 260 x 10-7 m3 kg-1. The χLF values measured in the Catena A soil samples are lower than
those observed by Poggere et al. (2018), ranging from 73 to 307 10-7 m3 kg-1 due to lower Fe oxides content
in the present research (Figures 5, 6 and 7).
Figures 8 and 9 summarize some of the observed magnetic contrasts, making sediment source
identification possible by comparing both soils’ sediment signatures with those of the reservoirs’ sediments.
Systematic variation in the horizons down the profile were observed, with reservoir B presenting values that
indicate influence from sediments of both catenas due to the mixture of different components (Figures 5, 6
and 7).
Figure 8. Low frequency magnetic susceptibility (10-7 m3 kg-1) of clay fraction of soil profiles, with different land uses (Table 1).
Figure 9. Low frequency magnetic susceptibility (10-7 m3 kg-1) of sand fraction of soil profiles, with different land uses (Table 1).
Figures 10 and 11 illustrate the strong particle size dependence of magnetic behavior of the
soils/sediments. As Catena B soils present a high χFD% (10-14%) in the clay and silt fractions,
superparamagnetic and stable single domain grains are likely. Such magnetic behaviors are evidenced by the
in situ formation of maghemite, most likely by oxidation of lithogenic magnetite during soil formation (Curi,
The difference in low frequency magnetic susceptibility between Catena B samples and Catena A samples, due to the greater content of magnetic minerals in Catena B samples, makes low frequency magnetic susceptibility an effective basis for source differentiation, as found in other studies (Pulley & Rowntree, 2016). Low frequency magnetic susceptibility is mainly associated with the Fe oxides assemblage and content within a soil: magnetite (Fe3O4) χLF values can be found in literature ranging from 4,000 to 10,000 10-7 m3 kg-
1, while maghemite (ɤFe2O3) varies from 2,500 to 4,500 10-7 m3 kg-1 and goethite (αFeOOH) varies from 3 to 13 10-7 m3 kg-1 (Walden et al., 1999). The magnetic susceptibility results obtained here are comparable to those reported by S. Silva et al. (2016) when evaluating the efficiency of a magnetometer
as a tool for mapping soil classes and properties in tropical conditions, with χLF values for Hapludox up to 260 x 10-7 m3 kg-1. The χLF values measured in the Catena A soil samples are lower than those observed by Poggere et al. (2018), ranging from 73 to 307 10-7 m3 kg-1 due to lower Fe oxides content in the present research (Figures 5, 6 and 7).
Figures 8 and 9 summarize some of the observed magnetic contrasts, making sediment source identification possible by comparing both soils’ sediment signatures with those of the reservoirs’ sediments. Systematic variation in the horizons down the profile were observed, with reservoir B presenting values that indicate influence from sediments of both catenas due to the mixture of different components (Figures 5, 6 and 7).
857Semina: Ciências Agrárias, Londrina, v. 41, n. 3, p. 847-864, maio/jun. 2020
Tracing the origin of reservoir sediments using magnetic properties in Southeastern Brazil
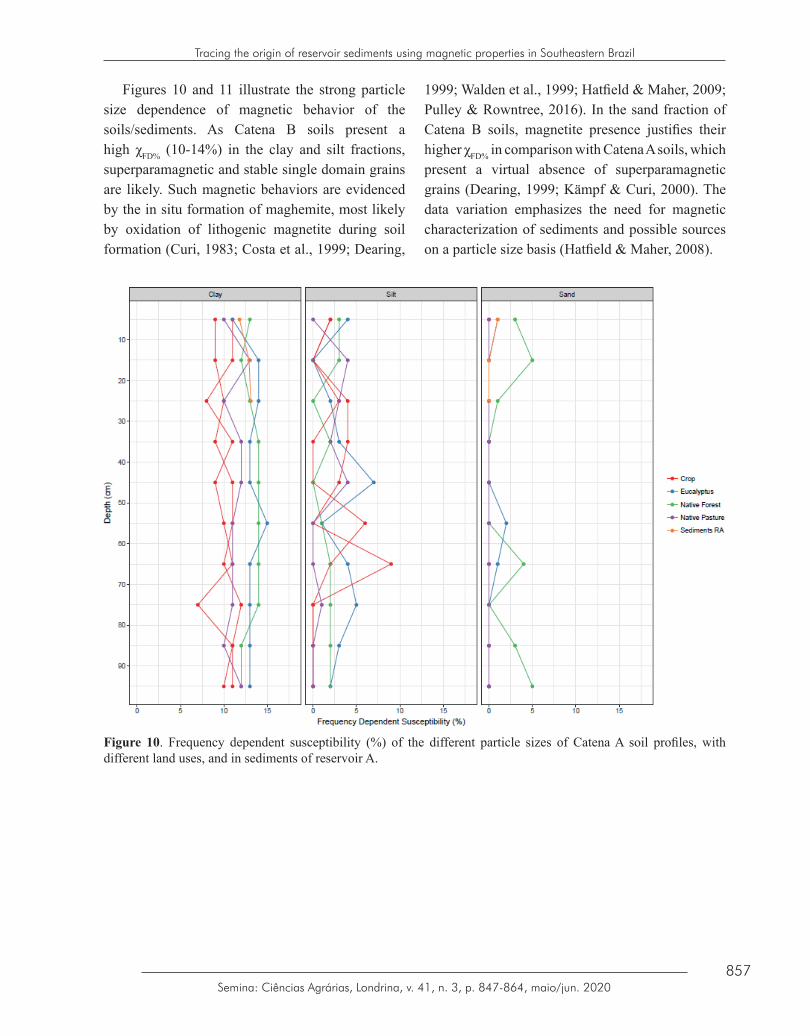
Figure 10. Frequency dependent susceptibility (%) of the different particle sizes of Catena A soil profiles, with different land uses, and in sediments of reservoir A.
Figures 10 and 11 illustrate the strong particle size dependence of magnetic behavior of the soils/sediments. As Catena B soils present a high χFD% (10-14%) in the clay and silt fractions, superparamagnetic and stable single domain grains are likely. Such magnetic behaviors are evidenced by the in situ formation of maghemite, most likely by oxidation of lithogenic magnetite during soil formation (Curi, 1983; Costa et al., 1999; Dearing,
1999; Walden et al., 1999; Hatfield & Maher, 2009; Pulley & Rowntree, 2016). In the sand fraction of Catena B soils, magnetite presence justifies their higher χFD% in comparison with Catena A soils, which present a virtual absence of superparamagnetic grains (Dearing, 1999; Kämpf & Curi, 2000). The data variation emphasizes the need for magnetic characterization of sediments and possible sources on a particle size basis (Hatfield & Maher, 2008).
1983; Costa et al., 1999; Dearing, 1999; Walden et al., 1999; Hatfield & Maher, 2009; Pulley & Rowntree,
2016). In the sand fraction of Catena B soils, magnetite presence justifies their higher χFD% in comparison
with Catena A soils, which present a virtual absence of superparamagnetic grains (Dearing, 1999; Kämpf &
Curi, 2000). The data variation emphasizes the need for magnetic characterization of sediments and possible
sources on a particle size basis (Hatfield & Maher, 2008).
Figure 10. Frequency dependent susceptibility (%) of the different particle sizes of Catena A soil profiles, with different land uses, and in sediments of reservoir A.
858Semina: Ciências Agrárias, Londrina, v. 41, n. 3, p. 847-864, maio/jun. 2020
Lima, P. L. T. et al.
The elevation (in meters) of the soils sampled under different land uses, as well as χLF (10-7 m3 kg-
1) of different particle sizes at 1 meter down soil profiles, are presented in figures 12 and 13. The magnetic measurements appear to differentiate the two major potential suspended sediment inputs (Catena A and B) to both reservoirs (RA and RB): figure 12 indicates a dominant Catena A sediment source at reservoir A, corroborating with the relief
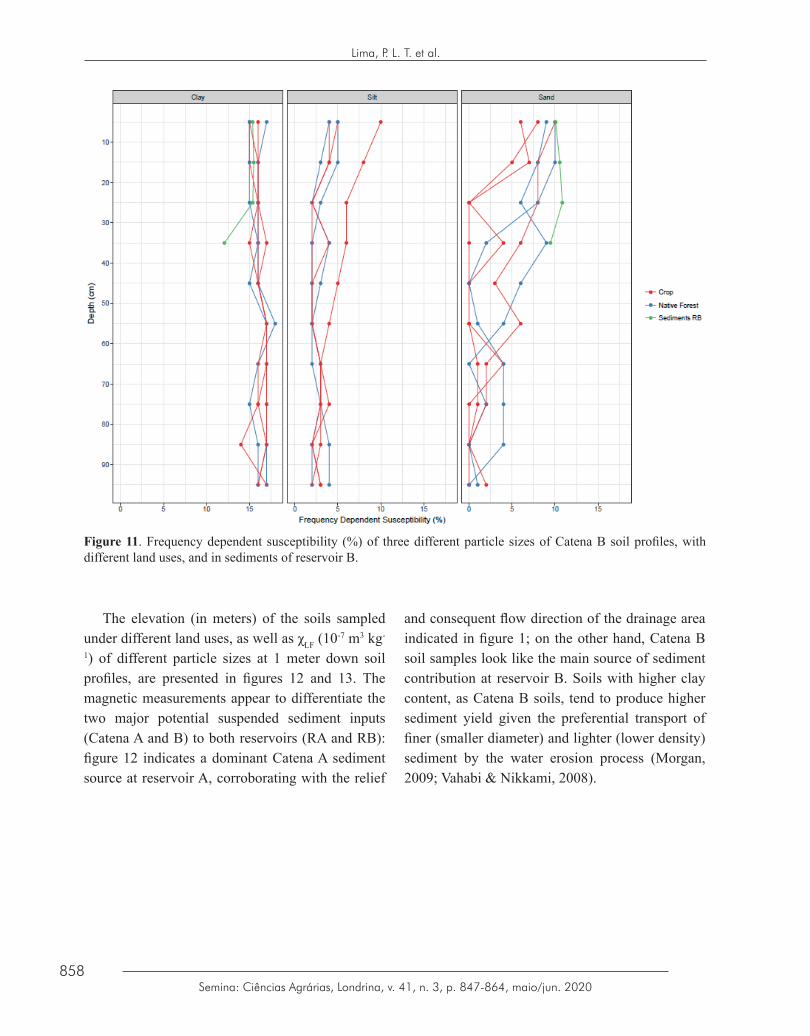
Figure 11. Frequency dependent susceptibility (%) of three different particle sizes of Catena B soil profiles, with different land uses, and in sediments of reservoir B.
Figure 11. Frequency dependent susceptibility (%) of three different particle sizes of Catena B soil profiles, with different land uses, and in sediments of reservoir B.
The elevation (in meters) of the soils sampled under different land uses, as well as χLF (10-7 m3 kg-1)
of different particle sizes at 1 meter down soil profiles, are presented in figures 12 and 13. The magnetic
measurements appear to differentiate the two major potential suspended sediment inputs (Catena A and B) to
both reservoirs (RA and RB): figure 12 indicates a dominant Catena A sediment source at reservoir A,
corroborating with the relief and consequent flow direction of the drainage area indicated in figure 1; on the
other hand, Catena B soil samples look like the main source of sediment contribution at reservoir B. Soils
with higher clay content, as Catena B soils, tend to produce higher sediment yield given the preferential
transport of finer (smaller diameter) and lighter (lower density) sediment by the water erosion process
(Morgan, 2009; Vahabi & Nikkami, 2008).
A5A4
A3
A2
A1
900
910
920
930
940
950
Ele
vatio
n (m
)
and consequent flow direction of the drainage area indicated in figure 1; on the other hand, Catena B soil samples look like the main source of sediment contribution at reservoir B. Soils with higher clay content, as Catena B soils, tend to produce higher sediment yield given the preferential transport of finer (smaller diameter) and lighter (lower density) sediment by the water erosion process (Morgan, 2009; Vahabi & Nikkami, 2008).
859Semina: Ciências Agrárias, Londrina, v. 41, n. 3, p. 847-864, maio/jun. 2020
Tracing the origin of reservoir sediments using magnetic properties in Southeastern Brazil
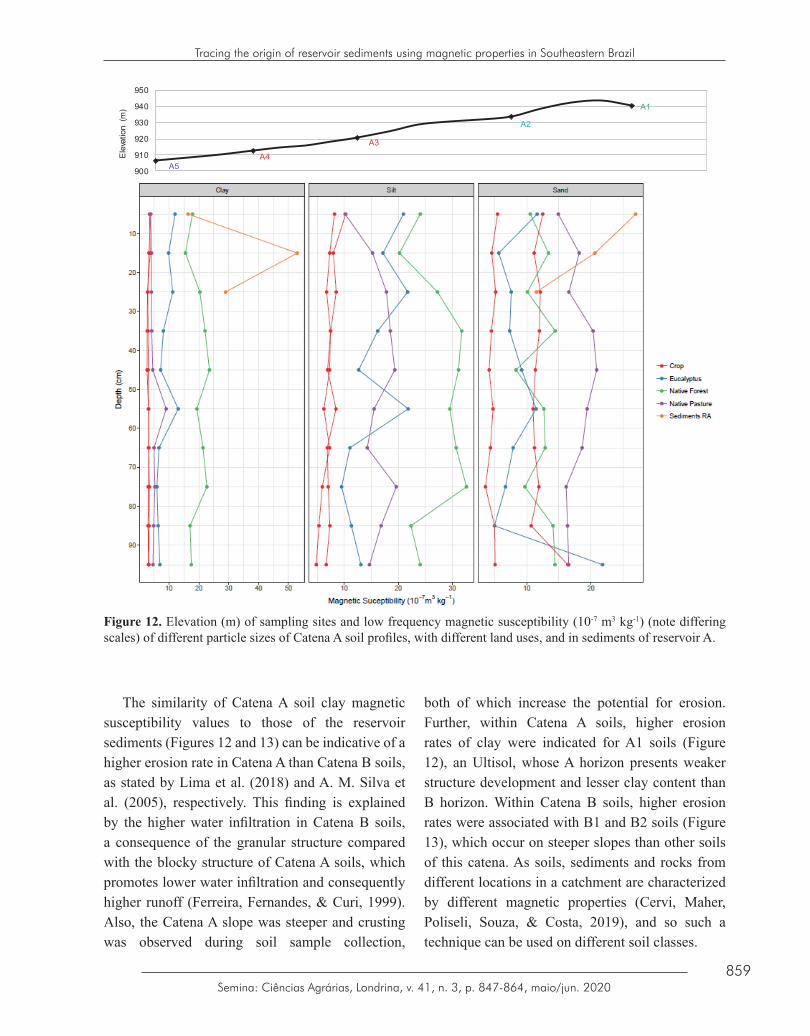
Figure 12. Elevation (m) of sampling sites and low frequency magnetic susceptibility (10-7 m3 kg-1) (note differing scales) of different particle sizes of Catena A soil profiles, with different land uses, and in sediments of reservoir A.
Figure 12. Elevation (m) of sampling sites and low frequency magnetic susceptibility (10-7 m3 kg-1) (note differing scales) of different particle sizes of Catena A soil profiles, with different land uses, and in sediments of reservoir A.
The similarity of Catena A soil clay magnetic susceptibility values to those of the reservoir
sediments (Figures 12 and 13) can be indicative of a higher erosion rate in Catena A than Catena B soils, as
stated by Lima et al. (2018) and A. M. Silva et al. (2005), respectively. This finding is explained by the
higher water infiltration in Catena B soils, a consequence of the granular structure compared with the blocky
structure of Catena A soils, which promotes lower water infiltration and consequently higher runoff
(Ferreira, Fernandes, & Curi, 1999). Also, the Catena A slope was steeper and crusting was observed during
soil sample collection, both of which increase the potential for erosion. Further, within Catena A soils, higher
erosion rates of clay were indicated for A1 soils (Figure 12), an Ultisol, whose A horizon presents weaker
structure development and lesser clay content than B horizon. Within Catena B soils, higher erosion rates
were associated with B1 and B2 soils (Figure 13), which occur on steeper slopes than other soils of this
catena. As soils, sediments and rocks from different locations in a catchment are characterized by different
magnetic properties (Cervi, Maher, Poliseli, Souza, & Costa, 2019), and so such a technique can be used on
different soil classes.
A5A4
A3
A2
A1
900
910
920
930
940
950
Ele
vatio
n (m
)
The similarity of Catena A soil clay magnetic susceptibility values to those of the reservoir sediments (Figures 12 and 13) can be indicative of a higher erosion rate in Catena A than Catena B soils, as stated by Lima et al. (2018) and A. M. Silva et al. (2005), respectively. This finding is explained by the higher water infiltration in Catena B soils, a consequence of the granular structure compared with the blocky structure of Catena A soils, which promotes lower water infiltration and consequently higher runoff (Ferreira, Fernandes, & Curi, 1999). Also, the Catena A slope was steeper and crusting was observed during soil sample collection,
both of which increase the potential for erosion. Further, within Catena A soils, higher erosion rates of clay were indicated for A1 soils (Figure 12), an Ultisol, whose A horizon presents weaker structure development and lesser clay content than B horizon. Within Catena B soils, higher erosion rates were associated with B1 and B2 soils (Figure 13), which occur on steeper slopes than other soils of this catena. As soils, sediments and rocks from different locations in a catchment are characterized by different magnetic properties (Cervi, Maher, Poliseli, Souza, & Costa, 2019), and so such a technique can be used on different soil classes.
860Semina: Ciências Agrárias, Londrina, v. 41, n. 3, p. 847-864, maio/jun. 2020
Lima, P. L. T. et al.
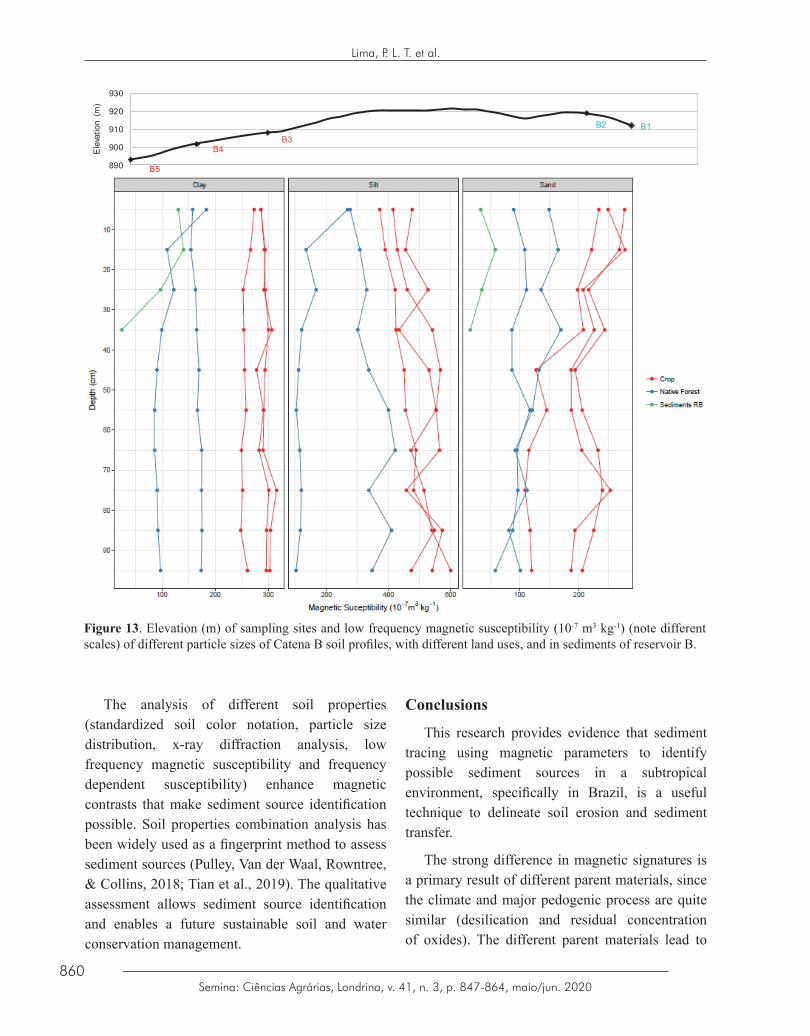
Figure 13. Elevation (m) of sampling sites and low frequency magnetic susceptibility (10-7 m3 kg-1) (note different scales) of different particle sizes of Catena B soil profiles, with different land uses, and in sediments of reservoir B.
Figure 13. Elevation (m) of sampling sites and low frequency magnetic susceptibility (10-7 m3 kg-1) (note different scales) of different particle sizes of Catena B soil profiles, with different land uses, and in sediments of reservoir B.
The analysis of different soil properties (standardized soil color notation, particle size distribution,
x-ray diffraction analysis, low frequency magnetic susceptibility and frequency dependent susceptibility)
enhance magnetic contrasts that make sediment source identification possible. Soil properties combination
analysis has been widely used as a fingerprint method to assess sediment sources (Pulley, Van der Waal,
Rowntree, & Collins, 2018; Tian et al., 2019). The qualitative assessment allows sediment source
identification and enables a future sustainable soil and water conservation management.
Conclusions
This research provides evidence that sediment tracing using magnetic parameters to identify
possible sediment sources in a subtropical environment, specifically in Brazil, is a useful technique to
delineate soil erosion and sediment transfer.
The strong difference in magnetic signatures is a primary result of different parent materials, since
the climate and major pedogenic process are quite similar (desilication and residual concentration of oxides).
The different parent materials lead to soils with different contents and types of Fe oxide minerals, inducing
B5
B4B3
B2 B1
890
900
910
920
930E
leva
tion
(m)
The analysis of different soil properties (standardized soil color notation, particle size distribution, x-ray diffraction analysis, low frequency magnetic susceptibility and frequency dependent susceptibility) enhance magnetic contrasts that make sediment source identification possible. Soil properties combination analysis has been widely used as a fingerprint method to assess sediment sources (Pulley, Van der Waal, Rowntree, & Collins, 2018; Tian et al., 2019). The qualitative assessment allows sediment source identification and enables a future sustainable soil and water conservation management.
Conclusions
This research provides evidence that sediment tracing using magnetic parameters to identify possible sediment sources in a subtropical environment, specifically in Brazil, is a useful technique to delineate soil erosion and sediment transfer.
The strong difference in magnetic signatures is a primary result of different parent materials, since the climate and major pedogenic process are quite similar (desilication and residual concentration of oxides). The different parent materials lead to
861Semina: Ciências Agrárias, Londrina, v. 41, n. 3, p. 847-864, maio/jun. 2020
Tracing the origin of reservoir sediments using magnetic properties in Southeastern Brazil
soils with different contents and types of Fe oxide minerals, inducing differential magnetic variability, which allows the identification of sources of deposited sediments. Different behavior of soil types could be clearly distinguished by magnetic property evaluation and the origin of sediments of downstream reservoirs allocated to their source. Given the low cost of magnetic measurements, and distinct properties among soil classes, magnetic tracing offers significant potential in soil erosion and sediment tracing studies in the tropics. This increased understanding could be used to develop appropriate soil erosion mitigation methods, maintaining soil quantity and quality and avoiding detrimental impacts in the downstream aquatic systems.
Acknowledgments
Authors express their gratitude to CAPES (Coordination of Improvement of Higher Education Personnel - Process number 12082/13-9), FAPEMIG (Research Foundation of Minas Gerais State - Process number APQ-00802-18 and CAG-APQ-01053-15) and CNPq (National Research and Development Council - Processes numbers 306511/2017-7 and 202938/2018-2) for their financial support and scholarships. The authors are also thankful to the all support given by Lancaster University’s Barbara Maher, Vassil Karloukovski.
ReferencesAlvares, C. A., Stape, J. L., Sentelhas, P. C., Moraes,
G. de, Leonardo, J., & Sparovek, G. (2013). Köppen’s climate classification map for Brazil. Meteorologische Zeitschrift, 22(6), 711-728. doi: 10.1127/0941-2948/2013/0507
Anache, J. A., Wendland, E. C., Oliveira, P. T., Flanagan, D. C., & Nearing, M. A. (2017). Runoff and soil erosion plot-scale studies under natural rainfall: a meta-analysis of the Brazilian experience. Catena, 152(2017), 29-39. doi: 10.1016/j.catena.2017.01.00
Araujo, J. C., Güntner, A., & Bronstert, A. (2006). Loss of reservoir volume by sediment deposition and
its impact on water availability in semiarid Brazil. Hydrological Sciences Journal, 51(1), 157-170. doi: 10.1623/hysj.51.1.157
Armstrong, A., Quinton, J. N., & Maher, B. A. (2012). Thermal enhancement of natural magnetism as a tool for tracing eroded soil. Earth Surface Processes and Landforms, 37(14), 1567-1572. doi: 10.1002/esp.3312
Barbosa, R. S., Marques, J., Barron, V., Martins, M. V., Siqueira, D. S., Peluco, R. G.,... Silva, L. S. (2019). Prediction and mapping of erodibility factors (USLE and WEPP) by magnetic susceptibility in basalt-derived soils in northeastern Sao Paulo state, Brazil. Environmental Earth Sciences, 78(1), 12. doi: 10.1007/s12665-018-8015-0
Batista, P. V. G., Davies, J., Silva, M. L. N., & Quinton, J. (2019). On the evaluation of soil erosion models: are we doing enough? Eart-Science Reviews, 197(2019), 102898. doi: 10.1016/j.earscirev.2019.102898
Batista, P. V. G., Silva, M. L. N., Silva, B. P. C., Curi, N., Bueno, I. T., Acérbi, F. W. Jr.,... & Quinton, J. (2017). Modelling spatially distributed soil losses and sediment yield in the upper Grande River Basin-Brazil. Catena, 157(2017), 139-150. doi: 10.1016/j.catena.2017.05.025
Bispo, D. F. A., Silva, M. L. N., Marques, J. J. G. D. S., Bechmann, M., Batista, P. V. G., & Curi, N. (2017). Phosphorus transfer at a small catchment in southeastern Brazil: distributed modelling in different land use scenarios. Ciência e Agrotecnologia, 41(5), 565-579. doi: 10.1590/1413-70542017415012217
Blundell, A., Dearing, J. A., Boyle, J. F., & Hannam, J. A. (2009). Controlling factors for the spatial variability of soil magnetic susceptibility across England and Wales. Earth-Science Reviews, 95(3-4), 158-188. doi: 10.1016/j.earscirev.2009.05.001
Bostanmaneshrad, F., Partani, S., Noori, R., Nachtnebel, H. P., Berndtsson, R., & Adamowski, J. F. (2018). Relationship between water quality and macro-scale parameters (land use, erosion, geology, and population density) in the Siminehrood River Basin. Science of the Total Environment, 639(2018), 1588-1600. doi: 10.1016/j.scitotenv.2018.05.244
Cervi, E. C., Maher, B., Poliseli, P. C., Souza, I. G., Jr., & Costa, A. C. S. (2019). Magnetic susceptibility as a pedogenic proxy for grouping of geochemical transects in landscapes. Journal of Applied Geophysics, 169(2019), 109-117. doi: 10.1016/j.jappgeo.2019.06.017
862Semina: Ciências Agrárias, Londrina, v. 41, n. 3, p. 847-864, maio/jun. 2020
Lima, P. L. T. et al.
Claessen, M. E. C. (1997). Manual de métodos de análise de solo. Rio de Janeiro: EMBRAPA Solos-Documentos (INFOTECA-E).
Collins, A. L., Pulley, S., Foster, I. D., Gellis, A., Porto, P., & Horowitz, A. J. (2017). Sediment source fingerprinting as an aid to catchment management: a review of the current state of knowledge and a methodological decision-tree for end-users. Journal of Environmental Management, 194(2017), 86-108. doi: 10.1016/j.jenvman.2016.09.075
Collins, A. L., & Walling, D. E. (2002). Selecting fingerprint properties for discriminating potential suspended sediment sources in river basins. Journal of Hydrology, 261(1-4), 218-244. doi: 10.1016/S0022-1694(02)00011-2
Collins, A. L., Walling, D. E., Sichingabula, H. M., & Leeks, G. J. L. (2001). Suspended sediment source fingerprinting in a small tropical catchment and some management implications. Applied Geography, 21(4), 387-412. doi: 10.1016/S0143-6228(01)00013-3
Costa, A. C. S., Bigham, J. M., Rhoton, F. E., & Traina, S. J. (1999). Quantification and characterization of maghemite in soils derived from volcanic rocks in southern Brazil. Clays and Clay Minerals, 47(4), 466-473. doi: 10.1346/CCMN.1999.0470408
Curi, N., & Kämpf, N. (2012). Caracterização do solo. In J. C. Ker, N. Curi, C. E. Schaefer, & P. Vidal-Torrado (Eds.), Pedologia; fundamentos (pp. 147-169). Viçosa, MG: Sociedade Brasileira de Ciência do Solo.
Curi, N. (1983). Lithosequence and toposequence of Oxisols from Goias and Minas Gerais states, Brazil Doctoral dissertation, Purdue University, West Lafayette, United States of America. Retrieved from https://docs.lib.purdue.edu/dissertations/AAI8323975/
Dantas, A. A. A., Carvalho, L. G. D., & Ferreira, E. (2007). Climatic classification and tendencies in Lavras region, MG. Ciência e Agrotecnologia, 31(6), 1862-1866. doi: 10.1590/S1413-70542007000600039
Dearing, J. A. (1999). Environmental magnetic susceptibility: using the Bartington MS2 system (2nd ed.). Kenilworth: Chi Publishing.
Dearing, J. A., Bird, P. M., Dann, R. J. L., & Benjamin, S. F. (1997). Secondary ferrimagnetic minerals in Welsh soils: a comparison of mineral magnetic detection methods and implications for mineral formation. Geophysical Journal International, 130(3), 727-736. doi: 10.1111/j.1365-246X.1997.tb01867.x
Deasy, C., Titman, A., & Quinton, J. N. (2014). Measurement of flood peak effects as a result of soil and land management, with focus on experimental issues and scale. Journal of Environmental Management, 132(2014), 304-312. doi: 10.1016/j.jenvman.2013.11.027
Environmental Systems Research Institute (2010). ArcGIS Desktop: Release 10.1. Redlands, CA: Environmental Systems Research Institute.
Ferreira, M. M., Fernandes, B., & Curi, N. (1999). Influência da mineralogia da fração argila nas propriedades físicas de Latossolos da região sudeste do Brasil. Revista Brasileira de Ciência do Solo, 23(3), 515-524. doi: 10.1590/S0100-06831999000300004
Fontes, M. P. F., Oliveira, T. S. de, Costa, L. M. da, & Campos, A. A. G. (2000). Magnetic separation and evaluation of magnetization of Brazilian soils from different parent materials. Geoderma, 96(1-2), 81-99. doi: 10.1016/S0016-7061(00)00005-7
Guzmán, G., Quinton, J. N., Nearing, M. A., Mabit, L., & Gómez, J. A. (2013). Sediment tracers in water erosion studies: current approaches and challenges. Journal of Soils and Sediments, 13(4), 816-833. doi: 10.1007/s11368-013-0659-5
Hatfield, R. G., & Maher, B. A. (2008). Suspended sediment characterization and tracing using a magnetic fingerprinting technique: Bassenthwaite Lake, Cumbria, UK. The Holocene, 18(1), 105-115. doi: 10.1177/0959683607085600
Hatfield, R. G., & Maher, B. A. (2009). Fingerprinting upland sediment sources: particle size‐specific magnetic linkages between soils, lake sediments and suspended sediments. Earth surface processes and landforms, 34(10), 1359-1373. doi: 10.1002/esp.1824
Jain, S. K., & Singh, V. P. (2003). Water resources systems planning and management. Amsterdam: Elsevier.
Kämpf, N., & Curi, N. (2000). Óxidos de ferro: indicadores de ambientes pedogênicos e geoquímicos. In R. F. Novais, V. H. Alvarez, & C. E. G. R. Schaefer (Eds.), Tópicos em ciência do solo, 1 (pp. 107-138). Viçosa, MG: Sociedade Brasileira de Ciência do Solo.
Kämpf, N., Marques, J. J., & Curi, N. (2012). Mineralogia de solos brasileiros. In J. C. Ker, N. Curi, C. E. Schaefer, & P. V. Torrado (Eds.), Pedologia; fundamentos (pp. 81-145). Viçosa, MG: Sociedade Brasileira de Ciência do Solo.
863Semina: Ciências Agrárias, Londrina, v. 41, n. 3, p. 847-864, maio/jun. 2020
Tracing the origin of reservoir sediments using magnetic properties in Southeastern Brazil
Ker, J. C. (1997). Latossolos do Brasil: uma revisão. Revista Geonomos, 5(1), 17-40. doi: 10.18285/geonomos.v5i1.187
Laceby, J. P., Evrard, O., Smith, H. G., Blake, W. H., Olley, J. M., Minella, J. P., & Owens, P. N. (2017). The challenges and opportunities of addressing particle size effects in sediment source fingerprinting: a review. Earth-Science Reviews, 169(2017), 85-103. doi: 10.1016/j.earscirev.2017.04.009
Le Gall, M., Evrard, O., Dapoigny, A., Tiecher, T., Zafar, M., Minella, J. P. G.,... & Ayrault, S. (2017). Tracing sediment sources in a subtropical agricultural catchment of Southern Brazil cultivated with conventional and conservation farming practices. Land degradation & development, 28(4), 1426-1436. doi: 10.1002/ldr.2662
Lima, P. L. T., Silva, M. L. N., Quinton, J. N., Batista, P. V. G., Cândido, B. M., & Curi, N. (2018). Relationship among crop systems, soil cover, and water erosion on a Typic Hapludox. Revista Brasileira de Ciência do Solo, 42(2018), e0170081. doi: 10.1590/18069657rbcs20170081
Lu, S. G., Xue, Q. F., Zhu, L., & Yu, J. Y. (2008). Mineral magnetic properties of a weathering sequence of soils derived from basalt in Eastern China. Catena, 73(1), 23-33. doi: 10.1016/j.catena.2007.08.004
Maher, B. A. (1998). Magnetic properties of modern soils and Quaternary loessic paleosols: paleoclimatic implications. Palaeogeography, Palaeoclimatology, Palaeoecology, 137(1-2), 25-54. doi: 10.1016/S0031-0182(97)00103-X
Maher, B. A., Thompson, R., & Hounslow, M. W. (1999) Introduction. In B. A. Maher, & R. Thompson (Eds.), Quaternary climates, environments and magnetism (pp. 1-48). Cambridge: Cambridge University Press.
Maher, B. A., Watkins, S. J., Brunskill, G., Alexander, J., & Fielding, C. R. (2009). Sediment provenance in a tropical fluvial and marine context by magnetic ‘fingerprinting’ of transportable sand fractions. Sedimentology, 56(3), 841-861. doi: 10.1111/j.1365-3091.2008.00999.x
Mathias, G. L., Nagai, R. H., Trindade, R. I., & Mahiques, M. M. de. (2014). Magnetic fingerprint of the late Holocene inception of the Río de la Plata plume onto the southeast Brazilian shelf. Palaeogeography, Palaeoclimatology, Palaeoecology, 415(2014), 183-196. doi: 10.1016/j.palaeo.2014.03.034
Morgan, R. P. C. (2009). Soil erosion and conservation (3nd ed.). Oxford: Blackwell Publishing.
Munsell Color Company (1946). Munsell soil colour charts. Baltimore, Maryland.
Oliveira, P. T. S., Nearing, M. A., & Wendland, E. (2015). Orders of magnitude increase in soil erosion associated with land use change from native to cultivated vegetation in a Brazilian savannah environment. Earth Surface Processes and Landforms, 40(11), 1524-1532. doi: 10.1002/esp.3738
Pimentel, D., Harvey, C., Resosudarmo, P., Sinclair, K., Kurz, D., McNair, M.,... & Blair, R. (1995). Environmental and economic costs of soil erosion and conservation benefits. Science, 267(5201), 1117-1123. doi: 10.1126/science.267.5201.1117
Poggere, G. C., Inda, A. V., Barrón, V., Kämpf, N., Brito, A. D. B. de, Barbosa, J. Z., & Curi, N. (2018). Maghemite quantification and magnetic signature of Brazilian soils with contrasting parent materials. Applied Clay Science, 161(2018), 385-394. doi: 10.1016/j.clay.2018.05.014
Pulley, S., & Rowntree, K. (2016). Stages in the life of a magnetic grain: sediment source discrimination, particle size effects and spatial variability in the South African Karoo. Geoderma, 271(2016), 134-143. doi: 10.1016/j.geoderma.2016.02.0
Pulley, S., Van der Waal, B., Rowntree, K., & Collins, A. L. (2018). Colour as reliable tracer to identify the sources of historically deposited flood bench sediment in the Transkei, South Africa: A comparison with mineral magnetic tracers before and after hydrogen peroxide pre-treatment. Catena, 160(2018), 242-251. doi: 10.1016/j.catena.2017.09.018
Resende, M., Curi, N., & Rezende, S. B. (2017). Uso agrícola e não agrícola das informações pedológicas. In N. Curi, J. C. Ker, R. F. Novais, P. V. Torrado, & C. E. G. R. Schaefer (Eds.), Pedologia: solos dos biomas brasileiros (pp. 47-110). Viçosa, MG: Sociedade Brasileira de Ciência do Solo.
Royall, D. (2003). A fifty-year record of historical sedimentation at Deer Lake, North Carolina. The Professional Geographer, 55(3), 356-371. doi: 10.1111/0033-0124.5503012
Saran, L. M., Meneghine, A. K., Célico, A. S., Pinheiro, D. G., & Alves, L. M. C. (2017). Freshwater quality of a stream in agricultural area where organic compost from animal and vegetable wastes is used. Ciência e Agrotecnologia, 41(3), 263-278. doi: 10.1590/1413-70542017413037616
864Semina: Ciências Agrárias, Londrina, v. 41, n. 3, p. 847-864, maio/jun. 2020
Lima, P. L. T. et al.
Silva, A. M., Silva, M. L. N., Curi, N., Lima, J. M. de, Avanzi, J. C., & Ferreira, M. M. (2005). Perdas de solo, água, nutrientes e carbono orgânico em Cambissolo e Latossolo sob chuva natural. Pesquisa Agropecuária Brasileira, 40(12), 1223-1230. doi: 10.1590/S0100-204X2005001200010
Silva, A. R. D., Souza, I. G. D., Jr., & Costa, A. C. S. D. (2010). Magnetic susceptibility of B horizon of soils in the state of Paraná. Revista Brasileira de Ciência do Solo, 34(2), 329-338. doi: 10.1590/S0100-06832010000200006
Silva, E. (2018). Mapeamento de solos e uso de algoritimos de aprendizagem em Lavras (MG). Tese de doutorado, Universidade Federal de Lavras, Lavras, Brasil. Recuperado de http://repositorio.ufla.br/ jspui/handle/1/28826
Silva, S., Poggere, G., Menezes, M., Carvalho, G., Guilherme, L., & Curi, N. (2016). Proximal sensing and digital terrain models applied to digital soil mapping and modeling of Brazilian Latosols (Oxisols). Remote Sensing, 8(8), 614. doi: doi.org/10.3390/rs8080614
Snowball, I., & Thompson, R. (1988). The occurrence of greigite in sediments from Loch Lomond. Journal of Quaternary Science, 3(2), 121-125. doi: 10.1002/jqs.3390030203
Soil Survey Staff (2014). Keys to soil taxonomy (12nd ed.). Washington, DC: United States Department of Agriculture, Natural Resources Conservation Service.
Tian, P., An, Z., Zhao, G., Gao, P., Li, P., Sun, W., & Mu, X. (2019). Assessing sediment yield and sources using fingerprinting method in a representative catchment of the Loess Plateau, China. Environmental Earth Sciences, 78(8), 261. doi: 10.1007/s12665-019-8240-1
Vahabi, J., & Nikkami, D. (2008). Assessing dominant factors affecting soil erosion using a portable rainfall simulator. International Journal of Sediment Research, 23(4), 376-386. doi: 10.1016/S1001-6279(09)60008-1
Walden, J., Oldfield, F., & Smith, J. (1999). Environmental Magnetism: A practical guide. London: Quaternary Research Association. Technical Guide No. 6.
Walling, D. E. (2013). The evolution of sediment source fingerprinting investigations in fluvial systems. Journal of Soils and Sediments, 13(10), 1658-1675. doi: 10.1007/s11368-013-0767-2
Wischmeier, W. H., & Smith, D. D. (1978). Predicting rainfall erosion losses-a guide to conservation planning. Washington, DC: United States Department of Agriculture.
Zhang, X. C., Nearing, M. A., Garbrecht, J. D., & Steiner, J. L. (2004). Downscaling monthly forecasts to simulate impacts of climate change on soil erosion and wheat production. Soil Science Society of America Journal, 68(4), 1376-1385. doi: 10.2136/sssaj2004.1376