Compreendendo a Terra - aedmoodle.ufpa.br
48
Compreendendo a Terra Cap. 23: Ambiente, Mudanças Globais, e Impactos Humanos Lecture Slides prepared by Bill Dupré • Peter Copeland Copyright © 2004 by W. H. Freeman & Company Frank Press • Raymond Siever • John Grotzinger • Thomas H. Jordan 4a Edição
Transcript of Compreendendo a Terra - aedmoodle.ufpa.br
Compreendendo a Terra
Cap. 23:Ambiente, Mudanças Globais, e
Impactos Humanos
Lecture Slides prepared by
Bill Dupré • Peter Copeland
Copyright © 2004 by W. H. Freeman & Company
Frank Press • Raymond Siever • John Grotzinger • Thomas H. Jordan
4a Edição


Fig. 23.1
Interacting Geosystems:
Climate – Plate Tectonics – Geodynamo

Fig. 23.2
O Simulador da Terra:
maior computador já construído
Centro de ciências da Terra, Yokohama-Japão

Fig. 23.2

Fig. 23.2
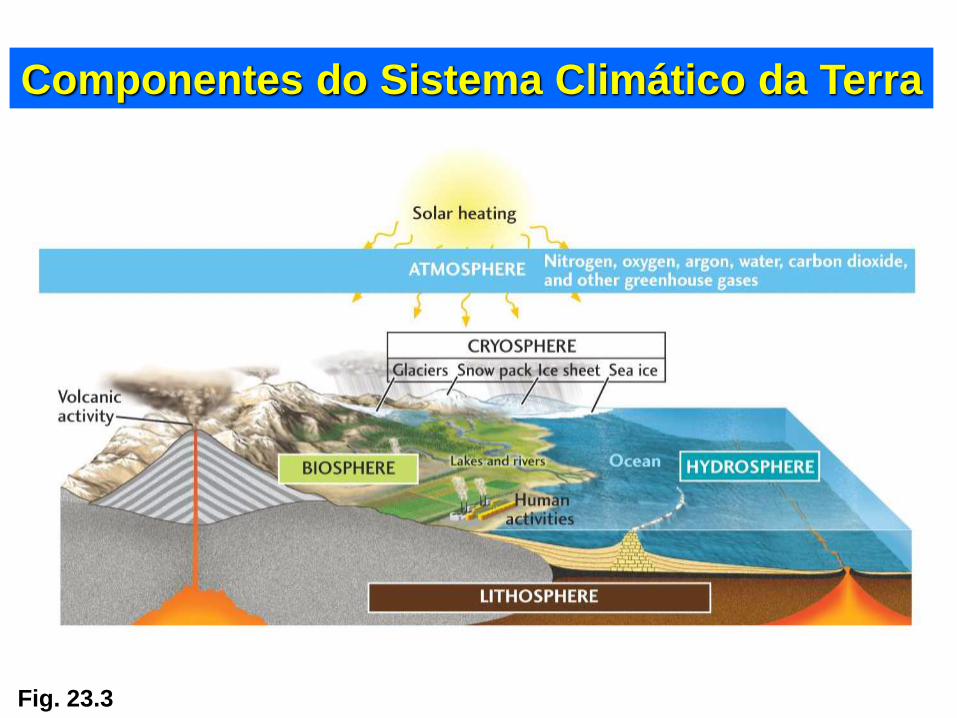
Fig. 23.3
Componentes do Sistema Climático da Terra

Fig. 23.3
As atividades antrópicas
podem resultar em mudanças:
Sea ice and
extent of glaciers
Land surface, vegetation,
and ecosystems
The hydrologic cycle
Oceanic circulation,
sea level, and geochemistry
Atmospheric composition
and circulation

Fig. 23.4
O gelo marinho é parte
importante da Criosphere
Arctic Sea ice flowing
south through the
Bering Strait, May
2002
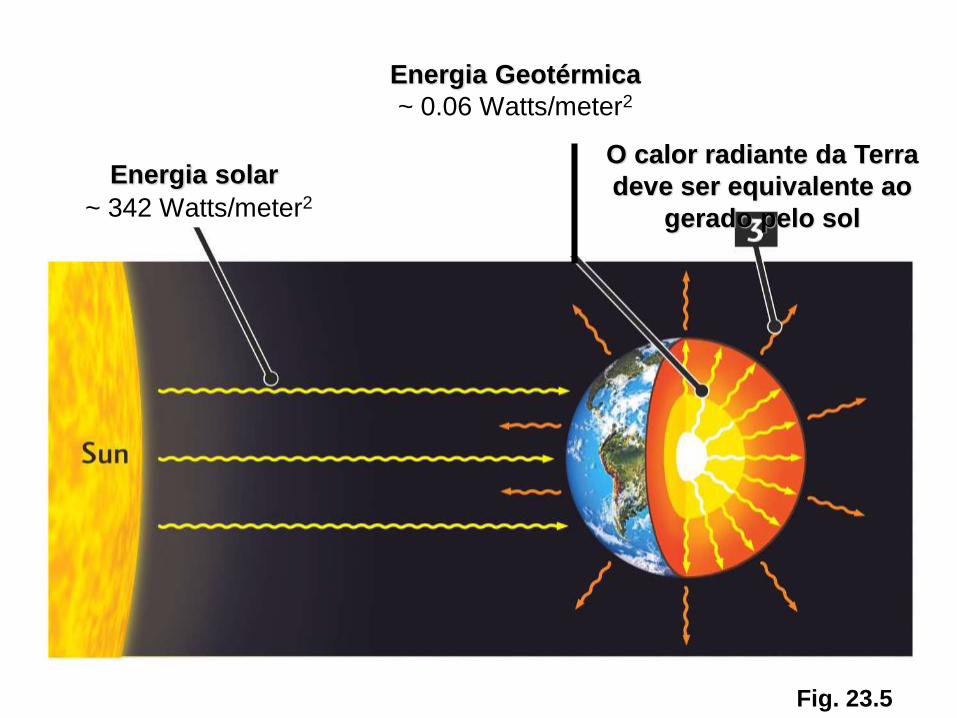
Fig. 23.5
Energia solar
~ 342 Watts/meter2
Energia Geotérmica
~ 0.06 Watts/meter2
O calor radiante da Terra
deve ser equivalente ao
gerado pelo sol

Fig. 23.6
Entrada e Saída
de radiação na Atmosfera Terrestre

Quais são os gases do efeito estufa?
(What are the greenhouse gases?)
(excluindo H2O)
• Dióxido de Carbono:49%
• Metano: 18%
• “CFC’s”: 14%
• Óxidos Nitrosos: 06%
• Outros: 13%

Qual a fonte do CO2 adicionado?
• Queima de comb fóssil: 75%
• Desmatamento: 15%
• Manufacturing: 07%
• Combustível de madeira: 03%

Fig. 23.8a
Global Temperatures Compared to
Increased CO2 Concentration

Fig. 23.8b
Global Temperatures and CO2 Concentrations
Over the Last Millennium

Fig. 23.8b
But…. How can we determine temperature and
CO2 content prior to instrumental readings?

Box 16.1
The ice core, such as at
Vostok Science Station in
Antarctica provides over
100,000 years of data on:
1) temperature,
2) CO2 content, and
3) methane content
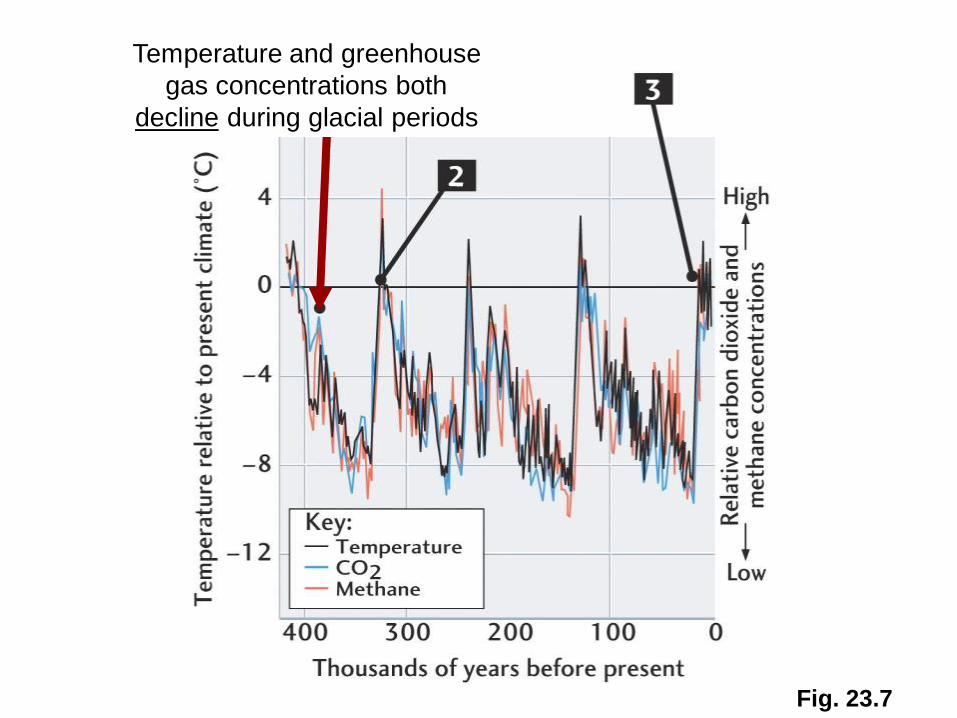
Fig. 23.7
Temperature and greenhouse
gas concentrations both
decline during glacial periods

Fig. 23.7
Temperature and greenhouse
gas concentrations both rise
rapidly during deglaciation

Fig. 23.7
Climate has been relatively warm and
stable during the last 10,000 yrs, the
Holocene interglacial period

Box 23.1
El Nino and La Nina

Box 23.1
During normal years, warm
surface waters in the Pacific lie in
the east off Indonesia

Box 23.1
During normal years, warm
surface waters in the Pacific lie in
the east off Indonesia
When the pattern oscillates to an
“El Nino”, the warm water shifts
east

Box 23.1
During normal years, warm
surface waters in the Pacific lie in
the east off Indonesia
When the pattern oscillates to an
“El Nino”, the warm water shifts
east
“La Nina” is characterized by
colder sea-surface temperatures
and stronger trade winds in the
eastern tropical Pacific

Box 23.1
South
America
During “Normal Years”
Warm water in the western Pacific causes low pressure and high rainfall;
pressure system drives tradewinds from east to west;
tradewinds drive warm water to the west;
causing cold water to rise off South America and flow west.

Box 23.1
South
America
During “El Nino”
Warm water shift to the eastern Pacific causes drought in western Pacific;
low pressure over the warm eastern Pacific causes heavy rains
and inhibits upwellings along the coast of South America.

Fig. 23.9
Transport Processes Between
Components of the Climate System

Fig. 23.10
The Calcium Cycle(showing fluxes in and out of the ocean)

Fig. 23.11
The Carbon Cycle(showing global reservoirs and fluxes)

Fig. 23.12
Human Effects on the Carbon Cycle

Fig. 23.12
Human Effects on the Carbon CycleHuman activities release
~7.1 Gt* of carbon into
the atmosphere each year
*Gt = gigaton

Fig. 23.12
Human effects on the Carbon CycleHuman activities release
~7.1 Gt* of carbon into
the atmosphere each year
*Gt = gigaton
New plant growth and
air-sea exchange
removes ~3.8 Gt/yr

Fig. 23.12
Human effects on the Carbon CycleHuman activities release
~7.1 Gt* of carbon into
the atmosphere each year
*Gt = gigaton
New plant growth and
Air-sea exchange
removes ~3.8 Gt/yr
…yielding a net
atmospheric increase
of ~ 3.3 Gt/yr.

Fig. 23.13

Fig. 23.13

Fig. 23.13
Before and After the Effects of Acid Rain

Fig. 23.14
Acidity of Rain:
1955-1998

Fig. 23.14
Burning high-sulfur coal generates atmospheric sulfuric acid
which falls as acid rain down-wind, to the northeast.

Fig. 23.14
Rains became more acidic and affected broader areas
until sulfur-reducing regulations were enacted…

Fig. 23.14
…reducing acid rain in the Northeast, however coal-fired
power plants in the Southwest have increased acid rain there.

Fig. 23.15
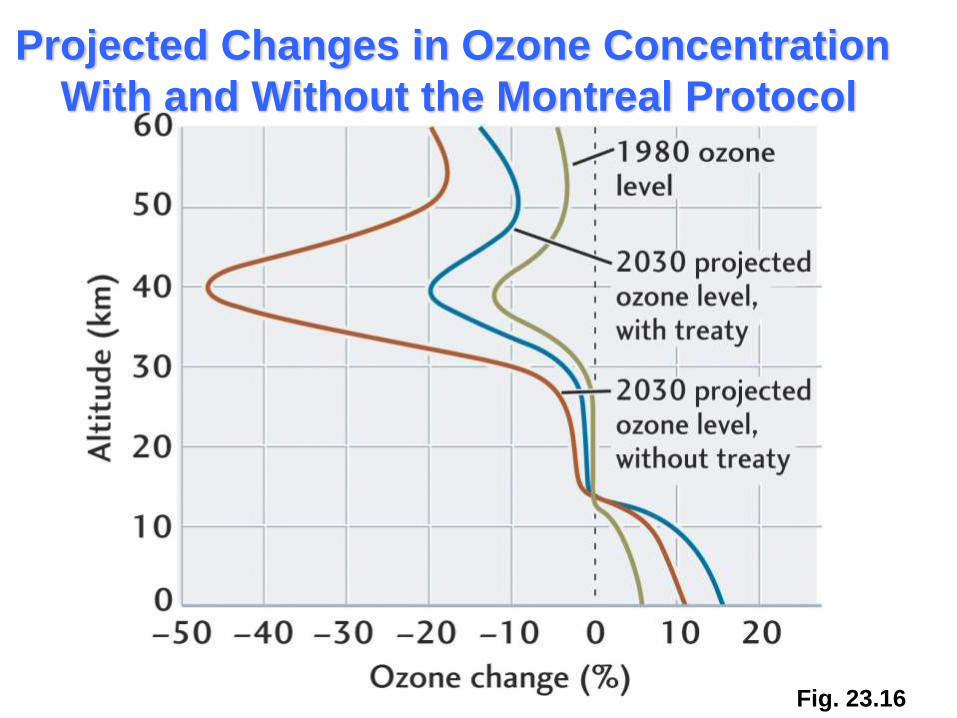
Fig. 23.16
Projected Changes in Ozone Concentration
With and Without the Montreal Protocol

Fig. 23.17a
Projected Changes in CO2 Concentration
Under Three Different Scenarios
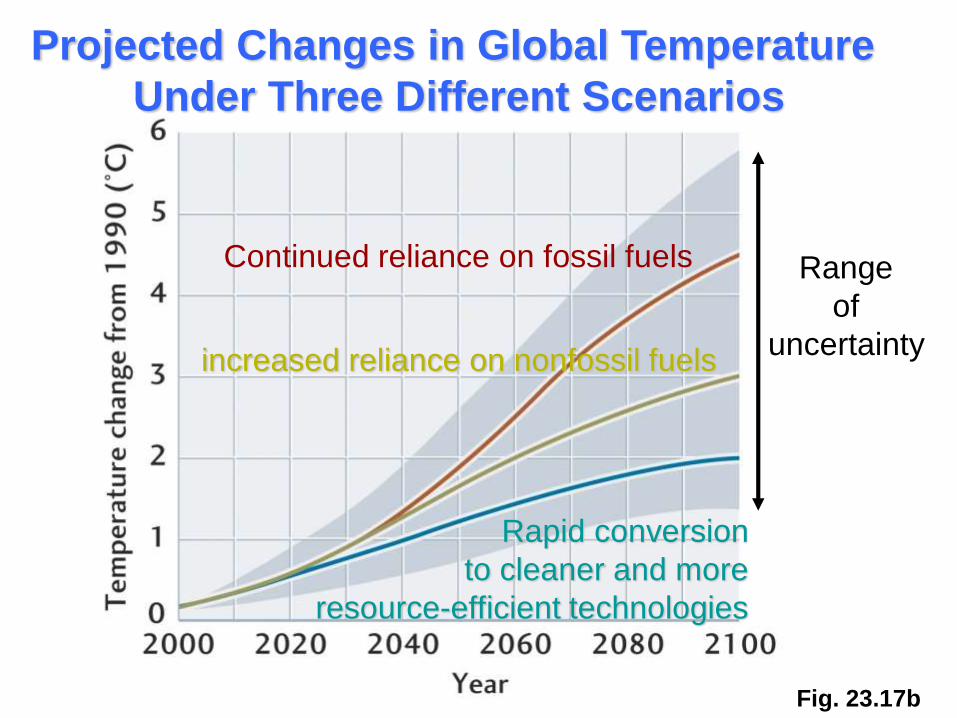
Fig. 23.17b
Projected Changes in Global Temperature
Under Three Different Scenarios
Range
of
uncertainty
Continued reliance on fossil fuels
increased reliance on nonfossil fuels
Rapid conversion
to cleaner and more
resource-efficient technologies

Fig. 23.18
Global warming is
projected to reduce
the north polar ice
cap, disrupting Arctic
ecosystems, but
possibly improving
navigation.

Table 23.1
Potential Climate-Change Effects
on Various Systems
Systems Potential Effects
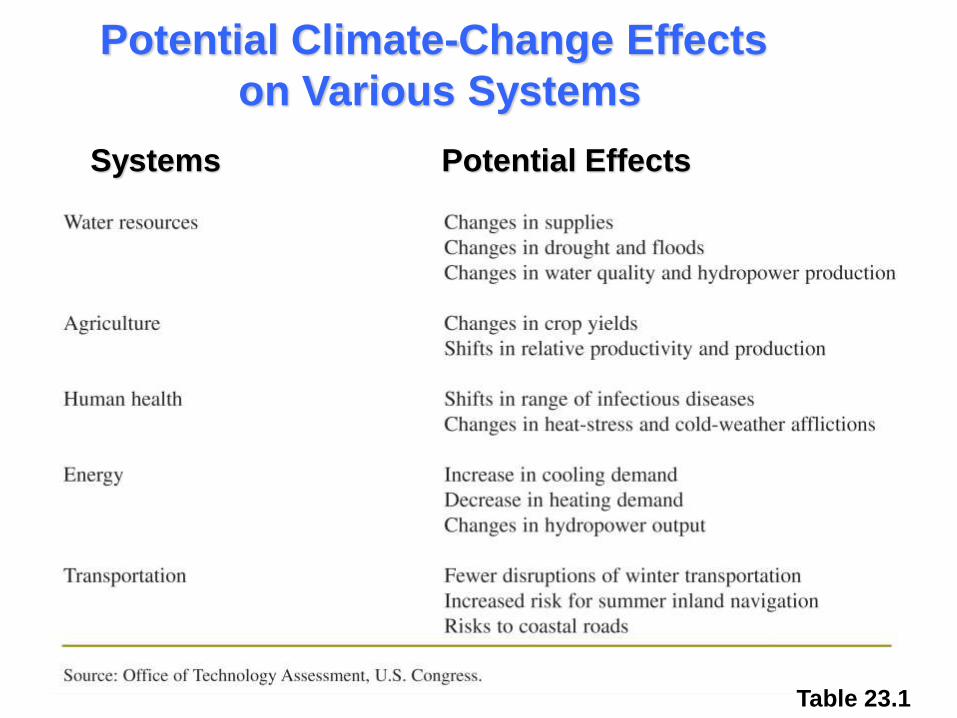
Table 23.1
Potential Climate-Change Effects
on Various Systems
Systems Potential Effects

Table 23.1