Boletim Mensal / Monthly Bulletin › fotos › editor2 › 2020 › Boletim_Mensal › 06... ·...
6
Mercado primário/ Primary market p. 1 Mercado secundário/ Secondary market p. 1 Dívida direta do Estado / State direct debt p. 2 Custo e estrutura da dívida / Cost and debt structure p. 3 Finanças públicas / Public finances p. 3 Economia / Economy p. 4 Ratings do soberano / Sovereign ratings p. 4 Notícias / News p. 4 Mercado primário Primary market Mercado secundário Secondary market http://www.igcp.pt · Tel: (+351) 217923300 · email: [email protected] · Bloomberg pages: IGCP · Reuters pages: IGCP01 Emissões de médio e longo prazo por maturidade e método de emissão [EUR mil milhões] Medium- and long-term debt issuance per bucket and method of issuance [EUR billion] Spreads de soberanos a 10 anos [pontos base] 10-year sovereign spreads [basis points] Curva de rendimentos das OT [%] PGB yield curve [%] Taxas de juro de OT a 5 e 10 anos [%] 5- and 10-year PGB yields [%] Curva spread OT-swap [pontos base] PGB-swap spread curve [basis points] Fonte/Source: Bloomberg -1- Boletim Mensal / Monthly Bulletin Dívida Pública / Public Debt junho / June 2020 Portugal Fonte/Source: IGCP Dívida emitida - últimas colocações Debt issued - latest allotments -1 0 1 2 2 3 4 5 6 7 8 9 10 15 20 30 30/Dec/2019 30/Apr/2020 29/May/2020 -50 0 50 100 150 200 2 3 4 5 6 7 8 9 10 15 20 30 30/Dec/2019 30/Apr/2020 29/May/2020 -1 0 1 2 3 4 5 6 7 Jan-14 Jul-14 Jan-15 Jul-15 Jan-16 Jul-16 Jan-17 Jul-17 Jan-18 Jul-18 Jan-19 Jul-19 Jan-20 Portugal 5Y Portugal 10Y 0 100 200 300 400 500 Portugal vs Alemanha / Portugal vs Germany Espanha vs Alemanha / Spain vs Germany Itália vs Alemanha / Italy vs Germany Calendário dos leilões de BT Tbills auction schedule Fonte/Source: IGCP 21% 51% 100% 22% 2% 25% 41% 53% 22% 9% 35% 44% 21% 2% 10% 8% 15% 26% 10% 7% 7% 13% 40% 38% 8% 25% 46% 46% 48% 45% 52% 65% 45% 7% 17% 19% 8% 2% 19% 19% 5% 0 5 10 15 20 25 2010 2011 2012 2013 2014 2015 2016 2017 2018 2019 mai/20 <4[ [4-6[ [6-9[ [9-13[ >=13 12% 41% 45% 48% 47% 25% 15% 37% 22% 58% 77% 47% 20% 36% 45% 55% 47% 54% 36% 100% 55% 9% 17% 5% 14% 10% 23% 6% 11% 12% 23% 8% 16% 17% 5% 0 5 10 15 20 25 2010 2011 2012 2013 2014 2015 2016 2017 2018 2019 mai/20 Syndications Auctions Exchanges MTN Issuance OTRV/FRN Inst rument o / Inst rument OT 2,875% OCT 2025 OT 0,475% OCT 2030 BT 20NOV2020 BT 21MAY2021 Dat a da t ransação / Trade dat e 13-05-2020 13-05-2020 20-05-2020 20-05-2020 Dat a de liquidação / Settlement date 15-05-2020 15-05-2020 22-05-2020 22-05-2020 Procura / Bids (EUR million) 1.670 1.436 2.015 3.020 Colocado / Allotted (EUR million) 887 871 903 1.241 Taxa de colocação / Allotment yield ( %) Taxa mí nima / Lowest yield ( %) -0,430 -0,400 Taxa máxima / Highest yield ( %) -0,401 -0,345 Taxa média / Average yield ( %) 0,258 0,852 -0,411 -0,351 Instrumento / Instrument Operação / Type Data indicativa / Indicative date M ontante indicativo/ Indicative amount (EUR milhões / EUR million ) BT 18SET2020 Reabertura / Reopening (3m) BT 21MAI2021 Reabertura / Reopening (11m) BT 15JAN2021 Reabertura / Reopening (6m) BT 16JUL2021 Lançament o / Launch (12m) BT 20NOV2020 Reabertura / Reopening (3m) BT 16JUL2021 Reabertura / Reopening (11m) * Leilão já realizado / Already executed 17/Jun/20* 1000-1250 15/Jul/20 1500-1750 19/Aug/20 1000-1250
Transcript of Boletim Mensal / Monthly Bulletin › fotos › editor2 › 2020 › Boletim_Mensal › 06... ·...
Mercado primário/ Primarymarket
p. 1
Mercado secundário/ Secondary market
p. 1
Dívida direta do Estado / Statedirect debt
p. 2
Custo e estrutura da dívida / Cost
and debt structure
p. 3
Finanças públicas / Public finances
p. 3
Economia / Economy
p. 4
Ratings do soberano / Sovereignratings
p. 4
Notícias / News
p. 4
Mercado primário Primary market
Mercado secundário Secondary market
http://www.igcp.pt · Tel: (+351) 217923300 · email: [email protected] · Bloomberg pages: IGCP · Reuters pages: IGCP01
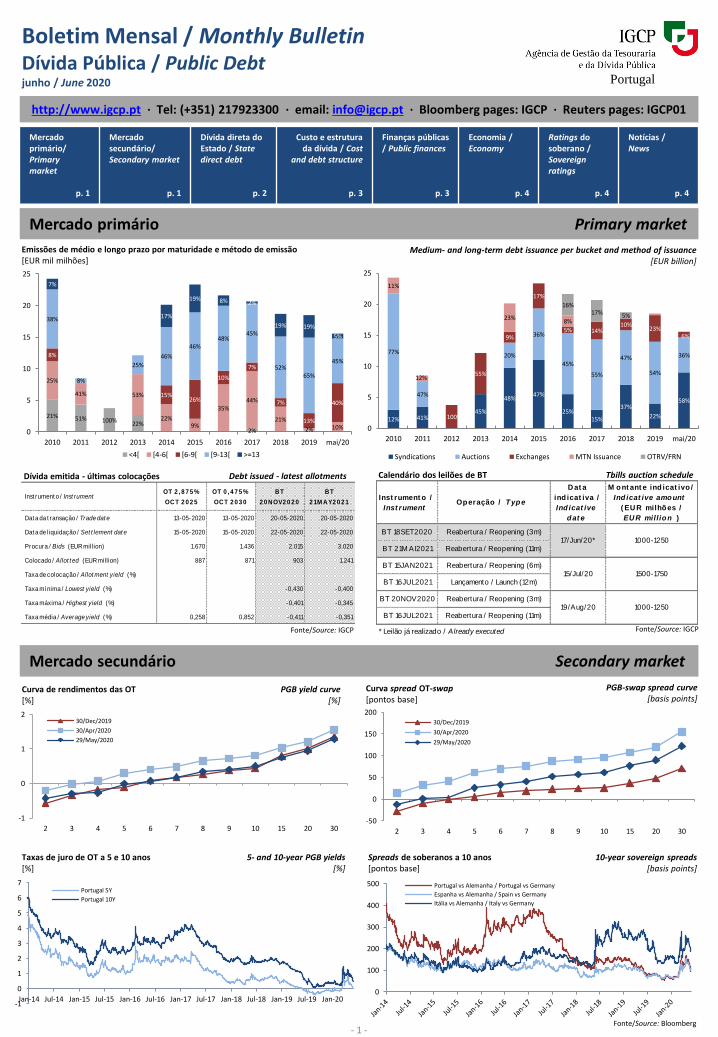
Emissões de médio e longo prazo por maturidade e método de emissão[EUR mil milhões]
Medium- and long-term debt issuance per bucket and method of issuance[EUR billion]
Spreads de soberanos a 10 anos[pontos base]
10-year sovereign spreads[basis points]
Curva de rendimentos das OT[%]
PGB yield curve[%]
Taxas de juro de OT a 5 e 10 anos[%]
5- and 10-year PGB yields[%]
Curva spread OT-swap[pontos base]
PGB-swap spread curve[basis points]
Fonte/Source: Bloomberg- 1 -
Boletim Mensal / Monthly BulletinDívida Pública / Public Debtjunho / June 2020 Portugal
Fonte/Source: IGCP
Dívida emitida - últimas colocações Debt issued - latest allotments
-1
0
1
2
2 3 4 5 6 7 8 9 10 15 20 30
30/Dec/2019
30/Apr/2020
29/May/2020
-50
0
50
100
150
200
2 3 4 5 6 7 8 9 10 15 20 30
30/Dec/2019
30/Apr/2020
29/May/2020
-1
0
1
2
3
4
5
6
7
Jan-14 Jul-14 Jan-15 Jul-15 Jan-16 Jul-16 Jan-17 Jul-17 Jan-18 Jul-18 Jan-19 Jul-19 Jan-20
Portugal 5Y
Portugal 10Y
0
100
200
300
400
500 Portugal vs Alemanha / Portugal vs Germany
Espanha vs Alemanha / Spain vs Germany
Itália vs Alemanha / Italy vs Germany
Calendário dos leilões de BT Tbills auction schedule
Fonte/Source: IGCP
21% 51% 100%22%
2%
25%
41% 53%
22%9%
35%44%
21%
2% 10%
8%
15%26%
10%
7%
7%
13%
40%
38%
8%
25%
46%
46%48%
45%
52%65%
45%
7%
17%
19% 8% 2%
19% 19%
5%
0
5
10
15
20
25
2010 2011 2012 2013 2014 2015 2016 2017 2018 2019 mai/20
<4[ [4-6[ [6-9[ [9-13[ >=13
12% 41%45%
48%47%
25%15%
37%
22%
58%
77%
47%
20%
36%
45%
55%
47%
54%
36%
100%
55%
9%
17%
5% 14%10%
23%6%
11%
12%
23%8%
16%17% 5%
0
5
10
15
20
25
2010 2011 2012 2013 2014 2015 2016 2017 2018 2019 mai/20
Syndications Auctions Exchanges MTN Issuance OTRV/FRN
Inst rument o / Inst rumentOT 2 , 8 7 5 %
OCT 2 0 2 5
OT 0 , 4 7 5 %
OCT 2 0 3 0
BT
2 0 NOV2 0 2 0
BT
2 1M AY2 0 2 1
Dat a da t ransação / Trade dat e 13-05-2020 13-05-2020 20-05-2020 20-05-2020
Dat a de liquidação / Set t lement dat e 15-05-2020 15-05-2020 22-05-2020 22-05-2020
Procura / Bids (EUR million) 1.670 1.436 2.015 3.020
Colocado / Allot t ed (EUR million) 887 871 903 1.241
Taxa de colocação / Allot ment yield (%)
Taxa mí nima / Lowest yield (%) -0,430 -0,400
Taxa máxima / Highest yield (%) -0,401 -0,345
Taxa média / Average yield (%) 0,258 0,852 -0,411 -0,351
Inst rument o /
Inst rumentOperação / T ype
D at a
ind icat iva /
Ind icat ive
dat e
M o nt ant e ind icat ivo /
Ind icat ive amount
( EU R milhões /
EU R mill ion )
BT 18SET2020 Reabertura / Reopening (3m)
BT 21M AI2021 Reabertura / Reopening (11m)
BT 15JAN2021 Reabertura / Reopening (6m)
BT 16JUL2021 Lançamento / Launch (12m)
BT 20NOV2020 Reabertura / Reopening (3m)
BT 16JUL2021 Reabertura / Reopening (11m)
* Leilão já realizado / Already executed
17/Jun/20* 1000-1250
15/Jul/20 1500-1750
19/Aug/20 1000-1250

Dívida Direta do Estado State direct debt
Movimento da dívida direta do Estado (1)
[EUR milhões]State direct debt flows (1)
[EUR million]
Saldo nominal vivo de BT e OT[mai-2020, EUR milhões]
Tbill and PGB nominal outstanding[May-2020, EUR million]
Calendário de amortizações (5)
[mai-2020, EUR mil milhões]Redemption profile (5)
[May-2020, EUR billion]
Carteira de derivados financeiros (4)
[EUR milhões]Financial derivatives’ portfolio (4)
[EUR million]
- 2 -Fonte/Source: IGCP
0
3
6
9
12
15
18
21
2020 2024 2028 2032 2036 2040 2044 2048
BT / Tbills
FEEF / EFSF
MEEF / EFSM
MEEF (maturidade final a confirmar) / EFSM (finalmaturity to be confirmed)
Outra dívida de médio e longo prazo / Othermedium and long term debt
2.8922.745
9032.539
1.3351.377
7.9748.727
10.34712.43512.711
14.18210.607
9.5675.000
11.27611.106
6.2445.377
6.9339.036
3.944
BT 17 Jul 2020BT 18 Sep 2020BT 20 Nov 2020BT 15 Jan 2021
BT 19 Mar 2021BT 21 May 2021
OT 4.8% 15 Jun 2010/2020OT 3.85% 15 Apr 2005/2021
OT 2.2% 17 Oct 2015/2022OT 4.95% 25 Oct 2008/2023OT 5.65% 15 Feb 2013/2024
OT 2.875% 15 Oct 2015/2025OT 2.875% 21 Jul 2016/2026
OT 4.125% 14 Apr 2017/2027OT 0.7% 15 Oct 2020/2027
OT 2.125% 17 Oct 2018/2028OT 1.95% 15 Jun 2019/2029
OT 3.875% 15 Feb 2014/2030OT 0.475% 18 Oct 2020/2030
OT 2.25% 18 Apr 2018/2034OT 4.1% 15 Apr 2006/2037OT 4.1% 15 Feb 2015/2045
SaldoOutstanding
jan-abr 2020 Jan-Apr 2020 SaldoOutstanding
maio 2020 May 2020 SaldoOutstanding Emissões Amort. Outros Emissões Amort. Outros
31/dez/19 Issues Redempt. Others 30/abr/20 Issues Redempt. Others 31/mai/20
Dívida denominada em euros (excluindo PAEF) /Euro-denominated debt (excluding EU-IMF loans) 197.123 25.818 16.947 (738) 205.255 4.650 3.165 (92) 206.648
Transacionável / Tradable 153.097 20.349 6.735 (738) 165.973 4.137 2.496 (92) 167.522
ECP - - - - - - - - -
BT 11.983 5.745 5.689 - 12.039 2.287 2.496 - 11.830
dos quais: BT a favor do FRDP / of which: BT issued to FRDP(2) 696 136 136 - 696 137 137 - 696
OT / Fixed rate Treasury Bonds 130.887 14.604 1.046 (738) 143.708 1.850 - (92) 145.466
OTRV / Floating rate note (FRN) 7.950 - - - 7.950 - - - 7.950
Outras obrigações / Other bonds - - - - - - - - -
MTN 2.270 - - - 2.270 - - - 2.270
Retail-Bonds 7 - - (0) 7 - - (0) 7
Não transacionável / Non tradable 44.026 5.468 10.212 (0) 39.282 512 668 - 39.126
Certificados de Aforro / Saving Certificates 12.020 260 210 - 12.071 75 44 - 12.102
Certificados do Tesouro / Treasury Certificates 17.049 1.514 1.703 - 16.859 201 123 - 16.937
CEDIC 9.720 2.923 7.871 - 4.773 98 329 - 4.542
CEDIM 953 - - - 953 - - - 953
Contas margem / Cash-collateral(3) 624 771 418 - 978 97 133 - 942
Outros / Others 3.659 0 10 (0) 3.649 40 40 - 3.649
Dívida denominada em moeda não euro (excluindo PAEF) /Non-euro denominated debt (excluding EU-IMF loans) 4.261 - - 137 4.398 - - (106) 4.293
Transacionável / Tradable 4.261 - - 137 4.398 - - (106) 4.293
ECP - - - - - - - - -
Outras obrigações / Other bonds - - - - - - - - -
MTN 4.261 - - 137 4.398 - - (106) 4.293
Não transacionável / Non tradable - - - - - - - - -
Programa de Assistência Económica e Financeira (PAEF) / Economic and Financial Assistance Programme (EU-IMF loans) 49.628 - - - 49.628 - - - 49.628
FEEF / EFSF 25.328 - - - 25.328 - - - 25.328
MEEF / EFSM 24.300 - - - 24.300 - - - 24.300
FMI / IMF - - - - - - - - -
Dívida total / Total debt 251.012 25.818 16.947 (601) 259.282 4.650 3.165 (198) 260.569
Efeito cambial de cobertura de derivados (líquido) / Exchange rate effect of hedging with derivatives (net) (629) (759) (653)
Dívida total após cobertura cambial / Total debt after exchange rate hedging 250.384 258.523 259.916
p.m.: BT criados para operações de repos / BT issued for repo transactions - - - - - 40 40 - -
p.m.: OT criadas para operações de repos / OT issued for repo transactions - - - - - - - - -
Dec-19 Apr-20 May-20 Dec-19 Apr-20 May-20 Dec-19 Apr-20 May-20 Dec-19 Apr-20 May-20
1. IRS -674 -674 -674 704 704 704 30 30 30 2 -6 -6
2. Swaptions -500 -500 -500 500 500 500 0 0 0 -300 -433 -424
3. CCIRS -3.194 -3.194 -3.194 3.816 3.939 3.843 623 745 649 611 954 838
4. FX-swaps / FX-forwards -551 -550 -550 559 566 553 9 15 2 7 14 1
4.1. dos quais cobertura capital /
of which principal hedging-439 -445 -445 445 460 449 6 14 4 5 14 3
4.2. Cobertura juros / Interest hedging -111 -105 -105 114 106 104 3 1 -2 2 1 -2
5. FX-options 0 0 0 0 0 0 0 0 0 0 0 0
Total -4.918 -4.918 -4.918 5.579 5.708 5.599 661 790 681 320 529 410
p.m. Efeito cambial swaps = -(3+4.1) - - - - - - -629 -759 -653 - - -
Valor Nocional / Notional Value Valor de Mercado
perna a pagar / pay leg perna a receber / receive leg líquido / net Market Value

Custo e estrutura da dívida Cost and debt structure
Finanças públicas Public finances
Dívida pública na ótica de Maastricht[% PIB]
Maastricht public debt[% GDP]
General government budget execution
[EUR million, yoy % change]
Execução orçamentaldas Administrações Públicas[EUR milhões, variação anual %]
Custo da dívida direta do Estado (6)
[%]State direct debt cost (6)
[%]Custo e maturidade dos empréstimos PAEF (7)
[mai-2020]Cost and maturity of EU-IMF loans (7)
[May-2020]
Duração modificada da dívida direta do Estado (9)
[anos]
Modified duration of theState direct debt (9)
[years]
Maturidade média da dívida direta do Estado (8)
[anos]
Average maturity of theState direct debt (8)
[years]
Composição da dívida direta do Estado [EUR mil milhões e % do total]
State direct debt composition[EUR billion and % of total]
Detentores de títulos de dívida direta do Estado (10)
[EUR mil milhões e % do total]
State direct debt securitiesholders (10)
[EUR billion and % of total]
Fonte/Source: Banco de Portugal
Fontes/Sources: Banco de Portugal, BCE/ECB
Fonte/Source: DGO
- 3 -
Fonte/Source: IGCP
Fonte/Source: IGCP Fonte/Source: IGCP
Fonte/Source: IGCP
Fonte/Source: IGCP
4,5
5,8
4,24,4
3,7
2,7 2,82,6
1,8
1,10,5
3,54,1 3,9 3,6 3,6 3,4 3,2
3,02,8
2,5
0
2
4
6
8
2010 2011 2012 2013 2014 2015 2016 2017 2018 2019 2020
Custo da dívida emitida / Cost of Issuance per year
Custo do stock da dívida / Cost of Debt Outstanding
7,5
6,3
10,5
0
2
4
6
8
10
12
14
16
18
20
Jan-11 Jan-12 Jan-13 Jan-14 Jan-15 Jan-16 Jan-17 Jan-18 Jan-19 Jan-20
Maturidade média residual / Average residual maturity
Maturidade média residual excl. empréstimos do PAEF / Average residual maturityexcl EU-IMF loansMaturidade média da dívida de MLP emitida em cada ano / Average maturity of MLTdebt issuance in each year
46% 47% 43% 37%40% 39% 38% 36% 35% 34% 32%
9%
17% 19% 20% 21% 22% 22% 22%19% 16%
12%10%
9%8%
7% 6% 6% 6% 6%34% 36%44%
44%
34%35%
35% 37% 37% 37% 40%
0
20
40
60
80
100
120
140
160
Dec/12 Dec/13 Dec/14 Dec/15 Dec/16 Dec/17 Dec/18 Jun/19 Sep/19 Dec/19 Feb/20
Residentes excl. BdP / Residents excl. BdP Banco de Portugal
BCE (SMP+PSPP) / ECB (SMP+PSPP) Não residentes (excl. BCE) / Non-residents (excl. ECB)
69% 70% 59% 48% 45% 43% 46% 47% 49% 51% 52%56%
6%6% 6%
6%
13%
13% 7%9% 9% 7%
7%6%
6%6% 5%
5%
13%
11%7%
6% 6% 8%9%
10%11%
12% 12%11%
32% 35%36%
32%29%
24%21% 20%
19%
133
152
175
194204
217 226236 238
246 251261
0
40
80
120
160
200
240
280
Dec/09 Dec/10 Dec/11 Dec/12 Dec/13 Dec/14 Dec/15 Dec/16 Dec/17 Dec/18 Dec/19 May/20
Outra não transacionável / Other non-tradable PAEF / EU-IMF
Retalho / Retail Outros CP / Other ST
BT / Tbills Outros MLP / Other MLT
OT / PGB TOTAL
0
1
2
3
4
5
6
Jan-01 Jan-03 Jan-05 Jan-07 Jan-09 Jan-11 Jan-13 Jan-15 Jan-17 Jan-19
100,2
114,4
129,0131,4
132,9131,2
131,5
126,1
122,0117,7
95,5
103,9
117,1
118,9120,7 121,1 119,5
116,0113,9
110,9
90,0
95,0
100,0
105,0
110,0
115,0
120,0
125,0
130,0
135,0
140,0
Dec/10 Dec/11 Dec/12 Dec/13 Dec/14 Dec/15 Dec/16 Dec/17 Dec/18 Dec/19
Dívida bruta / Gross debt
Dívida líquida de depósitos da Administração Pública /Debt net of General Government deposits
Entidade /
Entity
Montante
desembolsado /
Amount disbursed
(EUR mil milhões /
EUR billion )
Custo all-in
estimado /
Estimated all
in cost
Maturidade média final
desde data do desembolso /
Final average maturity
since disbursement date
(anos / years )
Saldo vivo /
Outstanding
(EUR mil milhões /
EUR billion )
Maturidade média
residual final /
Final average
residual maturity
(anos / years )
EFSM 24,1 2,6% 19,5 24,3 11,1
EFSF 26,0 1,6% 20,4 25,3 13,6
Perí odo / Period :
mar / M ar2 0 19 2 0 2 0
t vh /
yoy ( %)
OE 2 0 2 0 t vh /
2 0 2 0 B udget yoy ( %)
R eceit a ef et iva / Ef f ect ive revenue 2 5.3 0 1 2 6 .571 5,0 5,8
Impostos diretos / Direct taxes 4.756 5.421 14,0 3,1
Impostos indiretos / Indirect taxes 9.242 9.115 -1,4 2,7
Contribuições SS / Social security contribut ions 6.868 7.170 4,4 4,6
Outras receitas correntes / Other current revenue 3.887 4.266 9,8 15,8
Receita de capital / Capital revenue 547 598 9,4 46,1
D espesa ef et iva / Ef f ect ive expend it ure 2 6 .6 11 2 8 .2 2 2 6 ,1 6 ,7
Despesas com pessoal / Compensation of employees 6.124 6.431 5,0 2,7
Aquisição de bens e serviços / Purchase of goods and services 3.589 3.953 10,2 6,8
Juros e outros encargos / Interests and other charges 3.388 3.225 -4,8 -2,9
Transferências correntes / Current transfers 11.304 12.019 6,3 2,6
Subsídios / Subsidies 335 396 17,9 64,5
Outras despesas correntes / Other current expenditures 264 263 -0,6 118,2
Despesa de capital / Capital expenditure 1.606 1.935 20,5 33,1
Saldo g lobal / Overall balance - 1.3 10 - 1.6 51
Saldo primário / Primary balance 2 .0 78 1.574

Economia Portuguesa Portuguese Economy
Notícias News
Principais indicadores macroeconómicos Main macroeconomic indicators
Fontes/Sources: INE/Statistics Portugal, Banco de Portugal
- 4 -
Disclaimer Disclaimer
A informação disponibilizada neste Boletim foi compilada a partir de fontes que se julga seremfidedignas e de boa fé, mas nenhuma garantia, expressa ou implícita, poderá ser dada sobre a suafiabilidade, integridade ou correção.
Todas as estimativas apresentadas neste documento são publicadas para auxílio dos seus leitores,mas não podem em caso algum ser consideradas definitivas ou substituir o julgamento do leitor,nem o seu conteúdo constitui a base de qualquer contrato ou compromisso.
O IGCP não poderá em caso algum ser responsabilizado por qualquer perda que direta ouindiretamente resulte da utilização deste documento ou da informação nele contida.
The information contained in this bulletin have been compiled or arrived at from sources believed tobe reliable and in good faith, but no representation or warranty, express or implied, is made as totheir accuracy, completeness or correctness.
All estimates contained in this document are published for the assistance of recipients, but is not tobe relied upon as authoritative or taken in substitution for the exercise of judgment by a recipientand, therefore, does not form the basis of any contract or commitment whatsoever.
IGCP does not accept any liability whatsoever for any direct or consequential loss arising from anyuse of this document or its contents.
Páginas internet com informação económica sobre PortugalPortuguese Economy Web Sites
DGO - Direcção Geral do Orçamento Budget General Directorate www.dgo.pt
INE- Instituto Nacional de Estatística Statistics Portugal www.ine.pt
BP - Banco de Portugal Bank of Portugal www.bportugal.pt
CFP - Conselho de Finanças Públicas Portuguese Public Finance Council www.cfp.pt
PE Probe - Portuguese Economy Probe Portuguese Economy Probe www.peprobe.com
Operadores Especializados em Valores do Tesouro (OEVT) - OT
Primary Dealers
Banco Santander, S.A. Caixa Banco de Investimento, S.A. HSBC France Nomura International, Plc
Barclays Bank, Plc Citigroup Global Markets Limited Jefferies International Limited Novo Banco, S.A.
BBVA Crédit Agricole CIB J.P. Morgan Société Générale
BNP Paribas Deutsche Bank, AG Morgan Stanley & Co International
CaixaBank, S.A. Goldman Sachs International Bank Natwest Markets, Plc
Operadores de Mercado Primário (OMP) - OT Other Auction Participants
Millenniumbcp
Especialistas em Bilhetes do Tesouro (EBT) Treasury Bill Specialists
Banco Santander, S.A. Caixa Geral de Depósitos, S.A. HSBC France Natwest Markets, Plc
Barclays Bank, Plc Citigroup Global Markets Limited Jefferies International Limited Nomura International, Plc
BBVA Crédit Agricole CIB J.P. Morgan Novo Banco, S.A.
BNP Paribas Deutsche Bank, AG Millenniumbcp Société Générale
CaixaBank, S.A. Goldman Sachs International Bank Morgan Stanley & Co International
Ratings do soberano Sovereign Ratings
Fonte/Source: DBRS, Fitch, Moody’s, S&P [à data de/as of: 31-05-2020]
Indicador / Indicator Unidade / Unit 2017 2018 2019 2019 I 2019 II 2019 III 2019 IV 2020 I
PIB real / Real GDP Variação homóloga, % / year-on-year, % 3,5 2,6 2,2 2,4 2,1 1,9 2,2 -2,3
Inflação (IHPC) / Inflation (HICP) Variação homóloga, % / year-on-year, % 1,6 1,2 0,3 0,8 0,6 -0,3 0,2 0,5
Taxa de desemprego / Unemployment rate % da população ativa / % of labour force 8,9 7,0 6,5 6,8 6,3 6,1 6,7 6,7
Balança corrente / Current account % PIB / % GDP 1,0 0,2 0,0 -0,3 -0,2 -0,3 0,0
Balança corrente e de capital / Capital and current account % PIB / % GDP 1,8 1,2 0,8 0,7 0,8 0,6 0,8
Saldo das Administrações Públicas (SEC 2010) /
General Government balance (ESA 2010)% PIB / % GDP -3,0 -0,4 0,2 -0,2 0,1 -0,1 0,2
Dívida pública na ótica de Maastricht / Maastricht public debt % PIB / % GDP 126,1 122,0 117,7 123,4 120,8 120,2 117,7 120,2
Agê nc i a de Not a ç ã o /
Cr e di t Ra t i ng Age nc yAug- 2 0 19 S e p- 2 0 19 Oc t - 2 0 19 Nov - 2 0 19 J a n- 2 0 2 0 M a r - 2 0 2 0 Apr - 2 0 2 0 M a y - 2 0 2 0 J ul - 2 0 2 0 S e p- 2 0 2 0 Nov - 2 0 2 0
DBRS ( BBB (high) / St a.)04/ 10 (BBB t o BBB
high)
20/ 03 (St able |
Af f irmed)18/ 09
Fit ch ( BBB / St a.)22/ 11 (Posit ive |
Af f irmed)17/ 04 (St able) 22/ 05 20/ 11
Moody’s ( Baa3 / Pos.) 09/ 08 (Posit ive) 17/ 01 17/ 07
S&P ( BBB / St a.) 13/ 09 (Posit ive)13/ 03 (Posit ive |
Af f irmed)24/ 04 (St able) 11/ 09

Notas explicativas Explanatory notes
1. Os saldos em dívida encontram-se ao valor nominal (exceto osinstrumentos emitidos a desconto, nomeadamente os BT, que seencontram ao valor descontado), valorizados à taxa de câmbio do final doperíodo, enquanto que os valores de emissões e de amortizações estão aovalor de encaixe. A coluna Outros inclui variações cambiais, mais- oumenos-valias nas emissões e nas amortizações e a variação do valor darenda perpétua e dos consolidados.
2. Com base na eficiente gestão ativa da dívida direta do Estado, foramemitidos BT a favor do Fundo de Regularização da Dívida Pública (FRDP),tendo em vista o suporte de operações em mercado secundário. O saldo dadívida directa do Estado inclui este montante.
3. As contas margem correspondem aos montantes que as contrapartesentregam à República Portuguesa como colateral em dinheiro para fazerface a perdas potenciais decorrentes de contratos de derivados financeiros,i.e. quando o valor de mercado das posições em derivados é favorável àRepública. Essas garantias podem ser entregues sob a forma de títulos dedívida pública (sem impacto sobre o saldo da dívida) ou sob a forma dedinheiro. No entanto, a partir de 2011, as contrapartes passaram aprivilegiar a entrega de colateral em dinheiro. A dívida direta do Estadopassou a incluir o montante referente a estas contas margem a partir dedezembro de 2015, seguindo o critério adotado pelas autoridadesestatísticas para a dívida de Maastricht. As contas margem têm um impactoneutro no património líquido do Estado, uma vez que um aumento(redução) do seu valor se reflete numa emissão (amortização) de dívidaque é compensada por um aumento (redução) equivalente dos depósitosda Tesouraria Central do Estado.
4. Inclui instrumentos de derivados financeiros contratados pela República,que se dividem nas seguintes rubricas: (i) IRS – swaps de taxa de juro; (ii)swaptions – opções sobre swaps de taxa de juro; (iii) CCIRS – swaps decobertura de risco cambial e de taxa de juro; (iv) FX-swap e FX-forward –outros instrumentos de cobertura de risco cambial; e (v) FX-options –opções sobre instrumento de cobertura de risco cambial.
5. O calendário de amortizações exclui as amortizações de CA, CT, CEDIC eCEDIM. A maturidade final dos empréstimos do MEEF não está aindadefinida.
6. Custo da dívida emitida = custo médio dos BT, OT, OTRV e MTN emitidosno ano correspondente, ponderado pelo montante e maturidade. Custo dostock da dívida = rácio entre juros do subsetor Estado na ótica de ContasNacionais e saldo médio da dívida direta do Estado no final dos anos t e t-1.
7. A estimativa de custo “all-in” dos empréstimos do PAEF inclui todos oscustos diretamente associados (juros e comissões). A estimativa da TIR paraos empréstimos do FEEF tem em consideração o programa definanciamento previsto pelo FEEF e a evolução implícita nas forwards detaxa de juro. O montante desembolsado por cada entidade corresponde aovalor de emissão subtraído de todas as comissões e outros custos pagos nadata de emissão. A maturidade média final tem em consideração amaturidade final esperada dos empréstimos do MEEF.
8. A maturidade média residual tem em consideração o refinanciamentodos empréstimos do MEEF a ser concretizado. A maturidade média dadívida de médio e longo prazo emitida inclui emissões de OT e MTNocorridas no ano correspondente.
9. A duração modificada é calculada para a carteira total de dívida direta doEstado, incluindo derivados financeiros. A série histórica regista umaquebra em 31 de dezembro de 2018, em resultado de uma alteração dametodologia de avaliação do valor presente e do valor de mercado departe significativa dos instrumentos de gestão de dívida. De acordo com anova metodologia privilegia-se a avaliação dos instrumentos com recurso àcurva de rendimentos construída a partir de taxas de juro de Bilhetes eObrigações do Tesouro.
10. Exclui dívida não transacionável, nomeadamente os empréstimos doPAEF. Calculado por diferença entre os títulos de dívida da AdministraçãoCentral (AC) e os títulos de dívida das empresas públicas incluídas na AC. Ovalor detido pelo Banco de Portugal (BdP) está valorizado ao custoamortizado. O valor detido pelo Banco Central Europeu corresponde aomontante de títulos de dívida pública portuguesa adquiridos no âmbito doSecurities Market Programme ao valor nominal (divulgado publicamentepelo BCE apenas a partir de 2012) e do Public Sector Purchase Programmevalorizado ao custo amortizado, líquido do valor detido pelo BdP.
1. The outstanding amounts are at nominal value (except for theinstruments issued at discount, namely Tbills, which are at discountedvalue), converted at the end-of-period exchange rate, while the issues andredemptions are net of premiums or discounts. The column Others includesexchange rate fluctuations, premiums or discounts and value changes ofperpetual and consolidated debt.
2. Based on an efficient management of public debt, Tbills were issued tothe Public Debt Regularization Fund (FRDP), to conduct secondary marketoperations. State debt outstanding includes this amount.
3. Cash-collateral corresponds to the amount received from the PortugueseRepublic counterparties to compensate for potential losses arising fromfinancial derivatives contracts, i.e. when the market value of the derivativesportfolio is favourable for the Republic. These guarantees may be givenusing Government debt securities (without impact in the debt stock) orusing cash. However, since 2011, most counterparties have preferred togive cash-collateral. The State direct debt includes the amount of thesecash-collaterals since December 2015, following the criteria adopted by thestatistical authorities for the Maastricht debt. The cash-collateral has aneutral impact on the State’s net wealth, since an increase (reduction) of itsvalue is reflected in a debt issuance (redemption) that is compensated by anequivalent increase (reduction) of the deposits of the State TreasuryAccount.
4. Includes financial derivatives traded by the Portuguese Republic,comprising the following types: (i) IRS – interest rate swaps; (ii) swaptions –options on interest rate swaps; (iii) CCIRS – cross-currency interest rateswaps; (iv) FX-swap and FX-forward – foreign-exchange risk hedges; and(v) FX-options – options on foreign-exchange risk hedges.
5. The redemption profile excludes the redemptions of Saving and Treasurycertificates, as well as of CEDIC and CEDIM – short- and medium- to long-term special certificates held by other public entities. The final maturitydate of the EFSM loans is still not defined.
6. Cost of issuance = average cost of Tbills, PGB, FRN and MTN issued in thecorresponding year, weighted by issuance amount and maturity. Cost ofdebt outstanding = interest costs of the State subsector on an accrual basis/ average State direct debt outstanding at end of t and t-1.
7. The estimated all-in cost of the EU-IMF loans includes all direct costs(interest and fees). The IRR estimate for the EFSF loans takes into accountthe provisional EFSF funding program and interest rate forwards. Theamount disbursed by each entity corresponds to the issuance amountdeducted from all fees and other costs paid at the issuance date. The finalaverage maturity takes into account the final expected maturity of theEFSM loans.
8. The average residual maturity takes into account the rollover of the EFSMloans still to be executed. The average maturity of medium- and long-termdebt issuance considers PGB and MTN issued in the corresponding year.
9. The modified duration is computed for the overall State direct debtportfolio, including financial derivatives. The series presents a structuralbreak on 31 December 2018, due to a change of methodology in thecalculation of the present and market value of a significant share of debtinstruments. According to the new methodology, calculations derived fromyield curves created from Portuguese treasury bills and bonds are favored.
10. Excluding non-tradable debt, namely the EU-IMF loans. Obtained fromthe difference between the debt securities issued by the CentralGovernment (CG) and those issued by public companies included in the CG.The amount of debt held by Banco de Portugal (BdP) is valued at amortisedcost. The amount of debt held by the European Central Bank corresponds tothe amount of Portuguese debt securities purchased under the SecuritiesMarket Programme at nominal value (publicly disclosed by the ECB onlyfrom 2012 onwards) and the Public Sector Purchase Programme atamortised cost, net of the debt securities held by BdP.
- 5 -

Siglas e abreviaturas Abbreviations
- 6 -
BCE Banco Central Europeu
BT Bilhetes do Tesouro
CA Certificados de Aforro
CCIRS Cross Currency Interest Rate Swap
CEDIC Certificados Especiais de Dívida Pública
CEDIM Certificados Especiais de Dívida de Médio e Longo Prazo
CP Curto prazo
CT Certificados do Tesouro
DBRS Dominion Bond Rating Service
DSE Direitos de Saque Especial
EBT Especialista em Bilhetes do Tesouro
ECP Euro-Commercial Paper
EUR Euro
FEEF Facilidade Europeia de Estabilidade Financeira
FMI Fundo Monetário Internacional
FRDP Fundo de Regularização da Dívida Pública
IGCP Agência de Gestão da Tesouraria e da Dívida Pública – IGCP, E.P.E.
IHPC Índice Harmonizado de Preços no Consumidor
INE Instituto Nacional de Estatística
IRS Interest rate swap
MEEF Mecanismo Europeu de Estabilização Financeira
MLP Médio e Longo Prazo
MTN Medium Term Notes
OE Orçamento de Estado
OEVT Operadores Especializados em Valores do Tesouro
OMP Operadores do Mercado Primário
OT Obrigações do Tesouro
OTC Over-the-Counter
OTRV Obrigações do Tesouro Rendimento Variável
PAEF Programa de Assistência Económica e Financeira
PGB Portuguese Government Bonds
PIB Produto Interno Bruto
pp pontos percentuais
PSPP Public Sector Purchase Programme (programa de aquisição de títulos de dívida soberana)
Repos Reportes (Acordos de Recompra)
S&P Standard & Poor’s
SMP Securities Market Programme
TIR Taxa interna de rendibilidade
UE União Europeia
BT Treasury Bills
CA Saving Certificates
CCIRS Cross Currency Interest Rate Swap
CEDIC Special Certificates of Government Debt
CEDIM Special Certificates of Medium and Long term Debt
CT Treasury Certificates
DBRS Dominion Bond Rating Service
EBT Treasury Bill Specialist
ECB European Central Bank
ECP Euro-Commercial Paper
EFSF European Financial Stability Facility
EFSM European Financial Stabilisation Mechanism
EU European Union
EUR Euro
FRDP Public Debt Stabilisation Fund
FRN Floating rate note
GDP Gross Domestic Product
HICP Harmonised Index of Consumer Prices
IGCP Portuguese Treasury and Debt Management Agency
IMF International Monetary Fund
INE Statistics Portugal
IRR Internal rate of return
IRS Interest rate swap
MLT Medium and Long Term
MTN Medium Term Notes
OE State Budget
OEVT Primary Dealers
OMP Other Auction Participants
OT Treasury Bonds
OTC Over-the-Counter
PGB Portuguese Government Bonds
pp percentage points
PSPP Public Sector Purchase Programme
Repos Repurchase Agreements
SDR Special Drawing Rights
S&P Standard & Poor’s
SMP Securities Market Programme
ST Short term


![UNIVERSIDADE FEDERAL DE MINAS GERAIS Escola de … · APR Avaliação Preliminar de Riscos CAD Computer Aided Design [desenho assistido por computador] CapEx Capital Expenditure [estimativa](https://static.fdocumentos.tips/doc/165x107/5c609e7809d3f2db6c8bcaee/universidade-federal-de-minas-gerais-escola-de-apr-avaliacao-preliminar-de.jpg)