
Análisis molecular de la interacción Fitocromo-PIF-LHY en...
39
UNIVERSIDAD POLITÉCNICA DE MADRID ESCUELA TÉCNICA SUPERIOR DE INGENIERÍA AGRONÓMICA, ALIMENTARIA Y DE BIOSISTEMAS GRADO EN BIOTECNOLOGÍA Análisis molecular de la interacción Fitocromo-PIF-LHY en la respuesta fotoperiódica de chopo TRABAJO FIN DE GRADO Autor: Daniel Alique García Madrid, 2018 “Molecular analyses of Phytochrome-PIF-LHY interaction in poplar photoperiodic response”
Transcript of Análisis molecular de la interacción Fitocromo-PIF-LHY en...
UNIVERSIDAD POLITÉCNICA DE MADRID
ESCUELA TÉCNICA SUPERIOR DE INGENIERÍA
AGRONÓMICA, ALIMENTARIA Y DE BIOSISTEMAS
GRADO EN BIOTECNOLOGÍA
Análisis molecular de la interacción Fitocromo-PIF-LHY en la respuesta fotoperiódica de chopo
TRABAJO FIN DE GRADO
Autor: Daniel Alique García
Madrid, 2018
“Molecular analyses of Phytochrome-PIF-LHY interaction in poplar photoperiodic response”

ii
UNIVERSIDAD POLITÉCNICA DE MADRID
ESCUELA TÉCNICA SUPERIOR DE INGENIERÍA
AGRONÓMICA, ALIMENTARIA Y DE BIOSISTEMAS
GRADO DE BIOTECNOLOGÍA
ANÁLISIS MOLECULAR DE LA INTERACCIÓN FITOCROMO-PIF-LHY EN LA RESPUESTA FOTOPERIÓDICA DE CHOPO
TRABAJO FIN DE GRADO
Daniel Alique García
MADRID, 2018
Director: Mariano Perales
Investigador Ramón y Cajal
Centro de Biotecnología y Genómica de Plantas
iii
ANÁLISIS MOLECULAR DE LA INTERACCIÓN FITOCROMO-PIF-LHY EN LA
RESPUESTA FOTOPERIÓDICA DE CHOPO
Memoria presentada por DANIEL ALIQUE GARCÍA para la obtención del título de Graduado en Biotecnología por la Universidad Politécnica de Madrid
Fdo: Daniel Alique García
VºBº Tutor y director del TFG D. Mariano Perales Investigador Ramón y Cajal Centro de Biotecnología y Genómica de Plantas
VºBº Co-tutor del TFG Da. Isabel Allona Alberich Catedrática de Universidad Dpto. de Biotecnología-Biología Vegetal ETSIAAB - Universidad Politécnica de Madrid
Madrid, 27 de junio, 2018

iv
GENERAL INDEX
INDEX OF FIGURES ................................................................................................... v
LIST OF SYMBOLS ................................................................................................... vi
LIST OF ABBREVIATIONS ........................................................................................ vii
SUMMARY ................................................................................................................ viii
CHAPTER 1. Introduction and objectives ...................................................................... 1
1. Growth cessation ................................................................................................... 2
1.1. Photosensor system ..................................................................................... 3
1.2. Endogenous oscillator ................................................................................... 4
1.3. Mobile signal ................................................................................................. 5
2. Photoperiodic control of FT2: CO/FT module ........................................................ 5
3. Phytochrome-Interacting Factors ........................................................................... 6
3.1. Connection with the circadian clock (LHY2) ................................................... 6
3.2. DNA binding capacity .................................................................................... 7
4. Night hour counting mechanism model controlling poplar growth cessation .......... 8
4.1. LHY2, a night hour counter ............................................................................ 8
4.2. LHY2 promoter dissection ............................................................................. 9
4.3. Phytochromes and PIF1. ............................................................................. 9
5. Objectives. .......................................................................................................... 10
CHAPTER 2. Materials and methods .......................................................................... 11
CHAPTER 3. Results .................................................................................................. 14
1. Night break prevents growth cessation in poplar. ................................................ 14
2. Red light illumination ceases night perception of LHY2. ...................................... 16
3. Diurnal expression of phytochromes signalling genes. ........................................ 17
4. PIF1 does not bind LHY2 cis-regulatory elements. .............................................. 18
5. HY5_10 binds to LHY2 promoter in vitro. ............................................................ 19
CHAPTER 4. Discussion and conclusions .................................................................. 21
1. Night break disrupts SD growth pattern. .............................................................. 21
2. LHY2 transcription response to red light. ............................................................. 21
3. Phytochrome signalling and LHY2 transcriptional regulation. .............................. 22
4. PIF1 binding to LHY2 promoter needs an additional LHY2 binding factor. ........... 22
5. Day/night duration measurement mechanism controls poplar growth. ................. 24
6. Conclusions. ........................................................................................................ 26
CHAPTER 5. References ........................................................................................... 27
APPENDIX ................................................................................................................. 30
v
INDEX OF FIGURES
Figure 1. Annual growth cycle in poplar. ....................................................................... 1
Figure 2. Scheme of leaf-localized photoperiodic time measurement mechanism in
poplar ........................................................................................................................... 3
Figure 3. RNAi LHY1/2 poplar lines are less sensitive to the shortening of daylength .. 4
Figure 4. FT2 and LHY2 expression is regulated by light conditions. ........................... 8
Figure 5. LHY2 promoter deletions............................................................................. 9
Figure 6. Night hour counting mechanism theorized controlling poplar growth cessation
................................................................................................................................... 10
Figure 7. Night break prevents growth cessation in poplar ........................................ 15
Figure 8. LHY2 promoter activity is reduced by night break, in a similar manner to LD.
................................................................................................................................... 17
Figure 9. PHYB2, PHYA and PIF1 diurnal expression patterns ................................. 18
Figure 10. PIF1DBD doesn’t bind to the promoter region identified as essential for LHY2
photoperiodic control ................................................................................................. 19
Figure 11. HY5_10 can bind GCE2 and GCE3 motifs of LHY2 promoter ................... 20
Figure 12. Updated night hour counting mechanism model controlling poplar growth
cessation .................................................................................................................... 24

vi
LIST OF SYMBOLS
ºC: Celsius degrees
h: hour
µmol: micromole
mM: milliMolar
nm: nanometre
V: Volt

vii
LIST OF ABBREVIATIONS
At(gene/protein): Arabidopsis thaliana (gene/protein)
CDL: Critical daylength
CO: CONSTANS
COP1/SPA: CONSTITUTIVE PHOTOMORPHOGENEIC 1/ SUPPRESSOR OF PHYA
EMSA: Electrophoretic mobility shift assay
FHY3: RED ELONGATED HYPOCOTYL 3
FT: FLOWERING LOCUS T
GCE: G-box coupling element
His-: Hexahistidine-tag
HRE: HIPOXIA RESPONSIVE ERF
HY5: ELONGATED HYPOCOTYL 5
LD: Long day
LHY: LATE ELONGATED HYCOCOTYL
MBP-: Maltose Binding Protein-tag
ME: Morning element
NB: Night break by red illumination
NExt: Night extension
Pfr: Active phytochrome conformer
PHY: PHYTOCHROME
PIF: PHYTOCROME INTERACTING FACTOR
PIF1DBD: PIF1 DNA binding domain
pLHY2::LUC: LHY2 promoter: Luciferase
Pr: Inactive phytochrome conformer
SD: Short day
ZT: Zeitgeber time

viii
SUMMARY
As sessile organism, plants require adaptive mechanisms to fit its development with their
local environment. The adaptative versatility is especially meaningful for woody
perennials trees from temperate and boreal regions, long-life organisms that have to deal
with the harsh winter conditions year after year. With the aim to survive to this season,
perennials have evolved the vegetative growth-dormancy phenological transition. During
winter dormancy plants enter in a growth quiescent state resistant to freezing and
drought stress. In poplar, the shortening of daylength leads to shoot apical growth
cessation that is the gateway of dormancy establishment. During last decade, molecular
components mediating this photoperiodic control of growth cessation have started to
emerge, however understanding the mechanism involved require deeper analysis.
Previous studies performed in the laboratory, using poplar as the experimental
system, proved that the photoperiod integrator and growth inductor FLOWERING
LOCUS T 2 (FT2), is quantitatively repressed in response to the extension of the night.
An investigation of the photoperiodic repression route was initiated revealing that the
clock gene LATE ELONGATED HYPOCOTYL 2 (LHY2) is involved. Moreover, it was
identified the phytochrome signalling pathway as the responsible for perceiving and
transferring the photoperiodic external information to LHY2. These results have led to
hypothesize that a novel pathway senses the progressive extension of the night and
eventually represses FT2 expression, causing poplar shoot apical growth cessation. The
purpose of this work is to provide new experimental evidences that support this model,
focusing on understanding the photoperiodic control of LHY2 transcription.
This study evidences that night break assays, where poplars were subjected to a
red-light pulse in the middle of the night, release the repression of FT2 and subsequently
the bud set establishment triggered under short days. Moreover, in these conditions
LHY2 expression, as well as the other growth repressors acting up/downstream of LHY2
are downregulated, supporting the model hypothesized. Furthermore, it is shown that
red-light illumination inhibits LHY2 activation at the end of the night, pointing that
phytochrome signalling pathway could control its transcription. Remarkably, it is
demonstrated that the ELONGATED HYPOCOTYL 5 chromosome 10 (HY5_10) gene,
whose homologue in Arabidopsis is known to act downstream of the phytochromes and
physically interact with PHYTOCHROME-INTERACTING FACTOR 1 (PIF1), binds to
cis-regulatory elements of the LHY2 promoter, previously identified as essentials for its
correct photoperiodic transcriptional activation. Thus, a new model of LHY2
transcriptional regulation based on PIF1/HY5_10 ratio is proposed.

ix
This work reinforces the importance of the phytochromes signalling pathway in
the regulation of LHY2 transcription, supporting its participation in the photoperiodic
repressing route that control the levels of FT2 and shoot growth in a quantitative manner.

1
CHAPTER 1. Introduction and objectives
Natural forests, that cover 30% of terrestrial land surface, are indispensable for
biodiversity conservation and humankind progress due to its tangible and intangible
values. It is required to improve the planted forests efficiency to maintain this natural
resource and satisfying, at the same time the increasing demand for forests products
(Hirsch & May, 2012).
In contrast with annual plants, forests trees for boreal and temperate regions have
to deal with large seasonal changes of the environmental factors, because of its longer
life. In addition, climate change will alter and increase these seasonal fluctuations (Singh
et al., 2016). As sessile organisms, they can’t flee from stress, so they must adapt for its
survival. A remarkable example is the shoot apical and the cambial meristems cycle
between active growth and dormancy (Figure 1), that allows perennials to acclimate
winter conditions, acquiring cold tolerance and freeze and water stress hardiness
(Maurya & Bhalerao, 2017).
Figure 1. Annual growth cycle in poplar. Adapted from Singh et al. (2016).
In poplars, shortening of photoperiod below the critical daylength permissive for growth, triggers
growth cessation culminating in bud set (ecodormancy). Prolonged exposure to short days, together
with low temperatures induce the endodormancy protective state. Once established, dormant
meristem becomes insensitive to growth promotive signals. The release from dormancy strongly
depends on the accumulation of defined number chilling hours (below 4°C). Finally, chilling
dependent activation of growth promoters reactivate meristems growth under spring conditions.
SD= short days, LT= low temperature, WT= warm temperature and LD= long days.
2
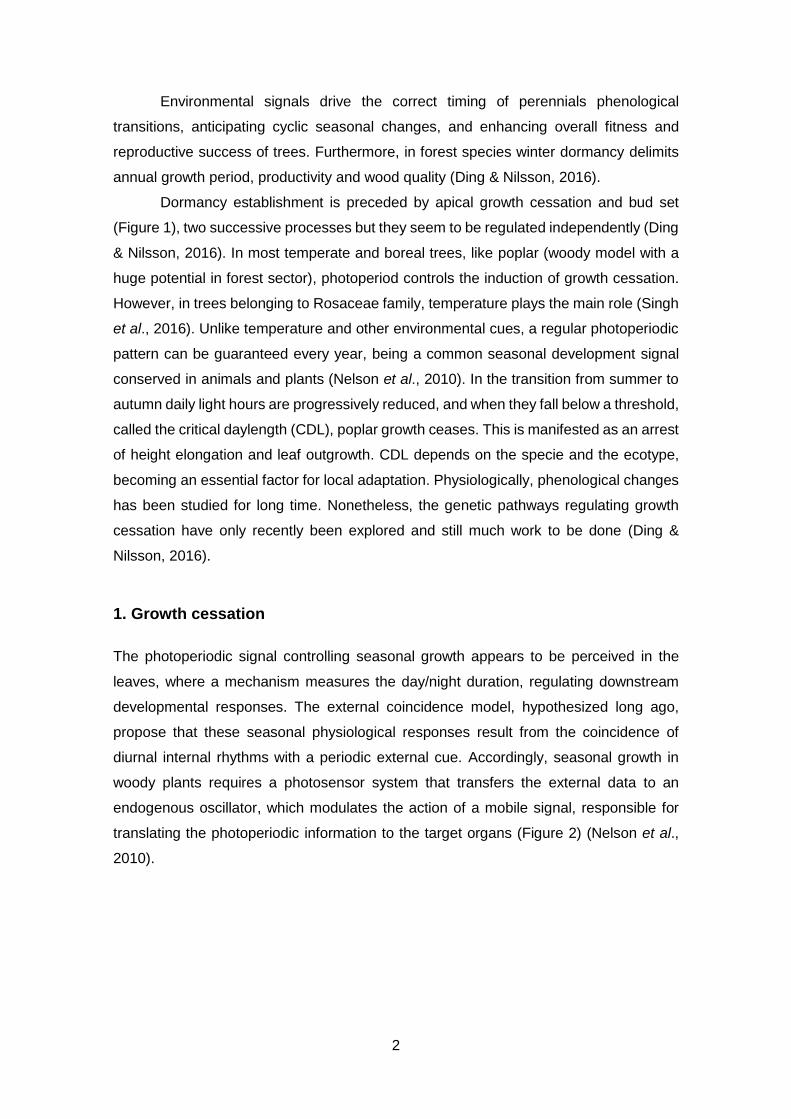
Environmental signals drive the correct timing of perennials phenological
transitions, anticipating cyclic seasonal changes, and enhancing overall fitness and
reproductive success of trees. Furthermore, in forest species winter dormancy delimits
annual growth period, productivity and wood quality (Ding & Nilsson, 2016).
Dormancy establishment is preceded by apical growth cessation and bud set
(Figure 1), two successive processes but they seem to be regulated independently (Ding
& Nilsson, 2016). In most temperate and boreal trees, like poplar (woody model with a
huge potential in forest sector), photoperiod controls the induction of growth cessation.
However, in trees belonging to Rosaceae family, temperature plays the main role (Singh
et al., 2016). Unlike temperature and other environmental cues, a regular photoperiodic
pattern can be guaranteed every year, being a common seasonal development signal
conserved in animals and plants (Nelson et al., 2010). In the transition from summer to
autumn daily light hours are progressively reduced, and when they fall below a threshold,
called the critical daylength (CDL), poplar growth ceases. This is manifested as an arrest
of height elongation and leaf outgrowth. CDL depends on the specie and the ecotype,
becoming an essential factor for local adaptation. Physiologically, phenological changes
has been studied for long time. Nonetheless, the genetic pathways regulating growth
cessation have only recently been explored and still much work to be done (Ding &
Nilsson, 2016).
1. Growth cessation
The photoperiodic signal controlling seasonal growth appears to be perceived in the
leaves, where a mechanism measures the day/night duration, regulating downstream
developmental responses. The external coincidence model, hypothesized long ago,
propose that these seasonal physiological responses result from the coincidence of
diurnal internal rhythms with a periodic external cue. Accordingly, seasonal growth in
woody plants requires a photosensor system that transfers the external data to an
endogenous oscillator, which modulates the action of a mobile signal, responsible for
translating the photoperiodic information to the target organs (Figure 2) (Nelson et al.,
2010).
3
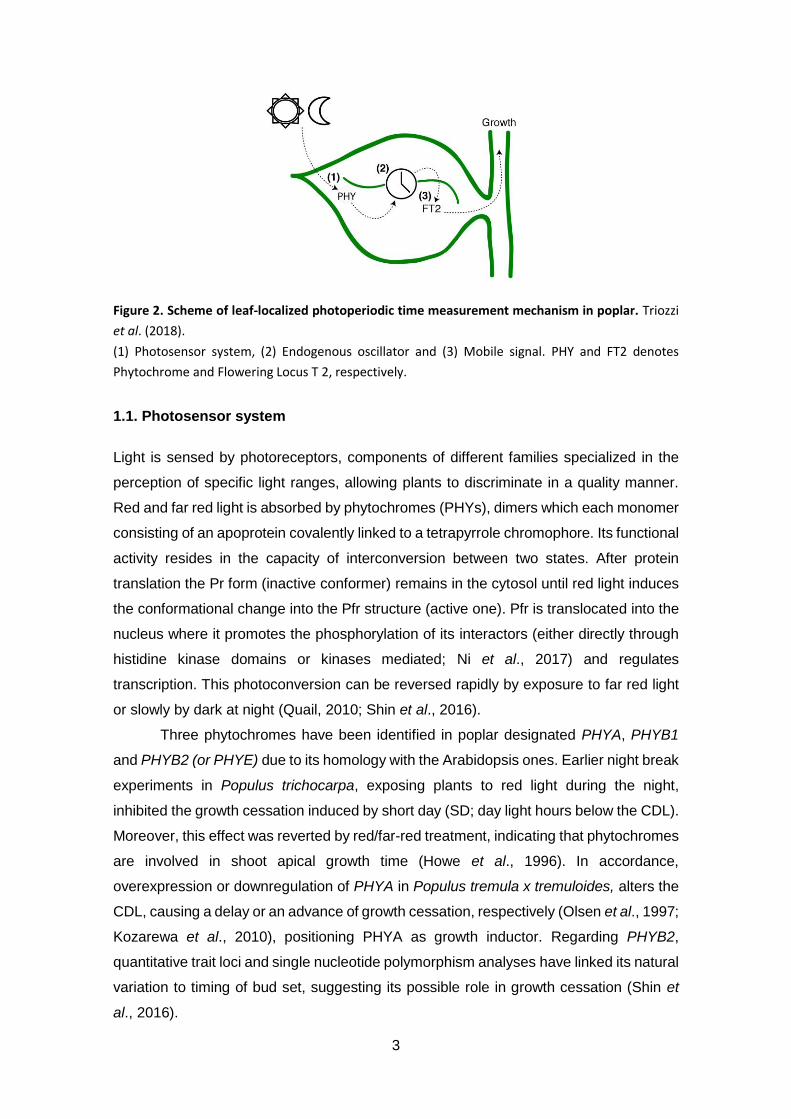
Figure 2. Scheme of leaf-localized photoperiodic time measurement mechanism in poplar. Triozzi
et al. (2018).
(1) Photosensor system, (2) Endogenous oscillator and (3) Mobile signal. PHY and FT2 denotes
Phytochrome and Flowering Locus T 2, respectively.
1.1. Photosensor system
Light is sensed by photoreceptors, components of different families specialized in the
perception of specific light ranges, allowing plants to discriminate in a quality manner.
Red and far red light is absorbed by phytochromes (PHYs), dimers which each monomer
consisting of an apoprotein covalently linked to a tetrapyrrole chromophore. Its functional
activity resides in the capacity of interconversion between two states. After protein
translation the Pr form (inactive conformer) remains in the cytosol until red light induces
the conformational change into the Pfr structure (active one). Pfr is translocated into the
nucleus where it promotes the phosphorylation of its interactors (either directly through
histidine kinase domains or kinases mediated; Ni et al., 2017) and regulates
transcription. This photoconversion can be reversed rapidly by exposure to far red light
or slowly by dark at night (Quail, 2010; Shin et al., 2016).
Three phytochromes have been identified in poplar designated PHYA, PHYB1
and PHYB2 (or PHYE) due to its homology with the Arabidopsis ones. Earlier night break
experiments in Populus trichocarpa, exposing plants to red light during the night,
inhibited the growth cessation induced by short day (SD; day light hours below the CDL).
Moreover, this effect was reverted by red/far-red treatment, indicating that phytochromes
are involved in shoot apical growth time (Howe et al., 1996). In accordance,
overexpression or downregulation of PHYA in Populus tremula x tremuloides, alters the
CDL, causing a delay or an advance of growth cessation, respectively (Olsen et al., 1997;
Kozarewa et al., 2010), positioning PHYA as growth inductor. Regarding PHYB2,
quantitative trait loci and single nucleotide polymorphism analyses have linked its natural
variation to timing of bud set, suggesting its possible role in growth cessation (Shin et
al., 2016).
4
1.2. Endogenous oscillator
Circadian clock is an autonomous molecular mechanism with a 24h cycle that control
the timing of gene expression, physiology and development. Existing in evolutionary
distinct organisms, the biological clock is essential to predict regular daily and seasonal
challenges. In plants, present in every cell, a transcriptional-translational feedback loop
network among the components guarantees its self-maintenance. The core oscillator
feedback loop comprises the morning-expressed transcription factors CIRCADIAN
CLOCK ASSOCIATED 1 and LATE ELONGATED HYPOCOTYL (LHY); and the evening-
expressed TIMING OF CAB EXPRESSION (TOC1) (Johansson et al., 2015).
The central circadian clock genes and its expression patterns, as well as, the cis
regulatory modules are greatly conserved among angiosperm species. Woody
perennials clock genes orthologues of Arabidopsis ones have been identified based on
sequence homology. Focus on poplar, most of these genes are duplicated, within two
copies of the MYB domain transcription factor LHY are found, named LHY1 and LHY2
(Johansson et al., 2015). Just like in Arabidopsis, both display an expression peak at
dawn, although LHY2 higher transcription level might reflect its major role in poplar clock
system (Takata et al., 2009). Downregulation of LHY1/2 triggers a shortening of clock-
controlled gene (termed outputs) expression rhythms. Even more, in these poplars
growth cessation and bud set is drastically delayed under SD conditions (Figure 3),
pointing the importance of circadian clock in photoperiodic time measurement. Whether
alteration of the circadian timing, LHY expression levels or both is responsible of growth
cessation time variation still under research (Ibáñez et al., 2010; Triozzi et al., 2018).
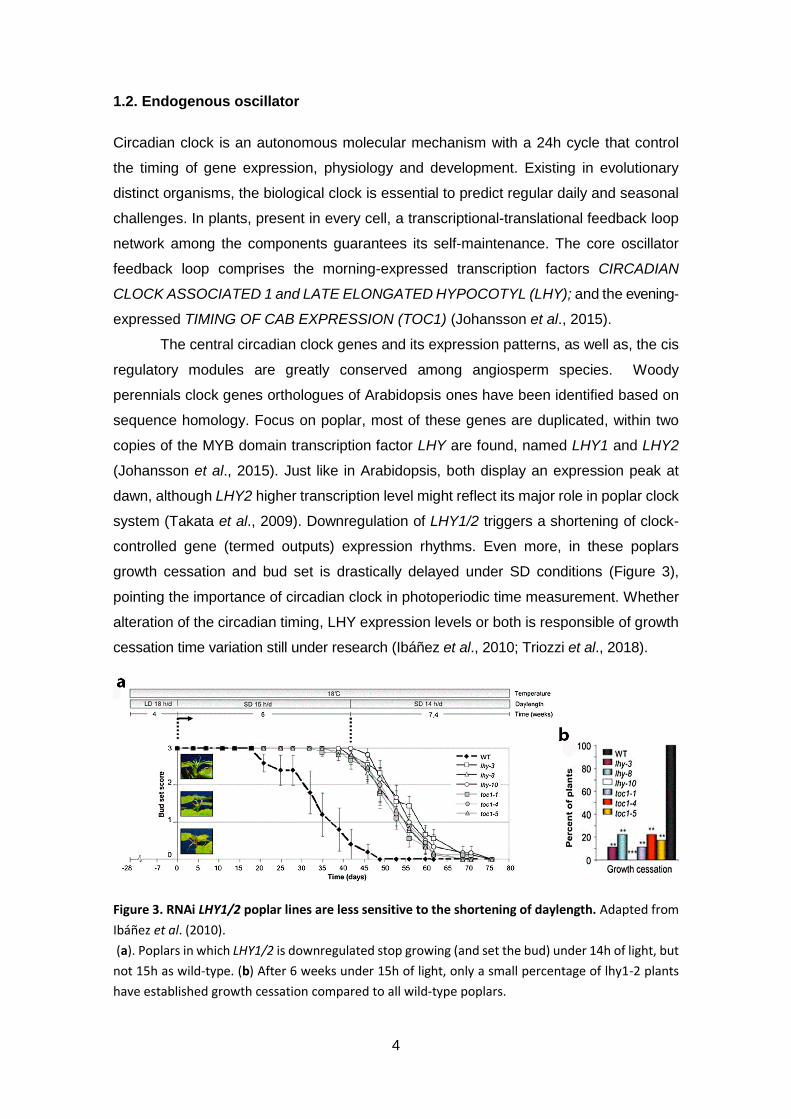
Figure 3. RNAi LHY1/2 poplar lines are less sensitive to the shortening of daylength. Adapted from
Ibáñez et al. (2010).
(a). Poplars in which LHY1/2 is downregulated stop growing (and set the bud) under 14h of light, but
not 15h as wild-type. (b) After 6 weeks under 15h of light, only a small percentage of lhy1-2 plants
have established growth cessation compared to all wild-type poplars.

5
1.3. Mobile signal
Long days induce high expression levels of FLOWERING LOCUS T (FT) and flowering
in Arabidopsis. FT is considered as the main component of the “florigen”, it is synthesized
in the leaves but moves to the shoot apex to transmit the photoperiodic signal (Song et
al., 2015). The two poplar paralogs, FT1 and FT2, diverge in its spatio-temporal
expression pattern. FT1 is induced in response to chilling temperatures and is expressed
in dormant buds in late winter; while FT2 mainly appears in leaf tissues and is upregulated
during long days (LD; day light hours above the CDL) and warmer temperatures.
Consequently, FT1 seems to be responsible of floral induction whereas FT2 promotes
vegetative growth, suggesting a functional specialization process. This is supported by
population genomics data, in which FT1 and FT2 have been associated with time of bud
burst and bud set, respectively (Brunner et al., 2014). Regarding the growth cessation,
FT2 overexpression cause its delay, oppositely FT RNAi poplars advance it (Böhlenius
et al., 2006; Hsu et al., 2011). Also, recent results evidence its possible mobile role from
leaves to the shoot apical meristem mediated by seasonal opening/closing of the
plasmodesmata (Tylewicz et al., 2018). These studies confirm the conservation of FT2
as integrator of the photoperiodic information.
2. Photoperiodic control of FT2: CO/FT module
CONSTANS (CO) encodes for B-box/CCT domain containing transcription factor, that is
known as a positive regulator of FT in Arabidopsis (Valverde et al., 2004). As happens
with LHY, in poplar there are two CO orthologs (CO1 and CO2) that have been
functionally associated to flowering and growth-dormancy transitions.
Böhlenius et al. (2006) reported that in CO1/2 downregulation poplars FT1 levels
are reduced. Hence, they demonstrated that CO/FT regulon controls the natural variation
of CDL in Populus tremula populations across different latitudes of Europe. The higher
latitude (closer to the pole) the greater CDL, is regulated by CO2 oscillation time. In
northern latitudes its expression peaks later than in southern ones, so a less shortening
of daylength is enough for night-expression coincidence. At darkness CO2 protein is
degraded and then FT1 is not transcribed.
Conversely, a few years later FT2 was identified as the paralog involved in that
control (detailed in Hsu et al., 2011). What is more, further studies showed a different
CO2 diurnal expression pattern, peaking at dawn in several poplar species (Ramos-
Sánchez PhD thesis, 2017). As a result, poplar COs display an antiphase temporal
expression pattern respect to FT2, unexpected for a direct activation role. In addition,

6
unlike in Arabidopsis, overexpression of CO1 or CO2 doesn’t increase FT2 levels under
SD (Hsu et al., 2012). Collectively, it suggests that although CO2 contribute to the poplar
photoperiodic response, additional factors should have main functions in daylength
sensing (Maurya & Bhalerao, 2017; Triozzi et al., 2018).
3. Phytochrome-Interacting Factors
PHYTOCHROME-INTERACTING FACTORS (PIFs) are bHLH transcription factors that
bind to G-box elements (CACGTG); a weakly union to a G-box Coupling Element 3
(GCE3; CACATG) has also been observed, in vitro (Kim et al., 2016). They present high
sequence homology and partly redundant functions, although specific activities have
been characterized in many cases (Shor et al., 2017).
In Arabidopsis thaliana, PIFs are known to physically interact with the Pfr
conformer of the phytochromes. Specifically, PHY-PIF binding has been described for
all the members with AtPHYB and for AtPIF1 and 3 in the case of AtPYHA (Leivar &
Quail, 2011). Then, they are proposed to be the direct mediators between phytochromes
and its target genes. The PHY-PIF interaction induces the phosphorylation,
ubiquitination and subsequently degradation of PIFs via the proteasome system, even
though the molecules implicated are still unclear. Recently, it has been reported the possible
role of a photoregulatory protein kinases family, capable of interact with AtPHYB and
AtPIF3 in a light promoted manner (Ni et al., 2017). Also, it is known that the degradation
occurs rapidly and is highly sensitive to the levels of Pfr. Consequently, PIFs levels are
reduced during the day (not complete removal), increasing again at darkness (Leivar &
Quail, 2011). Beyond the photoperiodic detection, PIFs acts as central integrators of
multiple internal and environmental signals e.g. temperature or hormones (Leivar &
Monte 2014). This fact linked to the identification of AtPHYB as thermosensor in Arabidopsis
(Jung et al., 2016), assure the key role of this signalling pathway in plant development.
3.1. Connection with the circadian clock (LHY2)
It is known that light signal, along with temperature and sucrose content, is involved in
clock entrainment, i.e., setting the period, phase and amplitude of the oscillator. In this
regard, in Arabidopsis PIFs have been demonstrated to alter circadian function. They
modify core clock gene transcription patterns and therefore the clock outputs expression
(Shor et al., 2017). G-box motif is overrepresented at morning-expressed gene
promoters both in Arabidopsis and Populus genomes (Filichkin et al., 2011). Hence, PIF
binding to LHY promoter has been shown in vitro and in vivo in the annual plant
(Martínez-García et al., 2000; Shor et al., 2017). Furthermore, quadruple mutant

7
pif1pif3pif4pif5 cause a phase shift in LHY, not observed in single mutants, evidencing
its overlapping function. Thus, PIFs could function as bridge between photoperiodic
perception and circadian system (Shor et al., 2017).
3.2. DNA binding capacity
In Arabidopsis at least 40% of the known PIF binding sites lack G-boxes, in turn only a
small fraction of these elements binds PIFs. Because of that, other factors should direct
proper PIF binding. For AtPIF1 it has been described that it could be assisted by PIFs
interacting transcription factors that bind GCEs. These motifs are classified in three
groups based on its core sequence, GCE1 (ACGC), GCE2 (ACGT), being the G-box a
special form of this set, and the already mentioned GCE3 (CACATG; also named PIF
binding E-box). There are several transcription factor families where GCEs binding
capacity has been characterized. This study will focus on ELONGATED HYPOCOTYL 5
(HY5), member of bZIP family, and the transposase-derived transcription factor FAR-
RED ELONGATED HYPOCOTYL 3 (FHY3) (Kim et al., 2016).
In Arabidopsis HY5 in vivo binding sites are enriched in GCE2, indeed, genome-
wide sequence targets of HY5 and PIFs significantly overlap (Lee et al., 2007). Even
more, AtPIF1 and 3 coexist showing directly protein-protein interaction in darkness and
light. The C-terminal HLH and ZIP domains, respectively, mediate its dimerization (Chen
et al., 2013). HY5 was originally reported to act downstream of the phytochromes and
currently it is known to control a large number of transcription factors involved in hormone
pathways, light signalling or flowering time, as well as circadian genes like LHY. Moreover,
it is regulated in the dark by COP1/SPA (CONSTITUTIVE PHOTOMORPHOGENEIC 1/
SUPPRESSOR OF PHYA) complex leading to ubiquitination followed by degradation
(Gangappa & Botto, 2016). Despite this darkness mediated reduction, a small amount
has been detected bound to the chromatin at night-time (Chen et al., 2013).
Studies in Arabidopsis indicate that FHY3 binds to FBS (CACGCGC; called for
FHY3-FAR1 binding site) and, but only in vitro, to the GCE1 containing element,
CACGCGA (Kim et al., 2016). In addition, it has been shown the interaction of AtPIF1
and HY5 (Chen et al., 2013). FHY3 acts in the first steps of AtPHYA signalling as a
positive regulator and seems to integrate light cues into the circadian clock. Hence, in
fhy3 mutants LHY mRNA level is greatly reduce. However, although it is expected to play
multiple functions in plant growth and development, most of them haven’t yet been
proved (Li et al., 2011; Tang et al., 2012).
In poplar several homologs have been identified in chromosomes 6, 10 and 18
for HY5; and in 6 and 16 for FHY3 (Tuskan et al., 2006).
8
4. Night hour counting mechanism model controlling poplar growth
cessation
All the results described in this section were reported in Ramos-Sánchez PhD thesis
(2017) and have been the initial point for this work.
4.1 LHY2, a night hour counter
The progressive delay of dawn (or night extension; NExt) quantitatively downregulates
FT2 (Figure 4a). Previous work in the laboratory evidenced that this FT2 repression is
not triggered by downregulation of its main activator CO2. In contrast it could be
explained by the increased expression of LHY2 in NExt (Figure 4b). Moreover, they
proved that LHY2 overexpression lines cause a drastic decrease of FT2 levels. Thus,
these results suggest that LHY2 may act as a night hour counter, which can transmit the
photoperiodic signal through transcriptional repression of FT2 in a quantitative manner.
Accordingly, as it was stated before, in LHY2 knockdown lines, in which the growth
inductor FT2 is less repressed by LHY2, the CDL is about 1h shorter than in wild-type
poplars (Figure 3, Ibáñez et al., 2010). Interestingly, while FT2 is downregulated in night
advance in a similar way as in NExt (Figure 4a), LHY2 doesn’t respond.
In addition, it has been observed that FT2 repression by LHY2 is mediated by the
HIPOXIA RESPONSIVE ERF poplar homolog (HRE_14). LHY2 activates HRE_14,
which in turn repress FT2 transcription.
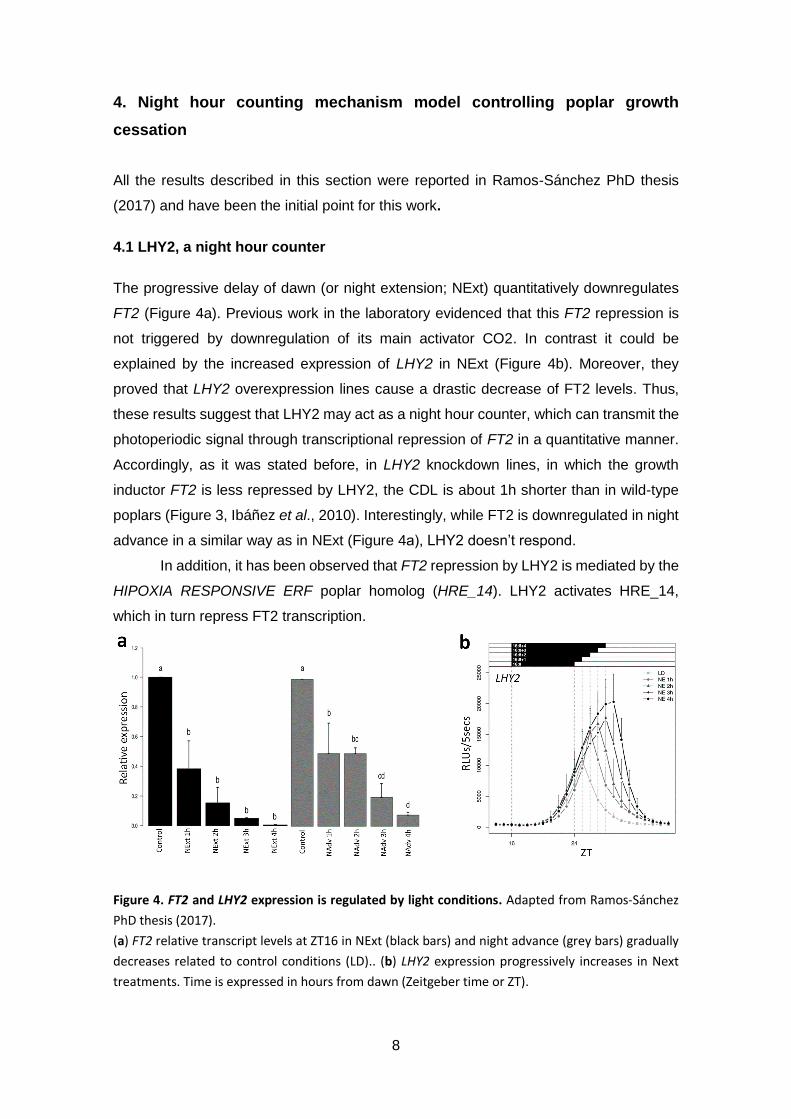
Figure 4. FT2 and LHY2 expression is regulated by light conditions. Adapted from Ramos-Sánchez
PhD thesis (2017).
(a) FT2 relative transcript levels at ZT16 in NExt (black bars) and night advance (grey bars) gradually
decreases related to control conditions (LD).. (b) LHY2 expression progressively increases in Next
treatments. Time is expressed in hours from dawn (Zeitgeber time or ZT).
9
4.2. LHY2 promoter dissection
5’UTR and promoter (until -1238bp) region of LHY2 contain cis-acting regulatory
elements associated with its circadian control, such as the Morning Element (ME;
conserved in circadian clock genes expressed earlier in the day). But besides that,
several light-related motifs have been identified in silico (Redondo-López degree thesis,
2017). Among them, there are two GCEs, a GCE2 and a GCE3, and one ATCT-motif
(Figure 5). Promoter deletions of the regions where these elements are comprised, have
allowed to hypothesise specific functions for each of them.
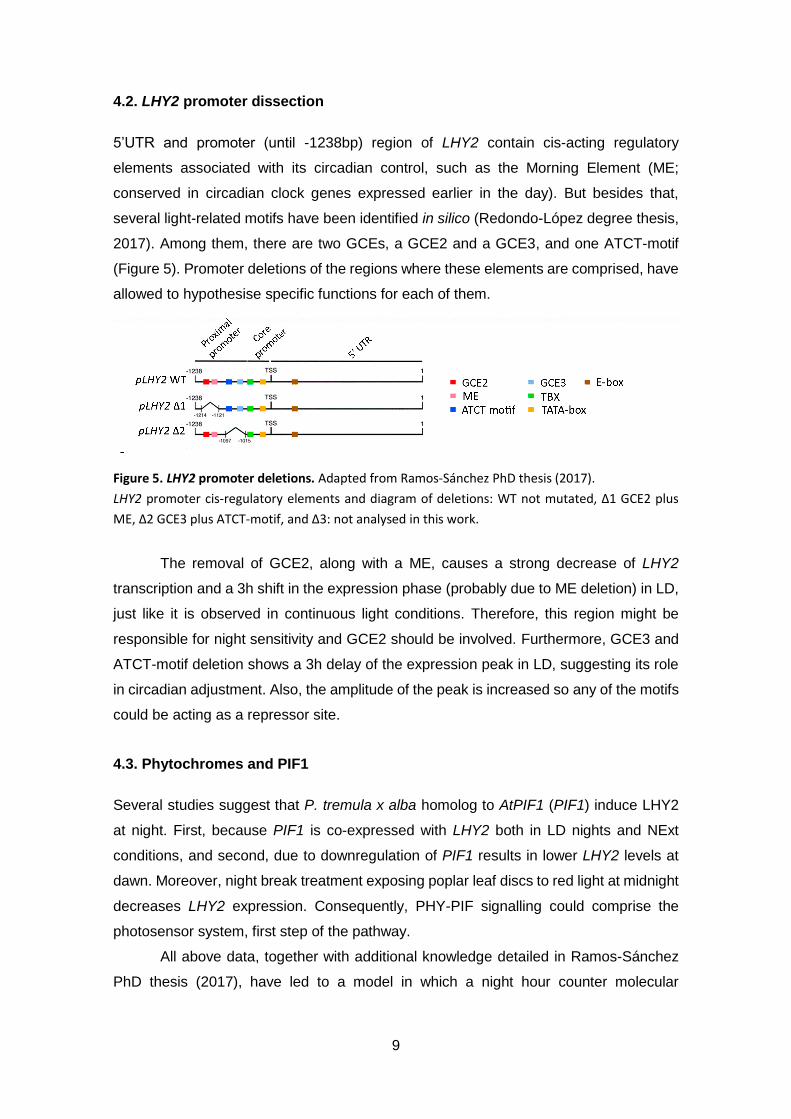
Figure 5. LHY2 promoter deletions. Adapted from Ramos-Sánchez PhD thesis (2017).
LHY2 promoter cis-regulatory elements and diagram of deletions: WT not mutated, Δ1 GCE2 plus
ME, Δ2 GCE3 plus ATCT-motif, and Δ3: not analysed in this work.
The removal of GCE2, along with a ME, causes a strong decrease of LHY2
transcription and a 3h shift in the expression phase (probably due to ME deletion) in LD,
just like it is observed in continuous light conditions. Therefore, this region might be
responsible for night sensitivity and GCE2 should be involved. Furthermore, GCE3 and
ATCT-motif deletion shows a 3h delay of the expression peak in LD, suggesting its role
in circadian adjustment. Also, the amplitude of the peak is increased so any of the motifs
could be acting as a repressor site.
4.3. Phytochromes and PIF1
Several studies suggest that P. tremula x alba homolog to AtPIF1 (PIF1) induce LHY2
at night. First, because PIF1 is co-expressed with LHY2 both in LD nights and NExt
conditions, and second, due to downregulation of PIF1 results in lower LHY2 levels at
dawn. Moreover, night break treatment exposing poplar leaf discs to red light at midnight
decreases LHY2 expression. Consequently, PHY-PIF signalling could comprise the
photosensor system, first step of the pathway.
All above data, together with additional knowledge detailed in Ramos-Sánchez
PhD thesis (2017), have led to a model in which a night hour counter molecular
10
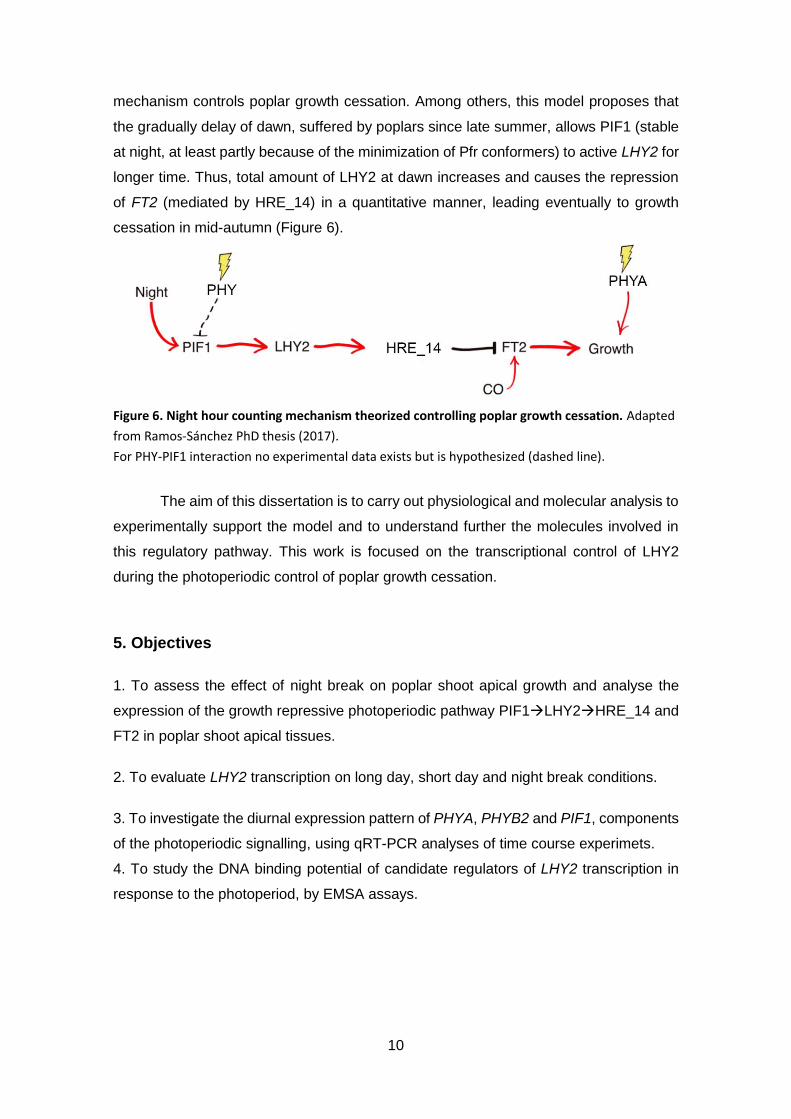
mechanism controls poplar growth cessation. Among others, this model proposes that
the gradually delay of dawn, suffered by poplars since late summer, allows PIF1 (stable
at night, at least partly because of the minimization of Pfr conformers) to active LHY2 for
longer time. Thus, total amount of LHY2 at dawn increases and causes the repression
of FT2 (mediated by HRE_14) in a quantitative manner, leading eventually to growth
cessation in mid-autumn (Figure 6).
Figure 6. Night hour counting mechanism theorized controlling poplar growth cessation. Adapted
from Ramos-Sánchez PhD thesis (2017).
For PHY-PIF1 interaction no experimental data exists but is hypothesized (dashed line).
The aim of this dissertation is to carry out physiological and molecular analysis to
experimentally support the model and to understand further the molecules involved in
this regulatory pathway. This work is focused on the transcriptional control of LHY2
during the photoperiodic control of poplar growth cessation.
5. Objectives
1. To assess the effect of night break on poplar shoot apical growth and analyse the
expression of the growth repressive photoperiodic pathway PIF1→LHY2→HRE_14 and
FT2 in poplar shoot apical tissues.
2. To evaluate LHY2 transcription on long day, short day and night break conditions.
3. To investigate the diurnal expression pattern of PHYA, PHYB2 and PIF1, components
of the photoperiodic signalling, using qRT-PCR analyses of time course experimets.
4. To study the DNA binding potential of candidate regulators of LHY2 transcription in
response to the photoperiod, by EMSA assays.

11
CHAPTER 2. Materials and methods
Plant materials and growth conditions
Hybrid poplar (Populus tremula x alba INRA clone 717 1B4) was used for all the
experiments described in this work.
For gene expression analysis, in vitro grown poplars under LD (16h/8h light/dark)
at 21oC were subjected to the pertinent photoperiod, and shoot apical tissue was
collected at different time points during 24h.
For luciferase experiments hybrid poplar carrying the clock transcriptional
reporter pLHY2::LUC (Ramos-Sánchez et al., 2017) were grown as stated above.
For phenological studies in vitro grown plants were transferred to pots containing
blond peat and grown in a growth chamber under LD (16h/8h light/dark), for 2 weeks
(controlled conditions: 21ºC, 65% relative humidity and 150µmol light intensity).
Subsequently, poplars were subjected to SD (12h/12h light/dark).
Night break assays were performed by a pulse of 1h red light illumination (660nm,
80µmol light intensity) at ZT21 into the night-time.
Plasmid constructs
Open reading frames (or fragments) of genes of interest were amplified from poplar
cDNA samples. PCR (Polymerase Chain Reaction) was performed using the primers
presented in Table 1 and Phusion DNA polymerase (Thermo Fisher). Next, PCR
products were purified and cloned employing Gateway technology. For that purpose,
pDONR207 and pMAL-p2 modified (Jurado et al., 2010) were used as entry and
destination vectors, respectively. After each recombination step, Escherichia coli DH5α
strain electrocompetent cells were transformed, and positive colonies were selected by
culture in LB (Luria-Bertani) agar plates supplemented with the appropriate antibiotic. All
clones were validated by sequencing. For PIF1DBD (PIF1 DNA binding domain), after
amplification, it was cloned into the pET-His vector using the NdeI- EcoRI sites.
12
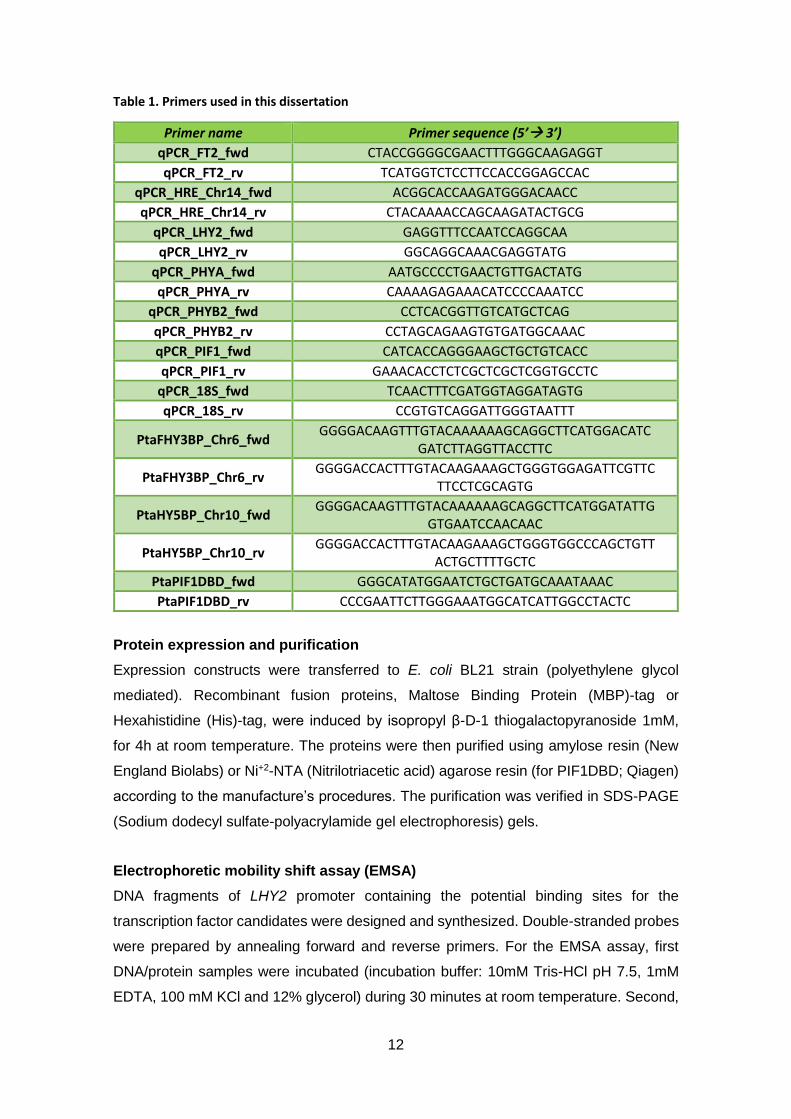
Table 1. Primers used in this dissertation
Primer name Primer sequence (5’→ 3’)
qPCR_FT2_fwd CTACCGGGGCGAACTTTGGGCAAGAGGT
qPCR_FT2_rv TCATGGTCTCCTTCCACCGGAGCCAC
qPCR_HRE_Chr14_fwd ACGGCACCAAGATGGGACAACC
qPCR_HRE_Chr14_rv CTACAAAACCAGCAAGATACTGCG
qPCR_LHY2_fwd GAGGTTTCCAATCCAGGCAA
qPCR_LHY2_rv GGCAGGCAAACGAGGTATG
qPCR_PHYA_fwd AATGCCCCTGAACTGTTGACTATG
qPCR_PHYA_rv CAAAAGAGAAACATCCCCAAATCC
qPCR_PHYB2_fwd CCTCACGGTTGTCATGCTCAG
qPCR_PHYB2_rv CCTAGCAGAAGTGTGATGGCAAAC
qPCR_PIF1_fwd CATCACCAGGGAAGCTGCTGTCACC
qPCR_PIF1_rv GAAACACCTCTCGCTCGCTCGGTGCCTC
qPCR_18S_fwd TCAACTTTCGATGGTAGGATAGTG
qPCR_18S_rv CCGTGTCAGGATTGGGTAATTT
PtaFHY3BP_Chr6_fwd GGGGACAAGTTTGTACAAAAAAGCAGGCTTCATGGACATC
GATCTTAGGTTACCTTC
PtaFHY3BP_Chr6_rv GGGGACCACTTTGTACAAGAAAGCTGGGTGGAGATTCGTTC
TTCCTCGCAGTG
PtaHY5BP_Chr10_fwd GGGGACAAGTTTGTACAAAAAAGCAGGCTTCATGGATATTG
GTGAATCCAACAAC
PtaHY5BP_Chr10_rv GGGGACCACTTTGTACAAGAAAGCTGGGTGGCCCAGCTGTT
ACTGCTTTTGCTC
PtaPIF1DBD_fwd GGGCATATGGAATCTGCTGATGCAAATAAAC
PtaPIF1DBD_rv CCCGAATTCTTGGGAAATGGCATCATTGGCCTACTC
Protein expression and purification
Expression constructs were transferred to E. coli BL21 strain (polyethylene glycol
mediated). Recombinant fusion proteins, Maltose Binding Protein (MBP)-tag or
Hexahistidine (His)-tag, were induced by isopropyl β-D-1 thiogalactopyranoside 1mM,
for 4h at room temperature. The proteins were then purified using amylose resin (New
England Biolabs) or Ni+2-NTA (Nitrilotriacetic acid) agarose resin (for PIF1DBD; Qiagen)
according to the manufacture’s procedures. The purification was verified in SDS-PAGE
(Sodium dodecyl sulfate-polyacrylamide gel electrophoresis) gels.
Electrophoretic mobility shift assay (EMSA)
DNA fragments of LHY2 promoter containing the potential binding sites for the
transcription factor candidates were designed and synthesized. Double-stranded probes
were prepared by annealing forward and reverse primers. For the EMSA assay, first
DNA/protein samples were incubated (incubation buffer: 10mM Tris-HCl pH 7.5, 1mM
EDTA, 100 mM KCl and 12% glycerol) during 30 minutes at room temperature. Second,

13
they were loaded onto a 6% polyacrylamide (37.5:1 Acrylamide: Bis-acrylamide, Sigma-
Aldrich) native gel and run 100V. Finally, The DNA in the gel was stained with GreenSafe
Premium (NZYTech) and visualized using a Molecular Imager Gel Doc XR System (Bio-
Rad).
Gene expression analyses
Shoot apical tissue samples (pools of at least 3 plants) were harvested, and total RNA
was extracted using NucleoSpin RNA Plant kit (Macherey). cDNA was synthesized as
described in Ibáñez et al. (2008). Quantitative PCR (qPCR) were done using gene
specific primers (Table 1) and FastStar Universal SYBR Green Master (ROX) (Roche)
with an Applied Biosystems 7300 Real-time PCR System (Applied Biosystems), following
the manufacturer’s instructions. For PIF1, it was carried out in a LightCycler 480 II
(Roche), using LightCycler 480 SYBR Green I Master (Roche). PCR reactions were
performed in triplicate for each sample and the expression levels were normalized to
housekeeping reference 18S rRNA.
Luciferase reporter assays
Leaf discs of pLHY2::LUC hybrid poplars were used to monitor luciferase activity under
the different light conditions (detailed in Ramos-Sanchez et al, 2017). It was registered
every 2h in night break experiments and 3h for monitoring entraining at different
photoperiod, using a TriStar2 LB 942 luminometer (Berthold Technologies).
Informatic tools
Conservation of LHY2 promoter motifs among species was analysed with Clustal Omega
(European Bioinformatic Institute) and visualized with CLC Sequence Viewer 8 (Qiagen).
Oligonucleotides design was assisted by bioinformatic tools; Primer3 for cloning,
and Realtime PCR Tool (Integrated DNA Technologies) for qPCR.
Statistical analyses were done with R software.
Accession Numbers
Sequence data from this work can be found in AspenDB database: FHY3_6
(Potri.006G020700), FT2 (Potri.010G179700), HY5_10 (Potri.010G004200), LHY2
(Potri.014G106800), PHYA (Potri.013G000300), PHYB2 (Potri.010G145900) and PIF1
(Potri.002G252800).

14
CHAPTER 3. Results
1. Night break prevents growth cessation in poplar
Previously, Ramos-Sánchez PhD thesis (2017) showed that transcriptional repression
of the growth promoter FT2 quantitatively correlates with the elongation of the night.
Moreover, night extension also provoked a quantitative activation of the growth repressor
LHY2. Even more, a conditional activation of LHY2 caused a repression of FT2
indicating they are functionally linked. Because of that, it has been proposed that night
length modulates the activation of LHY2 and the repression of FT2 through a new
photoperiodic signalling pathway. The theorized model also includes PIF1 and HRE_14
genes acting upstream and downstream of LHY2, respectively.
An open question is how this photoperiodic pathway and poplar growth
performance, response to night break. This assay is used to simulate LD response under
SD conditions, by illuminating the plant during the night by a light pulse. This treatment
disrupts the typical plant growth pattern triggered under SD. For instance, Arabidopsis
flowering is accelerated by night break treatment when plants are grown under SD which
is a flowering repressing condition. Therefore, firstly, it was assessed the effect of night
break by red light illumination (NB) on poplar shoot apical growth subjected to SD
conditions. To accomplish the experiment, two groups of twelve plants were grown under
SD of 12h/12h light/dark regime and SD+NB 12h/12h light/dark plus 1h of red light
illumination in the middle of the night (ZT21), using two identical growth chambers.
After 21 days, bud stage scores showed significant differences between
treatments. Leaf organogenesis ceased in plants grown under SD, however, poplars
subjected to SD+NB didn’t display any signs of growth cessation, pointing that hybrid
poplar response to night break keeping the normal rate of growth as it does in LD (Figure
7a). Conversely, no differences of height were observed (Figure 7b), this indicates that
leaf organogenesis ceases earlier than stem height elongation. Accordingly, in previous
studies at least 4 weeks of SD were needed to a complete stopping of stem elongation
(Ruttink et al., 2007).

15
Figure 7. Night break prevents growth cessation in poplar
(a) Bud stage scores of poplar shoot apex after 21 days of SD (left) and SD+NB (right). SD was created
by 12h/12h light/dark cycles; in SD+NB plants were illumination with red light during 1h at ZT21.
Upper panels show a representative top view picture showing the bud stage of the plants in SD (left
panel) and SD+NB (right panel), black arrows indicate leaves consider for counting bud score. Bottom
bar plot shows the mean bud scores ± standard deviation is plotted (n=12). Left picture shows
representative bud stages counted by number of leaf primordia, being 3=vegetative growth to 0=bud
formed. Significant differences were analysed by t-test. ***P <0.001. (b) Height scores of plants
grown under SD and SD+NB. The line plot shows the mean shoot height increases ± standard
deviation along the treatments. (c to f) Bar plot showing the relative transcript abundance of LHY2
at ZT23 (c), FT2 at ZT16 (d), PIF1 at ZT23 (e) and HRE_14 at ZT23 (f) in shoot apical tissue samples
collected after each treatment. Bar height indicates mean ± SEM (n=2 biological replicates).
Statistical differences were assessed by t-test. *P <0.05.
Subsequently, shoot apical tissues (including shoot apical meristem and leaf
primordia) were harvested to study the effect of SD and SD+NB conditions on the genes
involved in the new photoperiodic signalling pathway proposed by Ramos-Sanchez PhD
thesis (2017). Samples were collected at ZT16 and ZT23, times of maximal daily
expression of FT2 and LHY2. qRT-PCR analysis showed that LHY2 was downregulated

16
by half comparing SD+NB respect to SD (Figure 7c), whereas FT2 increased more than
eight times (Figure 7d). In addition, PIF1 and HRE_14, components that interact with
LHY2 in the model hypothesized (PIF1 promotes LHY2, which protein in turn upregulates
HRE_14; Figure 6) were also reduced at ZT23. (Figure 7e and 7f).
Collectively, these analyses indicate that the photoperiodic repression of FT2
triggered by SD is released under SD+NB causing continues shoot growth like in LD.
Moreover, the expression of the genes LHY2, PIF1 and HRE_14 were downregulated
by SD+NB respect to SD supporting their role as photoperiodic growth repressor
pathway controlling poplar shoot growth in response to photoperiod.
2. Red light illumination ceases night perception of LHY2
The observed LHY2 downregulation under SD+NB treatment could be produced by
transcriptional repression of the gene or by an increased rate of mRNA degradation.
Thus, luciferase transcriptional reporter assays were carried out to investigate the effect
of red light illumination on LHY2 transcriptional control.
Leaf discs of a stable transgenic hybrid poplar containing LHY2 promoter fused
to the luciferase reporter gene (pLHY2::LUC) were subjected to SD and subsequently
transferred to SD+NB. As shown in Figure 8a, red light inhibited LHY2 activation at the
end of the night, decreasing the promoter activity rapidly. Remarkably, the first day under
SD+NB conditions, LHY2 transcription could be restored, displaying its characteristic
peak at dawn, however during the second day the expression levels dropped and didn’t
rise again. In fact, the area below the curve, a good estimator of the total transcript
amount produced, was significantly reduced in SD+NBday2 related to SD (Figure 8b).
This mirrored the reduction of area observed in the pLHY2::LUC expression between SD
(12h/12h light/dark) and LD (16h/8h light/dark) suggesting that night break reset LHY2
transcription to the levels of LD (Figure 8c and d). Moreover, these results also indicate
that red light illumination may alter the stability of LHY2 transcriptional regulators, either
disrupting activators or stabilizing repressors, or both.

17
Figure 8. LHY2 promoter activity is reduced by night break, in a similar manner to LD.
(a) pLHY2::LUC activity detected by luminescence every two hours under SD (day 1) and SD+NB (days
2 and 3). 12h/12h light/dark cycles were set for SD, while in SD+NB 1h of red light illumination was
done at ZT21 indicated by red arrows. (c) pLHY2::LUC activity detected by luminescence every three
hours after SD (12h/12h light/dark) and LD (16h/8h light/dark). (b and d) Total luciferase activity
measured by the integration of the area below each peak of a (b) and c (d). Values represent mean
± standard deviation, n=10 (a-d). Statistical differences were assessed by Tukey’s test; P <0.05 (b)
and by t-test; ***P <0.001 (d). White values at bar base indicate the fold change respect to SD. ZT
means zeitgeber time.
3. Diurnal expression of phytochromes signalling genes
As it was mentioned in the introduction, red light illumination activates phytochromes
photoreceptors and downstream signalling, thus the inhibition of LHY2 expression by
night breaks of red light illumination could be mediated by the activation of the
phytochrome signalling pathway. Therefore, in order to investigate whether
phytochromes and phytochrome-associated genes are expressed during the night
period, the diurnal expression pattern of three components already associated with
growth cessation; PHYA, PHYB2 and PIF1 were studied at two different photoperiod SD
(8h/16h light/dark) and LD (16h/8h light/dark). qRT-PCR analyses of time course

18
samples revealed that PHYA and PHYB2 mRNA were expressed evenly along the day
under LD conditions (Figure 9a and 9b). However, under SD, PHYA expression was
induced during the night period showing higher mRNA levels than PHYB2, suggesting a
higher PHYA/PHYB2 ratio. PIF1 was expressed evenly irrespective the photoperiod,
although in SD it increases subtly at night-time (Figure 9c).
Figure 9. PHYB2, PHYA and PIF1 diurnal expression patterns.
(a to c) mRNA expression levels of poplar leaves, obtained by qRT-PCR under LD and SD conditions;
PHYA (a), PHYB2 (b) and PIF1 (c). LD and SD were set by 16h/8h and 8h/16h light/dark cycles,
respectively. Spots plotted represent mean ± standard deviation of three technical replicates. ZT
means zeitgeber time.
4. PIF1 does not bind LHY2 cis-regulatory elements
The transcriptional downregulation of LHY2 observed under night break of red light
illumination might be caused by an impairment of its transcriptional activators
participating in the phytochromes signalling pathway. PIF1 is a good candidate to
accomplish direct LHY2 activation due to 3 evidences: 1) Downregulation of PIF1
resulted in lower LHY2 levels (Ramos-Sánchez PhD thesis, 2017), 2) SD+NB treatment
induced PIF1 and LHY2 downregulation (this work) and 3) Promoter of LHY2 contains a
region required for photoperiodic transcriptional activation that carries potential PIF1
sites (Redondo-López degree thesis, 2017). Therefore, PIF1 could bind LHY2 promoter.
To test this hypothesis, the electrophoretic mobility shift assay (EMSA) technique was
standardized in the laboratory.
Before that, the presence of light response DNA elements G-boxes and GCEs
were analysed into LHY2 promoter, but due to the high amount identified (Supplementary
Figure A) only the sequence from -1015 to -1238 upstream the start codon was selected
to further studies. This particular region was previously linked to photoperiodic
transcriptional regulation of LHY2 (Figure 5; Redondo-López degree thesis, 2017). Thus,
three DNA probes were designed to test PIF1 binding. Among them, probe 1 contains

19
GCE2 (at -1206) and GCE1 (at -1186, identified in this work) elements, while probe 3
contains a GCE3 element (at -1044). Probe 2 (without any GCE) was used as a negative
control (Figure 10a). Additionally, PIF1 DNA binding domain, only this region because of
the large size of the protein, was cloned as fusion to His-tag to create His-PIF1DBD
construct. This fusion protein was expressed in E.coli and affinity purified.
The results of EMSA showed none electrophoretic mobility shift of the probes in
presence of purified His-PIF1DBD protein, indicating that PIF1 does not bind the GCEs
elements studied of LHY2 promoter in vitro (Figure 10b), nevertheless an indirect
regulation of LHY2 transcription by PIF1 may be possible.
Figure 10. PIF1DBD doesn’t bind to the promoter region identified as essential for LHY2
photoperiodic control.
(a) Diagram of DNA probes used for EMSA assay. GCEs elements are coloured in red. (b) Picture
showing the His-PIF1DBD EMSA. Black numbers correspond to probes used. This assay was repeated twice.
5. HY5_10 binds to LHY2 promoter in vitro
To identify additional transcription factors acting on the phytochrome mediated regulation
of LHY2 transcription, previous RNA-seq data generated in the laboratory were revisited.
These transcriptional profiling’s were performed during the night-time of poplars grown
in LD and LD+4h of darkness (NExt) conditions with the purpose to identify genes
showing a similar or opposite expression than LHY2 (Ramos-Sanchez PhD thesis 2017).
20
In addition to phytochrome signalling gene PIF1, two new potential candidates, HY5 of
chromosome 10 (HY5_10) and FHY3 of chromosome 6 (FHY3_6) were identified, which
have been shown to participate in PIF1 transcriptional complex in Arabidopsis (Chen et al.,
2013).
Following, it was proposed to check the binding of HY5_10 and FHY3_6 to LHY2
promoter by EMSAs. Thus, HY5_10 coding sequence was cloned as fusion to maltose
binding domain to create MBP-HY5_10 construct. This fusion protein was expressed in
E. coli and affinity purified. Binding of MBP-HY5_10 pure protein to probes 1, 2 and 3
was assayed by EMSA.
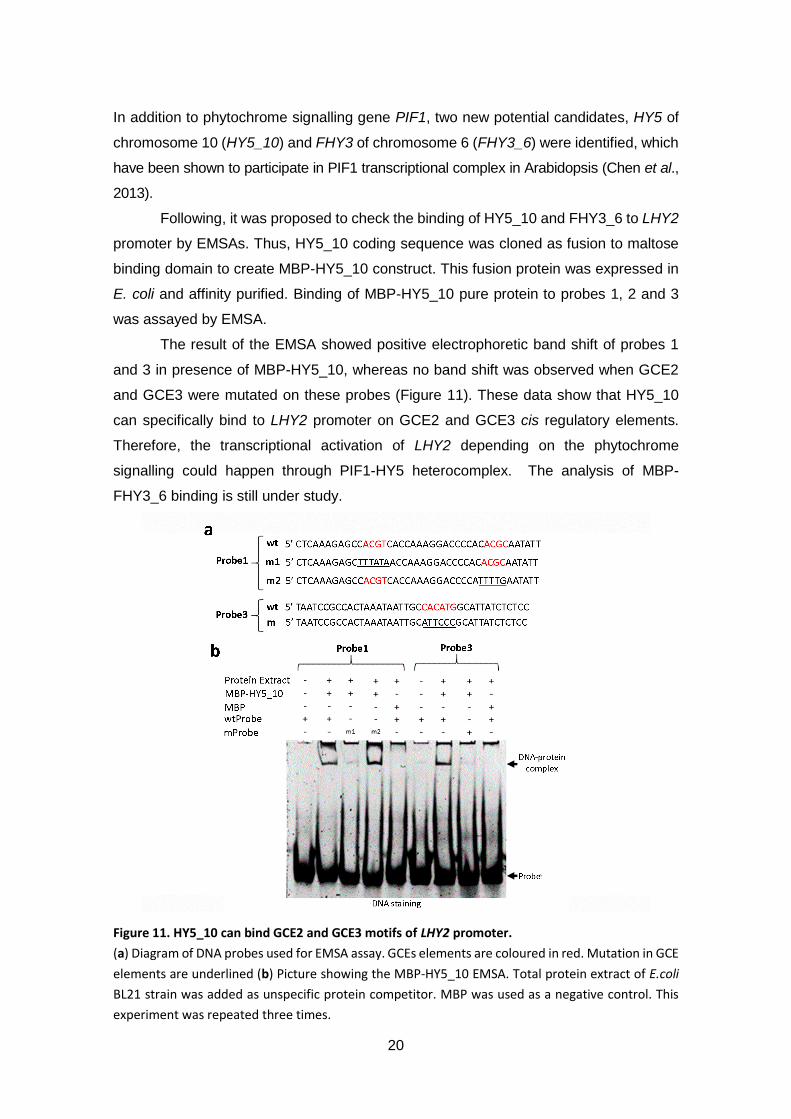
The result of the EMSA showed positive electrophoretic band shift of probes 1
and 3 in presence of MBP-HY5_10, whereas no band shift was observed when GCE2
and GCE3 were mutated on these probes (Figure 11). These data show that HY5_10
can specifically bind to LHY2 promoter on GCE2 and GCE3 cis regulatory elements.
Therefore, the transcriptional activation of LHY2 depending on the phytochrome
signalling could happen through PIF1-HY5 heterocomplex. The analysis of MBP-
FHY3_6 binding is still under study.
Figure 11. HY5_10 can bind GCE2 and GCE3 motifs of LHY2 promoter.
(a) Diagram of DNA probes used for EMSA assay. GCEs elements are coloured in red. Mutation in GCE
elements are underlined (b) Picture showing the MBP-HY5_10 EMSA. Total protein extract of E.coli
BL21 strain was added as unspecific protein competitor. MBP was used as a negative control. This
experiment was repeated three times.

21
CHAPTER 4. Discussion and conclusions
1. Night break disrupts SD growth pattern
Poplars response to short days promoting growth cessation and bud set. These are the
initial developmental events of a set of physical and physiological transformation that
leads to winter dormancy establishment. This photoperiodic response depends on
FLOWERING LOCUS T levels. Thus, LD promotes high levels of FT2 and shoot apical
growth and conversely, SD induces repression of FT2 and growth cessation (Hsu et al.,
2011). Therefore, SD should activate a photoperiodic repressive pathway to control
FT2 transcription. Previous laboratory work identified a new genetic route that leads to
repression of FT2 via night length dependent activation of growth repressors. The route
is composed by a cascade of PIF1→LHY2→HRE_14 transcription factors.
Night break assay supports the function of this photoperiodic repressive pathway
in the control of FT2 and growth cessation. It demonstrates that the night period is
required to transmit a growth-repressing signal, since an interruption of the night by red
light illumination supressed growth cessation. Moreover, the gene expression analysis
of SD versus SD+NB confirms that lower levels of PIF1→LHY2→HRE_14 correlates
with high expression levels of FT2 and shoot apical growth. Overexpressing lines of
PIF1, LHY2 and HRE_14 may help to confirm that constitutive expression of these
factors will cause growth cessation even at LD conditions.
In addition, night break has revealed differential sensitivity of leaf
organogenesis and shoot elongation to SD signalling. Earlier works considered that
repression of FT2 triggers photoperiodic growth cessation including the simultaneous
stopping of both responses. However, after 21 days of SD, leaf organogenesis ceased,
while height elongation not, evidencing that the first one is more sensitivity. This
suggests that the molecular pathway that controls these two processes downstream of
FT2, which is repressed after 1 week of SD, may reach a bifurcation point. Very likely
FT2 downregulation only impacts on leaf organogenesis while the photoperiodic control
of shoot elongation may involve a different pathway independent of FT2.
Understanding this photoperiodic growth response would be interesting due to its
implications for aerial biomass production, but it needs future studies.
2. LHY2 transcription responses to red light
LHY2 plays a central role sensing the night length and integrating this information at
transcriptional level. The longest is the night the highest LHY2 activation. Thus, it has
22
been proposed that LHY2 acts as a night hour counter sensing the length of the night
and triggering repression of FT2 and growth cessation whenever the plants recognize
SD. In accordance, LHY2 transcription is sensitive to red light illumination during the
night period, and after two days of SD+NB, it shows a diurnal pattern analogous to the
observed under LD conditions. The evolution of the pLHY2::LUC expression pattern
suggests that red light pulse could simulates the dawn and poplars are not able to
sense the two night hours remaining, behaving as in a LD of 15/9 light/dark, in
agreement with the maintenance of vegetative growth under SD+NB discussed above.
3. Phytochrome signalling and LHY2 transcriptional regulation
LHY2 transcription is unquestionably inhibited by red light and thus, components of the
phytochrome signalling pathway must be acting upstream to modulate its expression.
PHYA and PHYB2 have been earlier implicated in growth cessation response
(Kozarewa et al., 2010; Shin et al., 2016), moreover, PIF1 have been identified as a
positive regulator of LHY2 (Ramos-Sanchez PhD thesis 2017).
The expression of PHYA, higher than PHYB2 during the night period of SD,
suggests a possible high PHYA/PHYB2 ratio. Furthermore, in Arabidopsis it is known
that Pfr (active) conformer of AtPHYA is high at darkness, while AtPHYB one is low.
Interestingly the opposite ratio appears when plants are growth under sunlight (Franklin
& Whitelam, 2005). Therefore, a low PHYA/PHYB2 ratio could be important to repress
LHY2 expression during the day. This hypothesis agrees with the results obtained in
night break experiments, in which red light illumination activates PHYB2 and this could
lower PHYA/PHYB2 ratio, simulating a situation of sunlight and causing repression of
LHY2.
Regarding PIF1, in Arabidopsis, PIF factors are stable during the night when
AtPHYB is inactive, indeed, it has been proved that Pfr structure of AtPHYB triggers
PIFs degradation (Leivar & Quail, 2011). Accordingly, in this work, SD+NB reduced
levels of PIF1, and the diurnal expression pattern displayed a slightly activation during
the night period. Therefore, these results support PIF1 within this signalling.
4. PIF1 binding to LHY2 promoter needs an additional LHY2 binding factor
EMSA for PIF1 showed no binding of PIF1DBD to the DNA sequences required for
LHY2 upregulation at night. This negative result should be further tested using the full-
length protein sequence due to additional residues might influence the correct
conformation and functionality. However, there are several examples of isolated DNA
binding domain retaining a structured folding and then full binding capacity in vitro
23
(Perales et al., 2016). Thus, PIF1 DNA binding to LHY2 promoter may require
additional factors.
In EMSA assays, HY5_10, a potential PIF1 interactor (Chen et al., 2013),
specifically bound to LHY2 GCE2 and GCE3 motifs, suggesting its likely role as LHY2
transcriptional regulator in response to the photoperiod. Furthermore, it was verified the
conservation of GCE2 and GCE3 along trees of the Salicaceae family (Supplementary
Figure B), supporting the importance of these sites in the control of LHY2 expression.
Consequently, different scenarios should be considered now about PIF1 / HY5_10
mode of action:
1) Cooperative loop model
The first possibility is that HY5_10 acts as a mediator stabilizing the PIF1 binding to
LHY2 in vivo. Kim et al. (2016) hypothesized AtPIF1 specifically binds to G-boxes only
in the presence of a PIF1 interacting factor, simultaneously coupled to a nearby GCE.
They experimentally proved this hypothesis in Arabidopsis, since the separation
provoked by T-DNA insertion between GCE and G-box elements on a set of promoters
disrupted the in vivo targeting of AtPIF1. Consistent with this idea, a PIF1 binding
element (G-box) is present outside but near to the promoter region of LHY2 analysed in
this work (Supplementary Figure A). Therefore, PIF1 could be recruited to LHY2 in this
site and a DNA loop would enable PIF1-HY5_10 interaction, enhancing LHY2
transcription as a consequence. This model would explain the downregulation of LHY2
observed when GCE2 removal (Redondo-López degree thesis, 2017), due to this
deletion abolishes PIF1 targeting, being this factor responsible of transmit the sense of
night to LHY2. To validate this model, firstly, the interaction of PIF1 to G-box element of
LHY2 promoter should be tested by EMSA.
2) Homo/heterodimer ratio model
The second possibility is that both PIF1 and HY5_10 control LHY2 activation and
repression by competing for GCE2 element required for activation of LHY2.
Earlier reports in Arabidopsis indicate that PIFs and HY5 show antagonistic
effects on promoters of target genes (Chen et al., 2013). As stated in the introduction,
PIFs are stable during the night, whereas HY5 is degraded by COP1/SPA complex.
This scenario is reversed by light illumination which increases the activity of
phytochromes. Noteworthy, Lee et al. (2007) reported the existence of HY5 bound its
promoter target at night. This indicates that HY5 is actively degraded when it’s free, but
it escapes from degradation when it is bound to DNA. Considering also that PIF1
physically interact with HY5 (Chen et al., 2013); it could be envisaged a scenario
whether the ratio of PIF1/HY5 heterodimer bound to LHY2 GCE2 element could be
24
dynamically modulated by dark/light transitions. Thus, during the night, higher ratio
PIF1/HY5_10 homodimer binding LHY2 may promote activation. Conversely, during the
day, PIF1 is degraded, HY5 is stabilized forming homodimers which could lead to LHY2
repression. Supporting this idea, the binding of HY5_10 to GCE3, which is a repressor
site (Redondo-López degree thesis, 2017), has been observed suggesting that
HY5_could play a repressor role. Future work should address PIF1-HY5_10 physical
and functional interaction, and the binding of PIF1/HY5_10 heterodimers over GCE2
need to be tested. Thus, the ratio of PIF1/HY5_10 heterodimer would create a LHY2
transcriptional output.
Summarizing, the two scenarios exposed try to explain the activator role of PIF1,
but, until now, only experimental data of HY5_10 direct binding have been checked, so
alternative models can’t be ruled out yet. In addition, other transcription factors are
expected to be involved, FHY3 will be the next to test due to its relationship with both,
PIFs and HY5 in Arabidopsis. What is clear is that overall these results point to the
phytochrome signalling pathway as responsible for the photoperiodic transcriptional
control of LHY2.
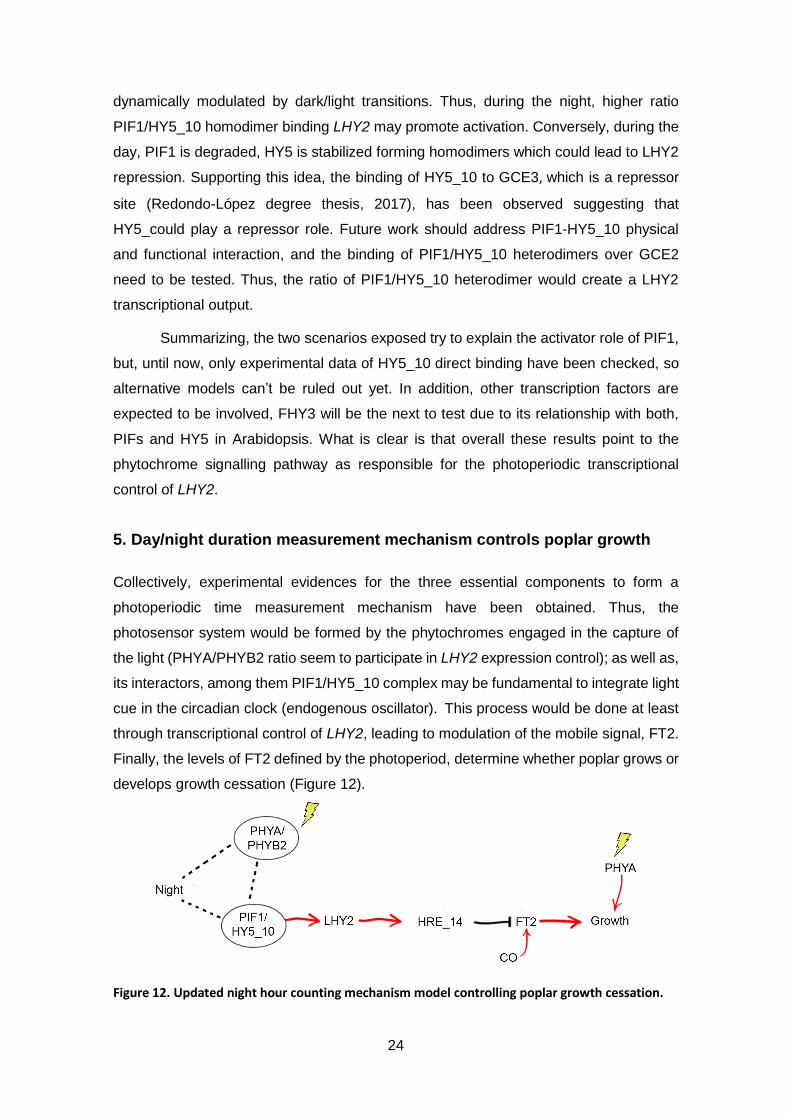
5. Day/night duration measurement mechanism controls poplar growth
Collectively, experimental evidences for the three essential components to form a
photoperiodic time measurement mechanism have been obtained. Thus, the
photosensor system would be formed by the phytochromes engaged in the capture of
the light (PHYA/PHYB2 ratio seem to participate in LHY2 expression control); as well as,
its interactors, among them PIF1/HY5_10 complex may be fundamental to integrate light
cue in the circadian clock (endogenous oscillator). This process would be done at least
through transcriptional control of LHY2, leading to modulation of the mobile signal, FT2.
Finally, the levels of FT2 defined by the photoperiod, determine whether poplar grows or
develops growth cessation (Figure 12).
Figure 12. Updated night hour counting mechanism model controlling poplar growth cessation.

25
The time of poplar dormancy entrance is vital because of, a delay compromises
winter survival, but early entrance reduces its growth activity and then its
competitiveness, leading again to harm its survival. Therefore, a fine tuning of growth
cessation time is essential. The exposed pathway is not the only expected to control
shoot apical growth, the CO/FT2 module, different hormones or PHYA itself have
evidenced to be involved. Moreover, the role of blue light, temperature, as well as
factors not even yet considered, need to be studied to envisage the network controlling
growth-dormancy transition. Understanding the molecular basis of this process, could
promote the implementation of biotechnological strategies focused on design trees
more capable of adapting to new environmental conditions and therefore with higher
yield.

26
6. Conclusions
1) Night break using red light illumination disrupts SD induced growth cessation in
hybrid poplars and correlates with an activation of FT2 and a downregulation of PIF1,
LHY2 and HRE_14.
2) Night breaks disrupt SD induced transcriptional activation of LHY2, switching from
SD to LD pattern, corroborating that photoperiodic regulation of LHY2 is mainly
transcriptional.
3) Genes of the phytochrome signalling related to growth cessation are expressed
during the night period, showing higher PHYA/PHYB2 ratio particularly in SD.
4) PIF1 does not bind LHY2 cis-regulatory elements in the studied promoter region,
therefore, PIF1 activation of LHY2 may require additional transcription factors.
5) PIF1 interacting factor HY5_10 specifically binds to GCE2 and GCE3 cis elements
located into the critical photoperiodic response region of LHY2 promoter, suggesting
PIF1/HY5_10 ratio may drive activation and/or repression of LHY2.

27
CHAPTER 5. References
Böhlenius H., Huang T., Charbonnel-Campaa L., Brunner A. M., Jansson S., Strauss S. H.
& Nilsson O. (2006). CO/FT regulatory module controls timing of flowering and seasonal
growth cessation in trees. Science, 312(5776), 1040-1043.
Brunner A. M., Evans L. M., Hsu C. Y. & Sheng X. (2014). Vernalization and the chilling
requirement to exit bud dormancy: shared or separate regulation? Frontiers in plant
science, 5, 732.
Chen D., Xu G., Tang W., Jing Y., Ji Q., Fei Z. & Lin, R. (2013). Antagonistic basic helix-loop-
helix/bZIP transcription factors form transcriptional modules that integrate light and reactive
oxygen species signaling in Arabidopsis. The Plant Cell, 25(5), 1657-1673.
Ding J. & Nilsson O. (2016). Molecular regulation of phenology in trees—because the seasons
they are a-changin’. Current opinion in plant biology, 29, 73-79.
Filichkin S. A., Breton G., Priest H. D., Dharmawardhana P., Jaiswal P., Fox S. E., ... &
Mockler T. C. (2011). Global profiling of rice and poplar transcriptomes highlights key
conserved circadian-controlled pathways and cis-regulatory modules. PloS one, 6(6),
e16907.
Franklin, K. A., & Whitelam, G. C. (2005). Phytochromes and shade-avoidance responses in
plants. Annals of botany, 96(2), 169-175.
Gangappa S. N. & Botto J. F. (2016). The multifaceted roles of HY5 in plant growth and
development. Molecular plant, 9(10), 1353-1365.
Hirsch S. & May M. (2012). The future we want for forests. FuturaGene.
Howe G. T., Gardner G., Hackett W. P. & Furnier G. R. (1996). Phytochrome control of short‐
day‐induced bud set in black cottonwood. Physiologia Plantarum, 97(1), 95-103.
Hsu C. Y., Adams J. P., Kim H., No K., Ma C., Strauss S. H., ... & Wickett N. (2011).
FLOWERING LOCUS T duplication coordinates reproductive and vegetative growth in
perennial poplar. Proceedings of the National Academy of Sciences, 108(26), 10756-10761.
Hsu C. Y., Adams J. P., No K., Liang H., Meilan R., Pechanova O., ... & Yuceer C. (2012).
Overexpression of CONSTANS homologs CO1 and CO2 fails to alter normal reproductive
onset and fall bud set in woody perennial poplar. PloS one, 7(9), e45448.
Ibáñez C., Kozarewa I., Johansson M., Ögren E., Rohde A. & Eriksson M. E. (2010). Circadian
clock components regulate entry and affect exit of seasonal dormancy as well as winter
hardiness in Populus trees. Plant physiology, 153(4), 1823-1833.
Ibañez C., Ramos A., Acebo P., Contreras A., Casado R., Allona I. & Aragoncillo, C. (2008).
Overall alteration of circadian clock gene expression in the chestnut cold response. PLoS
One, 3(10), e3567.
Johansson M., Ramos-Sánchez J. M., Conde D., Ibáñez C., Takata N., Allona I. & Eriksson
M. E. (2015). Role of the circadian clock in cold acclimation and winter dormancy in perennial
plants. In Advances in Plant Dormancy (pp. 51-74). Springer, Cham.
Jung J. H., Domijan M., Klose C., Biswas S., Ezer D., Gao M., ... & Kumar M. (2016).
Phytochromes function as thermosensors in Arabidopsis. Science, 354(6314), 886-889.

28
Jurado, S., Abraham, Z., Manzano, C., López-Torrejón, G., Pacios, L. F. & Del Pozo, J. C.
(2010). The Arabidopsis cell cycle F-box protein SKP2A binds to auxin. The Plant
Cell, 22(12), 3891-3904.
Kim J., Kang H., Park J., Kim W., Yoo J., Lee N., ... & Choi G. (2016). PIF1-interacting
transcription factors and their binding sequence elements determine the in vivo targeting sites
of PIF1. The Plant Cell, tpc-00125.
Kozarewa I., Ibáñez C., Johansson M., Ögren E., Mozley D., Nylander E., ... & Eriksson M.
E. (2010). Alteration of PHYA expression change circadian rhythms and timing of bud set in
Populus. Plant molecular biology, 73(1-2), 143-156.
Lee J., He K., Stolc V., Lee H., Figueroa P., Gao Y., ... & Deng X. W. (2007). Analysis of
transcription factor HY5 genomic binding sites revealed its hierarchical role in light regulation
of development. The Plant Cell, 19(3), 731-749.
Leivar P. & Monte E. (2014). PIFs: systems integrators in plant development. The Plant Cell,
26(1), 56-78.
Leivar P. & Quail, P. H. (2011). PIFs: pivotal components in a cellular signaling hub. Trends in
plant science, 16(1), 19-28.
Li G., Siddiqui H., Teng Y., Lin R., Wan X. Y., Li J., ... & Devlin P. F. (2011). Coordinated
transcriptional regulation underlying the circadian clock in Arabidopsis. Nature cell biology,
13(5), 616.
Martı́nez-Garcı́a J. F., Huq E. & Quail, P. H. (2000). Direct targeting of light signals to a promoter
element-bound transcription factor. Science, 288(5467), 859-863.
Maurya J. P. & Bhalerao R. P. (2017). Photoperiod-and temperature-mediated control of growth
cessation and dormancy in trees: a molecular perspective. Annals of botany, 120(3), 351-360.
Nelson R. J., Denlinger D. L. & Somers D. E. (Eds.). (2010). Photoperiodism: the biological
calendar. Oxford University Press.
Ni W., Xu S. L., González-Grandío E., Chalkley R. J., Huhmer A. F., Burlingame A. L., ... &
Quail P. H. (2017). PPKs mediate direct signal transfer from phytochrome photoreceptors to
transcription factor PIF3. Nature communications, 8, 15236.
Olsen J. E., Junttila O., Nilsen J., Eriksson M. E., Martinussen I., Olsson O., ... & Moritz T.
(1997). Ectopic expression of oat phytochrome A in hybrid aspen changes critical daylength
for growth and prevents cold acclimatization. The Plant Journal, 12(6), 1339-1350.
Perales M., Rodriguez K., Snipes S., Yadav R. K., Diaz-Mendoza M. & Reddy G. V. (2016).
Threshold-dependent transcriptional discrimination underlies stem cell
homeostasis. Proceedings of the National Academy of Sciences, 113(41), E6298-E6306.
Quail P. H. (2010). Phytochromes. Current Biology, 20(12), R504-R507.
Ramos-Sánchez J.M. (2017). Circadian and seasonal control of growth-dormancy cycles in tress
(PhD thesis). Universidad Politécnica de Madrid, Madrid, Spain.
Ramos-Sánchez, J. M., Triozzi, P. M., Moreno-Cortés, A., Conde, D., Perales, M. & Allona, I.
(2017). Real-time monitoring of PtaHMGB activity in poplar transactivation assays. Plant
methods, 13(1), 50.
Redondo-López A. (2017). Study of regulators of photoperiodic response in poplar. (degree
thesis). Universidad Politécnica de Madrid, Madrid, Spain.

29
Ruttink T., Arend M., Morreel K., Storme V., Rombauts S., Fromm J., ... & Rohde A. (2007).
A molecular timetable for apical bud formation and dormancy induction in poplar. The Plant
Cell, 19(8), 2370-2390.
Shin A. Y., Han Y. J., Baek A., Ahn T., Kim S. Y., Nguyen T. S., ... & Kim, J. I. (2016). Evidence
that phytochrome functions as a protein kinase in plant light signalling. Nature
communications, 7, 11545.
Shor E., Paik I., Kangisser S., Green R. & Huq, E. (2017). PHYTOCHROME INTERACTING
FACTORS mediate metabolic control of the circadian system in Arabidopsis. New Phytologist,
215(1), 217-228.
Singh R. K., Svystun T., AlDahmash B., Jönsson A. M. & Bhalerao R. P. (2016). Photoperiod‐
and temperature‐mediated control of phenology in trees–a molecular perspective. New
Phytologist, 213(2), 511-524.
Song Y. H., Shim J. S., Kinmonth-Schultz H. A. & Imaizumi T. (2015). Photoperiodic flowering:
time measurement mechanisms in leaves. Annual review of plant biology, 66, 441-464.
Takata N., Saito S., Tanaka Saito C., Nanjo T., Shinohara K. & Uemura M. (2009). Molecular
phylogeny and expression of poplar circadian clock genes, LHY1 and LHY2. New
phytologist, 181(4), 808-819.
Tang W., Wang W., Chen D., Ji Q., Jing Y., Wang H. & Lin R. (2012). Transposase-derived
proteins FHY3/FAR1 interact with PHYTOCHROME-INTERACTING FACTOR1 to regulate
chlorophyll biosynthesis by modulating HEMB1 during deetiolation in Arabidopsis. The Plant
Cell, 24(5), 1984-2000.
Triozzi P.M., Ramos-Sánchez J.M., Hernández T., Moreno-Cortés A., Allona I. & Perales M.
(2018) Photoperiodic regulation of shoot apical growth in poplar. Frontiers in plant science.
doi: 10.3389/fpls.2018.01030.
Tuskan G. A., Difazio S., Jansson S., Bohlmann J., Grigoriev I., Hellsten U., ... & Schein J.
(2006). The genome of black cottonwood, Populus trichocarpa (Torr. & Gray), science,
313(5793), 1596-1604.
Tylewicz S., Petterle A., Marttila S., Miskolczi P., Azeez A., Singh R. K., ... & Bowman J. L.
(2018). Photoperiodic control of seasonal growth is mediated by ABA acting on cell-cell
communication. Science, 360(6385), 212-215.
Valverde F., Mouradov A., Soppe W., Ravenscroft D., Samach A. & Coupland G. (2004).
Photoreceptor regulation of CONSTANS protein in photoperiodic
flowering. Science, 303(5660), 1003-1006.

30
APPENDIX
Supplementary figure A. G-box and GCEs found in LHY2 promoter sequence.
Motifs identified in both strands are highlighted. Numbering system starts in -888 (bases upstream
the start codon). Sequence can be found in AspenDB database under the accession number:
Potri.014G106800.
>LHY2 promoter (Populus tremula x alba INRA clone 717 1B4
-2888(5’) TTTTTTTATTTTCAATAGGGGATAAAATTATTTTTATTTACCTAATATTCAAACTATTATAATATTTTTTGTGTGTAAGA
ATAACATATCACAATCATCATTACTCTTCGTTGAATGTTTTGGCAAAATAAATTAAAAGATTTAGCCGTCTTTGGACGCT
-2728 AGCCATCTTTCAGAGGAGGCAATAAAATTGTTAGGCTGTTGGCTTTGGACTTCACCTTTCTAACACAAAAAAGTCTTCTT
CAGTTGTTGGCAACACAACATGAAGGCAGGAATGTTTGATCTACTGAGCTCAGTTGCGAGTTTGCGTTTTAATTGTTCCC
-2568
ATCAGTAGTTGTTGTAGCTAGGAACTCCTTTTTCTTTCTTCCTCTTGAATTACGCAAATACGTGATACAACAAATCTCGA
GATCTGTCATCGATGCATGTATTTTTATGGACTTAAAAAGACACCGCGAGCATGGTTTGATTAATTAATTTATCAATTAG
-2408
TGTTGGGTTTTAGCTTTCATGTATGCCAAATTGATATTTTCTTATTCATTCATCTTCACATCCTCGACTATCTACATCTA
TATTTTGGTTGGATCTGCAGAAGTTGGACAGAGCTACTAATCCAAAGATGGAGTGTGTCTAACTGGTTGGAAGATGCCTA
-2248
ATATATAGTGGTTCTGTCAAACTTAATACAAATGGTGCGATGAGATTTTCCATAGAAAGAGCAACTACAGGTGGGCTTCT
CAGGGACTGCACAAGATATTTCTCTTACAATATTGGTATTTGTTCAATTCCTAGAGCTGAATTATGAGGCATACTTATTG
-2068
GTTCACACCTCACATGGGAGAAAGACTTCAGGACTGTTATGGTGGATTCAGATTCTGCAGTGCAGTACTAAATCTCATTC
AAGGTACTCAAACCAGTAATAATTCTAATATCCAAATCATCAACTCTATCCAAGAACTCCTTACGCTACCATGACAGGTT
-1928
TAAATTCATTATGTTTATAGGGAGGCTAGTCTCTGTACGAATTGGATGGAAAATCATGCTTTCTCTCTTGAGTTAGGTAT
TCACTCTTTTGCTTCTTGCTTTTCTAGGTGTTTTATTGCTCTTCTGAAACACATGTATGGGACTGTGTTTCTTAAAATTA
-1768
TGTTCTTTGTAATTCTTTTATTTTAGGCTTTAAGCCATCCTTTCAATCCAAAAATAAAATCAAGAACAAAGAAAATTCAA
GTGGTTCATATTTTAAACTTTGCAGACTTGATCTTGTGCACAGAAAAGCAACTATCTCCCAATTGTTTTCGAAAAAAGAA
-1608
ACCCGAATTCATCTGTCTAGTTACACCATCGGCCCAGTTATTGGCCCAGCTCACAAAAGCAGGGCTGCCCTATTGCCTCC
ACCTTCTAGATTTTTTACCAAACACGCTACTTCCAGATTCACCAAGAAATAAGAAACGTTTAACGGGCAAGATGGTCACG
-1448
AACTTCCATCCCCTTGATCACACCGTCCATTACCAAACTACCCCATAGTCAAAGATAACGGCACTGGACGAACCTCACGA
GCATTCACTGGAGTAGAAAACGTGTGCACTTCTCCGCTTTTTCTTCATAAACCGCCACGTGGCGGTATTATTCTCCACGC
-1288
TGGCATAAAACTGTCCACTCTTTCCAGTTTACCCTTACGTACATAAACGCTACCGTATAGAACCGATCCTTCTCAAAGAG
CCACGTCACCAAAGGACCCCACACGCAATATTGGCTTTTACGGACTTAACCTTGAGAGCTAGGAGTTTGTGGTGGAGATT
-1128
TGAAGATGGAGTGAGGTGAGCCAAAATGGGGAAAAAGTGCAGGGGTGTGCTGTGCTTTAGTCTAATCCGCCACTAAATAA
TTGCCACATGGCATTATCTCTCCCATCTCTCCCTCATAGTTCAGCCTTCAACTTCAATAGCAGCCTCAAATAATAAGAAT
-968
TAATAAAAACAAAAATAAACCCACAAAAAATTATAGTGGCTGAGATTGTTCCTAGGTGTAGTTTCTGGTGTTAAAGGTCT(3’)
Supplementary figure B. Conservation of GCEs motifs studied in this work.
Multiple alignment of LHY2 promoter among P.tremula x alba (LHY2), P. trichocarpa (PtLHY2) and
Salix purpurea (SpLHY2). Cis-regulatory elements GCE2 at -1206 (bases upstream the start codon of
LHY2) (green), GCE1 at -1186 (blue) and GCE3 at -1044 (red) are highlighted.