ALICE DO CARMO PRECCI LOPES
116
ALICE DO CARMO PRECCI LOPES BIOGAS PRODUCTION POTENTIAL FROM KRAFT PULP MILL SLUDGE Dissertação apresentada à Universidade Federal de Viçosa, como parte das exigências do Programa de Pós- Graduação em Engenharia Civil, para obtenção do título de Magister Scientiae. VIÇOSA MINAS GERAIS – BRASIL 2017
Transcript of ALICE DO CARMO PRECCI LOPES

ALICE DO CARMO PRECCI LOPES
BIOGAS PRODUCTION POTENTIAL FROM KRAFT PULP MILL SLUDGE
Dissertação apresentada à Universidade Federal de Viçosa, como parte das exigências do Programa de Pós-Graduação em Engenharia Civil, para obtenção do título de Magister Scientiae.
VIÇOSA MINAS GERAIS – BRASIL
2017

Ficha catalográfica preparada pela Biblioteca Central da UniversidadeFederal de Viçosa - Câmpus Viçosa
T Lopes, Alice do Carmo Precci, 1991-L864b2017
Biogas production potential from kraft pulp mill sludge /Alice do Carmo Precci Lopes. – Viçosa, MG, 2017.
xi, 103f. : il. (algumas color.) ; 29 cm. Inclui anexos. Orientador: Cláudio Mudado Silva. Dissertação (mestrado) - Universidade Federal de Viçosa. Referências bibliográficas: f.56-65. 1. Biogás. 2. Lodo residual. 3. Indústria de Celulose.
I. Universidade Federal de Viçosa. Departamento de EngenhariaCivil. Programa de Pós-gradução em Engenharia Civil. II. Título.
CDD 22 ed. 665.776


ii
“I can’t change the direction of the wind, but I can adjust my sails to always reach
my destination”
Jimmy Dean

iii
AGRADECIMENTOS
Expresso imensa gratidão a todos que, de algum modo, me deram suporte nesta
jornada. Em especial ao meu orientador, professor Mudadu, por ter aberto preciosas
oportunidades e, principalmente, por ter ido além de sua atuação como docente,
compreendendo meus momentos de angústia e motivando-me sempre a ir adiante.
Ao professor André Rosa, pelos ensinamentos, pelas discussões e por me possibilitar
exercer um papel mais ativo na Universidade, ao poder participar de coorientação e
membro de banca de projeto final de curso. Ao professor Fábio Rodrigues, por ter não
somente me disponibilizado infraestrutura para que eu pudesse realizar as simulações,
como também por ter me guiado no uso do Aspen Plus®.
Aos professores Sérgio Aquino e Bruno Baêta, por terem me recebido abertamente no
Laboratório de Química Tecnológica e Ambiental (LQTA) da Universidade Federal
de Ouro Preto. Ter desenvolvido parte de minha pesquisa no LQTA foi uma bênção.
Agradeço em especial ao Diegão, grande mestre quem muito me ensinou nessa
caminhada, tanto academicamente quanto espiritualmente.
Aos meus amigos dos laboratórios LaSiP e LQTA que marcaram importante presença
nessa trajetória. Aos funcionários e amigos do Laboratório de Celulose e Papel, do
Laboratório de Painéis e Energia da Madeira e à Lilian do Laboratório de Análises
Bioquímicas da Universidade Federal de Viçosa. À casa Lero-Lero que me recebeu
de portas abertas em Ouro Preto.
Ao Departamento de Engenharia Civil, em especial à Cilene que sempre me apoiou e
motivou desde a graduação. Ao Phillip por ter feito as revisões de inglês. À CAPES
pela concessão da bolsa de estudos.
A minha família, pelo amor incondicional. E, parafraseando meu grande amigo de
mestrado, Everton, por todos esses momentos agradeço a Deus, colocando-me diante
de pessoas incríveis e de valiosas oportunidades quando tudo parecia sem saída.

iv
SUMÁRIO
ABREVIATURAS, SIGLAS E SÍMBOLOS .......................................................... vi
ABSTRACT ............................................................................................................. viii
RESUMO .................................................................................................................... x
GENERAL INTRODUCTION ................................................................................. 1
1 ENERGY PRODUCTION POTENTIAL FROM KRAFT PULP AND PAPER
MILL SLUDGES: A REVIEW FROM THE BRAZILIAN PERSPECTIVE ..... 3
Abstract .............................................................................................................................. 4
1.1 Introduction .......................................................................................................... 4
1.2 The kraft pulp mill ............................................................................................... 7
1.2.1 Energy demand .................................................................................................. 8
1.2.2 Energy generating systems ............................................................................... 10
1.3 The anaerobic digestion ..................................................................................... 11
1.3.1 Anaerobic digestion enhancement ................................................................... 14
1.4 Technical, economic and regulatory aspects of biogas ................................... 16
1.5 Final considerations ........................................................................................... 18
2 MESOPHILIC ANAEROBIC DIGESTION OF KRAFT PULP MILL
SLUDGES UNDER DIFFERENT SUBSTRATE TO INOCULUM RATIOS
AND INOCULUM TYPE........................................................................................ 20
Abstract ............................................................................................................................ 21
2.1 Introduction ........................................................................................................ 21
2.2 Material and methods ........................................................................................ 23
2.2.1 Material sampling ............................................................................................ 24
2.2.2 Material characterization .................................................................................. 25
2.2.3 Experimental design ......................................................................................... 25
2.2.4 Data analysis .................................................................................................... 27
2.2.5 Energy production potential ............................................................................. 28
2.3 Results and discussion ........................................................................................ 29
2.3.1 Material characteristics .................................................................................... 29
2.3.2 BMP Assays ..................................................................................................... 30

v
2.3.3 Potential energy production ............................................................................. 35
2.4 Conclusions ......................................................................................................... 36
3 BIOGAS PRODUCTION POTENTIAL FROM TERMOPHILIC
ANAEROBIC DIGESTION OF KRAFT PULP MILL SLUDGES ................... 37
Abstract ............................................................................................................................ 38
3.1 Introduction ........................................................................................................ 38
3.2 Material and methods ........................................................................................ 39
3.2.1 Material sampling ............................................................................................ 40
3.2.2 Material characterization .................................................................................. 40
3.2.3 BMP assays ...................................................................................................... 40
3.2.4 Model adjustments and calibration .................................................................. 42
3.2.5 Numerical simulations ..................................................................................... 43
3.3 Results and discussion ........................................................................................ 44
3.3.1 Material characteristics and BMP assays ......................................................... 44
3.3.2 Model calibration ............................................................................................. 48
3.3.3 Numerical simulations ..................................................................................... 49
3.4 Conclusions ......................................................................................................... 53
4 FINAL CONSIDERATIONS .............................................................................. 55
REFERENCES ......................................................................................................... 56
APPENDIX A – Potential of biogas and energy recovery from cellulosic pulp
residues: the concepts of biorefinery and process simulation model .................. 66
APPENDIX B – A multi-criteria decision analysis of management alternatives
for anaerobically digested kraft pulp mill sludges ................................................ 87

vi
ABREVIATURAS, SIGLAS E SÍMBOLOS
Associações e instituições
ABiogas Associação Brasileira de Biogás e Biometano (Brazilian Association of Biogas and Biomethane)
ABBM Associação Brasileira de Biogás e Metano (Brazilian Association of Biogas and Methane)
ANEEL Agência Nacional de Energia Elétrica (Brazilian Electricity Regulatory Agency)
ANP Agência Nacional do Petróleo, Gás Natural e Biocombustíveis (Brazilian National Agency of Petroleum, Natural Gas and Biofuels)
COP-21 21st Conference of the Parties
GIZ Deutsche Gesellschaft für Internationale Zusammenarbeit (German Society for International Cooperation)
IWA International Water Association
Siglas e abreviações
AD Anaerobic digestion
ADM1 Anaerobic digestion model no 1
ADt Air-dried ton of pulp
Aspen Plus®
Advanced system for process engineering software
BMP Biochemical methane potential
BOD5 Five-day biochemical oxygen demand
COD Chemical oxygen demand
CSTR Continuously stirred tank reactor
C/N Carbon to nitrogen ratio
DHFORM Standard heat of formation (at 25°C and 1 atm)
ETP Effluent treatment plant
FF 2-Furfuraldehyde
GC Gas chromatograph
HAc Acetic acid
HMF 5-Hydroxymethyl-2-furfuraldehyde
HP High pressure
HPLC High performance liquid chromatography
HRT Hydraulic retention time
ICMS Imposto sobre circulação de mercadorias e serviços (Tax on movement of goods and services)
LCFA Long chain fatty acids
LP Low pressure

vii
MIX Mixture between PS and SS (2.5:1 ratio in TS basis)
MP Medium pressure
N Normal (0°C and 1 atm)
OTR Oxygen transfer rate
P&P Pulp and paper
PS Primary sludge
PSM Process simulation model
S/I Substrate to inoculum ratio
SMP Specific cumulative methane production
SS Secondary sludge
SS–AD Solid state anaerobic digestion
ST Steam turbine
T Temperature
TCD Thermal conductivity detector
TMP Theoretical methane potential
TS Total solids
UASB Upflow anaerobic sludge blanket
VFA Volatile fatty acids
VS Volatile solids
w.b. Wet mass basis
WAS Waste activated sludge (or bio-sludge or secondary sludge)
Símbolos referentes às formulas e análises estatísticas
α Significance level
Bindex Biodegradation index
e exp(1)
E Normalized root-mean-square deviation
ECH4 Electricity production from biogas
EETP Electricity demand for aeration in a kraft pulp mill ETP
EP Energy production potential
P Specific cumulative methane yield
P0 Maximum specific methane yield
R2 Coefficient of determination
Rm Maximum specific methane production rate
t Incubation time
λ Lag phase

viii
ABSTRACT
LOPES, Alice do Carmo Precci, M.Sc., Universidade Federal de Viçosa, March, 2017. Biogas production potential from kraft pulp mill sludge. Advisor: Cláudio Mudadu Silva. Co-advisers: André Pereira Rosa and Fábio de Ávila Rodrigues.
The kraft pulping process is energy intensive. Although the mill generates part of its
own energy by burning the black liquor in the recovery boiler and wooden biomass in
the biomass boiler, it still relies on additional electricity and fossil fuel sources. Due
to an energy price increase, the pulp industry has been driven to optimize its energy
efficiency and self-sufficiency. One attractive industrial opportunity is to produce
biogas from sludge using the anaerobic digestion technology. Thus, the main objective
of this dissertation was to evaluate the potential of biogas production from bleached
kraft pulp mill primary and secondary sludges. The dissertation was structured in 5
Chapters written as scientific papers. Chapter 1 presented a literature review about
kraft pulp mills, biogas production, and legislations related to the implantation of
biodigesters. It was concluded that there are still very few studies related to the
anaerobic digestion of kraft pulp mill sludges. Additionally, although Brazil has great
potential for biogas production, the country still faces barriers related to political
incentives. Chapter 2 aimed at (i) identifying the best substrate to inoculum ratio (2/1,
1/1, and 0.4 g VSsubstrate/g VSinoculum); (ii) identifying the best inoculum type (UASB
sludge and UASB sludge + cow dung); and (iii) estimating the potential of substituting
the electricity demand of the mill’s effluent treatment plant (ETP) aeration system.
The substrates used consisted of primary (PS) and secondary (SS) sludges, and the
mixture (MIX) between PS and SS. The results showed that the SS presented the
highest methane production, with an optimal ratio of 1 g VSsubstrate/g VSinoculum using
UASB sludge as inoculum. Cow dung increased the methane production of the PS for
S/I = 1/1, but pre-treatment of PS should be tested to increase the substrate
biodegradability. Finally, the methane yield led to a potential substitution of 23% of
the ETP electricity demand. Chapter 3 aimed to (i) estimate potential biogas
production under thermophilic conditions for the same substrates; (ii) calibrate the
anaerobic digestion model developed by Rajendran et al. (2014); and (iii) simulate the
best sludge composition and the influence of nitrogen addition on anaerobic digestion
system. It was found that the (i) the maximum methane yield was achieved with the

ix
secondary sludge at 30 days (46.9 NmL CH4/g VS); (ii) the applied anaerobic
digestion model was applicable for the kraft pulp mill sludge after minor adjustments;
(iii) optimal sludge composition was found to be 21.62% carbohydrates, 61.67% lipids
and 16.72% proteins. The addition of nitrogen increased the methane yield for PS and
MIX, but decreased it for SS. Chapters 4 and 5 were the result of work developed by
bachelor exchange students as part of the Living Lab Biobased Brazil Program.
Chapter 4 aimed to adjust the Rajendran et al. (2014) model for mesophilic conditions
and simulate biogas use in the form of electricity and heat. From the simulation, a
potential heat production of 88 GJ/d and electric power of 148 kW was found. From
Chapter 4, possibilities for improving the Rajendran et al. (2014) model were proposed.
Finally, Chapter 5 aimed at giving an insight into the possible alternatives for
managing the anaerobically digested kraft pulp mill sludge using a simplified Multi-
Criteria Decision Analysis tool. From the analyzed alternatives (landfill, land
application, composting, incineration, pyrolysis/gasification and algae production),
composting appeared to be the most suitable alternative.

x
RESUMO
LOPES, Alice do Carmo Precci, M.Sc., Universidade Federal de Viçosa, março de 2017. Potencial de produção de biogás a partir de lodo de celulose kraft. Orientador: Cláudio Mudadu Silva. Coorientadores: André Pereira Rosa e Fábio de Ávila Rodrigues.
O processo de fabricação da polpa celulósica kraft demanda elevada quantidade de
água e energia. Embora a indústria gere parte de sua própria energia pela queima do
licor negro na caldeira de recuperação e biomassa residual na caldeira de biomassa, a
indústria ainda é dependente de energia elétrica e combustíveis fósseis adicionais.
Devido ao aumento da tarifa de energia, a indústria de celulose tem sido motivada a
aumentar sua eficiência energética, tornando-se autossuficiente. A produção de biogás
a partir do lodo gerado na estação de tratamento de efluentes da indústria constitui
uma potencial alternativa de gerenciamento dos resíduos e produção de energia. O
objetivo principal desta dissertação foi avaliar o potencial da produção de biogás a
partir dos lodos primário e secundário provenientes da indústria de celulose kraft
branqueada. A dissertação foi estruturada em 5 Capítulos desenvolvidos em forma de
artigos científicos. O Capítulo 1 apresentou uma revisão de literatura sobre os
processos de produção de celulose kraft e de biogás, bem como um panorama sobre
legislações brasileiras relacionadas à implantação de biodigestores. Foi concluído que
há pouco estudo relativo à digestão anaeróbia de lodo de celulose kraft.
Adicionalmente, apesar de o Brasil apresentar um grande potencial de produção de
biogás, o país ainda carece de incentivos governamentais no setor. O Capítulo 2
objetivou (i) identificar a melhor relação substrato/inóculo (2/1, 1/1 e 0.4 g VSsubstrato/g
VSinóculo); (ii) identificar o melhor tipo de inóculo (lodo de UASB ou lodo de UASB +
estrume); e (iii) estimar o potencial de substituição da energia elétrica demandada pelo
sistema de aeração da estação de tratamento de efluentes da indústria de celulose kraft
branqueada a partir do biogás produzido. Para tanto, foram utilizados como substratos
o lodo primário (PS), lodo secundário (SS) e a mistura de ambos (MIX). Os resultados
mostraram que o lodo secundário possuiu maior potencial de produção de biogás para
uma relação 1/1 g VSsubstrato/g VSinóculo, utilizando lodo de UASB como inóculo. O
estrume aumentou a produção de metano do lodo primário para relação S/I 1/1, porém
pré-tratamentos devem ser testados de modo a aumentar a biodegradabilidade do
substrato. Por fim, o biogás produzido apresentou potencial de substituir 23% da
xi
demanda de energia elétrica da estação de tratamento de efluentes. O Capítulo 3
objetivou (i) estimar o potencial de produção de biogás em condições termofílicas a
partir do PS, SS e MIX; (ii) calibrar o modelo de digestão anaeróbia desenvolvido por
Rajendran et al. (2014); e (iii) determinar a melhor composição do lodo e a influência
de adição de nitrogênio no sistema de digestão anaeróbia a partir de simulações
numéricas. Foi identificado que (i) a máxima produção de metano foi atingida pelo
lodo secundário em 30 dias (46.9 NmL CH4/g VS); (ii) o modelo de digestão anaeróbia
foi aplicável para lodo de celulose kraft após ajustes; (iii) a melhor composição de
lodo foi de 21.62% de carboidratos, 61,67% de lipídeos e 16.72% de proteínas. A
adição de nitrogênio aumentou a produção de metano para o PS e o MIX, mas reduziu
para o SS. Os Capítulos 4 e 5 foram desenvolvidos por estudantes intercambistas como
parte do programa Living Lab Biobased Brazil. Os objetivos do Capítulo 4 foram
ajustar o modelo de Rajendran et al. (2014) para a condição mesofílica e simular o uso
do biogás em forma de eletricidade e calor. A partir da simulação foi possível produzir
88 GJ/d de calor e 148 kW de potência elétrica. Além disso, a partir do ajuste do
modelo de Rajendran et al. (2014) para a condição mesofílica, foram propostas
melhorias para o modelo. Por fim, o Capítulo 5 objetivou apresentar potenciais
alternativas para o gerenciamento do lodo de celulose kraft pós-digestão anaeróbia,
utilizando a ferramenta de Análise de Multi-Critério simplificada. A partir das
alternativas avaliadas (aterro sanitário, aplicação no solo, compostagem, incineração,
pirólise/gaseificação e produção de algas), a compostagem se apresentou como a
melhor opção.

1
GENERAL INTRODUCTION
Brazil is of major importance globally for bleached kraft pulp. Along with the pulp
production, there is a significant sludge generation, which is mainly disposed of in
landfills or, in a few cases, incinerated. These alternatives restrain the sludge potential
for biogas production.
The kraft pulp mill generates part of its energy by burning wooden by-products in the
biomass boiler, and the black liquor in the recovery boiler. With the electricity price
increase and the instability of oil prices, the kraft pulp mills have been motivated to
become energy-sufficient and an energy exporter.
Anaerobic digestion of pulp mill sludge appears to be a suitable alternative for
managing sludge and providing additional energy for the mill. This technology works
with substrates with high moisture content and produces biogas, a renewable energy,
which can be further processed and transformed into electricity, heat and biofuel.
In this way, this Dissertation aimed at studying the technical viability of producing
biogas from the kraft pulp mill primary and secondary sludges. This work was divided
in 5 Chapters, which were structured in form of scientific papers. Chapter 1 presented
a literature review regarding kraft pulp mills, anaerobic digestion technology, and the
technical, economic and regulatory aspects related to biogas production in Brazil. This
chapter had as co-authors the exchange students Alessio Belmondo Bianchi Di
Lavagna, from the Avans University of Applied Sciences and Martijn Eikelboom,
from the University of Applied Sciences Van Hall Larenstein. Both took part in the
exchange program Living Lab Biobased Brazil, a cooperation between Brazil and
Holland.
For stable anaerobic digestion to occur, it is necessary to define an adequate substrate
to inoculum (S/I) ratio and to counterbalance the lack of nitrogen in the pulp mill
sludge. Thus, Chapter 2 aimed to identify the best S/I ratio, and to discuss the addition
of cow dung as a nitrogen source. This work was performed at the Laboratório de
Química Ambiental e Tecnológica of the Universidade Federal de Ouro Preto, under

2
guidance of Professors Sérgio Francisco de Aquino and Bruno Eduardo Lodo Baêta,
and of the Ph.D. students Diego Roberto Sousa Lima and Oscar Fernando Herrera
Adarme.
Chapter 3 was a result of a paper presented at the Sixth International Symposium on
Energy from Biomass and Waste, in Venice, Italy. It was later revised for submission
to the Renewable Energy Journal. The Chapter discussed the potential for biogas
production from the anaerobic digestion of primary and secondary sludges, and their
mixture under thermophilic conditions, coupling laboratory experiments and
numerical simulations.
Chapters 4 and 5 are presented in the Appendix and are the product of the research
developed by Alessio and Martijn during their stay at the Universidade Federal de
Viçosa. Alessio presented the potential of producing electricity and heat from biogas
conversion, and a critical review of the anaerobic digestion model used. Finally,
Martijn discussed alternatives for managing the sludge after the anaerobic digestion,
using a simplified Multi-Criteria Analysis Tool.

3
1 ENERGY PRODUCTION POTENTIAL FROM KRAFT PULP AND PAPER MILL SLUDGES: A REVIEW FROM THE BRAZILIAN PERSPECTIVE
“Rien ne se perd, rien ne se crée, tout se transforme”
Antoine Laurent de Lavoisier

4
Abstract
Brazil is of major importance globally for bleached kraft pulp. Along with pulp
production, there is significant sludge generation, which is mainly disposed of in
landfills or, in few cases, incinerated. These alternatives diminish sludge potential for
biogas production. This review focused on the anaerobic digestion of pulp and paper
(P&P) mill sludges, considering the characteristics and particularities of the kraft pulp
mill. First, a general background was given, including the kraft pulping process, its
energy systems and consumption, the anaerobic digestion process and its application
to pulp and paper mill sludges. Then, policies and regulations related to biogas
production were discussed, comparing Brazil to European countries. The available
literature underlined the potential for producing biogas from P&P mill sludges, but
studies related to its application on a large scale are lacking. With regard to policy and
regulation, Brazil is still new in the sector compared to European countries, but has
achieved important developments in the last few years.
1.1 Introduction
Pulp and paper (P&P) has been an essential human need for centuries, being used to
spread information and for hygiene and packaging purposes. Despite electronic
systems advances, paper production remains important in developing countries,
especially in the packaging, tissue and paperboard sectors. In developed countries,
paper production is expected to decline in the fields of printing and writing, making
way for modern electronic devices (Silva et al., 2015).
Brazil is the second largest producer of bleached kraft pulp in the world (FAO, 2016).
The Brazilian paper market achieved a growth of around 3% per year between 2004
and 2014 (Silva et al., 2015). In 2015, more than 17 Mt of cellulosic pulp were
produced in Brazil, most of it through bleached kraft pulping, the most commonly
applied technique in global terms (FAO, 2016; IBÁ, 2016). Pulp production in Brazil
is still growing, while in other countries it has remained steady or in decline
(Figure 1.1). This suggests that the sector still remains of primary interest for Brazil

5
and, therefore, the research has to take into account future perspectives and tendencies
as well.
Figure 1.1 Bleached kraft pulp production globally from 1961 to 2015 in megatons (Mt) (FAO, 2016).
Along with the economic success, the environmental aspects of the pulp industry have
to be considered. The production of 1 ton of pulp generates between 0.2 to 0.6 wet
tons of sludge, which are mainly dewatered and disposed of in landfills or burned in
biomass boilers (CANMET, 2005 apud Meyer and Edwards, 2014).
In Brazil, electricity is mainly produced from hydropower. With the drought that the
country has experienced in the last few years, thermoelectric power has been utilized,
pushing up energy prices and increasing air pollution. The electricity tax increase has
been transforming the industrial sector in the country and driving the P&P mill sector
to seek energy independence (EPE, 2016; International Paper, 2015).
Current sludge management by P&P mills mainly comprises incineration or landfill,
accounting for about 50% of operational costs (Kyllönen et al., 1988; Meyer and
Edwards, 2014). However, with a proper treatment of the waste activated sludge
(named as bio-sludge or secondary sludge as well), it is possible to significantly reduce

6
disposal costs (Wood, 2008). Additionally, due to environmental concerns related to
landfill disposal, it should be the last option considered for waste management (Brasil,
2010; EU, 2017).
Anaerobic digestion (AD) is one of the most sustainable practices for energy and
nutrients recovery from biomass and it is a better alternative for handling P&P mill
waste activated sludges than incineration (Stoica et al., 2009). The generated biogas
represents one of the cleanest and most CO2 neutral forms of energy use.
Climate change is the core of today’s global agenda. In 2015 it was reaffirmed in Paris
by the Conference of the Parties (COP-21) the necessity of deep cuts in global
emissions and the diffusion of renewable energy access in developing countries
(UNFCCC, 2016). Brazil, as a signatory country, stipulated up to 2020 a variety of
measures to reduce the country’s greenhouse gas emissions, including the increase of
biofuels share and use of alternative energy sources (UNFCCC, 2015).
There is no doubt that the anaerobic digestion of pulp mill sludges represents a promise
alternative for contributing to the achievement of the desired goal, since the
technology aims at producing biogas, a renewable energy, from waste streams. A
proper management of the sludge would avoid emissions (i) related to transportation
of the sludge to landfills; and (ii) from the landfill disposal. Additionally, the produced
biogas could partially substitute the fossil fuels still demanded by kraft pulp mills.
Although the potential benefits brought by the anaerobic digestion technology from
pulp and paper mill sludges, the opportunity to produce biogas on a large scale has
been overlooked by the industry. In addition, there is still a few number of studies that
embodies a techno-economic analysis of the process (Bayr et al., 2013; Bayr and
Rintala, 2012; Ekstrand et al., 2016; Kamali et al., 2016; Larsson et al., 2015; Meyer
and Edwards, 2014; Olsson and Fallde, 2015; Pokhrel and Viraraghavan, 2004; Saha
et al., 2011; Stoica et al., 2009).
This chapter aimed to (i) outline biogas production and use from the anaerobic
digestion of P&P mill sludges in the light of technical and governmental questions;

7
and (ii) highlight opportunities for the kraft pulp industry to increase its energy
independence.
1.2 The kraft pulp mill
Pulp is a fibrous raw material for papermaking and is produced from cellulosic
material, such as wood, straw, grass and hemp. About 90% of the global pulp
production is from wood (Holik, 2006). Another common way of producing pulp is
re-pulping recovered paper. Sulfate or kraft is the main chemical pulping process
because it produces a strong pulp from a variety of woods. Kraft pulping also has a
chemical recovery system, which is considered a pollution control device and is
economically advantageous (Springer, 1993).
The kraft pulp process mainly comprises three lines: fiber, recovery and effluent
treatment lines (Figure 1.2). First, wood logs are cut into medium sized woodchips.
The chips are then cooked either in batch or in continuous digesters with white liquor
constituted of an aqueous solution containing NaOH and Na2S. The white liquor
breaks the bonds between the lignin and cellulose within the fibers and separates the
lignin and hemicellulose from the cellulose fiber (D’Almeida et al., 2013).

8
Figure 1.2 Simplified kraft pulp process scheme.
When the digestion is completed, the softened chips are disintegrated into fibers and
washed to separate the cooked pulp from the residual liquor. After washing, the pulp
has a brownish color, which is removed in the bleaching plant. Then, the pulp is dried
and ready to be processed in a paper mill. In the recovery line, the black liquor is
dried to a consistency of about 75% solids and burnt in the recovery boiler, generating
heat and power for the mill. Other functions of the recovery line include the white
liquor and other by-products chemicals regeneration (Grace et al., 1989).
Finally, the effluent generated in the manufacturing processes is treated mostly using
the activated sludges system (Larsson et al., 2015; Stoica et al., 2009). The effluent
generation from a bleached kraft pulp mill ranges from 25 to 50 m3 per air-dried ton
of pulp produced (ADt) (European Comission, 2014). The activated sludge system
produces about 0.2 to 0.6 wet tons of sludge per ton of pulp (CANMET, 2005 apud
Meyer and Edwards, 2014). With a production of 17 Mt of pulp in 2015 (IBÁ, 2016),
pulp mill sludge generation would represent about 3.4 to 10.2 Mt a year in Brazil.
1.2.1 Energy demand

9
The P&P industry is large and resource-intensive. In Brazil, this typology is the third
most energy intensive (EPE, 2014). The kraft pulping process demands about 10 to 14
GJ/ADt of heat and 700 to 800 kWh/ADt of power (Suhr et al., 2015). Table 1.1
presents the energy consumption in a bleached kraft pulp mill in Canada. The most
energy intensive unit is the pulp machine, which is responsible for thickening the pulp
(Francis et al., 2002).
Table 1.1 Steam and electricity consumption in modern kraft pulp mills in Canada (Francis et al., 2002)
Process Steam (GJ/ADt) Electricity (kWh/ADt) Chip conveying 0.0 20
Digester 1.7 40
Washing and screening 0.0 30
Oxygen delignification 0.5 75
Bleaching 2.3 100
Pulp machine 2.3 141 Black liquor evaporators 3.1 30
Power plant 2.3 60
Kiln and recausticizing 0.0 50
Hot water supply 0.0 32
Miscellaneous 0.0 30
Total 12.2 638
The Canadian mill is capable of meeting its own steam requirements, but an extra 17
kWh/ADt of electricity and 1.2 GJ/ADt of natural gas needs to be purchased (Francis
et al., 2002). In Brazil, a P&P mill has reported that natural gas is the second most
required fuel (Macedo, 2006). Natural gas is mainly composed of methane, which is
also part of biogas composition (35 to 75% vol.) (Abatzoglou and Boivin, 2009). After
purification, the biogas from P&P sludges could represent a potential substitute of the
mill’s fossil fuels demand.
With regard to the effluent treatment plant (ETP) energy demand, P&P mill effluent
has a temperature of about 50°C (Reddy et al., 2005). Since the activated sludge
process has an operating temperature of 35 to 40 °C, the effluent has to be cooled first.
In addition, since the treatment process is aerobic, the energy demand for aeration is
high, comprising more than 50% of the electricity demand at the industry’s ETP
(Stoica et al., 2009). The ETP energy demand is estimated to be 30 kWh/ADt pulp
(Francis et al., 2002). This figure is low compared to the industry energy demand,
10
which is about 638 kWh/ADt (Francis et al., 2002). However, the ETP energy demand
must also be considered, in order to improve the industry’s energy efficiency and
sufficiency.
1.2.2 Energy generating systems
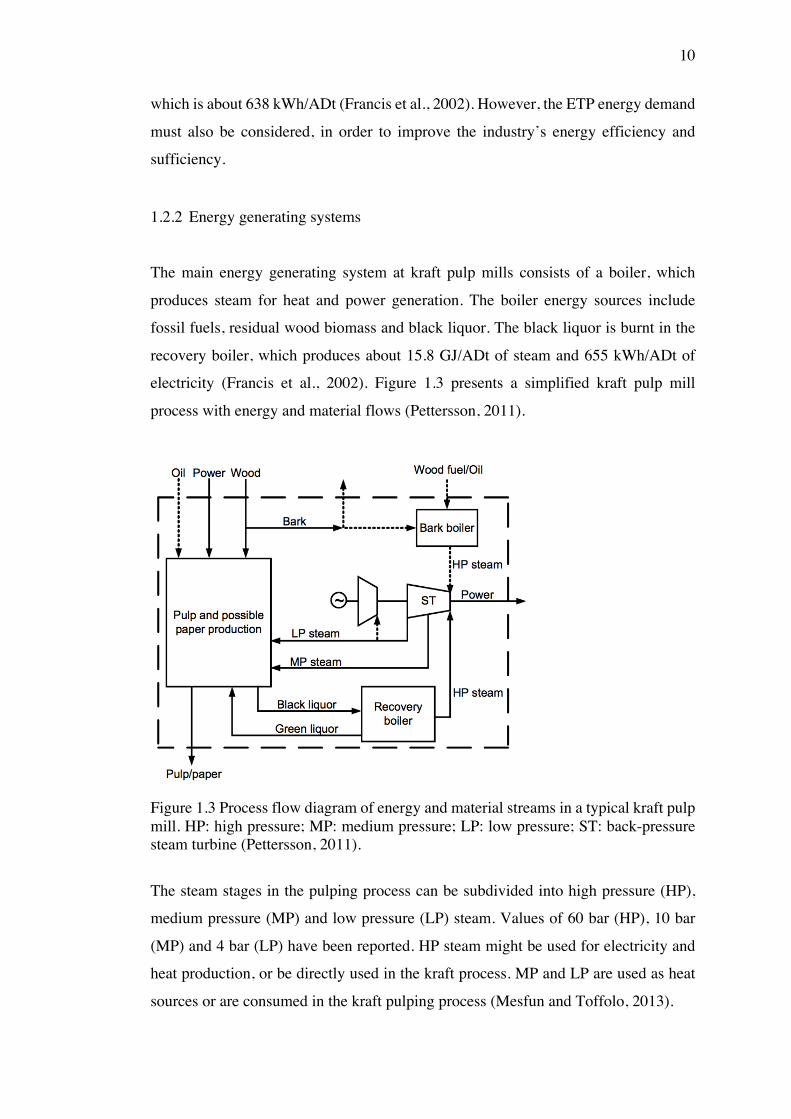
The main energy generating system at kraft pulp mills consists of a boiler, which
produces steam for heat and power generation. The boiler energy sources include
fossil fuels, residual wood biomass and black liquor. The black liquor is burnt in the
recovery boiler, which produces about 15.8 GJ/ADt of steam and 655 kWh/ADt of
electricity (Francis et al., 2002). Figure 1.3 presents a simplified kraft pulp mill
process with energy and material flows (Pettersson, 2011).
Figure 1.3 Process flow diagram of energy and material streams in a typical kraft pulp mill. HP: high pressure; MP: medium pressure; LP: low pressure; ST: back-pressure steam turbine (Pettersson, 2011).
The steam stages in the pulping process can be subdivided into high pressure (HP),
medium pressure (MP) and low pressure (LP) steam. Values of 60 bar (HP), 10 bar
(MP) and 4 bar (LP) have been reported. HP steam might be used for electricity and
heat production, or be directly used in the kraft process. MP and LP are used as heat
sources or are consumed in the kraft pulping process (Mesfun and Toffolo, 2013).
11
In Sweden, steam is mainly generated at a pressure of 60/65 bar and 450°C in order to
avoid corrosion of turbines and pipes. On the other hand, in Japan, recovery boilers
operating at pressures of 100 bar and 500°C have already been applied (Vakkilainen,
2007). A study carried out by Goortani et al. (2010) reported the operating conditions
of an old kraft pulp mill as HP steam generation of 31 bar and 371°C, followed by a
MP of 9.6 bar and 179°C and an LP of 3.4 bar and 143°C. The same study also
investigated the potential of increasing the efficiency of steam generation by
introducing new boilers able to produce steam at higher pressure and temperature (88
bar and 480°C).
The Confederation of Indian Industry (CII, 2009) determined the best practices for the
pulp and paper industry by visiting and gathering information from mills in Europe
and India. The study showed that, for the largest recovery boiler at that time, the steam
produced was about 520 to 525°C and operated by a single backpressure turbine
operated at 90–100 bar, with an extraction pressure system at three levels (11, 7 and 3
bar). The operation at maximum pressure, however, might cause corrosion of the
recovery boiler system, with its not being advisable to operate the system at its
maximum potential.
1.3 The anaerobic digestion
Anaerobic digestion (AD) stands for microbial treatment of organic matter in the
absence of oxygen. This type of technology has become appealing for the treatment
of organic waste since it allows nutrient recovery and energy production. AD is less
energy intensive compared to aerobic treatment, which requires an oxygen supply.
The process is quite complex on a microbial level. Organic materials, such as
carbohydrates, proteins and lipids, are hydrolyzed by hydrolytic enzymes (cellulases,
proteinases and lipases) produced by microorganisms (Vavilin et al., 2008). The
products of the hydrolysis include mainly monosaccharides, amino acids, long chain
fatty acids (LCFA) and glycerol. These products are fermented (acidogenesis),
producing volatile fatty acids (VFA), mainly acetate, butyrate, propionate and lactate.
The process can be stopped in this stage, being named as dark fermentation. In the
next step (acetogenesis), the VFA are consumed, producing acetic acid, carbon dioxide

12
and hydrogen, among other compounds. The biogas is then formed in the
methanogenesis, either through the acetic acid route (acetotrophic) or the reaction
between CO2 and H2 (hydrogenotrophic methanogenesis) (Khanal, 2008). A scheme
of the process is summarized in Figure 1.4
Figure 1.4 Anaerobic digestion scheme (Monlau et al., 2014).
Biogas is typically composed of 60–70% CH4 and has a heating value between 15 and
30 MJ/Nm3 (Abatzoglou and Boivin, 2009; Li et al., 2011). Other biogas constituents
include CO2, H2O, H2S, mercaptans and siloxanes (Abatzoglou and Boivin, 2009;
Khanal, 2008). The biogas composition varies depending on the efficiency of the
digester and the substrate composition (Khanal, 2008).
The bacterial growth rate is essential for the success of anaerobic digestion. For each
step of the process, there are specific bacteria which require different characteristics
for their development (Khalid et al., 2011). The bacterial population in an anaerobic
environment is strongly influenced by environmental factors. The ideal temperature
ranges between 35–40°C for mesophilic conditions, and 50–55°C for thermophilic
conditions (van Haandel and Lettinga, 1994). The pH should be maintained neutral,
within a range of 6.8–7.4 (Khanal, 2008).
Anaerobic digestion is also influenced by the presence of inhibitors, which create
hostile conditions for the bacterial population. The inhibition caused by ammonia,

13
sulfate, VFA, LCFA and hydrogen have been considered the main limiting factors.
Protein breakdown releases ammonia, which can inhibit microorganisms at specific
concentrations. On the other side, the presence of nitrogen is essential for the bacterial
growth and pH maintenance (Hansen et al., 1998).
Sulfur is important for the synthesis of protein. However, the presence of sulfate can
inhibit the methanogenesis, since the sulfate reducing bacteria compete with the
methanogenic archea for hydrogen and acetate. Additionally, the reduction of sulfate
(SO4-2) leads to the production of hydrogen sulfide (H2S), which is toxic to the system
(Khanal, 2008). H2S is also undesired in energy-conversion systems, since it causes
corrosion to pipes and motors when transformed to sulfur dioxide (SO2) and sulfuric
acid (H2SO4) (Abatzoglou and Boivin, 2009).
Although the lipids are the major contributors for biogas production, high lipid content
can lead to an inhibitory effect, since LCFA, originated from the lipids breakdown,
changes the cell permeability and may act as a barrier against other substrate
bioavailabilities (Cirne et al., 2007; Lesteur et al., 2010; Nieman, 1954). On the other
side, it is important to notice that pulp mill sludges lipids content is very low, do not
representing a concern. Another inhibition is related to the accumulation of hydrogen
when the symbiosis between the acidogens and methanogens microorganisms are
broken down. The high hydrogen pressure in the system inhibits the propionic acid
degrading bacteria (Khanal, 2008).
The substrate for biogas production varies according the country. Figure 1.5 compares
the biogas sources in Brazil, Germany, Finland and Sweden. Germany is the European
leader in biogas production and development (Sorda et al., 2013). Brazil, Finland and
Sweden are important countries in terms of P&P production (FAO, 2016). Although
Brazil is a key agricultural country, the biogas production from agrarian substrates are
very low compared to Germany, which is considered an industrial country.

14
Figure 1.5. Biogas sources in Brazil, Germany, Finland and Sweden (IEA, 2015) (adapted).
1.3.1 Anaerobic digestion enhancement
Anaerobic digestion is a well-known process which is applied at the industrial and
agricultural level. However, the efficiency and sustainability of the process has to be
increased in order to make biogas economically feasible to be implemented in kraft
pulp mills. The research has been focused on the study of procedures to improve P&P
mill sludges biodegradability and, hence, biogas production.
Although kraft pulp mill sludges can be considered to have been already passed
through a pre-treatment process during the pulping cooking, residual lignin is
accumulated in the sludge, which is an insoluble complex polymer (Bayr and Rintala,
2012; Ekstrand et al., 2016). Due to the substrate complexity, studies have been
reporting high hydraulic retention times (HRT) up to 32 days for P&P mill sludges
(Bayr and Rintala, 2012; Elliott and Mahmood, 2007). High HRT means the
construction of large volume anaerobic digesters, and, therefore, high overheads.
Therefore, it is important to increase the hydrolysis rate to reduce the HRT. There are
many pre-treatment methods able to increase the conversion of the substrate, such as
thermal, chemical, thermochemical, mechanical, and thermomechanical methods.
Studies about pre-treatment of P&P mill sludge have found significant improvement

15
in biogas production (Kamali et al., 2016; Meyer and Edwards, 2014; Saha et al., 2011;
Wood et al., 2009). Nevertheless, their economic feasibility and application at a
commercial scale still need to be further studied (Kamali et al., 2016).
Pre-treatment advantages include (i) availability increase of soluble substrates and
enzymes accessibility in cellulose and hemicellulose; (ii) increase production of
volatile fatty acids; and (iii) sludge viscosity reduction, making it possible to increase
the reactor feed with higher solid concentrations (Saha et al., 2011; Teghammar, 2013).
Nevertheless, the intensity of the process needs to be controlled. Temperatures higher
than 180 °C lead to lower biogas production, due to the production of compounds
inhibitory for enzymes and microorganisms, such as furfural and 5-
hydroxymethylfurfuraldehyde (Bayr et al., 2013).
There are still few studies specifically for kraft pulp mill sludges. The most common
pre-treatments applied were found to be thermal and alkaline. The parameters used in
the studies are presented in Table 1.2.
Table 1.2 Physical-chemical pre-treatment options for kraft pulp or kraft P&P mill sludges tested through biochemical methane potential (BMP) assays
Substrate Type Parameter
Condition CH4 yield Ref. T (°C)
Time (min)
Kraft pulp mill WAS
Thermal
170 60
Mesophilic
115 mL/g
COD Wood et al. (2010) apud
Meyer and Edwards (2014)
Control 30 mL/g COD
Kraft P&P mill WAS
70 40
Thermophilic
112 mL/g VS Bayr et al. (2013)
150 10 134 mL/g VS
Control 108 mL/g VS
Kraft pulp mill WAS Alkaline
(pH 12)
140 60
Mesophilic
110 mL/g
COD Wood et al. (2010) apud
Meyer and Edwards (2014)
Control 30 mL/g COD
Kraft P&P WAS
22 1440 Thermophilic
86 mL/g VS Bayr et al. (2013) Control 108 mL/g VS
T: temperature; COD: chemical oxygen demand; VS: volatile solids; WAS: waste activated sludge; P&P: pulp and paper.

16
Besides the pre-treatment technologies, the co-digestion between different substrates
has been studied and proven to be an effective way to create a more conductive
environment for bacterial growth. Co-digestion is used to adjust the C/N
(carbon/nitrogen) ratio to optimal levels. A recent literature review by Zhang et al.
(2016) showed that co-digestion has overtaken single substrate for biogas production.
P&P mills sludges lack of nitrogen, thus their co-digestion with other substrates has
also been studied (Kamali et al., 2016). Hagelqvist (2013) tested the co-digestion of
secondary P&P mill sludge with sewage sludge, showing that the methane yield from
the P&P mill sludges increased from 53 NmL CH4/g VS to about 85 NmL CH4/g VS
for an incubation time of 20 days.
The anaerobic digestion process can be classified according to the total solids content.
Wet systems have a solid concentration between 0.5–15%. Dry systems, known as
solid state anaerobic digestion (SS–AD), operate with solids concentration above 15%.
Lignocellulosic material may be treated through the dry route, which has the
advantage of requiring smaller reactor volumes and less energy demand for
maintaining the reactor’s temperature. On the other side, the dry route requires higher
retention time compared to the wet system (Li et al., 2011).
1.4 Technical, economic and regulatory aspects of biogas
The anaerobic digestion of pulp mill sludges has been studied since the 80’s (Kyllönen,
1986), however there is only one digester on a commercial scale, which is located in
Norway (Kepp et al., 2000 apud Meyer and Edwards, 2014). The digester has a
volume of 4,000 m3 and a processing capacity of 4,000 tons of dry sludge per year.
The generated biogas has an energy content of about 108 TJ per year (30 GWh/year)
(Panter and Kleiven, 2005 apud Meyer and Edwards, 2014).
The possibility of producing biogas from P&P mill sludges and the high investment
and operating costs however, impair the implementation of the anaerobic digesters on
a large scale (Elliott and Mahmood, 2007). Larsson et al. (2015) estimated the time to
regain the initial investment was up to 7.8 for producing liquefied biogas from kraft

17
pulp mill sludges and methanol condensate. A thermomechanical pulp mill in Canada
estimated a payback time over 9 years for installing an anaerobic digester, making the
project unfeasible at that time (Elliott and Mahmood, 2007). Nevertheless, Wood
(2008) reported a simplified economic analysis of pre-treatment options for pulp mill
sludges, showing potential costs reduction with sludge disposal when using the liquid
fraction for biogas production.
In February of 2016, the Metsä Group, a Finish forestry industry, assigned a contract
with the EcoEnergy, a biogas manufacturer, to build a biogas plant from pulp mill
sludge at an industrial scale (ENDS, 2016). The biogas plant is expected to be
completed in 2017 and the production is estimated to be 20 GWh per year, which is
equal to the annual fuel consumption of 1,800 passenger cars (Metsä Group, 2016).
Although there is great biogas production potential in Brazil, the country still has to
face barriers beyond to the technological level. The absence of a complete national
grid for natural gas transportation still represents a limitation for biogas upgrade and
commercialization in the country. Furthermore, the low amount of biogas production
compared to the potential total has limited interest for its upgrade and use in vehicles
as a liquefied petroleum gas substitute (ANEEL, 2016).
Other problems related to biogas implementation in Brazil rely on (i) low
governmental incentives and subsides; (ii) lack of information and poor dissemination
of opportunities in the sector; (iii) insecurity due to the lack of national company
models which have experience in biogas plants operation; and (iv) unclear legal
conditions specifically for biogas use (Bley Jr., 2015; Ministério das Cidades, 2016a).
Until 2012, there was no specific regulation or incentives for biogas production in
Brazil. However, great strides have been taken in the last four years with the
promulgation of the ANEEL Resolution nº 687/2015 (ANEEL, 2015), which
stipulates that consumers responsible for distributed microgeneration or
minigeneration systems are allowed to export the surplus energy to the grid, being
credited for subsequent use.

18
Other achievements include the (i) ANP Resolution nº 08/2015, which specifies
conditions for biomethane use originated from organic waste (ANP, 2015); (ii)
exemption of ICMS (Tax on movement of goods and services) in some states in Brazil
when biogas is used as energy source; and (iii) creation of biogas associations, such
as the ABiogas (Brazilian Association of Biogas and Biomethane) and ABBM
(Brazilian Association of Biogas and Methane) (Moreira, 2016).
In 2013, the PROBIOGAS, a cooperative project between the Brazilian Cities
Ministry and the German Institute GIZ (Deutsche Gesellschaft für Internationale
Zusammenarbeit) was initiated. The objective of the project was to expand biogas
application as an energy source from basic sanitation and agricultural activities. The
project provided training, development of guides (Ministério das Cidades, 2016b),
integration between the academic field, companies, the energy sector, banks, research
institutions, associations, etc. (Moreira, 2016).
In Europe, biogas application is more widespread, since the renewable energy question
has been studied and considered for longer. In addition, the collaboration between
European Union countries facilitates the exchange of information and the creation of
policies and regulations on a supra-national level. In Sweden, there is tendency is to
create simpler and more effective incentives which are oriented to the de-taxation of
renewable energy or cleaner energy sources in order to stimulate their use, especially
as vehicle fuel. For instance, companies using vehicles operated with upgraded biogas
receive an income tax reduction. In addition, investments on the reduction of biogas
price have been done in order to stimulate and increase the interest in biomethane on
a national market level (IEA, 2015).
1.5 Final considerations
Brazil is of major importance globally for bleached kraft pulp production.
Nevertheless, no attention has been given to develop technologies related to pulp mill
sludge treatment and energy production in the form of biogas in the country. The
majority of the studies regarding biogas production from pulp mills found to be from
northern-European countries and Canada.

19
Pre-treatment options for P&P mill sludges have been studied due to the complexity
of the substrate composition. However, there is still a lack of research related to the
application on a large scale of biogas originated from P&P mill sludges. Given that
the kraft pulp industry is still dependent on fossil fuels, biogas production from sludge
appears to be a great opportunity to increase the mill’s energy self-sufficiency.
Besides the technical aspects, laws and regulations also have to be considered to
understand the barriers and possibilities related to the subject of study. In Brazil,
specific governmental incentives and regulations for biogas production and use are
still weak, but a stimulation of the sector has been observed from 2012. Considering
the great potential of biogas production and use from kraft pulp mill sludges, Brazil
can be not only a major global pulp producer, but also a true example of sustainability
in the kraft pulp industry.

20
2 MESOPHILIC ANAEROBIC DIGESTION OF KRAFT PULP MILL SLUDGES UNDER DIFFERENT SUBSTRATE TO INOCULUM RATIOS AND INOCULUM TYPE
“Yet, despite our many advances, our environment is still threatened by a range of
problems, including global climate change, energy dependence on unsustainable
fossil fuels, and loss of biodiversity”
Dan Lipinski

21
Abstract
The activated sludge system is the main energy demand at kraft pulp mill effluent
treatment plants. It also generates primary and secondary sludges (or bio-sludge),
which are mainly dewatered and disposed of in landfill despite their potential to be
converted to biogas. Anaerobic digestion of kraft pulp mill sludges has been studied,
but mainly focused on pre-treatment options. To the best of our knowledge, no study
was found related to the substrate to inoculum (S/I) ratio. This parameter is very
important for an adequate realization of anaerobic digestion. In addition, nitrogen is a
limiting nutrient in primary sludge. Thus, the objectives of this study were to evaluate
the (i) S/I ratio for kraft pulp mill primary and secondary sludges, and the mixture
between them under mesophilic conditions; (ii) addition of cow dung as nitrogen
source; and (iii) potential of substituting the energy source at the effluent treatment
plant (ETP) of a kraft pulp mill with the biogas produced under the best condition.
The results showed that (i) the secondary sludge achieved the highest methane yield,
with an S/I ratio of 1/1 using UASB sludge as inoculum; (ii) cow dung increased the
methane production of the primary sludge for S/I = 1/1, but its pre-treatment should
be tested to make the fibers more available for the microorganisms; and (iii) the biogas
produced led to a potential substitution of 23% of the electricity demand of a bleached
kraft pulp mill ETP.
2.1 Introduction
The activated sludge effluent treatment process is the main energy consumer of a kraft
pulp mill effluent treatment plant (ETP). It also generates high organic load of primary
and secondary sludges, which are mainly dewatered and disposed of in landfills,
despite their potential to be converted to biogas through anaerobic digestion
technology (Bayr et al., 2013; Bayr and Rintala, 2012; Ekstrand et al., 2016; Kamali
et al., 2016).
The first step of the anaerobic digestion study is the substrate characterization, which
includes the determination of carbohydrates, lipids, proteins, lignin, fibers, ash and
moisture content. The sludge characterization also includes the determination of total

22
solids (TS), volatile solids (VS), chemical oxygen demand (COD) and pH. The pulp
mill sludge composition varies according to the industrial process type (bleached kraft,
thermomechanical, sulfite etc.) and the sludge type (primary or secondary), but a
simplified scheme for pulp mill sludges composition can be draw (Figure 2.1).
Figure 2.1 Scheme of the main composition of a pulp mill sludge.
Meyer and Edwards (2014) present a literature review about pulp and paper (P&P)
mill sludges. There are still very few studies specifically for kraft pulp mill sludges
characterization. Thus, Table 2.1 and Table 2.2 present a general compilation of P&P
mill characteristics.
Table 2.1 Compilation of primary and secondary P&P mill sludges characteristics
Parameter Primary sludge Secondary sludge(c)
Meyer and Edwards (2014)
Lehto (2009)(b); Manesh (2012); Migneault (2011)
TS (%) 1.5 – 6.5 0.83 – 2.5
VS (% TS) 51 – 80 58.7 – 83
Ash (% TS) 20 – 49 17 – 41.3
pH 5 – 11 7.7 – 8.2
Cellulose (% TS) 36 – 45 9.62 – 18.9
Hemicellulose (% TS) No data 3.4 – 6.8
Proteins (% TS) 0.6 – 3.1(a) 8.1(a) – 36 Extractives (% TS) 0.4 1.7 – 17
Lignin (% TS) 20 – 24 12.8 – 36.4
TS: total solids; VS: volatile solids; (a)calculated from sludge nitrogen content (conversion factor of 6.25); (b)Äänekoski mill. (c)Range from the three authors.

23
Table 2.2. Compilation of P&P mill sludges elemental composition
Element Primary sludge Secondary sludge
Ojanen (2001) apud Lehto (2009)
Ojanen (2001) apud Lehto (2009)
Lehto (2009)(a)
C (% TS) 25 – 45 45 – 47 31.3
H (% TS) 3 – 5.5 5.4 – 6.5 3.8
N (% TS) 1.2 – 4.5 1.5 – 4.7 3.8
S (% TS) < 0.5 1.2 – 3.8 No data
O (% TS) 15 – 35 25 – 35 40.6
Ash (% TS) 0.4 16 39.2 – 41.2
TS: total solids; (a)Äänekoski mill.
The primary sludge is mainly composed of cellulose, while the secondary sludge has
higher lignin content. Both sludges are described by low nitrogen content. Considering
anaerobic digestion as a treatment option, nitrogen should be added to the system
because it is a fundamental element for bacterial growth and pH stabilization (Bayr
and Rintala, 2012; Fricke et al., 2007; Procházka et al., 2012).
Another important parameter for conducting anaerobic digestion includes defining a
proper substrate to inoculum (S/I) ratio (Pellera and Gidarakos, 2016). According to
Eskicioglu and Ghorbani (2011), an adequate S/I ratio guarantees the presence of the
microbial community throughout all stages of the process. The literature has been
reporting higher methane yield when using a substrate to inoculum (S/I) ratio of 2/1
to 3/1 under mesophilic condition for lignocellulosic material (Yang et al., 2015). To
the best of our knowledge, biogas production from kraft pulp mill sludges has been
mainly focused on pre-treatment options. No study related to the best S/I ratio was
found.
The objectives of this study were to evaluate the (i) S/I ratio for kraft pulp mill sludges
under mesophilic conditions; (ii) addition of cow dung as nitrogen source; and (iii)
potential for substituting the energy source at the effluent treatment plant of a kraft
pulp mill with the biogas produced under optimal conditions.
2.2 Material and methods

24
Biochemical methane potential (BMP) tests were performed under mesophilic
conditions to test primary (PS) and secondary (SS) kraft pulp mill sludges, and their
mixture (MIX). Different inoculum types (UASB sludge, named as UASB, and the
mixture between UASB and cow dung) and different S/I ratios (2/1; 1/1 and 0.4 g
VSsubstrate/g VSinoculum) were used.
The experimental design is presented in Figure 2.2.
Figure 2.2 Experimental design. PS: primary sludge; SS: secondary sludge; MIX: PS + SS (2.5:1, TS basis).
2.2.1 Material sampling
PS and SS were sampled from the effluent treatment plant of a bleached kraft pulp
mill, located in Brazil. The mill uses eucalyptus as raw material for pulp production
(about 1 Mt of air-dried pulp, ADt, a year) and generates about 46 m3 effluent per ADt.
The effluent treatment process consists of a primary clarifier followed by a
conventional activated sludge. Approximately 40 kg (dry basis) of primary sludge and
15 kg (dry basis) of bio-sludge is generated per ADt.
The primary sludge was sampled after a screw-press and the secondary sludge after a
belt-press dewatering process. It was chosen dewatered sludge to perform the
experiments, because it would increase the solids concentration in the digester,
reducing its volume when considering the implementation on a large scale. The
samples were stored in a freezer, with a temperature below 0°C until use. Sludge from
a mesophilic UASB (Upflow Anaerobic Sludge Blanket) reactor was collected at the
Arrudas Wastewater Treatment Facility, Brazil. Cow dung was collected at a farm
located in Ouro Preto, Brazil.

25
2.2.2 Material characterization
Primary and secondary sludges were characterized for TS, VS, and oil/grease
according to APHA (2011); ashes according to TAPPI (2002); pH according to EPA
(2004); cellulose, hemicellulose, lignin as described by Baêta et al. (2016b); protein
according to Kyllönen et al. (1988); COD according to Ferreira (2013); and elemental
composition (C, N, H, S, O) according to the analyst’s manual of TruSpec Micro CHN,
TruSpec O and TruSpec S (LECO). The empirical biomass formula (CaHbOcNdSe) was
determined according to Rittmann and McCarty (2001). The theoretical methane
potential (TMP) of the PS and SS was calculated using the Buswell equation (Eq. 2.1)
described by Pellera and Gidarakos (2016).
C#H%O'N)S+ + a −%
0−
'
1+
2)
0+
+
1H1O →
#
1+
%
4−
'
0−
2)
4−
+
0CH0 +
#
1−
%
4+
'
0+
2)
4+
+
0CO1 + dNH2 + eH1S (Eq. 2.1)
For cellulose, hemicellulose, lignin, oil and grease and protein characterization,
sludges were first dried in an oven at 65 °C, and sieved (40–60 mesh). Oil and grease
followed the procedures described by APHA (2011), method 5520 D, but without prior
acidification, since the objective was to determine the raw sludge characterization
without any pre-treatment. Protein determination was based on the total nitrogen
content of the sample, considering a factor of 6.25 (Kyllönen et al., 1988). Although
the total nitrogen also expresses amines, nucleic acids and non-protein amino acids,
among others, the proteins have a constant nitrogen percentage.
The inoculum was characterized for TS, VS, ash, pH and elemental composition
according to the methods previously described.
2.2.3 Experimental design
Two sets of experiments were simultaneously conducted considering the (i) S/I ratio
(2/1; 1/1; and 0.4 g VSsubstrate/g VSinoculum); and (ii) inoculum type (100% UASB and 50%
UASB + 50% cow dung). Both sets were prepared on a VS basis. The total mass of
inoculum in each assay was set at 25 g. The inoculum UASB was first enriched with

26
macro- and micronutrients. Both UASB and cow dung were pre-incubated at 35°C for
acclimatization and reduction of endogenous methane production. Three substrates
were tested: primary sludge, secondary sludge, and their mixture at a ratio of 2.5:1 (TS
basis). This ratio was chosen based on the sludge production at a typical bleached kraft
pulp mill.
BMP assays were carried out in 275 mL bottles, with a headspace varying from 210
mL to 250 mL, depending on the substrate to inoculum ratio and substrate used.
Assays with inoculum alone were used as blanks. Methane produced from the blank
assays was subtracted from the respective sample assays. Assays inoculated with
UASB were set as the control, i.e., without repetition. Assays inoculated with the
mixture UASB + cow dung were performed in duplicate. Since the substrates and
inoculum were already at nearly neutral pH, no pH adjustments were necessary. The
prepared BMP assays were closed with a butyl rubber stopper and aluminum seal
crimp capes, flushed with N2 for about 3 min, and incubated at 35°C with shaking at
180 rpm (Shaker Thoth® model 6440) (Figure 2.3a,b).
Figure 2.3 Methane production monitoring: (a) and (b) incubation; (c) pressure measure; and (d) area extraction for volume of methane estimation.
Monitoring was carried out manually. First, the pressure generated by the biogas was
measured using the Manometer®, model PM–9100HA (Figure 2.3c). Then, a biogas
sample was collected with a syringe and injected into a gas chromatograph – GC
(Shimadzu®, model 2014/TCD), equipped with thermal conductivity detector – TCD,
using N2 as carrier gas with a total flow of 34.9 mL/min, and molecular sieves column

27
at temperature 40°C (Figure 2.3d). The volume of methane produced was estimated
from the area generated by the GC. The results were expressed in the standard
conditions of temperature and pressure (275.15 K and 1 atm) as NmL CH4/g VS.
Holliger et al. (2016) suggest that the BMP assays should be stopped when the daily
methane production is less than 1% of the accumulated production for three
consecutive days (BMP1%). Nevertheless, in some cases, even with a production higher
than 1%, the tests were stopped, since the monitoring reached nearly 100 days, which
is already unviable for large scale production. In other cases, it was observed that the
methane production was stable under 1% for more than 3 days. However, the methane
production rate started to increase again to values higher than 1%. In these cases, the
assays also continued to be monitored.
2.2.4 Data analysis
From the TMP and the specific cumulative methane production (SMP) achieved
through the BMP tests, the biodegradability of each substrate for each condition was
calculated by Eq. (2.2).
�89:;< = (���/���)�100 Eq. (2.2)
where:
Bindex Biodegradation index (%)
SMP Specific methane production achieved by BMP tests (NmL CH4/g VS)
TMP Theoretical specific methane potential (NmL CH4/g VS)
The Modified Gompertz model (Eq. 2.3) was fitted to the methane production data
using MATLAB 2010a (Pellera and Gidarakos, 2016; Zwietering et al., 1990)
� = �H���� − expMN<;
OP� λ − � + 1 Eq. (2.3)
where:

28
P Specific cumulative methane yield (NmL CH4/g VS)
P0 Maximum specific methane yield (NmL CH4/g VS)
Rm Maximum specific methane production rate (NmL CH4/g VS.d)
� Lag phase (d)
t Incubation time (d)
e exp(1)
2.2.5 Energy production potential
The potential of energy production (EP) from a bleached kraft pulp mill effluent
treatment plant in Brazil was estimated from the highest methane yields achieved from
the BMP tests. An energy balance was carried out, comparing the potential electricity
production from biogas through a CHP (combined heat and power) unit and the energy
demanded by the aeration system at the ETP. For the biogas production potential, it
was considered the sum of the biogas yield from the PS and SS. For the conversion of
the biogas in electricity, it was considered an efficiency of 30% (Eq. 2.4).
�� =TUVW
TXYZ�100 (Eq. 2.4)
where:
EP Energy production potential (%)
ECH4 Electricity production from biogas from PS and SS (kWhel/d)
EETP Electricity demand for aeration in a kraft pulp mill ETP (kWhel/d)
The parameters considered to calculate the energy production from biogas and the
energy demand of the ETP aeration system are presented in Table 2.3. Two scenarios
were considered: (i) the ideal scenario, where the TMP was used; and the (ii) real
scenario, where the biogas yield from the BMP assays was used to perform the energy
balance.
Table 2.3 Parameters considered for energy balance of a bleached kraft pulp mill ETP
Parameter Value Reference Pulp production (ADt/d) 5000 This study
PS characteristics

29
continuation
Parameter Value Reference PS generation (kg dry/ADt) 40 This study
PS total solids (%, w.b.) 31.69 This study
PS volatile solids (%, w.b.) 31.28 This study
Methane production (NmL CH4/g VS) – real scenario 16.3 This study
Methane production (NmL CH4/g VS) – ideal scenario 417 This study
SS characteristics
SS generation (kg dry/ADt) 15 This study
SS total solids (%, w.b.) 10.73 This study SS volatile solids (%, w.b.) 9.24 This study
Methane production (NmL CH4/g VS) – real scenario 66.2 This study
Methane production (NmL CH4/g VS) – ideal scenario 519 This study
Effluent characteristics
Effluent generation (m3/ADt) 46 This study
Effluent BOD5 (kg O2/m3 effluent) 0.4 Silva (2007)
Energy analysis parameters
OTR (kg O2/kWh) 1.0 von Sperling (1997)
Methane heating value (MJ/Nm3) 34.5 Baêta et al. (2016b)
Biogas conversion to electricity efficiency (%) 30 Cano et al. (2015)
Biogas conversion to heat efficiency (%) 55 Cano et al. (2015) ADt: Air-dried ton; BOD5: five-day biochemical oxygen demand; PS: primary sludge; SS: secondary sludges; ORT: oxygen transfer rate; w.b.: wet mass basis.
It was assumed that the energy required for maintaining the reactor’s temperature was
null, since Brazil is a tropical country. Therefore, the biogas produced by the sludge
anaerobic digestion was considered to be all available for further use.
2.3 Results and discussion
2.3.1 Material characteristics
Table 2.4 presents the main characteristics of each substrate (PS, SS and MIX) and
each inoculum (UASB and UASB + cow dung).
Table 2.4 Characteristics of the substrate and inoculum
Parameter PS SS MIX UASB UASB +
cow dung TS (%, w.b.) 31.69 ± 0.07 10.73 ± 0.09 25.70 7.72 ± 0.02 6.33
VS (%, w.b.) 31.28 ± 0.07 9.24 ± 0.08 24.98 4.62 ± 0.01 4.44
pH 8.30 ± 0.19 6.42 ± 0.31 8.25 7.42 7.36
COD (mg O2/g TS)
1217 ± 10.3 1236 ± 8.9 1223 – –

30
continuation
Parameter PS SS MIX UASB UASB +
cow dung
Cellulose (% TS) 81.03 ± 0.28 31.24 ± 0.12 66.80 – –
Hemicellulose (% TS)
12.03 ± 0.14 5.52 ± 0.06 10.17 – –
Lignin (% TS) 5.71 ± 0.24 30.46 ± 0.22 12.78 – – Proteins (% TS) 0.38 ± 0.01 30.31 ± 0.02 8.93 – –
Oil and grease (% TS)
3,74 ± 0,15 3.98 ± 0.07 3.81 – –
Ash (% TS) 0.59 ± 0.02 12.50 ± 0.20 3.99 – –
C (% TS) 44.10 ± 0.10 45.20 ± 0.20 44.41 40.6 ± 0.00 38.0
H (% TS) 6.04 ± 0.04 5.83 ± 0.09 5.98 5.27 ± 0.04 5.2
N (% TS) 0.06 ± 0.01 4.85 ± 0.02 1.43 1.90 ± 0.03 3.0
S (% TS) 0.40 ± 0.01 1.82 ± 0.01 0.81 0.47 ± 0.00 1.2
O (% TS) 48.80 ± 0.05 29.80 ± 0.15 34.86 26.4 ± 0.30 24.2
C/N 689 9 31 21 13
Empirical formula
C804H1321O667NS3 C11H17O5N C36H58O27N – –
TMP (NmL CH4/g VS)
417 519 444 – –
TS: total solids; VS: volatile solids; COD: chemical oxygen demand; TMP: theoretical methane potential; w.b.: wet mass basis.
Primary sludge has low nitrogen and high cellulose content due to fiber losses in the
kraft pulping process. Secondary sludge has a lower fiber content, but higher lignin
content than primary sludge. This is expected because the bleaching plant, which is
the major source of effluent, removes residual lignin from the pulp and the filtrates are
sent directly to the ETP.
The C/N ratio of both PS and SS are completely overbalanced, but their mixture in
proportions 2.5:1 (TS basis) achieved the ideal range (20 to 35:1) (Khalid et al., 2011).
Nitrogen is important for the formation of enzymes and bacterial growth. The absence
of nitrogen leads to a low biodegradation ratio and the available carbon is not
completely degraded. On the other hand, too much nitrogen leads to an excessive
formation of NH3, which is freely permeable in membranes, passing passively through
the microbial cells, causing imbalance and/or nutrient deficit (Chen et al., 2008).
2.3.2 BMP Assays

31
Table 2.5 presents the specific cumulative methane yield after 30 days for each
substrate (PS, SS and MIX) and each S/I ratio (2/1; 1/1 and 0.4) using different
inoculum (UASB and UASB + cow dung). In order to compare the data, a 30–day
period was fixed, which is a suitable hydraulic retention for large scale biogas
production.
Table 2.5 Specific cumulative methane yield (NmL CH4/g VS) in 30 days for each substrate (PS, SS and MIX) inoculated with UASB and UASB + cow dung in different S/I ratios. The values reported in parenthesis represent the substrate biodegradability (Bindex, %)
S/I UASB UASB + cow dung PS SS MIX PS SS MIX
2/1 14.1(3.4) 59.5(11.5) 31.6(7.1) 14.9(3.6) ± 6.3 49.8(9.6) 35.2(7.9) ± 4.8
1/1 6.0(1.4) 66.2(12.7) 21.3(4.8) 16.3(3.9) ± 2.3 58.0(11.2) ± 4.7 20.3(4.6) ± 7.3
0.4 4.9(1.2) 51.5(9.9) -0.6(0.0) 1.2(0.3) ± 0.0 27.8(5.3) ± 9.7 1.5(0.3) ± 0.2
Table 2.6 presents the estimated C/N ratio for each assay, based on the carbon and
nitrogen contents of each substrate and inoculum, and on the added mass of each
substrate and inoculum in the bottles.
Table 2.6 C/N ratio for each assay. Values estimated by calculation
S/I UASB UASB + cow dung PS SS MIX PS SS MIX
2/1 49 12 26 33 10 21 1/1 35 14 25 23 11 18
0.4 27 16 23 17 11 15
Figure 2.4 presents the cumulative methane production in NmL per gram of volatile
solids added of each assay.
Figure 2.4 Cumulative methane production for assays inoculated with (a) UASB and (b) UASB + cow dung for different S/I ratios (2/1; 1/1 and 0.4).

32
As reported by Pellera and Gidarakos (2016), the process is characterized by an initial
lag phase, followed by a rapid increase in biogas production and finally, a stabilization
phase. The lag phase can be defined as a bacterial adjustment time for further growth.
The smaller the difference between the older and the newer environment, the smaller
the duration of the lag phase (Buchanan and Klawitter, 1991).
Table 2.7 presents the BMP data fitted to the modified Gompertz model for the
conditions that presented a methane yield higher than 6 NmL CH4/g VS.
Table 2.7. Data fitted to the modified Gompertz model. The cumulative methane production (P0) refers to the day of stabilization (t), which varied from assay to assay.
Type S/I UASB UASB + Cow dung PS 2/1 P0
Rm λ R2 E t
= = = = = =
29.71 NmL CH4/g VS 0.54 NmL CH4/g VS.d 5 d 0.9841 3.8% 96 d
P0 Rm λ R2 E t
= = = = = =
40.10 NmL CH4/g VS 0.88 NmL CH4/g VS.d
14 d 0.9980 1.7% 75 d
PS 1/1 P0 Rm λ R2 E t
= = = = = =
6.24 NmL CH4/g VS 0.42 NmL CH4/g VS.d
9 d 0.9868 4.6% 28 d
P0 Rm λ R2 E t
= = = = = =
20 NmL CH4/g VS 1.18 NmL CH4/g VS.d 16 d 0.9924 3.6% 44 d
SS 2/1 P0 Rm λ R2 E t
= = = = = =
60 NmL CH4/g VS 4.2 NmL CH4/g VS.d 9.2 d 0.9907 3.7% 32 d
P0 Rm λ R2 E t
= = = = = =
62.7 NmL CH4/g VS 3.4 NmL CH4/g VS.d 15.3 d 0.9858 4.3% 96
SS 1/1 P0 Rm λ R2 E t
= = = = = =
67 NmL CH4/g VS 3.49 NmL CH4/g VS.d 5.3 d 0.9944 2.7% 31 d
P0 Rm λ R2 E t
= = = = = =
62 NmL CH4/g VS 3.09 NmL CH4/g VS.d 5.3 d 0.9954 2.5% 33 d
SS 0.4 P0 Rm λ R2 E t
= = = = = =
62 NmL CH4/g VS 2.79 NmL CH4/g VS.d 8.5 d 0.9903 3.7% 47 d
P0 Rm λ R2 E t
= = = = = =
30 NmL CH4/g VS 1.72 NmL CH4/g VS.d 10.4 d 0.9860 4.6% 30 d
MIX 2/1 P0 Rm λ R2 E t
= = = = = =
38.7 NmL CH4/g VS 1.41 NmL CH4/g VS.d 1.4 d 0.9712 5.1% 29 d
P0 Rm λ R2 E t
= = = = = =
37.6 NmL CH4/g VS 2.28 NmL CH4/g VS.d 8.7 d 0.9952 2.8% 29 d

33
continuation Type S/I UASB UASB + Cow dung MIX 1/1 P0
Rm λ R2 E t
= = = = = =
22 NmL CH4/g VS 1.14 NmL CH4/g VS.d 7 d 0.9951 2.7% 33 d
P0 Rm λ R2 E t
= = = = = =
33.5 NmL CH4/g VS 1.32 NmL CH4/g VS.d 13.6 d 0.9967 2.2% 38 d
P0: Maximum specific methane yield; Rm: Maximum specific methane production; λ : lag phase; E: normalized root-mean-square deviation; R2: coefficient of determination; t: incubation time.
As shown on Table 2.5 and 2.7, the methane yield and maximum production rate
increased for PS (S/I =1/1) when using UASB + cow dung as inoculum. With regard
to the secondary sludge, this substrate has a low C/N ratio (Table 2.4 and Table 2.6),
which means that there was an excess of nitrogen that needed to be balanced with the
addition of a carbon source. Therefore, since cow dung is a source of nitrogen, its
addition to the SS did not increase methane production (Table 2.5), nor increase the
degradation rate or, reduce the lag phase (Table 2.7).
The best S/I ratio for the PS and the MIX was 2/1. The secondary sludge performed
slightly better at a 1/1 ratio. The highest S/I ratio led to a slight decrease in the methane
yield, since the excess of substrate might have led to volatile fatty acids (VFA)
accumulation. However, in practical terms, it may be better to feed the digester with
high organic load content, since the biogas yields at S/I = 2/1 and S/I = 1/1 for the
secondary sludge inoculated with UASB were close.
Among all substrates, the secondary sludge achieved the highest methane yield after
30 days (Table 2.5). Although SS presented the highest lignin content, it did not impair
methane production, rather, the cellulose content seemed to be a stronger barrier,
because PS, mainly composed of cellulose, had the lowest biogas yield.
During the kraft pulp process, complex lignocellusic molecules are broken, facilitating
the sludges anaerobic digestion process (Ekstrand et al., 2016). However, the kraft
process might also produce inhibitory compounds, impairing the biological process.
Andrić et al. (2010) reported that products from cellulose degradation act as inhibitors
of cellulolytic enzymes. Since the primary sludge presented the highest cellulose

34
content, the lowest methane yield might be also related to inhibition caused by the
cellulosic products originated from the kraft process.
Wood et al. (2008) carried out BMP assays with the liquid phase of secondary pulp
sludge with and without prior treatment. Without pretreatment, he achieved a methane
production of 30 mL/g COD in 34 days. This study achieved 46.7 NmL CH4/g COD
for the best condition (SS 1/1 UASB) in 34 days, suggesting that anaerobic digestion
during the solid phase is more efficient than in the liquid phase. In fact, according to
Tchobanoglous et al. (2003), feeding the digester with thickened sludge might enhance
biogas production, due to the higher solids concentration.
Hagelqvist (2013) achieved a methane production potential of 53 NmL/g VS in 19
days from the secondary sludge of a P&P mill. The result achieved by this study is
slightly smaller, with a production of 43 NmL/g VS over the same period.
The low methane production for S/I = 0.4 for PS and MIX might be due to the low
substrate concentration and biodegradability, and not to acidification, since the final
pH of all the assays was higher than 7. The explanation for a negative value for the
MIX (S/I = 0.4, using UASB as inoculum) implies on the lower methane production
by the substrate (MIX) than by the inoculum alone. Although the mixture between PS
and SS satisfied the C/N ratio, the MIX is mainly composed of PS, i.e., cellulose fibers,
which are resistant to biodegradation without prior pre-treatment.
Substrates with low nitrogen content (high C/N ratio) have low buffer capacity, which
may result in an accumulation of VFA (Procházka et al., 2012). In fact, for the S/I =
2/1, the lowest pH at the conclusion of the assays was observed for the PS using only
UASB as inoculum (5.82), which is the substrate with the lowest N content. When
cow dung was added, the final pH for PS 2/1 was 7.28 ± 1.13.
According to the theoretical methane production (Table 2.4), the highest potential
would be achieved by the SS (519 NmL CH4/g VS). Nevertheless, the maximum
biogas production achieved in this study was only 66.2 NmL CH4/g VS (SS digested
with UASB). This represents less than 15% of the theoretical methane production. The

35
theoretical value for methane production is usually higher than the measured
production. This is due to inhibitors in the process and not the total available
compounds for biodegradation. Nevertheless, it still has a potential to be further
explored using pre-treatment options.
2.3.3 Potential energy production
Table 2.8 presents the results of the potential energy production and energy demand
at a kraft pulp mill ETP by the activated sludges aeration system.
Table 2.8 Energy balance
Item Ideal scenario Real scenario
PS SS Total PS SS Total Energy potential from biogas (GJ/d)
2840 1156 3996 111 148 259
Electricity production potential from biogas (MWhel/d)(a)
237 96 333 9 12 21
Energy demand by ETP aeration system (MWhel/d)
– – 92 – – 92
Energy production (%) 257 105 362 10 13 23
Heat production (GJ/d)(b) 1562 636 2198 61 81 142
Heat production (MJ/ADt) 312 127 439 12 16 28 (a)Conversion efficiency of 30%; (b)conversion efficiency of 55%; ADt: air-dried ton of pulp.
Primary and secondary kraft pulp mill sludges have the potential to supply about 23%
of the ETP energy demand by converting the generated biogas into electricity (real
scenario). It would still be possible to recover 28 MJ/ADt of heat. Since modern mills
still require about extra 1200 MJ/ADt of natural gas for the lime kiln unit (Francis et
al., 2002), the produced biogas has the potential to substitute 2.3% of the demanded
fossil fuel.
Although the energy production potential from the anaerobic digestion of kraft pulp
mill sludges still low, it represents a possible route for kraft pulp mills to move towards
sustainability. If all the potential biogas production is explored (ideal scenario), the
mill ETP has the potential to be not only self-sufficient, but also an energy exporter.

36
2.4 Conclusions
• The secondary sludge presented higher methane production potential than
primary sludge and the mixture.
• 1/1 (g VSsubstrate/g VSinoculum) was the best S/I ratio for kraft pulp mill secondary
sludge using inoculum UASB, with a production of 66.2 NmL CH4/g VS in 30
days.
• Cow dung increased the methane production of the primary sludge for S/I =
1/1, but pre-treatment of PS should be tested to make the fibers more available
to microorganisms.
• The highest methane yield from the primary (16.3 NmL CH4/g VS) and
secondary sludges (66.2 NmL CH4/g VS) led to a potential substitution of 23%
of the aeration system electricity demand of a bleached kraft pulp mill ETP.

37
3 BIOGAS PRODUCTION POTENTIAL FROM TERMOPHILIC ANAEROBIC DIGESTION OF KRAFT PULP MILL SLUDGES
“Water and air, the two essential fluids on which all life depends, have become
global garbage cans”
Jacques Yves Cousteau

38
Abstract
Primary and secondary sludges originating from kraft pulp mill effluent treatment
plants represent an environmental challenge. Their final disposal mainly includes
landfill or burning in the mill’s biomass boiler. Seeking energy self-sufficiency and
better environmental outcomes, the pulp industry is looking to develop new waste
management strategies. Biogas production is a millennial technology already applied
in many fields, but still behind in terms of pulp and paper mill sludges. Due to the high
moisture content of sludge, anaerobic digestion shows great potential. This chapter
aimed to study biogas production using kraft pulp mill primary and secondary sludges
under thermophilic conditions, coupling laboratory experiments with mathematical
modeling. Methane production was estimated through the Biochemical Methane
Potential (BMP). The Process Simulation Model developed by Rajendran et al. (2014)
was calibrated for kraft pulp mill sludge based on the BMP results. Cumulative
methane production from the secondary sludge reached 46.9 NmL CH4/g VS in 30
days. Rajendran et al. (2014) model was shown to be suitable for simulating the
methane yield from bleached kraft pulp mill secondary sludge after minor adjustments.
3.1 Introduction
Modeling has been applied to overcome limitations in predicting biogas production in
large scale anaerobic digestion plants. Mathematical models of anaerobic digestion
began to be developed over 50 years ago, however they are still not well assimilated
by engineers or operators. This might be due to (i) a wide variety of anaerobic
digestion models, and (ii) their specificity for a determined feedstock (Batstone et al.,
2002). In addition, the development of modelling is further hampered by complex
microorganism metabolism (Yu et al., 2013).
In 2002, the first comprehensive anaerobic digestion model, ADM1, was developed
by the IWA Anaerobic Digestion Modelling Task Group. The ADM1 considers the
disintegration and hydrolysis, acidogenesis, acetogenesis and methanogenesis steps.
Extra-cellular biochemical reactions follow the first order rate kinetics, and intra-
cellular biochemical reactions follow Monod’s equation. The model also considers

39
inhibition by pH, hydrogen, free ammonia and growth limitation, when inorganic
nitrogen is limited (Batstone et al., 2002).
ADM1 brought important contributions to anaerobic digestion, although it has
limitations and might be difficult to use (Kythreotou et al., 2014). Rajendran et al.
(2014) developed a process simulation model (PSM), using a simpler interface, that
can be run in the software Aspen Plus® (Advanced System for Process Engineering).
The PSM was based on previous anaerobic digestion models, such as the ones
developed by Angelidaki et al. (1999, 1993); Batstone et al. (2002) and Serrano (2011).
The PSM considers two reactors: (a) a stoichiometry reactor, where the hydrolysis
reactions occur; and (b) a continuously stirred tank reactor (CSTR), where the
acidogenesis, acetogenesis and methanogenesis take place. The input parameters
include mass flow, hydraulic retention time and substrate composition (Rajendran et
al., 2014). The reactor’s volume is calculated based on interactions and an initial value
is estimated by the user. The model calculates the final volume based on the Broyden
mass balance convergence.
The main objective of this chapter was to estimate the biogas production potential
from kraft pulp mill primary and secondary sludges and their mixture using the
software Aspen Plus® based on Rajendran et al. (2014) model. The specific objectives
were to (i) adjust the model using results from kraft pulp mill anaerobic digestion
batch assays; (ii) determine the best sludge composition; and (iii) verify the influence
of nitrogen addition in the methane yield.
3.2 Material and methods
The research was carried out in four phases. Phase 1 consisted of characterizing the
substrates (primary and secondary sludges); Phase 2 consisted of carrying out
anaerobic digestion batch assays; Phase 3 aimed to adjust the Rajendran et al. (2014)
anaerobic digestion model using the results from Phase 2. Phase 4 included numerical
simulations to estimate the methane production from different sludge compositions
and nitrogen content.

40
3.2.1 Material sampling
Refer to item 2.3.1.
3.2.2 Material characterization
Refer to item 2.3.2.
3.2.3 BMP assays
The Biochemical Methane Potential (BMP) assays were carried out in bottles of 275
mL in triplicate. The headspace volume varied from 255 mL to 225 mL, depending on
the substrate used. The inoculum was prepared by mixing 50% of UASB sludge
enriched with macro- and micronutrients and 50% of cow dung, in VS basis. The
mixture between UASB and cow dung was chosen as inoculum, because the cow dung
is a nitrogen source, suppling the lack of this element in the primary sludge. In addition,
it was not observed a significant decrease in the methane yield for the secondary
sludge when using this type of inoculum.
Each inoculum (UASB and cow dung) was incubated separately at 55°C three days
prior to the assays for acclimatization and reduction of endogenous methane
production. A sample of the acclimatized inoculum was incubated at 35°C to verify if
there was still methane production in the mesophilic state, even after the pre-
incubation period in a thermophilic state.
Three substrates were tested: primary sludge (PS), secondary sludge (SS), and the
mixture (MIX) between them in a 2.5:1 ratio (TS basis). This ratio was chosen based
on the sludge generation of a typical bleached kraft pulp mill. The substrate to
inoculum (S/I) ratio was 2 g VSsubstrate/g VSinoculum. This ratio is more appealing to the
industry when compared to lower ratios. Considering a large scale, the digester would
be fed with higher solids concentration and smaller amount of inoculum. Additionally,
it was not observed a significant decrease in the methane yield when working with 2/1
ration under mesophilic condition.

41
Since substrate and inoculum pHs were already nearly neutral, no pH adjustment was
necessary. Assays containing only inoculum were used as blanks. Methane produced
from the blank assays was subtracted from each sample assay. The prepared BMP
assays were closed with butyl rubber stopper and aluminum seal crimp capes, flushed
with N2 for about 3 min, and incubated at 55 ± 5 °C with shaking at 180 rpm (Shaker
Thoth® model 6440). Methane production was monitored two times a day until the
methane production rate decreased. Subsequently, the monitoring was performed once
a day until stabilized.
Monitoring was carried out manually. First, the pressure generated by the biogas was
measured using the Manometer®, model PM–9100HA. Then, a biogas sample was
collected with a syringe and injected into a gas chromatograph – GC (Shimadzu®,
model 2014/TCD), equipped with thermal conductivity detector – TCD, using N2 as
carrier gas). The volume of methane produced was estimated from the area generated
by the GC. The results were expressed in the standard conditions of temperature and
pressure (275.15 K and 1 atm) as NmL CH4/g VS.
The best cumulative methane yield was fitted to the modified Gompertz model (Eq.
3.1) (Pellera and Gidarakos, 2016; Zwietering et al., 1990).
� = �H���� − expMN<;
OP� λ − � + 1 Eq. (3.1)
where P is the specific cumulative methane yield (NmL CH4/g VS); P0 is the maximum
specific methane yield (NmL CH4/g VS); Rm is the maximum specific methane
production rate (NmL CH4/g VS.d); t is the incubation time (d); λ is the lag phase (d);
and e is the exp(1).
The concentration of acetic acid (HAc), 5-hydroxymethyl-2-furfuraldehyde (HMF)
and 2-furfuraldehyde (FF) after the BMP assays was also determined. Samples from
the digested were prepared by centrifugation (centrifuge excelsa baby I 206) for 30
minutes. The liquid phase was again centrifuged in an Eppendorf (centrifuge 5410),
filtered in a 45 µm membrane and injected in the High Performance Liquid

42
Chromatography (HPLC) according to the conditions described by Baêta et al.
(2016b).
3.2.4 Model adjustments and calibration
Since Aspen Plus® lacks of some component properties, such as for lysine and alanine,
adjustments needed to be made before running the simulations. The lysine heat of
formation (DHFORM) was used for the arginine data and the glycine DHFORM was
used for alanine (Table 3.1). These changes were based on Serrano (2011).
Table 3.1 Adjustment in input properties of Aspen Plus®
Copied from To DHFORM (kcal.mol-1) Lysine Arginine -110,1079583 Glycine Alanine -93,65147607
DHFORM: Heat of formation (at 25°C and 1 atm).
The PSM (Rajendran et al., 2014) was calibrated for the best result achieved in the
BMP assays, i.e., for the bleached kraft pulp mill secondary sludge. The calibration
was performed by changing the fractional conversion of the hydrolysis step until the
simulated methane production was close to the one achieved in the BMP assay. In
order to carry out the simulations, the sludge composition was adjusted, i.e., each
original component value was divided by the total amount of 114%. Thus, the
components (carbohydrates, protein, lipids, ash and water) totaled 100% (Table 3.2).
In addition, the lignin content was included as inert, since it is still not possible to
model the degradation kinetics of the lignin due to its complexity (Serrano, 2011). The
hydraulic retention time (HRT) was set at 20 days, according the BMP assay results,
when the methane production rate decreased significantly.
Table 3.2. Input data for the secondary sludge Parameter Value Composition Original Adjusted
Water (%) 86.23 86.23
Cellulose (% TS) 31.24 27.40
Hemicellulose (% TS) 5.52 4.84
Protein (% TS) 30.31 26.59
Lipids (% TS) 3.98 3.49
Inert (% TS) 42.96 37.68
Total (% TS) 114.01 100.00

43
CSTR: continuously stirred tank reactor; HRT: hydraulic retention time; TS: total solids.
3.2.5 Numerical simulations
From the calibrated model, two numerical simulations were carried out, (i) varying
the sludge composition; and (ii) adding nitrogen.
(i) Varying the sludge composition. In order to simulate the methane yield as a
function of the sludge composition, extreme vertices design of the mixture experiment
was used. The extreme vertices design is used when there are factors in constraint
regions of mixture experiments (McLean and Anderson, 1966). In a mixture
experiment, the response surface is a function of the proportion of each component of
the mixture, in that their sum is equal to one (Myers and Montgomery, 2005). Extreme
vertices design refers to mixture experiments that are formed by a constrained region,
with upper- and lower-bound constraints (Myers and Montgomery, 2005). Since
carbohydrates, proteins and lipids represent the major organic matter contributors for
biogas production, these three components were chosen to be varied. The widest
possible range of each component was set. As a first effort, the range of 0 to 1 was
simulated; nevertheless, no polynomial model could be statistically fitted. In addition,
the simulation model resulted in errors when some components were set at 0 or 1.
Therefore, the lower- and upper-bound constraints of each factor were set to 0.001 and
0.900. Ash and moisture contents were fixed at 15% (in dry mass basis) and 85% (in
wet mass basis). The HRT was set to 20 days. Nineteen random combinations were
generated using the software Minitab 17®. Each one of the combinations was
simulated in Aspen Plus® using the Rajendran et al. (2014) model after calibration,
generating the response, i.e., the methane production (Nm3. t-1 VS). The generated data
was tested in different polynomial models using the software Statistica 2015®. The
best model was chosen based on the analysis of variance (ANOVA, test F, α of 0.05),
with the higher adjusted R2 and least complexity.
continuation
Parameter Value
HRT (d) – 20
Sludge flow rate (t/d) – 500
Initial CSTR value (m3) – 20000

44
(ii) Adding nitrogen.
Since pulp mill sludges lack nitrogen content, a sensitivity analysis was performed in
the calibrated model, considering the sludge composition of this study. Nitrogen
addition was simulated in form of NH3, which can be obtained from urea. The
simulation was carried out using to the sensibility analysis tool available in Aspen
Plus®.
3.3 Results and discussion
3.3.1 Material characteristics and BMP assays
Table 3.3 presents the results of the sludge and inoculum characteristics.
Table 3.3 Characteristics of the substrates (PS, SS and MIX) and inoculum (UASB + cow dung)
Parameter PS SS MIX Inoculum TS (%, w.b.) 31.99 ± 0.23 13.77 ± 0.04 26.79 8.00
VS (%, w.b.) 31.56 ± 0.22 11.73 ± 0.03 25.90 5.84
pH 8.30 ± 0.19 6.42 ± 0.31 8.25 7.05
COD (mg O2/g TS) 1217 ± 10.3 1236 ± 8.9 1223 –
Cellulose (%TS) 81.03 ± 0.28 31.24 ± 0.12 66.80 –
Hemicellulose (%TS) 12.03 ± 0.14 5.52 ± 0.06 10.17 –
Lignin (%TS) 5.71 ± 0.24 30.46 ± 0.22 12.78 –
Proteins (%TS) 0.38 ± 0.01 30.31 ± 0.02 8.93 –
Oil and grease (%TS) 3,74 ± 0,15 3.98 ± 0.07 3.81 –
Ash (%TS) 0.59 ± 0.02 12.50 ± 0.20 3.99 –
C (%TS) 44.10 ± 0.10 45.20 ± 0.20 44.41 38.00
H (%TS) 6.04 ± 0.04 5.83 ± 0.09 5.98 5.20
N (%TS) 0.06 ± 0.01 4.85 ± 0.02 1.43 3.00
S (%TS) 0.40 ± 0.01 1.82 ± 0.01 0.81 1.20
O (%TS) 48.80 ± 0.05 29.80 ± 0.15 34.86 24.2
C/N 689 9 31 13
Empirical formula C804H1321O667NS3 C11H17O5N C36H58O27N –
TMP (NmL CH4/g VS) 417 519 443 –
COD: chemical oxygen demand; PS: primary sludge; SS: secondary sludge; MIX: PS + SS (2.5:1, TS basis); TMP: theoretical methane potential; TS: total solids; VS: volatile solids; w.b.: wet mass basis.
Figure 3.1 presents the cumulative methane yield for each assay (PS, SS and MIX).

45
Figure 3.1 Cumulative methane yield per g VS added from the BMP assays for PS, SS and MIX. Figure 3.2 presents the results of the best methane yield (secondary sludge) fitted to
the modified Gompertz model.
Figure 3.2 Cumulative methane production per g VS added from the best BMP assay (secondary sludge) fitted to the modified Gompertz model and its parameters (P0 – maximum specific methane yield; Rm – maximum specific methane production rate; t – incubation time; and λ – lag phase; E – normalized root mean square error).
The fitted model (modified Gompertz) presented a R2 of 0.9949 and a normalized root
mean square error (NRMSE) of 2.53%, describing well the methane yield of the pulp
mill secondary sludge. In fact, other studies also using lignocellulosic substrates,
reported good adjustment for this model (Baêta et al., 2016a, 2016b). The maximum

46
specific methane production rate was 3.45 NmL CH4/g VS.d and the lag phase was
extended to almost 4 days, which could be reduced by adequate pre-treatment (Bayr
et al., 2013).
Table 3.4 presents a summary of all BMP assays, with the cumulative methane yield
of each assay, stabilization time, final pH and concentration of HAc, HMF and FF in
the digested.
Table 3.4. BMP assays results
Substrate Methane yield Digested characteristics NmL CH4/g VS pH HAc (mg/L) HMF (mg/L) FF (mg/L)
PS 3.5 ± 0.5 5.2 ± 0.3 7081 ± 18 27 ± 0 0 ± 0
SS 46.9 ± 9.3 8.3 ± 0.0 1763 ± 5 7 ± 3 0 ± 0
MIX 3.3 ± 1.3 5.1 ± 0.1 10232 ± 184 3 ± 1 0 ± 0
PS: primary sludge; SS: secondary sludge; MIX: PS + SS (2.5:1 ratio, in TS basis); TS: total solids; VS: volatile solids; HAc: acetic acid; HMF: 5-hydroxymethyl-2-furfuraldehyde; FF: 2-furfuraldehyde.
According to Table 3.3, PS, SS and MIX has the maximum methane production
potential of 417, 519 and 443 NmL/g VS, respectively. The best result obtained by
this study was using the secondary sludge, where the methane production represented
only 9% of its potential. The main factor that could explain the low methane
production was the sludge lignocellulosic composition that confers low
biodegradability on the pulp sludges.
Both PS and MIX did not succeed in producing biogas (Table 3.4), and the final pH
was acidic due to the accumulation of acetic acid, inhibiting the methanogenic bacteria.
This is related to the high S/I applied, since the thermophilic condition is more
sensitive. Although the acetic acid is an important intermediate for CH4 production
(Gulhane et al., 2017), at high concentrations it inhibits the process. Wang et al. (2009)
reported that a concentration of 2,400 mg/L of acetic acid did not lead to significant
inhibition. However, at 13,000 mg/L, methanogenic inhibition in a two-phase
anaerobic digestion of municipal solid waste in a mesophilic condition was observed
(Viéitez and Ghosh, 1999).

47
The low buffer capacity of pulp mill primary sludge is related to its low nitrogen
content (Procházka et al., 2012). Nevertheless, even with the addition of cow dung as
a nitrogen source in this study, it was still not enough to guarantee pH stabilization.
The inoculum used was collected from a mesophilic anaerobic digester. Nevertheless,
the inoculum incubated in mesophilic condition after its pre-incubation in
thermophilic condition achieved a maximum accumulated methane production of 0.02
± 0.01 NmL CH4/g VS at the same time as the thermophilic assays, indicating that the
pre-incubation of the inoculum for 3 days at 55°C was enough to guarantee that only
thermophilic bacteria acted in the BMP assays.
HMF and FF are toxic elements that impair anaerobic digestion (Baêta et al., 2016b).
Inhibition caused by HMF at 800 mg/L under thermophilic conditions was observed
(Ghasimi et al., 2016). However, in the present study, there was no accumulation of
FF and the final HMF concentration was very low (smaller than 30 mg/L).
Table 3.5 presents the BMP results from the literature for pulp and paper mill sludges
and other lignocellulosic substrates.
Table 3.5. BMP assays in thermophilic conditions from literature for kraft pulp and paper mill sludges and similar substrate
Substrate S/I ratio HRT (d) CH4 yield (NmL/g VS) Ref. PS 1.1 – 1.3 42 230 ± 20 Bayr and Rintala (2012)
SS 2 30 46.90 ± 9.33 This study
SS 2 20–23 67 Bayr et al. (2013)
SS 1.1 – 1.3 42 100 ± 10 Bayr and Rintala (2012)
Paper tube residual
– 56 238 Teghammar et al. (2010)
HTR: hydraulic retention time; PS: primary sludge; SS: secondary sludge; S/I = substrate/inoculum ratio in VS basis; VS: volatile solids.
A higher methane yield was achieved by Bayr and Rintala (2012) when compared to
this study. The major reason was probably due to the type of inoculum used. While
Bayr and Rintala (2012) worked with an inoculum originated from a biogas plant
already adapted for thermophilic conditions, this study worked with an adapted
inoculum from a mesophilic anaerobic reactor.

48
According to Stoica et al. (2009), the pulp mill primary sludge should be used as paper
feedstock rather than energy production due to its high cellulose fiber content. In fact,
the PS anaerobic digestion showed the inability of biogas production from raw primary
kraft pulp mill sludge. On the other hand, the secondary sludge presented biogas
production potential, agreeing with results from Stoica et al. (2009). The high moisture
content of the SS diminishes its energy capacity through incineration, so that the
energy required for drying is higher than that released during burning. Therefore, in
terms of energy production, the anaerobic digestion of secondary sludge seems to be
more advantageous than incineration.
3.3.2 Model calibration
Table 3.6 shows the adjusted hydrolysis fractional conversion factors of each
component for bleached kraft pulp mill secondary sludge compared to the fractional
conversions used by Rajendran et al. (2014).
Table 3.6. Fractional conversion adjustments for the hydrolysis step
Reactant (product) Hydrolysis fractional conversion
This study Rajendran et al. (2014) Carbohydrates
Cellulose (Dextrose) 0.2 0.4 ± 0.1 Cellulose (Ethanol) 0.4 0.4 ± 0.1
Hemicellulose (Ac. Acetic) 0.5 0.5 ± 0.2
Lipids
Tripalm 0.1 0.5 ± 0.3
Triolein 0.1 0.5 ± 0.2
Palmito-olein 0.1 0.6 ± 0.2
Palmito-linolein 0.1 0.6 ± 0.2
Soluble protein 0.1 0.5 ± 0.2
Rajendran et al. (2014) originally proposed higher fractional conversion for hydrolysis.
However, the authors simulated the methane yield from substrates, which are easily
biodegradable, such as cow dung and food waste. By contrast, this study used
lignocellulosic material as substrates that has a low biodegradability (Bayr et al., 2013;
Kamali et al., 2016).

49
Table 3.7 presents the simulated methane yield for the SS after adjustments, compared
to the results achieved in the BMP test considering an HRT of 20 days.
Table 3.7. Results of the simulation after adjustments compared to the BMP assay
Substrate Methane yield (NmL CH4/g VS)
Error (%) Laboratory Simulation
Secondary sludge 43.30 42.82 1.11
The methane yield obtained by the simulation after the model calibration was similar
to the results achieved in the laboratory, demonstrating that the model is suitable for
predicting the methane yield of bleached kraft pulp mill secondary sludge after minor
adjustments. Rajendran et al. (2014) also obtained excellent simulation results, having
a minimum error of 0.3% when simulating the anaerobic digestion of cow dung and a
maximum error of 12.4% for municipal solids waste.
3.3.3 Numerical simulations
Table 3.8 presents the results of the numerical simulations, i.e., the methane yield as
a function of the substrate composition (carbohydrates, lipids and proteins).
Table 3.8 Results of the mixture experiment design. Values in italics indicate that simulations occurred with warnings, i.e., there was lack of nitrogen in some reactions. Values in bold indicate the sludge composition for the highest methane yield
Treatment Sludge composition (fraction) Methane yield
Carbohydrates Lipids Protein Nm3 CH4/t VS 1 0.9000 0.0010 0.0990 6.45
2 0.0010 0.9000 0.0990 83.23
3 0.0990 0.0010 0.9000 31.65
4 0.0010 0.0990 0.9000 32.44
5 0.0990 0.9000 0.0010 0.00
6 0.9000 0.0990 0.0010 0.03
7 0.0010 0.4995 0.4995 60.58
8 0.4995 0.0010 0.4995 50.24
9 0.4995 0.4995 0.0010 0.00
10 0.9000 0.0500 0.0500 2.12
11 0.0500 0.9000 0.0500 0.00
12 0.0500 0.0500 0.9000 33.50
13 0.3333 0.3333 0.3333 75.13
14 0.6167 0.1672 0.2162 71.65
15 0.1672 0.6167 0.2162 95.38

50
continuation
Treatment Sludge composition (fraction) Methane yield
Carbohydrates Lipids Protein Nm3 CH4/t VS
16 0.2162 0.1672 0.6167 53.10
17 0.1672 0.2162 0.6167 55.35
18 0.2162 0.6167 0.1672 97.90 19 0.6167 0.2162 0.1672 76.52
Table 3.9 presents the statistical analysis of the numerical simulations fitted to
different models: linear, quadratic, special cubic and cubic.
Table 3.9. Analysis of variances of the models (only the main parameters are shown; sum of squares, degrees of freedom, and mean square were omitted). Values in bold indicate the significant models (p-value < 0.05)
Model F p-value R2 R2 adjusted Linear 0.873862 0.436333 0.098476 0.000000 Quadratic 5.379675 0.012525 0.5978 0.443103 Special cubic
2.332148 0.152645 0.663244 0.494866
Cubic 5.524941 0.019847 0.8815 0.762985
Figure 3.3 and Figure 3.4 present the methane yield response surface as a function of
the sludge composition (carbohydrates, lipids and proteins) fitted to the quadratic
model. The data used to fit the model are presented in Table 3.8.
Figure 3.3 Trace plot of expected responses. The x-axis is represented in terms of pseudo-components, i.e., the lower and upper limits previously set at 0.001 and 0.900 to each component were re-scaled to 0 and 1 for graphical representation.

51
Figure 3.4. Response surface (methane yield, Nm3/t VS) as a function of each component (carbohydrates, proteins and lipids). The axes are represented in terms of pseudo-components, i.e., the lower and upper limits previously set at 0.001 and 0.900 to each component were re-scaled to 0 and 1 for graphical representation.
All components have a methane production peak. Proteins are a nitrogen source, which
is an essential component for anaerobic digestion (Procházka et al., 2012).
Nevertheless, at high concentrations, nitrogen in the form of ammonia inhibits the
anaerobic digestion process (Hansen et al., 1998; Procházka et al., 2012).
High lipid content could lead to an inhibition of microorganisms, because long-chain
fatty acids (LCFA), originated from lipid breakdown, results in changes in cell
membrane permeability. Furthermore, they can act as a barrier against other substrate
bioavailability (Cirne et al., 2007; Lesteur et al., 2010; Nieman, 1954). However, at
low concentrations, LCFA can also interfere on bacterial growth (Nieman, 1954). In
fact, Rajendran et al. (2014) model considers inhibition related to LCFA.
The best sludge composition appeared to be 21.6% carbohydrates, 61.7% lipids and
16.7% proteins (Table 3.8). However, pulp mill sludges have high content of fibers
(cellulose and hemicellulose), and low lipid content. To compensate the lack of
nutrients, co-digestion of pulp mill sludges with other substrates has also been
investigated (Kamali et al., 2016). Lin et al. (2012) reported methane yield of 256 mL
CH4/g VS when co-digesting pulp and paper mill sludge with food waste.

52
In order to evaluate the interactions between sludge components (carbohydrates,
proteins and lipids), an analysis of variance of the components was carried out
(Table 3.10).
Table 3.10. Analysis of variance for the pulp mill secondary sludge components, considering the quadratic model. Values in bold indicate the statistically significant components (p-value < 0.05)
Component Coeff Sdt Error t-value p-value A (Carbohydrates) -14.3736 21.0625 -0.682424 0.506949
B (Lipids) 13.1668 21.0625 0.625130 0.542704
C (Proteins) -3.8314 21.0625 -0.181908 0.858461
AB 116.9740 109.4641 1.068606 0.304689 AC 281.9146 109.4641 2.575407 0.023056 BC 327.9047 109.4641 2.995547 0.010327
Coeff.: coefficient; Sdt: standard error.
Table 3.10 shows that there was interaction between components A (carbohydrates)
and C (proteins), and components B (lipids) and C (proteins). There was no interaction
between (A) carbohydrates and (B) lipids, which is understandable, since biogas
production depends on microorganism growth and the lack of nitrogen would impair
the microbial metabolism. In fact, except for Treatment 2, which had high lipids
content, all treatments with low protein content (1, 2, 5, 6, 9, 10, and 11) led to
insignificant or no methane yield.
Since low nitrogen content is one of the factors that restrains biogas production from
pulp and paper mill sludges, an analysis of sensitivity was carried out, considering the
addition of nitrogen in the form of NH3 in each substrate (Figure 3.5).
Figure 3.5. Sensitivity analysis of nitrogen addition in the form of NH3 (mass of NH3/ mass of wet sludge), considering sludge composition from this study.

53
Methane yield increased by increasing the nitrogen content for PS and MIX. On the
other hand, methane yield decreased for SS with the addition of nitrogen. In fact, SS
is characterized by a low C/N ratio (Table 3.3), which means that additional carbon
sources are required to counterbalance the excess nitrogen. An excessive amount of
nitrogen may lead to an inhibitory effect, decreasing the methane yield (Hansen et al.,
1998; Procházka et al., 2012).
Although both PS and MIX increased the methane production with up to 2% added
NH3, it is still considerably below their maximum potentials, which are 416 and 443
NmL CH4/g VS, respectively. While the primary sludge is rich in cellulose, the
secondary sludge is mainly composed of lignin and microbial cells. Both sludges have
a high lignocellulosic content, which makes them resistant to biodegradation.
Therefore, it is worth considering pre-treatment options to disrupt cells and open
structures facilitating microbial degradation (Bayr et al., 2013; Teghammar, 2013).
Pulp and paper mills still rely on fossil fuels to complement energy requirements.
Modern kraft pulp mills may require additional 1.2 GJ/ADt of natural gas for the lime
kiln unit (Francis et al., 2002). The development of more efficient biodegradation
techniques of kraft pulp mill sludges could enhance methane yields, making energy
production through sludge anaerobic digestion viable. On the other hand, the high
costs associated with pre-treatment technologies might impair the implementation of
large scale biogas production.
3.4 Conclusions
• The highest methane yield was achieved by the secondary sludge (46.9 NmL
CH4/g VS in 30 days). Neither PS nor MIX succeeded in producing methane
due to the high recalcitrant lignocellulosic content and low nitrogen content.
• The applied anaerobic digestion model developed by Rajendran et al. (2014)
was applicable for kraft pulp mill sludges after adjustments in the hydrolysis
fractional conversion. The modified Gompertz model presented significant
adjustment for the secondary sludge, with a maximum methane production rate
of 3.45 NmL CH4/g VS.d.

54
• From the numerical simulations, the best sludge composition was found to be
21.62% carbohydrates, 61.67% lipids and 16.72% proteins.
• The numerical simulations showed that added nitrogen increased the methane
yield for PS and MIX until 2% of NH3, but decreased it for SS.

55
4 FINAL CONSIDERATIONS
Anaerobic digestion is a millennial technology, however its application to pulp mill
sludges is still in the early stages. Due to environmental regulations and energy price
increases, biogas production from pulp mill sludges has turned a promising alternative.
Studies have focused on increasing sludge biodegradability, nevertheless pre-
treatment might still constitute an impairment for large scale AD application due to
the high costs involved.
This study showed that the biogas produced from the anaerobic digestion of the
primary and secondary sludges under mesophilic conditions has the potential to
substitute 23% of the energy demand of a kraft pulp mill ETP. With regard to the
primary sludge and the mixture, both under mesophilic and thermophilic conditions,
their methane productions were negligible. Pre-treatment options must be considered
to increase substrate biodegradability.
From the sludge composition, it was possible to estimate biogas production through
modeling tools, which have been applied to overcome limitations in predicting biogas
production on a large scale. Modeling saves time and does not require huge infra-
structure. However, the prediction of biogas through modeling is still under
development due to the complexity of the microbial processes. The anaerobic
digestion model developed by Rajendran et al. (2014), however, appeared to be
applicable for kraft pulp mill sludges after minor adjustments.
In order to increase the biogas production efficiency from pulp mill sludges, it is
recommended to:
• Test different UASB to cow dung ratios when working under thermophilic
condition, in order to guarantee the buffer capacity of the system;
• Test a S/I ratio of 1/1 under thermophilic condition;
• Test pre-treatment options to increase sludge biodegradability;
• Test the anaerobic digestion in two-stages;
• Perform an economic analysis for the highest methane yield achieved.

56
REFERENCES
Abatzoglou, N., Boivin, S., 2009. A review of biogas purification processes. Biofuels,
Bioprod. Biorefining 42–71. doi:10.1002/bbb
Andrić, P., Meyer, A. S., Jensen, P. A., Dam-Johansen, K., 2010. Reactor design for
minimizing product inhibition during enzymatic lignocellulosic hydrolysis: I.
Significance and mechanism of cellobiose and glucose inhibition on cellulolytic
enzymes. Biotechnology Advances 28, 308–324.
http://dx.doi.org/10.1016/j.biotechadv.2010.01.003
ANEEL, 2016. Agência Nacional de Energia Elétrica. Banco de informações de
geração
<http://www.aneel.gov.br/aplicacoes/capacidadebrasil/OperacaoCapacidadeBra
sil.cfm> (accessed 2.29.16).
ANEEL, 2015. Resolução normativa n. 687, de 24 de novembro de 2015. Altera a
Resolução Normativa no 482, de 17 de abril de 2012, e os Módulos 1 e 3 dos
Procedimentos de Distribuição – PRODIST.
Angelidaki, I., Ellegaard, L., Ahring, B.K., 1999. A comprehensive model of
anaerobic bioconversion of complex substrates to biogas. Biotechnol. Bioeng. 63,
363–372. doi:10.1002/(SICI)1097-0290(19990505)63:3<363::AID-
BIT13>3.0.CO;2-Z
Angelidaki, I., Ellegaard, L., Ahring, B.K., 1993. A mathematical model for dynamic
simulation of anaerobic digestion of complex substrates: Focusing on ammonia
inhibition. Biotechnol. Bioeng. 42, 159–166. doi:10.1002/bit.260420203
ANP, 2015. Agência Nacional do Petróleo Gás Natural e Biocombustíveis. Resolução
ANP No 8 DE 30/01/2015. Estabelece a especificação do Biometano contida no
Regulamento Técnico ANP no 1/2015, parte integrante desta Resolução
<https://www.legisweb.com.br/legislacao/?id=280722> (accessed 2.23.17).
APHA, 2011. American Public Health Association. Standard methods for the
examination of water and wastewater, 21st ed.
Baêta, B.E.L., Lima, D.R.S., Adarme, O.F.H., Gurgel, L.V.A., Aquino, S.F. de, 2016a.
Optimization of sugarcane bagasse autohydrolysis for methane production from
hemicellulose hydrolyzates in a biorefinery concept. Bioresour. Technol. 200,
137–146. doi:10.1016/j.biortech.2015.10.003

57
Baêta, B.E.L., Lima, D.R.S., Filho, J.G.B., Adarme, O.F.H., Gurgel, L.V.A., Aquino,
S.F.D., 2016b. Evaluation of hydrogen and methane production from sugarcane
bagasse hemicellulose hydrolysates by two-stage anaerobic digestion process.
Bioresour. Technol. 218, 436–446. doi:10.1016/j.biortech.2016.06.113
Batstone, D.J., Keller, J., Angelidaki, I., Kalyuzhnyi, S.V., Pavlostathis, S.G., Rozzi,
A., Sanders, W.T.M., Siegrist, H., Vavilin, V.A., 2002. The IWA Anaerobic
Digestion Model No 1 (ADM 1). Water Sci. Technol. 45 (10), 65–73.
Bayr, S., Kaparaju, P., Rintala, J., 2013. Screening pretreatment methods to enhance
thermophilic anaerobic digestion of pulp and paper mill wastewater treatment
secondary sludge. Chem. Eng. J. 223, 479–486. doi:10.1016/j.cej.2013.02.119
Bayr, S., Rintala, J., 2012. Thermophilic anaerobic digestion of pulp and paper mill
primary sludge and co-digestion of primary and secondary sludge. Water Res. 46,
4713–4720. doi:10.1016/j.watres.2012.06.033
Bley Jr., C., 2015. Biogás A Energia Invisível, 2ed ed, CIBiogás, São Paulo.
Brasil, 2010. Lei n. 12,305/2010. Institui a Política Nacional de Resíduos Sólidos;
altera a Lei no 9.605, de 12 de fevereiro de 1998; e dá outras providências.
Brasília: Diário Oficial da União, 2 Aug. 2010.
Buchanan, R.L., Klawitter, L.A., 1991. Effect of temperature history on the growth of
Listeria monocytogenes Scott A at refrigeration temperatures. Int. J. Food
Microbiol. 12, 235–245. doi:10.1016/0168-1605(91)90074-Y
CANMET, 2005. Pulp and Paper Sludge to Energy – Preliminary Assessment of
Technologies apud Meyer, T., Edwards, E.A., 2014. Anaerobic digestion of pulp
and paper mill wastewater and sludge. Water Res. 65, 321–349.
doi:10.1016/j.watres.2014.07.022.
Cano, R.; Pérez-Elvira, S.I.; Fdz-Polanco, F., 2015. Energy feasibility study of sludge
pretreatments: A review. Applied Energy 149, 176–185.
http://dx.doi.org/10.1016/j.apenergy.2015.03.132
Chen, Y., Cheng, J.J., Creamer, K.S., 2008. Inhibition of anaerobic digestion process:
A review. Bioresour. Technol. 99, 4044–4064.
doi:10.1016/j.biortech.2007.01.057
CII, 2009. Confederation of Indian Industry. National & International Best Practices
Manual Pulp & Paper Industry.
Cirne, D.G., Paloumet, X., Björnsson, L., Alves, M.M., Mattiasson, B., 2007.

58
Anaerobic digestion of lipid-rich waste-Effects of lipid concentration. Renew.
Energy 32, 965–975. doi:10.1016/j.renene.2006.04.003
D’Almeida, M.L.O., Koga, M.E.T., Ferreira, D.C., Pigozzo, R.J.B., Toucini, R., Reis,
H.M. dos, Viana, E.F., 2013. Celulose. São Paulo.
Ekstrand, E.-M., Karlsson, M., Truong, X.-B., Björn, A., Karlsson, A., Svensson, B.H.,
Ejlertsson, J., 2016. High-rate anaerobic co-digestion of kraft mill fibre sludge
and activated sludge by CSTRs with sludge recirculation. Waste Manag. 56, 166–
172. doi:10.1016/j.wasman.2016.06.034
Elliott, A., Mahmood, T., 2007. Pretreatment technologies for advancing anaerobic
digestion of pulp and paper biotreatment residues. Water Res. 41, 4273–4286.
doi:10.1016/j.watres.2007.06.017
ENDS, 2016. Waste & Bioenergy. Finland: World first pulp sludge-to-biogas plant
revealed. <http://www.endswasteandbioenergy.com/article/1383937/finland-
world-first-pulp-sludge-to-biogas-plant-revealed> (accessed 2.23.17).
EPA, 2004. United States Environmental Protection Agency. METHOD 9045D: Soil
and waste pH.
EPE, 2016. Empresa de Pesquisa Energética. Consumo de eletricidade recua 1.5% em
março. Resenha mensal do mercado de energia elétrica, n. 103.
EPE, 2014. Empresa de Pesquisa Energética. Balanço Energético Nacional 2014. Ano
Base 2013. Rio de Janeiro: EPE.
Eskicioglu, C., Ghorbani, M., 2011. Effect of inoculum/substrate ratio on mesophilic
anaerobic digestion of bioethanol plant whole stillage in batch mode. Process
Biochem. 46, 1682–1687. doi:10.1016/j.procbio.2011.04.013
EU, 2017. European Comission. Environment. Waste
<http://ec.europa.eu/environment/waste/landfill_index.htm> (accessed 2.2.17).
European Comission, 2014. Official Journal of the European Union. L 284/76.
Establishing the best available techniques (BAT) conclusions, under Directive
2010/75/EU of the European Parliament and of the Council, for the production
of pulp, paper and board. Brussels.
FAO, 2016. Food and Agriculture Organization of the United Nations. FAOSTAT.
<http://www.fao.org/faostat/en/#data/FO/visualize> (accessed 1.11.17).
Ferreira, L.C.G., 2013. Evaluación de la Biodegradabilidad Anaerobia de Residuos
Orgánicos Pre-Tratados Térmicamente. Thesis (PhD). Universidad de Vallalodid,

59
Spain. 363p.
Francis, D.W., Towers, M.T., Browne, T.C., 2002. Energy Cost Reduction in the Pulp
and Paper Industry – An Energy Benchmarking Perspective. Pulp and paper
technical association of Canada, Montréal.
Fricke, K., Santen, H., Wallmann, R., Hüttner, A., Dichtl, N., 2007. Operating
problems in anaerobic digestion plants resulting from nitrogen in MSW. Waste
Manag. 27, 30–43. doi:10.1016/j.wasman.2006.03.003
Ghasimi, D.S.M., Aboudi, K., de Kreuk, M., Zandvoort, M.H., van Lier, J.B., 2016.
Impact of lignocellulosic-waste intermediates on hydrolysis and methanogenesis
under thermophilic and mesophilic conditions. Chem. Eng. J. 295, 181–191.
doi:10.1016/j.cej.2016.03.045
Goortani, B.M., Mateos-Espejel, E., Paris, J., 2010. Integration of a cogeneration unit
into a kraft pulping process. Appl. Therm. Eng. 30, 2724–2729.
doi:10.1016/j.applthermaleng.2010.07.026
Grace, T.M., Malcolm, E.W., Kocurek, M.J., 1989. Alkaline Pulping (Pulp and Paper
Manufacture Series), 3rd ed. Tappi Press.
Gulhane, M., Pandit, P., Khardenavis, A., Singh, D., Purohit, H., 2017. Study of
microbial community plasticity for anaerobic digestion of vegetable waste in
Anaerobic Baffled Reactor. Renew. Energy 101, 59–66.
doi:10.1016/j.renene.2016.08.021
Hagelqvist, A., 2013. Batchwise mesophilic anaerobic co-digestion of secondary
sludge from pulp and paper industry and municipal sewage sludge. Waste Manag.
33, 820–824. doi:10.1016/j.wasman.2012.11.002
Hansen, K.H., Angelidaki, I., Ahring, B.K., 1998. Anaerobic digestion of swine cow
dung: Inhibition by ammonia. Water Res. 32, 5–12. doi:10.1016/S0043-
1354(97)00201-7
Holik, H., 2006. Handbook of Paper and Board.
Holliger, C., Alves, M., Andrade, D., Angelidaki, I., Astals, S., Baier, U., Bougrier,
C., Buffiere, P., Carballa, M., de Wilde, V., Ebertseder, F., Fernandez, B., Ficara,
E., Fotidis, I., Frigon, J.-C., de Laclos, H.F., Ghasimi, D.S.M., Hack, G., Hartel,
M., Heerenklage, J., Horvath, I.S., Jenicek, P., Koch, K., Krautwald, J., Lizasoain,
J., Liu, J., Mosberger, L., Nistor, M., Oechsner, H., Oliveira, J. V., Paterson, M.,
Pauss, A., Pommier, S., Porqueddu, I., Raposo, F., Ribeiro, T., Rusch Pfund, F.,

60
Stromberg, S., Torrijos, M., van Eekert, M., van Lier, J., Wedwitschka, H.,
Wierinck, I., 2016. Towards a standardization of biomethane potential tests.
Water Sci. Technol. 1–9. doi:10.2166/wst.2016.336
IBÁ, 2016. Indústria Brasileira de Árvores. Statistics of the Brazilian Tree Industry.
IEA, 2015. IEA Bioenergy Task 37 Country Reports Summary 2014. IEA Bioenergy.
International Paper, 2015. Caldeira de Biomassa: autossuficiência energética e
sustentabilidade do negócio. Prêmio FIESP - Mérito Ambiental 2015.
Kamali, M., Gameiro, T., Costa, M.E. V, Capela, I., 2016. Anaerobic digestion of pulp
and paper mill wastes - An overview of the developments and improvement
opportunities. Chem. Eng. J. 298, 162–182. doi:10.1016/j.cej.2016.03.119
Kepp, U., Machenbach, I., Weisz, N., Solheim, O.E., 2000. Enhanced stabilization of
sewage sludge through thermal hydrolysis e three years of experience with full
scale plant. Water Sci. Technol. 42 (9), 89–96. apud Meyer, T., Edwards, E.A.,
2014. Anaerobic digestion of pulp and paper mill wastewater and sludge. Water
Res. 65, 321–349. doi:10.1016/j.watres.2014.07.022
Khalid, A., Arshad, M., Anjum, M., Mahmood, T., Dawson, L., 2011. The anaerobic
digestion of solid organic waste 31, 1737–1744.
doi:10.1016/j.wasman.2011.03.021
Khanal, S.K., 2008. Anaerobic Biotechnology for Bioenergy Production Principles
and Applications. John Wiley & Sons, Inc.
Kyllönen, H., 1986. Treatment of waste sludges from the pulp and paper industry.
VTT Research Notes 637, Technical Research Centre of Finland, Espoo, Finland.
Kyllönen, H.L., Lappi, M.K., Thun, R.T., Mustaranta, A.H., 1988. Treatment and
characterization of biological sludges from the pulp and paper industry. Water
Sci. Technol. 20, 183–192.
Kythreotou, N., Florides, G., Tassou, S.A., 2014. A review of simple to scientific
models for anaerobic digestion. Renew. Energy 71, 701–714.
doi:10.1016/j.renene.2014.05.055
Larsson, M., Jansson, M., Grönkvist, S., Alvfors, P., 2015. Techno-economic
assessment of anaerobic digestion in a typical Kraft pulp mill to produce
biomethane for the road transport sector. J. Clean. Prod. 104, 460–467.
doi:10.1016/j.jclepro.2015.05.054
Lehto, J., 2009. Characterisation of waste activated and tertiary sludges from forest
61
industry. Thesis (Master's). University of Jyväskylä, Finalnd. 125p.
Lesteur, M., Bellon-Maurel, V., Gonzalez, C., Latrille, E., Roger, J.M., Junqua, G.,
Steyer, J.P., 2010. Alternative methods for determining anaerobic
biodegradability: A review. Process Biochem. 45, 431–440.
doi:10.1016/j.procbio.2009.11.018
Li, Y., Park, S. Y., Zhu, J., 2011. Solid-state anaerobic digestion for methane
production from organic waste. Renew. Sustainable Energy Rev. 15, 821–826.
http://dx.doi.org/10.1016/j.rser.2010.07.042
Lin, Y., Wang, D., Li, Q., Xiao, M., 2012. Mesophilic anaerobic co-digestion of pulp
and paper sludge and food waste for methane production in a fed- batch basis.
Bioresour. Technol. 33, 2627–2633. doi:10.1016/j.biortech.2010.10.114
Macedo, J.C.F., 2006. Análise térmica e ambiental da queima do lodo primário da
fabricação de papel e celulose em caldeira de biomassa à grelha. Thesis (Master's).
Universidade Federal de Itajubá, Brazil. 219p.
Monlau, F., Sambusiti, C., Barakat, A.; Quéméneur, M.; Trably, E., Steyer, J. -P.,
Carrère, H., 2014. Do furanic and phenolic compounds of lignocellulosic and
algae biomass hydrolyzate inhibit anaerobic mixed cultures? A comprehensive
review. Biotechnology Advances. 32, 934–951.
http://dx.doi.org/10.1016/j.biotechadv.2014.04.007
Manesh, M.E., 2012. Utilization of Pulp and Paper Mill Sludge as Filler in Nylon
Biocomposite Production. Thesis (PhD). University of Toronto, Canada. 151p.
McLean, R.A., Anderson, V.L., 1966. Extreme vertices design of mixture experiments.
Technometrics 8, 447–454.
Mesfun, S., Toffolo, A., 2013. Optimization of process integration in a Kraft pulp and
paper mill – Evaporation train and CHP system 107, 98–110.
Metsä Group, 2016. Metsä Group’s bioproduct concept is progressing.
<http://www.metsagroup.com/en/media/Pages/Case-Metsä-Groups-bioproduct-
concept-is-progressing.aspx> (accessed 6.1.16).
Meyer, T., Edwards, E.A., 2014. Anaerobic digestion of pulp and paper mill
wastewater and sludge. Water Res. 65, 321–349.
doi:10.1016/j.watres.2014.07.022
Migneault, S., 2011. Recylage des résidus papetiers pour la production de panneaux
de fibres. Thesis (PhD). Université Laval, Canada. 128p.

62
Ministério das Cidades, 2016a. Barreiras e propostas de soluções para o mercado de
biogás no Brasil/Probiogás. Ministério das Cidades, Deutsche Gesellschaft für
Internationale Zusammenarbeit GmbH (GIZ); autores, Oliver Jende ... [et al.]. –
Brasília, DF: Ministério das Cidades.
Ministério das Cidades, 2016b. Publicações do PROBIOGAS
<http://www.cidades.gov.br/saneamento-
cidades/probiogas/publicacoes/publicacoes-do-probiogas> (accessed 1.3.17).
Moreira, H.C., 2016. Projeto Brasil-Alemanha de Fomento ao Aproveitamento
Energético de Biogás. Avanços e oportunidades. In: 4° Workshop Internacional
sobre Aproveitamento Energético de Biogas de ETEs. Curitiba.
Myers, R.H., Montgomery, D.C., 2005. Response surface methodology: process and
product optimization using designed experiments. John Wiley & Sons Inc, New
York.
Nieman, C., 1954. Influence of trace amounts of fatty acids on the growth of
microorganisms. Bacteriol. Rev. 18, 147–63.
Ojanen, P., 2001. Treatment and utilization of pulp and paper mill sludges and factors
limiting them, Regional Environmental Publications 223, Southeast Finland
Regional Environment Centre, Aalef online kirjapaino, Lappeenranta, 65 p. apud
Lehto, J., 2009. Characterisation of waste activated and tertiary sludges from
forest industry. Thesis (Master's). University of Jyväskylä, Finalnd. 125p.
Olsson, L., Fallde, M., 2015. Waste(d) potential: A socio-technical analysis of biogas
production and use in Sweden. J. Clean. Prod. 98, 107–115.
doi:10.1016/j.jclepro.2014.02.015
Panter, K., Kleiven, H., 2005. Ten years experience of full-scale thermal hydrolysis
projects. In: Proceedings of the 10th European Biosolids and Biowaste
Conference, Wakefield, UK. apud Meyer, T., Edwards, E.A., 2014. Anaerobic
digestion of pulp and paper mill wastewater and sludge. Water Res. 65, 321–349.
doi:10.1016/j.watres.2014.07.022
Pellera, F.M., Gidarakos, E., 2016. Effect of substrate to inoculum ratio and inoculum
type on the biochemical methane potential of solid agroindustrial waste. J.
Environ. Chem. Eng. 4, 3217–3229. doi:10.1016/j.jece.2016.05.026
Pettersson, K., 2011. Black Liquor Gasification-Based Biorefineries – Determining
Factors for Economic Performance and CO2 Emission Balances. Thesis (PhD).
63
Chalmers University of Technology, Sweden. 118p.
Pokhrel, D., Viraraghavan, T., 2004. Treatment of pulp and paper mill wastewater – a
review. Sci. Total Environ. 333, 37–58. doi:10.1016/j.scitotenv.2004.05.017
Procházka, J., Dolejš, P., MácA, J., Dohányos, M., 2012. Stability and inhibition of
anaerobic processes caused by insufficiency or excess of ammonia nitrogen. Appl.
Microbiol. Biotechnol. 93, 439–447. doi:10.1007/s00253-011-3625-4
Rajendran, K., Kankanala, H.R., Lundin, M., Taherzadeh, M.J., 2014. A novel process
simulation model (PSM) for anaerobic digestion using Aspen Plus. Bioresour.
Technol. 168, 7–13. doi:10.1016/j.biortech.2014.01.051
Reddy, P., Pillay, V.L., Kunamneni, A., Singh, S., 2005. Degradation of pulp and
paper-mill effluent by thermophilic micro-organisms using batch systems. Water
SA 31, 575–580. doi:10.4314/wsa.v31i4.5147
Rittmann, B. E., McCarty, P. L., 2001. Environmental Biotechnology: Principles and
Applications. McGrall-Hill series in Water Resources and Environmental
Engineering.
Saha, M., Eskicioglu, C., Marin, J., 2011. Microwave, ultrasonic and chemo-
mechanical pretreatments for enhancing methane potential of pulp mill
wastewater treatment sludge. Bioresour. Technol. 102, 7815–7826.
doi:10.1016/j.biortech.2011.06.053
Serrano, R.P., 2011. Biogas Process Simulation using Aspen Plus. Thesis (Master's).
Syddansk Universitet, Denmark. 88p.
Silva, C.A.F., Bueno, J.M., Neves, M.R., 2015. The Pulp and Paper Industry in Brazil,
Guia ABTCP, Fornecedores & Fabricantes.
Silva, T.C.F., 2007. Procesos oxidativos evancados para tratamento de efluentes de
indústria de celulose kraft branqueada. Thesis (Master's). Universidade Federal
de Viçosa, Brazil. 104p.
Sorda, G., Sunak, Y., Madlener, R., 2013. An agent-based spatial simulation to
evaluate the promotion of electricity from agricultural biogas plants in Germany.
Ecol. Econ. 89, 43–60. doi:10.1016/j.ecolecon.2013.01.022
Springer, A.M., 1993. Industrial Environmental Control – Pulp and Paper Industry,
2nd ed. Tappi Press.
Stoica, A., Sandberg, M., Holby, O., 2009. Energy use and recovery strategies within
wastewater treatment and sludge handling at pulp and paper mills. Bioresour.

64
Technol. 100, 3497–3505. doi:10.1016/j.biortech.2009.02.041
Suhr, M., Klein, G., Kourti, I., Gonzalo, M.R., Santonja, G.G., Roudier, S., Sancho,
L.D., 2015. Best Available Techniques ( BAT ) Reference Document for the
Production of Pulp , Paper and Board. European Comission. doi:10.2791/370629
TAPPI, 2002. T 211 om-02: Ash in wood, pulp, paper and paperboard: combustion at
525°C.
Tchobanoglous, G., Burton, F.L., David, H.S., 2003. Wastewater engineering –
Treatment and use, 4th ed. McGraw Hill.
Teghammar, A., 2013. Biogas Production from Lignocelluloses: Pretreatment,
Substrate Characterization, Co-digestion, and Economic Evaluation. Thesis
(PhD). University of Borås, Sweden. 74p.
Teghammar, A., Yngvesson, J., Lundin, M., Taherzadeh, M.J., Horváth, I.S., 2010.
Pretreatment of paper tube residuals for improved biogas production. Bioresour.
Technol. 101, 1206–1212. doi:10.1016/j.biortech.2009.09.029
UNFCCC, 2015. United Nations Framework Convention on Climate Change. Pre-
2020 action by countries. < http://unfccc.int/resource/climateaction2020/ >.
(accessed 3.5.17).
UNFCCC, 2016. United Nations Framework Convention on Climate Change.
Convenção quadro sobre Mudança do Clima. < https://nacoesunidas.org/wp-
content/uploads/2016/04/Acordo-de-Paris.pdf>. (accessed 3.5.17).
Vakkilainen, E., 2007. Kraft recovery boilers: Principles and practice, 2nd ed.
van Haandel, A.C., Lettinga, G., 1994. Anaerobic Sewage Treatment: A Practical
Guide for Regions with a Hot Climate. John Wiley & Sons, Chichester, England.
Vavilin, V.A., Fernandez, B., Palatsi, J., Flotats, X., 2008. Hydrolysis kinetics in
anaerobic degradation of particulate organic material : An overview 28, 939–951.
doi:10.1016/j.wasman.2007.03.028
Viéitez, E.R., Ghosh, S., 1999. Biogasification of solid wastes by two-phase anaerobic
fermentation. Biomass and Bioenergy 16, 299–309. doi:10.1016/S0961-
9534(99)00002-1
von Sperling, M., 1997. Princípios do tratamento biológico de águas residuárias –
Lodos ativados, 2nd ed. DESA/UFMG, Belo Horizonte.
Wang, Y., Zhang, Y., Wang, J., Meng, L., 2009. Effects of volatile fatty acid
concentrations on methane yield and methanogenic bacteria. Biomass and
65
Bioenergy 33, 848–853. doi:10.1016/j.biombioe.2009.01.007
Wood, N., 2008. Pretreatment of pulp mill wastewater treatment residues to improve
their anaerobic digestion. Thesis (Master's). University of Toronto.
Wood, N., Tran, H., Master, E., 2010. Improving anaerobic conversion of pulp mill
secondary sludge to biogas by pretreatment. Tappi J. 16–21 apud Meyer, T.,
Edwards, E.A., 2014. Anaerobic digestion of pulp and paper mill wastewater and
sludge. Water Res. 65, 321–349. doi:10.1016/j.watres.2014.07.022
Wood, N., Tran, H., Master, E., 2009. Pretreatment of pulp mill secondary sludge for
high-rate anaerobic conversion to biogas. Bioresour. Technol. 100, 5729–5735.
doi:10.1016/j.biortech.2009.06.062
Yang, L., Xu, F., Ge, X., Li, Y., 2015. Challenges and strategies for solid-state
anaerobic digestion of lignocellulosic biomass. Renew. Sustainable Energy Rev.
44, 824–834.
Yu, L., Wensel, P., Ma, J., Chen, S., 2013. Mathematical Modeling in Anaerobic
Digestion (AD). J. Bioremediation Biodegrad. S4, 12. doi:10.4172/2155-
6199.S4-003
Zhang, Q., Hu, J., Lee, D., 2016. Biogas from anaerobic digestion processes: Research
updates. Renew. Energy J. 98, 108–119.
doi:http://dx.doi.org/10.1016/j.renene.2016.02.029
Zwietering, M.H., Jongenburger, I., Rombouts, F.M., Van’t Riet, K., 1990. Modeling
of the bacterial growth curve. Appl. Environ. Microbiol. 56, 1875–1881.
doi:10.1111/j.1472-765X.2008.02537.x

66
APPENDIX A – Potential of biogas and energy recovery from cellulosic pulp residues: the concepts of biorefinery and process simulation model
Abstract
To understand the best application for the produced biogas, the energy generating
systems at pulp mills were investigated. The model described by Rajendran et al.
(2014) was studied and adapted for simulation under mesophilic conditions. The
necessary data relied on the experimental analysis and literature. The anaerobic
digestion model was integrated with a combined heat and power unit in Aspen Plus®,
in order to estimate the potential energy production from biogas. It was supposed that
the anaerobic reactor was fed with 500 tons of wet sludge per day. The biogas was
firstly combusted, then the generated heat produced steam at high temperature and
pressure. Considering a turbine outlet pressure of 10 bar, 148 kW of electric power
and 88 GJ of heat was generated per day. A simplified energy balance showed to be
possible to produce heat from the biogas originated from the kraft pulp mill secondary
sludge. However, the electric power was not enough to maintain the energy demanded
by the reactor stirring.
1. Introduction
The integration of the biorefinery concept into industrial production processes is
becoming an attractive opportunity to lower environmental impacts and add value to
byproducts (Hamaguchi et al., 2012). The interest relates to transforming residues into
valuable goods, such as the production of energy from waste streams. The pulp and
paper industry has a high-energy demand from thermal and mechanical processes, and
for the effluent treatment processes. The energy demand in kraft pulp mills ranges
from 10 to 14 GJ/ADt of heat and from 700 to 800 kWh/ADt of electric power (Suhr
et al., 2015). Primary clarification followed by activated sludge bio-treatment are the
most common effluent treatment processes used by the pulp and paper industry, which
it generates high quantities of primary and secondary sludge. Although the industry
has not paid much attention in this option, there is an opportunity to anaerobically
digest the sludge in order to stabilize it and generate biogas for energy production. The

67
implementation of such technology could reduce the overall costs of the solid waste
management at the mills.
Some studies have been reporting the potential for biogas production from pulp and
paper mill sludges. The specific methane yield potential ranges between 40 and 200
mL/g VS (Kamali et al., 2016; Meyer and Edwards, 2014). The possibility of energy
production from waste streams represents a good opportunity to improve the mill’s
energy efficiency and self-sufficiency. In addition, the possibility of biogas
combustion in a combined heat and power (CHP) unit, already available at the mills,
facilitates the benefits of biogas (Mesfun, 2013).
It is essential to understand the mechanisms and ways to estimate the biogas
production potential in sludge digestion and the heat and power production potential
in CHP power plants of kraft pulp mills. For this purpose, simulation models may be
used to describe and quantify the processes involved. The art of simulating
biochemical processes has become an important tool. The development of a process
simulation model is quite complex, but it allows the creation of simple and
comprehensible results, which are a powerful tool to predict the potential and
efficiency of a system.
Different mathematical models have been developed to describe the anaerobic
digestion of organics. The ADM1 (Anaerobic Digestion Model N° 1) appears to be
the most complete and accurate in describing the kinetics of the reactions involved
(Batstone et al., 2002). Rejandran et al. (2014) developed an anaerobic digestion
model (PSM) based on Angelidaki et al. (1999), Angelidaki et al. (1993), Batstone et
al., (2002) and Serrano (2011). Rejandran et al. (2014) model estimates biogas
production under thermophilic conditions and it is divided into four stages: hydrolysis,
acidogenesis, acetogenesis and methanogenesis. The model includes 46 reactions and
the hydrolysis step is considered separately from the other reactions. Figure A.1 shows
a conceptual block flow diagram for the considered anaerobic digestion process.

68
Figure A.1. Simplified anaerobic digestion block flow diagram from Rajendran et al. (2014) model (adapted).
The goal of the research was to investigate the technical feasibility of producing
energy from the anaerobic digestion of primary and secondary sludges originated from
a bleached kraft pulp mill. This was done by coupling the PSM from Rajendran et al.
(2014) with a CHP unit using the software Aspen Plus®. The adaptation of the
anaerobic model was supported by experiments and literature research.
2. Material and methods
This research was carried out in 6 Phases. Phase 1 aimed at giving an overview of the
actual energy generation process in a kraft pulp mill and the possibility of integrating
biogas production into the process. Phase 2 aimed at characterizing the sludges. Phase
3 aimed at estimating the biogas production potential by BMP assays (developed in
Chapter 2). In Phase 4, the potential of energy production from the slugdes in the form
of biogas and direct burning were compared. In Phase 5, the Rajendran et al. (2014)
model was modified to work under mesophilic conditions and calibrated for the kraft
pulp mill sludge based on the BMP assays. Finally, in Phase 6, the model was
integrated with the CHP block in order to convert the biogas into heat and electric
power.
2.1 Phase 1 – Process description

69
The process flow diagram of the energy generation at a typical kraft pulp mill is
illustrated in Figure A.2. Black boxes describe typical operation units already existing
at kraft pulp mills. Red boxes indicate possibilities for integration.
Figure A.2. Simplified process flow diagram of the actual kraft production process and the possibility of integration with the biogas produced from primary and secondary sludges. Lines in black indicate processes already applied. Lines in red indicate possibilities for process integration. ETP: Effluent treatment plant; HP: high pressure; MP: medium pressure; and LP: low pressure.
The energy generating system is mainly fed with residues from the production process,
such as the black liquor, the wood residues and, in a few mills, the primary and
secondary sludges. The different kinds of fuels are incinerated in two different boilers:
the recovery boiler, where the black liquor is used, and the biomass boiler, where
residual wood and, in some cases, sludge is burnt. In the boilers, high-pressure (HP)
steam is generated in order to operate the turbine and produce electric power. The out-
coming low pressure (LP) and medium pressure (MP) steams are used in the
production process, which allows heat recovery. The biomass boiler may be fed with
additional fossil fuels in order to meet the energy demand of the pulp mill (Hamaguchi
et al., 2012; Pettersson, 2011).
2.2 Phase 2 – Characterization of primary and secondary sludges

70
Primary and secondary sludges were characterized for total solids, volatile solids, ash,
elemental composition (C, N, H, S, O), carbohydrates (cellulose and hemicellulose),
lignin, and oil and grease, as previously described in Chapter 2, item 2.2.2. The sludges’
higher heating value (HHV) was determined at the Pulp and Paper Laboratory, located
at Universidade Federal de Viçosa, following the procedures described by ABNT
NBR 8633 (1984). The determination of the sludges’ lower heating value (LHV) was
based on their HHV and elemental composition, as presented in Eq. (A.1) (Cortez et
al., 2008).
��� = [ ��� − �� � + 0,09�� �(100 − �)/100] (Eq. A.1)
where:
1. LHV 2. lower heating value, wet basis (MJ/kg)
3. HHV 4. higher heating value, dry basis (MJ/kg TS)
5. λ 6. water latent heat (2,31 MJ/kg at 25 °C)
r 7. W/ (100-W)
8. W 9. Sludge moisture content, wet basis (%)
H Sludge hydrogen content, dry basis (%)
2.3 Phase 3 – Primary and secondary sludges methane production potential
The methane production potential was based on the BMP assays. The methodology is
described in Chapter 2, item 2.2.3.
2.4 Phase 4 – Potential of energy production from sludge: biogas vs. direct
incineration
Table A.1 describes the procedures to estimate the energy production potential from
the primary and secondary sludges, either through incineration of the raw sludges or
through incineration of the produced biogas (Rosa, 2013).

71
Table A.1. Procedures for calculating the total energy potential from raw sludges and biogas (Rosa, 2013)
Substrate Equation Explanation
Raw sludge ��efg:h; = �efg:h; ����efg:h;
��efg:h;: Energy potential from sludge (MJ/d)
�efg:h;: Sludge production (kg TS/d)
���efg:h;: Sludge LHV (MJ/kg TS)
Biogas ��i8jháe = �lmW��efg:h;����lmW
��i8jhne: Energy potential from biogas (MJ/d)
�lmW : Cumulative methane yield from sludge
anaerobic digestion (Nm3 CH4/g VS)
�efg:h;: Sludge production (g VS/d)
���lmW: Methane LHV (34.5 MJ/Nm3 CH4)
TS: total solids; LHVCH4: methane lower heating value, based on Baêta et al. (2016); VS: volatile solids.
The sludge production was based on the production of a typical kraft pulp mill. The
cumulative methane yield from each substrate was based on the best results of Chapter
2 (Table A.2).
Table A.2. Typical kraft pulp mill production
Substrate Production (d.b.) TS (%, w.b.)(a) VS (%, d.b.)(a) CH4 production (NmL/g VS)(b)
Pulp 5000 ADt/d – – –
Primary sludge (PS) 40 kg/ADt 31.69 98.72 16.3
Secondary sludge (SS) 15 kg/ADt 10.73 86.06 66.2
Total sludge (MIX) 55 kg/ADt 25.70 95.10 35.2
d.b.: dry mass basis; w.b.: wet mass basis; TS: total solids; VS: volatile solids; (a)Details in Chapter 2. (b)The highest methane production was considered for each substrate for 30 days of incubation (PS: S/I = 1/1 UASB + cow dung; SS: S/I = 1/1 UASB; and MIX: S/I = 2/1 UASB + cow dung)
2.5 Phase 5 – Anaerobic digestion simulation
The anaerobic digestion simulation was carried out with Aspen Plus® v8.8 using the
model presented by Rajendran et al. (2014) after modifications. In Aspen Plus®, the
simulation of the kinetics involved in the reactions is described by kinetic constants
provided in the literature, combined with FORTRAN statements and calculator blocks.
The calculator blocks contain equations described by the Monod kinetics, which
explains the bacterial growth and the substrate affinity, and by the Arrhenious equation,
which calculates the temperature dependence of reaction rates and bacterial growth.
The FORTRAN statement language is applicable in Aspen Plus® and it was used to

72
interconnect variables between the model input and the calculator blocks, in order to
describe the dependence of kinetics on temperature, pH, retention time and inhibitory
effects; this is possible by creating subroutines of forward/feedback information. This
procedure was used to describe the influence of temperature change on the kinetics by
connecting the variable “temperature” with the temperature-related equations of the
calculator blocks. Other FORTRAN statements were used to connect the variable
“concentration” of various components and intermediary products which influence the
kinetics described in the calculator blocks.
The equations that describe the kinetic interactions in the acidogenic, acetogenic and
methanogenic steps are described by Rajendran et al. (2014) model based on Serrano
(2011) model, who coupled the ADM1 (Batstone, 2002) and Angelidaki et al. (1993;
1999) models. Table A.3 present the equations used by Rajendran et al. (2014).
Table A.3. Kinetics equations (K) used in Rajendran et al. (2014) model Acidogenesis
Dextrose degradation
K = �q T �µt#u�1
1 +Kv(T)
GLU
�1
1 +Kv,z{2TNH2
�1
1 +[LCFA]K~,����
xS(pH)
Glycerol degradation
K = µt#u�1
1 +Kv,���
GTO
�1
1 +Kv,z{2TNH2
�1
1 +[LCFA]K~,����
�S(pH)
LCFA degradation
Lino degradation
K = �q T �1
1 +Kv,����
LINO+[LCFA]K~,����
�1
1 +Kv,z{2TNH2
�S(pH)
Oleic degradation
K = �q T �1
1 +Kv,����
LCFA+[LCFA]K~,����
�1
1 +Kv,z{2TNH2
�S(pH)
Palm degradation
K = �q T �1
1 +Kv,����
PALM+[LCFA]K~,����
�1
1 +Kv,z{2TNH2
�S(pH)
VFA degradation
Butyrate degradation
K = �q T �1
1 +Kv(T)
VFA
�1
1 +Kv,z{2TNH3
�1
1 +[HAc]K~,{�'
�1
1 +[LCFA]K~,����
�1
1 +[H1]
K~,{1(T)
�S(pH)
Propionate degradation
K = �q T �1
1 +Kv(T)
PROP
�1
1 +Kv,z{2TNH3
�1
1 +[HAc]K~,{�'
�1
1 +[LCFA]K~,����
�1
1 +[H1]
K~,{1(T)
�S(pH)
Valerate degradation
K = �q T �1
1 +Kv(T)
VALE
�1
1 +Kv,z{2TNH3
�1
1 +[HAc]K~,{�'
�1
1 +[LCFA]K~,����
�1
1 +[H1]
K~,{1(T)
�S(pH)

73
Methanogenesis
Methanogenic K = �q T �1
1 +Kv THAc
�1
1 +Kv,z{2TNH3
�1
1 +NH3Kv(T)
�1
1 +LCFAK~,����
�R(pH)
Amino acid degradation
Amino acids
degradation K = �q T �
1
1 +Kv,��AA
�S(pH)
Other parameters
S (pH) � = 2.7182818284� −3��� − 5.5
5.5 − 4
1
R (pH) � =(1 + 2�10 H.�< ��� )
(1 +10 �m�� + 10 ���m )
�� (�) �q T = �q �e����
< ��
�P
Since the objective of this study was to simulate anaerobic digestion under mesophilic
conditions and the Rajendran et al. (2014) model functions under termophilic
conditions, the kinetics contants needed firstly to be adjusted to values related to 35°C.
The adjusted parameters for mesophilic conditions, such as the maximum bacterial
growth rate (μmax), the substrate affinity constant (Ks) and the LCFA inhibition
constant (KI, LCFA), were collected from the ADM1 model described in the available
literature (Chen, 2010; Dasa et al., 2016; Fernández et al., 2011; Lille, 2015;
Pavlostathis and Giraldo-Gomez, 1991; Queen, 2006; and Vance-Harrop et al., 2003).
Other inhibitions were not adapted to the mesophilic conditions because of a lack
information and relevance (assuming that their value is more or less applicable under
both conditions). The Km values were not modified, since they were re-calculated by
the Arrhenius Equation. The adjusted parameters are presented in Table A.4.
Table A.4. Adjusted kinetic parameters in Rajendran et al. (2014) model for mesophilic condition (35 °C)
Reactant μmax (d-1) Ks (g/L) Ea (J/mol)5 KI, LCFA (g/L)6
Dextrose 3.9121 0.4273 35,616.457 0.050 Glycerol 0.482 – – 0.050 Oleic acid – 0.44 21,472.731 0.050 Propionic acid – 0.14 18,108.108 0.050 Isobutyric acid – 0.24 17,044.808 0.050 Isovaleric acid – 0.24 17,044.808 0.050 Linoleic acid – 0.44 21,472.731 0.050 Palmitic acid – 0.44 21,472.731 0.050 Acetic acid – 0.154 29,136.680 0.050 Hydrogen – –
–
– Aminoacid (overall) – 0.35 14,143.7262 –

74
1Fernández et al. (2011), 2Vance-Harrop et al. (2003), 3Pavlostathis et al. (1990), 4Chen (2010), 4Queen (2006), 5Recalculated from Serrano (2011), and 6Dasa et al. (2016).
The activation energy was calculated throughout the Arrhenius equation for two
reaction rates at different temperatures (Eq. A.2) by comparing the maximum specific
uptake rate (Km) at 35°C, provided in ADM1, and at 55°C, provided by Serrano (2011).
�1 � = � ���
X�¡
<¢
Y£�
¢
Y¢
(Eq. A.2)
Where Ea is the activation energy (J/mol), R is the universal gas constant (J/k.mol), T
is temperature (K) and K is the reaction rate (d-1). The equation was solved for Ea. The
Km values (K1 and K2) were obtained from three different sources which reported the
ADM1 kinetic constants (Serrano, 2011; Lille, 2009; and Queen, 2006) or calculated
through the relation Km = μmax/Y (Khanal, 2008), where Y values were also obtained
from the ADM1 model, based on the aforementioned literature.
After adjusting the model to the mesophilic kinetics, the model was run for the
secondary sludge. For this, the sludge composition was corrected to 100%, since the
composition obtained in the laboratory gave a total result of 114% (Table A.5).
Table A.5. Secondary sludge composition
The sludge composition was integrated into the model in terms of cellulose,
hemicellulose, protein, lipids (triolein, tripalmate, palmito-olein, and palmito-linolein)
and inert, which also included the lignin due to its modeling complexity (Serrano,
2011). The industrial parameters included the sludge mass flow, hydraulic retention
time (HRT) and temperature of the process (Table A.6).
Parameter Adjusted Original Water (%, wet mass basis) 89.27 89.27
Total solids, TS (%, wet mass basis) 10.73 10.73
Cellulose (% TS) 27.40 31.24
Hemicellulose (% TS) 4.84 5.52
Lignin (% TS) 26.72 30.46
Protein (% TS) 26.59 30.31
Lipids (% TS) 3.49 3.98
Ash (% TS) 10.96 12.50
Total (% TS) 100.00 114.00

75
Table A.6. Industrial parameters entered in the simulation
The fractional conversions (Table A.7) of the reactants in the hydrolytic step were then
adjusted until the simulated methane production reached similar yields achieved in the
BMP assays. The simulation was performed for the best result achieved by the BMP
tests (secondary sludge under mesophilic condition, with a substrate to inoculum ratio
of 1/1). Refer to Chapter 2 for more details.
Table A.7. Hydrolysis fractional conversions used for simulating the mesophilic anaerobic digestion of secondary kraft pulp mill sludge considering an S/I = 1/1 Reactant (product) Conversion Carbohydrates
Cellulose (Dextrose) 0.6
Cellulose (Ethanol) 0.4
Hemicellulose (Ac. Acetic) 0.5
Hemicellulose (Xylose) 0.1
Lipids
Tripalm 0.1
Triolein 0.1
Palmito-olein 0.1
Palmito-linolein 0.1
Soluble protein 0.1
2.6 Phase 6 – CHP modeling
A scheme developed by Dias (2011) for modeling a combined heat and power (CHP)
generation system was adapted into be integrated in Rajendran et al. (2014) model.
The CHP process is described in Figure A.3.
Parameter Value Sludge mass flow in wet basis (t/d) 500
HRT (d) 30
Temperature (°C) 35
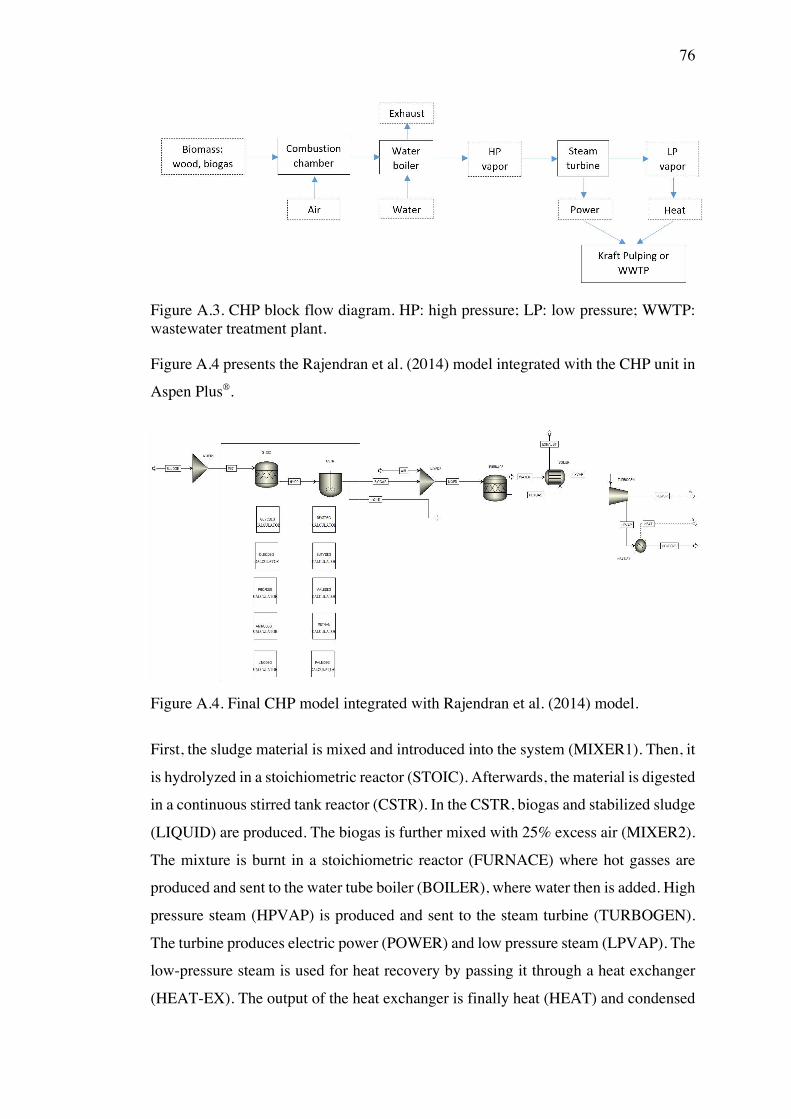
76
Figure A.3. CHP block flow diagram. HP: high pressure; LP: low pressure; WWTP: wastewater treatment plant. Figure A.4 presents the Rajendran et al. (2014) model integrated with the CHP unit in
Aspen Plus®.
Figure A.4. Final CHP model integrated with Rajendran et al. (2014) model.
First, the sludge material is mixed and introduced into the system (MIXER1). Then, it
is hydrolyzed in a stoichiometric reactor (STOIC). Afterwards, the material is digested
in a continuous stirred tank reactor (CSTR). In the CSTR, biogas and stabilized sludge
(LIQUID) are produced. The biogas is further mixed with 25% excess air (MIXER2).
The mixture is burnt in a stoichiometric reactor (FURNACE) where hot gasses are
produced and sent to the water tube boiler (BOILER), where water then is added. High
pressure steam (HPVAP) is produced and sent to the steam turbine (TURBOGEN).
The turbine produces electric power (POWER) and low pressure steam (LPVAP). The
low-pressure steam is used for heat recovery by passing it through a heat exchanger
(HEAT-EX). The output of the heat exchanger is finally heat (HEAT) and condensed

77
water (CONDENS). It is assumed that the CHP unit is already present at the kraft pulp
mill.
The air input (AIR) in the FURNACE, assuming 25% air excess, was estimated
stoichiometrically according to Eq. A.3 (Flagan and Seinfel, 1988).
CH4 + 1.25 x 2 (O2 + 3.76 N2) à CO2 + 2 H2O + 0.5 O2 + 9.4 N2 (Eq. A.3)
The estimation of the water input (WATER, mw) in the water tube boiler (BOILER)
assumed the heat from methane combustion (LHV) and the water vaporisation to be
at the desired levels. The boiler efficiency was assumed to be 85%. The calculation
consisted of multiplying the amount of methane produced (mCH4) by its LHV and
boiler efficiency (ɛ), and then dividing it by the specific heat of water vaporisation (hw,
evap) (Eq. A.4).
mw = mCH4 x LHVCH4 x ɛ / hw, evap (Eq. A.4)
The necessary data for air and water calculations are provided in Table A.8, togheter
with the data estimated for the turbine operation.
Table A.8. CHP parameters Parameter Value Air calculation Excess (%) 25 Water calculation Input pressure (bar) 80
Input temperature (°C) 70 Input enthalpy (kJ/kg) 299 Steam enthalpy (kJ/kg) at 60 bar and 357°C 3364 Methane heating value (kJ/kg) at 1.013 bar and 25°C 55500 Boiler efficiency (%) 85 Turbine Steam input pressure (bar) 60 Steam output pressure (bar) 10 Isentropic efficiency (%) 85
The mechanical power required for maintaining the complete mixture of the reactor
was considered to be 10 W/m3 (Brasil, 2015).

78
3. Results and discussion
3.1 Primary and secondary sludge characteristics and energy production
potential
Table A.9 presents the characteristics of the primary and secondary sludges, and the
mixture between them.
Table A.9. Substrates characteristics Parameter PS SS MIX TS (%, w.b.) 31.69 10.73 25.70
VS (%, TS) 99.41 87.50 96.01
Ash (% TS) 0.59 12.50 3.99
C (% TS) 44.10 45.20 44.41
H (% TS) 6.04 ± 0.04 5.83 ± 0.09 5.98
N (% TS) 0.06 ± 0.01 4.85 ± 0.02 1.43
S (% TS) 0.40 ± 0.01 1.82 ± 0.01 0.81
O (% TS) 48.80 ± 0.05 29.80 ± 0.15 34.86
Cellulose (% TS) 81.03 ± 0.28 31.24 ± 0.12 66.80
Hemicellulose (% TS) 12.03 ± 0.14 5.52 ± 0.06 10.17
Lignin (% TS) 5.71 ± 0.24 30.46 ± 0.22 12.78 Proteins (% TS) 0.38 ± 0.01 30.31 ± 0.02 8.93
Oil and grease (% TS) 3,74 ± 0,15 3.98 ± 0.07 3.81
HHV (MJ/kg TS) 17.80 ± 0.05 19.00 ± 0.15 18.14
LHV (MJ/kg, w.b.) 3.7 -0.2 3.0
w.b.: wet mass basis; TS: total solids; VS: volatile solids.
From the sludge composition, it can be seen that the carbon content is quite high, but
the actual degradable carbon is low because of the presence of hardly degradable
molecules like cellulose and lignin.
In terms of the sludge’s energy potential, Kim et al. (2005) also reported negative LHV
value for sludge with high moisture content. For a mixture between industrial and
domestic sewage sludge with 97.2% of water content, the LHV was -1.8 MJ/kg.
However, according to the study, moisture content ranging from 40 to 60% might be
acceptable for direct sludge combustion.
The moisture content of the PS and MIX are within the range stipulated by Kim et al.
(2005), indicating their potential for combustion. On the other hand, due to the high

79
moisture content of the SS, anaerobic digestion is more appealing. Table A.10 presents
the comparison between the maximum energy production potential from raw sludges
and from produced biogas.
Table A.10. Energy potential (EP) from raw sludge compared to potential of energy production from the anaerobic digestion of the same substrates
Substrate EPsludge (GJ/d) EPbiogas (GJ/d) PS 2340 112 SS -140 150 MIX 3210 321
From Table A.10 it can be observed that only the secondary sludge has greater
potential to be converted into biogas when compared to its raw combustion. The
potential for energy production from the primary sludge and from the mixture by direct
combustion is 21 and 10 times higher than their respective energy production from
anaerobic digestion. Therefore, only the anaerobic digestion of the secondary sludge
was considered to be modeled in Aspen Plus®.
3.2 Anaerobic digestion simulation
Table A.11 presents the methane yield from the simulations compared to the BMP
tests.
Table A.11. Secondary sludge anaerobic digestion simulation under mesophilic conditions vs. BMP assay
CH4 yield/g VS Error
Laboratory Simulation 66.2 64.7 2.3%
The difference found by Rajendran et al. (2014) when comparing the simulations with
the experimental results ranged from 0.3 to 12.4% depending on the type of substrate.
In this study, after making the mesophilic adjustments, the encountered error was 2.9%,
which is within the range reported by Rajendran et al. (2014).
3.3 CHP result and energy balance

80
After obtaining the methane production results from the anaerobic digestion, the
necessary air and water input to operate the CHP model was calculated according to
the previously described methodology. The results are shown in Table A.12.
Table A.12. Estimated CHP air and water input Input Value Air (kg/d) 45943 Water (kg/d) 32963
These parameters calculated for air and water input allowed running the proposed
model under the best condition. Some small changes in water input might be necessary
depending on the efficiency of the biomass boiler considered. The net energy produced
by the CHP system is presented in Table A.13. The energy output is considered in
terms of heat and electric power.
Table A.13 CHP results with a reactor feed of 500 wet tons of secondary sludge per day
Parameter Production potential Reactor’s demand Net output Heat (GJ/d) 88 0 88 Power (kW) 148 148320(1) -142172
(1) Considered as 10 kW/m3 (Brasil, 2015). Liquid volume: 14832 m3 (estimated in Aspen Plus®).
The electric power and heat production potentials were 148 kW and 88 GJ from the
biogas produced by the secondary sludge. The heat produced was net positive, since
the biochemical reactions were capable of maintaining the desired reactor temperature
at 35°C. Additionally, since Brazil is a tropical country, the ambient temperature is
usually stable within the ideal mesophilic range. On the other hand, the electric power
produced was no sufficient to maintain the reactor stirring.
Since kraft pulp mills still rely on fossil fuels, especially to supply the energy demand
at the lime kiln (1.2 GJ/ADt) (Francis et al., 2002), the biogas produced from the
secondary sludge could partially supply this energy demand. Considering a pulp mill
with a production of 5000 ADt/d and sludge generation of 500 t/d, the energy demand
for the lime kiln would be 6000 GJ/d. The energy provided by the biogas would be 88
GJ/d, i.e., 1.5% of the lime kiln energy demand. Even contributing a small amount of
energy, biogas constitutes a new possibility for the kraft pulp industry. Further

81
development is still needed to increase the energy production potential of kraft pulp
mill sludges to guarantee the total energy sustainability of the anaerobic digestion
process.
3.4 Model analysis
The Rajendran et al. (2014) model was first developed and discussed by Serrano
(2011). The Serrano (2011) model was the result of a combination of two different
theoretical models: Angelidaki et al. (1999, 1993) and ADM1 (Batstone, 2002). The
combination was necessary to create a more complex and complete model. The
mesophilic simulation required changes in the kinetic parameters, in order to obtain
reasonable and comparable results. In the end, the result of the simulation was
reasonably close to the laboratory experiments performed in this research. This would
suggest that the model was successfully developed and applied. However, there are
some questions that still need to be answered, which led the research group to think
that the simulation proposed still needs to be improved in terms of the kinetic
interactions described by the equations, which were applied in Aspen Plus® in the form
of calculation blocks. These doubts arise from three main facts.
Fact 1: The power law (as suggested by Serrano, 2011 and Rajendran et al., 2014)
was used in the calculator blocks (Aspen Plus®) to describe the change in the
maximum specific uptake rate Km when changing temperature from thermophilic to
mesophilic conditions (from 55°C to 35ºC). This is possible by collecting the Km
values at both temperatures, from the ADM1, and then calculating an apparent
activation energy (Ea) from the power law expression. Afterwards, the same power
law is used to calculate Km when changing the temperature in the simulation, by
knowing Km at one of the two temperatures and Ea. This procedure is useful to relate
reaction rates to temperature change. However, the values of Ea calculated by Serrano
(2011) are apparently wrong since they are negative. A negative activation energy
implies that the reaction rates decrease when temperature is increasing. However, the
reaction rates involved in the anaerobic digestion process increases with the
temperature. Thus, this led to a reflection on the validity of the Ea values presented.
The calculation of Ea using the same procedure and values has shown in fact shown a

82
positive result. The Arrhenius Equation can be expressed as ln (k2/k1) = (Ea/R)*(1/T1-
1/T2). When solved for Ea: Ea = [R*ln(k2/k1)]/[(1/T1-1/T2)]. This confirms that a
temperature increase leads to a positive activation energy.
Fact 2: The integration of ADM1 and Angelidaki’s model might be questionable when
mixing the kinetic equations of both models. The combination was done without
taking into account the differences in kinetic parameter expression between the two
models. Angelidaki et al. (1999) degradation equations are expressed as μmax
(maximum specific growth rate of microorganism, d-1). The ADM1 model is based on
Km (maximum specific substrate uptake rate, d-1). These two parameters are related by
Km = μmax/Y (where Y is the yield of biomass) (Khanal, 2008). Thus, these parameters
are proportionally related, but it might not justify their application together without
adjustments. Our belief is that one specific kinetic equation describing a process
involved in anaerobic digestion can only be applied (or solved) for Km or μmax, but not
for both. In particular, the equations used appear to be closer to the system used in
Angelidaki’s model, and therefore, it would make sense to apply only the μmax and
eventually convert Km to μmax when considering values from ADM1.
Fact 3: The model developed by Serrano (2011) and referred to by Rajendran et al.
(2014), was programmed to simulate both thermophilic and mesophilic conditions. In
reality the model was not able to do so, because most parameters were not related to
temperature dependence.
In conclusion, it appears that the model used is not completely correct. Unfortunately,
due to a lack of time and information it is difficult to completely adjust the model.
Anyway, we believe that some progress has been made toward understanding the
kinetic interactions and this could be a good starting point for further research or study.
3.5 Conclusions
• Energy recovery from anaerobic digestion has proven to be theoretically
feasible only in the case of secondary sludge, while for primary sludge, direct
combustion might be preferable.

83
• The Rajendran et al (2014) model was adjusted for the particular anaerobic
digestion conditions (mesophilic, S/I = 1/1, kraft pulp mill secondary sludge).
• The simulation carried out with Aspen Plus® showed that the difference in
methane yield between experiments and model simulation was negligible.
• Reasonable amounts of energy generation were possible by applying the
described model coupled with the CHP unit.
• The anaerobic digestion of pulp mill sludges is still in its early stages. More
study is needed to optimize energy production so that the process can be
implemented industrially.

84
References
ABNT, 1984. Associação Brasileira de Normas Técnicas. NBR 8633. Carvão vegetal – determinação do poder calorífico. Método de ensaio.
Angelidaki, I., Ellegaard, L., Ahring, B.K., 1999. A comprehensive model of anaerobic bioconversion of complex substrates to biogas. Biotechnol. Bioeng. 63, 363–372. doi:10.1002/(SICI)1097-0290(19990505)63:3<363::AID-BIT13>3.0.CO;2-Z.
Angelidaki, I., Ellegaard, L., Ahring, B.K., 1993. A mathematical model for dynamic simulation of anaerobic digestion of complex substrates: Focusing on ammonia inhibition. Biotechnol. Bioeng. 42, 159–166. doi:10.1002/bit.260420203.
Baêta, B.E.L., Lima, D.R.S., Filho, J.G.B., Adarme, O.F.H., Gurgel, L.V.A., Aquino, S.F.D., 2016. Evaluation of hydrogen and methane production from sugarcane bagasse hemicellulose hydrolysates by two-stage anaerobic digestion process. Bioresour. Technol. 218, 436–446. doi:10.1016/j.biortech.2016.06.113.
Batstone, D.J., Keller, J., Angelidaki, I., Kalyuzhnyi, S.V., Pavlostathis, S.G., Rozzi, A., Sanders, W.T.M., Siegrist, H., Vavilin, V.A., 2002. The IWA Anaerobic Digestion Model No 1 (ADM 1). Water Sci. Technol. 45 (10), 65–73. Brasil, 2015. Secretaria Nacional de Saneamento Ambiental. Probiogas. Anteprojeto de uma usina e capacitação em biogás. 1st edition. Ministério das Cidades, Deutsche Gesellschaft für Internationale Zusammenarbeit GmbH (GIZ). Brasília, DF: Ministério das Cidades.
Chen, Q., 2010. Kinetics of Anaerobic Digestion of Selected C1 to C4 Organic Acids. University of Missouri-Columbia. Thesis (Master’s).
Cortez, L. A. B., Lora, E. E. S., Gómez, E. O., 2008. Biomassa para energia. Editora da Unicamp, Campinas, São Paulo.
Dasa, K. T., Westman, S. Y., Millati, R., Cahyanto, M. N., Taherzadeh, M. J., Niklasson, C., 2016. Inhibitory Effect of Long-Chain Fatty Acids on Biogas Production and the Protective Effect of Membrane Bioreactor. BioMed Research International. http://dx.doi.org/10.1155/2016/7263974

85
Dias, M. O. S., 2011. Desenvolvimento e otimização de processos de produção de etanol de primeira e segunda geração e eletricidade a partir da cana-de-açúcar. Thesis (D.Sc.). Universidade Estadual de Campinas, Campinas, São Paulo.
Fernández, F. J., Villaseñor, J., Infantes, D., 2011. Kinetic and stoichiometric modelling of acidogenic fermentation of glucose and fructose. Biomass and Bioenergy, v. 35, p. 3877–3883. Flagan, R. C. and Seinfeld, J. H., 1988. Fundamentals of air pollution engineering. Englewood Cliffs, New Jersey: Caltech. 0-13-332537-7.
Francis, D.W., Towers, M.T., Browne, T.C., 2002. Energy Cost Reduction in the Pulp and Paper Industry – An Energy Benchmarking Perspective. Pulp and paper technical association of Canada, Montréal.
Hamaguchi, M., Cardoso, M., Vakkilainen, E., 2012. Alternative Technologies for Biofuels Production in Kraft Pulp Mills – Potential and Prospects. Energies, v. 5, p. 2288-2309. doi:10.3390/en5072288.
Kamali, M., Gameiro, T., Costa, M.E. V, Capela, I., 2016. Anaerobic digestion of pulp and paper mill wastes – An overview of the developments and improvement opportunities. Chem. Eng. J. 298, 162–182. doi:10.1016/j.cej.2016.03.119.
Khanal, S.K., 2008. Anaerobic Biotechnology for Bioenergy Production Principles and Applications. John Wiley & Sons, Inc.
Kim, Y.-J.; Kang, H.-O.; Qureshi, T. I., 2005. Heating value characteristics of sewage sludge: a comparative study of different sludges types. Jour. Chem. Soc. Pak., v. 25, n.2.
Lille, M. I. V., 2015. Modeling, Simulation and Control of Biotechnological Processes in Decentralized Anaerobic Treatment of Domestic Wastewater. Thesis (PhD). Friedrich-Alexander-Universität Erlangen-Nürnberg, Germany.
Meyer, T., Edwards, E.A., 2014. Anaerobic digestion of pulp and paper mill wastewater and sludge. Water Res. 65, 321–349. doi:10.1016/j.watres.2014.07.022
Mesfun, S., Toffolo, A., 2013. Optimization of process integration in a Kraft pulp and paper mill – Evaporation train and CHP system. Applied Energy, 107, 98–110. http://dx.doi.org/10.1016/j.apenergy.2013.02.016

86
Pavlostathis, S. G.; Giraldo-Gomez, E., 1991. Kinetics of anaerobic treatment: A critical review. Critical Reviews in Environmental Control., v. 21(5,6), p. 411–490.
Pettersson, K., 2011. Black Liquor Gasification-Based Biorefineries – Determining Factors for Economic Performance and CO2 Emission Balances. Chalmers University of Technology. Thesis (Ph.D.), Sweden.
Queen, A. S., 2006. Simulador de Reatores Anaeróbios com base no ADM1. Universidade de São Paulo. Thesis (Master’s), São Paulo. Rajendran, K., Kankanala, H.R., Lundin, M., Taherzadeh, M.J., 2014. A novel process simulation model (PSM) for anaerobic digestion using Aspen Plus. Bioresour. Technol. 168, 7–13. doi:10.1016/j.biortech.2014.01.051.
Rosa, A.P., 2013. Aproveitamento de biogás e lodo excedente de reatores UASB como fonte de energia renovável em estações de tratamento de esgoto. Thesis (D.Sc.). Universidade Federal de Minas Gerais, Belo Horizinte, Brazil.
Serrano, R. P., 2011. Biogas Process Simulation using Aspen Plus. Thesis (Master’s). Syddansk Universitet, 88p.
Suhr, M., Klein, G., Kourti, I., Gonzalo, M.R., Santonja, G.G., Roudier, S., Sancho, L.D., 2015. Best Available Techniques (BAT). Reference Document for the Production of Pulp, Paper and Board. European Comission. doi:10.2791/370629.
Vance-Harrop, M. H.; Gusmão, N. B.; Campos-Takaki, G. M., 2003. New bioemulsifiers produced by Candida lipolytica using D-glucose and babassu oil as carbon sources. Braz. J. Microbiol., 34.

87
APPENDIX B – A multi-criteria decision analysis of management alternatives for anaerobically digested kraft pulp mill sludges
Abstract
The Multi-Criteria Decision Analysis (MCDA) procedure was used to compare waste
management options for kraft pulp mill sludge after its anaerobic digestion. Anaerobic
digestion of sludge is advantageous because it produces biogas that may be used to
generate electricity, heat and biofuels. However, adequate management of the digested
sludge is essential. Landfill disposal is a non-sustainable waste management
alternative. Kraft pulp mill digested sludge applied to land may pose risks to the
environment and public health if the sludge has not been properly treated. This study
compared several recycling alternatives for anaerobically digested sludge from kraft
pulp mills: composting, incineration, pyrolysis/gasification, and algae production for
biofuels. The MCDA procedure considered nine criteria to compare digested sludge
recycling alternatives: CO2 emission, exposure to pathogens, risk of pollution, material
recovery, energy recovery, overall costs, value of products, maintenance and operation,
and feasibility of implementation in a kraft pulp mill. The most suitable management
options for the solids fraction of the digested sludge from kraft pulp mills were found
to be composting and incineration (when the latter was coupled with recycling ash to
the cement industry).
1. Introduction
Anaerobic digestion (AD) of sludge is being reported as a promising option by the
literature, because it produces biogas and ultimately energy. However, similar to other
processes, AD also generates a waste stream, in the form of digested sludge. Digested
sludge constitutes a major problem for final disposal due its high moisture content and
possible presence of environmental contaminants. To the best of our knowledge, there
are a number of studies related to the biogas production from kraft pulp mill sludges,
but none of them discuss managing the generated AD digested sludge. Based on results
obtained from recent renowned literature and on the Multi-Criteria Decision Analysis
(MCDA) tool, our study gives an insight into the possibilities for managing the kraft

88
pulp mill anaerobic digested sludge highlighting advantages and drawbacks for each
one.
The major emerging technologies to anaerobically digest sludges (Figure B.1) have
been described by Sheets et al. (2015).
Figure B.1. Processes for treatment and recycling anaerobic digested sludges (adapted). Source: SHEETS et al., 2015.
Landfilling is the most used method for handling AD sludge, however Nkoa (2013)
argues that this alternative might be harmful to the environment and to human health.
Sheets et al. (2015) agree with Nkoa (2013) and believe that other alternatives should
be sought for managing AD digested sludge besides landfill. In addition, Sheets et al.
(2015) found that composting is a promising technique for AD effluent treatment.
Huang et al. (2017) studied the composting of kitchen waste digested at the lab-scale,
obtaining remarkable results and showing that it is still possible to compost the
remaining organic matter from anaerobically digested wastes.
Anaerobic
digestionSludge
Biogas
Digested sludge
Land application
Composting Solid fraction
Liquid fractionMicrobial fuel
cells
Ammonia
stripping
Struvite
crystallization
Hydroponics
Algae production
Pyrolysis or
gasification
Cellulosic ethanol
Incineration
Fiber
Electricity
Lipids
Crops
Struvite fertilizer
(NH4)2SO4
fertilizer
Animal bedding
Dewatering
Syngas, bio-oil,
biochar
Ethanol
Energy + ash for
concrete
Particleboard
Landfill
WWTP

89
The objective of this study was to investigate, compare and select, using a simplified
MCDA procedure, the most suitable options for managing anaerobically digested
primary and secondary sludges from kraft pulp mills.
2. Material and methods
Six options for recycling pulp mill digested sludge were examined, based on the most
common management alternatives adopted in the USA, China and Brazil: land
application, landfill disposal, composting, incineration, pyrolysis/gasification, and
biofuel production by algae. The study data were obtained from published literature,
and the recycling alternatives were compared using MCDA, a procedure widely
accepted in solid waste management studies (Babalola, 2015; Yap and Nixon, 2015).
The method compares various alternatives having different criteria and considers the
opinion of stakeholders.
The environmental domain included the following decision criteria: CO2 emission;
exposure to pathogens; pollution risks; material recovery; and energy recovery. The
CO2 emissions were calculated using previously developed equations for landfill
disposal, land application, and composting (EPA, 2010). Exposure to pathogens, risk
of pollution, and material and energy recovery were based on the data in published
literature and previous research.
The criteria overall costs (which included costs for operation, maintenance,
transportation, labor, energy demand and, in some cases, quality control or soil testing)
and product value were selected based on the economic domain. The costs for all
options except algae production, were based on data from Stamatelatou and
Tsagarakis (2015). The product value was calculated using the average market value
in the USA of the product recovered (EPA, 1995; Orbite, 2016; Seenews, 2016; U.S.
Department of Energy, 2016).
Technical criteria were selected to ensure the feasibility of each recycling option for
the kraft pulp mill industry. The criteria for maintenance and operation, and for the
feasibility of implementing an option in kraft pulp mills, were chosen for this purpose.

90
Maintenance and operation refers to the recycling process and to the complexity of the
alternatives proposed. Implementation feasibility for kraft pulp mills refers to the
viability of adapting available management options to a typical kraft pulp mill.
The criteria were assigned different weight factors (WF1, WF2 or WF3) to denote the
perceived importance of the factor. The feasibility of implementing a digested sludge
alternative in kraft pulp mills (WF3) was designated as the most important criterion,
because it integrated the feasibility and adaptability of the technology to current
industry practices. The overall costs, product values, and maintenance and operation
criteria were each assigned a weight factor of two (WF2), according to their economic
attractiveness and feasibility importance. The weight factor of one (WF1) was
assigned to criteria for CO2 emission, exposure to pathogens, pollution risks, material
recovery, and energy recovery.
The options were ranked from one to six, i.e., from the worst (one) to the best (six),
based on the literature data and calculations. The calculated sum of each recycling
alternative was determined using the weight assigned per criterion. The higher the sum,
the better was the recycling alternative.
A survey of experts from kraft pulp mills and students from the environmental
engineering field was conducted to support the analysis. The participants were asked
to rank the alternatives described per criterion in a preference order.
An anaerobic digestion model developed by Rajendran et al. (2014) was used with the
software Aspen Plus® to estimate the digested sludge generation by a kraft pulp mill
located in the state of Minas Gerais, Brazil. Water (APHA, 2005), proteins (Detmman,
2012), lipids (APHA, 2005) and ash content (APHA, 2005) were characterized in the
sludge. The cellulose and hemicellulose contents of primary (Migneault, 2011) and
secondary (Kyllönen, 1988) sludge were based on data from published literature that
examined sludge from kraft pulp mills. The liquid and solid fractions of the kraft pulp
mill digested sludge were measure from the water fraction provided by the model in
Aspen Plus®.

91
3. Results and discussion
The characteristics of primary and secondary kraft pulp sludges are presented in Table
B.1. Both have high concentrations of fibers (cellulose and hemicellulose) that are
potential substrates for bacteria in the anaerobic digestion process. Nevertheless, their
protein content (i.e., nitrogen concentration) is low. The lack of nitrogen impairs
biogas production, because it is an essential element for bacterial growth.
Table B.1. Characteristics of the investigated kraft pulp mill sludges. The mixed sludges refer to the mixture between the primary and secondary sludges in 2.5:1 ratio
Component Primary sludge Secondary sludge Mixed sludge Water (%) 61.52 88.63 77.12
Cellulose (%) 15.67 0.77 7.09
Hemicellulose (%) 3.07 1.44 2.13
Protein (%) 0.47 3.24 2.06
Lipids (%) 0.92 0.37 0.60
Ash (%) 18.35 5.56 11.04
Total (%) 100 100 100
Production
Sludge (kgTS/d) 157,500 67,500 225,000
Sludge (kgwet/d) 409,304 593,668 1,002,971
The characteristics of the digested sludge predicted by the model simulation highlights
the efficiency of anaerobic digestion of secondary pulp mill sludge in comparison with
digestion of primary sludge. More residual solids remained after digestion of the
primary sludge compared to secondary sludge, which means that there is unused
potential for biogas production from primary sludge due to the lack of nitrogen in this
type of sludge (Table B.2).
Table B.2. Primary (PS), secondary (SS) and mixed digested sludges production Parameter PS SS Mixed Digested production (kg/yr) 1.38 x 10⁸ 2.08 x 10⁸ 3.46 x 10⁸ Liquid production (kg/yr) 8.86 x 10⁷ 1.89 x 10⁸ 2.76 x 10⁸
Solids production (kg/yr) 4.96 x 10⁷ 1.87 x 10⁷ 6.99 x 10⁷
TS: total solids
Using MCDA to evaluate the combined environmental, economic and technical
domains of alternatives, the options were ranked from best to worst as follows:
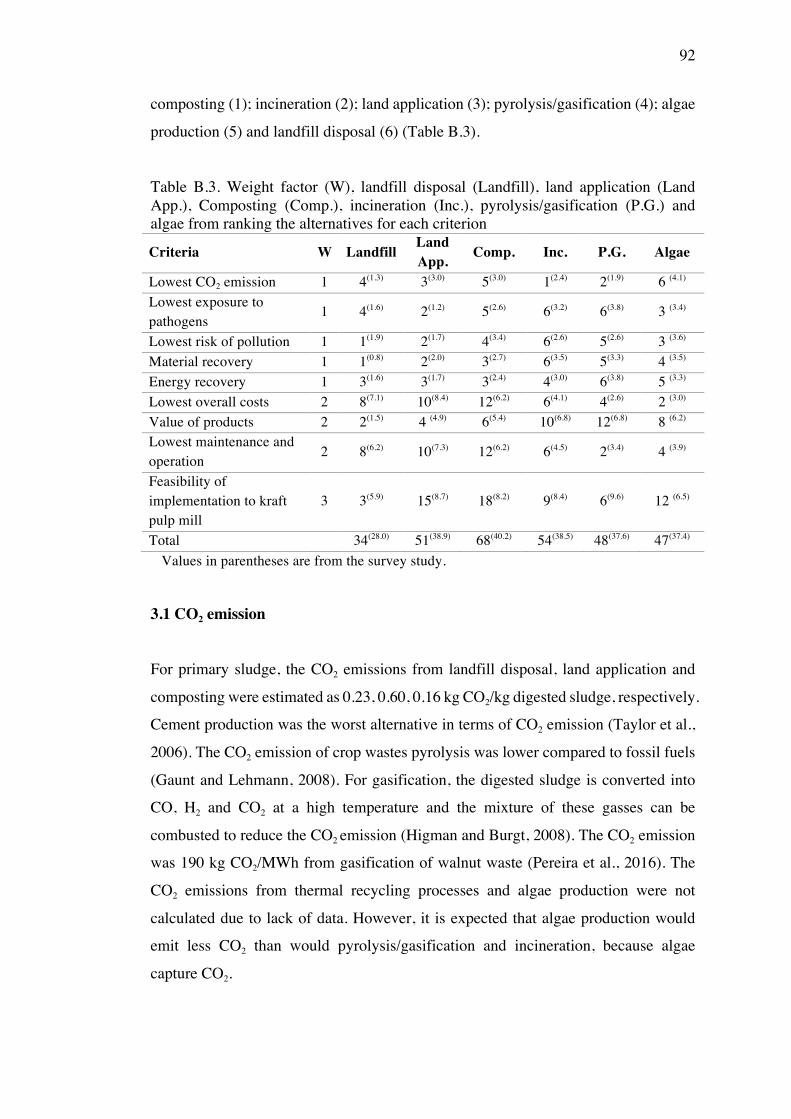
92
composting (1); incineration (2); land application (3); pyrolysis/gasification (4); algae
production (5) and landfill disposal (6) (Table B.3).
Table B.3. Weight factor (W), landfill disposal (Landfill), land application (Land App.), Composting (Comp.), incineration (Inc.), pyrolysis/gasification (P.G.) and algae from ranking the alternatives for each criterion
Criteria W Landfill Land App.
Comp. Inc. P.G. Algae
Lowest CO2 emission 1 4(1.3) 3(3.0) 5(3.0) 1(2.4) 2(1.9) 6 (4.1)
Lowest exposure to pathogens
1 4(1.6) 2(1.2) 5(2.6) 6(3.2) 6(3.8) 3 (3.4)
Lowest risk of pollution 1 1(1.9) 2(1.7) 4(3.4) 6(2.6) 5(2.6) 3 (3.6)
Material recovery 1 1(0.8) 2(2.0) 3(2.7) 6(3.5) 5(3.3) 4 (3.5)
Energy recovery 1 3(1.6) 3(1.7) 3(2.4) 4(3.0) 6(3.8) 5 (3.3)
Lowest overall costs 2 8(7.1) 10(8.4) 12(6.2) 6(4.1) 4(2.6) 2 (3.0)
Value of products 2 2(1.5) 4 (4.9) 6(5.4) 10(6.8) 12(6.8) 8 (6.2) Lowest maintenance and operation
2 8(6.2) 10(7.3) 12(6.2) 6(4.5) 2(3.4) 4 (3.9)
Feasibility of implementation to kraft pulp mill
3 3(5.9) 15(8.7) 18(8.2) 9(8.4) 6(9.6) 12 (6.5)
Total 34(28.0) 51(38.9) 68(40.2) 54(38.5) 48(37.6) 47(37.4)
Values in parentheses are from the survey study.
3.1 CO2 emission
For primary sludge, the CO2 emissions from landfill disposal, land application and
composting were estimated as 0.23, 0.60, 0.16 kg CO2/kg digested sludge, respectively.
Cement production was the worst alternative in terms of CO2 emission (Taylor et al.,
2006). The CO2 emission of crop wastes pyrolysis was lower compared to fossil fuels
(Gaunt and Lehmann, 2008). For gasification, the digested sludge is converted into
CO, H2 and CO2 at a high temperature and the mixture of these gasses can be
combusted to reduce the CO2 emission (Higman and Burgt, 2008). The CO2 emission
was 190 kg CO2/MWh from gasification of walnut waste (Pereira et al., 2016). The
CO2 emissions from thermal recycling processes and algae production were not
calculated due to lack of data. However, it is expected that algae production would
emit less CO2 than would pyrolysis/gasification and incineration, because algae
capture CO2.

93
3.2 Exposure to pathogens
For landfill disposal, the risk of exposure to pathogens is low if impermeable linings
protected by sand layers are applied to prevent leaching of contaminants to
groundwater (Powelson et al., 1991). Land application, without pre-treatment, showed
a significantly high risk of pathogen exposure. Therefore, sludge and digested sludge
have to meet quality standards regarding heavy metals, pathogens and vectors (EPA,
1994). The high temperatures for thermal recycling alternatives should inactivate
pathogens (Taruya et al., 2002). Nevertheless, pathogens inactivation also happens at
relatively low temperatures (50 °C) in a composting pile (Patterson and Kilpatrick,
1998). For algae production, the exposure to pathogens could cause occupational
health or environmental problems (NAS, 2012).
3.3 Risk of pollution
For landfill disposal, harmful contaminants can leach through the soil, polluting
groundwater and surface water. In addition, nutrients (N, P, K, Ca and Mg) at high
concentrations can leach to groundwater. The heavy metal content in digested kraft
pulp sludge does not exceed legal limits (Guerra et al., 2007), but potentially toxic
elements in the kraft pulp mill digested sludge are a risk in land application. Heavy
metals accumulate in agricultural soil and their persistence in topsoil causes problems
in the food chain (Alloway et al., 1990). Composting decreases the organic matter
content and dissolved organic carbon, resulting in a low heavy metal concentration in
the final compost (Miaomiao et al., 2009). Cement production from digested sludge
oxidizes organic pollutants and immobilizes heavy metals (Taruya et al., 2002). For
pyrolysis/gasification, digested sludge is first dried, pressed to pellets and then
combusted. In the combustion, organic pollutants are oxidized, but heavy metals
present in the feedstock will remain in the ash (Kratzeisen et al., 2010). Algae-bacterial
systems can remove organic pollutants, nutrients and heavy metals from wastewater
streams (Muñoz and Guieysse, 2006). However, well-mixed photobioreactors with
algal biomass recirculation can protect algae from the toxicity of the liquid fraction.
3.4 Material recovery

94
The disposal of sludge in a landfill is a waste of recyclable material that has both
fertilizer and calorific value (European Commission, 2001). The land application and
composting options allow the use of digested sludge in agricultural production as a
low-cost fertilizer with high quality. Incineration produces energy and ash from
digested sludge, and dried sludge can be used to produce cement. The heating value
of the sludge is lower than the raw sludge due to decreased organic content after
digestion, but incineration is still feasible (Sheets et al., 2015). Concerning pyrolysis,
the kraft pulp mill digested sludge can be converted into bio-oil, pyrolysis gas and
biochar. Bio-oil can replace crude oil, while pyrolysis gas can be used to produce
energy, and biochar is a good soil conditioner (Sheets et al., 2015). The gasification
process produces gas that can be used to produce electricity (Judex et al., 2012). Algae
production has potential applications, including biological CO2 sequestration and
wastewater treatment (Fernandes et al., 2014), but its most interesting application is
for biodiesel production (Mata et al., 2010).
3.5 Energy recovery
Landfill disposal, land application and composting of sludge do not enable energy
recovery. Raw sludge from wastewater treatment plants can be digested and
incinerated. Houdková et al. (2008) found the calorific value of digested sludge was
only 2.1 MJ/kg. In a study conducted by Cao and Pawlowski (2012), primary and
secondary sewage sludges were digested and pyrolyzed, producing 0.102 ton bio-oil
and 0.207 ton bio-char per ton of primary sludge, and 0.192 ton bio-oil and 0.407 ton
bio-char per ton of secondary sludge. Although that study (Cao and Pawlowski, 2012)
was conducted using sludge from municipal wastewater treatment, it gives an insight
in the energy production potential from kraft pulp mill digested sludges. Gasification
of sludge was found to produce 8.197 MJ/kg sludge, which was a lower energy value
than that of other feedstocks such as coal, vegetable oils, straw, wood and plants
(Ptasinski et al., 2007). Biofuel production from algae grown using digested kraft pulp
mill sludge as a substrate has not been reported.
3.6 Overall costs

95
Overall costs of each alternative sludge management option were described in Euros
(€) per ton of dry matter (Table B.4).
Table B.4. Alternative costs for handling the kraft pulp mill digested sludge (Stamatelatou and Tsagarakis, 2015)
Alternative Costs (€.t-1) Considered costs Landfill disposal 309 labor, vehicle fuel, electricity, landfill tax and gate fees
Land application 126–280 labor and regulatory testing of soil
Composting 90–160 labor
Incineration 332–441 labor, transport to site and quality control
Pyrolysis/gasification 332–441 labor, transport to site and quality control
Algae production no data –
Overall costs for large-scale algae production from sludge have been poorly studied;
however, these costs were estimated to be high due to maintenance and operation costs.
Dewatering the digested sludge might increase the costs associated with incineration
and pyrolysis/gasification due to the expected high moisture content of the kraft pulp
digested sludge.
3.7 Value of product
The revenue from digested sludge used for land application needs to be better studied;
in a 1995 study, a revenue value of US$ 34–36 per ton was found (EPA, 1995). The
inflation from 1995 to 2016 changes this value to US$ 53–100 per ton of digested
sludge. However, this was determined for treated sludge that was free of pathogens,
heavy metals and odor; comparable data are scarce about the value of composted
sludge. One ton of sludge dry solids (DS) were converted to 0.81 MWh through
incineration (Houdková et al., 2008). One MWh of biomass or coal was valued in
terms of the Brazilian real (R$) at R$ 251 (Seenews, 2016); therefore, the value of one
ton of sludge DS is valued at R$ 203.31 (US$ 58.18). The ash value of sludge DS was
estimated to be US$ 200 per ton (Orbite, 2016). One ton of digested sludge on a DS
basis produced 0.17 ton of ash (Houdková et al., 2008). Therefore, the value of one
ton of DS was set at US$ 34. Incineration of one ton of sludge DS is worth US$ 91.83.
Pyrolysis of one ton of digested primary sludge (DS basis) resulted in 0.102 ton bio-
oil and 0.207 ton bio-char. The selling price for bio-oil and bio-char are US$ 0.66/L

96
and US$ 0.4/kg, respectively (Fang et al., 2015). The value of one ton digested primary
sludge is US$ 80.84 for bio-oil, and US$ 82.80 for bio-char considering the density of
the bio-oil to be 1.2 kg/L, resulting in a total value of US$ 163.64 per ton of digested
primary sludge. One ton of digested secondary sludge (DS basis) produced revenue of
US$ 314.96 (Fang et al., 2015). Energy production from gasification was estimated to
be 8,197 MJ per ton sludge, i.e., 2.277 MWh per ton sludge (DS) (Ptasinski et al.,
2007). The Brazilian value of one MWh (R$ 251) (Climatescope, 2015) yields a
revenue of R$ 571.53 (US$ 163.56) per ton dry sludge.
For algae production, 4,558.71 m3 of wastewater is needed for 1 m3 of biodiesel, and
1 m3 of biodiesel results in revenue of US$ 636.65. Therefore, 1 m3 of digested sludge
(liquid fraction) is valued at US$ 7.16 (U.S. Department of Energy, 2016).
3.8 Maintenance and operation
In-situ composting is the preferred alternative regarding the maintenance and
operation criterion. Neither land application nor landfill disposal is complicated, but
each requires more maintenance in terms of labor and quality control than does
composting. Application of the digested sludge on land requires managers to minimize
odor potential, pathogens and other harmful constituents in sludge to acceptable levels
and frequently monitor possible environmental impacts using soil and groundwater
analyses (Saskatchewan, 2015). The kraft pulp mill digested sludge is too wet and
needs to be dewatered (Mata-Alvarez et al., 2000). The dewatering method needs to
be further studied for kraft pulp mill waste because the anaerobic digestion process
changes the capillary structure of the digested sludge, i.e., digestion alters the binding
of water inside crevices and interstitial spaces that exist on and between particles and
organisms (García-Bernet et al., 2011).
Thermal treatment alternatives and algae production are more complex to operate than
other alternatives. The kraft pulp mill digested sludge needs to be dewatered prior
incineration. The dewatering requirement constitutes a major challenge because kraft
pulp mill digested sludge has high moisture content. Gaseous emissions require air
pollution control equipment. A major advantage of the thermal treatment alternative

97
is to incinerate the kraft pulp mill in a biomass boiler. The bottom ash, a solid residue
after incineration, can be used in cement production.
The relative complexity of pyrolysis processing equipment is the major disadvantage
of this process. Pyrolysis involves a complex series of chemical reactions to
decompose organic materials and produce oils, gases and char (Kim and Parker, 2007).
The major challenge of algae production is to implement an integrated system that
combines large-scale production and algae harvesting to produce biofuels. Further
investigation and development of large-scale production and harvesting methods for
biofuels are necessary (Christenson and Sims, 2011).
3.9 Feasibility of implementation in kraft pulp mills
Landfilling of kraft pulp mill digested sludge is easily implemented; however, this
alternative is outdated and has environmental risks, and does not accrue economic
profits or facilitate any material or energy recovery. Land application of kraft pulp
mill digested sludge is feasible to implement, but the possible pathogen contamination
and heavy metal content need to be studied. Heavy metal content of raw kraft pulp
sludge is low (Guerra et al., 2007). Composting allows reactors (i.e., compost piles)
to be placed and operated on-site at a kraft pulp mill, if area is available. Incineration
(which can take place in the biomass boiler of a kraft pulp mill) combined with ash
utilization (in the cement industry) are promising solutions for managing kraft mill
sludge. Pyrolysis and gasification of the digested sludge, when compared to
incineration, have the disadvantage of being difficult to implement on-site at a kraft
pulp mill (Huang and Tang, 2016). In addition, these alternatives require high-cost
investments. Thermal treatment is also an alternative of questionable feasibility
because of the high moisture content in the kraft pulp mill digested sludge. Algae
production seems a promising alternative, but more research is needed to determine
its feasibility for managing digested sludge from a kraft pulp mill, since this type of
sludge lacks some essential constituents, such as nitrogen. An option for solving this
problem would be to apply a thermal pre-treatment (Jian et al., 2016) or ultrasound
treatment (Li et al., 2016) to solubilize the sludge.

98
4. Conclusion
• Composting appeared to be the most suitable alternative for recycling the
anaerobically digested sludge from kraft pulp mills.
• Composting is safe and produces low-cost fertilizer for agriculture. There is
no energy recovery, but the overall costs are low and the process is feasible to
implement.
• The incineration alternative may be easy to implement at a kraft pulp mill
biomass boiler, because it includes energy recovery, and the ash generated can
be recycled into cement production. Nevertheless, the incineration process is
more complex and has higher costs compared to composting.
• The only difference between the opinion survey and the research based on
literature and calculations was the score determined for the land application
alternative, which was considered by the survey participants to be a better
alternative than incineration.
• This study gave an insight into the advantages and disadvantages of various
alternatives for managing anaerobically digested kraft pulp mill sludge.
Acknowledgements
The authors would like to thank students and experts for their time in responding to
the opinion survey.

99
References
Alloway, B.J.; Jackson, A.P.; Morgan, H. The accumulation of cadmium by vegetables grown on soils contaminated from a variety of sources. Science of the total Environment 91(1990) 223-236. APHA. Standard methods for the examination of water and wastewater. American Public Health Association. Washington, DC, USA; 21st ed., 2005. Babalola, M.A. A Multi-criteria decision analysis of waste treatment options for food and biodegradable waste management in Japan. Environments 2(2015) 471-488. Cao, Y.; Pawlowski, A. Sewage sludge-to-energy approaches based on anaerobic digestion and pyrolysis: Brief overview and energy efficiency assessment. Renewable and Sustainable Energy Reviews 16(2012) 1657-1665. Christenson, L.; Sims, R. Production and harvesting of microalgae for wastewater treatment, biofuels, and bioproducts. Biotechnology Advances 29(2011) 686-702. Climatescope. Global Climatescope. Available at: http://globalclimatescope.org/en/ country/brazil/#/details. 2015. (accessed on: 07.062015). Detmann, E.; Souza, M.A.; Valadares Filho, S.C.V.; Queiroz, A.C.; Berchielli, T.T.; Saliba, E.O.S.; Cabral, L.S.; Pima, D.S.; Ladeira, M.; Azevedo, J.A.G. Métodos para Análise de Alimentos. INCT – Ciência Animal. Visconde de Rio Branco, MG: Suprema, 2012. 214p. EPA, US Environmental Protection Agency. A guide for land appliers on the requirements of the federal standards for the use or disposal of sewage sludge. Washington, DC: Office of Enforcement and Compliance Assurance, 1994. EPA, US Environmental Protection Agency. Greenhouse gas emissions estimation methodologies for biogenic emission from selected source categories: solid waste disposal, wastewater treatment, ethanol fermentation. United States: EPA, 2010. EPA, US Environmental Protection Agency. Land application of sewage sludge and domestic septage. Washington, DC: Environmental Protection Agency, 1995. European Commission, Disposal and recycling routes for sewage sludge. Part 2- Regulatory report. Luxembourg: Office for Official Publications of the European Communities, 2001.

100
Fang, Z.; Smith, R.L.; Qi, X. Production of biofuels and chemicals with microwave. China: Springer, 2015. Fernandes, L.; Lucas, M.S.; Maldonado, M.I.; Oller, I.O.; Sampaio, A. Treatment of pulp mill wastewater by Cryptococcus podzolicus and solar photo-Fenton: A case study. Chemical Engineering Journal 245(2014) 158–165. García-Bernet, D.; Buffière, P.; Latrille, E.; Steyer, J.; Escudié, R. Water distribution in biowastes and digestates of dry anaerobic digestion technology. Chemical Engineering Journal 172(2011) 924–928. Gaunt, J.L.; Lehmann, J. Energy balance and emissions associated with biochar sequestration and pyrolysis bioenergy production. USA: Environmental Science Technology, 2008. Guerra, M.S.A.L; Silva, C.M.; Rossoni, H.A.V.; Rezende, A.A.; Landim, A.B.; CARVALHO, S.T. Absorption potential of heavy metals and organochlorine compost (PCDD and PCDF) in Brassica juncea using compost and bio-sludge from an Eucalyptus kraft bleached pulp mill. In. LeBlanc, Ronald J; Laughton, Peter J; Tyagi, Rajesh. Moving forward wastewater biosolids sustainability: technical, managerial, and public synergy. New Brunswick, GMSC, 2007. p.641-647. Higman, C.; Burgt, M. Gasification. 2. ed. Elsevier, 2008. Houdková, L.; Boráň, J.; Ucekaj, V.; Elsäßer, T.; Stehlík, P. Thermal processing of sewage sludge – II. Applied Thermal Engineering 28(2008) 2083–2088. Huang, R.; Tang, Y. Evolution of phosphorus complexation and mineralogy during (hydro) thermal treatments of activated and anaerobically digested sludge: Insights from sequential fractionation and P K-edge XANES. Water Research 100(2016) 439-447. Huang, Y.L.; Sun, Z.-Y.; Zhong, X.Z.; Wang, T.T.; Tan, L.; Tang, Y.Q.; Kida, K. Aerobic composting of digested residue eluted from dry methane fermentation to develop a zero-emission process. Waste Management In Press Corrected Proof. (2017).
http://dx.doi.org/10.1016/j.wasman.2017.01.007. Jian, Z.; Shuangfei, W.; Shiguang, L.; Ping, X.; Tian, X. Kinetics of combined thermal pretreatment and anaerobic digestion of waste activated sludge from sugar and pulp industry. Chemical Engineering Journal 295(2016) 131–138. Judex, J.W.; Gaiffi, M.; Burgbacher, H.C. Gasification of dried sewage sludge: Status of the demonstration and the pilot plant. Waste Management 32(2012) 719-723.

101
Kim, Y.; Parker, W. A technical and economic evaluation of the pyrolysis of sewage sludge for the production of bio-oil. Bioresource Technology 99(2007) 1409-1416. Kratzeisen, M.; Starcevic, N.; Martinov, M.; Maurer, C.; Müller, J. Applicability of biogas digestate as solid fuel. Fuel, 89(2010) 2544-2548. Kyllönen, H.L.; Lappi, M.K.; Thun, R.T.; Mustaranta, A.H. Treatment and characterization of biological sludges from the pulp and paper industry. Water Science Technology, 20(1988) 183-192. Li, X.; Zhu, T.; Zhang, K.; Lv, L.; Shen, Y.; Chai, T.; Wang, Y.; You, M.; Xie, Y. Enhanced sludge degradation process using a microbial electrolysis cell in an up-flow anaerobic sludge blanket reactor with ultrasound treatment. Chemical Engineering Journal 306(2016) 17–21. Mata-Alvarez, J.; Macé, S.; Llabrés, P. Anaerobic digestion of organic solid wastes. An overview of research achievements and perspectives. Bioresource Technology 74(2000) 3-16. Mata, T.M.; Martins, A.A.; Caetano, N.S. Microalgae for biodiesel production and other applications. Renewable and Sustainable Energy Reviews, 14(2010) 217-232. Miaomiao, H.; Wenhong, L.; Xinqiang, L.; Donglei, W.; Guangming, T. Effect of composting process on phytotoxicity and speciation of copper, zinc and lead in sewage sludge and swine cow dung. Waste Management 29(2009) 590-597. Migneault, S. Recylage des residuos papetiers pour la production de panneaux de fibres. 2011.128f. Thesis (Sciences du bois) - Université Laval, Québec, 2011. Muñoz, R.; Guieysse, B. Algal–bacterial processes for the treatment of hazardous contaminants: a review. Water Research, 40(2006) 2799-2815. NAS, Sustainable Development of Algal Biofuels in the United States. United States of America: The National Academies Press, 2012. Nkoa, R. Agricultural benefits and environmental risks of soil fertilization with anaerobic digestates: a review. Agron. Sustain. Dev. (2013). doi 10.1007/s13593-013-0196-z. Orbite, Orbite Technologies. Available at: http://www.orbitetech.com, 2016. (accessed on: 12.05.2016).

102
Patterson, M.F.; Kilpatrick, D.J. The combined effect of high hydrostatic pressure and mild eat on inactivation of pathogens in milk and poultry. Journal of Food Protection 61(1998) 432-436. Pereira, E.I.; Suddick, E.C.; Six, J. Carbon Abatement and Emissions Associated with the Gasification of Walnut Shells for Bioenergy and Biochar Production. California, USA: Elsevier, 2016. Powelson, D.K.; Simpson, J.R.; Gerba, C.P. Effects of organic matter on virus transport in unsaturated flow. Applied Environmental Microbiology, 57(1991) 2192-2196.
Ptasinski, K.J.; Prins, M.J.; Pierik, A. Exergetic evaluation of biomass gasification. Energy 32(2007) 568-574. Rajendran, K.; Kankanala, H.R.; Lundim, M.; Taherzadeh, M.J.A. A novel process simulation model (PSM) for anaerobic digestion using Aspen Plus. Bioresource Technology, v.168, p.7-13, 2014.
Saskatchewan, R. Land Application of Municipal Sewage Sludge Guidelines. Water Security Agency, 2015. Sheets, J.; Yang, L.; Ge, X.; Wang, Z.; Li, Y. Beyond land application: Emerging technologies for the treatment and recycling of anaerobically digested agricultural and food waste. Waste Management 44(2015), 94-115. Seenews. Brazil sets bidding cap for April 29 auction, lowest is for wind, Available at: http://renewables.seenews.com/news/brazil-sets-bidding-cap-forapril-29-auction-lowest-is-for-wind-519097, 2016. (accessed on: 12.05.2016). Stamatelatou, K.; Tsagarakis, K.P. Sewage Treatment Plants: Economic Evaluation of Innovative Technologies for Energy Efficiency. London: IWA Publishing, 2015. Taruya, T.; Okuno, N.; Kanaya, K. Recycling of sewage sludge as raw material of Portland cement in Japan. Water Science Technology 46(2002) 255-258. Taylor, M.; Tam, C.; Gielen, D. Energy Efficiency and CO2 Emissions from the Global Cement Industry. Paris: International Energy Agency, 2006.
U.S. Department of Energy. Alternative Fuels Data Center. Available at: http://www.afdc.energy.gov/fuels/prices.html, 2016. (accessed on: 12.05.2016).

103
Yap, H.Y.; Nixon, J.D.A. A multi-criteria analysis of options for energy recovery from municipal solid waste in India and the UK. Waste Management 46(2015) 265-277.