About NICOLE Brasilnicolebrasil.com.br/wp-content/uploads/White-Paper... · 3.4.1 Development of...
81
Transcript of About NICOLE Brasilnicolebrasil.com.br/wp-content/uploads/White-Paper... · 3.4.1 Development of...
Ficha Catalográfica
Elaborada pela NICOLE Brasil – Latin America Network for Soil and Water Management
Gouvêa Júnior, José Carlos Rocha [et al]
Intrusão de Vapores em Ambientes Fechados – Conceitos Básicos, Avaliação e
Gerenciamento de Áreas Contaminadas no Brasil/ José Carlos Rocha
Gouvêa Júnior [et al]. São Paulo, 2016.
81p.
White Paper - NICOLE Brasil – Latin America Network for Soil and Water
Management. Grupo de Trabalho: Intrusão de Vapores
Inclui Bibliografia
1. Gerenciamento de áreas Contaminadas 2. Intrusão de vapores 3. Ambientes
fechados 4. Análise de Riscos 5. Solo 6. Água subterrânea 7. White Paper
I. NICOLE Brasil – Latin America Network for Soil and Water Management. Grupo
de Intrusão de Vapores
1 1

About NICOLE Brasil:
Disclaimer:
Acknowledgements:
Members of NICOLE Brasil Working Group Vapor Intrusion want to recognize
individuals, organizations and agencies who contributed to this guidance
document. The author of the document José Carlos Rocha Gouvêa Junior
(Companhia Siderúrgica Nacional) would like to acknowledge the efforts of
individual team co-authors:
Aline Vilas Boas Delgado, Enfil S/A
Anne Takamori, Dn&A
James Henderson, DuPont
Márcio Alberto, Enfil S/A
Rivaldo Mello, Independent consultant
And finally, it was due to lower efforts of employees who contributed throughout
the document development process that the author and co-authors would like to
acknowledge:
Camila Silva, Angel Ambiental
Fellippe Avarino, Tetra Tech
Lais Trento, University of Western Ontario
Maria Cristina Lemes, DuPont
Rafael Sato, KW Ambiental
Rodrigo Figueiredo, New Fields
Suzana Kraus, DuPont
Tiago Moura, New Fields
Abstract
Brazil is a country blessed with an abundant natural resource base, burgeoning
economy and population, and strategic positioning within a developing
international region. But this position of relative privilege has come at a high
environmental cost. Despite the country’s well-developed environmental
consciousness, with roots in a decades-long struggle to preserve its Amazon
rainforests, much needs to be done in Brazil to rectify past environmental ills
that afflict the entire country.
Of particular interest, and the subject of growing public awareness, are
contaminated lands in the nation’s major industrial areas (São Paulo, Rio de
Janeiro, etc.), and increasingly, in less populated zones. Largely unchecked
industrial growth and the reuse of contaminated areas by the country’s
expanding housing market have caused several highly publicized incidents of
acute indoor air contamination. For example, a commercial supermarket built on
a former unregulated landfill resulted in the vapor intrusion of methane and
temporary closure of the establishment (CETESB, 2015). Incidents such as this
can occur when stakeholders are ignorant of the potential for vapor intrusion
and contaminated land is redeveloped for inappropriate uses.
Increasing public awareness and greater regulatory scrutiny have meant that
indoor air quality is now of concern to Brazil’s governmental agencies, as well
as other stakeholders involved. Despite that, technical guidance on the issue
almost exclusively hails from North America and Europe. While such expertise
is certainly relevant on its technical merit alone, it cannot acknowledge or
consider country-specific physical and contextual realities which may or may not
be adequately represented; as such, a concerted technical response to the
issue itself necessarily starts from a position of disadvantage.
The present document seeks to change that. NICOLE Brasil was founded in
2014 by a network of industrial and consulting companies with the intent of
addressing complex contamination issues as a diverse, collaborative group.
The organization follows in the model of NICOLE Europe, which has more than
20 years of history finding solutions to a variety of environmental challenges.
NICOLE Brasil (http://www.ekosbrasil.org.br/nicole.html) chose vapor intrusion
as a focus area for the 2015 technical program and formed a Working Group to
research the issue.
The Working Group has produced this White Paper in an effort to provide an
authoritative and country-specific treatise on vapor intrusion for the benefit of all
stakeholders in Brazil, whether they are academia, government, industry,
consulting, or the interested public. Hopefully, this White Paper will also clarify
the research needs in this area within Brazil. Special care has been taken to
focus this technical analysis on the Brazilian reality. Where possible, expertise
and sources from North America and Europe have been combined with Brazil-
specific knowledge. The members of the Working Group gratefully acknowledge
the assistance of our reviewers for their invaluable feedback:
Blayne Hartman, Hartman Environmental Geocience
Craig A. Cox, Cox Associates Consulting
Harry O’Neal, Beacon
John T. Wilson, Scissortail Environmental Solutions, LLC
Laura Trozzolo, TRC Solutions
Lowell Kessel, Envirologek
Paul Nathanail, University of Nottingham
Robin V. Davis, USEPA Utah
Yours Sincerely,
The NICOLE Brasil Vapor Intrusion Working Group (undersigned),
____________________________ ________________________
José Carlos Rocha Gouvêa Júnior James Henderson Working Group Leader President NICOLE Brasil
LIST OF FIGURES
Figure 01 – Conceptual basis of the migration process for subsurface vapors to indoor
environments and the relationship between the main parameters involved ................... 18
Figure 02 – Basic types of constructions considered in evaluating the indoor vapor
intrusion process ............................................................................................................ 24
Figure 03 – Causes of longitudinal mechanical dispersion in the size scale referring to
the pores .......................................................................... Erro! Indicador não definido.1
Figure 04 – Typical constructive profile for vapor sample wells ............................................ 42
Figure 05 – Conceptual model of Vapor Transport from a source of LNAPL or from
Dissolved Phase ............................................................................................................. 54
Figure 06 – Base Conceptual basis of Johnson and Ettinger algorithm and the
relationship between the eight primary input parameters on the primary modelErro! Indicador não definido.0
Figure 07 – Input screen of the reverse calculation spreadsheet of USEPA ......................... 64
Figure 08 – Example of data entry screen of the BioVapor software .................................... 66
Figure 09 - An illustration of the kinetic isotope effect. .......................................................... 68
Figure 10 - Conceptual Model, Vapors Intrusion .................... Erro! Indicador não definido.0
Figure 11 - SUMMA Canister ................................................................................................. 71
Figure 12 - Schematic representation of the dissolution sample tube device ........................ 72
LIST OF BOARDS
Board 01 – Summary of fundamental differences between the model of Johnson and
Ettinger and USEPA's spreadsheets .............................................................................. 65

LIST OF TABLES
Table 01 – Potential sources of BTEX release indoors ........ Erro! Indicador não definido.28
Table 02 – Summary of sampling methods commonly used to collect subsurface
vapors ............................................................................................................................. 47
Table 03 – Summary of analytical methods for quantification of compounds in vapor
phase ................................................................................. Erro! Indicador não definido.
LIST OF PHOTOGRAPHS
Photograph 01 – Combustion of gases and vapors from a subsurface source ..................... 19
Photograph 02 – Installation of asphalt barrier ...................................................................... 24
Photography 03 – Example of diffusion of potassium permanganate in water ...................... 29
LIST OF GRAPHS
Graph 01 – Characteristic concentration profile indicating aerobic biodegradation of
hydrocarbons .................................................................... Erro! Indicador não definido.
Graph 02 – Clean soil thickness necessary to mitigate concentrations of benzene in
vapor phase associated with various concentration ranges in dissolved phase ............ 35
Graph 03 – Clean soil thickness necessary to mitigate concentrations of benzene vapor
associated with sources with product free phase ........................................................... 36
Graph 04 – Attenuation factor for vapors in the soil depending on the depth of the
source of vapors in dissolved phase .............................................................................. 62
INDEX
1 - INTRODUCTION .................................................................................................. 15
2 – TECHNOLOGIES AND APPLICATION .............................................................. 16
3 – CONCEPT REVIEW ............................................................................................ 19
3.1 - Vapor Sources ............................................................................................................................................... 20
3.2 – Physical Environment Variables .................................................................................................................. 21
3.2.1 Soil Profile 21
3.2.2 Physical characteristics of Brazilian soil 22
3.2.3 Weather Conditions 23
3.2.4 Construction characteristics of the buildings 24
3.2.5 Background Concentrations 26
3.3 Vapor Transport Mechanisms in subsurface ..................................................................................... 27
3.3.1 Diffusion 27
3.3.2 Advection 30
3.3.3 Mechanical Dispersion 31
3.3.4 Partition between phases 32
3.3.5 Biodegradation 33
3.3.6 Ethanol influence 38
3.4 Investigation of occurrence of vapor in the subsurface ..................................................................... 40
3.4.1 Development of the conceptual model 40
3.4.2 Selection of sampling points 42
3.4.3 Installation of monitoring wells for soil vapor sampling 43
3.4.4 Procedures for soil vapor sampling 45
3.4.5 Analytical Methods 49
3.4.6 Interpretation of results 50
3.4.7 Evaluation of vapor intrusion according to standards established on Board Decision No.
263/2009 of CETESB 51
3.4.8 Evaluation of vapor intrusion according to EPA’s 2015 technical guide 53
3.4.9 Technical guides to handle petroleum vapor intrusion 54
3.5 Mathematical Modelling and Calculation of Target Levels .............................................................. 58
3.5.1 Johnson and Ettinger Algorithm 59
3.5.2 CETESB spreadsheets for risk assessment in contaminated areas 61
3.5.3 USEPA Spreadsheets 62
3.5.4 BioVapor 66

4 - USE OF COMPOUND-SPECIFIC ISOTOPE ANALYSIS (CSIA) TO DIFFERENTIATE INDOOR POLLUTION SOURCES ..................... 68
4.1 - Introduction ................................................................................................................................................... 68
4.2 - What is an isotope? ....................................................................................................................................... 68
4.3 - Use of CSIA on Vapor Phase ........................................................................................................................ 70
4.4 - Methodology of isotope testing for indoor contamination ............................................................................ 71
4.5 - Case Study in Brazil ...................................................................................................................................... 72
REFERENCES.. ........................................................................................................ 73
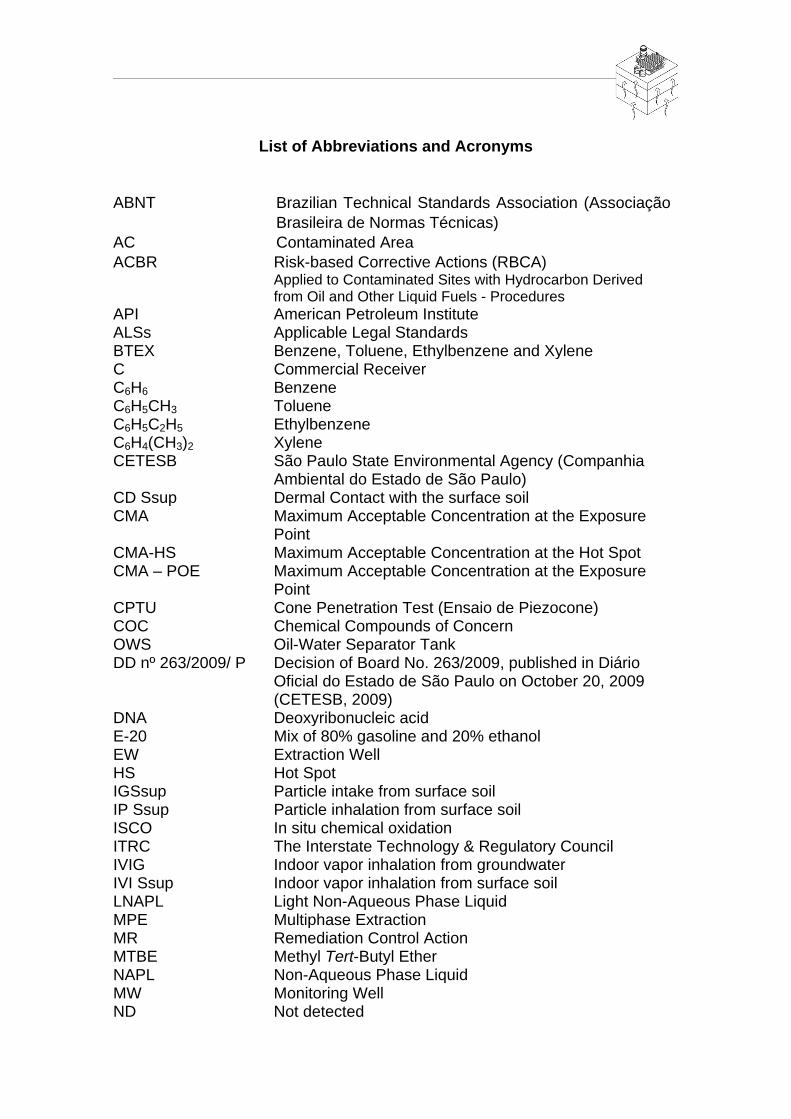
List of Abbreviations and Acronyms
ABNT Brazilian Technical Standards Association (Associação
Brasileira de Normas Técnicas)
AC Contaminated Area
ACBR Risk-based Corrective Actions (RBCA) Applied to Contaminated Sites with Hydrocarbon Derived from Oil and Other Liquid Fuels - Procedures
API American Petroleum Institute ALSs Applicable Legal Standards BTEX Benzene, Toluene, Ethylbenzene and Xylene C Commercial Receiver C6H6 Benzene C6H5CH3 Toluene C6H5C2H5 Ethylbenzene C6H4(CH3)2 Xylene CETESB São Paulo State Environmental Agency (Companhia
Ambiental do Estado de São Paulo) CD Ssup Dermal Contact with the surface soil CMA Maximum Acceptable Concentration at the Exposure
Point CMA-HS Maximum Acceptable Concentration at the Hot Spot CMA – POE Maximum Acceptable Concentration at the Exposure
Point CPTU Cone Penetration Test (Ensaio de Piezocone) COC Chemical Compounds of Concern OWS Oil-Water Separator Tank DD nº 263/2009/ P Decision of Board No. 263/2009, published in Diário
Oficial do Estado de São Paulo on October 20, 2009 (CETESB, 2009)
DNA Deoxyribonucleic acid E-20 Mix of 80% gasoline and 20% ethanol EW Extraction Well HS Hot Spot IGSsup Particle intake from surface soil IP Ssup Particle inhalation from surface soil ISCO In situ chemical oxidation ITRC The Interstate Technology & Regulatory Council IVIG Indoor vapor inhalation from groundwater IVI Ssup Indoor vapor inhalation from surface soil LNAPL Light Non-Aqueous Phase Liquid MPE Multiphase Extraction MR Remediation Control Action MTBE Methyl Tert-Butyl Ether NAPL Non-Aqueous Phase Liquid MW Monitoring Well ND Not detected

NW Northwest O2 Oxygen OSWER Office of Solid Waste and Emergency Response OVIG Outdoor vapor inhalation from groundwater OVI Ssup Outdoor vapor inhalation from surface soil pH Hydrogen ionic Potential PVI Petroleum Vapor Intrusion QL Quantification Limit R Residential Receiver RAIS The Risk Assessment Information System SSTL Site Specific Target Level TO 14 Methods for the determination of toxic organic
compounds in ambient air - determination of volatile organic compounds (VOCs) in ambient air using specially prepared canisters with subsequent analysis by gas chromatography
TO 15 Methods for the determination of toxic organic compounds in ambient air - determination of volatile organic compounds (VOCs) in air collected in specially-prepared canisters and analyzed by gas chromatography/ mass spectrometry (GC/MS)
TO 17 Methods for the determination of toxic organic compounds in ambient air - determination of volatile organic compounds in ambient air using active sampling on to sorbent tubes
TNT Trinitrotoluene TPH Total Petroleum Hydrocarbons USEPA United States Environmental Protection Agency VI Intervention Values for underground Water on Estado
de São Paulo - CETESB, Board decision n. 195-2005 from 23/11/2005
VI Ssup Vapor inhalation from surface soil VOC Volatile Organic Compounds

List of Symbols
: Attenuation Factor [ - ]
Koc : Coefficient of organic carbon-water partition
[mL/g]
Kow : Coefficient of Octanol-water partition [mL/g]
J : Diffusive flow
D : Diffusion coefficient [cm2/s]
C : Concentration of solute [g/cm3]
x : Relative position
t : Time [ s ]
dC/dx : Concentration Gradient [g/cm3/cm]
D* : Coefficient of effective diffusion [cm2/s]
ω : Coefficient of tortuosity
Do : Diffusion coefficient in a free solution
Vx : Percolation rate [cm/s]
K : Permeability Coefficient [cm/s]
n : Porosity [cm3-void/cm3-soil]
i : Hydraulic Gradient [ % ]
AB : Building surface area in contact with the soil
[m2]
Deffcrack : Overall coefficient of effective
diffusion of vapor through cracks in the walls and foundation
[mcrackeff2/d]
DeffT : Overall coefficient of effective
diffusion of vapor in the soil column between the foundation and the source
[m2/d]
Lcrack : Floor slab thickness [m]
LT : Distance (Depth) to the vapor source, as measured from the slab
[m]
QB : Volumetric air flow [m3/d]
η : Fraction of cracks in the foundation [m2/m2]

Qsoil : Underground gas flow directed by pressure to the indoor environment
[m3/d]
Cindoor : Indoor air concentration [g/m3]
Csource : Source concentration [g/L]
θ Tsoil : Soil porosity [cm3-void/cm3-soil]
θ w-soil : Humidity in the unsaturated zone [cm3-water/cm3-soil]
foc : Fraction of organic carbon in soil [ % ]
ρS : Soil Density (total) [g-soil/cm3-soil]
T : Temperature [ ºC ]
θw : Water Content in Soil [ % ]
θw,cap : Humidity in the capillary fringe [ % ]
CZh : Height of the capillary fringe [ cm ]
EB : Ratio of air exchange [h-1]
HB : Mixing zone height inside the building [ m ]
FB : Building Area [ m2 ]
EDnc : Duration of exposure to non-carcinogenic compounds
[years]
EFc : Frequency of exposure to carcinogenic compounds
[days/year]
ATc : Average duration of exposure to carcinogenic compounds
[years]
EFnc : Frequency of exposure to non-carcinogenic compounds
[days/year]
ATnc : Average time for non-carcinogenic compounds
[days/year]
THQ : Target level of individual risk quotient [ - ]
Lmix : Air mixing height of indoor environmental
[cm]
ER : Air Exchange rate [1/day]
θ Tcrack : Total Porosity [cm3-void/cm3-soil]
θ w-crack : Porosity filled with water [cm3-void/cm3-soil]
Qs : Air flow through foundation [cm3-air/sec]

TR (-) : Risk index (carcinogenic) [ - ]
ATHC : Average time of exposure [ yrs ]
BW : Average body weight [ Kg ]
ED : Exposure duration [ yrs ]
EF : Exposure Frequency [days/yrs]
CF (-) : Adjustment factor for indoor inhalation
[ - ]
< : Concentration lower than the quantification limit of the method used by the laboratory
EDc : Duration of exposure to carcinogenic compounds
[years]
αSG : Attenuation factor for soil vapors [ - ]
αGW : Johnson & Ettinger Attenuation factor for groundwater
[ - ]

15
1 - INTRODUCTION
The process of migration of volatile chemical compounds, in vapor phase,
from a subsurface source to the interior of buildings on the surface is known as
vapor intrusion. The volatile chemical compounds in soil and contaminated
groundwater can vent vapors with the potential to migrate through the layer of
soil subsurface and through cracks, fractures, and discontinuities that may exist
on the foundations, reach indoor environments, and affect air quality on the site.
In extreme cases, the accumulated vapors inside buildings may pose an
imminent risk, such as an explosion. However, in most cases, only low
concentrations of the chemicals of interest are observed. Over a long exposure
duration, these low concentrations can increase the risk of chronic health
effects on receptors in these spaces (USEPA, 2002).
Indoor intrusion of vapors from soil and / or groundwater is the result of a
complex series of physical and chemical processes that occur in landfills,
industrial plants, fuel distribution and storage points and other places where
products containing organic volatile compounds are stored, handled or
transported.
Several environmental regulatory agencies around the world have
recognized the importance of this route of exposure and require its
consideration when analyzing risks to human health in areas potentially
contaminated by the presence of volatile organic compounds.
Currently in Brazil, the need of intervention methods is verified through
comparative tables between the concentrations detected in soil samples and
groundwater, the maximum acceptable concentrations according to the distance
to the receptor, and applicable legal standards. These comparisons are used to
elaborate risk maps that identify sites that pose an unacceptable risk and
require intervention.
This analysis method can be considered conservative as important
variables associated with attenuation processes that occur during transport of
the contaminants from the vapor source to the environments in study, such as
biodegradation, are not included in this approach or are treated in a generic
16
way. However, improving site-specific, quantifiable information about these
processes could be quite costly and in some cases technically impossible,
particularly when there is large spatial and temporal variability.
Considering these challenges, data obtained directly from sampling vapors
in the subsurface near the exposure point can provide a more accurate estimate
of subsurface concentrations that have real potential to reach the receptors
present indoors.
However, for this process to be consistent and more accurately represent
risk to human health, the results and concentrations quantified directly in vapor
phase should be compared to appropriate standards, determined using the
physical parameters of the place and specific characteristics of receptors and
buildings that exist in the affected areas.
In this context, this study presents a proposal for addressing this potential
route of exposure, based on performing systematic evaluations, considering
that various parameters of the physical environment of the evaluated sites can
significantly influence this process, including geotechnical and geological
characteristics, nature of the contamination, location of the vapor sources and
characteristics of buildings on the surface.
2 – TECHNOLOGIES AND APPLICATION
The importance of vapor intrusion has been the subject of debate between
the scientific and regulatory communities for over two decades. Initially, the
focus of the research was limited to the migration of radon naturally present in
soils and gases from landfills to closed environments (MCHUGH & NICKELS,
2008).
In the early 90s, the indoor vapor intrusion process attracted the interest of
North American environmental agencies during the implementation of a new
approach to corrective action (Risk Based Corrective Action) that focused on
addressing risks to human health. In 1991, Johnson and Ettinger (1991)
published a model that built on radon intrusion models to assess diffusive and
advective flows from a much wider category of subsurface contamination. The

17
results of this model provide an attenuation factor (), considering the depth of
the source of vapors and specific geotechnical characteristics of the evaluated
areas. With the use of specific mitigating factors, the vapor concentrations
expected in indoor air are estimated, allowing an evaluation of exposure to
these concentrations in terms of risk to human health.
During the second half of the 1990s, various North American State
environmental agencies and the USEPA (USEPA, 2002) used the Johnson and
Ettinger (1991) model, associated with some conservative assumptions, to
calculate risk-based target levels for groundwater, to predict the degree of
exposure to indoor air receptors impacted by the presence of volatile organic
compounds in the subsurface.
In the late 1990s, the intrusion of vapors attracted public attention in the
United States when two areas in Colorado located above a chlorinated solvent
groundwater plume were found to have indoor air concentrations that exceeded
the established target levels. To support a response action in these cases, the
division of corrective actions of the USEPA’s Office of Solid Waste and
Emergency Response (OSWER) developed and released a supplemental guide
in 2001 to facilitate the evaluation of the intrusion of vapors (MCHUGH &
NICKELS, 2008).
In 2002, the USEPA began to limit the use of modeling to assess the
relevance of the route of exposure related to vapor intrusion indoors,
recommending instead the use of data obtained in the field, during evaluations
focused on quantifying concentrations of vapor.
The US EPA encourages the use many lines of evidence, which include
modeling, empirical data and other assessment methods to verify that the
intrusion of vapors actually occurs in the area evaluated. Currently, several
North American States, (California, Oregon, Washington, Idaho, Montana,
Wyoming, Colorado, South Dakota, Nebraska, Kansas, Missouri, Minnesota,
Louisiana, Alabama, Wisconsin, Michigan, Indiana, Ohio, Pennsylvania, New
York, Maine, New Hampshire, Massachusetts, Rhode Island, Connecticut, New
Jersey, Delaware, Maryland, Virginia, North Carolina and others) have their own

18
methods for assessing vapor intrusion, similar to the approach recommended
by the USEPA (NEW JERSEY, 2005).
Although the USEPA (USEPA, 2002), has limited the use of predictive
models, the Johnson and Ettinger model (1991) is still widely used for
evaluating the indoor intrusion of vapors from subsurface sources (MCHUGH;
NICKELS, 2008). The API BioVapor model has also been widely used for
petroleum sites. It can be found in the American Petroleum Institute (API)
website.
The State of São Paulo has its own guideline for evaluating this route of
exposure that incorporates the Johnson and Ettinger model (1991). On October
20th, 2009 the State of São Paulo Environment Agency, CETESB, published
guidance for fuel retailers on site investigation and intervention plans, and
included in that guidance procedures for assessing vapor intrusion (CETESB
2009).
According to the guidance, when the spatial distribution of contamination
plumes is mapped during the detailed investigation stage, risk maps are drawn
that show iso-concentration curves corresponding to CMAs (maximum
acceptable concentrations) that were exceeded. On the vapor intrusion risk
maps, the limits of iso-concentration curve of the CMA are increased by 10
meters, thus defining a constraint area for the presence of receptors subjected
to this exposure. If there are buildings and receptors occupying spaces within
the mapped risk area, intervention measures should be adopted to reduce
concentrations in source areas or at exposure points until they reach acceptable
levels established by the risk assessment worksheet of CETESB (risk increase
of 10-5 for carcinogenic compounds and 1.00 risk ratio to toxic effects).
Currently, regardless of the specific parameters of the area, the CMA for
dissolved benzene for a residential occupancy scenario (assuming a typical
adult) is 272 g/L; for a commercial occupancy scenario, the CMA is 892 g/L.
If there is any building occupied by any of these types of receptors within the
limits of the risk map corresponding to the CMA, an intervention plan is
required.

19
However, in this method, variables associated with attenuation processes
that occur during the transport of contaminants between the vapor source and
target environments of study are not included or are treated in a generic way
(aerobic biodegradation, deep in the water level, organic carbon fraction in the
soil, porosity, etc.).
3 – CONCEPT REVIEW
The process of migration of volatile compounds from a source on the
subsurface to the interior of existing buildings is known as vapor intrusion.
Volatile compounds present in soil and groundwater may be liberated into vapor
phase, with potential to migrate through layers of unsaturated soil and fractures
or cracks on the buildings’ base, eventually reaching indoor environments and
altering air quality. Figure 01 shows the conceptual basis of the process and
the relationship between the main parameters involved in the vapor intrusion
process.
Figure 02 – Conceptual basis of the migration process for subsurface vapors to indoor environments and the relationship between the main parameters involved
Source: Modified from API 2005

20
In extreme cases, the accumulated vapor in the environment may represent
imminent risk, for example, explosion or acute toxicity (Photograph 01).
However, in most cases, only low concentrations of the chemicals of interest
are observed, which can increase the risk of occurrence of chronic health
effects on the receptors that occupy these spaces over a long exposure time
(USEPA, 2002).
In this chapter, variables of the physical environment that can influence the
process and vapor attenuation mechanisms that occur in the unsaturated zone
will be discussed. Additionally, currently available methods for investigating the
occurrence of vapor associated with subsurface volatile organic compounds are
presented.
Photograph 01 – Combustion of gases and vapors from a subsurface source
Source: Tomlinson (2008)
3.1 - Vapor Sources
In any vapor intrusion scenario, the initial condition is the existence of a
source area. In general, the vapor source may be characterized by the
presence of volatile chemical substances or mass concentrations sufficient to
represent a potential risk for migration indoors. This includes the presence of
volatile compounds in free phase, dissolved in groundwater phase, residual
phase or adsorbed to soil particles, in intra and intergranular spaces, fractures,
discontinuities, planar structures (i.e., contact between distinct lithological
layers, mirror of flaws, geological contacts) and other discontinuities in the soil
or in the existing rocks in the study area.
21
The sources of vapors may be related to the presence of landfills, industrial
plants, distribution depots and fuel storage (focus of evaluation in this study)
and other places where products containing volatile organic compounds are
stored, handled or transported. For petroleum products, the vapors formed,
being heavier than air, will spread over the affected surface and may
accumulate in concentrations that provide short-term risks (i.e. explosions or
acute effects on human health) or nuisances due to the generation of odors
(Johnson, 2002).
3.2 – Physical Environment Variables
3.2.1 Soil Profile
Site geology can affect the mobility of vapors and needs to be properly
characterized and mapped to evaluate and detail the presence of geological
barriers (fine-textured layers with high moisture content), preferential paths
(vertical fractures with significant gaps, lithological diversity), or materials with
potential to increase or retard the transport of vapors. Typically these data are
obtained from geological surveys, visual inspection and laboratory analysis of
geotechnical properties such as porosity, moisture, organic matter fraction and
particle size distribution (New Jersey, 2005).
When evaluating the relevance of different indoor intrusion routes of
subsurface vapor, the following parameters related to the local soil profile are
typically considered:
• porosity (total and effective);
• volumetric content of water present in the soil;
• fraction of organic carbon in the soil;
• Total density of the soil; and,
• hydraulic conductivity of the porous medium.
In Brazil, the incorporation of geotechnical techniques for undisturbed soil
sampling at depth (thin-walled samplers type Shelby, block sampling, etc.) and

22
field tests for geotechnical soil classification and groundwater depth (CPTU
test), has improved the quality of such data (IGNATIUS, 1999).
3.2.2 Physical characteristics of Brazilian soil
Soil forming processes, such as weathering and pedogenesis, can
significantly influence geotechnical properties taken in consideration when
evaluating vapor intrusion processes.
This consideration is particularly important in the Brazilian context, since the
predominant weathering processes in tropical and subtropical regions can affect
the thickness of the soil profile (potential field for migration of organic vapors
and water), dissolution and precipitation of mineral species, diagenetic
processes related to the formation of clay minerals, etc. In the Serra do Mar
region, for example, the soil profile can be as much as 100 meters thick (MELFI;
MONTES, 2008).
Oxisol is a dominant soil type in Brazil. The soil particle size in these soils is
predominantly clay mainly composed of kaolinite (clay 1:1), which has a lower
vapor retention trend and humidity than the clay smectite type (2:1) (MELFI;
MONTES, 2008). The iron, manganese and aluminum oxides, common in
oxisols, form lateritic crusts, which constitute natural barriers to migration of
vapors. The distribution of lateritic crusts is constrained by the topography of the
land.
CETESB (CETESB, 2001) conducted soil characterization work in São
Paulo to determine the regional background of naturally occurring substances in
the soil, especially metals, and establish the guiding values for reference.
The methodology consisted of sampling the main types of soils across the
state, concluding that oxisol is the predominant soil type, followed by podsol.
The sampling interval was from ground surface (0 to 20 cm) and subsurface (80
to 100 cm). Results were considered statistically comparable, so that only one
value has been adopted for the whole interval, maximum quartile of 75%.

23
Specific studies using column testing to simulate the behavior of the
migration of vapors in relation to the intrinsic geotechnical properties of the soil
are fundamental to establish national values related to vapor transport and
migration phenomena. Currently, a research project being developed by PRIME
(PRIME 2015) in the POLI-USP and IPT laboratories tests soil columns
(Oxisols) and sand.
3.2.3 Weather Conditions
The influence of climatic conditions on the vapor transport process in the
subsurface is very complex and difficult to predict. However, in some situations,
they may significantly modify the process.
Air pressure and temperature directly influence how volatiles partition to
the vapor phase (as defined by Henry's and Raoult's Laws), with an expected
relationship (proportional, in the case of temperature and inversely, in the case
of pressure) between the variation of these parameters and the magnitude of
the process. That is, higher migration rates can be expected during the warmer
periods of the year and lower rates during periods of higher atmospheric
pressures.
Similarly, higher depressurization rates in buildings and consequent
migration of vapors through unsaturated soil layers would be expected during
warmer periods due to the ‘stack effect’.
The moisture content in the soil profile also has significant influence, since
the saturation of the porous environment (i.e. unconfined aquifer) may represent
a barrier to the migration of vapors. Thus, higher migration rates would be
expected during drier periods of the year.
However, there is no simple relationship between these factors, so it can
be difficult to predict the level of influence these variables have on vapor
formation and migration.
This can be best illustrated when observing the climatic conditions
prevailing in the Brazilian tropics. The hottest periods are also rainy, with the
soil profile more saturated in humidity, which decreases the formation and
24
migration of vapors. So in this scenario, the vapor transport rate could actually
be reduced. However, during rainy periods the groundwater recharge fronts can
induce advective flow of vapors.
Weather can also have an effect on biodegradation processes. The high
moisture content can reduce the flow of oxygen from the atmosphere into the
subsurface, thereby reducing the process of aerobic biodegradation of
hydrocarbons in the unsaturated zone (NEW JERSEY, 2005).
The influence of seasonal factors over the ventilation inside the
constructions is also hard to predict. For example, during the coldest periods of
the year, natural ventilation through windows or doors can be reduced,
decreasing the dilution of vapors that may come from subsurface. Daily
temperature variations can be important when considering this seasonal factor.
It is worth noting that the extent of seasonal variations, especially
temperature, decreases with increasing depth. In some situations where the
average water level of the free local aquifer is deep, seasonal impact may be
insignificant or nonexistent (NEW JERSEY, 2005).
3.2.4 Construction characteristics of the buildings
Conceptually, buildings with different types of structures in contact with the
ground can lead to different processes of vapor intrusion. For example, for
homes with basements, higher rates of advective flow of vapor would be
expected due to increased depressurization rate and the contact surface with
the subsoil, while in buildings installed on "palafitas" (a term used to designate
buildings built on elevated structures in order to avoid direct contact with the
ground, common in humid areas or wooden houses), the existing ventilation
between the floor and the subsoil is increased, increasing the mixing rate with
the outside air, thereby decreasing the rate vapor intrusion. These kinds of
buildings are the only ones that can be considered intrinsically safe.
The vapor intrusion processes can occur regardless of the layout of the
building assessed, even when the surface appears to be free of cracks or
discontinuities.

25
Figure 02 illustrates the main types of construction considered when evaluating the intrusion of subsurface vapors indoors.
Figure 02 – Basic types of constructions considered in evaluating the indoor vapor intrusion processSource: Modified from API 2005
In some situations, during construction, mechanical barriers of plastic or
asphalt material are installed (impervious webs), which can reduce the
advective transport vapor (Photograph 02). But if the barriers are not installed
properly, the diffusive flux of vapors through small perforations can be
significant (HERS 2010).
Photograph 02 – Installation of asphalt barrier
Source: Hers (2010)

26
When subsurface vapors enter the interior of buildings, ventilation and air
changes will result in dilution of concentrations from the subsurface by the air
present in indoor environments. From the point of view of mathematical
modeling, it is commonly assumed that the distribution of concentrations
indoors is uniform.
It is important that during the preparation of the conceptual model, age-
related construction data is collected, as well as type of pavement, presence of
underground utilities that may represent preferred paths, layout and distance
(lateral and vertical) in relation to the source of vapors.
3.2.5 Background Concentrations
During vapor intrusion evaluations, the possible influence of background
concentrations should be considered, both from external sources and from
existing sources inside the buildings evaluated. These sources can contribute to
the presence of chemical compounds of interest in detectable concentrations or
even higher than the environmental quality standards used as reference. The
evaluation of the possible presence of background concentrations is important,
especially when low concentrations are measured that may constitute long-term
risk.
Potential alternative sources present indoors include cleaning products,
consumer goods and building materials. Table 01 presents a summary relating
the potential sources for release of BTEX indoors.
External sources include emissions from cars, industries, places with
significant use and handling of chemicals, landfills, and others. In extreme
cases, outside air concentrations may be higher than the indoor air target
levels. Such considerations are especially important in densely populated and
industrialized cities and should be included during the preparation of the
conceptual model of the evaluated areas.

27
Table 01 – Potential sources of BTEX release indoors
Source Compound
Benzene Toluene Ethylbenzene Xylene
Latex-based paint X x
Carpets X x
Carpet Glue X x
Wood Burning x x
Varnish remover x
Spray products x
Scotch tape x
Cigarette smoke X x x x
Gasoline X x x x
Solvents x x
Source: Adapted from Hers et al. (2001, p.180)
3.3 Vapor Transport Mechanisms in subsurface
The recognition of fate and transport mechanisms of vapors in the
subsurface is critical to the interpretation of data collected during a specific
assessment of vapor intrusion. Theoretical considerations regarding these
processes should guide the development of conceptual and mathematical
models for the scenarios evaluated.
The main fate and transport mechanisms of vapors in subsurface affecting
indoor vapor intrusion process will be described in this chapter.
3.3.1 Diffusion
The diffusion process, from the physical and thermodynamic point of view,
is a transport phenomenon associated with kinetic energy of molecules, where
the chemicals of interest, solutes, migrate from areas with the presence of high
concentrations to areas with relatively lower concentrations (NEW JERSEY,
2005). This process occurs regardless of the flow velocity, and can be observed
inside solids, liquids and gases. In practical terms, diffusion can be exemplified
28
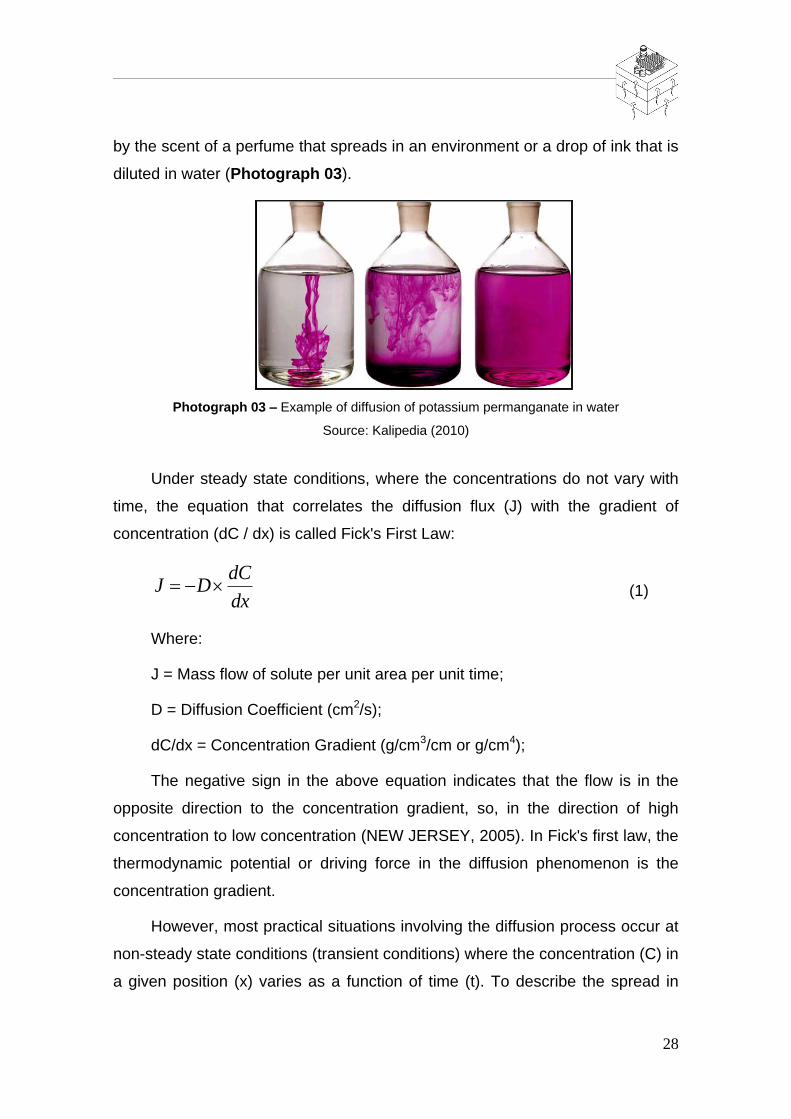
by the scent of a perfume that spreads in an environment or a drop of ink that is
diluted in water (Photograph 03).
Photograph 03 – Example of diffusion of potassium permanganate in water
Source: Kalipedia (2010)
Under steady state conditions, where the concentrations do not vary with
time, the equation that correlates the diffusion flux (J) with the gradient of
concentration (dC / dx) is called Fick's First Law:
dx
dCDJ (1)
Where:
J = Mass flow of solute per unit area per unit time;
D = Diffusion Coefficient (cm2/s);
dC/dx = Concentration Gradient (g/cm3/cm or g/cm4);
The negative sign in the above equation indicates that the flow is in the
opposite direction to the concentration gradient, so, in the direction of high
concentration to low concentration (NEW JERSEY, 2005). In Fick's first law, the
thermodynamic potential or driving force in the diffusion phenomenon is the
concentration gradient.
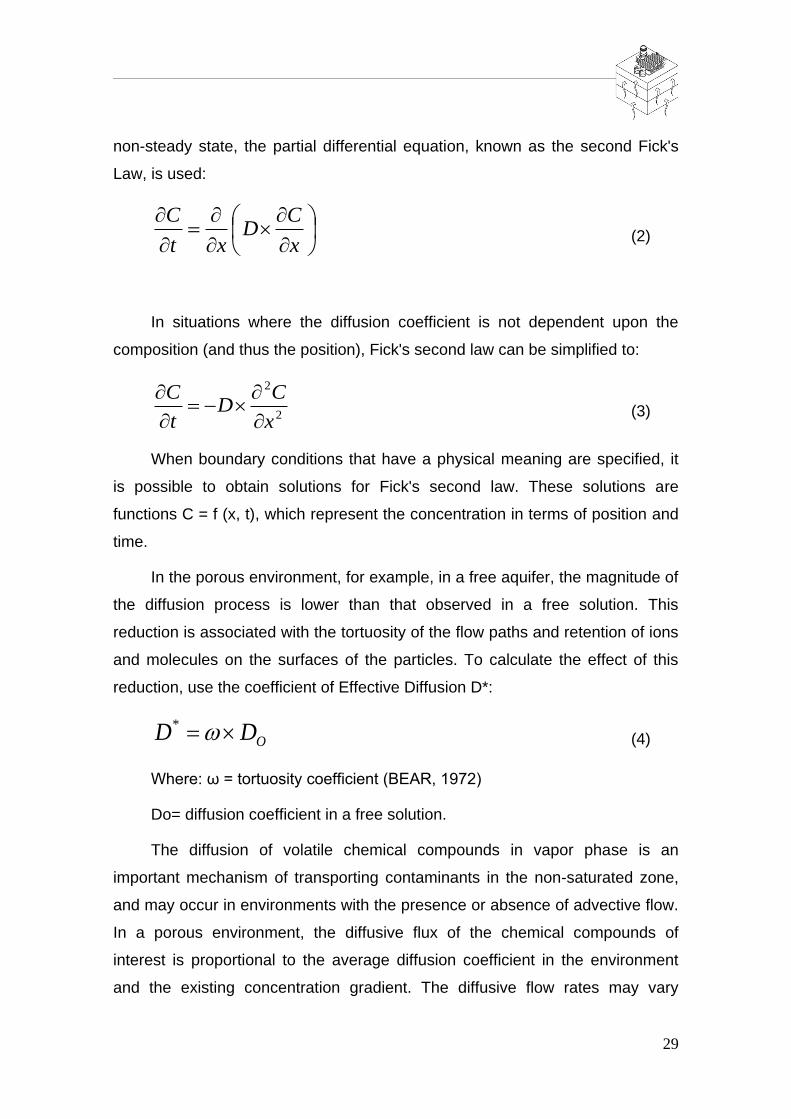
However, most practical situations involving the diffusion process occur at
non-steady state conditions (transient conditions) where the concentration (C) in
a given position (x) varies as a function of time (t). To describe the spread in
29
non-steady state, the partial differential equation, known as the second Fick's
Law, is used:
x
CD
xt
C (2)
In situations where the diffusion coefficient is not dependent upon the
composition (and thus the position), Fick's second law can be simplified to:
2
2
x
CD
t
C
(3)
When boundary conditions that have a physical meaning are specified, it
is possible to obtain solutions for Fick's second law. These solutions are
functions C = f (x, t), which represent the concentration in terms of position and
time.
In the porous environment, for example, in a free aquifer, the magnitude of
the diffusion process is lower than that observed in a free solution. This
reduction is associated with the tortuosity of the flow paths and retention of ions
and molecules on the surfaces of the particles. To calculate the effect of this
reduction, use the coefficient of Effective Diffusion D*:
ODD * (4)
Where: ω = tortuosity coefficient (BEAR, 1972)
Do= diffusion coefficient in a free solution.
The diffusion of volatile chemical compounds in vapor phase is an
important mechanism of transporting contaminants in the non-saturated zone,
and may occur in environments with the presence or absence of advective flow.
In a porous environment, the diffusive flux of the chemical compounds of
interest is proportional to the average diffusion coefficient in the environment
and the existing concentration gradient. The diffusive flow rates may vary

30
depending on various factors such as porosity and moisture content of the soil
column, concentration gradients, temperature, size and structure of the
molecules of the chemical compounds of interest, the viscosity of the fluid and
the environment in which the diffusion will occur.
3.3.2 Advection
The advection process is characterized by the transport of molecules or
ions through a moving fluid, where these elements move in the direction of the
flux lines at an average speed equal to the fluid (NEW JERSEY, 2005). The
equation that models this type of transport is the differential equation of
transport by advection:
X
X
CV
t
C
(5)
in
KVX (6)
Where:
C = Solute concentration (g/cm3);
Vx = percolation speed (cm/s);
K = permeability coefficient (cm/s);
n = porosity and;
i = hydraulic gradient.
When the fluids percolate through a porous environment such as soil,
whose volume is partly occupied by solids, this phenomenon will occur
predominately in media with high permeability such as sands, cracked clays
and weathered, fractured rocks. Therefore, variables related to the physical
properties of the environment, such as impermeable lithological layers and the
presence of structures and floors that can redirect the advective flow,
particularly to vapor phase, must be taken into account during the modeling.

31
Advective transport is a major process for the movement of vapors in the
unsaturated zone. Advective flow may be related to temperature gradients,
pressure gradients and density differences (vapors denser than atmospheric air
tend to go down, accumulating along the capillary fringe while less dense
vapors than air tend to rise, getting accumulated in layers nearest to surface
Temperature gradients can be related to seasonal or diurnal warming of
the surface layers of soil. The differential pressures may be related to recharge
fronts of groundwater that compress the vapors accumulated in the pores.
Differential pressure can result from the ventilation systems in buildings and by
wind-blown on structures that may result in advective movement of vapor from
the soil to the indoors impermeable lithologic layers and man-made structures,
such as decks and passive exhaust systems can redirect the advective flow of
vapors and should be considered during modeling (NEW JERSEY, 2005).
3.3.3 Mechanical Dispersion
Mechanical dispersion results from the interaction between the moving
fluid and the solid structure of porous medium. It is characterized by tortuous
movement of fluids through the center portion of the flow, and results in mass
spreading of the compounds beyond the region with predominantly advective
flow. This movement can occur in both horizontal and vertical directions.
During the modeling of this process in water systems, the hydrodynamic
dispersion coefficients are calculated using local soil characteristics related to
dispersibility and advective speed of movement of vapors (FETTER, 1980).
Figure 03 illustrates the causes of mechanical dispersion in the size range of
the pores.
32
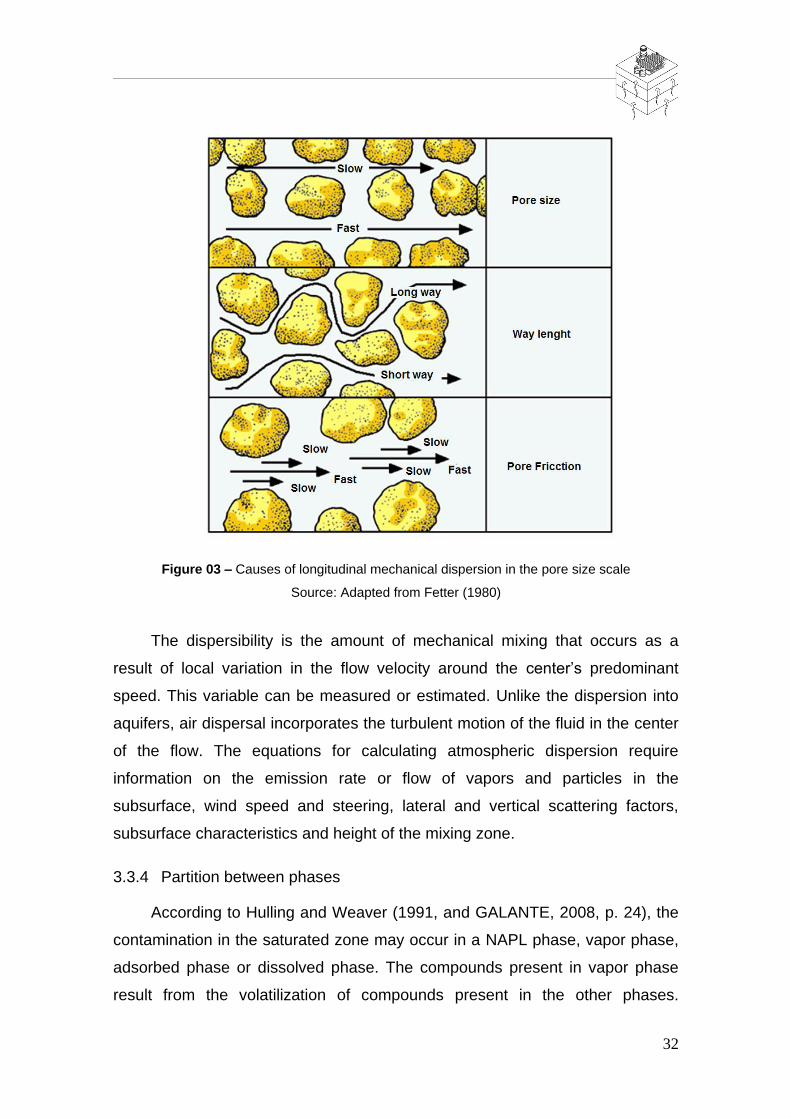
Figure 03 – Causes of longitudinal mechanical dispersion in the pore size scale
Source: Adapted from Fetter (1980)
The dispersibility is the amount of mechanical mixing that occurs as a
result of local variation in the flow velocity around the center’s predominant
speed. This variable can be measured or estimated. Unlike the dispersion into
aquifers, air dispersal incorporates the turbulent motion of the fluid in the center
of the flow. The equations for calculating atmospheric dispersion require
information on the emission rate or flow of vapors and particles in the
subsurface, wind speed and steering, lateral and vertical scattering factors,
subsurface characteristics and height of the mixing zone.
3.3.4 Partition between phases
According to Hulling and Weaver (1991, and GALANTE, 2008, p. 24), the
contamination in the saturated zone may occur in a NAPL phase, vapor phase,
adsorbed phase or dissolved phase. The compounds present in vapor phase
result from the volatilization of compounds present in the other phases.

33
Generally, the greater contribution of contamination comes from the NAPL
phase. The potential for indoor vapor intrusion is proportionally greater for
compounds that volatilize more easily.
The transfer of mass from a source of contamination to the vapor phase
will depend on the vapor pressure of the pure compound, which corresponds to
the maximum possible vapor phase concentration in a given condition of
temperature and pressure. Partitioning from the free phase/residual phase to
the vapor phase is governed by Raoult's law (partition from NAPL phase to the
vapor phase) and partition from low concentrations in the dissolved phase to the
vapor phase is governed by Henry's Law. Those phenomena are ruled
respectively by the vapor pressure and the solubility of the compound, and vary
depending on the pressure conditions and temperature.
3.3.5 Biodegradation
Biodegradation is based on processes in which there are biochemical
reactions mediated by microorganisms. In general, an organic compound, when
oxidized, loses electrons to a final electron acceptor, which is reduced (gains
electrons). When present, oxygen commonly serves as the final electron
acceptor, wherein the oxidation process of organic compounds, together with
the reduction of molecular oxygen, is called heterotrophic aerobic respiration.
However, when there is no oxygen available, the microorganisms may use
some alternative organic compounds or inorganic ions as final electron
acceptors, which is known as the anaerobic condition. Anaerobic
biodegradation may occur by denitrification of organic matter, iron reduction,
sulfate reduction, acetate decarboxylation and CO2 reduction (methane
producing) (CORDAZZO, 2000).
Depending on the substrate, the VOC, the electron acceptors (i.e.
Oxygen-O2), and nutrients, biodegradation may be a limiting factor on the
transport of organic vapors to indoor areas. However, most of the models used
for risk analysis currently do not consider this process.
34
According to Hers et al. (2002), aerobic biotransformation of organic
contaminants occurs in the non-saturated zone under suitable conditions,
depending on oxygen availability, microbial population, moisture, nutrients and
the presence of suitable conditions of pH, temperature and salinity.
De Vaull (1997, and HERS, 2002, p. 8), suggests that under conditions
where the oxygen concentration exceeds 4% and where the concentration of
dissolved nitrate present in the entrapped water from the pores exceeds 1 to 2
mg/L, biodegradation can be maintained. The results obtained by Zwick et al.
(1995, and HERS, 2002, p. 8) suggest that aerobic biodegradation is
significantly reduced as the moisture content present in the ground increases.
These results are consistent with those obtained by Teixeira et al. (2009), who
studied the aerobic oxidation of methane in three landfills in Brazil. The results
of this study suggest an inverse relationship between the degree of saturation at
the time of collection of the analyzed soil samples and the number of
methanotrophic bacteria present in the soil profile.
This evidence indicates that the dissolved phase of volatile organic
compounds is subjected to biodegradation processes in aerobic and anaerobic
conditions in groundwater. Aerobic biodegradation of volatile organic
compounds using alternative electron acceptors (i.e. Nitrate, sulfate) can occur
in the groundwater at considerable rates, however, few studies have been
conducted to demonstrate the extent of biodegradation in the unsaturated zone
using these acceptors.
Other lines of evidence can be used to demonstrate the occurrence of
biodegradation in the unsaturated zone, such as the presence of other gases in
the soil. During the biodegradation process, oxygen is consumed and in its
place, carbon dioxide is generated (HERS, 2002).
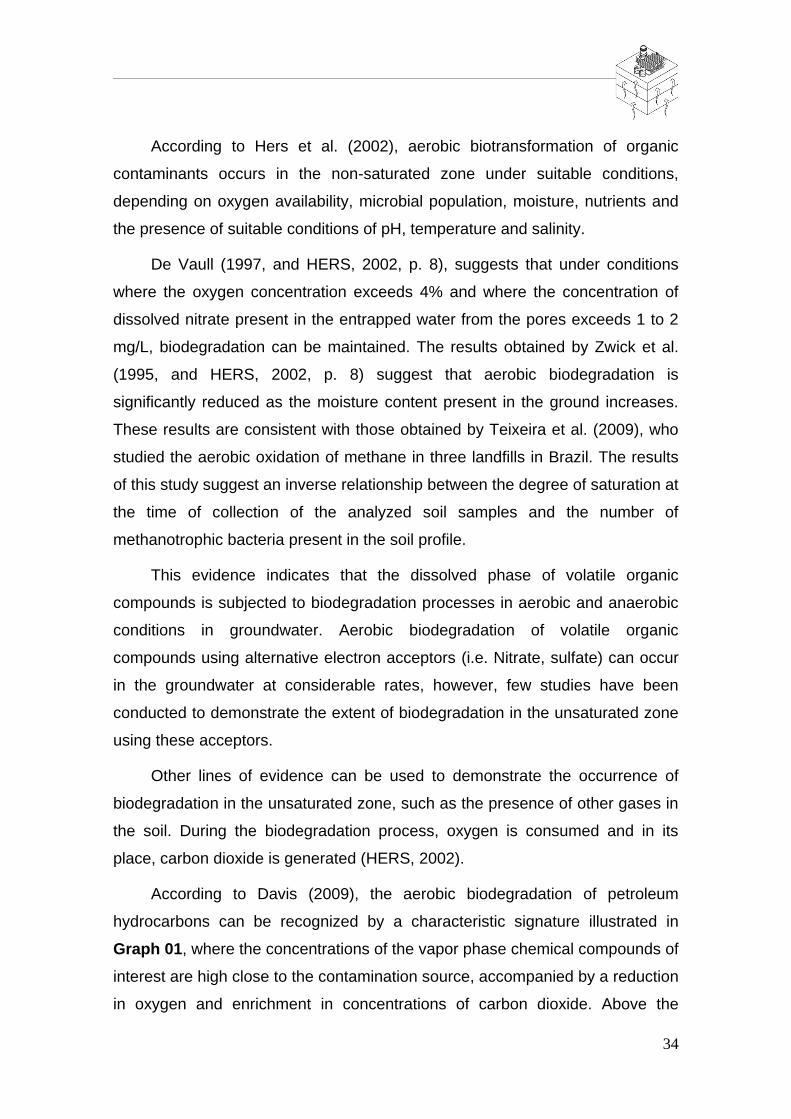
According to Davis (2009), the aerobic biodegradation of petroleum
hydrocarbons can be recognized by a characteristic signature illustrated in
Graph 01, where the concentrations of the vapor phase chemical compounds of
interest are high close to the contamination source, accompanied by a reduction
in oxygen and enrichment in concentrations of carbon dioxide. Above the
35
contaminated zone, carbon dioxide and oxygen concentrations return to the
expected conditions near the surface environments. This example
demonstrates that the petroleum hydrocarbon concentrations in vapor phase,
associated with highly dissolved concentrations (low persistence contamination
sources) are attenuated by a factor of roughly one million for every 2.1 meters
of clean soil layer over the source of contamination.
Graph 01 – Characteristic concentration profile indicating aerobic biodegradation of hydrocarbons
Source: Adapted from Davis, 2009
From a database of approximately 127 vapor and groundwater monitoring
campaigns in several areas located in the United States and Canada, Davis
(2009) established clean soil thickness over a contamination source necessary
to mitigate concentrations of benzene vapor associated with various
concentration ranges in dissolved phase, as illustrated in Graph 02.

36
Graph 02 – Clean soil thickness necessary to mitigate concentrations of benzene in vapor phase associated with various concentration ranges in dissolved phase
Source: Adapted from Davis, 2009
The data obtained demonstrate that a layer of 1.5m in thickness of clean
soil over the area source of vapor is sufficient to attenuate the vapor phase at
concentrations associated with dissolved phase concentrations equal or greater
than 1,000 g / L benzene. Approximately 4.5 meters of clean soil are sufficient
to attenuate benzene concentrations associated with dissolved phase
concentrations greater than 25,000 g / L.
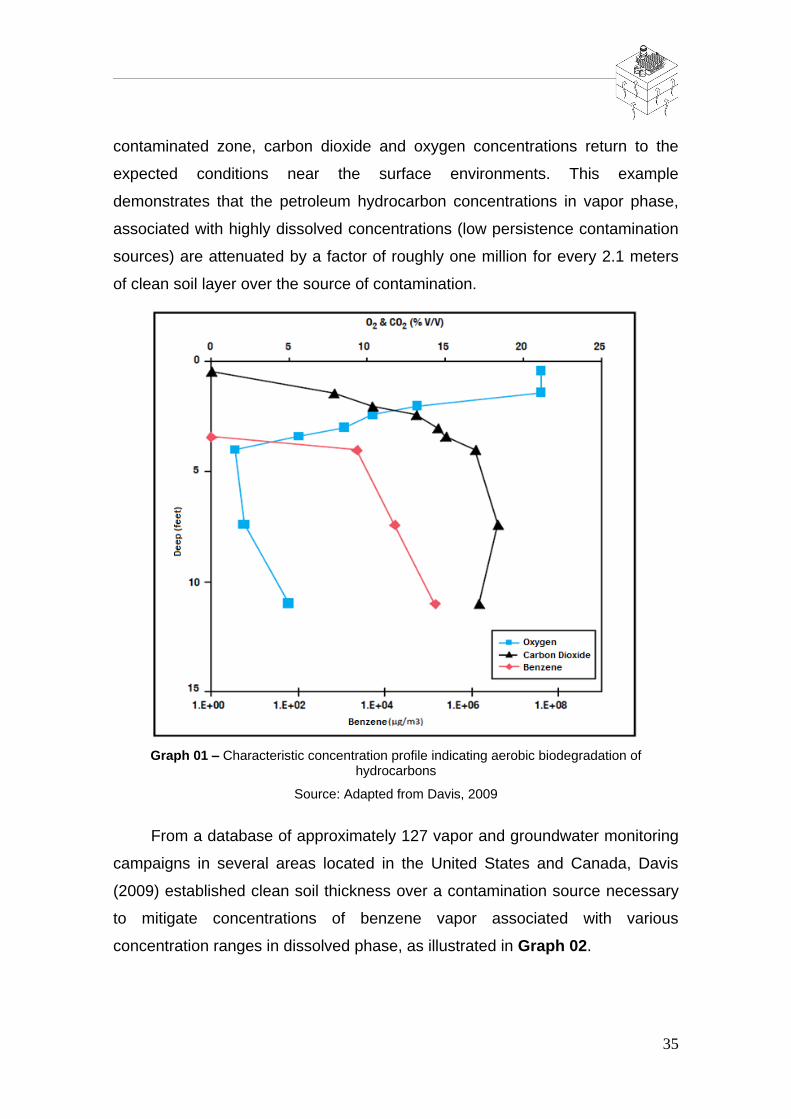
Graph 03 shows data obtained from 43 sampling campaigns at six areas
where the occurrence of products in free phase were observed. These data
indicate that concentrations of vapor associated with the presence of free phase
are completely attenuated with a layer of nine meters of clean soil.
37
Graph 03 – Clean soil thickness necessary to mitigate concentrations of benzene vapor associated with sources with product free phase
Source: Adapted from Davis, 2009
According to Davis (2009), the relationship between concentrations
present at the source, in free or dissolved phase, and the thickness of clean soil
present on the source can be used as decision criteria to evaluate the relevance
of the route of exposure associated with the intrusion of vapors indoors, guiding
future actions related to environmental management of areas contaminated by
the presence of volatile organic compounds.
38
3.3.6 Ethanol influence
According to Ferreira (2003), gasoline sold in Brazil receives the addition
of anhydrous ethyl alcohol, also known as ethanol, into fractions which can vary
from 20 to 24% in volume. The use of this compound in gasoline increases
octane level and reduces carbon monoxide emissions into the atmosphere.
According to Chiaranda (2006), the addition of ethanol to gasoline affect
the main properties that rule its distribution in the subsurface. When ethanol-
containing gasoline is spilled into the unsaturated zone, the hydrophilic nature
of ethanol causes it to partition into the water contained in the soil interstices
and remain stored in this region due to capillary forces. The presence of ethanol
in the unsaturated zone reduces the interfacial tension LNAPL-water, thus
promoting the migration of LNAPL in the soil until it reaches the capillary fringe,
where it starts to accumulate.
In quantities exceeding 10% by volume of the mixture, ethanol increases
its saturation in the water, reducing surface tension and the ability of capillary
forces to keep it in the unsaturated zone. Thus, alcohol also begins to migrate
through the unsaturated zone to reach the LNAPL plume, increasing the
solubility of pure product in water, an effect known as co-solvency
(POWERS; McDOWELL, 2003).
The results obtained by Ferreira, Oliveira and Duarte (2004), who studied
the relationship between the thickness found in monitoring wells and the porous
medium, both for pure gasoline and for E-20 (80% gasoline and 20% ethanol)
indicated that the BTEX concentrations are significantly higher in a dissolved
phase plume of E-20, compared to pure gasoline (despite the mole fraction of
BTEX being lower in the first, due to the addition of ethanol in the composition).
In addition to increasing the mass transfer BTEX to groundwater, ethanol is also
responsible for the increased length of the BTEX plume, because the reduction
of the interfacial tension between the E-20 and the aqueous phase increases
increase the migration capacity. Likewise, reduction of interfacial tension
contributes to the reduction of the capillary fringe’s height, with the increase of
the ethanol content in the saturated zone.

39
Due to the property of co-solvency, ethanol has also been applied in
remediation where the persistence of residual gasoline phase is observed.
Oliveira (1997) presented a detailed analysis of the pseudo-ternary diagram for
fuel-water-ethanol. Results were obtained regarding the minimum amount of
ethanol necessary for the fluid to reach the miscible displacement for complete
removal of gasoline residues in a process of ethanol injection (flushing). The
minimum amount of ethanol to incur a water miscible displacement corresponds
to about 88% in ethanol weight and 12% water. Otherwise the miscibility is not
achieved and the removal of gasoline residues is not complete.
Regarding the partition of volatile compounds to the vapor phase, the
presence of ethanol in gasoline increases the vapor pressure of the mixture and
consequently the tendency of loss by evaporation. The volatile organic
compounds present in the fuel mixture, such as BTEX, tend to increase
proportionally.
Finotti et al. (2009) quantitatively evaluated the influence of ethanol on the
volatilization process of BTEX compounds in a mixture of gasoline and
anhydrous ethanol 25% (v/v) in experimental columns that simulated soils
contaminated with pure gasoline and gasoline/ethanol. The results showed that
all BTEX compounds showed significant increase in volatilization rates in the
column containing the mixture gasoline/ethanol.
According to Cruz et al. (2003), this phenomenon can be explained by the
change of intermolecular bonds of hydrocarbons of gasoline caused by the
presence of ethanol, which can occur in two ways:
1) For small amounts (up to 10%), all the ethanol molecules are
surrounded by hydrocarbon molecules. The presence of ethanol
causes the breaking of the intermolecular bonds of hydrocarbons,
facilitating its evaporation and thereby increasing the vapor
pressure of the mixture;
2) For higher ethanol levels, alcohol molecules are present in
amounts sufficient to interact with one another and, since these
interactions are stronger than the ones between molecules of
40
hydrocarbons due to the higher polarity of the ethanol, the vapor
pressure of the mixture starts to decrease.
Cruz et al. 2003 also showed that the effect of the presence of ethanol on
vapor pressure becomes more pronounced as the temperature of the center
increases.
3.4 Investigation of occurrence of vapor in the subsurface
Sampling of vapors present in the soil has been used as a tool to evaluate
the spatial distribution of the chemical compounds of interest present in the soil
and groundwater (MCHUGH; NICKELS, 2008). These data are commonly used
to guide the environmental characterization of the areas under study, identify
areas where soil and groundwater samples should be collected, and monitor the
efficiency and effectiveness of remediation systems.
Since the results of this type of sampling generally do not provide specific
concentrations in vapor phase of the chemical compounds of interest, the
methods traditionally used during an environmental characterization are not
suitable for assessing the impacts related to exposure to vapors indoors.
The collection of soil vapor samples for analytical determination of
compounds and concentrations present to evaluate the vapor intrusion potential
is a relatively new approach. However, in countries that already have specific
guidelines, this method has frequently been used to provide a more accurate
estimate of potential for contaminants in the subsurface to reach the receptors
present indoors.
In this context, the aim of this chapter is to briefly present the main steps
involved in a typical environmental investigation focused on the distribution of
concentrations in vapor phase at places where, during the stages of
confirmatory or detailed environmental investigation, concentrations of volatile
organics in soil and/or groundwater exceeded environmental quality standards
for the exposure route in question.
3.4.1 Development of the conceptual model

41
The development of conceptual models for assessing vapor intrusion has
as main objective the three-dimensional presentation of specific data available
for the study area, in the most comprehensive and clearest way possible,
including all relevant characteristics. This model must be based on reliable data
describing the sources of contamination, the existing release and transport
mechanisms, the potential subsurface migration routes, potential receptors, as
well as historical data on the use and occupation of the area evaluated and,
possibly in some cases, the intended use in a future scenario (NEW JERSEY,
2005).
The conceptual model should include a consistent textual description,
clearly distinguishing aspects that are known or determined in the field and
assumptions based on empirical data. Its graphical representation must include
the relationship between contaminants and possibly present receptors. Usually,
it presents information related to the soil, geology, hydrogeology,
heterogeneities, soil and groundwater contaminant concentrations, regional
direction of groundwater flow, and features present in surface (i.e. presence of
recharge areas, surface water bodies and ground cover). The conceptual model
is a dynamic tool, and should be updated whenever there is new information
available, as appropriate, after each new investigation stage.
The conceptual model is an essential tool to help in decisions related to
environmental management. Therefore, it should provide all interested parties
(e.g., legal representatives and managers) with a general understanding of the
scenario, including the potential for exposure to the contaminants of interest. In
this context, for developing a consistent vapor sampling plan and establishing
site conditions, the conceptual model must contain at least the following
information:

42
a) chemical compounds of interest currently present or previously stored
or processed on-site (chlorinated solvents, gasoline, jet fuel, diesel,
etc.);
b) concentrations detected in soil and / or groundwater, environmental
standards used as a quality reference and applied analytical
methods;
c) potential sources for release of vapors (presence of free phase,
phase adsorbed to the soil, phase dissolved in the groundwater, etc.);
d) geological-geotechnical and hydrogeological conditions of the area;
e) approximate location of subsurface sources of vapor and distances
(lateral and vertical) in relation to the assessed buildings;
f) types of flooring that might influence the flow of vapors between the
subsurface and indoor air on the site;
g) presence of underground utilities;
h) characteristics of existing buildings (construction such as slab-on-
grade or basement, size, age, presence of cracks in the foundation,
etc.);
i) potential use of the area in a future scenario.
3.4.2 Selection of sampling points
For a consistent analysis, the expected conceptual model for the study
area should be set prior to the selection of the depths and the points to be
sampled, describing the main features of the sources of vapor, including their
location, extent, characteristics of the physical environment, concentrations of
the chemical compounds of interest and the expected variation in these
characteristics over time (Ex. seasonal variations). The model may further
include the expected distribution of the gases present in the soil along the
profile evaluated, and the following basic information (API 2005):
43
a) stability of analyzed concentrations over time;
b) expected gas distribution profile, considering the influence of existing
geological features in the area; and,
c) presence of underground utilities or other preferential pathways for
migration of vapors.
3.4.3 Installation of monitoring wells for soil vapor sampling
The procedure for installing vapor monitoring wells, together or
individually, is similar to that used for installing wells for groundwater sampling.
To install vapor sampling wells, manual methods are recommended, as
these methods can be used in most soils present in the unsaturated zone. With
manual methods, it is easier to be careful about the dimensioning of the
bentonite seals and filling with pre-filter in the filter sections. Additionally,
manual drilling is advantageous over more invasive methods (roto-pneumatic
drill), because it minimizes disturbances in the distribution of vapor in the soil
resulting from the drilling procedure, reducing the re-equilibration time (API
2005).
The drilling may be performed using manual auger of 4" in diameter. For
the coating of the survey is recommended to use small diameter tubes (1/4 "),
made from chemically stable material, such as stainless steel or Teflon® or
nylon. The use of PVC pipes is not recommended, because this material may
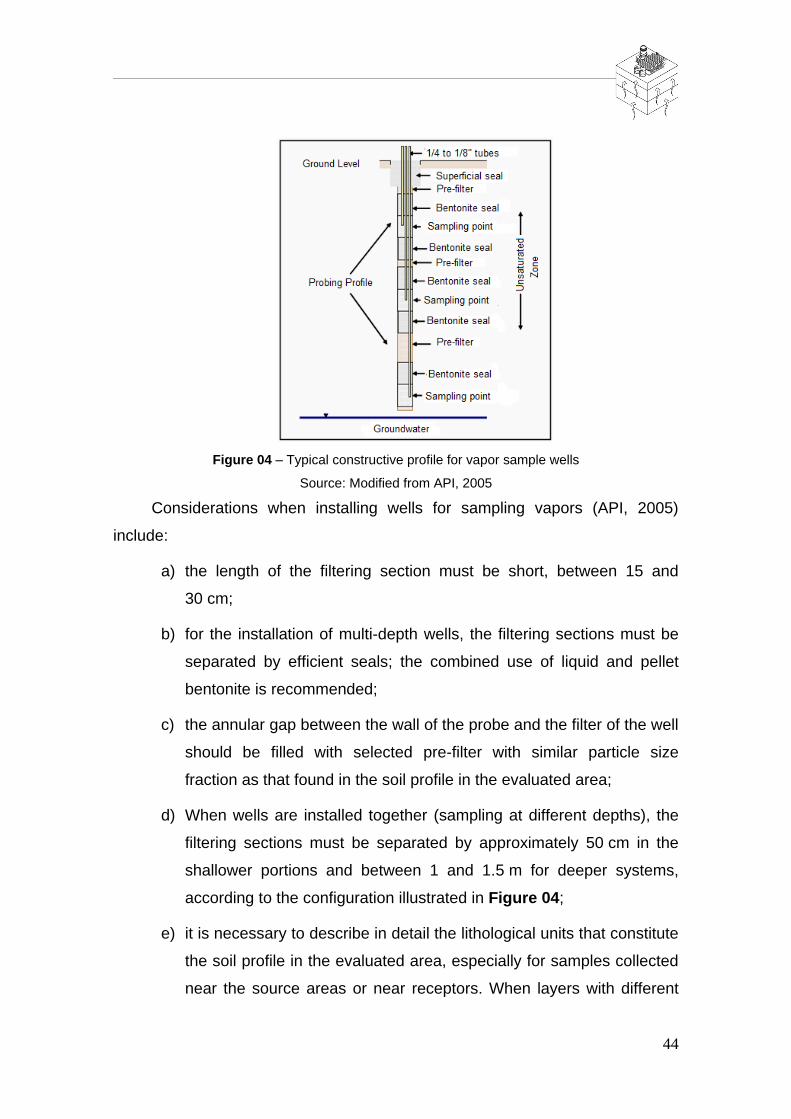
react to some volatile organic compounds (API 2005). The typical constructive
profile for vapor sampling at different levels of depth can be seen in Figure 04.
44
Figure 04 – Typical constructive profile for vapor sample wells
Source: Modified from API, 2005
Considerations when installing wells for sampling vapors (API, 2005)
include:
a) the length of the filtering section must be short, between 15 and
30 cm;
b) for the installation of multi-depth wells, the filtering sections must be
separated by efficient seals; the combined use of liquid and pellet
bentonite is recommended;
c) the annular gap between the wall of the probe and the filter of the well
should be filled with selected pre-filter with similar particle size
fraction as that found in the soil profile in the evaluated area;
d) When wells are installed together (sampling at different depths), the
filtering sections must be separated by approximately 50 cm in the
shallower portions and between 1 and 1.5 m for deeper systems,
according to the configuration illustrated in Figure 04;
e) it is necessary to describe in detail the lithological units that constitute
the soil profile in the evaluated area, especially for samples collected
near the source areas or near receptors. When layers with different

45
permeability are present, sampling must be performed in higher
permeability layers, as they may represent preferential paths for the
migration of vapors;
f) in areas where the vapor source is located near the groundwater, it is
advisable to install one or two sampling wells with a maximum depth
of 60 cm above the highest water level in the area. Sampling at these
points may provide more accurate data about vapor phase
concentrations if conducted during periods when the free aquifer is
deeper;
g) methods recently available on the market (e.g. direct push by
GEOPROBE Systems®) enable greater precision during the process
of installing permanent or temporary wells for sampling vapors in the
soil. These tools increase the reliability and representativeness of the
data obtained in the field (GEOPROBE SYSTEMS, 2006).
3.4.4 Procedures for soil vapor sampling
Collecting and storing vapor samples can be accomplished by means of
various equipment, such as Summa Canisters, TedLar®Bags, tubes with
adsorbent materials, glass cylinders and sampling syringes. Equipment should
be selected according to the objectives of the investigation, the inherent
methodological requirements and the necessary detection limits for the
assessment of exposure to vapor-phase compounds. Table 02 presents a
summary of the sampling methods commonly used to collect subsurface
vapors. Currently, there are a number of manuals and guides that guide the
collection and validation of data in the field (USEPA, 2002, API, 2005, ITRC,
2007, 2014), addressing sampling techniques, appropriate analytical methods,
and the elaboration of specific conceptual models. In countries where the
assessment of vapor intrusion is already an established method, the
environmental regulatory agencies have their own procedures covering various
techniques and specific equipment. For further readings on sampling
procedures, it is recommended to consult the following documents: ASTM,
1992; API 2005; USEPA, 2002.

46
Table 02 – Summary of sampling methods commonly used to collect subsurface vapors
Method Description Advantages Disadvantages
TedLar®Bags
TedLar®Bags can be found in volumes ranging from 10 mL to 10 liters. For vapor sampling in the soil, 0.5-liter bags are usually used. Samples can be collected with the following technologies: 1) pump with a small electric battery; 2) Syringe 3) peristaltic pump or; 4) the vacuum chamber The vacuum chamber method involves placing a bag in a sealed chamber which has been evacuated. This causes the bag to suction vapors from the soil, making it ideal for low permeability soil.
When using peristaltic pumps, the device does not contact the sample, eliminating the risk of cross-contamination; Easy to sample, can be completed using several methods; Disposable material, eliminating the possibility of false positives; Lower cost when compared to other vapor sampling methods.
Electric pumps are subject to cross-contamination and appropriate decontamination is necessary at every collection point. Additionally, in situations requiring the application of strong vacuum, leaks may occur; There may be significant leakage from TedLar®Bags during the first 24 to 48 hours after collection. Therefore, samples should be sent for chemical analysis as quickly as possible in order to ensure better representation
Glass cylinders
Glass cylinders can be found in various volumes. Generally, 1 liter cylinders are used for sampling soil vapors; Glass cylinders are normally supplied by the laboratory responsible for chemical analysis, filled with high purity nitrogen.
The glass cylinder is installed in line, between the probe and the sampling pump, avoiding the risk of cross-contamination.
The samples collected by this method should be analyzed within 24-48 h. Unfamiliar and unaffordable method for most consultants
Syringes
Syringes are typically used to collect small volumes of sample (normally 5 to 60 ml).
Expeditious method, simple and easy to use during sampling; Lower cost when compared to Summa Canister and tubes with absorbent materials.
The samples must be analyzed in a short period of time after collection (30 min). Therefore, this method is only recommended for analysis on site using portable chromatographs.

47
Source: Modified from New Jersey, (2005)
Cont. Table 2 - Summary of sampling methods commonly used to collect subsurface vapors
Method Description Advantages Disadvantages
Tubes with adsorbent materials
There is a wide variety of adsorbent materials (Ex. Tenax®, Carbotrap®), which should be selected based on the chemical of interest and the expected concentrations for the area. Generally, sampling rates used are between 100 and 200 ml / min, and the flow rate provided by the sampling pump must be accurately determined. The sampling time will depend on the expected concentration, the flow rate and the desired detection limits.
The tubes are installed in line between the probe and the sample pump, avoiding cross contamination. Easy to carry.
High cost when compared to other sampling methods
Summa Canisters
Summa canisters can be found in volumes ranging from 400 ml to 6 liters. They are previously evacuated, and vacuum is measured before and after transportation in order to detect possible leaks. The sampling rate is controlled by a flow regulator attached directly to the container.
Samples can be stored for up to 30 days before chemical analysis; Requires no pumps or other devices for sampling.
The container is used in various sampling campaigns, and decontamination is performed by the laboratory responsible for chemical analysis. Proper decontamination could be a critical factor; High cost when compared to other sampling methods.
Passive samplers
Passive samplers are those whose sampling principle is based on passive adsorption of contaminants in an adsorbent material. There is no need to use sampling pumps. Passive sampling may last from days to weeks and is used to identify potential routes of vapor intrusion and determining the lateral extent of the contaminants.
The identification of contaminants can reach the level of ng or ug; Effective in low permeability soil; Reduces the effects of varying the concentrations of the vapors over the time.
Does not allow vertical profiling of concentrations of vapors; The data are reported in mass and not in concentration units for risk assessment; It is not applicable for methane and other non-adsorbable compounds.
48
3.4.4.1 Soil Vapor Re-equilibration Time
The installation of vapor monitoring wells and the operation of remediation
systems may affect the distribution of vapors in the soil. Prior to sampling, the
distribution profile of vapors in the soil must be re-equilibrated. Some best
practices can help ensure the accuracy of samples:
a) after the installation of wells, sufficient time should elapse before
actual sampling, so that an equilibrium can be established between
the gases present in the soil and in the pre-filter;
b) an equilibrium time of 48 hours (API 2005) is recommended for wells
installed using manual methods;
c) for wells installed with more invasive methods, such as roto-
pneumatic equipment, disturbances caused by drilling may be
greater. Therefore, the equilibrium time can vary from days to months
after the installation of wells; and,
d) testing for leaks using tracer gas (e.g. helium) and portable detectors
can be done to determine the presence of disturbances in the soil at
the drilling site and integrity of the seal of the installed wells, thus
reducing the possibility of cross-contamination with atmospheric air
during the sampling.
3.4.4.2 Purge
To ensure equilibrium between the equipment used and the sampled
medium, besides guaranteeing a representative sample, it is necessary to carry
out purge procedures prior to sampling. The volume of the purge must be
compatible with the sampled medium and the equipment used. For an accurate
estimate, one must consider the inner diameter of the tubing used for the
installation of vapor monitoring wells, the length and internal diameter of the
tubing used for attaching the well to sampling equipment, and the volume of the
container used for sample storage.
The typical volume used for purging is between 1 to 5 times the total
volume of the sampling system. Empirical data (API, 2005) indicate that the
49
most appropriate procedure is to minimize the purge volume during sampling, in
order to reduce uncertainty regarding the representativeness of the sampled
point (e.g., entry of vapor system from other portions of the soil, entry of vapors
from the surface [short-circuit], etc.). You can set a number of volumes to purge
(e.g., three times the system volume), or calculate an appropriate purge volume
based on specific variables, such as permeability, and stability of the
concentrations in the field (measured with portable vapor analyzers). Vacuum or
peristaltic pumps are recommended for purging, since the purge volume can be
controlled with greater accuracy.
3.4.5 Analytical Methods
The analytical methods for determining the COC concentrations present in
soil vapors were defined mostly by the USEPA. Currently, there are several
methods applicable for the quantification of COCs in vapor samples, however,
the methods should be selected according to the intended use of the sampling
results and the technical requirements from regulatory agencies (in case the
methodology is recognized by the local environmental agency). To select the
most appropriate method, some fundamental issues need to be evaluated:
a) the analytes that need to be identified/quantified in the analysis;
b) the detection limits suitable for the evaluation of risks associated with
exposure to COCs;
c) the methodology used to collect the samples;
d) laboratory certification by the environmental agency and certification
of selected analytical method;
e) expiration date of the sample; and,
f) the analytical method suitable for analyzing soil vapors.
Table 03 presents a list of analytical methods commonly applied for this
type of analysis.
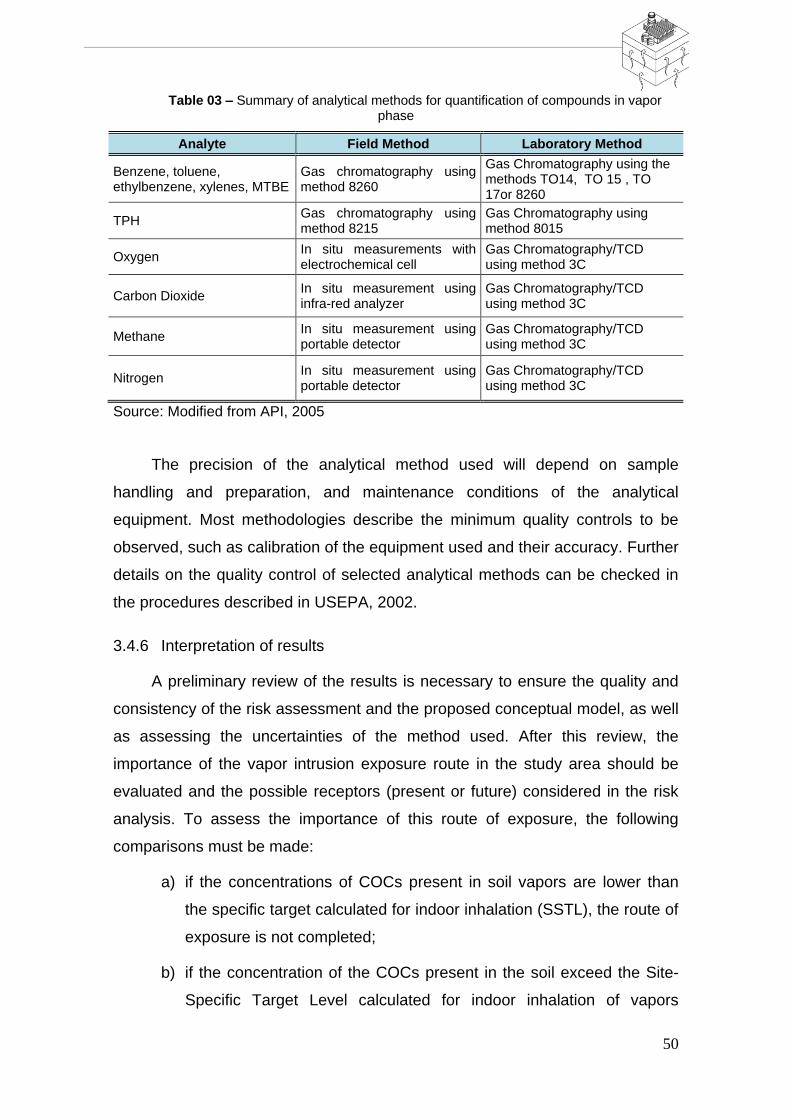
50
Table 03 – Summary of analytical methods for quantification of compounds in vapor phase
Analyte Field Method Laboratory Method
Benzene, toluene, ethylbenzene, xylenes, MTBE
Gas chromatography using method 8260
Gas Chromatography using the methods TO14, TO 15 , TO 17or 8260
TPH Gas chromatography using method 8215
Gas Chromatography using method 8015
Oxygen In situ measurements with electrochemical cell
Gas Chromatography/TCD using method 3C
Carbon Dioxide In situ measurement using infra-red analyzer
Gas Chromatography/TCD using method 3C
Methane In situ measurement using portable detector
Gas Chromatography/TCD using method 3C
Nitrogen In situ measurement using portable detector
Gas Chromatography/TCD using method 3C
Source: Modified from API, 2005
The precision of the analytical method used will depend on sample
handling and preparation, and maintenance conditions of the analytical
equipment. Most methodologies describe the minimum quality controls to be
observed, such as calibration of the equipment used and their accuracy. Further
details on the quality control of selected analytical methods can be checked in
the procedures described in USEPA, 2002.
3.4.6 Interpretation of results
A preliminary review of the results is necessary to ensure the quality and
consistency of the risk assessment and the proposed conceptual model, as well
as assessing the uncertainties of the method used. After this review, the
importance of the vapor intrusion exposure route in the study area should be
evaluated and the possible receptors (present or future) considered in the risk
analysis. To assess the importance of this route of exposure, the following
comparisons must be made:
a) if the concentrations of COCs present in soil vapors are lower than
the specific target calculated for indoor inhalation (SSTL), the route of
exposure is not completed;
b) if the concentration of the COCs present in the soil exceed the Site-
Specific Target Level calculated for indoor inhalation of vapors

51
(SSTL) in one or more sampling points, it must be determined
whether the concentrations are reduced (both vertically and laterally)
between the vapor source and foundation of the building enough to
become lower than the target. If it is verified that COC concentrations
do not reduce below the target calculated specifically for soil vapors
(SSTL) between the vapor source and the building, this route of
exposure is considered significant for the area.
According to API (2005), COC concentrations of the determined directly in
certain buildings have values in the order of 1000x lower in relation to soil vapor
concentrations obtained immediately below the foundation of those buildings.
This relationship is consistent with published data on studies conducted by
Nazaroff et al. (1987), and the results obtained from the model developed by
Johnson and Ettinger (1991). However, there are limitations to this relationship.
Soil vapor concentrations measured near the surface and just below the
buildings can vary significantly due to short circuit potential (contamination with
surface air) from samples collected from the surface. SSTLs for each mode of
this transport in the area (groundwater, soil, soil vapor, outdoor air and indoor
air) must be used. Alternatively, modeling can be performed using the
concentrations present in groundwater, calculating the equilibrium relationships
and partition between the air and groundwater (USEPA, 2002; ASTM 1992).
3.4.7 Evaluation of vapor intrusion according to standards established on
Board Decision No. 263/2009 of CETESB
The procedures for assessing vapor intrusion in São Paulo are included in
the current roadmap for undertaking detailed site investigation and intervention
plan development for fuel retailers (CETESB - São Paulo State Environmental
Company from the Board Decision No. 263/2009, published in Diário Oficial do
Estado de São Paulo on October 20, 2009).
Based on the mapping of the spatial distribution of contamination plumes
during the detailed investigation stage, the roadmap determines a number of
additional steps for intervention, including developing a conceptual model,
evaluating types of intervention that could be applied, and establishing an action
plan based on the exposure pathways and receptors in the evaluated area.
52
The need for intervention measures is assessed by comparing the
concentrations of Chemicals of Concern (COCs) detected in soil and
groundwater samples to the Maximum Acceptable Concentrations at the Point
of Exposure (MCAs - POE) as a function of the distance between the source
and the exposure point, as well as other Applicable Legal Standards (ALSs).
The maximum acceptable concentrations for indoor inhalation of vapors,
listed in the document Ações Corretivas Baseadas em Risco (ACBR) Aplicadas
a Áreas Contaminadas com Hidrocarbonetos Derivados de Petróleo e Outros
Combustíveis Líquidos – Procedimentos, are based on mathematical models
that estimate the concentrations in the vapor phase that will intrude into
buildings. In these models, the concentrations in vapor phase that will reach the
interior of the buildings are calculated based on the concentrations in soil
samples and/or groundwater and the conduction properties, equilibrium
relationships, and existing partition between these media and air, for the
"average" geological and geotechnical condition existing in the site’s broader
region (USEPA, 2002 and ASTM 1992).
For each COC whose concentrations in soil (unsaturated zone) or
groundwater (saturated zone) have exceeded at least one of the CMAs - POE
or ALSs, a risk map should be prepared in accordance with the intervention
framework. Risk maps should include the iso-concentration curves
corresponding to all CMAs - POE and ALSs that have been exceeded, and
should describe a conceptual model that identifies the retained and dissolved
contamination plumes and the location of potential recipients. In the risk maps
prepared for the exposure scenarios for vapor inhalation from soil and
groundwater, the limits of iso-concentration curve of CMA - POE should be
extended by 10 meters. It should also be considered that the first receptor
identified in the external area must be a residential receptor in the scenarios of
indoor vapor inhalation from soil and groundwater.

53
3.4.8 Evaluation of vapor intrusion according to EPA’s 2015 technical guide
The document issued by the USEPA titled "OSWER Technical Guide
For Assessing and Mitigating the Vapor Intrusion Pathway from Subsurface
Vapor Sources to Indoor Air," published in June 2015, provides a structured
approach to investigating vapors, and details measures that can mitigate
and eliminate the vapor intrusion route.
During the investigation planning stage, the conceptual model for the
area should be developed and any underground interferences (sewer pipes,
water, energy, gas, etc.) identified. The investigation should only evaluate the
COCs that are known or reasonably expected to be found in the area under
evaluation.
As vapor concentrations decrease along the distance from a source
in the subsurface, the concentration may become negligible at a certain
distance. EPA indicates, for certain cases, an “inclusion zone” of 100 ft
(30,5m) from the boundaries of a vapor-generating anomaly. That distance
should also be considered when planning the investigation.
Due to the variability of several factors (temperature, humidity, air
exchange volume, among others), EPA believes that a simple sample of the
air present in the building, collected on a randomly selected date, is
insufficient to estimate the average exposure to the chemical compounds of
interest. Multiple samples are recommended in order to estimate an
average of long-term exposure and allow the assessment of risks to human
health.
For human health risk evaluations, ambient air samples over a period
of 24 hours in residential areas and 8 hours in commercial/industrial areas
are recommended.
EPA recommends some vapors mitigating factors that should be
considered when interpreting the results. These factors were developed
using EPA's database.
For example, the average attenuation factor for sub-slab samples in
residential buildings is 0.03. Thus, the Vapor Intrusion Screening Level,
54
indicative of the risk of inhalation of vapors, can be calculated from the
equation below:
(7) CVISL = Ctarget,ia / αVI
where:
CVISL – Concentration of Vapor Intrusion Screening Level (VISL);
Ctarget,ia – Risk rate for indoor environments according to Regional
Screening Levels (RSLs) for Chemical Contaminants at Superfund Sites da
USEPA; and
αVI – Attenuation factor recommended for subsurface air indoors.
EPA emphasizes that attenuation of vapor intrusion into buildings is
usually not a suitable substitute for the mitigation and elimination of
subsurface vapor sources. EPA recommends a variety of engineering
responses and institutional controls for addressing vapor intrusion, both for
existing buildings and future construction.
3.4.9 Technical guides to handle petroleum vapor intrusion
Considering the fact that petroleum hydrocarbons degrade rapidly under
aerobic conditions and their intermediate degradation products are generally
less toxic than the original hydrocarbons, there is a lower potential for vapor
intrusion. Therefore, traditional approaches used for chlorinated solvents and
other non-biodegradable VOCs in aerobic environment may not be appropriate.
The technical guide about the intrusion of petroleum vapors developed by
ITRC in 2014, PVI (Petroleum Vapor Intrusion), deals with vapor intrusion from
petroleum hydrocarbon compounds and non-chlorinated volatile organic
compounds, or other non-persistent and non-petroleum hydrocarbons.
This guidance document explains the principles of PVI and assists with the
following tasks: PVI identification on sites contaminated by petroleum
hydrocarbons, decision-making for PVI risk management, and selection of
measures to reduce or eliminate the effects of PVI indoors.
The guide’s method for identifying PVI is based on the vertical distance
from the source to the base of the foundation of a particular building (Figure 5).
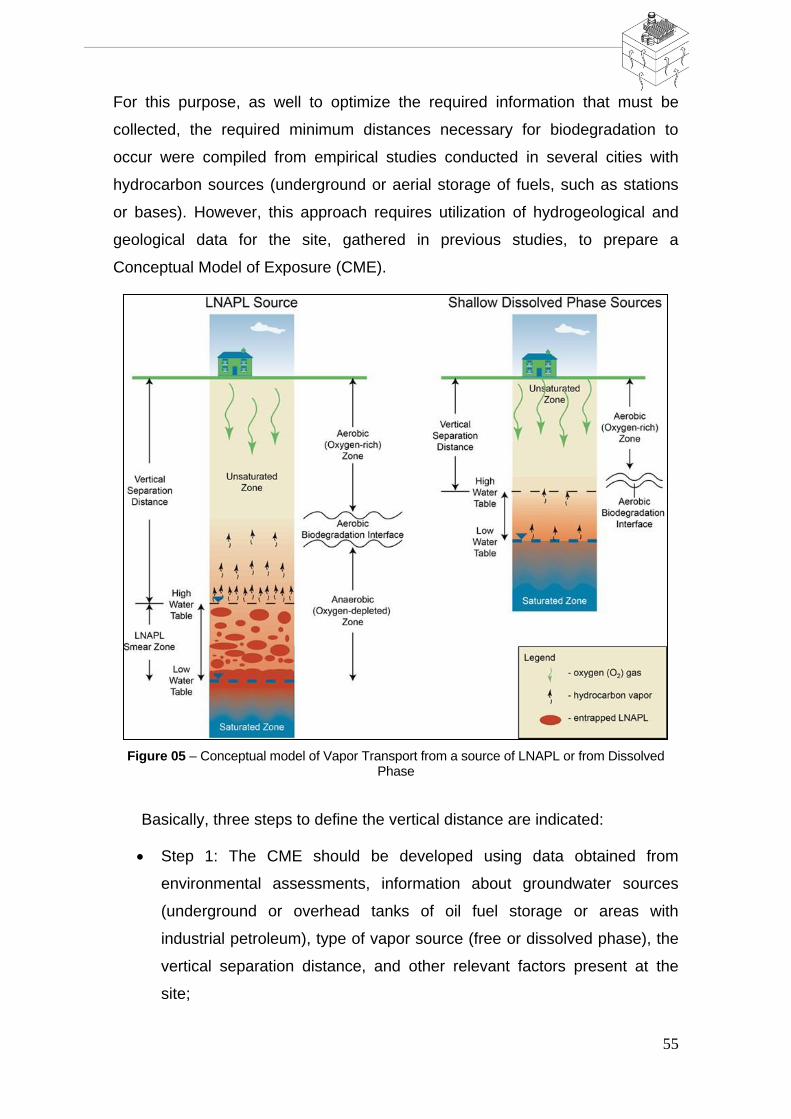
55
For this purpose, as well to optimize the required information that must be
collected, the required minimum distances necessary for biodegradation to
occur were compiled from empirical studies conducted in several cities with
hydrocarbon sources (underground or aerial storage of fuels, such as stations
or bases). However, this approach requires utilization of hydrogeological and
geological data for the site, gathered in previous studies, to prepare a
Conceptual Model of Exposure (CME).
Figure 05 – Conceptual model of Vapor Transport from a source of LNAPL or from Dissolved Phase
Basically, three steps to define the vertical distance are indicated:
Step 1: The CME should be developed using data obtained from
environmental assessments, information about groundwater sources
(underground or overhead tanks of oil fuel storage or areas with
industrial petroleum), type of vapor source (free or dissolved phase), the
vertical separation distance, and other relevant factors present at the
site;
56
Step 2: Evaluation of the area of interest regarding Barriers and
Horizontal Dispersion: If barriers are present, further investigations are
necessary. Otherwise, it should be checked whether the current or future
buildings are on zones of lateral vapor dispersion, which leads to Step 3.
If the building is not in a zone of lateral vapor dispersion, further
evaluation is not necessary.
Step 3: Delimiting of the vertical separation distance: the distance
between the base of the building foundation and the top of the source of
vapor emissions (free or dissolved phase plume).
Three models are used to evaluate PVI:
Empirical models: Use data based on assumptions from other studies
(mitigation factor). This model uses an appropriate distance or an
attenuation factor derived from the evaluation of data from the area with
potential PVI or for estimating vapor concentrations in buildings. This
model’s output is a vertical separation distance;
Analytical models: mathematical equations based on simplifications of
the conditions of the area of interest (e.g., the Johnson and Ettinger
model, 1991). In this model, PVI evaluation is exclusively unidimensional
or assumes that the source, at a certain depth, is a flat and uniform
surface. A distinctive feature of this model is the consideration of
biodegradation processes. The model BioVapor (DeVaull, 2007) is an
adaptation of the Johnson and Ettinger model, with the incorporation of
limited biodegradation by O2, as well as: options for setting different O2
refill conditions for the subsurface and the sum of Petroleum
Hydrocarbons present. The model of biodegradation limited to O2
content only simulates biodegradation in the unsaturated zone when
there is sufficient O2, essential for the biodegradation process. This
model has undergone several revisions and the EPA is in the process of
developing a new version;
Numerical model: Allows multidimensional transport simulation and
generates a more realistic representation of the specific conditions of the
area of interest. This model has the advantage of including details such
as the medium’s heterogeneity, geometric complexity and temporal
57
variation. The PVI numerical model has been applied to understand in
detail the causes and effects of transport and attenuation of vapors. Due
to the complexity of this model, acquiring specific information is required,
which can lead to increased costs, making it less practical and rarely
used.
In 2015, the EPA released the Technical Guide for Addressing Petroleum
Vapor Intrusion at Leaking Underground Storage Tank Sites (USEPA, 2015),
which was designed to regulate procedures in the United States.
The procedure recommended by EPA to evaluate these areas includes
identifying and mitigating imminent risk, characterizing the site and developing a
conceptual model of the area, delimiting a lateral inclusion zone, determining
the vertical separation distance, evaluation of source and attenuation of
petroleum hydrocarbon vapors, and vapor intrusion mitigation actions if
necessary.
The lateral inclusion side is used to orient the investigations in areas most
prone to intrusion of vapors. For each building within the lateral inclusion zone,
additional samples must be taken to determine the vertical separation distance,
which is defined as the thickness of clean biologically active soil separating the
contaminants in soil and/or groundwater from buildings and potential receptors.
The EPA technical document points that, depending on the vertical
separation distance, a more detailed vapor intrusion investigation is
unnecessary in some scenarios.
The attenuation factors listed in the document Technical Guide for
Assessing and Mitigating the Vapor Intrusion Pathway from Subsurface Vapor
Sources to Indoor Air by the USEPA (2015), as previously mentioned, are not
applicable to intrusion of petroleum vapors from leaking underground storage
tanks, because they do not account for the biodegradation that occurs in
unsaturated aerobic soil. Thus, EPA recommends sampling to measure the
actual attenuation that occurs due to the aerobic biodegradation.
Modeling can be used to better estimate the attenuation factor, but only if
the current specific conditions of the area are the ones assumed by the model.
The recommended models are Abreu, Ettinger and McAlary (2009), Verginelli

58
and Baciocchi (2014) and the BioVapor model (DeVaull, 2007). EPA has
developed a model called PVIScreen specifically for cases of petroleum vapor
intrusion.
This document does not address specific remediation techniques, and its
recommendations include interrupting the path between the source of
contamination and the potential receptor, remediating the source of
contamination (including the removal of LNAPL when present), and establishing
institutional controls to limit or prohibit access to affected areas.
3.5 Mathematical Modelling and Calculation of Target Levels
There are three options for assessing the relevance of exposure to vapors
that migrate from a subsurface source to the proximities of the foundations of
buildings and other confined spaces.
In the first approach, samples are taken directly inside the buildings and
the concentrations are compared directly with the reference values for indoor
air. In the second approach, existing experimental data (underground vapor
sampling) for the area are compiled and analyzed, establishing a comparison
between the actual and expected conditions for the area. In the third approach,
models that consider the specific conditions of the area (geology,
concentrations of the chemical compounds of interest in soil, vapors and
groundwater, etc.) are used to predict concentrations in indoor air.
These three approaches do not need to be mutually exclusive, and each
can play an important role in an integrated assessment of potential impacts of
the intrusion of subsurface vapors (USEPA, 2002).
Since performing regular indoor air monitoring can often be impracticable,
models have played an important role to predict concentrations indoors. The
applications of these models include:
a) estimating the potential impact of vapor intrusion in specific areas;
b) identifying areas that require more specific analysis;
c) obtaining specific target levels for the areas under study; and,

59
d) identifying how the target levels or concentrations obtained for the
indoor air may change due to variations in the concentrations in
groundwater and soil or due to the chemical characteristics of
compounds of interest.
3.5.1 Johnson and Ettinger Algorithm
The Johnson and Ettinger model (1991) and its extensions (i.e. API
Publication, 2005), are currently the most widely used models worldwide for
evaluating the subsurface vapor intrusion pathway for buildings. Johnson and
Ettinger’s algorithm combines equations that determine the partition of the
contaminants at the vapor source, transport in the vadose zone, transport
through the slab of the building and mixing with the air present indoors.
The results of these equations will depend on the data used for input,
which include specificities of the local soil, characteristics of buildings and
physical and chemical parameters of the compounds of interest. The model
produces an estimate of vapor attenuation factor, which is the ratio between the
concentration measured indoors and the concentration of vapors in subsurface
soil:
1expexp
exp
B
eff
crack
cracksoil
Tsoil
B
eff
T
TB
B
eff
T
B
eff
crack
cracksoil
B
eff
crack
cracksoil
TB
B
eff
T
AD
LQ
LQ
AD
LQ
AD
AD
LQ
AD
LQ
LQ
AD
(8)
Where α = (Cindoor/Csource), and:
AB = Surface area of the building in contact with the ground (m2);
Deffcrack = Global coefficient of effective diffusion of vapor through cracks in
the walls and foundation [mcrackeff2/d];
DeffT = Global coefficient of effective diffusion of the vapor phase in the soil
column between the foundation and the source [m2/d];
Lcrack = Slab thickness of the building [m];

60
LT = Distance (depth) to the vapor source or other point of interest below
the slab [m], measured from the slab towards the vapor source or other point of
interest;
QB = Volumetric air flow [m3/d]. Generally estimated as the product of the
building volume (VB [m3]) multiplied by the ratio of air exchanges between
indoor air and outside air (EB [1/d]);
Qsoil = Gas flow from underground directed by pressure to the building
[m3/d];
η = Fraction of the surface area of the building open to intrusion of vapors
[m2/m2]; commonly referred to in the literature as "crack factor". This can be
estimated as the total area of cracks, fractures, discontinuities and perforations
on the surface in contact with the ground, divided by the total area in contact
with the ground;
Cindoor = Concentration in indoor air;
Csource= Concentration in the source.
Figure 06 illustrates the conceptual basis of the algorithm and the
relationship between the eight primary input parameters.
It is worth noting that Equation 7 is, in practice, the version most often
used of the algorithm. This version considers that the vapor source is in steady
state, so, concentrations do not vary over time. There is also a version of the
equation that considers the reduction of concentrations over time by the vapor
source area.

61
Figure 06 –Conceptual basis of Johnson and Ettinger algorithm and the relationship between the eight primary input parameters on the primary model
Source: Modified from Johnson, 2002
3.5.2 CETESB spreadsheets for risk assessment in contaminated areas
In order to standardize and optimize the implementation of risk
assessment studies in São Paulo, since the publication DD 263/2009, CETESB
published the worksheets for risk assessment in contaminated areas under
investigation. Spreadsheets were developed in Microsoft Excel™ platform and
are divided into four files, representing the possible types of receptors present
in the areas under investigation:
a) Residents in urban areas (represented by adults or children);
b) Residents in rural areas (represented by adults or children);
c) Commercial / industrial workers; and,
d) Civil construction workers.
Spreadsheets allow the quantification of risks for both non-carcinogenic
and carcinogenic substances, individual and cumulative, in various exposure
scenarios. It also calculates the MACs for these substances.

62
The calculations are based on the procedure described in RAGS - Risk
Assessment Guidance for Superfund - Volume I - Human Health Evaluation
Manual Part A (USEPA, 1991) for quantifying the exposure and risk, as well as
the Johnson and Ettinger (1991) model for vapor transport in the saturated
zone. Spreadsheets include information on the physical-chemical and
toxicological properties of 631 substances. All input parameters of mathematical
models were defined so that values for the exposure factors and the physical
environment given are applicable to the reality of São Paulo state.
As a result of modeling, spreadsheets provide standardized reports,
including the quantification of the risk to human health and the determination of
MACs for exposure scenarios that should be considered during preparation of
the Intervention Plan.
3.5.3 USEPA Spreadsheets
The publication of the "Draft Guidance for Evaluating the Vapor Intrusion
to Indoor Air Pathway from Groundwater and Soils” (USEPA, 2002) established
a series of procedures for evaluating the indoor intrusion of volatile organic
compound vapors from a subsurface source of contamination.
The relevance of the vapor intrusion route of exposure in question is
evaluated in a 3-Tier Assessment. These tiers analyze the site with
progressively more detail as the presence of vapor is confirmed. These tiers
include:
1) Tier 1 – Preliminary evaluation;
2) Tier 2 - Comparing the concentrations in dissolved phase with
generic reference values (or semi-specific); and,
3) Tier 3 - Specific evaluation contemplating the investigation of
vapors in the soil.
The Preliminary Assessment (Tier 1), addresses three primary questions:
1) presence of VOCs;
2) distance to existing buildings;
3) imminent risk (explosion or toxicity);
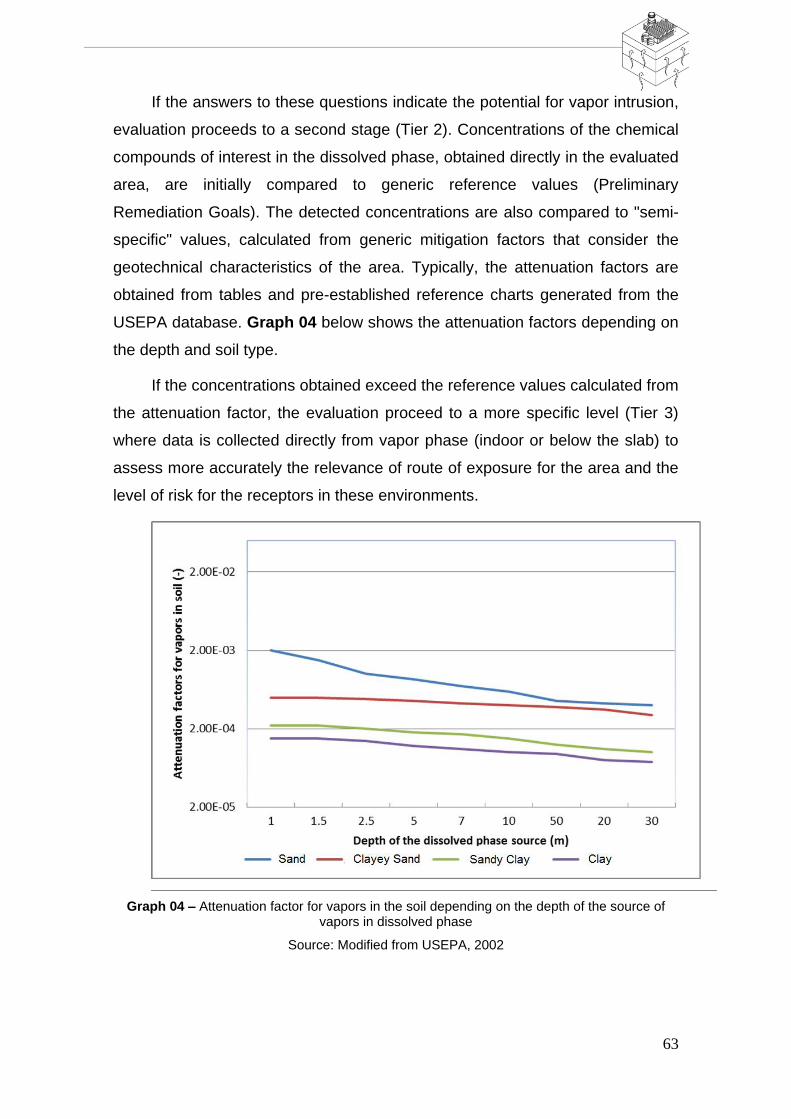
63
If the answers to these questions indicate the potential for vapor intrusion,
evaluation proceeds to a second stage (Tier 2). Concentrations of the chemical
compounds of interest in the dissolved phase, obtained directly in the evaluated
area, are initially compared to generic reference values (Preliminary
Remediation Goals). The detected concentrations are also compared to "semi-
specific" values, calculated from generic mitigation factors that consider the
geotechnical characteristics of the area. Typically, the attenuation factors are
obtained from tables and pre-established reference charts generated from the
USEPA database. Graph 04 below shows the attenuation factors depending on
the depth and soil type.
If the concentrations obtained exceed the reference values calculated from
the attenuation factor, the evaluation proceed to a more specific level (Tier 3)
where data is collected directly from vapor phase (indoor or below the slab) to
assess more accurately the relevance of route of exposure for the area and the
level of risk for the receptors in these environments.
Graph 04 – Attenuation factor for vapors in the soil depending on the depth of the source of vapors in dissolved phase
Source: Modified from USEPA, 2002
2,00E-05
2,00E-04
2,00E-03
2,00E-02
1 1,5 2,5 5 7 10 50 20 30
A
tte
nu
atio
n f
acto
rs f
or
vap
ors
in s
oil
(-)
Depth of the dissolved phase source (m)
Areia Areia Argilosa Argila Arenosa Argila
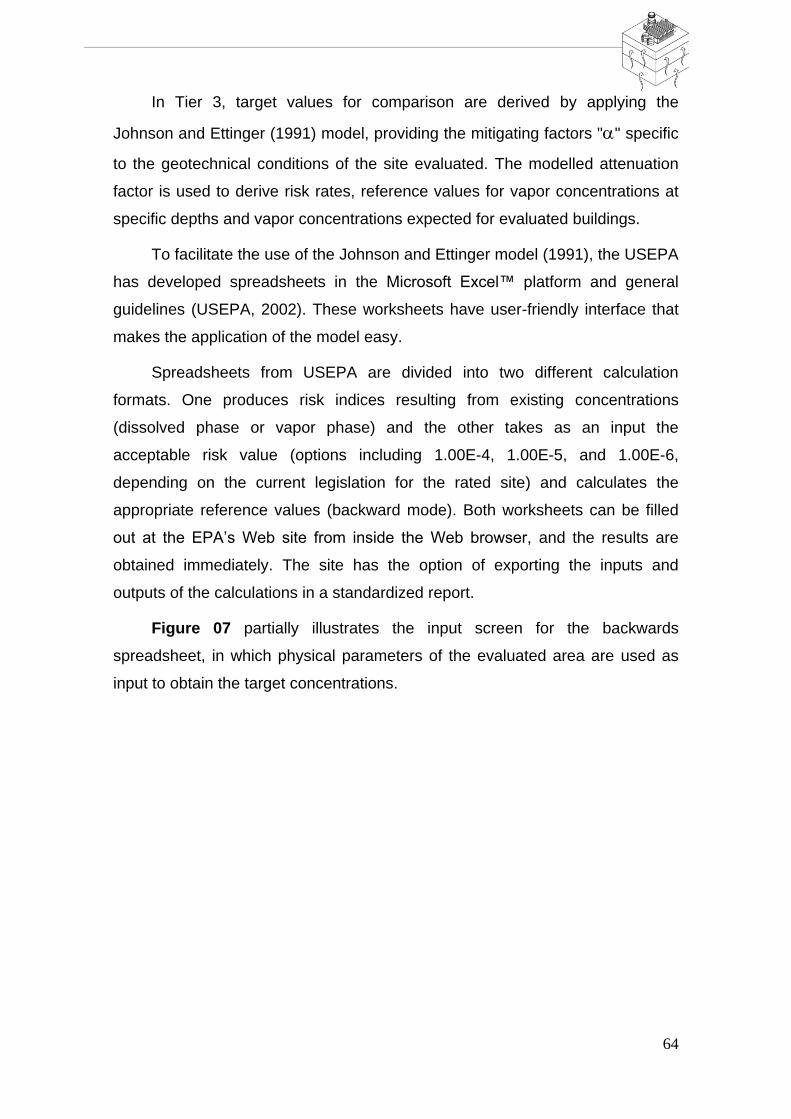
64
In Tier 3, target values for comparison are derived by applying the
Johnson and Ettinger (1991) model, providing the mitigating factors "" specific
to the geotechnical conditions of the site evaluated. The modelled attenuation
factor is used to derive risk rates, reference values for vapor concentrations at
specific depths and vapor concentrations expected for evaluated buildings.
To facilitate the use of the Johnson and Ettinger model (1991), the USEPA
has developed spreadsheets in the Microsoft Excel™ platform and general
guidelines (USEPA, 2002). These worksheets have user-friendly interface that
makes the application of the model easy.
Spreadsheets from USEPA are divided into two different calculation
formats. One produces risk indices resulting from existing concentrations
(dissolved phase or vapor phase) and the other takes as an input the
acceptable risk value (options including 1.00E-4, 1.00E-5, and 1.00E-6,
depending on the current legislation for the rated site) and calculates the
appropriate reference values (backward mode). Both worksheets can be filled
out at the EPA’s Web site from inside the Web browser, and the results are
obtained immediately. The site has the option of exporting the inputs and
outputs of the calculations in a standardized report.
Figure 07 partially illustrates the input screen for the backwards
spreadsheet, in which physical parameters of the evaluated area are used as
input to obtain the target concentrations.

65
Figure 07 – Input screen of the reverse calculation spreadsheet of USEPA
Source: The author
The worksheets require a large number of input parameters and, as a
result, relations between inputs and outputs of the model may be
misunderstood, since many users are not able to identify the critical variables.
This has caused some disagreements about the utility of this model
(JOHNSON, 2002). Since USEPA spreadsheets are commonly referred to in
professional circles as "Johnson and Ettinger model," it is useful to point out
some fundamental differences between the application of these spreadsheets
and the original Johnson and Ettinger algorithm (1991). These differences are
summarized in Board 01 below:

66
Johnson & Ettinger (1991) USEPA Spreadsheets (1997, 2000)
Model output is the attenuation factor
Spreadsheet outputs are the level of incremental risk, index or target levels for remediation of soil and groundwater resulting from certain incremental risk levels. Alpha attenuation factor is an intermediate part of the calculations and does not appear in the final results page.
Gas underground flow directed by pressure to the building (Q soil) is defined as a primary parameter input.
The gas flow in underground directed by pressure to the building (Qsoil) is an intermediate calculation, and does not appear in the final results page. It is obtained through input parameters defined by the user as soil permeability, differential pressure, length of the perimeter of fractures, etc.
Humidity and thickness of the capillary fringe are defined by the researcher
Humidity and thickness of the capillary fringe are defined from soil description tables with predefined categories
The calculation is focused on the relationship between vapor concentrations indoors and the concentration of vapors in the soil at a defined depth
Partition between retained phase and vapor is introduced; initial application of the sheet is limited to individual compounds, where contaminants in immiscible phases are not present, although this is not clear to the user
For both models it is necessary to ensure consistency in the relationship between the input parameters (e.g., total porosity and moisture in the unsaturated zone).
Board 01 – Summary of fundamental differences between the model of Johnson and Ettinger
and USEPA's spreadsheets
Source: Johnson, 2002
3.5.4 BioVapor
The BioVapor model (API, 2009) adds to the Johnson and Ettinger model
(1991) by accounting for the aerobic biodegradation potential. It features a user-
friendly interface, using spreadsheets where input data are inserted and model
outputs are presented. Figure 08 shows the software entry screen and the
fields that must be filled with data on exposure and physical environment.
In its design, the model considers a source of gasoline vapors in steady
state (the concentrations of the source do not vary as a function of time), with
diffusion being the main vapor transport mechanism in the subsurface. The soil
profile is divided into a surface layer where aerobic biodegradation is
predominant and a deeper layer where anaerobic biodegradation occurs.
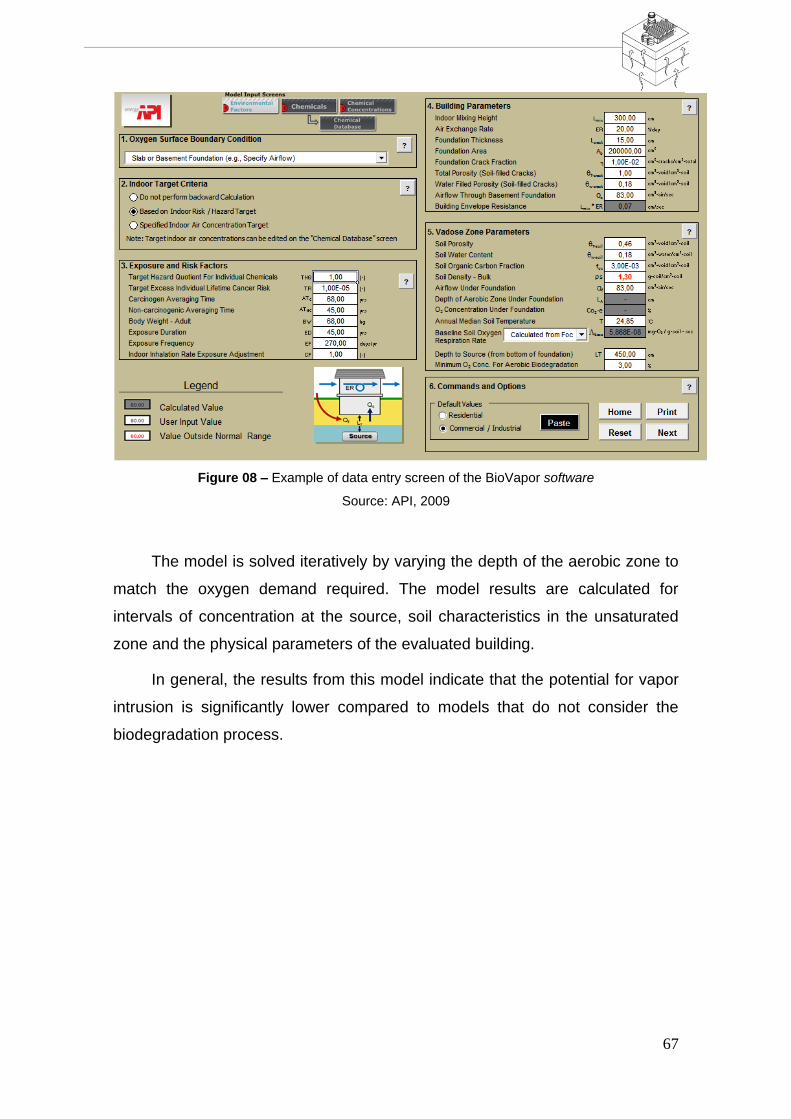
67
Figure 08 – Example of data entry screen of the BioVapor software
Source: API, 2009
The model is solved iteratively by varying the depth of the aerobic zone to
match the oxygen demand required. The model results are calculated for
intervals of concentration at the source, soil characteristics in the unsaturated
zone and the physical parameters of the evaluated building.
In general, the results from this model indicate that the potential for vapor
intrusion is significantly lower compared to models that do not consider the
biodegradation process.
68
4 - USE OF COMPOUND-SPECIFIC ISOTOPE ANALYSIS (CSIA) TO
DIFFERENTIATE INDOOR POLLUTION SOURCES
4.1 - Introduction
Compound-Specific Stable Isotopes have been used in environmental
applications to assess biodegradation, as well as for forensic investigation of
environmental compounds that may have caused contamination of soil or
groundwater. An example would be determining the origin of a possible leak.
CSIAs have been successful when assessing Volatile Organic Compounds
(VOC) dissolved in groundwater, which led to increased interest in the use of
CSIA for VOC vapor, determining attenuation processes in the vadose zone
and the potential in differentiating the sources of indoor contamination. This
chapter provides a brief explanation of the use of CSIA, new methodology for
collecting and analyzing vapor samples (from the interior of the buildings),
potential applications and field studies considering their potential relevance for
use in Brazil.
4.2 - What is an isotope?
Isotopes are formed when atoms have different numbers of neutrons,
which produces variations in molecular weight (the sum of the number of
protons and neutrons). Isotopes can be unstable (radioactive, for example, C14)
or stable, (for example, C12 and C13, which have 6 and 7 neutrons,
respectively). For decades, isotope chemistry has been used in various
industries. Its application in environmental chemistry has been relatively recent,
as analytical methods now have lower detection limits than in the past. CSIA
has been increasingly used in various environmental applications (USEPA,
2008).
Isotopes are mainly used to evaluate the degradation of the chemical
compounds of interest in groundwater. Some isotopes are lighter, having lower
molecular weight, and bonds are more likely to be broken. These features allow
these isotopes to be preferentially degraded by microorganisms and, over time,
this process results in the enrichment of heavier isotopes, in this case C13. This
process is known as "kinetic isotope effect". This can confirm the occurrence of
the biodegradation process, and in some cases, allow quantification of such
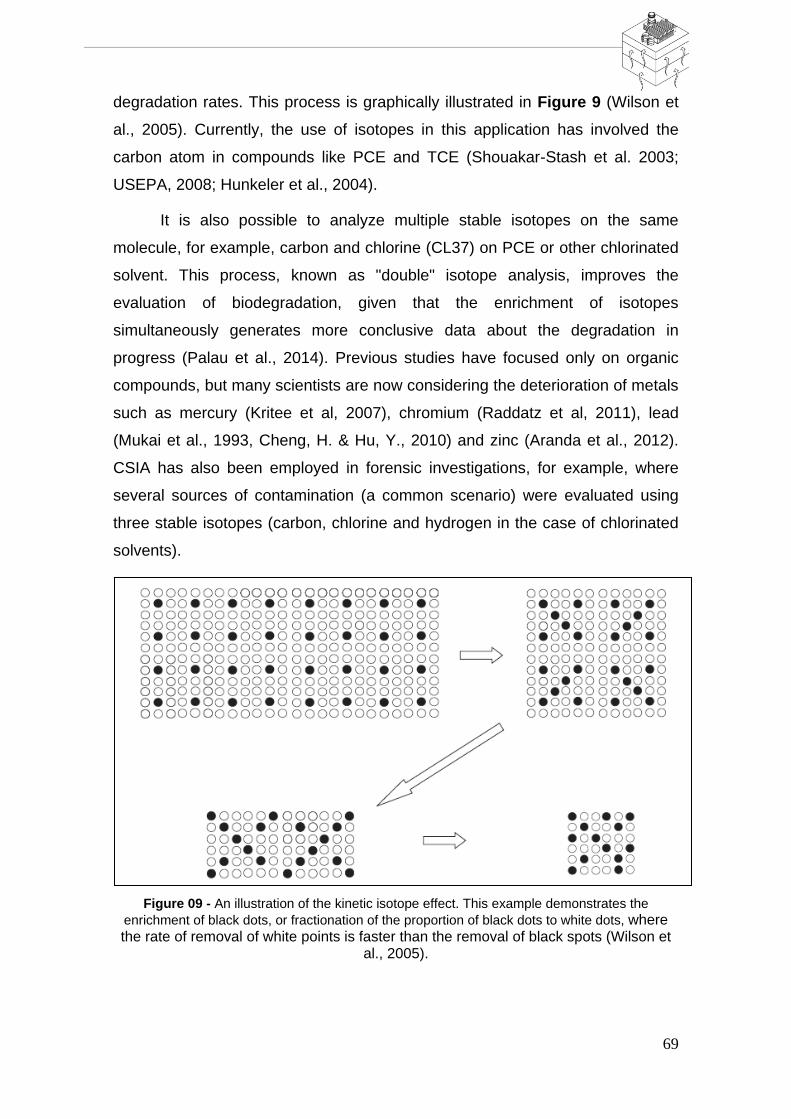
69
degradation rates. This process is graphically illustrated in Figure 9 (Wilson et
al., 2005). Currently, the use of isotopes in this application has involved the
carbon atom in compounds like PCE and TCE (Shouakar-Stash et al. 2003;
USEPA, 2008; Hunkeler et al., 2004).
It is also possible to analyze multiple stable isotopes on the same
molecule, for example, carbon and chlorine (CL37) on PCE or other chlorinated
solvent. This process, known as "double" isotope analysis, improves the
evaluation of biodegradation, given that the enrichment of isotopes
simultaneously generates more conclusive data about the degradation in
progress (Palau et al., 2014). Previous studies have focused only on organic
compounds, but many scientists are now considering the deterioration of metals
such as mercury (Kritee et al, 2007), chromium (Raddatz et al, 2011), lead
(Mukai et al., 1993, Cheng, H. & Hu, Y., 2010) and zinc (Aranda et al., 2012).
CSIA has also been employed in forensic investigations, for example, where
several sources of contamination (a common scenario) were evaluated using
three stable isotopes (carbon, chlorine and hydrogen in the case of chlorinated
solvents).
Figure 09 - An illustration of the kinetic isotope effect. This example demonstrates the
enrichment of black dots, or fractionation of the proportion of black dots to white dots, where the rate of removal of white points is faster than the removal of black spots (Wilson et
al., 2005).
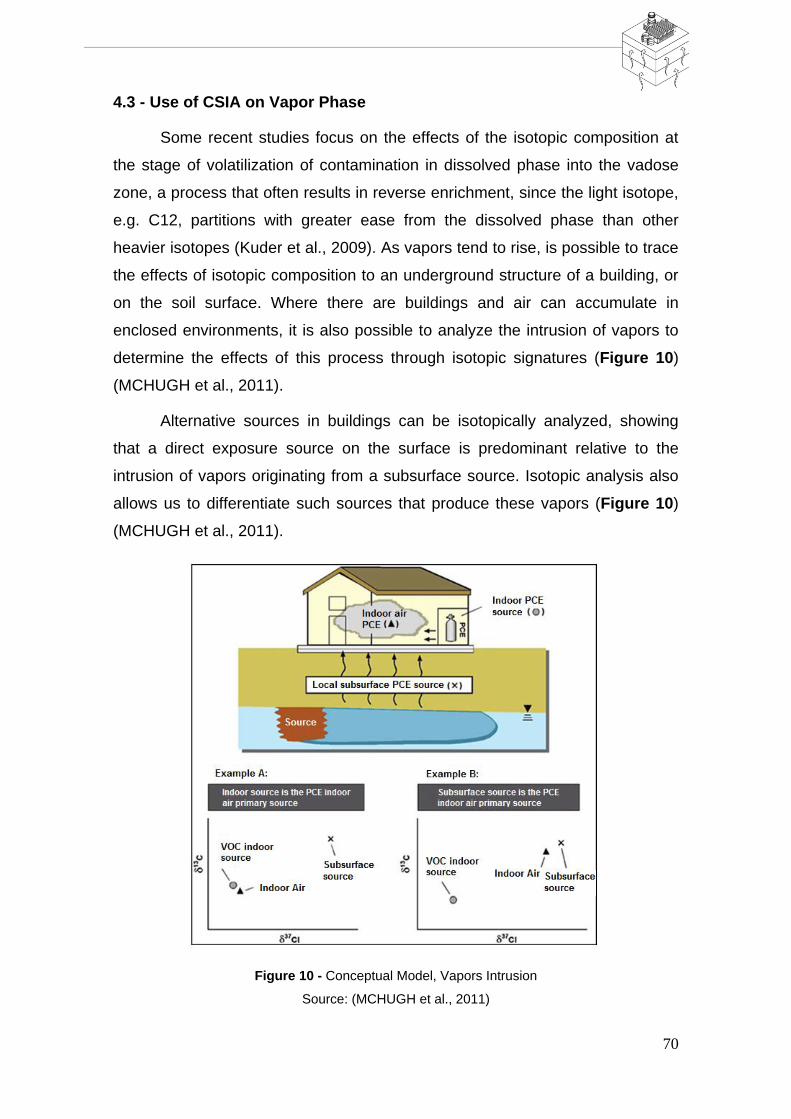
70
4.3 - Use of CSIA on Vapor Phase
Some recent studies focus on the effects of the isotopic composition at
the stage of volatilization of contamination in dissolved phase into the vadose
zone, a process that often results in reverse enrichment, since the light isotope,
e.g. C12, partitions with greater ease from the dissolved phase than other
heavier isotopes (Kuder et al., 2009). As vapors tend to rise, is possible to trace
the effects of isotopic composition to an underground structure of a building, or
on the soil surface. Where there are buildings and air can accumulate in
enclosed environments, it is also possible to analyze the intrusion of vapors to
determine the effects of this process through isotopic signatures (Figure 10)
(MCHUGH et al., 2011).
Alternative sources in buildings can be isotopically analyzed, showing
that a direct exposure source on the surface is predominant relative to the
intrusion of vapors originating from a subsurface source. Isotopic analysis also
allows us to differentiate such sources that produce these vapors (Figure 10)
(MCHUGH et al., 2011).
Figure 10 - Conceptual Model, Vapors Intrusion
Source: (MCHUGH et al., 2011)
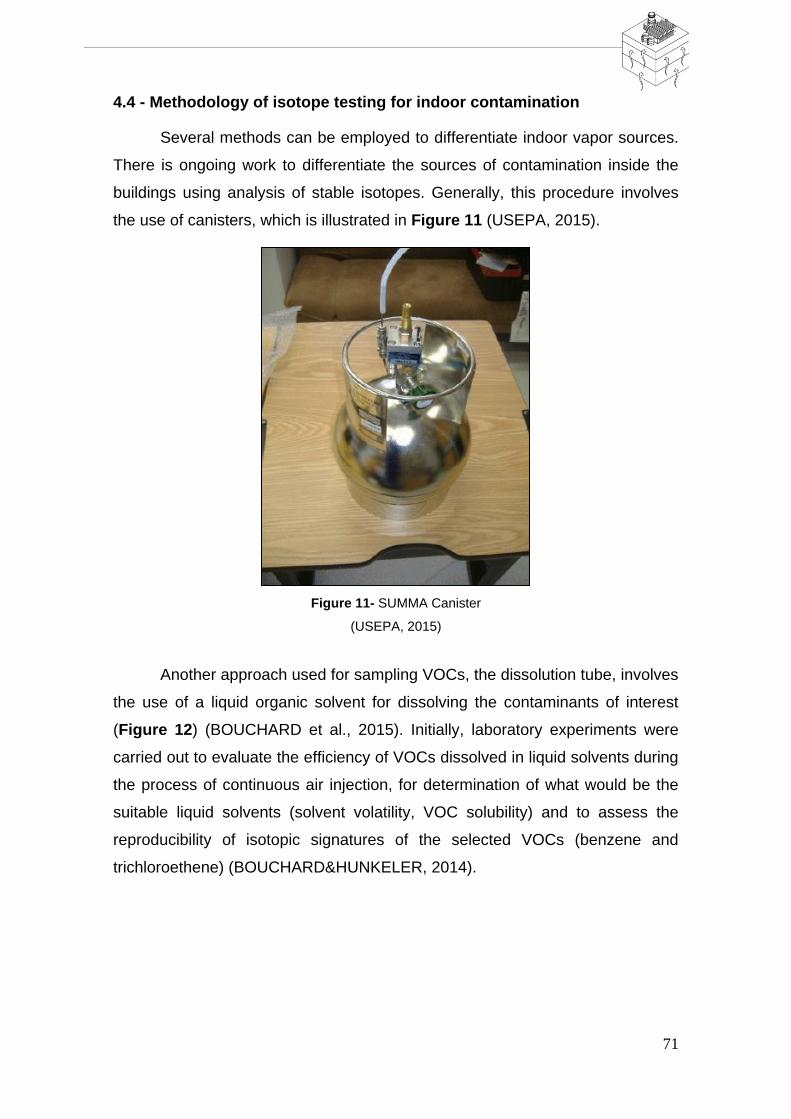
71
4.4 - Methodology of isotope testing for indoor contamination
Several methods can be employed to differentiate indoor vapor sources.
There is ongoing work to differentiate the sources of contamination inside the
buildings using analysis of stable isotopes. Generally, this procedure involves
the use of canisters, which is illustrated in Figure 11 (USEPA, 2015).
Figure 11- SUMMA Canister
(USEPA, 2015)
Another approach used for sampling VOCs, the dissolution tube, involves
the use of a liquid organic solvent for dissolving the contaminants of interest
(Figure 12) (BOUCHARD et al., 2015). Initially, laboratory experiments were
carried out to evaluate the efficiency of VOCs dissolved in liquid solvents during
the process of continuous air injection, for determination of what would be the
suitable liquid solvents (solvent volatility, VOC solubility) and to assess the
reproducibility of isotopic signatures of the selected VOCs (benzene and
trichloroethene) (BOUCHARD&HUNKELER, 2014).

72
Figure 12: Schematic representation of the dissolution sample tube device
(BOUCHARD et al., 2015)
This methodology was applied during an experiment carried out in an old
industrial building (BOUCHARD et al, 2008a; BOUCHARD et al, 2008b.). A
source of TCE (liquid phase) with known isotopic composition (δC13 and δCl37)
was used to create a plume in vapor phase inside an insulated room. The vapor
accumulated in this room was sampled with the dissolution tube. While passing
the liquid solvent, VOC in vapor phase is dissolved and accumulated. The
results are compared to samples with use of canisters, indicating that there is
excellent correlation in the measurement of δC13 for TCE between the two
methods used. Furthermore, the values of δC13 and δCl37 measured for the
sampled TCE with the dissolution tube were similar to the known values of the
source.
4.5 - Case Study in Brazil
As this technique is under development, specific applications in Brazil
need more study.A case brought by this Working Group involves the evaluation
of stable isotopes of methane gas generated by biodegradation processes
(Freitas et al., 2010) at the municipal park in the city of São Paulo. The use of
isotopes in this case has identified particular mechanisms of biodegradation.
This information can be used for forensic investigation to determine the specific
source of methane in the area of interest (FREITAS et al, 2010).
73
REFERENCES
ABREU, L.D.V. A Transient three dimensional numerical model to
simulate vapor intrusion into buildings. 2005. 276 f. Tese (Doutorado em
Filosofia) – Arizona State University, Phoenix, 2005.
ABREU, Lilian D. V.; JOHNSON, Paul C.. Effect of Vapor Source Building
Separation and Building Construction on Soil Vapor Intrusion as Studied with a
Tree-Dimensional Numerical Model. Environment Science & Technology,
Arizona State University, Tempe, v. 12, n. 39, p.4550-4561, 2005. Disponível
em: <http://pubs.acs.org/doi/abs/10.1021/es049781k>. Accessed in : 29 jul.
2009.
ABREU, Lilian D. V.; JOHNSON, Paul C.. Simulating the Effect of Aerobic
Biodegradation on Soil Vapor Intrusion into Buildings: Influence of Degradation
Rate, Source Concentration, and Depth. Environment Science & Technology,
Arizona State University, Tempe, v. 40, n. 12, p.2304-2315, 2006. Disponível
em: <http://pubs.acs.org/doi/abs/10.1021/es051335p>. Accessed in: 29 jul.
2009.
AMERICAN PETROLEUM INSTITUTE - AMERICAN PETROLEUM
INSTITUTE. Assessing the Significance of Subsurface Contaminant Vapor
Migration to Enclosed Spaces, Site-Specific Alternatives to Generic
Estimates. Washington D.C: Health And Environmental Sciences Department.,
1998. 4674 v.
AMERICAN PETROLEUM INSTITUTE - AMERICAN PETROLEUM
INSTITUTE. A Pratical Strategy for Assessing the Subsurface Vapor-to-
Indoor Air Migration Pathway at Petroleum Hydrocarbon Sites: Collecting
and Interpreting Soil Gas Samples from Vadose Zone. Publication 4741.
Washington D. C: Regulatory Analysis and Scientific Affairs, 2005.
AMERICAN PETROLEUM INSTITUTE . BIOVAPOR-A 1-D Vapor Intrusion
Model with Oxygen-Limited Aerobic Biodegradation Version 2.0. United
States Of America: American Petroleum Institute, 2009. 58 p.
AMERICAN SOCIETY FOR TESTING AND MATERIALS - AMERICAN
SOCIETY FOR TESTING AND MATERIALS. Standard guide for soil gas
monitoring in the vadose zone. Conshohocken, Pennsylvania: Annual Book
of AMERICAN SOCIETY FOR TESTING AND MATERIALS Standards, 1992. 4
v.
AMERICAN SOCIETY FOR TESTING AND MATERIALS - AMERICAN
SOCIETY FOR TESTING AND MATERIALS. Standard Guide for Risk-Based
Corrective Action Applied at Petroleum Release Sites. Conshohocken,
Pennsylvania: Annual Book of AMERICAN SOCIETY FOR TESTING AND
MATERIALS Standards, 1995. Designation E 1739-95.
AMERICAN SOCIETY FOR TESTING AND MATERIALS - AMERICAN
SOCIETY FOR TESTING AND MATERIALS. Standard Provisional Guide for
Risk-Based Corrective Action. Conshohocken, Pennsylvania: Annual Book of

74
AMERICAN SOCIETY FOR TESTING AND MATERIALS Standards, 1998.
Designation PS 104 - 98.
AMERICAN SOCIETY FOR TESTING AND MATERIALS - AMERICAN
SOCIETY FOR TESTING AND MATERIALS. Standard Provisional Guide for
Risk-Based Corrective Action. Conshohocken, Pennsylvania: Annual Book of
AMERICAN SOCIETY FOR TESTING AND MATERIALS Standards, 1998.
Designation PS 108 - 98.
ARANDA, S.; Borrok, D.M.; Wanty, R.B.; Balistrieri, L.S. Zinc isotope
investigation of surface and porewaters in a mountain
watershedimpactedbyacid rock drainage. Science of the Total Environment.
2012, 420, 202-213.
ASSOCIAÇÃO BRASILEIRA DE NORMAS TÉCNICAS. Poços de
monitoramento de águas subterrâneas em aquíferos granulados Parte 1:
Projeto e construção: NBR 15495-1. Rio de Janeiro, 2007.
ASSOCIAÇÃO BRASILEIRA DE NORMAS TÉCNICAS. Poços de
monitoramento de águas subterrâneas em aquíferos granulares Parte 2:
Desenvolvimento: NBR 15495-2. Rio de Janeiro, 2008.
ASSOCIAÇÃO BRASILEIRA DE NORMAS TÉCNICAS. Requisitos Gerais
para a Competência de Laboratórios de Ensaio e Calibração: NBR ISO/IEC
17025. Rio de Janeiro, 2005.
BEAR, Jacob. Dynamics of Fluids in Porous Media. Haifa: Dover
Publications Inc., 1972.
BOUCHARD, D.; Hoehener, P.; Hunkeler, D. Carbon isotope fractionation
during volatilization of petroleum hydrocarbons and diffusion across a
porous medium: A columnexperiment. Environ. Sci. Technol. 2008, 42, 7801–
7806.
BOUCHARD, D.; Hunkeler, D., Solvent-based dissolution methodto sample
gas-phase volatile organic compounds for Compound-Specific Isotope
Analysis. Journal of Chromatography2014, 1325, 16-22.
BOUCHARD, D.; Hunkeler, D.; Gaganis, P.; Aravena, R.; Hohener, P.;
Broholm, M. M.; Kjeldsen, P. Carbon isotope fractionation during diffusion
and biodegradation of petroleum hydrocarbons in the unsaturated zone:
Field experimentatVaerloseairbase, Denmark, and modeling. Environ. Sci.
Technol. 2008, 42, 596– 601.
BOUCHARD, D.; McLoughlin, P.W.; Hunkeler, D.; Pirkle, R.J. δ13C and δ37Cl
on gas-phase TCE for source identification and investigation – innovative
solvent-baseds ampling method. Manuscript in development. 2015.
CETESB - COMPANHIA DE TECNOLOGIA E SANEAMENTO AMBIENTAL DO
ESTADO DE SÃO PAULO. Relatório de estabelecimento de Valores
Orientadores para Solos e Águas Subterrâneas no Estado de São Paulo,
São Paulo, 2001.
75
CETESB - COMPANHIA DE TECNOLOGIA E SANEAMENTO AMBIENTAL DO
ESTADO DE SÃO PAULO. Ações Corretivas Baseadas em Risco (ACBR)
Aplicadas a Áreas Contaminadas com Hidrocarbonetos de Petróleo e
Outros Combustíveis Líquidos. São Paulo, 2001. 80 p. Relatório Final.
CETESB - COMPANHIA DE TECNOLOGIA E SANEAMENTO AMBIENTAL DO
ESTADO DE SÃO PAULO. Estabelecimento de Valores Orientadores para
Solos e Água Subterrânea no Estado de São Paulo. São Paulo, 2005. 246 p.
Relatório Final.
CETESB - COMPANHIA DE TECNOLOGIA E SANEAMENTO AMBIENTAL DO
ESTADO DE SÃO PAULO. Procedimento para Identificação de Passivos
Ambientais em Postos de Combustíveis. São Paulo, 2002. 11 p.
CETESB - COMPANHIA DE TECNOLOGIA E SANEAMENTO AMBIENTAL DO
ESTADO DE SÃO PAULO. Manual de Gerenciamento de Áreas
Contaminadas. 2. ed. São Paulo: Cetesb, 2001. 389 p.
CETESB - COMPANHIA DE TECNOLOGIA E SANEAMENTO AMBIENTAL DO
ESTADO DE SÃO PAULO. Procedimento para a Identificação de Passivos
Ambientais em Estabelecimentos com Sistema de Armazenamento Aéreo
de Combustíveis (SAAC). São Paulo, 2007. 9 p.
CETESB - COMPANHIA DE TECNOLOGIA E SANEAMENTO AMBIENTAL DO
ESTADO DE SÃO PAULO. Procedimento para Identificação de Passivos
Ambientais em Estabelecimentos com Sistema de Armazenamento
Subterrâneo de Combustíveis (SASC). São Paulo, 2006. 8 p.
CETESB - COMPANHIA DE TECNOLOGIA E SANEAMENTO AMBIENTAL DO
ESTADO DE SÃO PAULO. Decisão de Diretoria Nº 263/2009. São Paulo,
2009. 55 p.
CETESB - COMPANHIA AMBIENTAL DO ESTADO DE SÃO PAULO.
Contaminação no Shopping Center Norte. Áreas Contaminadas.
http://www.cetesb.sp.gov.br/areas-contaminadas/Rela%C3%A7%C3%B5es%2
0de%20%C3%A1reas%20contaminadas/20-Shopping%20Center%20Norte
(acessado em8 de Junho, 2015).
Cheng, H.; Hu, Y. Lead (Pb) isotopic fingerprinting and its applications in
lead pollution studies in China: a review. Environmental Pollution. 2010, 158,
1134–1146.
CHIARANDA, E. S. Volatilização dos compostos BTEX em ambientes
subsuperficiais contaminados com gasolina e etanol: comparação entre
concentrações medidas e simuladas. Florianópolis, 2006. 119 f.
Dissertação (Mestrado) – Departamento de Engenharia Sanitária e Ambiental,
Universidade Federal de Santa Catarina, Florianópolis, 2006.
CORDAZZO, Jonas. Modelagem e simulação numérica do derramamento
de gasolina acrescida de álcool em águas subterrâneas. 2000. 108 f.
76
Dissertação (Mestrado) - Departamento de Engenharia Mecânica, Universidade
Federal de Santa Catarina, Florianópolis, 2000.
CRUZ, M. J. F.; CARVALHO, F. R.; STRAGEVITCH, L. Efeito de aditivos
oxigenados na pressão de vapor de gasolinas. In: CONGRESSO BRASILEIRO
DE P&D EM PETRÓLEO & GÁS, 2, 2003, Rio de Janeiro. Anais...Rio de
Janeiro: IBP – Instituto Brasileiro do Petróleo, 2003.
DAVIS, Robin V.. Update on Recent Studies and Proposed Screening Criteria
for the Vapor-Intrusion Pathway. LUSTLine Bulletin, Massachusetts, n. 61,
p.11-14, maio de 2009.
DEVAULL, George E.. Indoor Vapor Intrusion with Oxygen-Limited
Biodegradation for a Subsurface Gasoline Source. Environmental Science &
Technology, v. 41, n. 9, p.3241-3248, 2007.
FERREIRA, S.M. Relação entre espessura real e aparente da gasolina com
etanol e da gasolina pura em colunas de laboratório. 2003. 107 p. Tese
(Doutorado em Recursos Minerais e Hidrogeologia) – Instituto de Geociências -
Universidade de São Paulo, São Paulo, 2003.
FERREIRA, Sílvia Maria; OLIVEIRA, Everton de; DUARTE, Uriel.
Comportamento da Gasolina com Etanol (E-20) e da Gasolina Pura Após a
Simulação de um Vazamento em Colunas de Laboratório. Revista do Instituto
de Geociências - USP: Geologia Série Científica USP, São Paulo, v. 2, n. ,
p.91-102, out. 2004.
FETTER, C. W.. Applied Hydrogeology. Columbus: Merrill Publishing
Company, 1980. 592 p.
FINOTTI, Alexandra R.; CAECEDO, Nelson O. Luna; RODRIGUEZ, Maria
Teresa Raya. Contaminações Subterrâneas com Combustíveis Derivados de
Petróleo: Toxicidade e Legislação Brasileira. Revista Brasileira de Recursos
Hídricos, Porto Alegre, v. 6, n. 2, p.29-46, jun. 2001.
FINOTTI, Alexandra Rodrigues et al. Avaliação da influência do etanol sobre o
grau de volatilização BTEX em solos impactados por derrames de
gasolina/etanol. Engenharia Sanitária e Ambiental: Nota Técnica, Caxias do
Sul, v. 14, n. 4, p.443-448, dez. 2009.
FREITAS, J.G; Fletcher, B.; Aravena, R.; Barker, J. Methane production and isotopic fingerprinting in ethanol fuel contaminated sites. Groundwater. 2010. 48, 6, 844–857. FREZZE, R. A.; CHERRY, J. A.. Groundwater. New Jersey: Prentice Hall, Inc,
1979. 604 p.
GALANTE, G. C. S. Plumas de contaminação por hidrocarbonetos em
diferentes cenários hidrogeológicos paulistas. São Paulo, 2008. 150 f.
Dissertação (Mestrado) – Instituto de Geociências, Universidade de São Paulo,
São Paulo, 2008.

77
GEOPROBE SYSTEMS (Kansas) (Org.). Direct Push Installation of Device
for Active Soil Gas Sampling & Monitoring. Salina, 2006. 32 p. (MK3098).
HERS, E. D. et al. TECHNICAL REPORT: Vapor Transfer of Soil
Contaminants: The Institute of Petroleum, 2002. 118 p. P5-18/TR.
HERS, Ian et al. The Use of Indoor Air Measurements To Evaluate Intrusion of
Subsurface VOC vapors into buildings. Journal Of The Air & Waste
Management Association, Vancouver, p. 174-187. set. 2001.
HERS, Ian. Recent Developments for Assessment and Management of Soil
Vapour Intrusion. In: MEIA 2ND ANNUAL REMEDIATION & PREVENTION
CONFERENCE, 2., 2010, Winnipeg. Recent Developments for Assessment
and Management of Soil Vapour Intrusion. Winnipeg: 2010. p. 1 - 59.
HOWARD, P. H.. Handbook of Environmental Fate and Exposure Data for
Organical Chemicals. Michigan: Lewis Publishers Inc., 1990.
HUNKELER, D.; Chollet, N.; Pittet, X.; Aravena, R.; Cherry, J.A.; Parker, B.L.
Effect of source variability and transport processes on carbon isotope
ratios of TCE and PCE in two sandy aquifers. J. Contam.Hydrol. 2004, 74,
265.
HUNKELER, D.; Meckenstock R. U.; Sherwood Lollar, B.; Schmidt T. C.;
Wilson, J T.A Guide for Assessing Biodegradation and Source
Identification of Organic Groundwater Contaminants using Compound
Specific Isotope Analysis (CSIA), EPA 600/R-08/148; U.S. Environmental
ProtectionAgency: Washington, DC, 2008.
IGNATIUS, Scandar Gasperazzo. Fluxo unidirecional de gás através de um
solo compactado : determinação laboratorial dos parâmetros. 1999. 337 f.
Tese (Doutorado) - Curso de Engenharia de Solos, Universidade de São Paulo,
São Paulo, 1999.
ITRC - THE INTERSTATE TECHNOLOGY & REGULATORY COUNCIL. Vapor
Intrusion Pathway: A Practical Guideline. Washington D.C: The Interstate
Technology & Regulatory Council, 2007. 172 p.
ITRC - THE INTERSTATE TECHNOLOGY & REGULATORY COUNCIL.
Petroleum Vapor Intrusion: Fundamentals of Screening, Investigation and
Management. Washington D.C: The Interstate Technology & Regulatory
Council, 2014. 391 p.
JOHNSON, P. C.; ETTINGER, R. A.. Heuristic Model for Predicting the
Intrusion Rate of Contaminant Vapors into Buildings. Environmental Science
& Technology, Houston, v. 25, n. 8, p.1445-1452, 1991.
JOHNSON, Paul C.. Idetification of Critical Parameters for the Johnson and
Ettinger (1991) Vapour Intrusion Model. American Petroleum Institute,
Arizona State University, Tempe, n. 17, p 1-39, 2002.
78
KALIPEDIA (Ed.). Disoluciones. Disponível em:
<http://pr.kalipedia.com/ecologia/tema/fotos-difusion-permanganato-
potasio.html?x1=20070924klpcnafyq_20.Ies&x=20070924klpcnafyq_27.Kes>.
Accessed in: 20 maio 2010.
KRITEE, K.; Blum, J.; Johnson, M.W.; Bergquist, B.A.; Barkay, T. Mercury stable isotope fractionation during reduction of Hg(II) to Hg(0) by mercury resistant microorganisms. Environ. Sci. Technol. 2007, 41, 1889-1895 KUDER, T.; Philp, P.; Allen, J. Effects of volatilization on carbon and
hydrogen isotope ratios of MTBE. Environ. Sci. Technol. 2009, 43, 1763–
1768.
LUNDEGARD, P. D.; JOHNSON, P. C.; DAHLEN, P.. Oxygen Transport From
the Atmosphere to Soil Gas Beneath a Slab-on-Grade Foundation Overlying
Petroleum-Impacted Soil. Environmental Science & Technology, Fullerton, v.
42, n. 15, p.5534-5540, 2008.
MCHUGH, Thomas E.; NICKELS, Tim N.. FINAL REPORT: Detailed Field
Investigation of Vapor. Houston: GSI Environmental, Inc., 2008. 338 p. ESTCP
Project ER-0423.
MCHUGH, T.; Kuder, T.; Fiorenza, S.; Gorder, K.; Dettenmaier, E.; Philp, P.
Application of CSIA to Distinguish Between Vapor Intrusion and Indoor
Sources of VOCs. Environ. Sci. Technol. 2011, 45, (14), 5952-5958.
MUKAI, H.; Furuta, N.; Fujii, T.; Ambe, Y.; Sakamoto, K.; Hashimoto, Y.
Characterization of sources of lead in the urban air of Asia using ratios of
stable lead isotopes. Environmental Science and Technology. 1993, 27,
1347–1356.
MAZZUCO, Lilian Maria. ATENUAÇÃO NATURAL DE HIDROCARBONETOS
AROMÁTICOS EM AQUÍFEROS CONTAMINADOS COM ÓLEO DIESEL.
2004. 72 f. Dissertação (Mestrado) - Curso de Química, Universidade Federal
de Santa Catarina, Florianópolis, 2004.
MELFI, A.J.; MONTES, C.R.. Solo e Ambiente. As ciências da Terra e sua
importância para a humanidade. A contribuição brasileira para o Ano
Internacional do Planeta Terra. São Paulo: Sociedade Brasileira de Geologia,
2008.
MINAS GERAIS. Assessoria de Comunicação Social Procuradoria da
República em Minas Gerais. Inquérito civil público vai investigar sete
marcos que conteriam benzeno: Disponível em:
<http://noticias.pgr.mpf.gov.br/noticias/noticias-do-site/copy_of_consumidor-e-
ordem-economica/mpf-mg-investiga-presenca-de-substancia-cancerigena-em-
refrigerantes>. Accessed in: 20 maio 2010.
NAZAROFF, W. W. et al. Experiments on pollutant transport from soil into
residential basements by pressure-driven airflow. Environmental Science &
Technology, Berkeley, v. 21, n. 5, p.459-465, 1987.
79
NAZAROFF, W. W. et al. Radon transport into a detached one-story house with
basement. Atmospheric Environment, Berkeley, v. 19, n. 1, p.31-46, 1985.
NEW JERSEY. Diane Groth. NJDEP Vapor Intrusion Committee (Org.). Vapor
Intrusion Guidance. New Jersey, 2005. 283 p.
OLIVEIRA, Everton de. Ethanol Flushing of Gasoline Residuals -
Microscale and Field scale experiments. 1997. 311 f. Tese (Doutorado) -
Curso de Filosofia em Ciências da Terra, University Of Waterloo, Waterloo,
1997.
PAULAU, J.; Marchesi, M.; Chambon, J.C.C.; Aravena, R.; Canals, A.; Binning,
P.J.; Bierg, P.; Otero, N.; Soler, A. Multi-isotope (carbon and chlorine)
analysis for fingerprinting and site characterization at a fractured bedrock
aquifer contaminated by chlorinated ethenes. Science of the Total
Environment. 2014, 475, 61–70.
POWERS, S. E ; McDOWELL, C. J. Infiltration and distribution of ethanol and
blended gasoline in vadose zone. . Environmental Science & Technology,
Berkeley, v. 37, p. 1803-1810, 2003.
PRIME - CONSULTORES ASSOCIADOS. Informe gerencial- Projeto de
intrusão de vapor e parâmetros de franja capilar. Bimestre
janeiro/Fevereiro de 2015, São Paulo, 2015.
RADDTZ A. L.; Johnson, T.M.; McLing, T.L..Cr stable isotopes in Snake
River Plain Aquifer groundwater: evidence for natural reduction of
dissolved Cr(VI). Environ. Sci. Technol. 2011, 45, 502–507
RAIS - THE RISK ASSESSMENT INFORMATION SYSTEM. Toxicity
Summary for Benzene. Disponível em:
<http://rais.ornl.gov/tox/profiles/benzene.shtml>. Accessed in: 01 set. 2009.
RAIS - THE RISK ASSESSMENT INFORMATION SYSTEM. Toxicity
Summary for Toluene. Disponível em:
<http://rais.ornl.gov/tox/profiles/toluene.shtml>. Accessed in: 01 set. 2009.
RAIS - THE RISK ASSESSMENT INFORMATION SYSTEM. Toxicity
Summary for Etilbenzene. Disponível em:
<http://rais.ornl.gov/tox/profiles/etilbenzene.shtml>. Accessed in: 01 set. 2009.
RAIS - THE RISK ASSESSMENT INFORMATION SYSTEM. Toxicity
Summary for Xilenes. Disponível em:
<http://rais.ornl.gov/tox/profiles/xilenes.shtml>. Accessed in: 01 set. 2009.
RESS, T. H.; Hers, I. NJDEP-GOLDER SUBSURFACE VAPOR INTRUSION
RESEARCH PROJECT: Investigation of Indoor Air Quality in Structures
Located Above VOC-Contaminated Groundwater, Year Two Part 1: Evaluation
of Soil Vapor Intrusion at Mount Holly Site, New Jersey: Golder Associates,
2006. 234 p. 023-6124-001.
80
SANTOS, R. C. F.. Impacto do Etanol na Biodegradação de Compostos
Monoaromáticos em Aquíferos Contaminados por Derramamento de
Gasolina. 1996. Dissertação (Mestrado) - Departamento de Engenharia
Sanitária e Ambiental, Universidade Federal de Santa Catarina, Florianópolis,
1996.
SANTOS, R. D. et al. Manual de Descrição e Coleta de Solo no Campo. 5.
ed. Viçosa: Sociedade Brasileira de Ciência do Solo - SBCS, 2005. 92 p.
SHOUAKAR-Stash, O.; Frape, S. K.; Drimmie, R. J., Stable hydrogen, carbon
and chlorine isotope measurements of selected chlorinated organic
solvents. J. Contam. Hydrol. 2003, 60, (3-4), 211-228.
TEIXEIRA, Cláudia E. et al. Estudos sobre a Oxidação Aeróbia do Metano na
Cobertura de Três Aterros Sanitários no Brasil. Engenharia Sanitária e
Ambiental, Universidade de Caxias do Sul, Caxias do Sul, v. 14, n. 1, p.99-
108, 2009.
TOMLINSON, Derek W.. Vapor Intrusion Assessment Tools. In: IV SEMINÁRIO
INTERNACIONAL SOBRE REMEDIAÇÃO E REVITALIZAÇÃO DE ÁREAS
CONTAMINADAS, 4., 2008, São Paulo. Vapor Intrusion Assessment Tools.
São Paulo: X, 2008. v. 1, p. 1 - 48.
UNITED STATES ENVIRONMENTAL PROTECTION AGENCY . Risk
Assessment Guidance for Superfund Volume I: Human Health Evaluation
Manual – Supplemental Guidance “Standard Default Exposure Factors”
Interim Final. United States Of America: United States Environmental
Protection Agency, 1991. 28 p.
UNITED STATES ENVIRONMENTAL PROTECTION AGENCY . Draft
Guidance for Evaluating the Vapor Intrusion to Indoor Air Pathway from
Groundwater and Soils. United States Of America: United States
Environmental Protection Agency, 2002. 53 p.
UNITED STATES ENVIRONMENTAL PROTECTION AGENCY . Oswer
Technical Guide for Assessing and Mitigating the Vapor Intrusion
Pathway from Subsurface Vapor Sources to Indoor Air. United States Of
America: United States Environmental Protection Agency, 2015. 267 p.
UNITED STATES ENVIRONMENTAL PROTECTION AGENCY . Technical
Guide for Addressing Petroleum Vapor Intrusion at Leaking Underground
Storage Tank Sites. United States Of America: United States Environmental
Protection Agency, 2015. 129 p.
UNITED STATES ENVIRONMENTAL PROTECTION AGENCY. Summa
Cannister. Region 6. http://www.epa.gov/Region6/6pd/rcra_c/ca/ canister.html
(accessed June 08, 2015).
WILSON, J. T.; Kaiser, P. M.; Adair, C. Monitored Natural Attenuation of
MTBE as a Risk Management Optionat Leaking Underground StorageTank
81
Sites EPA 600/R-04/179.U.S. Environmental Protection Agency:
Washington, DC, 2005.
Zwick, T.C.; Lesson, A.; Hinchee, R.E.; Hoeppel, R.E.; Bowling, L. Soil
Moisture Effects During Bioventing in Fuel-Contaminated Arid Soils, em,
In situ Aeration: Air Sparging Bioventing and Related Remediation
Processes, Batelle Press, Columbus, 1995. 333-340p.