2013 ANNU A L REPOR T
100
2013 ANNUAL REPORT
Transcript of 2013 ANNU A L REPOR T
2 0 1 3 A N N U A L R E P O R T

Your partners from the f irst – Al Qualey Aaron Hoeppner Aaron Sheets Aasim Turk Abeer Aslam Adair Engel Adam Bueter Adam Gill Adam Hamilton Adam Henson Adam Schmeltz Adrienne Gonzalez Alana Lezotte Alberta Barker Alex Austin Alisa Troyer Alison Jones Allyssa Phillip Amanda Alburitel Amanda Alvarado Amanda Grenert Amanda Hosaflook Amanda Kroll Amanda Miller Amber Briggs Amber Evans Amber Riggs Amber Smith Amber Stephenson Amber Watson Amishia Kreft Amy Barbour Amy Bobson Amy Burnau Amy Burridge Amy Clark Amy Delee Amy Dutton Amy Evans Amy Grey Amy Gullotta Amy Hagan Amy Hechlinski Amy Houk Amy Mailander Amy Matchett Amy Mauro Amy O Brien Amy Wagoner Amy Wankhade Amy Welkie Amy York Ana Santiago Martinez Ana Silguero Casados Anderson Nascimento Andrea Badowski Andrea Ehresman Andrea Morton Andrea Short Andrea Smiddy-Schlagel Andrea Soule Andrew Heck Andrew Manes Andrew Piasecki Andy Fox Angela Beilman Angela Beison Angela Dvorak Angela Harris Angela Marciniak Angela Nurnberg Angela Price Angie Arndt Angie Beserra Angie Fisher Angie Jeter Angie Zajac Ann Duncan Ann Feltz Ann Schepman Ann Shell Ann Wu Anna Rodda Anna Roose Anne Slavinskas Anthony Hurley Art Bayley Artavia Franklin Ashleigh Zimpelman Ashley Lower Ashley Myers Ashley Ward Ashlyn Irk Aurora Machado Barb Guerin Barb Ziolkowski Barbara Botka Barry Bilger Becca Mc Millen Becky Christner Becky Dietrich Becky Kincaid Becky Niedbalski Becky Pritchard Becky Ritter Becky Rizor Becky Sherman Becky Vervaet Becky Womer Bela Machan Ben Fanning Beth Curtis Beth Harshman Beth Ricksgers Beth Schultz Beth Van Parys Bethany Panting Bill Burton Bill Fox Billye Purdy Bob Ax Bob Jamieson Bob Kedzior Bob Rountree Bob Welsh Bonnie Chlebowski Bonnie Farnsworth Bonnie Fitch Bonnie Hobbs Bonnie Luczyk Brad Bradley Brad Bucher Brad Campbell Brad Dunlap Brandon Frisby Brandon Pawloski Brandon Schmidt Brandy Henrich Brenda Allison Brenda Capps Brenda Geller Brent Herwehe Brent Mithoefer Brent Ramer Brett Bauer Brian Green Brian Johnston Brittainy Chaffee Brittany Brockie Brittany Flosenzier Brittany Morgan Brittany Salisbury Brittany Smith Brittany Stutzman Brittney Plummer Bryan Byers Bryan Phillips Caitlin Shobert Candice Scott Candise Lassus Candy Sickels Caren Parko Caressa Rospierski Carey Koch Cari Wells Carmen Jun Carmen Lynes Carol Hochstetler Carol Hoke Carol Lewis Carol Sechrist Carole Watson Carolyn Biggs Carolyn Fields Carri Harrington Carrie Kosac Carrissa Cross Caryn Fisher Casey Desmith Casey Yerger Cassie Stamper Catherine Davis Catherine Janowiak Catherine Langford Cecil Murray Cecilia Hess Chad Gentry Chad Menzie Char Fabiszak Charity Mitchell Charlene Koszyk Chelsea Smith Cheri Richmond Cherie Wright Cheryl Borsch Cheryl Dennis Cheryl Noell Cheryl Scarberry Cheryl Wetters Choong Liew Chosani Chitaya Chree Kizer Chris Caudill Chris Craft Chris Frydrych Chris Modlin Chris Murphy Chris Ross Chris Skoczylas Chris Slomski Chris Strafford Chris Woody Chrisie Holmes Christa Cook Christina Dettman Christina Ringer Christine Baldwin Christine Gosztola Christine Miley Christine Pittman Christopher Bowman Christy Bader Chuck Ditto Chuck Matheny CiAnna Mc Daniel Cimmon Dougherty Cindy Frederick Cindy Mann Cindy May Cindy Millington Cindy Nimtz Cindy Trenerry Clara Lorentzen Claudia White Cliff Tuttle Connie Estep Connie Fordyce Connie Lemler Connie Lipscomb Connie Perkins Corrinne Burelison Cory Teagno Courtney Cassler Courtney Cerajewski Courtney Irwin Courtney Matheny Courtney Rhoades Crissy Blint Cristabel Hernandez Crystal Cartwright Crystal Love Crystal Schnick Crystal Williams Curt Lewandowski Curtis Bethel Curtis Brown Cyndi Miller Cynthia Dixon Cynthia Pierce Cynthia Rangel Cynthia Vasta Daina Krueger Dana Boone Dana Giszewski Daniel Haisley Daniel Peppler Daniel Riley Danielle Eigenmann Danielle Erickson Danielle Trumbull Danny Conroy Danny Grass Darla Perkins Darran Teamor Dave Bergevin Dave Crim Dave Hudak Dave Martin Dave Wertz David Ball David Silvers David Smedley David Voors David White Dawn Brutout Dawn Sumption Dawn Tungate Dawn Young-Pavasco Dayanara Flores Deb Barton Deb Bass Deb Holloman Deb Mc Cormick Deb Moser Deb Pogotis DebVan De Walle Deb Wentland Deb Wesolek-Mynsberge Deb Wogoman Debbie Dean Debbie Jernas Debbie Rykovich Deborah Cross Deborah Doelling Deborah Farkas Debra Franks Debra Meyer Debra Smith Debrielle Lane Delfa Rosenberg Denise Ford Denise Miller Denise Myers Denise Scott Denny Hively Derek Erny Derek Hayes Diana Domsic Diana Riddle Diane Burgess Diane Dolezal Diane Nally Diane Pugh Divya Nattanmai Dolores Bingham Donna Curry Donna Duttlinger Donna Lichtenbarger Donna Reed-Hamilton Doug Bryant Doug Carroll Doug Pierce Doug Way Douglas Johnson Drew Halliar Drew Lodder Dustin Wlodarski Ed Anthony Eddie Baumgartner Edgie Bottom Eduardo Ferreira Edwin Ponce Effie Thomas Eileen Jackson Elaine Bradtmueller Ellen Burke Ellen Santa Emily Bay Emily Bruck Emily Dubree Emily Eash Emily Sammons Emily Utermark Emily Walton Eric Heintzelman Eric Olsen Eric Peat Erica Molden Erica Shelton Ericka Santiesteban Erik Back Erik Watson Erika Doke Erin Hathaway Erin Shell Erin Van Dieren Faith Dejong Fran Hegyi Fran Maynard Fran Price Fred Boothby Gabrielle Hardy Gail Crussemeyer Garrett Kautz Garry Stoll Gary Blacketor Gary Jenswold Gena Saviano Gene Damalas Georganne Vervaet Georgia Rice Gina Beckner Gina Bentivenga Gina Bowen Gina Pointer Gina Ritter Glen Crookston Glenda Dixon Gloria Vaughan McKown Gopi Menon Grace Fox Grant Zhang Greg Holst Greg Linder Greg Stroupe Gregory Spalding Grier Gentry Guadalupe Robles Hazel Horvath Hazel Munnell Heather Brames Heather Mast Heather Walters Helen Atkinson Helesha Thomas Holly Horan Holly Nichols Holly Proctor Holly Risner Ida Balazsi Ingrid Mathias Leuthold Irene Lopez Jack Bahbah Jackie Gearhart Jackie Kronewitter Jackie O Blenis Jackie Peters Jackie Pisarek Jackie Vida Jacqueline Rico Jacqui Kovach Jaimie Hageman James Heim James Spitters James Welch Jamie Alexander Jamie Bankert Jamie Fahlsing Jamie Nicholos Jamie Warren Jan Bergstedt Jan Wilhelm Jana Bishop Jane Crim Janessa Burns Janet Hughes Janet Outman Janet Pasquarello Janet Rumpf Janet Siri Janice Howdeshell Janice Skok Janice Slach Janine Wood Jann Morris Jason Cooper Jason Mankey Jason Manwarren Jason Metcalfe Jason Olejnik Jay Gosselin Jay King Jay Potts Jayme Hampton Jayne Cooper Jean Lentz Jeanette Fage Jeannette De Neve Jeannette Hayes Jeannie Amador Jeannie Coby Jeannie Valencourt Jeff Bomstad Jeff Buckley Jeff Buhr Jeff Cooley Jeff Griggs Jeff Gunn Jeff Lindstadt Jeff Miller Jeff Peat Jeff Williams Jeffrey Bachmann Jen Engdahl Jen Klein Jen Snyder Jenni Nunemaker Jennie Williams Jennifer Armstrong Jennifer Gore Jennifer Greve Jennifer Hipsher Jennifer Lincoln Jennifer Prestine Jennifer Rice Jennifer Snyder Jenny Ramirez Jerry Mast Jerry Miller Jerry Szmanda Jessa Tilford Jessica Miller Jessica Peel Jessica Phelps Jessica Wall Jesus Cervera Jill Alward Jill Wagoner Jill Zwick Jim Dollar Jim Griest Jim Magera Jim Seitz Jo Kozlowski Joann Small Joanna Houin JoAnna Vitale JoAnne Klowetter Jodi Cox Jody Wilson Joe Frucci Joe Hunting Joe Kuzmitz Joe Malinowski Joe Mc Clintock Joe Noffsinger Joe O Dell Joe Rogina JoElla De Pra John Bedient John Borkowski John Dampeer John Elliott John Fowler John Griffith John Holmes John Horan John James John Jarvis John Linabury John Mc Creary John Morr Jon Marley Jon Painter Jonathan Rountree Jordan Messmann Joseph Carlton Joseph O Connor Josh Wheeler Joshua Birky Joshua Neff Joy Minocha Joyce Rayl Joyce Schalliol Judd Mc Nally Judy Bock Judy Caudill Judy Dominy Judy Hodgson Judy Horner Judy Lauer Judy Link Judy Love Juli Hayes Julianna Herring Julie Corr Julie Flanigan Julie Leszczynski Julie Lewandowski Julie Martinez Julie Miller Julie Quinn Julie Rodriguez Julie Scott Julie Thode Julie Wozencraft Julli Wirt
2013 ANNUAL REPORT CONTENTS
Corporate Description .................................................................................. i
2013 in Brief ................................................................................................. i
Financial Highlights ...................................................................................... ii
2013 Annual Shareholder Letter .................................................................... iii
Recognition .................................................................................................. x
Services ......................................................................................................... x
2013 Banking Center Locations .................................................................... xi
Shareholders’ Information ............................................................................. xii
Financial Report ........................................................................................... 1
Officers and Directors ........................................................... Inside Back Cover
i
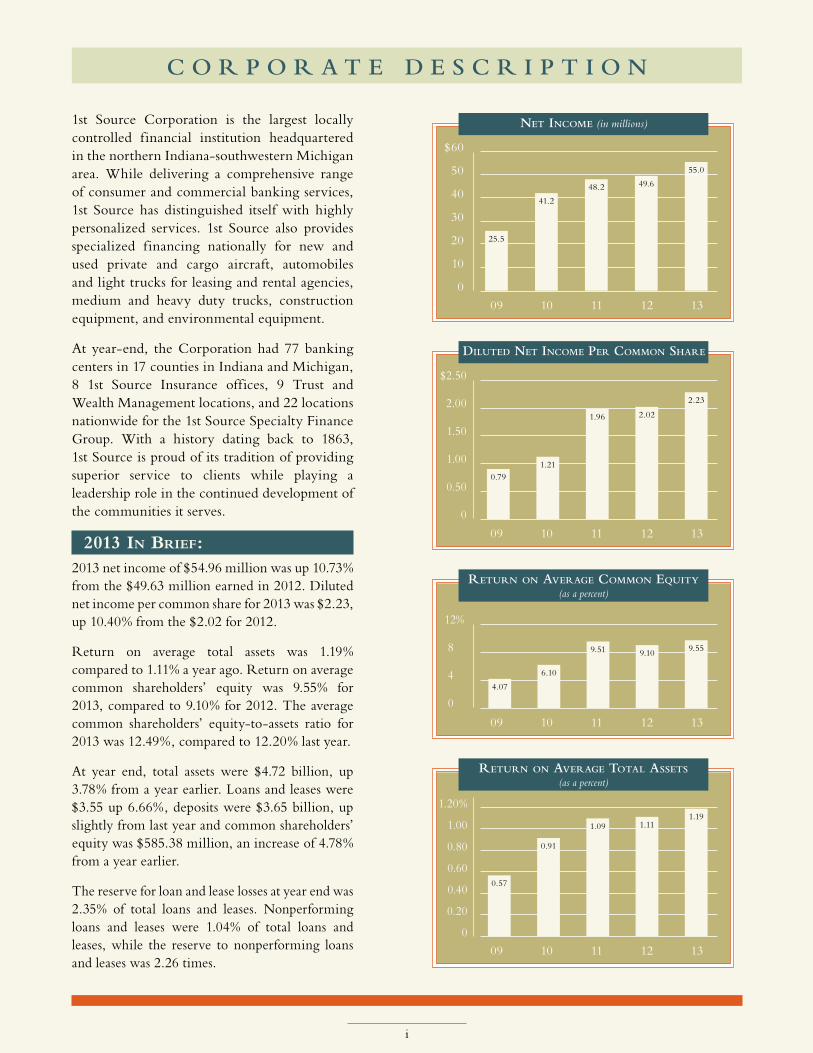
1st Source Corporation is the largest locally controlled financial institution headquartered in the northern Indiana-southwestern Michigan area. While delivering a comprehensive range of consumer and commercial banking services, 1st Source has distinguished itself with highly personalized services. 1st Source also provides specialized financing nationally for new and used private and cargo aircraft, automobiles and light trucks for leasing and rental agencies, medium and heavy duty trucks, construction equipment, and environmental equipment.
At year-end, the Corporation had 77 banking centers in 17 counties in Indiana and Michigan, 8 1st Source Insurance offices, 9 Trust and Wealth Management locations, and 22 locations nationwide for the 1st Source Specialty Finance Group. With a history dating back to 1863, 1st Source is proud of its tradition of providing superior service to clients while playing a leadership role in the continued development of the communities it serves.
2013 IN BRIEF:2013 net income of $54.96 million was up 10.73% from the $49.63 million earned in 2012. Diluted net income per common share for 2013 was $2.23, up 10.40% from the $2.02 for 2012.
Return on average total assets was 1.19% compared to 1.11% a year ago. Return on average common shareholders’ equity was 9.55% for 2013, compared to 9.10% for 2012. The average common shareholders’ equity-to-assets ratio for 2013 was 12.49%, compared to 12.20% last year.
At year end, total assets were $4.72 billion, up 3.78% from a year earlier. Loans and leases were $3.55 up 6.66%, deposits were $3.65 billion, up slightly from last year and common shareholders’ equity was $585.38 million, an increase of 4.78% from a year earlier.
The reserve for loan and lease losses at year end was 2.35% of total loans and leases. Nonperforming loans and leases were 1.04% of total loans and leases, while the reserve to nonperforming loans and leases was 2.26 times.
C O R P O R A T E D E S C R I P T I O N
$60
50
40
30
20
10
0 09 10 11 12 13
25.5
41.2
48.2 49.6
NET INCOME (in millions)
$2.50
2.00
1.50
1.00
0.50
0
09 10 11 12 13
0.791.21
1.96 2.02
DILUTED NET INCOME PER COMMON SHARE
12%
8
4
0
09 10 11 12 13
4.07
6.10
9.51 9.10
RETURN ON AVERAGE COMMON EQUITY (as a percent)
1.20%
1.00
0.80
0.60
0.40
0.20
0 09 10 11 12 13
RETURN ON AVERAGE TOTAL ASSETS (as a percent)
0.57
0.91
1.09 1.11
55.0
2.23
9.55
1.19
ii
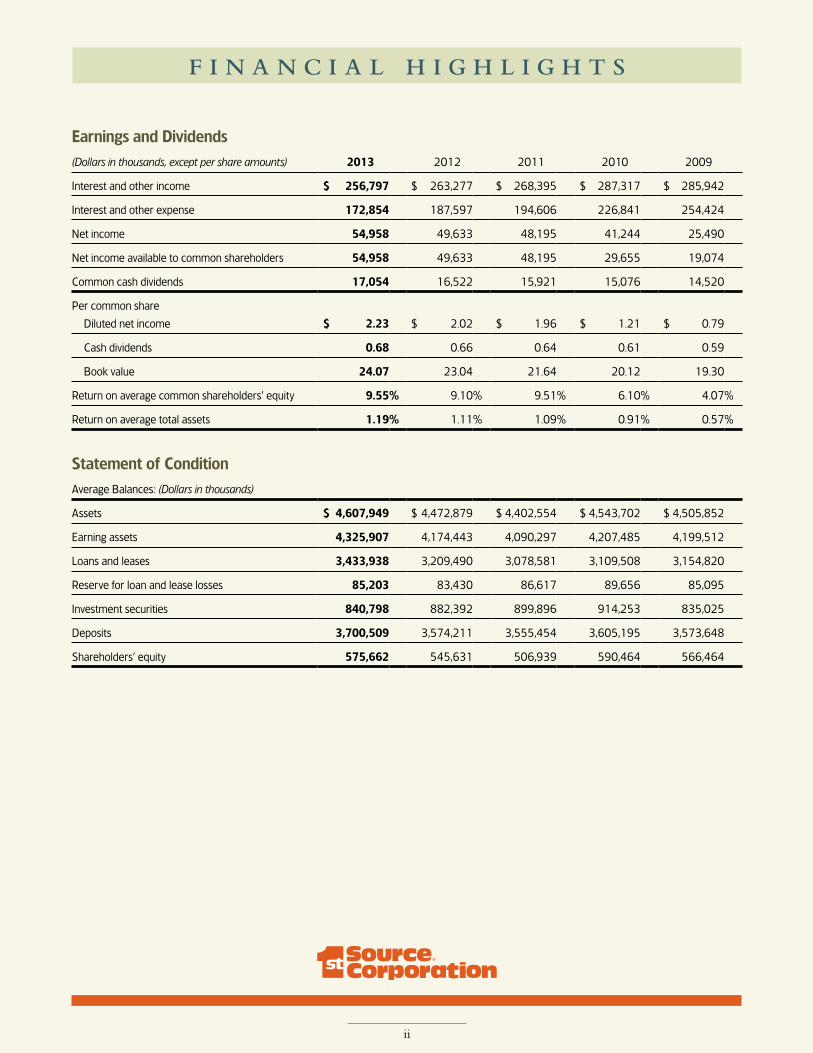
Earnings and Dividends(Dollars in thousands, except per share amounts) 2013 2012 2011 2010 2009
Interest and other income $ 256,797 $ 263,277 $ 268,395 $ 287,317 $ 285,942
Interest and other expense 172,854 187,597 194,606 226,841 254,424
Net income 54,958 49,633 48,195 41,244 25,490
Net income available to common shareholders 54,958 49,633 48,195 29,655 19,074
Common cash dividends 17,054 16,522 15,921 15,076 14,520
Per common share
Diluted net income $ 2.23 $ 2.02 $ 1.96 $ 1.21 $ 0.79
Cash dividends 0.68 0.66 0.64 0.61 0.59
Book value 24.07 23.04 21.64 20.12 19.30
Return on average common shareholders’ equity 9.55% 9.10% 9.51% 6.10% 4.07%
Return on average total assets 1.19% 1.11% 1.09% 0.91% 0.57%
Statement of ConditionAverage Balances: (Dollars in thousands)
Assets $ 4,607,949 $ 4,472,879 $ 4,402,554 $ 4,543,702 $ 4,505,852
Earning assets 4,325,907 4,174,443 4,090,297 4,207,485 4,199,512
Loans and leases 3,433,938 3,209,490 3,078,581 3,109,508 3,154,820
Reserve for loan and lease losses 85,203 83,430 86,617 89,656 85,095
Investment securities 840,798 882,392 899,896 914,253 835,025
Deposits 3,700,509 3,574,211 3,555,454 3,605,195 3,573,648
Shareholders’ equity 575,662 545,631 506,939 590,464 566,464
F I N A N C I A L H I G H L I G H T S

iii
On November 30, 1863 1st Source opened its doors for the first time. This is our 150th year of serving the people of Northern
Indiana and Southwestern Michigan! We are proud of what we have accomplished in building these communities and in helping individuals and businesses grow and succeed. We began our anniversary celebration in June when all of our colleagues came together to rededicate ourselves to helping our clients achieve security, build wealth, and realize their dreams. We do this by providing straight talk and sound advice while keeping the client’s best interest in mind for the long term. We recommitted to working together as a team and recognized the legacy of caring, committed service that has been passed on to us and which we must steward and pass on to those who come after us. We used this moment to look back so that we could look forward with strength and commitment. This year is about the next 150 years of growth and success, therefore we will continue to celebrate right through the coming summer.
As we celebrate this anniversary, I am pleased to report that 2013 was another good year for 1st Source. We achieved record earnings at $55.0 million, up from $49.6 million the prior year, a 10.7% increase. Earnings per share, also a record, was up 10.4% over the prior year to $2.23 from $2.02.
In spite of tightening net interest margins, we were able to achieve this performance by growing our loan portfolios, holding our cost growth in check, and working to recover prior charged off principal, recover expenses and collect past due interest. We were able to do this because we maintain strong capital and reserves. This gives us the ability to work with our clients through periods of challenge and distress, nursing them back to health while building stronger financial controls and disciplines. We have worked with some from as far back as the September 11th attacks and others since the financial crises of 2008.
The bank’s first President, Judge Thomas S. Stanfield has been called one of the most broad-minded and farseeing men in early South Bend. A prominent lawyer and civic leader, he served as Circuit Court Judge, Indiana State Representative and a close advisor to Governor Morton during the Civil War. Judge Stanfield was a leader in bringing the railroad to South Bend in 1851.
2 0 1 3 A N N U A L S H A R E H O L D E R L E T T E R

STRONG CREDIT QUALITY:Our credit quality continues to improve as net charge offs for the year were remarkably low at about two hundredths of one percent of average loans and leases. Delinquency was 0.52% at year end and nonperforming assets were $46.7 million or 1.29% of outstanding loans and leases. The loan and lease loss reserve at the close of the year was $83.5 million or 2.35% of outstanding loans and leases. The reserve for loan and lease losses covers nonperforming assets 1.79 times at the end of the year.
ORGANIC GROWTH:Our average loans and leases grew from $3.2 billion in 2012 to $3.4 billion in 2013. Mortgage volumes were off substantially but consumer loans, commercial business lending and specialty equipment lending all grew during the year. Similarly, our deposits continued to grow to $3.7 billion up from $3.6 billion in 2012. There was certainly hesitancy on the part of our clients to make long term capital investments in growth as they are not trusting of the government’s actions with regard to taxes, the deficit, healthcare, or the continuing growth and cost of regulation. A more predictable fiscal, economic, and political horizon would do much to lead to stronger local investment.
iv
First Bank opened a bank branch in 1935, the first branch to be opened by a banking institution in northern Indiana.
This photograph from the early 1900s shows the lobby of the 1st Source office located at 14 Indiana Avenue in Valparaiso. 1st Source purchased the property in 2007 when the bank acquired the First National Bank Valparaiso.
In 1865, a fire destroyed the St. Joseph Hotel, the original home of
the First National Bank of South Bend. Following the fire, the bank purchased
the Old State Bank Building located at the southwest corner of Michigan
Street and Colfax Avenue.
On June 10, 1900, the First National Bank of South Bend moved into the newly-constructed Oliver Hotel located at 101 North Main Street. The bank remained at this location until 1923.

v
We are blessed to serve many of the larger more successful businesses in our region. In many cases they have grown with us as they started small and have grown over the years. We have always believed it important to help build our economy with smaller businesses that become the base of the future. Our SBA efforts have been focused for a number of years and we were pleased to be recognized in 2013 as the number 1 SBA lender in Northwest Indiana in our Fort Wayne region. We have been number 1 in North Central Indiana for a number of years. As best we can tell, we hold the number 1 position in every market in which we have branches in Indiana. We were also recognized by the SBA as the Diversity Lender of the Year for the Great Lakes Region for our support of women, veterans, and minorities. Lastly, in partnership with the SBA we also launched a Veterans’ Program in Indiana.
To help us grow with our personal banking clients, we opened new branches in Columbia City and in Lafayette, Indiana and introduced improvements to our online and mobile banking platforms. We continue to develop our lean initiatives for more effective management of all our resources.
CELEBRATING 150 YEARS:As previously mentioned, this year is devoted to reminiscing, to celebrating our successes, to better understanding our legacy, and to reinforcing the importance of our values of integrity, teamwork, superior quality in everything we do, outstanding client service, and leadership in the communities we serve. All of this is centered on the client because we are all part of one team connected now and across time for the purpose of serving our clients.
We asked ourselves: Why is 1st Source here? Why does 1st Source exist? It is simple: to serve clients.
A variety of clients helped us better understand our commitment and our importance to their success. They shared their stories with us pointing out where we delivered well on that commitment. It was the nuances of their messages that resonated most with us. They represented individuals who had come on hard times but we had helped in a variety of ways. There were entrepreneurs who were dreamers and started businesses and then relied on our advice to achieve lasting success, families that had worked over generations and continued to grow and build based on their reliance on us, and businesses small and large that had come to us for straight talk and sound advice because they knew they could trust us to keep their best interests in mind, for the long term. Their stories reinforced that we exist for one reason and that is to serve clients.
Vincent Bendix and E. M. Morris combined resources to form the new First Bank & Trust Co.
As founder of the Associates Investment Company, First Bank Chairman Ernest M. Morris played a major role in establishing the finance industry as we know it today. In 1917 when few banks were interested in financing automobiles, he created the Associates Investment Company to purchase sales finance contracts from auto dealers. The Associates became the first company to prepare a simple automobile loan contract and the first to develop a rate chart to clearly show the monthly loan payment. Morris’ leadership extended into many good works in the community.
1928: The bank made a bold move and became the first bank in the city and the fifteenth in the nation to replace teller cages in favor of a friendlier counter system. With the bars removed, bankers could more easily assist clients and provide personal service.E. M. Morris
Vincent Bendix

vi
We learned that what has gotten us here, what has sustained us for over 150 years, is very simple: it is the way we think, it is our collective values, it is the way we collectively think and act. It is a clear belief in the goodness of each other as partners, as teammates, as colleagues. It is a clear belief in the goodness of our clients. It is a clear belief in the value and nobility of our mission of helping others to achieve security, build wealth, and realize their dreams using our individual and combined talents and skills to serve them honestly and fairly.
COMMITMENT TO CLIENTS:Rather than celebrate with bands, partying, and celebrity motivational speeches, we invited a philosopher to meet with us and give us insight into those immutable values that have sustained us for 150 years. We asked him to talk with us about what the great philosophers have said throughout the ages about the values and practices that lead to lasting success. We wanted to ref lect on these and then embrace them as a foundation for the next 150 years. Using his research and the writings of the great philosophers, Tom Morris PhD helped us think through the issues and presented a framework for better understanding our own success and the personal happiness that comes from serving others. He reminded us that true happiness, true success and sustainable growth are built on core values and that ours of integrity, teamwork, superior quality in everything we do, outstanding client service, and community leadership have helped us be successful for 150 years and should serve well as a strong foundation for the next 150 years.
The 1950s and 60s were a time of prosperity for South Bend. The city’s downtown business district thrived and area manufacturers were busy keeping up with post-war consumer demand. First Bank anticipated the needs of a growing community and added new locations and services.

A LITTLE HISTORY:That evening we also learned a little more about how 1st Source was forged first in the middle of the worst struggle our nation has endured, the Civil War, and then later in the midst of the Great Depression. A prominent local judge and some others, including a gentleman destined to become Vice President of the United States under President Grant, received a charter in September 1863 and then opened for business as The First National Bank of South Bend on November 30, 1863. This new bank was formed to serve individuals and businesses in Indiana and Michigan from South Bend. The bank opened two weeks after President Lincoln’s Gettysburg Address. Fire destroyed our first offices but the assets of the bank were saved and moved to new quarters where we stayed for 35 years before moving to the stately Oliver Hotel. The depression hit after the crash of 1929, and in the early ‘30s, E.M. Morris, founder of The Associates Investment Company and a pioneer of automobile financing for individuals, was asked by the then Board to take over as President and to merge the bank and The Union Trust Company. He and Vincent Bendix, founder of the Bendix Corporation, each then invested $500,000 into the capital of the bank and changed its name to The First Bank and Trust Company, taking over deposits of other financial institutions that were failing in the community. During a three year period, 11 of the 18 banks in South Bend failed. First Bank not only survived but was the first to be allowed to reopen after President Franklin D. Roosevelt announced his national bank holiday and closed all the banks in the country for up to three weeks.
Our history since that time has been to continue to grow and serve markets across Northern Indiana and Southwest Michigan as a community bank, now named 1st Source Bank. We are focused on client success and we have been committed to building a set of equipment finance capabilities serving specific markets on a national, and in some cases, international basis.
vii
We answer the phone, with real people.
Technology may be great in many areas, but at
1st Source, we answer the phone with employees
based right here in northern Indiana and
southwestern Michigan.
In 1947, ground was broken for a new office of the First Bank & Trust Company in South Bend’s River Park neighborhood. The branch opened in 1948 at 2602 Mishawaka Avenue, and was the bank’s second branch office and third location overall.
Built in 1968, the Roseland and Ewing Avenue branches featured identical designs. The two branches were the bank’s first buildings to incorporate the now-familiar, signature colonial style.
Hundreds of balloons were released into the Michiana sky on May 16, 1984 to celebrate the second
anniversary of the opening of 1st Source Center in downtown South Bend.
In 1983, 1st Source Bank won an Eagle Award for its commercial describing the “trials and tribulations” of going to the big-city megabanks for financial services.

BEING IN SERVICE TO OTHERS:From this long history, we learned that life in service to others, as community banking is, can be among the highest callings if we truly do give straight talk and sound advice, keeping our clients’ best interests in mind for the long term. We learned that we are all part of something bigger than ourselves, and that to succeed from one generation to the next, hard decisions have to be made. A commitment to building a fortress-like balance sheet, to developing and maintaining a strong disciplined credit culture, the opening of branches, the deployment of ATMs, the use of technology, the tight management of expenses, the training of people, and the constant building of a great team are all necessary for our continued success in serving our clients from one generation to the next.
CLIENT AND COMMUNITY CENTRIC:We started our celebration early in the year by asking clients to write us about their experiences with 1st Source over the years. We received hundreds of heartwarming and moving letters. The stories, the remembrances and the comments were inspiring. We followed these by anniversary parties in our branches as a way of saying thank you to our clients. We then invited everyone in the communities we serve to help us support their favorite charities by nominating a not-for-profit in our 150 Years, $150,000 Cheers promotion. We understand the importance of a strong social and human safety net, the critical need for high quality health care, the empowering and creative nature of the arts, and the critical importance of education to our future economic development leading to a better standard of living and more fulfilling life for everyone in the communities we serve.
viii
Play Ball! – 1st Source sponsors a night at Coveleski Stadium for our community and employees.
1st Source banking centers take time to celebrate our 150th Anniversary with clients.

I cannot tell you how excited and energized we were to receive over 13,500 nominations for 1,500 organizations across the region. Through drawings over six weeks, we were able to give 150 organizations each $1,000 and two organizations selected from among them each received $15,000. This supplements the over 27,000 hours our colleagues volunteer in these communities each year and the almost $1.1 million we invest in the not-for-profit organizations that have become an important part of the fabric of the markets we serve.
Our 150th Anniversary is all about our clients and we will continue to celebrate with them this year through the summer. We will continue to reinforce among ourselves those values that have sustained us for so long and which will serve as a strong foundation for the future.
ix
Left – The South Bend Center for History 1st Source exhibit Below and left – 1st Source press conference announcing the two grand prize winners in our 150 Years/$150,000 Cheers charity donation contest.
At 1st Source, we continue to focus on the basics of delivering exceptional client service, practicing rigorous cost control, and maintaining pristine credit quality. We look forward optimistically and with enthusiasm to continue building a company that all our partners in the bank and our long term shareholder partners can be proud of. Thank you for your continuing support.
Christopher J. Murphy IIIChairman and Chief Executive Officer
1st Source Corporation

x
Strong. Stable. Local. Personal. We’re a top rated community bank recognized for outstanding performance and exceptional service to clients.
Staying true to our values has helped us succeed. Integrity; outstanding client service; teamwork; superior quality; and community leadership are at the heart of everything we do. We adhere to solid,
basic lending principles, allowing us to maintain a strong financial standing.
America’s Best Banks
Ranked #25 in 2013 based on an analysis of asset quality,
capital adequacy and profitability
Northwest Indiana Business Quarterly Magazine
Recognized as ‘Best Bank for Business, Attaining a Business Loan, and Customer
Service’ in Michiana
BauerFinancial 5 Star “Superior” Rating
Highest rating possible. Based on capital ratio, profitability/loss trend, credit quality and CRA ratings
Seifried&BrewTop 15th Percentile of Community Banks
Small Business Administration
2013 Indiana SBA Community Lender Award
BankDirectorTop 150
Performing Banks
Ranked #24 in 2013 based on profitability, capital adequacy and
asset size.
BankDirectorNifty Fifty
Ranked #43 on the 2014 list of best users of capital based on
profitability and capital strength
KBW, Inc2012 & 2013
Bank Honor Roll of Superior Performers
The BankerTOP 1000
WORLD BANKS 2013#859 on global list
#38 soundest bank in U.S.
Small Business Administration
Great Lakes Diversity Lender of the Year
for 2013
Bank & Thrift Sm-All Stars
Top 31 performing banks in U.S.
P R E S T I G I O U S R E C O G N I T I O NSTRAIGHT TALK
andSOUND ADVICE
SINCE 1863
C O M P R E H E N S I V E S E RV I C E S
CheckingSavingsCertificates of Deposit IRAsHealth Savings Accounts
LoansPersonalAutomobileHome EquityMortgageBoat, RV, Motorcycle
Asset ManagementTrust and EstateAdministrationTrust AdministrationIRA/401(k) ManagementSpecial Needs TrustEstate SettlementBill Payment ServicesCharitable Trust and Foundation Administration
Wealth Management ServicesInvestment ManagementEstate PlanningCharitable StrategiesRetirement PlanningEducation PlanningTax PlanningInsurance Solutions
Private BankingRelationship ManagementPremier Convenience in Day to Day Banking
Deposit/Cash ManagementSpecialization
Mortgage LoansLines of Credit (secured and unsecured)
Checking
Loans & LeasingCash ManagementMerchant Card ServicesBusiness 401K PlansRetirement Plan Services
Aircraft & HelicopterAuto & Light TruckHeavy & Medium Duty Trucks
Construction EquipmentShuttle BusStep VansFuneral CoachesEnvironmental Equipment
PersonalHomeownersRentalFloodUmbrella Liability CoverageLife & HealthDisability IncomeAutomobileSnowmobileRecreational VehicleBoat
BusinessCommercial AutoCommercial PropertyCrimeEmployment PracticesKey Man LifeEnvironmental LiabilityGeneral LiabilityUmbrella/Excess Liability Workers’ Compensation Crop Insurance
PERSONAL INSUR ANCE BUSINESS
SPECIALTY EQUIPMENT FINANCE

xi
Kalamazoo
Fort Wayne
South Bend
Mishawaka
Berrien
Cass St. Joseph
Allen
DeKalb
Elkhart
Fulton
Huntington
Kosciusko
La Grange
LaPorte
Marshall
NoblePorter
Pulaski
St. Joseph
Starke
Steuben
Wells
WhitleyNew Haven
ElkhartGranger
Dunlap
Goshen
Niles
St. Joseph
Stevensville
Michigan City
LaPortePortage
Valparaiso
Knox
Winamac
Dowagiac
New Carlisle
Walkerton
North Liberty
Plymouth
Argos
Rochester
Warsaw
LaPazBremen
OsceolaMiddlebury
ColumbiaCity
Huntington
Bluffton
Nappanee
469
69
94
69
80/9080/90
24
24224
30
30
35 31
31
33
33
20
1212
131
6
6
39
9
92
15
60
23
69
51
1
8
5
5
5
16
7
Kalamazoo
White
Tippecanoe
Cass
421Miami Wabash
Lafayette
Westville
Chesterton
Portage Ave.
Cleveland Rd.
20
31
20 31
933
933
331
80/90 23
23
Mishawaka
Ironwood D
r.
Mishawaka Ave.
Gra
pe R
d.
McKinley Ave.
Lincoln Way West
Lincoln Way East
Mai
n St
. Michigan St.
Western Ave.
NotreDame 30
469
469
69
69
24
27
27
3033
930
327
930
32733
Anthony Blvd.
Clin
ton
St.
State Blvd.
Bluf
fton
Rd.
New Haven
State Blvd.
Tillman Rd.
Lafayette St.
Map
lecr
est R
d.
Jefferson Blvd
.
Dupont Rd.
Hat
zell
Rd.
Coliseum Blvd.
Cold
wat
er R
d.
ValparaisoUniversity
Valparaiso
Indiana Ave.
E. Evans Ave.
Glendale Blvd.
County Road 400 North
Roosevelt Rd.N. Cam
pbell St.
N. Valparaiso St.
N. W
ashington St.
E. Lincolnway
N. C
alum
et A
ve.
30 2
Silhavy Rd.
Franklin St.
130
Sturdy Rd.
49
Chicago
Indianapolis
Detroit
Milwaukee
Cleveland
South Bend
Fort Wayne
Louisville
Wisconsin
Illinois
Michigan
Ohio
Kentucky
Indiana
Hebron
4
Kouts LaCrosse
Specialty Finance Group Locations
2 0 1 3 B A N K I N G C E N T E R L O C AT I O N S

2013 Stock Performance & Dividends1st Source Corporation common stock is traded on the Over-The-Counter Market and is listed on the Nasdaq Global Select Market under the symbol “SRCE.” 1st Source is also listed on the National Market System tables in many daily papers under the symbol “1stSrc.”
High and low common stock prices, cash dividends paid for 2013 and book value were:
Cash Dividends Quarter Ended High Low Paid
March 31 $ 24.79 $ 21.88 $0 .17
June 30 25.25 22.65 0.17
September 30 28.82 23.87 0.17
December 31 32.92 25.64 0.17Book value per common share at December 31, 2013: $24.07
Annual Meeting of Shareholders
The Annual Meeting of Shareholders has been called for 10:00 a.m. EDT, April 24, 2014, at 1st Source Center, 100 North Michigan Street, South Bend, Indiana.
Entrance to the annual meeting is limited to shareholders only. If your shares are held in “street name” (that is, through a broker), you must bring a recent copy of a brokerage statement reflecting your stock ownership as of February 18, 2014, the record date.
Common Stock ListingThe Nasdaq Global Select Market
Market Symbol: “SRCE”CUSIP #336901 10 3
1stsource.comFor the latest shareholder information, log on to www.1stsource.com.
Click on the “About Us” link and then “Investor Relations.”
If you would like to help us reduce printing costs by receiving reports electronically, please e-mail us at shareholder!1stsource.com.
Transfer Agent, Registrar and Dividend Disbursing AgentAmerican Stock Transfer and Trust Company
6201 15th AvenueBrooklyn, NY 11219
Independent Auditors Shareholder Inquiries Ernst & Young LLP 1st Source Corporation 155 North Wacker Drive Andrea G. Short, Chief Financial Officer Chicago, IL 60606 Post Office Box 1602 South Bend, IN 46634 (574) 235-2000
xii
S H A R E H O L D E R S ’ I N F O R M A T I O N
1 SRCE 2013 Form 10-K
UNITED STATESSECURITIES AND EXCHANGE COMMISSION
Washington, D.C. 20549
FORM 10-K(Mark One)
ANNUAL REPORT PURSUANT TO SECTION 13 OR 15(d) OF THE SECURITIES EXCHANGE ACT OF 1934
For the fiscal year ended December 31, 2013
OR
TRANSITION REPORT PURSUANT TO SECTION 13 OR 15(d) OF THE SECURITIES EXCHANGE ACT OF 1934
For the transition period from to
Commission file number 0-6233
1ST SOURCE CORPORATION(Exact name of registrant as specified in its charter)
Indiana 35-1068133(State or other jurisdiction of incorporation or organization) (I.R.S. Employer Identification No.)
100 North Michigan Street, South Bend, Indiana 46601(Address of principal executive offices) (Zip Code)
Registrant’s telephone number, including area code: (574) 235-2000
Securities registered pursuant to Section 12(b) of the Act:
Title of each class
Name of each exchange on which registeredCommon Stock — without par value
The NASDAQ Stock Market LLC
Securities registered pursuant to section 12(g) of the Act: None
Indicate by check mark if the registrant is a well-known seasoned issuer, as defined in Rule 405 of the Securities Act. Yes No
Indicate by check mark if the registrant is not required to file reports pursuant to Section 13 or Section 15(d) of the Act. Yes No
Indicate by check mark whether the registrant (1) has filed all reports required to be filed by Section 13 or 15(d) of the Securities Exchange Act of 1934 during the preceding 12 months (or for such shorter period that the registrant was required to file such reports), and (2) has been subject to such filing requirements for the past 90 days. Yes No
Indicate by check mark whether the registrant has submitted electronically and posted on its corporate Website, if any, every Interactive Data File required to be submitted and posted pursuant to Rule 405 of Regulation S-T (§232.405 of this chapter) during the preceding 12 months (or for such shorter period that the registrant was required to submit and post such files). Yes No
Indicate by check mark if disclosure of delinquent filers pursuant to Item 405 of Regulation S-K (§229.405 of this chapter) is not contained herein, and will not be contained, to the best of registrant’s knowledge, in definitive proxy or information statements incorporated by reference in Part III of this Form 10-K or any amendment to this Form 10-K.
Indicate by check mark whether the registrant is a large accelerated filer, an accelerated filer, a non-accelerated filer, or a smaller reporting company. See the definitions of “large accelerated filer,” “accelerated filer” and “smaller reporting company” in Rule 12b-2 of the Exchange Act.
Large accelerated filer Accelerated filer
Non-accelerated filer Smaller reporting company
Indicate by check mark whether the registrant is a shell company (as defined in Rule 12b-2 of the Act). Yes No The aggregate market value of the voting common stock held by non-affiliates of the registrant as of June 30, 2013 was $465,841,482The number of shares outstanding of each of the registrant’s classes of stock as of February 14, 2014: Common Stock, without par value — 24,274,210 shares
DOCUMENTS INCORPORATED BY REFERENCE
Portions of the 2014 Proxy Statement for the 2014 annual meeting of shareholders to be held April 24, 2014, are incorporated by reference into Part III.
2 SRCE 2013 Form 10-K
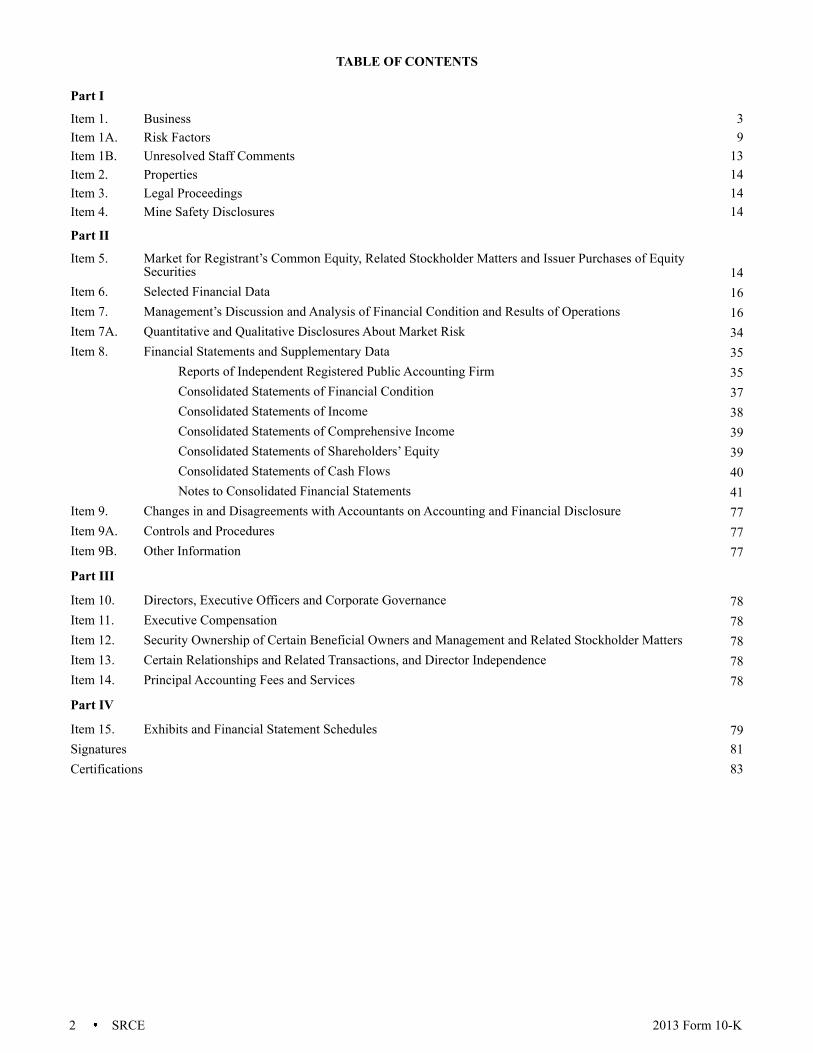
TABLE OF CONTENTS
Certifications 83
Part I
Item 1. Business 3Item 1A. Risk Factors 9Item 1B. Unresolved Staff Comments 13Item 2. Properties 14Item 3. Legal Proceedings 14Item 4. Mine Safety Disclosures 14
Part II
Item 5. Market for Registrant’s Common Equity, Related Stockholder Matters and Issuer Purchases of Equity Securities 14
Item 6. Selected Financial Data 16Item 7. Management’s Discussion and Analysis of Financial Condition and Results of Operations 16Item 7A. Quantitative and Qualitative Disclosures About Market Risk 34Item 8. Financial Statements and Supplementary Data 35
Reports of Independent Registered Public Accounting Firm 35Consolidated Statements of Financial Condition 37Consolidated Statements of Income 38Consolidated Statements of Comprehensive Income 39Consolidated Statements of Shareholders’ Equity 39Consolidated Statements of Cash Flows 40Notes to Consolidated Financial Statements 41
Item 9. Changes in and Disagreements with Accountants on Accounting and Financial Disclosure 77Item 9A. Controls and Procedures 77Item 9B. Other Information 77
Part III
Item 10. Directors, Executive Officers and Corporate Governance 78Item 11. Executive Compensation 78Item 12. Security Ownership of Certain Beneficial Owners and Management and Related Stockholder Matters 78Item 13. Certain Relationships and Related Transactions, and Director Independence 78Item 14. Principal Accounting Fees and Services 78
Part IV
Item 15. Exhibits and Financial Statement Schedules 79Signatures 81

3 SRCE 2013 Form 10-K
Part I
Item 1. Business.1ST SOURCE CORPORATION
1st Source Corporation, an Indiana corporation incorporated in 1971, is a bank holding company headquartered in South Bend, Indiana that provides, through its subsidiaries (collectively referred to as “1st Source,” “we,” and “our”), a broad array of financial products and services. 1st Source Bank (“Bank”), its banking subsidiary, offers commercial and consumer banking services, trust and investment management services, and insurance to individual and business clients through most of our 77 banking center locations in 17 counties in Indiana and Michigan. 1st Source Bank’s Specialty Finance Group, with 22 locations nationwide, offers specialized financing services for new and used private and cargo aircraft, automobiles and light trucks for leasing and rental agencies, medium and heavy duty trucks, construction and environmental equipment. While our lending portfolio is concentrated in certain equipment types, we serve a diverse client base. We are not dependent upon any single industry or client. At December 31, 2013, we had consolidated total assets of $4.72 billion, loans and leases of $3.55 billion, deposits of $3.65 billion, and total shareholders’ equity of $585.38 million.
Our principal executive office is located at 100 North Michigan Street, South Bend, Indiana 46601 and our telephone number is 574 235-2000. Access to our annual report on Form 10-K, quarterly reports on Form 10-Q, current reports on Form 8-K, and all amendments to those reports is available, free of charge, at www.1stsource.com soon after the material is electronically filed with the Securities and Exchange Commission (SEC).
1ST SOURCE BANK
1st Source Bank is a wholly owned subsidiary of 1st Source Corporation that offers a broad range of consumer and commercial banking services through its lending operations, retail branches, and fee based businesses.
Commercial, Agricultural, and Real Estate Loans — 1st Source Bank provides commercial, small business, agricultural, and real estate loans to primarily privately owned business clients mainly located within our regional market area. Loans are made for a wide variety of general corporate purposes, including financing for industrial and commercial properties, financing for equipment, inventories and accounts receivable, and acquisition financing. Other services include commercial leasing, cash management services and retirement planning services.
Consumer Services — 1st Source Bank provides a full range of consumer banking products and services through our banking centers and at 1stsource.com. In a number of our markets 1st Source also offers insurance products through 1st Source Insurance offices. The traditional banking services include checking and savings accounts, certificates of deposits and Individual Retirement Accounts. 1st Source offers a full line of on-line and mobile banking products which includes bill payment. As an added convenience, a strategically located Automated Teller Machine network serves our customers and supports the debit and credit card programs of the bank. Consumers also have the ability to obtain consumer loans, real estate loans and lines of credit in any of our banking centers or on-line. Finally, 1st Source offers a variety of financial planning, financial literacy and other consultative services to our customers.
Trust Services — 1st Source Bank provides a wide range of trust, investment, agency, and custodial services for individual, corporate, and not-for-profit clients. These services include the administration of estates and personal trusts, as well as the management of investment accounts for individuals, employee benefit plans, and charitable foundations.
Specialty Finance Group Services — 1st Source Bank, through its Specialty Finance Group, provides a broad range of comprehensive equipment loan and lease finance products addressing the financing needs of a broad array of companies. This group can be broken down into four areas: auto and light trucks; medium and heavy duty trucks; new and used aircraft; and construction and environmental equipment.
The auto and light truck division consists of financings to automobile rental and leasing companies, light truck rental and leasing companies, and special purpose vehicles. The auto and light truck finance receivables generally range from $100,000 to $20 million with fixed or variable interest rates and terms of one to five years.
The medium and heavy duty truck division provides financing for highway tractors and trailers and delivery trucks to the commercial trucking industry. Medium and heavy duty truck finance receivables generally range from $500,000 to $15 million with fixed or variable interest rates and terms of three to seven years.
Aircraft financing consists of financings for new and used general aviation aircraft (including helicopters) for private and corporate aircraft users, aircraft distributors and dealers, air charter operators, air cargo carriers, and other aircraft operators. We have for many years selectively entered the international aircraft markets, primarily Brazil and Mexico, on a limited basis where desirable aircraft financing opportunities exist for private and corporate aircraft users. Aircraft finance receivables generally range from $500,000 to $15 million with fixed or variable interest rates and terms of one to ten years.

4 SRCE 2013 Form 10-K
Construction and environmental equipment financing includes financing of equipment (i.e., asphalt and concrete plants, bulldozers, excavators, cranes, loaders, and trash and recycling equipment, etc.) to the construction industry. Construction and environmental equipment finance receivables generally range from $50,000 to $20 million with fixed or variable interest rates and terms of one to five years.
We also generate equipment rental income through the leasing of construction equipment, medium and heavy duty trucks, automobiles, and other equipment to clients through operating leases.
SPECIALTY FINANCE GROUP SUBSIDIARIES
The Specialty Finance Group also consists of separate wholly owned subsidiaries of 1st Source Bank which include: Michigan Transportation Finance Corporation; 1st Source Specialty Finance, Inc.; SFG Aircraft, Inc.; 1st Source Intermediate Holding, LLC; SFG Commercial Aircraft Leasing, Inc.; and SFG Equipment Leasing Corporation I.
1ST SOURCE INSURANCE, INC.
1st Source Insurance, Inc. is a wholly owned subsidiary of 1st Source Bank that provides insurance products and services to individuals and businesses covering corporate and personal property, casualty insurance, and individual and group health and life insurance. 1st Source Insurance, Inc. has eight offices.
1ST SOURCE CORPORATION INVESTMENT ADVISORS, INC.
1st Source Corporation Investment Advisors, Inc. (Investment Advisors) is a wholly owned subsidiary of 1st Source Bank that provides investment advisory services to trust and investment clients of 1st Source Bank and to Wasatch Advisors, Inc., the investment advisor of the Wasatch Mutual Fund family. Investment Advisors is registered as an investment advisor with the Securities and Exchange Commission under the Investment Advisors Act of 1940. Investment Advisors serves strictly in an advisory capacity and, as such, does not hold any client securities.
OTHER CONSOLIDATED SUBSIDIARIES
We have other subsidiaries that are not significant to the consolidated entity.
1ST SOURCE MASTER TRUST
Our unconsolidated subsidiary includes 1st Source Master Trust. This subsidiary was created for the purpose of issuing $57.00 million of trust preferred securities and lending the proceeds to 1st Source. We guarantee, on a limited basis, payments of distributions on the trust preferred securities and payments on redemption of the trust preferred securities.
COMPETITION
The activities in which we and the Bank engage in are highly competitive. Our businesses and the geographic markets we serve require us to compete with other banks, some of which are affiliated with large bank holding companies headquartered outside of our principal market. We generally compete on the basis of client service and responsiveness to client needs, available loan and deposit products, the rates of interest charged on loans and leases, the rates of interest paid for funds, other credit and service charges, the quality of services rendered, the convenience of banking facilities, and in the case of loans and leases to large commercial borrowers, relative lending limits.
In addition to competing with other banks within our primary service areas, the Bank also competes with other financial service companies, such as credit unions, industrial loan associations, securities firms, insurance companies, small loan companies, finance companies, mortgage companies, real estate investment trusts, certain governmental agencies, credit organizations, and other enterprises.
Additional competition for depositors’ funds comes from United States Government securities, private issuers of debt obligations, and suppliers of other investment alternatives for depositors. Many of our non-bank competitors are not subject to the same extensive Federal and State regulations that govern bank holding companies and banks. Such non-bank competitors may, as a result, have certain advantages over us in providing some services.
We compete against these financial institutions by being convenient to do business with, and by taking the time to listen and understand our clients’ needs. We deliver personalized, one-on-one banking through knowledgeable local members of the community always keeping the client's best interest in mind while offering a full array of products and highly personalized services. We rely on our history and our reputation in northern Indiana dating back to 1863.
EMPLOYEES
At December 31, 2013, we had approximately 1,100 employees on a full-time equivalent basis. We provide a wide range of employee benefits and consider employee relations to be good.
5 SRCE 2013 Form 10-K
REGULATION AND SUPERVISION
General — 1st Source and the Bank are extensively regulated under Federal and State law. To the extent that the following information describes statutory or regulatory provisions, it is qualified in its entirety by reference to the particular statutory and regulatory provisions. Any change in applicable laws or regulations may have a material effect on our business and our prospective business. Our operations may be affected by legislative changes and by the policies of various regulatory authorities. We are unable to predict the nature or the extent of the effects on our business and earnings that fiscal or monetary policies, economic controls, or new Federal or State legislation may have in the future.
We are a registered bank holding company under the Bank Holding Company Act of 1956 (BHCA) and, as such, we are subject to regulation, supervision, and examination by the Board of Governors of the Federal Reserve System (Federal Reserve). We are required to file annual reports with the Federal Reserve and to provide the Federal Reserve such additional information as it may require.
1st Source Bank, as an Indiana state bank and member of the Federal Reserve System, is supervised by the Indiana Department of Financial Institutions (DFI) and the Federal Reserve. As such, 1st Source Bank is regularly examined by and subject to regulations promulgated by the DFI and the Federal Reserve. Because the Federal Deposit Insurance Corporation (FDIC) provides deposit insurance to 1st Source Bank, we are also subject to supervision and regulation by the FDIC (even though the FDIC is not our primary Federal regulator).
Bank Holding Company Act — Under the BHCA, as amended, our activities are limited to business so closely related to banking, managing, or controlling banks as to be a proper incident thereto. We are also subject to capital requirements applied on a consolidated basis in a form substantially similar to those required of the Bank. The BHCA also requires a bank holding company to obtain approval from the Federal Reserve before (i) acquiring, or holding more than 5% voting interest in any bank or bank holding company, (ii) acquiring all or substantially all of the assets of another bank or bank holding company, or (iii) merging or consolidating with another bank holding company.
The BHCA also restricts non-bank activities to those which, by statute or by Federal Reserve regulation or order, have been identified as activities closely related to the business of banking or of managing or controlling banks. As discussed below, the Gramm-Leach-Bliley Act (GLBA), which was enacted in 1999, established a new type of bank holding company known as a “financial holding company” that has powers that are not otherwise available to bank holding companies.
The Federal Deposit Insurance Corporation Improvement Act of 1991 — The Federal Deposit Insurance Corporation Improvement Act of 1991 (FDICIA) was adopted to supervise and regulate a wide variety of banking issues. In general, FDICIA provided for the recapitalization of the former Bank Insurance Fund, deposit insurance reform, including the implementation of risk-based deposit insurance premiums, the establishment of five capital levels for financial institutions (“well capitalized,” “adequately capitalized,” “undercapitalized,” “significantly undercapitalized,” and “critically undercapitalized”) that would impose more scrutiny and restrictions on less capitalized institutions, along with a number of other supervisory and regulatory issues. At December 31, 2013, the Bank was categorized as “well capitalized,” meaning that our total risk-based capital ratio exceeded 10.00%, our Tier 1 risk-based capital ratio exceeded 6.00%, our leverage ratio exceeded 5.00%, and we are not subject to a regulatory order, agreement, or directive to meet and maintain a specific capital level for any capital measure.
Federal Deposit Insurance Reform Act — On February 1, 2006, Congress approved the Federal Deposit Insurance Reform Act of 2005 (FDIRA). Among other things, the FDIRA provides for the merger of the Bank Insurance Fund with the Savings Association Insurance Fund and for an immediate increase in Federal deposit insurance for certain retirement accounts up to $250,000. The statute further provides for the indexing of the maximum deposit insurance coverage for all types of deposit accounts in the future to account for inflation. The FDIRA also requires the FDIC to provide certain banks and thrifts that were in existence prior to December 31, 1996 with one-time credits against future premiums based on the amount of their payments to the Bank Insurance Fund or Savings Association Insurance Fund prior to that date.
FDIC Deposit Insurance Assessments —The Dodd-Frank Wall Street Reform and Consumer Protection Act (Dodd-Frank Act), which was signed into law on July 21, 2010, changes how the FDIC will calculate future deposit insurance premiums payable by insured depository institutions. The Dodd-Frank Act directs the FDIC to amend its assessment regulations so that future assessments will generally be based upon a depository institution’s average total consolidated assets minus the average tangible equity of the insured depository institution during the assessment period, whereas assessments were previously based on the amount of an institution’s insured deposits. The minimum deposit insurance fund rate will increase from 1.15% to 1.35% by September 30, 2020, and the cost of the increase will be borne by depository institutions with assets of $10 billion or more.
The Dodd-Frank Act also provides the FDIC with discretion to determine whether to pay rebates to insured depository institutions when its deposit insurance reserves exceed certain thresholds. Previously, the FDIC was required to give rebates to depository institutions equal to the excess once the reserve ratio exceeded 1.50%, and was required to rebate 50% of the excess over 1.35% but not more than 1.5% of insured deposits. The FDIC adopted a final rule on February 7, 2011 that implements these provisions of the Dodd-Frank Act.
6 SRCE 2013 Form 10-K
Emergency Economic Stabilization Act of 2008 — On October 3, 2008, President George W. Bush signed the Emergency Economic Stabilization Act of 2008 (EESA). This Act temporarily increased the standard maximum deposit insurance amount from $100,000 to $250,000 effective immediately. This temporary increase in the scope of deposit insurance coverage was originally set to expire on December 31, 2013, but the Dodd-Frank Act made this temporary increase permanent. Under the Troubled Asset Relief Program established by EESA, the U.S. Treasury Department (Treasury) announced a Capital Purchase Program (CPP). CPP was designed to encourage U.S. financial institutions to build capital to increase the flow of financing to U.S. businesses and consumers and support the U.S. economy. Under the program, Treasury could purchase up to $250 billion of senior preferred shares on standardized terms as described in the program’s term sheet. The program was available to qualifying U.S. controlled banks, savings associations, and certain bank and savings and loan holding companies engaged only in financial activities that submitted applications to Treasury by November 14, 2008. EESA provided for Treasury to determine an applicant’s eligibility to participate in the CPP after consulting with the appropriate federal banking agency.
1st Source submitted an application to participate in the CPP and obtained Treasury approval on December 11, 2008. On January 23, 2009, 1st Source issued preferred stock valued at $111.00 million and a warrant to acquire 837,947 shares of its common stock to Treasury pursuant to the CPP. The warrant was exercisable at any time during the ten-year period following issuance at an exercise price of $19.87 per share. On December 29, 2010, 1st Source redeemed all of the preferred stock issued to the Treasury under CPP for $111.68 million, which included accrued and unpaid dividends payable to Treasury on the preferred stock. On March 8, 2011, 1st Source repurchased the common stock warrant for $3.75 million.
Securities and Exchange Commission (SEC) and The NASDAQ Stock Market (NASDAQ) — We are under the jurisdiction of the SEC and certain state securities commissions for matters relating to the offering and sale of our securities and our investment advisory services. We are subject to the disclosure and regulatory requirements of the Securities Act of 1933, as amended, and the Securities Exchange Act of 1934, as amended, as administered by the SEC. We are listed on the NASDAQ Global Select Market under the trading symbol “SRCE,” and we are subject to the rules of Nasdaq for listed companies.
Interstate Branching — Congress enacted the Riegle-Neal Interstate Banking and Branching Efficiency Act of 1994 (Interstate Act) to allow bank holding companies to expand, by acquiring existing banks, into all states, even those which had theretofore restricted entry. The legislation also authorized a bank to open de novo branches in other states, but only to the extent that the law of the bank’s home state, as well as the law of the state where the branch was to be located, permitted an out-of-state bank to open a de novo branch. The Interstate Act also authorized, subject to future action by individual states, a bank holding company to convert its subsidiary banks located in different states under a single charter.
The Dodd-Frank Act amended the Interstate Act by expanding the authority of a state or national bank to open offices in other states. A state or national bank may now open a de novo branch in another state if the law of the state where the branch is to be located would permit a state bank chartered by that state to open the branch. This amendment repealed the restriction under the Interstate Act that permitted an out-of-state bank to open a de novo branch in another state only if the bank’s home state and the state where the branch was to be located had each enacted reciprocal de novo interstate branching laws.
Gramm-Leach-Bliley Act of 1999 — The GLBA is intended to modernize the banking industry by removing barriers to affiliation among banks, insurance companies, the securities industry, and other financial service providers. It provides financial organizations with the flexibility of structuring such affiliations through a holding company structure or through a financial subsidiary of a bank, subject to certain limitations. The GLBA establishes a new type of bank holding company, known as a financial holding company, which may engage in an expanded list of activities that are “financial in nature,” which include securities and insurance brokerage, securities underwriting, insurance underwriting, and merchant banking. The GLBA also sets forth a system of functional regulation that makes the Federal Reserve the “umbrella supervisor” for holding companies, while providing for the supervision of the holding company’s subsidiaries by other Federal and state agencies. A bank holding company may not become a financial holding company if any of its subsidiary financial institutions are not well-capitalized or well-managed. Further, each bank subsidiary of the holding company must have received at least a satisfactory Community Reinvestment Act (CRA) rating. The GLBA also expands the types of financial activities a national bank may conduct through a financial subsidiary, addresses state regulation of insurance, generally prohibits unitary thrift holding companies organized after May 4, 1999 from participating in new activities that are not financial in nature, provides privacy protection for nonpublic customer information of financial institutions, modernizes the Federal Home Loan Bank system, and makes miscellaneous regulatory improvements. The Federal Reserve and the Secretary of the Treasury must coordinate their supervision regarding approval of new financial activities to be conducted through a financial holding company or through a financial subsidiary of a bank. While the provisions of the GLBA regarding activities that may be conducted through a financial subsidiary directly apply only to national banks, those provisions indirectly apply to state-chartered banks. In addition, the Bank is subject to other provisions of the GLBA, including those relating to CRA and privacy, regardless of whether we elect to become a financial holding company or to conduct activities through a financial subsidiary. We do not currently intend to file notice with the Board to become a financial holding company or to engage in expanded financial activities through a financial subsidiary.
7 SRCE 2013 Form 10-K
Financial Privacy — In accordance with the GLBA, Federal banking regulators adopted rules that limit the ability of banks and other financial institutions to disclose non-public information about customers to nonaffiliated third parties. These limitations require disclosure of privacy policies to consumers and, in some circumstances, allow consumers to prevent disclosure of certain personal information to a nonaffiliated third party. The privacy provisions of the GLBA affect how consumer information is transmitted through diversified financial companies and conveyed to outside vendors. We are also subject to various state laws that generally require us to notify any customer whose personal financial information may have been released to an unauthorized person as the result of a breach of our data security policies and procedures.
USA Patriot Act of 2001 — The USA Patriot Act of 2001 (USA Patriot Act) was signed into law following the terrorist attacks of September 11, 2001. The USA Patriot Act is comprehensive anti-terrorism legislation that, among other things, substantially broadened the scope of anti-money laundering laws and regulations by imposing significant new compliance and due diligence obligations on financial institutions.
The regulations adopted by the Treasury under the USA Patriot Act require financial institutions to maintain appropriate policies, procedures and controls to detect, prevent and report money laundering, and terrorist financing. Additionally, the regulations require that we, upon request from the appropriate Federal regulatory agency, provide records related to anti-money laundering, perform due diligence of private banking and correspondent accounts, establish standards for verifying customer identity, and perform other related duties.
Failure of a financial institution to comply with the USA Patriot Act’s requirements could have serious legal and reputational consequences for the institution.
Regulations Governing Capital Adequacy — The Federal bank regulatory agencies use capital adequacy guidelines in their examination and regulation of bank holding companies and banks. If capital falls below the minimum levels established by these guidelines, a bank holding company or bank will be required to submit an acceptable plan for achieving compliance with the capital guidelines and will be subject to denial of applications and appropriate supervisory enforcement actions. The various regulatory capital requirements that we are subject to are disclosed in Part II, Item 8, Financial Statements and Supplementary Data — Note 20 of the Notes to Consolidated Financial Statements.
Community Reinvestment Act — The Community Reinvestment Act of 1977 requires that, in connection with examinations of financial institutions within their jurisdiction, the Federal banking regulators must evaluate the record of the financial institutions in meeting the credit needs of their local communities, including low and moderate income neighborhoods, consistent with the safe and sound operation of those banks. Federal banking regulators are required to consider a financial institution’s performance in these areas as they review applications filed by the institution to engage in mergers or acquisitions or to open a branch or facility.
Regulations Governing Extensions of Credit — 1st Source Bank is subject to certain restrictions imposed by the Federal Reserve Act on extensions of credit to 1st Source or our subsidiaries, or investments in our securities and on the use of our securities as collateral for loans to any borrowers. These regulations and restrictions may limit our ability to obtain funds from the Bank for our cash needs, including funds for acquisitions and for payment of dividends, interest and operating expenses. Further, the BHCA, certain regulations of the Federal Reserve, state laws and many other Federal laws govern the extensions of credit and generally prohibit a bank from extending credit, engaging in a lease or sale of property, or furnishing services to a customer on the condition that the customer obtain additional services from the bank’s holding company or from one of its subsidiaries.
1st Source Bank is also subject to certain restrictions imposed by the Federal Reserve Act on extensions of credit to executive officers, directors, principal shareholders, or any related interest of such persons. Extensions of credit (i) must be made on substantially the same terms, including interest rates and collateral, and subject to credit underwriting procedures that are at least as stringent as those prevailing at the time for comparable transactions with non affiliates, and (ii) must not involve more than the normal risk of repayment or present other unfavorable features. The Bank is also subject to certain lending limits and restrictions on overdrafts to such persons.
Reserve Requirements — The Federal Reserve requires all depository institutions to maintain reserves against their transaction account deposits. The Bank must maintain reserves of 3.00% against net transaction accounts greater than $13.30 million and up to $89.00 million (subject to adjustment by the Federal Reserve) and reserves of 10.00% must be maintained against that portion of net transaction accounts in excess of $89.00 million. These amounts are indexed to inflation and adjusted annually by the Federal Reserve.
Dividends — The ability of the Bank to pay dividends is limited by state and Federal laws and regulations that require 1st Source Bank to obtain the prior approval of the DFI and the Federal Reserve Bank of Chicago before paying a dividend that, together with other dividends it has paid during a calendar year, would exceed the sum of its net income for the year to date combined with its retained net income for the previous two years. The amount of dividends the Bank may pay may also be limited by certain covenant agreements and by the principles of prudent bank management. See Part II, Item 5, Market for Registrant’s Common Equity, Related Stockholder Matters and Issuer Purchases of Equity Securities for further discussion of dividend limitations.
8 SRCE 2013 Form 10-K
Monetary Policy and Economic Control — The commercial banking business in which we engage is affected not only by general economic conditions, but also by the monetary policies of the Federal Reserve. Changes in the discount rate on member bank borrowing, availability of borrowing at the “discount window,” open market operations, the imposition of changes in reserve requirements against member banks’ deposits and assets of foreign branches, and the imposition of, and changes in, reserve requirements against certain borrowings by banks and their affiliates are some of the instruments of monetary policy available to the Federal Reserve. These monetary policies are used in varying combinations to influence overall growth and distributions of bank loans, investments, and deposits, and such use may affect interest rates charged on loans and leases or paid on deposits. The monetary policies of the Federal Reserve have had a significant effect on the operating results of commercial banks and are expected to do so in the future. The monetary policies of the Federal Reserve are influenced by various factors, including economic growth, inflation, unemployment, short-term and long-term changes in the international trade balance, and in the fiscal policies of the U.S. Government. Future monetary policies and the effect of such policies on our future business and earnings, and the effect on the future business and earnings of the Bank cannot be predicted.
Sarbanes-Oxley Act of 2002 — The Sarbanes-Oxley Act of 2002 (SOA) includes provisions intended to enhance corporate responsibility and protect investors by improving the accuracy and reliability of corporate disclosures pursuant to the securities laws, and which increase penalties for accounting and auditing improprieties at publicly traded companies. The SOA generally applies to all companies that file or are required to file periodic reports with the SEC under the Exchange Act.
Among other things, the SOA creates the Public Company Accounting Oversight Board as an independent body subject to SEC supervision with responsibility for setting auditing, quality control, and ethical standards for auditors of public companies. The SOA also requires public companies to make faster and more-extensive financial disclosures, requires the chief executive officer and the chief financial officer of public companies to provide signed certifications as to the accuracy and completeness of financial information filed with the SEC, and provides enhanced criminal and civil penalties for violations of the Federal securities laws.
The SOA also addresses functions and responsibilities of audit committees of public companies. The statute, by mandating certain stock exchange listing rules, makes the audit committee directly responsible for the appointment, compensation, and oversight of the work of the company’s outside auditor, and requires the auditor to report directly to the audit committee. The SOA authorizes each audit committee to engage independent counsel and other advisors, and requires a public company to provide the appropriate funding, as determined by its audit committee, to pay the company’s auditors and any advisors that its audit committee retains. The SOA also requires public companies to prepare an internal control report and assessment by management, along with an attestation to this report prepared by the company’s independent registered public accounting firm, in their annual reports to stockholders.
Secure and Fair Enforcement for Mortgage Licensing Act — The Secure and Fair Enforcement for Mortgage Licensing Act of 2008 (S.A.F.E. Act) establishes a nationwide licensing and registration system for mortgage loan originators. The S.A.F.E. Act requires an employee of a bank, savings association or credit union and certain of their subsidiaries that are regulated by a federal banking agency (agency-regulated institutions) who acts as a residential mortgage loan originator to register with the Nationwide Mortgage Licensing System and Registry (NMLS), obtain a unique identifier, and maintain this registration.
The federal banking agencies adopted a final rule that was published on August 23, 2010 to implement these provisions. The final rule requires, among other things, that a loan originator submit to the NMLS certain information concerning his or her personal history and experience, undergo an FBI criminal background check, and authorize the NMLS to obtain information related to any administrative, civil, or criminal findings by any governmental agency regarding the loan originator.
Dodd-Frank Wall Street Reform and Consumer Protection Act — On July 21, 2010, President Obama signed into law the Dodd-Frank Act, which significantly changes the regulation of financial institutions and the financial services industry. The Dodd-Frank Act includes provisions affecting large and small financial institutions alike, including several provisions that will profoundly affect how community banks, thrifts, and small bank and thrift holding companies will be regulated in the future. Among other things, these provisions abolish the Office of Thrift Supervision and transfer its functions to the other federal banking agencies, relax rules regarding interstate branching, allow financial institutions to pay interest on business checking accounts, and impose new capital requirements on bank and thrift holding companies. The Dodd-Frank Act also includes several corporate governance provisions that apply to all public companies, not just financial institutions. These include provisions mandating certain disclosures regarding executive compensation and provisions addressing proxy access by shareholders.
The Dodd-Frank Act also makes permanent the temporary increase in deposit insurance coverage from $100,000 to $250,000 that was included in the EESA, and extended until December 31, 2012 the period during which the FDIC provided unlimited deposit insurance for “noninterest-bearing transaction accounts.” After that date, deposit insurance coverage of non-interest bearing transaction accounts at an insured depository institution is subject to the same restrictions that apply to other deposit accounts at the institution.

9 SRCE 2013 Form 10-K
The Dodd-Frank Act also establishes the Consumer Financial Protection Bureau (CFPB) as an independent entity within the Federal Reserve. Effective July 10, 2011, the CFPB assumed primary responsibility for administering substantially all of the consumer compliance regulations, including Regulation Z issued under the Truth in Lending Act and Regulation X issued under the Real Estate Settlement Procedures Act, formerly administered by other federal agencies. The CFPB also has the authority to promulgate consumer protection regulations that will apply to all entities, including banks, that offer consumer financial services or products. Additionally, the Dodd-Frank Act includes a series of provisions covering mortgage loan origination standards affecting, among other things, originator compensation, minimum repayment standards, and pre-payment penalties. The Dodd-Frank Act contains numerous other provisions affecting financial institutions of all types, many of which may have an impact on our operating environment in substantial and unpredictable ways.
Because many of the regulations required to implement the Dodd-Frank Act have not yet been issued, the statute’s effect on the financial services industry in general, and on us in particular, is uncertain at this time. The Dodd-Frank Act is likely to affect our cost of doing business, however, and may limit or expand the scope of our permissible activities and affect the competitive balance within our industry and market areas. Our management continues to monitor the implementation of the Dodd-Frank Act and as new regulations are issued, will assess their effect on our business, financial condition, and results of operations.
Capital Standards — In July 2013, the Federal Reserve and other federal banking agencies approved final rules implementing the Basel Committee on Banking Supervision's capital guidelines for all U.S. banks and for bank holding companies with greater than $500 million in assets. Under these final rules, minimum requirements will increase for both the quantity and quality of capital held by 1st Source and the Bank. The rules include a new common equity Tier 1 capital ratio of 4.5%, a minimum Tier 1 capital ratio of 6.0%, a total capital ratio of 8.0%, and a minimum leverage ratio of 4.0%. The final rules also require a common equity Tier 1 capital conservation buffer of 2.5% of risk-weighted assets which is in addition to the other minimum risk-based capital standards in the rule. Institutions that do not maintain the required capital buffer will become subject to progressively more stringent limitations on the percentage of earnings that can be paid out in dividends or used for stock repurchases and on the payment of discretionary bonuses to senior executive management. The capital buffer requirement will be phased in over three years beginning in 2016. The capital buffer requirement effectively raises the minimum required common equity Tier 1 capital ratio to 7.0%, the Tier 1 capital ratio to 8.5%, and the total capital ratio to 10.5% on a fully phased-in basis.
The final rules also increase the required capital for certain categories of assets, including higher-risk construction real estate loans and certain exposures related to securitizations. The final rules do not, however, adopt the changes in the proposed rule to the risk weights assigned to certain mortgage loan assets. The final rules instead adopt the risk weights for residential mortgages under the existing general risk-based capital rules, which assign a risk weight of either 50% (for most first-lien exposures) or 100% for other residential mortgage exposures. Similarly, the final rules do not adopt the proposed rule's elimination of Tier 1 treatment of trust preferred securities for banking organizations with less than $15 billion in assets as of December 31, 2010. Instead, the final rules permit these banking organizations to retain non-qualifying Tier 1 capital trust preferred securities issued prior to May 19, 2010.
These new minimum capital ratios will become effective for us on January 1, 2015 and will be fully phased-in on January 1, 2019. Management believes that, as of December 31, 2013, 1st Source and 1st Source Bank would met all capital adequacy requirements under the Basel III Capital Rules on a fully phased-in basis as if such requirements were currently in effect.
Pending Legislation — Because of concerns relating to competitiveness and the safety and soundness of the banking industry, Congress often considers a number of wide-ranging proposals for altering the structure, regulation, and competitive relationships of the nation’s financial institutions. We cannot predict whether or in what form any proposals will be adopted or the extent to which our business may be affected.
Item 1A. Risk Factors.
An investment in our common stock is subject to risks inherent to our business. The material risks and uncertainties that we believe affect us are described below. See “Forward Looking Statements” under Item 7 of this report for a discussion of other important factors that can affect our business.
Credit Risks
We are subject to credit risks relating to our loan and lease portfolios — We have certain lending policies and procedures in place that are designed to optimize loan and lease income within an acceptable level of risk. Our management reviews and approves these policies and procedures on a regular basis. A reporting system supplements the review process by providing our management with frequent reports related to loan and lease production, loan quality, concentrations of credit, loan and lease delinquencies, and nonperforming and potential problem loans and leases. Diversification in the loan and lease portfolios is a means of managing risk associated with fluctuations and economic conditions.
We maintain an independent loan review department that reviews and validates the credit risk program on a periodic basis. Results of these reviews are presented to our management. The loan and lease review process complements and reinforces the risk identification and assessment decisions made by lenders and credit personnel, as well as our policies and procedures.
10 SRCE 2013 Form 10-K
Commercial and commercial real estate loans generally involve higher credit risks than residential real estate and consumer loans. Because payments on loans secured by commercial real estate or equipment are often dependent upon the successful operation and management of the underlying assets, repayment of such loans may be influenced to a great extent by conditions in the market or the economy. We seek to minimize these risks through our underwriting standards. We obtain financial information and perform credit risk analysis on our customers. Credit criteria may include, but are not limited to, assessments of income, cash flows, collateral, and net worth; asset ownership; bank and trade credit references; credit bureau reports; and operational history.
Commercial real estate or equipment loans are underwritten after evaluating and understanding the borrower’s ability to operate profitably and generate positive cash flows. Our management examines current and projected cash flows of the borrower to determine the ability of the borrower to repay their obligations as agreed. Underwriting standards are designed to promote relationship banking rather than transactional banking. Most commercial and industrial loans are secured by the assets being financed or other business assets; however, some loans may be made on an unsecured basis. Our credit policy sets different maximum exposure limits both by business sector and our current and historical relationship and previous experience with each customer.
We offer both fixed-rate and adjustable-rate consumer mortgage loans secured by properties, substantially all of which are located in our primary market area. Adjustable-rate mortgage loans help reduce our exposure to changes in interest rates; however, during periods of rising interest rates, the risk of default on adjustable-rate mortgage loans may increase as a result of repricing and the increased payments required from the borrower. Additionally, some residential mortgages are sold into the secondary market and serviced by our principal banking subsidiary, 1st Source Bank.
Consumer loans are primarily all other non-real estate loans to individuals in our regional market area. Consumer loans can entail risk, particularly in the case of loans that are unsecured or secured by rapidly depreciating assets. In these cases, any repossessed collateral may not provide an adequate source of repayment of the outstanding loan balance. The remaining deficiency often does not warrant further substantial collection efforts against the borrower beyond obtaining a deficiency judgment. In addition, consumer loan collections are dependent on the borrower’s continuing financial stability, and thus are more likely to be adversely affected by job loss, divorce, illness, or personal bankruptcy.
The 1st Source Specialty Finance Group loan and lease portfolio consists of commercial loans and leases secured by construction and transportation equipment, including aircraft, autos, trucks, and vans. Finance receivables for this Group generally provide for monthly payments and may include prepayment penalty provisions.
Our construction and transportation related businesses could be adversely affected by slowdowns in the economy. Clients who rely on the use of assets financed through the Specialty Finance Group to produce income could be negatively affected, and we could experience substantial loan and lease losses. By the nature of the businesses these clients operate in, we could be adversely affected by rapid increases of fuel costs. Since some of the relationships in these industries are large, a slowdown could have a significant adverse impact on our performance.
Our construction and transportation related businesses could be adversely impacted by the negative effects caused by high fuel costs, terrorist and other potential attacks, and other destabilizing events. These factors could contribute to the deterioration of the quality of our loan and lease portfolio, as they could have a negative impact on the travel and transportation sensitive businesses for which our specialty finance businesses provide financing.
In addition, our leasing and equipment financing activity is subject to the risk of cyclical downturns, industry concentration and clumping, and other adverse economic developments affecting these industries and markets. This area of lending, with transportation in particular, is dependent upon general economic conditions and the strength of the travel, construction, and transportation industries.
Our reserve for loan and lease losses may prove to be insufficient to absorb probable losses in our loan and lease portfolio — In the financial services industry, there is always a risk that certain borrowers may not repay borrowings. The determination of the appropriate level of the reserve for loan and lease losses inherently involves a high degree of subjectivity and requires us to make significant estimates of current credit risks and future trends, all of which may undergo material changes. Our reserve for loan and lease losses may not be sufficient to cover the loan and lease losses that we may actually incur. If we experience defaults by borrowers in any of our businesses, our earnings could be negatively affected. Changes in local economic conditions could adversely affect credit quality, particularly in our local business loan and lease portfolio. Changes in national or international economic conditions could also adversely affect the quality of our loan and lease portfolio and negate, to some extent, the benefits of national or international diversification through our Specialty Finance Group’s portfolio. In addition, bank regulatory agencies periodically review our reserve for loan and lease losses and may require an increase in the provision for loan and lease losses or the recognition of further loan or lease charge-offs based upon their judgments, which may be different from ours.
11 SRCE 2013 Form 10-K
The soundness of other financial institutions could adversely affect us — Financial services institutions are interrelated as a result of trading, clearing, counterparty, or other relationships. We have exposure to many different industries and counterparties, and we routinely execute transactions with counterparties in the financial services industry, including commercial banks, brokers and dealers, investment banks, and other institutional clients. Many of these transactions expose us to credit risk in the event of a default by our counterparty or client. In addition, our credit risk may be exacerbated when the collateral held by us cannot be realized or is liquidated at prices not sufficient to recover the full amount of the credit or derivative exposure due us. Any such losses could have a material adverse effect on our financial condition and results of operations.
Certain investments could have a negative impact — As a result of recent economic conditions, some municipalities are struggling to meet financial obligations. We have investment securities which are subject to credit risk if the issuers are unable to meet their obligations to us. Although we believe the issuers will be able to meet their obligations, there can be no certainty regarding future results. In addition, we face further credit analysis requirements as a result of the Dodd-Frank Act and rules promulgated by the Federal Reserve.
Our liability for residential mortgage loan repurchases could be insufficient — The agreements under which we sell residential mortgage loans in the secondary market contain various representations and warranties regarding the acceptability of loans for purchase. On occasion, we may be asked to indemnify the loan purchaser for credit losses on loans that were later deemed ineligible for purchase or we may be asked to repurchase the loan. We have established a mortgage loan repurchase liability which represents our best estimate of the losses we may incur. This estimate is based on specific loan repurchase requests and a historical loss ratio with respect to origination dollar volume. Because the level of mortgage loan repurchase losses are dependent on economic factors, investor demand strategies and other external conditions that may change over the life of the underlying loans, the level of liability for mortgage loan repurchase losses is difficult to estimate and requires considerable management judgment. Within the industry, repurchase demands in recent years have increased and while we believe the loans we have underwritten and sold have met or exceeded applicable transaction parameters, we must acknowledge the current trend of mortgage insurance rescissions and speculative repurchase requests. If significant additions to our existing repurchase liability are required, it could have a material adverse impact on our financial condition and results of operations.
Market Risks
Fluctuations or continued stagnation in interest rates could reduce our profitability and affect the value of our assets — Like other financial institutions, we are subject to interest rate risk. Our primary source of income is net interest income, which is the difference between interest earned on loans and leases and investments, and interest paid on deposits and borrowings. We expect that we will periodically experience imbalances in the interest rate sensitivities of our assets and liabilities and the relationships of various interest rates to each other. Over any defined period of time, our interest-earning assets may be more sensitive to changes in market interest rates than our interest-bearing liabilities, or vice-versa. In addition, the individual market interest rates underlying our loan and lease and deposit products may not change to the same degree over a given time period. In any event, if market interest rates should move contrary to our position, earnings may be negatively affected. In addition, loan and lease volume and quality and deposit volume and mix can be affected by market interest rates as can the businesses of our clients. Changes in levels of market interest rates could have a material adverse effect on our net interest spread, asset quality, origination volume, and overall profitability.
Market interest rates are beyond our control, and they fluctuate in response to general economic conditions and the policies of various governmental and regulatory agencies, in particular, the Federal Reserve Board. Changes in monetary policy, including changes in interest rates, may negatively affect our ability to originate loans and leases, the value of our assets and our ability to realize gains from the sale of our assets, all of which ultimately could affect our earnings.
Adverse changes in economic conditions could impair our financial condition and results of operations — We are impacted by general business and economic conditions in the United States and abroad. These conditions include short-term and long-term interest rates, inflation, money supply, political issues, legislative and regulatory changes, fluctuations in both debt and equity capital markets, broad trends in industry and finance, unemployment, and the strength of the U.S. economy and the local economies in which we operate, all of which are beyond our control. A deterioration in economic conditions could result in an increase in loan delinquencies and non-performing assets, decreases in loan collateral values and a decrease in demand for our products and services. Economic turmoil in the European Union represents significant risk to the global economy. Economic collapse of any EU member or similar severe crisis in Europe could adversely impact us and our clients.
12 SRCE 2013 Form 10-K
Liquidity Risks
We could experience an unexpected inability to obtain needed liquidity — Liquidity measures the ability to meet current and future cash flow needs as they become due. The liquidity of a financial institution reflects its ability to meet loan requests, to accommodate possible outflows in deposits, and to take advantage of interest rate market opportunities and is essential to a financial institution’s business. The ability of a financial institution to meet its current financial obligations is a function of its balance sheet structure, its ability to liquidate assets, and its access to alternative sources of funds. We seek to ensure our funding needs are met by maintaining a level of liquidity through asset and liability management. If we become unable to obtain funds when needed, it could have a material adverse effect on our business, financial condition, and results of operations. Additionally, under Indiana law governing the collateralization of public fund deposits, the Indiana Board for Depositories determines which financial institutions are required to pledge collateral based on the strength of their financial ratings. We have been informed that no collateral is required for our public fund deposits. However, the Board of Depositories could alter this requirement in the future and adversely impact our liquidity.
We rely on dividends from our subsidiaries — Our parent company, 1st Source Corporation, receives substantially all of its revenue from dividends from our subsidiaries. These dividends are the principal source of funds to pay dividends on our common stock and interest and principal on our debt. Various federal and/or state laws and regulations limit the amount of dividends that our subsidiaries may pay to our parent company. In the event our subsidiaries are unable to pay dividends to our parent company, we may not be able to service debt, pay obligations or pay dividends on our common stock. The inability to receive dividends from our subsidiaries could have a material adverse effect on our business, financial condition and results of operations.
Operational Risks
We are dependent upon the services of our management team — Our future success and profitability is substantially dependent upon our management and the banking abilities of our senior executives. We believe that our future results will also depend in part upon our ability to attract and retain highly skilled and qualified management. We are especially dependent on a limited number of key management personnel, many of whom do not have employment agreements with us. The loss of the chief executive officer and other senior management and key personnel could have a material adverse impact on our operations because other officers may not have the experience and expertise to readily replace these individuals. Many of these senior officers have primary contact with our clients and are important in maintaining personalized relationships with our client base. The unexpected loss of services of one or more of these key employees could have a material adverse effect on our operations and possibly result in reduced revenues if we were unable to find suitable replacements promptly. Competition for senior personnel is intense, and we may not be successful in attracting and retaining such personnel. Changes in key personnel and their responsibilities may be disruptive to our businesses and could have a material adverse effect on our businesses, financial condition, and results of operations.
Technology security breaches and constant technological change — Information security risks have increased significantly due to the use of online, telephone, and mobile banking channels by clients and the increased sophistication and activities of organized crime, hackers, terrorists and other external parties. Any compromise of our security could deter our clients from using our banking services. We depend on the services of a variety of third party vendors to meet data processing and communication needs. We rely on security systems to provide the security and authentication necessary to effect secure transmission of data against damage by theft, fire, power loss, telecommunications failure or similar catastrophic event, as well as from security breaches, denial of service attacks, viruses, worms, and other disruptive problems caused by hackers. Computer break-ins, phishing and other disruptions of customer or vendor systems could also jeopardize the security of information stored in and transmitted through our computer systems and network infrastructure. We also maintain a cyber insurance policy that is designed to cover loss resulting from cyber security breaches. These precautions may not protect our systems from compromises or breaches of our security measures that could result in damage to our reputation and business.
The financial services industry is constantly undergoing rapid technological change with frequent introductions of new technology-driven products and services. The effective use of technology increases efficiency and enables financial institutions to better service clients and reduce costs. Our future success depends, in part, upon our ability to address the needs of our clients by using technology to provide products and services that will satisfy client demands, as well as create additional efficiencies within our operations. Many of our competitors have substantially greater resources to invest in technological improvements. We may not be able to effectively implement new technology-driven products and services quickly or be successful in marketing these products and services to our clients. Failure to successfully keep pace with technological change affecting the financial services industry could have a material adverse impact on our business and, in turn, our financial condition and results of operations.
13 SRCE 2013 Form 10-K
Our accounting estimates and risk management processes rely on analytical and forecasting models — The processes we use to estimate our probable loan losses and to measure the fair value of financial instruments, as well as the processes used to estimate the effects of changing interest rates and other market measures on our financial condition and results of operations, depends upon the use of analytical and forecasting models. These models reflect assumptions that may not be accurate, particularly in times of market stress or other unforeseen circumstances. Even if these assumptions are adequate, the models may prove to be inadequate or inaccurate because of other flaws in their design or their implementation. If the models we use for interest rate risk and asset-liability management are inadequate, we may incur increased or unexpected losses upon changes in market interest rates or other market measures. If the models we use for determining our probable loan losses are inadequate, the reserve for loan and lease losses may not be sufficient to support future charge-offs. If the models we use to measure the fair value of financial instruments is inadequate, the fair value of such financial instruments may fluctuate unexpectedly or may not accurately reflect what we could realize upon sale or settlement of such financial instruments. Any such failure in our analytical or forecasting models could have a material adverse effect on our business, financial condition and results of operations.
Legal/Compliance Risks
We are subject to extensive government regulation and supervision — Our operations are subject to extensive federal and state regulation and supervision. Banking regulations are primarily intended to protect depositors’ funds, federal deposit insurance funds and the banking system as a whole, not security holders. These regulations affect our lending practices, capital structure, investment practices, dividend policy and growth, among other things. Congress and federal regulatory agencies continually review banking laws, regulations and policies for possible change. Changes to statutes, regulations or regulatory policies, including changes in interpretation or implementation of statutes, regulation or policies, could affect us in substantial and unpredictable ways. Such changes could subject us to additional costs and limit the types of financial services and products we may offer. Failure to comply with laws, regulations or policies could result in sanctions by regulatory agencies, civil money penalties and/or reputation damage, which could have a material adverse effect on our business, financial condition and results of operations. While we have policies and procedures designed to prevent any such violations, there can be no assurance that such violations will not occur.
Changes in accounting standards could impact reported earnings — Current accounting and tax rules, standards, policies and interpretations influence the methods by which financial institutions conduct business, implement strategic initiatives and tax compliance, and govern financial reporting and disclosures. These laws, regulations, rules, standards, policies and interpretations are constantly evolving and may change significantly over time. Events that may not have a direct impact on us, such as bankruptcy of major U.S. companies, have resulted in legislators, regulators, and authoritative bodies, such as the Financial Accounting Standards Board, the Securities and Exchange Commission, the Public Company Accounting Oversight Board and various taxing authorities, responding by adopting and/or proposing substantive revision to laws, regulations, rules, standards, policies and interpretations. New accounting pronouncements and varying interpretations of accounting pronouncements have occurred and may occur in the future. A change in accounting standards may adversely affect our reported financial condition and results of operations.
Substantial ownership concentration — Our directors, executive officers and 1st Source Bank, as trustee, collectively hold a significant ownership concentration of our common shares. Due to this significant level of ownership among our affiliates, our directors, executive officers, and 1st Source Bank, as trustee, may be able to influence the outcome of director elections or impact significant transactions, such as mergers or acquisitions, or any other matter that might otherwise be favored by other stockholders.
Reputational Risks
Competition from other financial services providers could adversely impact our results of operations — The banking and financial services business is highly competitive. We face competition in making loans and leases, attracting deposits and providing insurance, investment, trust, and other financial services. Increased competition in the banking and financial services businesses may reduce our market share, impair our growth or cause the prices we charge for our services to decline. Our results of operations may be adversely impacted in future periods depending upon the level and nature of competition we encounter in our various market areas.
Managing reputational risk is important to attracting and maintaining customers, investors, and employees — Threats to our reputation can come from many sources, including adverse sentiment about financial institutions generally, unethical practices, employee misconduct, failure to deliver minimum standards of service or quality, compliance deficiencies, and questionable or fraudulent activities of our customers. We have policies and procedures in place that seek to protect our reputation and promote ethical conduct. Nonetheless, negative publicity may arise regarding our business, employees, or customers, with or without merit, and could result in the loss of customers, investors, and employees; costly litigation; a decline in revenues; and increased government regulation.
Item 1B. Unresolved Staff Comments.
None
14 SRCE 2013 Form 10-K
Item 2. Properties.
Our headquarters building is located in downtown South Bend, Indiana. The building is part of a larger complex, including a 300-room hotel and a 500-car parking garage. In December 2010, we entered into a new 10.5 year lease on our headquarters building which became effective January 1, 2011. As of December 31, 2013, 1st Source leases approximately 69% of the office space in this complex.
At December 31, 2013, we also owned property and/or buildings on which 56 of 1st Source Bank’s 77 banking centers were located, including the facilities in Allen, Elkhart, Fulton, Huntington, Kosciusko, LaPorte, Marshall, Porter, St. Joseph, Starke, Tippecanoe, Wells, and Whitley Counties in the State of Indiana and Berrien and Cass Counties in the State of Michigan, as well as an operations center, warehouse, and our former headquarters building, which is utilized for additional business operations. The Bank leases additional property and/or buildings to and from third parties under lease agreements negotiated at arm's-length.
Item 3. Legal Proceedings.
As previously reported, 1st Source Bank, as the trustee (the “Trustee”) of the Morris Family Trusts for Ernestine M. Raclin, Chairman Emeritus of the Company, and other beneficiaries, requested approval of the Probate Court of St. Joseph County Indiana to divide the Morris Family Trusts into four separate family trust lines. The Trustee also sought other relief regarding the trusts including approving its accounts. The action was taken in light of possible changes in tax laws and for financial and estate planning purposes, including the possible divesture of some 1st Source Corporation common stock owned by the Trusts. Shares at issue in the probate action held by the Morris Family Trusts represent approximately 21% of the outstanding common stock of the Company. 1st Source Bank has served as Trustee continuously since 1985.
The four family trust lines correspond to the four children of Mrs. Raclin. (Mrs. Raclin's daughter, Carmen is the wife of Christopher J. Murphy III, the Chairman of the Board and Chief Executive Officer of the Company.) In a response filed on September 28, 2012, two of the siblings and their respective children filed a joint answer to the Trustee’s petition and a counter-petition setting forth their objection to the Trustee’s proposed division of the Morris Family Trusts into four family trust lines. They also sought affirmative relief, alleging that the Trustee has breached its duties by, among other things, acquiring an inappropriate and unreasonably high concentration in common stock of the Company in 1971 and, for decades thereafter, failing to prudently, impartially and timely diversify the assets of the Morris Family Trusts uninfluenced by the impact on the Company or its executives.
The relief sought includes removal of the Trustee, unspecified damages and payment by 1st Source Bank of all fees, costs and expenses incurred by the Trustee for, among other things, all matters related to the preparation and prosecution of the probate action. Mrs. Raclin, the two remaining siblings and their children, respectively, filed their joint answer to the petition indicating their previous and ongoing support for the Trustee’s acquisition of and continuing investment in the common stock of the Company. The Company believes there is no basis for the relief requested in the objection and counter-petition. The Trustee is defending the matter vigorously. The Board of Directors of the Company has formed a special committee of independent directors that actively monitors the progress of the matter.
1st Source and our subsidiaries are involved in various other legal proceedings incidental to the conduct of our businesses. Our management does not expect that the outcome of any such proceedings will have a material adverse effect on our consolidated financial position or results of operations.
Item 4. Mine Safety Disclosures.
None
Part II
Item 5. Market for Registrant’s Common Equity, Related Stockholder Matters and Issuer Purchases of Equity Securities.
Our common stock is traded on the NASDAQ Global Select Market under the symbol “SRCE.” The following table sets forth for each quarter the high and low sales prices for our common stock, as reported by NASDAQ, and the cash dividends paid per share for each quarter.
2013 Sales Price Cash Dividends 2012 Sales Price Cash Dividends
Common Stock Prices (quarter ended) High Low Paid High Low PaidMarch 31 $ 24.79 $ 21.88 $ 0.17 $ 26.79 $ 23.54 $ 0.16June 30 25.25 22.65 0.17 24.86 20.51 0.16September 30 28.82 23.87 0.17 23.97 21.40 0.17December 31 32.92 25.64 0.17 23.15 19.70 0.17
As of February 14, 2014, there were 908 holders of record of 1st Source common stock.
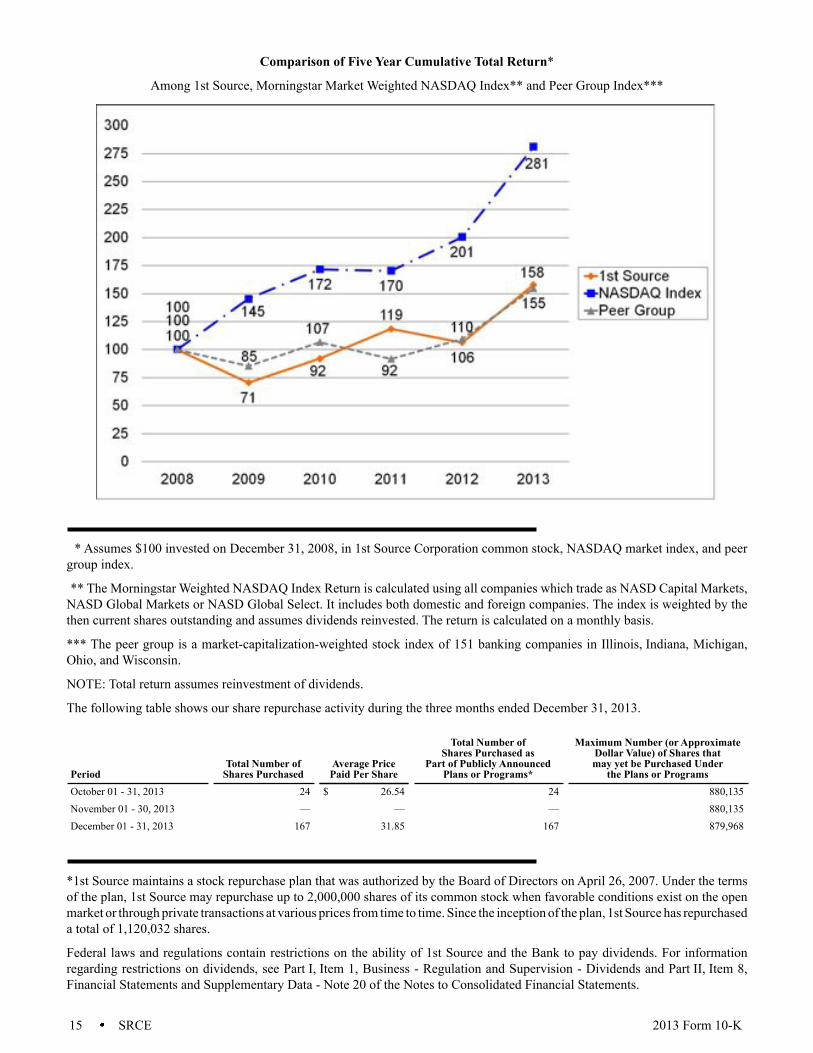
15 SRCE 2013 Form 10-K
Comparison of Five Year Cumulative Total Return*
Among 1st Source, Morningstar Market Weighted NASDAQ Index** and Peer Group Index***
* Assumes $100 invested on December 31, 2008, in 1st Source Corporation common stock, NASDAQ market index, and peer group index.
** The Morningstar Weighted NASDAQ Index Return is calculated using all companies which trade as NASD Capital Markets, NASD Global Markets or NASD Global Select. It includes both domestic and foreign companies. The index is weighted by the then current shares outstanding and assumes dividends reinvested. The return is calculated on a monthly basis.
*** The peer group is a market-capitalization-weighted stock index of 151 banking companies in Illinois, Indiana, Michigan, Ohio, and Wisconsin.
NOTE: Total return assumes reinvestment of dividends.
The following table shows our share repurchase activity during the three months ended December 31, 2013.
PeriodTotal Number of
Shares PurchasedAverage PricePaid Per Share
Total Number ofShares Purchased as
Part of Publicly AnnouncedPlans or Programs*
Maximum Number (or ApproximateDollar Value) of Shares thatmay yet be Purchased Under
the Plans or ProgramsOctober 01 - 31, 2013 24 $ 26.54 24 880,135November 01 - 30, 2013 — — — 880,135December 01 - 31, 2013 167 31.85 167 879,968
*1st Source maintains a stock repurchase plan that was authorized by the Board of Directors on April 26, 2007. Under the terms of the plan, 1st Source may repurchase up to 2,000,000 shares of its common stock when favorable conditions exist on the open market or through private transactions at various prices from time to time. Since the inception of the plan, 1st Source has repurchased a total of 1,120,032 shares.
Federal laws and regulations contain restrictions on the ability of 1st Source and the Bank to pay dividends. For information regarding restrictions on dividends, see Part I, Item 1, Business - Regulation and Supervision - Dividends and Part II, Item 8, Financial Statements and Supplementary Data - Note 20 of the Notes to Consolidated Financial Statements.
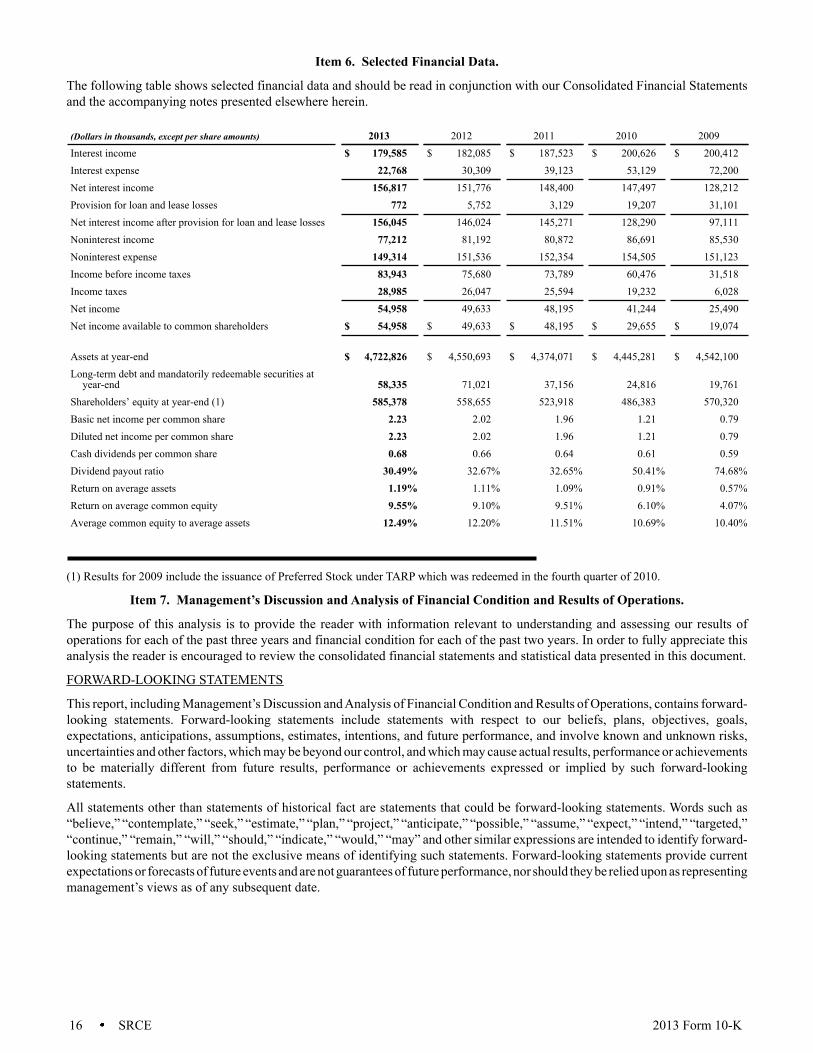
16 SRCE 2013 Form 10-K
Item 6. Selected Financial Data.
The following table shows selected financial data and should be read in conjunction with our Consolidated Financial Statements and the accompanying notes presented elsewhere herein.
(Dollars in thousands, except per share amounts) 2013 2012 2011 2010 2009Interest income $ 179,585 $ 182,085 $ 187,523 $ 200,626 $ 200,412Interest expense 22,768 30,309 39,123 53,129 72,200Net interest income 156,817 151,776 148,400 147,497 128,212Provision for loan and lease losses 772 5,752 3,129 19,207 31,101Net interest income after provision for loan and lease losses 156,045 146,024 145,271 128,290 97,111Noninterest income 77,212 81,192 80,872 86,691 85,530Noninterest expense 149,314 151,536 152,354 154,505 151,123Income before income taxes 83,943 75,680 73,789 60,476 31,518Income taxes 28,985 26,047 25,594 19,232 6,028Net income 54,958 49,633 48,195 41,244 25,490Net income available to common shareholders $ 54,958 $ 49,633 $ 48,195 $ 29,655 $ 19,074
Assets at year-end $ 4,722,826 $ 4,550,693 $ 4,374,071 $ 4,445,281 $ 4,542,100Long-term debt and mandatorily redeemable securities at
year-end 58,335 71,021 37,156 24,816 19,761Shareholders’ equity at year-end (1) 585,378 558,655 523,918 486,383 570,320Basic net income per common share 2.23 2.02 1.96 1.21 0.79Diluted net income per common share 2.23 2.02 1.96 1.21 0.79Cash dividends per common share 0.68 0.66 0.64 0.61 0.59Dividend payout ratio 30.49% 32.67% 32.65% 50.41% 74.68%Return on average assets 1.19% 1.11% 1.09% 0.91% 0.57%Return on average common equity 9.55% 9.10% 9.51% 6.10% 4.07%Average common equity to average assets 12.49% 12.20% 11.51% 10.69% 10.40%
(1) Results for 2009 include the issuance of Preferred Stock under TARP which was redeemed in the fourth quarter of 2010.
Item 7. Management’s Discussion and Analysis of Financial Condition and Results of Operations.
The purpose of this analysis is to provide the reader with information relevant to understanding and assessing our results of operations for each of the past three years and financial condition for each of the past two years. In order to fully appreciate this analysis the reader is encouraged to review the consolidated financial statements and statistical data presented in this document.
FORWARD-LOOKING STATEMENTS
This report, including Management’s Discussion and Analysis of Financial Condition and Results of Operations, contains forward-looking statements. Forward-looking statements include statements with respect to our beliefs, plans, objectives, goals, expectations, anticipations, assumptions, estimates, intentions, and future performance, and involve known and unknown risks, uncertainties and other factors, which may be beyond our control, and which may cause actual results, performance or achievements to be materially different from future results, performance or achievements expressed or implied by such forward-looking statements.
All statements other than statements of historical fact are statements that could be forward-looking statements. Words such as “believe,” “contemplate,” “seek,” “estimate,” “plan,” “project,” “anticipate,” “possible,” “assume,” “expect,” “intend,” “targeted,” “continue,” “remain,” “will,” “should,” “indicate,” “would,” “may” and other similar expressions are intended to identify forward-looking statements but are not the exclusive means of identifying such statements. Forward-looking statements provide current expectations or forecasts of future events and are not guarantees of future performance, nor should they be relied upon as representing management’s views as of any subsequent date.
17 SRCE 2013 Form 10-K
All written or oral forward-looking statements that are made by or attributable to us are expressly qualified in their entirety by this cautionary notice. We have no obligation and do not undertake to update, revise, or correct any of the forward-looking statements after the date of this report, or after the respective dates on which such statements otherwise are made. We have expressed our expectations, beliefs, and projections in good faith and we believe they have a reasonable basis. However, we make no assurances that our expectations, beliefs, or projections will be achieved or accomplished. The results or outcomes indicated by our forward-looking statements may not be realized due to a variety of factors, including, without limitation, the following:
• Local, regional, national, and international economic conditions and the impact they may have on us and our clients and our assessment of that impact.
• Changes in the level of nonperforming assets and charge-offs.
• Changes in estimates of future cash reserve requirements based upon the periodic review thereof under relevant regulatory and accounting requirements.
• The effects of and changes in trade and monetary and fiscal policies and laws, including the interest rate policies of the Federal Reserve Board.
• Inflation, interest rate, securities market, and monetary fluctuations.
• Political instability.
• Acts of war or terrorism.
• Substantial increases in the cost of fuel.
• The timely development and acceptance of new products and services and perceived overall value of these products and services by others.
• Changes in consumer spending, borrowings, and savings habits.
• Changes in the financial performance and/or condition of our borrowers.
• Technological changes.
• Acquisitions and integration of acquired businesses.
• The ability to increase market share and control expenses.
• Changes in the competitive environment among bank holding companies.
• The effect of changes in laws and regulations (including laws and regulations concerning taxes, banking, securities, and insurance) with which we and our subsidiaries must comply.
• The effect of changes in accounting policies and practices and auditing requirements, as may be adopted by the regulatory agencies, as well as the Public Company Accounting Oversight Board, the Financial Accounting Standards Board, and other accounting standard setters.
• Changes in our organization, compensation, and benefit plans.
• The costs and effects of legal and regulatory developments including the resolution of legal proceedings or regulatory or other governmental inquires and the results of regulatory examinations or reviews.
• Greater than expected costs or difficulties related to the integration of new products and lines of business.
• Our success at managing the risks described in Item 1A. Risk Factors.
APPLICATION OF CRITICAL ACCOUNTING POLICIES AND ESTIMATES
Our consolidated financial statements are prepared in accordance with U.S. generally accepted accounting principles (GAAP) and follow general practices within the industries in which we operate. Application of these principles requires management to make estimates or judgments that affect the amounts reported in the financial statements and accompanying notes. These estimates or judgments reflect management’s view of the most appropriate manner in which to record and report our overall financial performance. Because these estimates or judgments are based on current circumstances, they may change over time or prove to be inaccurate based on actual experience. As such, changes in these estimates, judgments, and/or assumptions may have a significant impact on our financial statements. All accounting policies are important, and all policies described in Part II, Item 8, Financial Statements and Supplementary Data, Note 1 (Note 1), should be reviewed for a greater understanding of how our financial performance is recorded and reported.
18 SRCE 2013 Form 10-K
We have identified the following three policies as being critical because they require management to make particularly difficult, subjective, and/or complex estimates or judgments about matters that are inherently uncertain and because of the likelihood that materially different amounts would be reported under different conditions or using different assumptions. These policies relate to the determination of the reserve for loan and lease losses, fair value measurements, and the valuation of mortgage servicing rights. Management believes it has used the best information available to make the estimations or judgments necessary to value the related assets and liabilities. Actual performance that differs from estimates or judgments and future changes in the key variables could change future valuations and impact net income. Management has reviewed the application of these policies with the Audit Committee of the Board of Directors. Following is a discussion of the areas we view as our most critical accounting policies.
Reserve for Loan and Lease Losses — The reserve for loan and lease losses represents management’s estimate of probable losses inherent in the loan and lease portfolio and the establishment of a reserve that is sufficient to absorb those losses. In determining an appropriate reserve, management makes numerous judgments, assumptions, and estimates based on continuous review of the loan and lease portfolio, estimates of client performance, collateral values, and disposition, as well as historical loss rates and expected cash flows. In assessing these factors, management benefits from a lengthy organizational history and experience with credit decisions and related outcomes. Nonetheless, if management’s underlying assumptions prove to be inaccurate, the reserve for loan and lease losses would have to be adjusted. Our accounting policy related to the reserve is disclosed in Note 1 under the heading “Reserve for Loan and Lease Losses.”
Fair Value Measurements — We use fair value measurements to record certain financial instruments and to determine fair value disclosures. Available-for-sale securities, trading account securities, mortgage loans held for sale, and interest rate swap agreements are financial instruments recorded at fair value on a recurring basis. Additionally, from time to time, we may be required to record at fair value other financial assets on a nonrecurring basis. These nonrecurring fair value adjustments typically involve write-downs of, or specific reserves against, individual assets. GAAP establishes a three-level hierarchy for disclosure of assets and liabilities recorded at fair value. The classification of assets and liabilities within the hierarchy is based on whether the inputs to the valuation methodology used in the measurement are observable or unobservable. Observable inputs reflect market-driven or market-based information obtained from independent sources, while unobservable inputs reflect our estimates about market data.
The degree of management judgment involved in determining the fair value of a financial instrument is dependent upon the availability of quoted market prices or observable market data. For financial instruments that trade actively and have quoted market prices or observable market data, there is minimal subjectivity involved in measuring fair value. When observable market prices and data are not fully available, management judgment is necessary to estimate fair value. In addition, changes in the market conditions may reduce the availability of quoted prices or observable data. For example, reduced liquidity in the capital markets or changes in secondary market activities could result in observable market inputs becoming unavailable. Therefore, when market data is not available, we use valuation techniques that require more management judgment to estimate the appropriate fair value measurement. Fair value is discussed further in Note 1 under the heading “Fair Value Measurements” and in Note 21, “Fair Value Measurements.”
Mortgage Servicing Rights Valuation — We recognize as assets the rights to service mortgage loans for others, known as mortgage servicing rights, whether the servicing rights are acquired through purchases or through originated loans. Mortgage servicing rights do not trade in an active open market with readily observable market prices. Although sales of mortgage servicing rights do occur, the precise terms and conditions may not be readily available. As such, the value of mortgage servicing assets is established and valued using discounted cash flow modeling techniques which require management to make estimates regarding future net servicing cash flows, taking into consideration actual and expected mortgage loan prepayment rates, discount rates, servicing costs, and other economic factors. The estimated rates of mortgage loan prepayments are the most significant factors driving the value of mortgage servicing assets. Increases in mortgage loan prepayments reduce estimated future net servicing cash flows because the life of the underlying loan is reduced. In determining the fair value of the mortgage servicing assets, mortgage interest rates (which are used to determine prepayment rates), and discount rates are held constant over the estimated life of the portfolio. Estimated mortgage loan prepayment rates are derived from a third-party model and adjusted to reflect our actual prepayment experience. Mortgage servicing assets are carried at the lower of amortized cost or fair value. The values of these assets are sensitive to changes in the assumptions used and readily available market pricing does not exist. The valuation of mortgage servicing assets is discussed further in Note 21, “Fair Value Measurements.”
EARNINGS SUMMARY
Net income in 2013 was $54.96 million, up from $49.63 million in 2012 and up from $48.20 million in 2011. Diluted net income per common share was $2.23 in 2013, $2.02 in 2012, and $1.96 in 2011. Return on average total assets was 1.19% in 2013 compared to 1.11% in 2012, and 1.09% in 2011. Return on average common shareholders’ equity was 9.55% in 2013 versus 9.10% in 2012, and 9.51% in 2011.
19 SRCE 2013 Form 10-K
Net income in 2013, as compared to 2012, was positively impacted by a $5.04 million or 3.32% increase in net interest income and $4.98 million or 86.58% decrease in provision for loan and lease losses over 2012, which was offset by a $3.98 million or 4.90% decrease in noninterest income and a $2.94 million or 11.28% increase in income tax expense. Net income in 2012 was positively impacted by a $3.38 million or 2.27% increase in net interest income from 2011, which was offset by an increase of $2.62 million or 83.83% in provision for loan and lease losses.
Dividends paid on common stock in 2013 amounted to $0.68 per share, compared to $0.66 per share in 2012, and $0.64 per share in 2011. The level of earnings reinvested and dividend payouts are determined by the Board of Directors based on management’s assessment of future growth opportunities and the level of capital necessary to support them.
Net Interest Income — Our primary source of earnings is net interest income, the difference between income on earning assets and the cost of funds supporting those assets. Significant categories of earning assets are loans and securities while deposits and borrowings represent the major portion of interest-bearing liabilities. For purposes of the following discussion, comparison of net interest income is done on a tax equivalent basis, which provides a common basis for comparing yields on earning assets exempt from federal income taxes to those which are fully taxable.
Net interest margin (the ratio of net interest income to average earning assets) is significantly affected by movements in interest rates and changes in the mix of earning assets and the liabilities that fund those assets. Net interest margin on a fully taxable equivalent basis was 3.67% in 2013, compared to 3.69% in 2012 and 2011. The stable margins in 2013 and 2012 reflect the decline in funding costs offset by lower yields on earnings assets. Net interest income was $156.82 million for 2013, compared to $151.78 million for 2012 and $148.40 million for 2011. Tax-equivalent net interest income totaled $158.64 million for 2013, up $4.80 million from the $153.84 million reported in 2012. Tax-equivalent net interest income for 2012 was up $2.93 million from the $150.91 million reported for 2011.
During 2013, average earning assets increased $151.46 million while average interest-bearing liabilities increased $47.03 million over the comparable period in 2012. The yield on average earning assets decreased 22 basis points to 4.19% for 2013 from 4.41% for 2012 due to reduced market interest rates. Total cost of average interest-bearing liabilities decreased 25 basis points to 0.69% during 2013 from 0.94% in 2012 as liabilities were impacted by decreases in market rates and rate re-pricing on maturing certificates of deposit. The result was a decrease of 2 basis points to net interest spread, or the difference between interest income on earning assets and expense on interest-bearing liabilities.
The largest contributor to the decrease in the yield on average earning assets in 2013 was the 33 basis point decrease in the loan and lease portfolio yield. Average net loans and leases increased $224.45 million or 6.99% in 2013 from 2012 while the yield decreased to 4.69%.
During 2013, the tax-equivalent yield on securities available for sale decreased 16 basis points to 2.26% while the average balance decreased $41.59 million. Average mortgages held for sale decreased $9.13 million during 2013 and the yield increased 42 basis points. Average other investments, which include federal funds sold, time deposits with other banks, Federal Reserve Bank excess balances, Federal Reserve Bank and Federal Home Loan Bank stock and commercial paper decreased $22.26 million during 2013 while the yield increased 73 basis points. The increase in yield was primarily a result of lower outstanding balances at higher rates.
Average interest-bearing deposits increased $52.40 million during 2013 while the effective rate paid on those deposits decreased 19 basis points. Average noninterest-bearing demand deposits increased $73.90 million during 2013.
Average short-term borrowings increased $16.87 million during 2013 while the effective rate paid increased 2 basis points. Average long-term debt increased $7.42 million during 2013 as the effective rate decreased 45 basis points.
Average subordinated notes decreased $29.66 million during 2013 while the effective rate paid decreased by 15 basis points. The decrease in yield and average balance during 2013 was due to the redemption of trust preferred securities in December 2012.
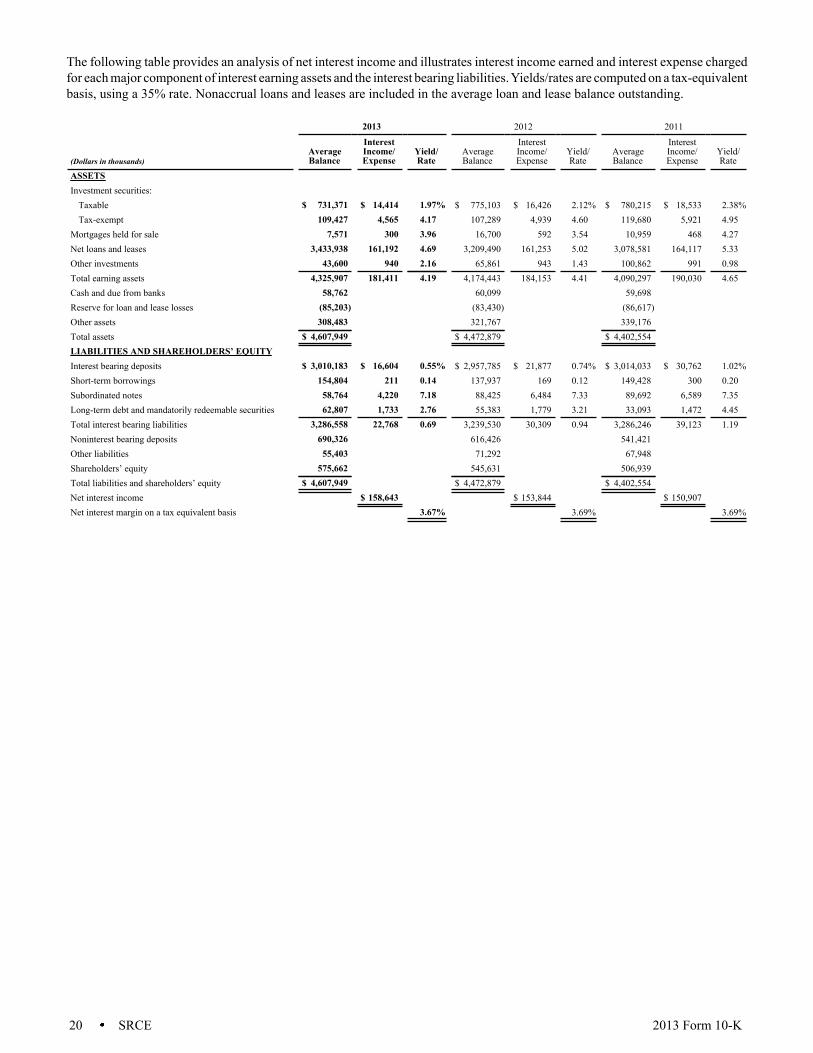
20 SRCE 2013 Form 10-K
The following table provides an analysis of net interest income and illustrates interest income earned and interest expense charged for each major component of interest earning assets and the interest bearing liabilities. Yields/rates are computed on a tax-equivalent basis, using a 35% rate. Nonaccrual loans and leases are included in the average loan and lease balance outstanding.
2013 2012 2011
(Dollars in thousands)AverageBalance
InterestIncome/Expense
Yield/Rate
AverageBalance
InterestIncome/Expense
Yield/Rate
AverageBalance
InterestIncome/Expense
Yield/Rate
ASSETS Investment securities:
Taxable $ 731,371 $ 14,414 1.97% $ 775,103 $ 16,426 2.12% $ 780,215 $ 18,533 2.38%Tax-exempt 109,427 4,565 4.17 107,289 4,939 4.60 119,680 5,921 4.95
Mortgages held for sale 7,571 300 3.96 16,700 592 3.54 10,959 468 4.27Net loans and leases 3,433,938 161,192 4.69 3,209,490 161,253 5.02 3,078,581 164,117 5.33Other investments 43,600 940 2.16 65,861 943 1.43 100,862 991 0.98Total earning assets 4,325,907 181,411 4.19 4,174,443 184,153 4.41 4,090,297 190,030 4.65Cash and due from banks 58,762 60,099 59,698 Reserve for loan and lease losses (85,203) (83,430) (86,617) Other assets 308,483 321,767 339,176 Total assets $ 4,607,949 $ 4,472,879 $ 4,402,554 LIABILITIES AND SHAREHOLDERS’ EQUITY Interest bearing deposits $ 3,010,183 $ 16,604 0.55% $ 2,957,785 $ 21,877 0.74% $ 3,014,033 $ 30,762 1.02%Short-term borrowings 154,804 211 0.14 137,937 169 0.12 149,428 300 0.20Subordinated notes 58,764 4,220 7.18 88,425 6,484 7.33 89,692 6,589 7.35Long-term debt and mandatorily redeemable securities 62,807 1,733 2.76 55,383 1,779 3.21 33,093 1,472 4.45Total interest bearing liabilities 3,286,558 22,768 0.69 3,239,530 30,309 0.94 3,286,246 39,123 1.19Noninterest bearing deposits 690,326 616,426 541,421 Other liabilities 55,403 71,292 67,948 Shareholders’ equity 575,662 545,631 506,939 Total liabilities and shareholders’ equity $ 4,607,949 $ 4,472,879 $ 4,402,554 Net interest income $ 158,643 $ 153,844 $ 150,907 Net interest margin on a tax equivalent basis 3.67% 3.69% 3.69%
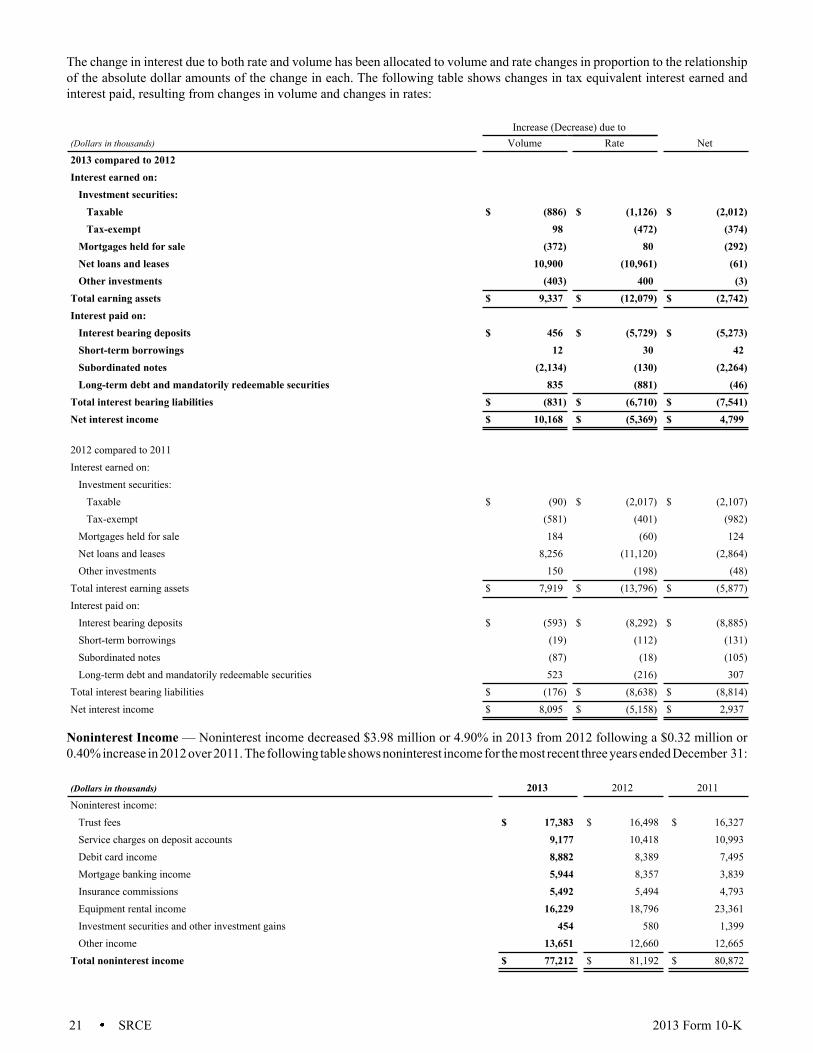
21 SRCE 2013 Form 10-K
The change in interest due to both rate and volume has been allocated to volume and rate changes in proportion to the relationship of the absolute dollar amounts of the change in each. The following table shows changes in tax equivalent interest earned and interest paid, resulting from changes in volume and changes in rates:
Increase (Decrease) due to
(Dollars in thousands) Volume Rate Net2013 compared to 2012 Interest earned on:
Investment securities: Taxable $ (886) $ (1,126) $ (2,012)Tax-exempt 98 (472) (374)
Mortgages held for sale (372) 80 (292)Net loans and leases 10,900 (10,961) (61)Other investments (403) 400 (3)
Total earning assets $ 9,337 $ (12,079) $ (2,742)Interest paid on:
Interest bearing deposits $ 456 $ (5,729) $ (5,273)Short-term borrowings 12 30 42Subordinated notes (2,134) (130) (2,264)Long-term debt and mandatorily redeemable securities 835 (881) (46)
Total interest bearing liabilities $ (831) $ (6,710) $ (7,541)Net interest income $ 10,168 $ (5,369) $ 4,799
2012 compared to 2011 Interest earned on:
Investment securities: Taxable $ (90) $ (2,017) $ (2,107)Tax-exempt (581) (401) (982)
Mortgages held for sale 184 (60) 124Net loans and leases 8,256 (11,120) (2,864)Other investments 150 (198) (48)
Total interest earning assets $ 7,919 $ (13,796) $ (5,877)Interest paid on:
Interest bearing deposits $ (593) $ (8,292) $ (8,885)Short-term borrowings (19) (112) (131)Subordinated notes (87) (18) (105)Long-term debt and mandatorily redeemable securities 523 (216) 307
Total interest bearing liabilities $ (176) $ (8,638) $ (8,814)Net interest income $ 8,095 $ (5,158) $ 2,937
Noninterest Income — Noninterest income decreased $3.98 million or 4.90% in 2013 from 2012 following a $0.32 million or 0.40% increase in 2012 over 2011. The following table shows noninterest income for the most recent three years ended December 31:
(Dollars in thousands) 2013 2012 2011Noninterest income:
Trust fees $ 17,383 $ 16,498 $ 16,327Service charges on deposit accounts 9,177 10,418 10,993Debit card income 8,882 8,389 7,495Mortgage banking income 5,944 8,357 3,839Insurance commissions 5,492 5,494 4,793Equipment rental income 16,229 18,796 23,361Investment securities and other investment gains 454 580 1,399Other income 13,651 12,660 12,665
Total noninterest income $ 77,212 $ 81,192 $ 80,872
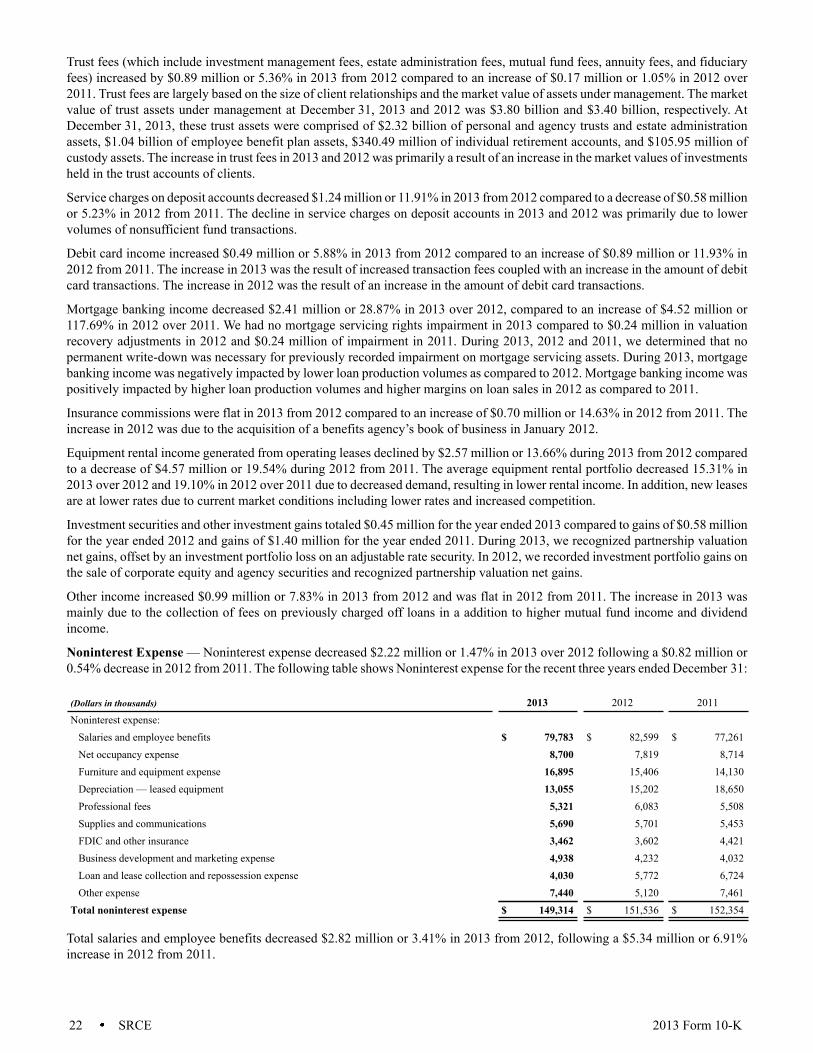
22 SRCE 2013 Form 10-K
Trust fees (which include investment management fees, estate administration fees, mutual fund fees, annuity fees, and fiduciary fees) increased by $0.89 million or 5.36% in 2013 from 2012 compared to an increase of $0.17 million or 1.05% in 2012 over 2011. Trust fees are largely based on the size of client relationships and the market value of assets under management. The market value of trust assets under management at December 31, 2013 and 2012 was $3.80 billion and $3.40 billion, respectively. At December 31, 2013, these trust assets were comprised of $2.32 billion of personal and agency trusts and estate administration assets, $1.04 billion of employee benefit plan assets, $340.49 million of individual retirement accounts, and $105.95 million of custody assets. The increase in trust fees in 2013 and 2012 was primarily a result of an increase in the market values of investments held in the trust accounts of clients.
Service charges on deposit accounts decreased $1.24 million or 11.91% in 2013 from 2012 compared to a decrease of $0.58 million or 5.23% in 2012 from 2011. The decline in service charges on deposit accounts in 2013 and 2012 was primarily due to lower volumes of nonsufficient fund transactions.
Debit card income increased $0.49 million or 5.88% in 2013 from 2012 compared to an increase of $0.89 million or 11.93% in 2012 from 2011. The increase in 2013 was the result of increased transaction fees coupled with an increase in the amount of debit card transactions. The increase in 2012 was the result of an increase in the amount of debit card transactions.
Mortgage banking income decreased $2.41 million or 28.87% in 2013 over 2012, compared to an increase of $4.52 million or 117.69% in 2012 over 2011. We had no mortgage servicing rights impairment in 2013 compared to $0.24 million in valuation recovery adjustments in 2012 and $0.24 million of impairment in 2011. During 2013, 2012 and 2011, we determined that no permanent write-down was necessary for previously recorded impairment on mortgage servicing assets. During 2013, mortgage banking income was negatively impacted by lower loan production volumes as compared to 2012. Mortgage banking income was positively impacted by higher loan production volumes and higher margins on loan sales in 2012 as compared to 2011.
Insurance commissions were flat in 2013 from 2012 compared to an increase of $0.70 million or 14.63% in 2012 from 2011. The increase in 2012 was due to the acquisition of a benefits agency’s book of business in January 2012.
Equipment rental income generated from operating leases declined by $2.57 million or 13.66% during 2013 from 2012 compared to a decrease of $4.57 million or 19.54% during 2012 from 2011. The average equipment rental portfolio decreased 15.31% in 2013 over 2012 and 19.10% in 2012 over 2011 due to decreased demand, resulting in lower rental income. In addition, new leases are at lower rates due to current market conditions including lower rates and increased competition.
Investment securities and other investment gains totaled $0.45 million for the year ended 2013 compared to gains of $0.58 million for the year ended 2012 and gains of $1.40 million for the year ended 2011. During 2013, we recognized partnership valuation net gains, offset by an investment portfolio loss on an adjustable rate security. In 2012, we recorded investment portfolio gains on the sale of corporate equity and agency securities and recognized partnership valuation net gains.
Other income increased $0.99 million or 7.83% in 2013 from 2012 and was flat in 2012 from 2011. The increase in 2013 was mainly due to the collection of fees on previously charged off loans in a addition to higher mutual fund income and dividend income.
Noninterest Expense — Noninterest expense decreased $2.22 million or 1.47% in 2013 over 2012 following a $0.82 million or 0.54% decrease in 2012 from 2011. The following table shows Noninterest expense for the recent three years ended December 31:
(Dollars in thousands) 2013 2012 2011Noninterest expense:
Salaries and employee benefits $ 79,783 $ 82,599 $ 77,261Net occupancy expense 8,700 7,819 8,714Furniture and equipment expense 16,895 15,406 14,130Depreciation — leased equipment 13,055 15,202 18,650Professional fees 5,321 6,083 5,508Supplies and communications 5,690 5,701 5,453FDIC and other insurance 3,462 3,602 4,421Business development and marketing expense 4,938 4,232 4,032Loan and lease collection and repossession expense 4,030 5,772 6,724Other expense 7,440 5,120 7,461
Total noninterest expense $ 149,314 $ 151,536 $ 152,354
Total salaries and employee benefits decreased $2.82 million or 3.41% in 2013 from 2012, following a $5.34 million or 6.91% increase in 2012 from 2011.
23 SRCE 2013 Form 10-K
Employee salaries declined $2.36 million or 3.56% in 2013 from 2012 compared to an increase of $3.72 million of 5.94% in 2012 from 2011. The decrease in 2013 was a result of lower base salaries and producer commissions. Lower base salary expense was primarily due to fewer full time equivalent employees offset by increases from the annual performance raises. Loan producer commissions were lower due to decreased residential mortgage loan production volumes. The increase in 2012 was primarily due to higher base salaries, executive incentive expense and loan producer commissions. Higher base salary expense was primarily due to more full time equivalent employees and annual performance raises. Loan producer commissions were higher due to increased residential mortgage loan production volumes.
Employee benefits decreased by $0.46 million or 2.80% in 2013 from 2012, compared to an increase of $1.62 million or 11.04% in 2012 from 2011. The decrease in 2013 was primarily due to fewer full time equivalent employees, offset by higher group insurance costs. The increase in 2012 was primarily due to higher group insurance costs.
Occupancy expense increased $0.88 million or 11.27% in 2013 from 2012, compared to a decrease of $0.90 million or 10.27% in 2012 from 2011. The higher expense in 2013 was mainly due to the receipt of real estate tax refunds in 2012, higher depreciation on buildings as a result of branch remodeling in 2013, and new branches opened during 2013. The lower expense in 2012 was mainly due to reduced real estate taxes as a result of the successful appeals of assessed values.
Furniture and equipment expense, including depreciation, grew by $1.49 million or 9.67% in 2013 from 2012 compared to an increase of $1.28 million or 9.03% in 2012 from 2011. The higher expense during 2013 and 2012 was in the areas of equipment depreciation, computer processing charges and software maintenance.
Depreciation on equipment owned under operating leases decreased $2.15 million or 14.12% in 2013 from 2012, following a $3.45 million or 18.49% decrease in 2012 from 2011. In 2013 and 2012, depreciation on equipment owned under operating leases decreased in conjunction with the decrease in equipment rental income.
Professional fees declined by $0.76 million or 12.53% in 2013 from 2012, compared to a $0.58 million or 10.44% increase in 2012 from 2011. The decrease in 2013 was the result of reduced utilization of consulting services. The increase in 2012 was primarily due to higher consulting fees offset by lower legal fees.
Supplies and communications expense was flat in 2013 from 2012, compared to a $0.25 million or 4.55% increase in 2012 from 2011. During 2012, data communication costs were higher than prior year.
FDIC and other insurance expense was flat in 2013 from 2012 versus a $0.82 million or 18.53% decrease in 2012 over 2011. The decrease in 2012 was due to lower FDIC premiums based on average total consolidated assets minus the average tangible equity of the insured depository institution during the assessment period, whereas assessments were previously based on the amount of an institution's insured deposits.
Business development and marketing expense increased $0.71 million or 16.68% in 2013 from 2012 compared to a $0.20 million or 4.96% increase in 2012 from 2011. The higher expense in 2013 was the result of increased charitable contributions. Increased promotions and marketing activity resulted in higher costs in 2012.
Loan and lease collection and repossession expenses decreased $1.74 million or 30.18% in 2013 from 2012 compared to a decrease of $0.95 million or 14.16% in 2012 from 2011. Loan and lease collection and repossession expense was lower in 2013 mainly due to a reduction in the average repossessions outstanding and reduced valuation adjustments as credit quality slowly improves. The decrease in 2012 was mainly due to reduced ORE operating costs, collection and repossession expense, and valuation adjustments as compared to 2011. These reductions were offset by higher mortgage loan repurchase losses.
Other expenses increased $2.32 million or 45.31% in 2013 as compared to 2012 and decreased $2.34 million or 31.38% in 2012 from 2011. The increase in 2013 was mainly due to the gain on the sale of the corporate headquarters' parking garage that occurred in 2012, a previously reported trustee matter, and a higher provision on unfunded loan commitments. The decline in 2012 was mainly due to a lower provision on unfunded loan commitments and the gain on sale of the corporate headquarters’ parking garage.
Income Taxes — 1st Source recognized income tax expense in 2013 of $28.99 million, compared to $26.05 million in 2012, and $25.59 million in 2011. The effective tax rate in 2013 was 34.53% compared to 34.42% in 2012, and 34.69% in 2011.
Effective January 1, 2014, the Indiana Financial Institutions tax rate decreases from 8.5% to 8.0% and will continue to decrease by 0.5% each of the next three years. As a result of the change, we decreased the carrying value of certain state deferred tax assets. The impact of the change was not material and was recorded in the financial statements during the second quarter of 2013. For a detailed analysis of 1st Source’s income taxes see Part II, Item 8, Financial Statements and Supplementary Data — Note 17 of the Notes to Consolidated Financial Statements.
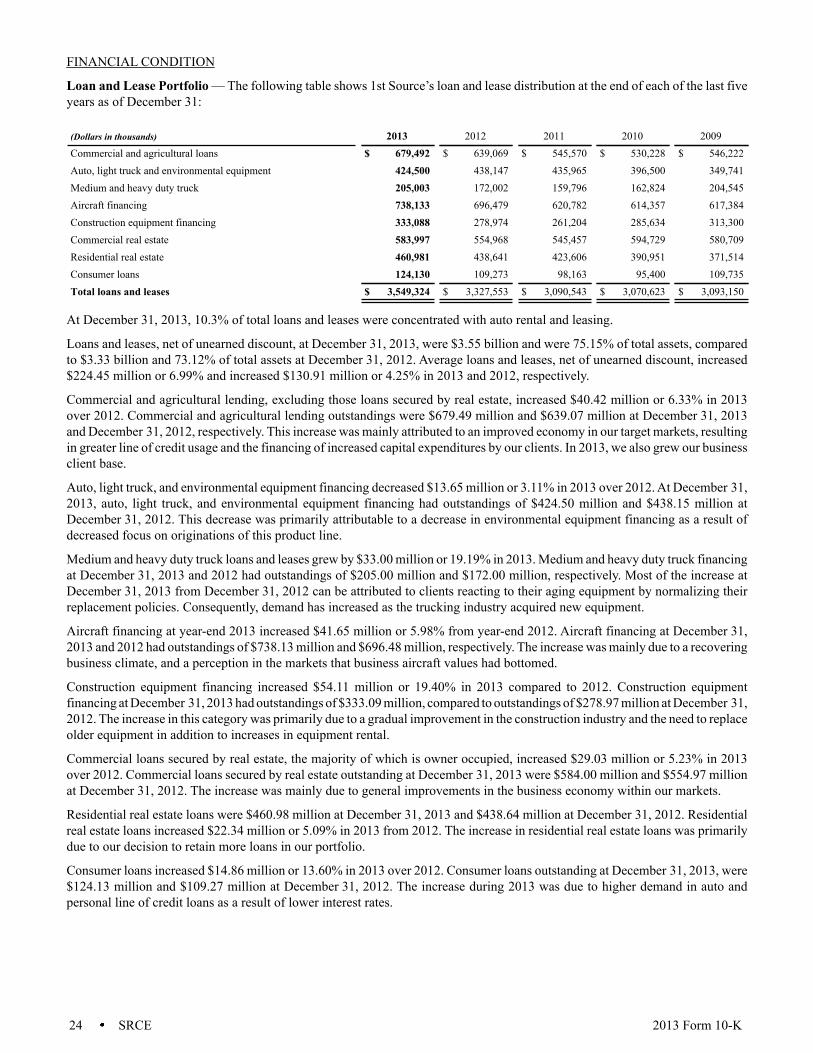
24 SRCE 2013 Form 10-K
FINANCIAL CONDITION
Loan and Lease Portfolio — The following table shows 1st Source’s loan and lease distribution at the end of each of the last five years as of December 31:
(Dollars in thousands) 2013 2012 2011 2010 2009Commercial and agricultural loans $ 679,492 $ 639,069 $ 545,570 $ 530,228 $ 546,222Auto, light truck and environmental equipment 424,500 438,147 435,965 396,500 349,741Medium and heavy duty truck 205,003 172,002 159,796 162,824 204,545Aircraft financing 738,133 696,479 620,782 614,357 617,384Construction equipment financing 333,088 278,974 261,204 285,634 313,300Commercial real estate 583,997 554,968 545,457 594,729 580,709Residential real estate 460,981 438,641 423,606 390,951 371,514Consumer loans 124,130 109,273 98,163 95,400 109,735Total loans and leases $ 3,549,324 $ 3,327,553 $ 3,090,543 $ 3,070,623 $ 3,093,150
At December 31, 2013, 10.3% of total loans and leases were concentrated with auto rental and leasing.
Loans and leases, net of unearned discount, at December 31, 2013, were $3.55 billion and were 75.15% of total assets, compared to $3.33 billion and 73.12% of total assets at December 31, 2012. Average loans and leases, net of unearned discount, increased $224.45 million or 6.99% and increased $130.91 million or 4.25% in 2013 and 2012, respectively.
Commercial and agricultural lending, excluding those loans secured by real estate, increased $40.42 million or 6.33% in 2013 over 2012. Commercial and agricultural lending outstandings were $679.49 million and $639.07 million at December 31, 2013 and December 31, 2012, respectively. This increase was mainly attributed to an improved economy in our target markets, resulting in greater line of credit usage and the financing of increased capital expenditures by our clients. In 2013, we also grew our business client base.
Auto, light truck, and environmental equipment financing decreased $13.65 million or 3.11% in 2013 over 2012. At December 31, 2013, auto, light truck, and environmental equipment financing had outstandings of $424.50 million and $438.15 million at December 31, 2012. This decrease was primarily attributable to a decrease in environmental equipment financing as a result of decreased focus on originations of this product line.
Medium and heavy duty truck loans and leases grew by $33.00 million or 19.19% in 2013. Medium and heavy duty truck financing at December 31, 2013 and 2012 had outstandings of $205.00 million and $172.00 million, respectively. Most of the increase at December 31, 2013 from December 31, 2012 can be attributed to clients reacting to their aging equipment by normalizing their replacement policies. Consequently, demand has increased as the trucking industry acquired new equipment.
Aircraft financing at year-end 2013 increased $41.65 million or 5.98% from year-end 2012. Aircraft financing at December 31, 2013 and 2012 had outstandings of $738.13 million and $696.48 million, respectively. The increase was mainly due to a recovering business climate, and a perception in the markets that business aircraft values had bottomed.
Construction equipment financing increased $54.11 million or 19.40% in 2013 compared to 2012. Construction equipment financing at December 31, 2013 had outstandings of $333.09 million, compared to outstandings of $278.97 million at December 31, 2012. The increase in this category was primarily due to a gradual improvement in the construction industry and the need to replace older equipment in addition to increases in equipment rental.
Commercial loans secured by real estate, the majority of which is owner occupied, increased $29.03 million or 5.23% in 2013 over 2012. Commercial loans secured by real estate outstanding at December 31, 2013 were $584.00 million and $554.97 million at December 31, 2012. The increase was mainly due to general improvements in the business economy within our markets.
Residential real estate loans were $460.98 million at December 31, 2013 and $438.64 million at December 31, 2012. Residential real estate loans increased $22.34 million or 5.09% in 2013 from 2012. The increase in residential real estate loans was primarily due to our decision to retain more loans in our portfolio.
Consumer loans increased $14.86 million or 13.60% in 2013 over 2012. Consumer loans outstanding at December 31, 2013, were $124.13 million and $109.27 million at December 31, 2012. The increase during 2013 was due to higher demand in auto and personal line of credit loans as a result of lower interest rates.
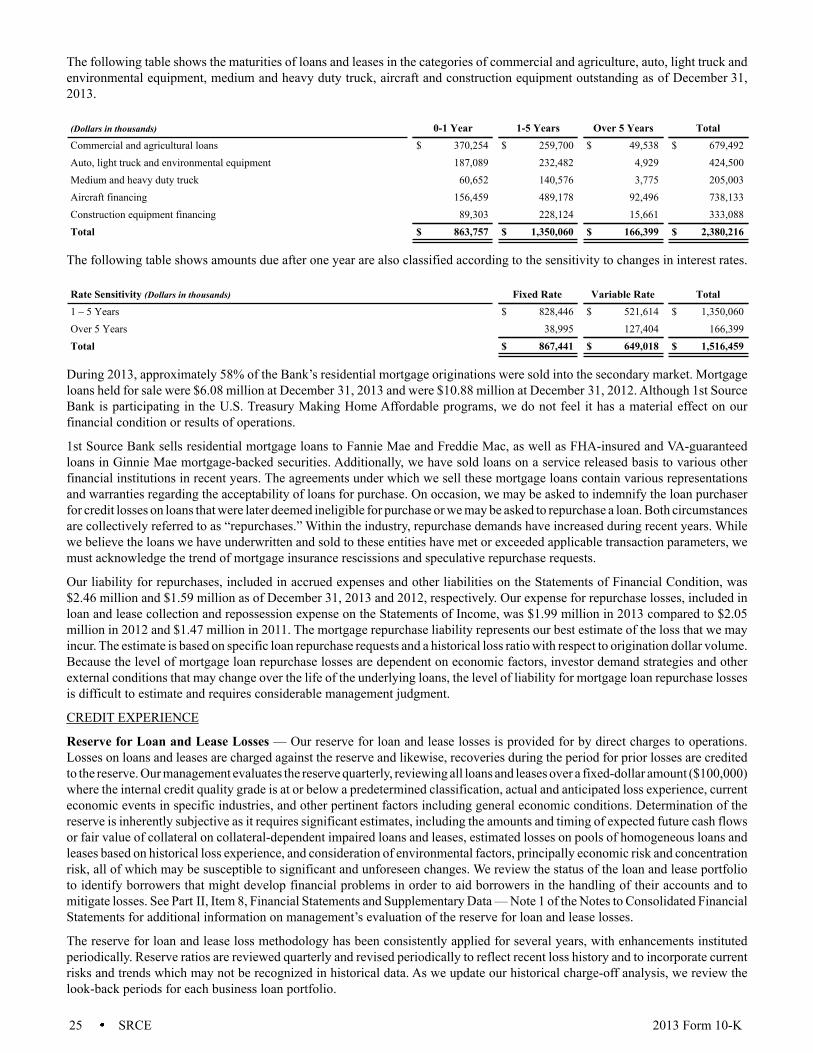
25 SRCE 2013 Form 10-K
The following table shows the maturities of loans and leases in the categories of commercial and agriculture, auto, light truck and environmental equipment, medium and heavy duty truck, aircraft and construction equipment outstanding as of December 31, 2013.
(Dollars in thousands) 0-1 Year 1-5 Years Over 5 Years TotalCommercial and agricultural loans $ 370,254 $ 259,700 $ 49,538 $ 679,492Auto, light truck and environmental equipment 187,089 232,482 4,929 424,500Medium and heavy duty truck 60,652 140,576 3,775 205,003Aircraft financing 156,459 489,178 92,496 738,133Construction equipment financing 89,303 228,124 15,661 333,088Total $ 863,757 $ 1,350,060 $ 166,399 $ 2,380,216
The following table shows amounts due after one year are also classified according to the sensitivity to changes in interest rates.
Rate Sensitivity (Dollars in thousands) Fixed Rate Variable Rate Total1 – 5 Years $ 828,446 $ 521,614 $ 1,350,060Over 5 Years 38,995 127,404 166,399Total $ 867,441 $ 649,018 $ 1,516,459
During 2013, approximately 58% of the Bank’s residential mortgage originations were sold into the secondary market. Mortgage loans held for sale were $6.08 million at December 31, 2013 and were $10.88 million at December 31, 2012. Although 1st Source Bank is participating in the U.S. Treasury Making Home Affordable programs, we do not feel it has a material effect on our financial condition or results of operations.
1st Source Bank sells residential mortgage loans to Fannie Mae and Freddie Mac, as well as FHA-insured and VA-guaranteed loans in Ginnie Mae mortgage-backed securities. Additionally, we have sold loans on a service released basis to various other financial institutions in recent years. The agreements under which we sell these mortgage loans contain various representations and warranties regarding the acceptability of loans for purchase. On occasion, we may be asked to indemnify the loan purchaser for credit losses on loans that were later deemed ineligible for purchase or we may be asked to repurchase a loan. Both circumstances are collectively referred to as “repurchases.” Within the industry, repurchase demands have increased during recent years. While we believe the loans we have underwritten and sold to these entities have met or exceeded applicable transaction parameters, we must acknowledge the trend of mortgage insurance rescissions and speculative repurchase requests.
Our liability for repurchases, included in accrued expenses and other liabilities on the Statements of Financial Condition, was $2.46 million and $1.59 million as of December 31, 2013 and 2012, respectively. Our expense for repurchase losses, included in loan and lease collection and repossession expense on the Statements of Income, was $1.99 million in 2013 compared to $2.05 million in 2012 and $1.47 million in 2011. The mortgage repurchase liability represents our best estimate of the loss that we may incur. The estimate is based on specific loan repurchase requests and a historical loss ratio with respect to origination dollar volume. Because the level of mortgage loan repurchase losses are dependent on economic factors, investor demand strategies and other external conditions that may change over the life of the underlying loans, the level of liability for mortgage loan repurchase losses is difficult to estimate and requires considerable management judgment.
CREDIT EXPERIENCE
Reserve for Loan and Lease Losses — Our reserve for loan and lease losses is provided for by direct charges to operations. Losses on loans and leases are charged against the reserve and likewise, recoveries during the period for prior losses are credited to the reserve. Our management evaluates the reserve quarterly, reviewing all loans and leases over a fixed-dollar amount ($100,000) where the internal credit quality grade is at or below a predetermined classification, actual and anticipated loss experience, current economic events in specific industries, and other pertinent factors including general economic conditions. Determination of the reserve is inherently subjective as it requires significant estimates, including the amounts and timing of expected future cash flows or fair value of collateral on collateral-dependent impaired loans and leases, estimated losses on pools of homogeneous loans and leases based on historical loss experience, and consideration of environmental factors, principally economic risk and concentration risk, all of which may be susceptible to significant and unforeseen changes. We review the status of the loan and lease portfolio to identify borrowers that might develop financial problems in order to aid borrowers in the handling of their accounts and to mitigate losses. See Part II, Item 8, Financial Statements and Supplementary Data — Note 1 of the Notes to Consolidated Financial Statements for additional information on management’s evaluation of the reserve for loan and lease losses.
The reserve for loan and lease loss methodology has been consistently applied for several years, with enhancements instituted periodically. Reserve ratios are reviewed quarterly and revised periodically to reflect recent loss history and to incorporate current risks and trends which may not be recognized in historical data. As we update our historical charge-off analysis, we review the look-back periods for each business loan portfolio.
26 SRCE 2013 Form 10-K
During 2013, the medium-term portion of the look-back period was five years given that 2009 through 2013 losses were considerably impacted by the severe recession. Although the recession began in December 2007, its financial consequences were not recognized in the loan portfolios until 2009. We gave the greatest weight to this recent five year period in our calculation, as we feel it is most consistent with our current expectations for 2014. Furthermore, we perform a thorough analysis of charge-offs, non-performing asset levels, special attention outstandings and delinquency in order to review portfolio trends and other factors, including specific industry risks and economic conditions, which may have an impact on the reserves and reserve ratios applied to various portfolios. We adjust the calculated historical based ratio as a result of our analysis of environmental factors, principally economic risk and concentration risk. Key economic factors affecting our portfolios are growth in gross domestic product, unemployment rates, housing market trends, commodity prices, inflation and global economic and political issues. Concentration risk is impacted primarily by geographic concentration in Northern Indiana and Southwestern Lower Michigan in our business banking and commercial real estate portfolios and by collateral concentration in our specialty finance portfolios.
The past three years we included a factor in our loss ratios for global risk, previously principally the European debt crisis. While we are less concerned about the implosion of Europe, we are increasingly aware of the risk that global issues may affect our customers. While we are unable to determine with any precision the impact of global economic and political issues on 1st Source Bank’s loan portfolios, we feel the risks are real and significant. We believe there is a risk of negative consequences for our borrowers that would affect their ability to repay their financial obligations. Therefore, we increased our loss ratios across all portfolios as of year-end 2011 and continued to include a factor for global risk in our analysis for 2013.
Another area of concern continues to be our aircraft portfolio where we have significant collateral concentration and a sizable foreign exposure. The aircraft industry was among the sectors affected most by the sluggish economy. Recently, we have seen some evidence that depressed private jet markets are improving. Nevertheless, we remain concerned about the prolonged low prices for several models and the negative effect the severe recession and the protracted recovery have had on our borrowers. We continue to experience higher default rates in this portfolio than in our other lending segments. We reassessed our ratios and made some upward adjustments based on our knowledge that many factors can effect this portfolio negatively.
We experienced ongoing improvement in the medium and heavy duty truck portfolio. We recognized sizable losses during 2009 and the first half of 2010; however, since then we have had no charge-offs. Current industry concerns are focused on a new highway finance law, revised greenhouse gas emissions standards, anticipated mandate for electronic logs to record driver hours of service and new regulations aimed at improving driver health and highway safety. Nevertheless, the underlying industry fundamentals are expected to remain relatively stable. As a result, we maintained our risk factors at levels consistent with last year.
Our construction equipment portfolio is characterized by increasing outstanding loan balances and improved credit quality in 2013. The construction industry, which was hard hit during the recession, is positioned to benefit from an improved housing market and increased demand in the energy sector. Historically, 1st Source has experienced less volatility in this portfolio than the industry as losses have been mitigated by appropriate underwriting and the advantage of strong collateral values due to the global market for used construction equipment. The underlying risk has not changed significantly for this portfolio; our reserve factors are similar to last year.
The auto, light truck and environmental equipment portfolio outstanding loan balances were relatively stable year-over-year, following three years of substantial growth. We are concerned about the softening of used car values, driven in large part by the increased production by manufacturers, as we move into 2014. As a result, we made an upward adjustment in the reserve ratio for the auto portfolio. We are not aggressively pursuing new business in our environmental equipment portfolio. Credit quality indicators are stable to improving with lower delinquency and Special Attention accounts. Our reserve ratio for the environmental equipment portfolio remains unchanged.
There are several industries represented in the commercial and agricultural portfolio. The outlook for the business banking portfolio is guardedly optimistic. While recent economic news indicates improvement, there are significant economic uncertainties and small business owners remain concerned. With the struggling job creation market, unemployment remains high albeit improving, which is a continued concern for our consumer portfolios. The outlook for the agriculture portfolio is good, with moderating crop prices and consistently strong land values. We have fewer accounts in Special Attention than we did at this time last year. We have reviewed the calculated loss ratios and the environmental factors and concentration issues affecting these portfolios and incorporated minor adjustments to the reserve ratios as deemed appropriate.
Similar to the commercial portfolio, our commercial real estate loans are concentrated in our local market with local customers, with over fifty percent of the Bank's exposure being owner occupied facilities where we are the primary relationship bank for our customers. Nevertheless, we are not immune to the dramatic declines in real estate values following the great recession, similar to other U.S. markets and we experienced losses from 2009 through 2011. We reduced our reserve ratios somewhat last year in response to improving market conditions, as evidenced by lower Special Attention accounts. That trend continued throughout 2013. However, as a result of our recent growth in the more risky non-owner occupied sector, we are maintaining the reserve ratios established last year.

27 SRCE 2013 Form 10-K
The reserve for loan and lease losses at December 31, 2013, totaled $83.51 million and was 2.35% of loans and leases, compared to $83.31 million or 2.50% of loans and leases at December 31, 2012 and $81.64 million or 2.64% of loans and leases at December 31, 2011. It is our opinion that the reserve for loan and lease losses was appropriate to absorb losses inherent in the loan and lease portfolio as of December 31, 2013.
Charge-offs for loan and lease losses were $3.83 million for 2013, compared to $7.64 million for 2012 and $12.59 million for 2011. Charge-offs decreased in 2013 and 2012 due to a decrease in average nonperforming loans and leases reflecting a slowly improving economy. In 2012, a large auto rental loss accounted for almost fifty percent of gross losses and in excess of ninety percent of net charge-offs. The provision for loan and lease losses was $0.77 million for 2013, compared to the provision for loan and lease losses of $5.75 million for 2012 and the provision for loan and lease losses of $3.13 million for 2011.
The following table summarizes our loan and lease loss experience for each of the last five years ended December 31:
(Dollars in thousands) 2013 2012 2011 2010 2009Amounts of loans and leases outstanding at end of period $ 3,549,324 $ 3,327,553 $ 3,090,543 $ 3,070,623 $ 3,093,150Average amount of net loans and leases outstanding during
period $ 3,433,938 $ 3,209,490 $ 3,078,581 $ 3,109,508 $ 3,154,820Balance of reserve for loan and lease losses at beginning of
period $ 83,311 $ 81,644 $ 86,874 $ 88,236 $ 79,776Charge-offs:
Commercial and agricultural loans 538 524 1,667 4,000 8,809Auto, light truck and environmental equipment 283 3,795 346 1,014 2,750Medium and heavy duty truck — — — 1,879 2,071Aircraft financing 1,308 600 4,681 6,507 7,812Construction equipment financing 88 120 853 2,372 1,476Commercial real estate 170 471 3,120 6,219 2,654Residential real estate 316 594 282 486 99Consumer loans 1,125 1,532 1,640 1,629 2,544
Total charge-offs 3,828 7,636 12,589 24,106 28,215Recoveries:
Commercial and agricultural loans 468 484 1,923 1,612 3,193Auto, light truck and environmental equipment 253 1,223 175 80 310Medium and heavy duty truck 348 192 2 50 5Aircraft financing 884 711 964 636 983Construction equipment financing 323 268 308 345 444Commercial real estate 627 223 346 105 28Residential real estate 14 43 56 47 8Consumer loans 333 407 456 662 603
Total recoveries 3,250 3,551 4,230 3,537 5,574Net charge-offs 578 4,085 8,359 20,569 22,641Provision for loan and lease losses 772 5,752 3,129 19,207 31,101Balance at end of period $ 83,505 $ 83,311 $ 81,644 $ 86,874 $ 88,236Ratio of net charge-offs to average net loans and leases
outstanding 0.02% 0.13% 0.27% 0.66% 0.72%Ratio of reserve for loan and lease losses to net loans and
leases outstanding end of period 2.35% 2.50% 2.64% 2.83% 2.85%Coverage ratio of reserve for loan and lease losses to
nonperforming loans and leases 225.73% 226.03% 143.49% 115.50% 104.84%
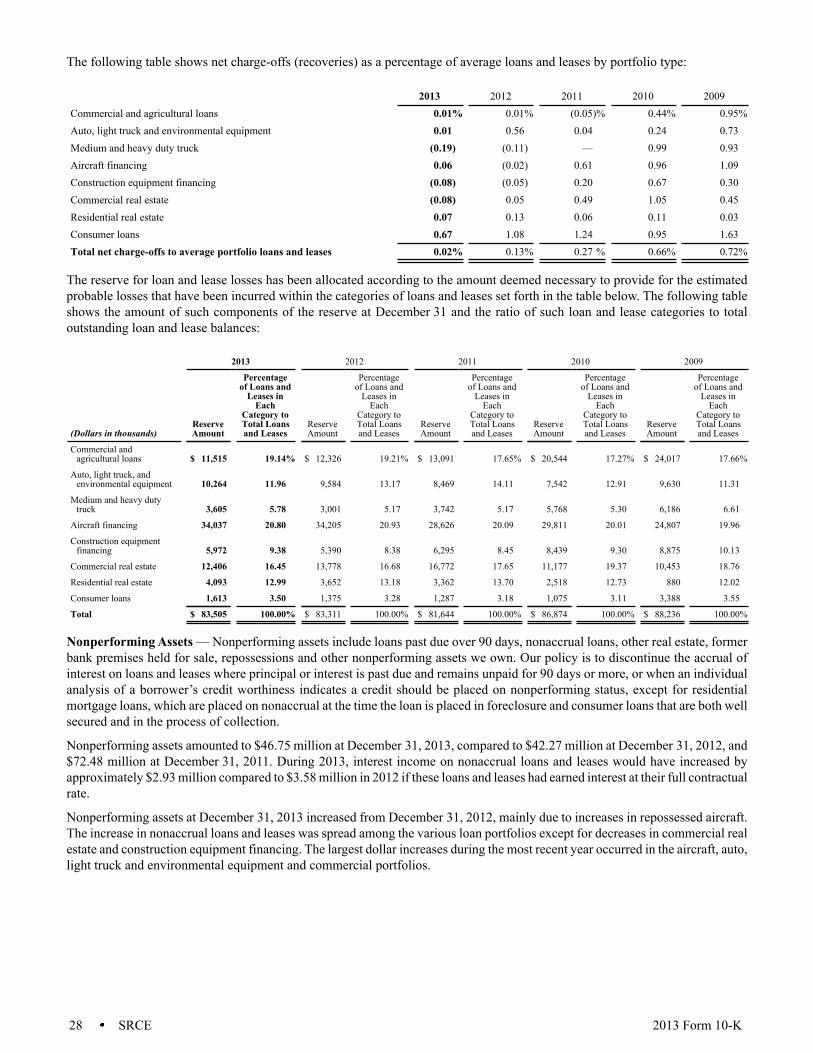
28 SRCE 2013 Form 10-K
The following table shows net charge-offs (recoveries) as a percentage of average loans and leases by portfolio type:
2013 2012 2011 2010 2009
Commercial and agricultural loans 0.01% 0.01% (0.05)% 0.44% 0.95%Auto, light truck and environmental equipment 0.01 0.56 0.04 0.24 0.73Medium and heavy duty truck (0.19) (0.11) — 0.99 0.93Aircraft financing 0.06 (0.02) 0.61 0.96 1.09Construction equipment financing (0.08) (0.05) 0.20 0.67 0.30Commercial real estate (0.08) 0.05 0.49 1.05 0.45Residential real estate 0.07 0.13 0.06 0.11 0.03Consumer loans 0.67 1.08 1.24 0.95 1.63Total net charge-offs to average portfolio loans and leases 0.02% 0.13% 0.27 % 0.66% 0.72%
The reserve for loan and lease losses has been allocated according to the amount deemed necessary to provide for the estimated probable losses that have been incurred within the categories of loans and leases set forth in the table below. The following table shows the amount of such components of the reserve at December 31 and the ratio of such loan and lease categories to total outstanding loan and lease balances:
2013 2012 2011 2010 2009
(Dollars in thousands)ReserveAmount
Percentageof Loans and
Leases inEach
Category toTotal Loansand Leases
ReserveAmount
Percentageof Loans and
Leases inEach
Category toTotal Loansand Leases
ReserveAmount
Percentageof Loans and
Leases inEach
Category toTotal Loansand Leases
ReserveAmount
Percentageof Loans and
Leases inEach
Category toTotal Loansand Leases
ReserveAmount
Percentageof Loans and
Leases inEach
Category toTotal Loansand Leases
Commercial andagricultural loans $ 11,515 19.14% $ 12,326 19.21% $ 13,091 17.65% $ 20,544 17.27% $ 24,017 17.66%
Auto, light truck, andenvironmental equipment 10,264 11.96 9,584 13.17 8,469 14.11 7,542 12.91 9,630 11.31
Medium and heavy dutytruck 3,605 5.78 3,001 5.17 3,742 5.17 5,768 5.30 6,186 6.61
Aircraft financing 34,037 20.80 34,205 20.93 28,626 20.09 29,811 20.01 24,807 19.96
Construction equipmentfinancing 5,972 9.38 5,390 8.38 6,295 8.45 8,439 9.30 8,875 10.13
Commercial real estate 12,406 16.45 13,778 16.68 16,772 17.65 11,177 19.37 10,453 18.76
Residential real estate 4,093 12.99 3,652 13.18 3,362 13.70 2,518 12.73 880 12.02
Consumer loans 1,613 3.50 1,375 3.28 1,287 3.18 1,075 3.11 3,388 3.55
Total $ 83,505 100.00% $ 83,311 100.00% $ 81,644 100.00% $ 86,874 100.00% $ 88,236 100.00%
Nonperforming Assets — Nonperforming assets include loans past due over 90 days, nonaccrual loans, other real estate, former bank premises held for sale, repossessions and other nonperforming assets we own. Our policy is to discontinue the accrual of interest on loans and leases where principal or interest is past due and remains unpaid for 90 days or more, or when an individual analysis of a borrower’s credit worthiness indicates a credit should be placed on nonperforming status, except for residential mortgage loans, which are placed on nonaccrual at the time the loan is placed in foreclosure and consumer loans that are both well secured and in the process of collection.
Nonperforming assets amounted to $46.75 million at December 31, 2013, compared to $42.27 million at December 31, 2012, and $72.48 million at December 31, 2011. During 2013, interest income on nonaccrual loans and leases would have increased by approximately $2.93 million compared to $3.58 million in 2012 if these loans and leases had earned interest at their full contractual rate.
Nonperforming assets at December 31, 2013 increased from December 31, 2012, mainly due to increases in repossessed aircraft. The increase in nonaccrual loans and leases was spread among the various loan portfolios except for decreases in commercial real estate and construction equipment financing. The largest dollar increases during the most recent year occurred in the aircraft, auto, light truck and environmental equipment and commercial portfolios.
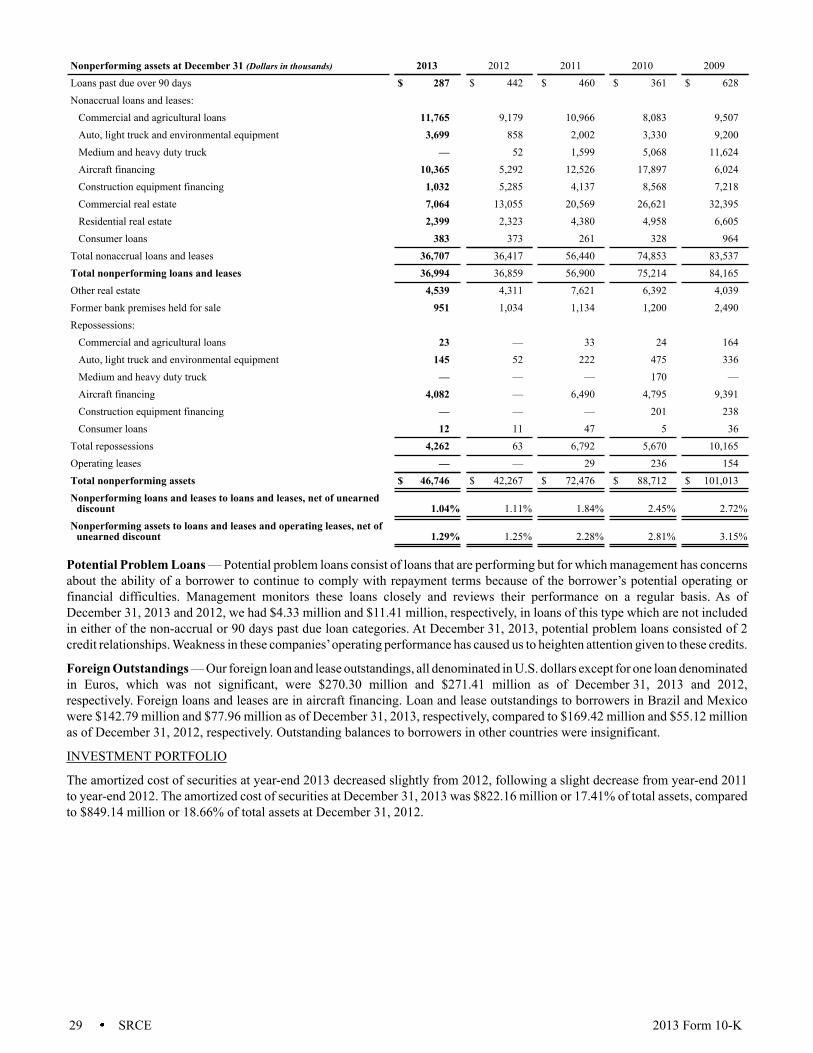
29 SRCE 2013 Form 10-K
Nonperforming assets at December 31 (Dollars in thousands) 2013 2012 2011 2010 2009Loans past due over 90 days $ 287 $ 442 $ 460 $ 361 $ 628Nonaccrual loans and leases:
Commercial and agricultural loans 11,765 9,179 10,966 8,083 9,507Auto, light truck and environmental equipment 3,699 858 2,002 3,330 9,200Medium and heavy duty truck — 52 1,599 5,068 11,624Aircraft financing 10,365 5,292 12,526 17,897 6,024Construction equipment financing 1,032 5,285 4,137 8,568 7,218Commercial real estate 7,064 13,055 20,569 26,621 32,395Residential real estate 2,399 2,323 4,380 4,958 6,605Consumer loans 383 373 261 328 964
Total nonaccrual loans and leases 36,707 36,417 56,440 74,853 83,537Total nonperforming loans and leases 36,994 36,859 56,900 75,214 84,165Other real estate 4,539 4,311 7,621 6,392 4,039Former bank premises held for sale 951 1,034 1,134 1,200 2,490Repossessions:
Commercial and agricultural loans 23 — 33 24 164Auto, light truck and environmental equipment 145 52 222 475 336Medium and heavy duty truck — — — 170 —Aircraft financing 4,082 — 6,490 4,795 9,391Construction equipment financing — — — 201 238Consumer loans 12 11 47 5 36
Total repossessions 4,262 63 6,792 5,670 10,165Operating leases — — 29 236 154Total nonperforming assets $ 46,746 $ 42,267 $ 72,476 $ 88,712 $ 101,013Nonperforming loans and leases to loans and leases, net of unearned
discount 1.04% 1.11% 1.84% 2.45% 2.72%Nonperforming assets to loans and leases and operating leases, net of
unearned discount 1.29% 1.25% 2.28% 2.81% 3.15%
Potential Problem Loans — Potential problem loans consist of loans that are performing but for which management has concerns about the ability of a borrower to continue to comply with repayment terms because of the borrower’s potential operating or financial difficulties. Management monitors these loans closely and reviews their performance on a regular basis. As of December 31, 2013 and 2012, we had $4.33 million and $11.41 million, respectively, in loans of this type which are not included in either of the non-accrual or 90 days past due loan categories. At December 31, 2013, potential problem loans consisted of 2 credit relationships. Weakness in these companies’ operating performance has caused us to heighten attention given to these credits.
Foreign Outstandings — Our foreign loan and lease outstandings, all denominated in U.S. dollars except for one loan denominated in Euros, which was not significant, were $270.30 million and $271.41 million as of December 31, 2013 and 2012, respectively. Foreign loans and leases are in aircraft financing. Loan and lease outstandings to borrowers in Brazil and Mexico were $142.79 million and $77.96 million as of December 31, 2013, respectively, compared to $169.42 million and $55.12 million as of December 31, 2012, respectively. Outstanding balances to borrowers in other countries were insignificant.
INVESTMENT PORTFOLIO
The amortized cost of securities at year-end 2013 decreased slightly from 2012, following a slight decrease from year-end 2011 to year-end 2012. The amortized cost of securities at December 31, 2013 was $822.16 million or 17.41% of total assets, compared to $849.14 million or 18.66% of total assets at December 31, 2012.
30 SRCE 2013 Form 10-K
The following table shows the amortized cost of securities available-for-sale as of December 31:
(Dollars in thousands) 2013 2012 2011U.S. Treasury and Federal agencies securities $ 394,558 $ 410,983 $ 390,819U.S. States and political subdivisions securities 120,416 100,055 101,587Mortgage-backed securities — Federal agencies 273,495 301,136 317,392Corporate debt securities 30,828 30,897 36,349Foreign government and other securities 700 3,700 4,690Marketable equity securities 2,166 2,368 2,367Total investment securities available-for-sale $ 822,163 $ 849,139 $ 853,204
Yields on tax-exempt obligations are calculated on a fully tax equivalent basis assuming a 35% tax rate. The following table shows the maturities of securities available-for-sale at December 31, 2013, at the amortized costs and weighted average yields of such securities:
(Dollars in thousands) Amount YieldU.S. Treasury and Federal agencies securities
Under 1 year $ 45,600 2.37 %1 – 5 years 300,478 1.595 – 10 years 48,480 1.55Over 10 years — —
Total U.S. Treasury and Federal agencies securities 394,558 1.67U.S. States and political subdivisions securities
Under 1 year 11,981 4.631 – 5 years 58,821 4.175 – 10 years 46,982 3.76Over 10 years 2,632 4.35
Total U.S. States and political subdivisions securities 120,416 4.06Corporate debt securities
Under 1 year 6,539 0.931 – 5 years 24,289 1.645 – 10 years — —Over 10 years — —
Total Corporate debt securities 30,828 1.49Foreign government and other securities
Under 1 year 400 1.901 – 5 years 300 1.605 – 10 years — —Over 10 years — —
Total Foreign government and other securities 700 1.77Mortgage-backed securities — Federal agencies 273,495 2.43Marketable equity securities 2,166 5.40Total investment securities available-for-sale $ 822,163 2.28%
At December 31, 2013, the residential mortgage-backed securities we held consisted primarily of GNMA, FNMA and FHLMC pass-through certificates (Government Sponsored Enterprise, GSEs). The type of loans underlying the securities were all conforming loans at the time of issuance. The underlying GSE backing these mortgage-backed securities are rated Aaa or AA+ from the rating agencies. At December 31, 2013, the vintage of the underlying loans comprising our securities are: 40% in the years 2012 and 2013; 30% in the years 2010 and 2011; 19% in the years 2008 and 2009; and 11% in years 2007 and prior.
31 SRCE 2013 Form 10-K
DEPOSITS
The following table shows the average daily amounts of deposits and rates paid on such deposits:
2013 2012 2011
(Dollars in thousands) Amount Rate Amount Rate Amount RateNoninterest bearing demand deposits $ 690,326 —% $ 616,426 —% $ 541,421 —%Interest bearing demand deposits 1,234,145 0.13 1,151,617 0.16 1,350,193 0.22Savings deposits 691,942 0.09 656,245 0.14 364,453 0.11Other time deposits 1,084,096 1.33 1,149,923 1.66 1,299,387 2.11Total deposits $ 3,700,509 $ 3,574,211 $ 3,555,454
See Part II, Item 8, Financial Statements and Supplementary Data — Note 10 of the Notes to Consolidated Financial Statements for additional information on deposits.
SHORT-TERM BORROWINGS
The following table shows the distribution of our short-term borrowings and the weighted average interest rates thereon at the end of each of the last three years. Also provided are the maximum amount of borrowings and the average amount of borrowings, as well as weighted average interest rates for the last three years.
(Dollars in thousands)
Federal FundsPurchased and
SecuritiesRepurchaseAgreements
CommercialPaper
Other Short-Term Borrowings
TotalBorrowings
2013 Balance at December 31, 2013 $ 181,120 $ 10,814 $ 122,197 $ 314,131Maximum amount outstanding at any month-end 181,120 16,552 122,197 319,869Average amount outstanding 121,294 9,035 24,475 154,804Weighted average interest rate during the year 0.11% 0.22% 0.22% 0.14%Weighted average interest rate for outstanding amounts at
December 31, 2013 0.17% 0.24% 0.28% 0.22%2012 Balance at December 31, 2012 $ 158,680 $ 3,469 $ 7,039 $ 169,188Maximum amount outstanding at any month-end 189,150 10,114 11,531 210,795Average amount outstanding 121,495 6,739 9,703 137,937Weighted average interest rate during the year 0.13 % 0.21 % — % 0.12 %Weighted average interest rate for outstanding amounts at
December 31, 2012 0.20 % 0.22 % — % 0.19 %2011 Balance at December 31, 2011 $ 106,991 $ 7,579 $ 10,664 $ 125,234Maximum amount outstanding at any month-end 144,062 8,058 16,548 168,668Average amount outstanding 129,233 5,506 14,689 149,428Weighted average interest rate during the year 0.16 % 0.30 % 0.53 % 0.20 %Weighted average interest rate for outstanding amounts at
December 31, 2011 0.14 % 0.21 % — % 0.13 %
LIQUIDITY
Core Deposits — Our major source of investable funds is provided by stable core deposits consisting of all interest bearing and noninterest bearing deposits, excluding brokered certificates of deposit and certain certificates of deposit over $250,000 in 2013 and 2012 and $100,000 in 2011 based on established FDIC insured deposits. In 2013, average core deposits equaled 78.35% of average total assets, compared to 77.32% in 2012 and 71.46% in 2011. The effective rate of core deposits in 2013 was 0.43%, compared to 0.58% in 2012 and 0.72% in 2011.
Average demand deposits (noninterest bearing core deposits) increased 11.99% in 2013 compared to an increase of 13.85% in 2012. These represented 19.12% of total core deposits in 2013, compared to 17.82% in 2012, and 17.21% in 2011.
32 SRCE 2013 Form 10-K
Purchased Funds — We use purchased funds to supplement core deposits, which include certain certificates of deposit over $250,000, brokered certificates of deposit, over-night borrowings, securities sold under agreements to repurchase, commercial paper, and other short-term borrowings. Purchased funds are raised from customers seeking short-term investments and are used to manage the Bank’s interest rate sensitivity. During 2013, our reliance on purchased funds decreased to 5.31% of average total assets from 5.67% in 2012.
Shareholders’ Equity — Average shareholders’ equity equated to 12.49% of average total assets in 2013, compared to 12.20% in 2012. Shareholders’ equity was 12.39% of total assets at year-end 2013, compared to 12.28% at year-end 2012. We include unrealized gains (losses) on available-for-sale securities, net of income taxes, in accumulated other comprehensive income (loss) which is a component of shareholders’ equity. While regulatory capital adequacy ratios exclude unrealized gains (losses), it does impact our equity as reported in the audited financial statements. The unrealized gains (losses) on available-for-sale securities, net of income taxes, were $6.58 million and $19.54 million at December 31, 2013 and 2012, respectively.
Other Liquidity — Under Indiana law governing the collateralization of public fund deposits, the Indiana Board of Depositories determines which financial institutions are required to pledge collateral based on the strength of their financial ratings. We have been informed that no collateral is required for our public fund deposits. However, the Board of Depositories could alter this requirement in the future and adversely impact our liquidity. Our potential liquidity exposure if we must pledge collateral is approximately $595 million.
Liquidity Risk Management — The Bank’s liquidity is monitored and closely managed by the Asset/Liability Management Committee (ALCO), whose members are comprised of the Bank’s senior management. Asset and liability management includes the management of interest rate sensitivity and the maintenance of an adequate liquidity position. The purpose of interest rate sensitivity management is to stabilize net interest income during periods of changing interest rates.
Liquidity management is the process by which the Bank ensures that adequate liquid funds are available to meet financial commitments on a timely basis. Financial institutions must maintain liquidity to meet day-to-day requirements of depositors and borrowers, take advantage of market opportunities and provide a cushion against unforeseen needs.
Liquidity of the Bank is derived primarily from core deposits, principal payments received on loans, the sale and maturity of investment securities, net cash provided by operating activities, and access to other funding sources. The most stable source of liability-funded liquidity is deposit growth and retention of the core deposit base. The principal source of asset-funded liquidity is available-for-sale investment securities, cash and due from banks, overnight investments, securities purchased under agreements to resell, and loans and interest bearing deposits with other banks maturing within one year. Additionally, liquidity is provided by repurchase agreements, and the ability to borrow from the Federal Reserve Bank (FRB) and the Federal Home Loan Bank (FHLB).
The Bank’s liquidity strategy is guided by internal policies and the Interagency Policy Statement on Funding and Liquidity Risk Management. Internal guidelines consist of:
(i) Available Liquidity (sum of short term borrowing capacity) greater than $500 million;
(ii) Liquidity Ratio (total of net cash, short term investments and unpledged marketable assets divided by the sum of net deposits and short term liabilities) greater than 15%;
(iii) Dependency Ratio (net potentially volatile liabilities minus short term investments divided by total earning assets minus short term investments) less than 15%; and
(iv) Loans to Deposits Ratio less than 100%
At December 31, 2013, we were in compliance with the foregoing internal policies and regulatory guidelines.
The Bank also maintains a contingency funding plan that assesses the liquidity needs under various scenarios of market conditions, asset growth and credit rating downgrades. The plan includes liquidity stress testing which measures various sources and uses of funds under the different scenarios. The contingency plan provides for ongoing monitoring of unused borrowing capacity and available sources of contingent liquidity to prepare for unexpected liquidity needs and to cover unanticipated events that could affect liquidity.
We have borrowing sources available to supplement deposits and meet our funding needs. 1st Source Bank has established relationships with several banks to provide short term borrowings in the form of federal funds purchased. While at December 31, 2013 there was $63.50 million outstanding, we could borrow approximately $201.50 million in additional funds for a short time from these banks on a collective basis. As of December 31, 2013, we had $157.98 million outstanding in FHLB advances and could borrow an additional $49.53 million. We also had $381.68 million available to borrow from the FRB with no amounts outstanding as of December 31, 2013.
33 SRCE 2013 Form 10-K
Interest Rate Risk Management — ALCO monitors and manages the relationship of earning assets to interest bearing liabilities and the responsiveness of asset yields, interest expense, and interest margins to changes in market interest rates. In the normal course of business, we face ongoing interest rate risks and uncertainties. We occasionally utilize interest rate swaps to partially manage the primary market exposures associated with the interest rate risk related to underlying assets, liabilities, and anticipated transactions.
A hypothetical change in net interest income was modeled by calculating an immediate 200 basis point (2.00%) and 100 basis point (1.00%) increase and a 100 basis point (1.00%) decrease in interest rates across all maturities. The following table shows the aggregate hypothetical impact to pre-tax net interest income at December 31, 2013 and 2012:
Percentage Change in Net Interest Income
December 31, 2013 December 31, 2012
Basis Point Interest Rate Change 12 Months 24 Months 12 Months 24 Months
Up 200 (0.81)% 3.36% 3.68% 6.92%
Up 100 (1.36)% 0.73% 0.71% 2.42%
Down 100 (1.18)% (4.45)% (1.66)% (4.33)%
The earnings simulation model excludes the earnings dynamics related to how fee income and noninterest expense may be affected by changes in interest rates. Actual results may differ materially from those projected. The use of this methodology to quantify the market risk of the balance sheet should not be construed as an endorsement of its accuracy or the accuracy of the related assumptions.
At December 31, 2013 and 2012, the impact of these hypothetical fluctuations in interest rates on our derivative holdings was not significant, and, as such, separate disclosure is not presented. We manage the interest rate risk related to mortgage loan commitments by entering into contracts for future delivery of loans with outside parties. See Part II, Item 8, Financial Statements and Supplementary Data — Note 18 of the Notes to Consolidated Financial Statements.
OFF-BALANCE SHEET ARRANGEMENTS AND CONTRACTUAL OBLIGATIONS
In the ordinary course of operations, we enter into certain contractual obligations. Such obligations include the funding of operations through debt issuances as well as leases for premises and equipment. The following table summarizes our significant fixed, determinable, and estimated contractual obligations, by payment date, at December 31, 2013, except for obligations associated with short-term borrowing arrangements. Payments for borrowings do not include interest. Further discussion of the nature of each obligation is included in the referenced note to the consolidated financial statements.
The following table shows contractual obligation payments by period:
(Dollars in thousands) Note 0 – 1 Year 1 – 3 Years 3 – 5 Years Over 5 YearsIndeterminate
maturity TotalDeposits without stated maturity — $ 2,722,805 $ — $ — $ — $ — $ 2,722,805Certificates of deposit 10 644,396 246,368 34,024 6,057 — 930,845Long-term debt 11 5,868 6,904 26,658 4,833 14,072 58,335Subordinated notes 12 — — — 58,764 — 58,764Operating leases 18 3,207 5,092 4,260 5,125 — 17,684Purchase obligations — 24,139 2,383 413 158 — 27,093Total contractual obligations $ 3,400,415 $ 260,747 $ 65,355 $ 74,937 $ 14,072 $ 3,815,526
We routinely enter into contracts for services. These contracts may require payment for services to be provided in the future and may also contain penalty clauses for early termination of the contract. We have made a diligent effort to estimate such payments and penalties, where applicable. Additionally, where necessary, we have made reasonable estimates as to certain purchase obligations as of December 31, 2013. Our management has used the best information available to make the estimations necessary to value the related purchase obligations. Our management is not aware of any additional commitments or contingent liabilities which may have a material adverse impact on our liquidity or capital resources at year-end 2013.
We also enter into derivative contracts under which we are required to either receive cash from, or pay cash to, counterparties depending on changes in interest rates. Derivative contracts are carried at fair value on the consolidated balance sheet with the fair value representing the net present value of expected future cash receipts or payments based on market interest rates as of the balance sheet date. The fair value of the contracts changes daily as market interest rates change. Because the derivative assets and liabilities recorded on the balance sheet at December 31, 2013 do not necessarily represent the amounts that may ultimately be paid under these contracts, these assets and liabilities are not included in the table of contractual obligations presented above.
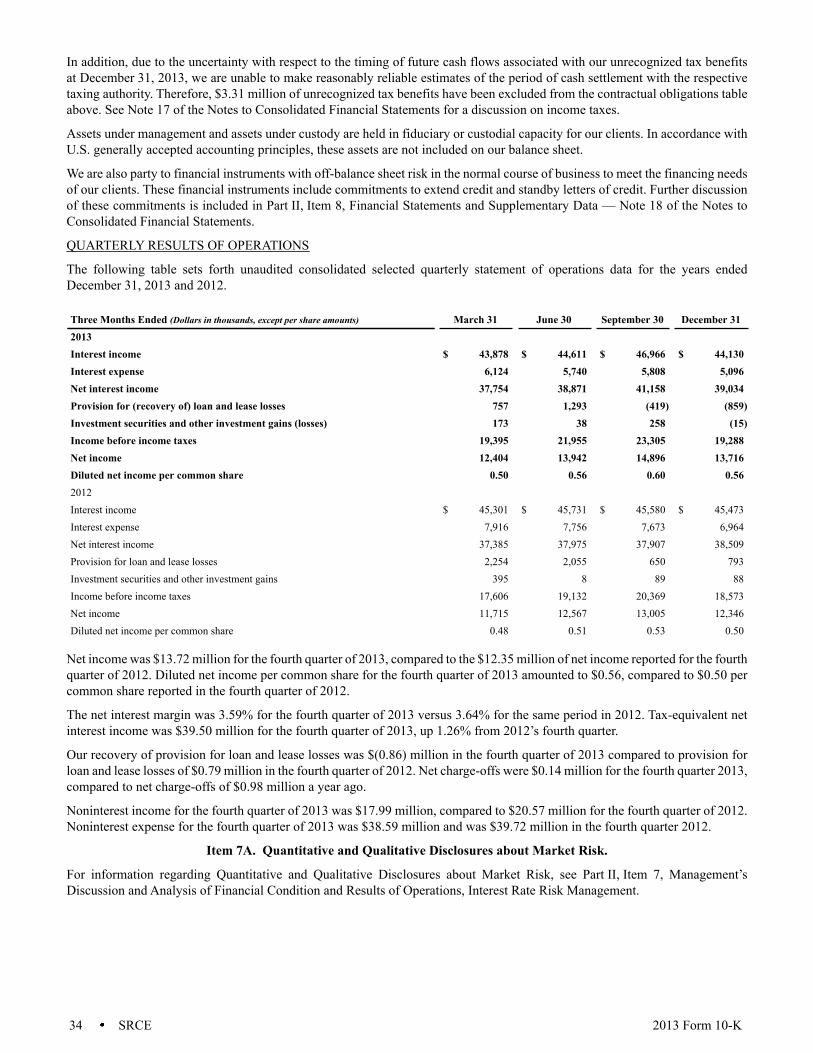
34 SRCE 2013 Form 10-K
In addition, due to the uncertainty with respect to the timing of future cash flows associated with our unrecognized tax benefits at December 31, 2013, we are unable to make reasonably reliable estimates of the period of cash settlement with the respective taxing authority. Therefore, $3.31 million of unrecognized tax benefits have been excluded from the contractual obligations table above. See Note 17 of the Notes to Consolidated Financial Statements for a discussion on income taxes.
Assets under management and assets under custody are held in fiduciary or custodial capacity for our clients. In accordance with U.S. generally accepted accounting principles, these assets are not included on our balance sheet.
We are also party to financial instruments with off-balance sheet risk in the normal course of business to meet the financing needs of our clients. These financial instruments include commitments to extend credit and standby letters of credit. Further discussion of these commitments is included in Part II, Item 8, Financial Statements and Supplementary Data — Note 18 of the Notes to Consolidated Financial Statements.
QUARTERLY RESULTS OF OPERATIONS
The following table sets forth unaudited consolidated selected quarterly statement of operations data for the years ended December 31, 2013 and 2012.
Three Months Ended (Dollars in thousands, except per share amounts) March 31 June 30 September 30 December 312013 Interest income $ 43,878 $ 44,611 $ 46,966 $ 44,130Interest expense 6,124 5,740 5,808 5,096Net interest income 37,754 38,871 41,158 39,034Provision for (recovery of) loan and lease losses 757 1,293 (419) (859)Investment securities and other investment gains (losses) 173 38 258 (15)Income before income taxes 19,395 21,955 23,305 19,288Net income 12,404 13,942 14,896 13,716Diluted net income per common share 0.50 0.56 0.60 0.562012 Interest income $ 45,301 $ 45,731 $ 45,580 $ 45,473Interest expense 7,916 7,756 7,673 6,964Net interest income 37,385 37,975 37,907 38,509Provision for loan and lease losses 2,254 2,055 650 793Investment securities and other investment gains 395 8 89 88Income before income taxes 17,606 19,132 20,369 18,573Net income 11,715 12,567 13,005 12,346Diluted net income per common share 0.48 0.51 0.53 0.50
Net income was $13.72 million for the fourth quarter of 2013, compared to the $12.35 million of net income reported for the fourth quarter of 2012. Diluted net income per common share for the fourth quarter of 2013 amounted to $0.56, compared to $0.50 per common share reported in the fourth quarter of 2012.
The net interest margin was 3.59% for the fourth quarter of 2013 versus 3.64% for the same period in 2012. Tax-equivalent net interest income was $39.50 million for the fourth quarter of 2013, up 1.26% from 2012’s fourth quarter.
Our recovery of provision for loan and lease losses was $(0.86) million in the fourth quarter of 2013 compared to provision for loan and lease losses of $0.79 million in the fourth quarter of 2012. Net charge-offs were $0.14 million for the fourth quarter 2013, compared to net charge-offs of $0.98 million a year ago.
Noninterest income for the fourth quarter of 2013 was $17.99 million, compared to $20.57 million for the fourth quarter of 2012. Noninterest expense for the fourth quarter of 2013 was $38.59 million and was $39.72 million in the fourth quarter 2012.
Item 7A. Quantitative and Qualitative Disclosures about Market Risk.
For information regarding Quantitative and Qualitative Disclosures about Market Risk, see Part II, Item 7, Management’s Discussion and Analysis of Financial Condition and Results of Operations, Interest Rate Risk Management.

35 SRCE 2013 Form 10-K
Item 8. Financial Statements and Supplementary Data.
Report of Independent Registered Public Accounting Firm
The Board of Directors and Shareholders of 1st Source Corporation
We have audited 1st Source Corporation's (the “Company's”) internal control over financial reporting as of December 31, 2013, based on criteria established in Internal Control — Integrated Framework issued by the Committee of Sponsoring Organizations of the Treadway Commission (1992 framework) (the COSO criteria). 1st Source Corporation's management is responsible for maintaining effective internal control over financial reporting, and for its assessment of the effectiveness of internal control over financial reporting included in the accompanying Management Report on Internal Control over Financial Reporting. Our responsibility is to express an opinion on the company’s internal control over financial reporting based on our audit.
We conducted our audit in accordance with the standards of the Public Company Accounting Oversight Board (United States). Those standards require that we plan and perform the audit to obtain reasonable assurance about whether effective internal control over financial reporting was maintained in all material respects. Our audit included obtaining an understanding of internal control over financial reporting, assessing the risk that a material weakness exists, testing and evaluating the design and operating effectiveness of internal control based on the assessed risk, and performing such other procedures as we considered necessary in the circumstances. We believe that our audit provides a reasonable basis for our opinion.
A company’s internal control over financial reporting is a process designed to provide reasonable assurance regarding the reliability of financial reporting and the preparation of financial statements for external purposes in accordance with generally accepted accounting principles. A company’s internal control over financial reporting includes those policies and procedures that (1) pertain to the maintenance of records that, in reasonable detail, accurately and fairly reflect the transactions and dispositions of the assets of the company; (2) provide reasonable assurance that transactions are recorded as necessary to permit preparation of financial statements in accordance with generally accepted accounting principles, and that receipts and expenditures of the company are being made only in accordance with authorizations of management and directors of the company; and (3) provide reasonable assurance regarding prevention or timely detection of unauthorized acquisition, use or disposition of the company’s assets that could have a material effect on the financial statements.
Because of its inherent limitations, internal control over financial reporting may not prevent or detect misstatements. Also, projections of any evaluation of effectiveness to future periods are subject to the risk that controls may become inadequate because of changes in conditions, or that the degree of compliance with the policies or procedures may deteriorate.
In our opinion, 1st Source Corporation maintained, in all material respects, effective internal control over financial reporting as of December 31, 2013 based on the COSO criteria.
We also have audited, in accordance with the standards of the Public Company Accounting Oversight Board (United States), the consolidated statements of financial condition of 1st Source Corporation as of December 31, 2013 and 2012, and the related consolidated statements of income, comprehensive income, shareholders’ equity and cash flows for each of the three years in the period ended December 31, 2013 and our report dated February 21, 2014 expressed an unqualified opinion thereon.
/s/ Ernst & Young LLP
Chicago, IllinoisFebruary 21, 2014
36 SRCE 2013 Form 10-K
Report of Independent Registered Public Accounting Firm
The Board of Directors and Shareholders of 1st Source Corporation and Subsidiaries
We have audited the accompanying consolidated statements of financial condition of 1st Source Corporation and subsidiaries (“the Company”) as of December 31, 2013 and 2012, and the related consolidated statements of income, comprehensive income, shareholders’ equity, and cash flows for each of the three years in the period ended December 31, 2013. These financial statements are the responsibility of the Company’s management. Our responsibility is to express an opinion on these financial statements based on our audits.
We conducted our audits in accordance with the standards of the Public Company Accounting Oversight Board (United States). Those standards require that we plan and perform the audit to obtain reasonable assurance about whether the financial statements are free of material misstatement. An audit includes examining, on a test basis, evidence supporting the amounts and disclosures in the financial statements. An audit also includes assessing the accounting principles used and significant estimates made by management, as well as evaluating the overall financial statement presentation. We believe that our audits provide a reasonable basis for our opinion.
In our opinion, the financial statements referred to above present fairly, in all material respects, the consolidated financial position of 1st Source Corporation and subsidiaries at December 31, 2013 and 2012, and the consolidated results of their operations and their cash flows for each of the three years in the period ended December 31, 2013, in conformity with U.S. generally accepted accounting principles.
We also have audited, in accordance with the standards of the Public Company Accounting Oversight Board (United States), 1st Source Corporation’s internal control over financial reporting as of December 31, 2013, based on criteria established in Internal Control-Integrated Framework issued by the Committee of Sponsoring Organizations of the Treadway Commission (1992 framework) (the COSO criteria) and our report dated February 21, 2014 expressed an unqualified opinion thereon.
/s/ Ernst & Young LLP
Chicago, IllinoisFebruary 21, 2014
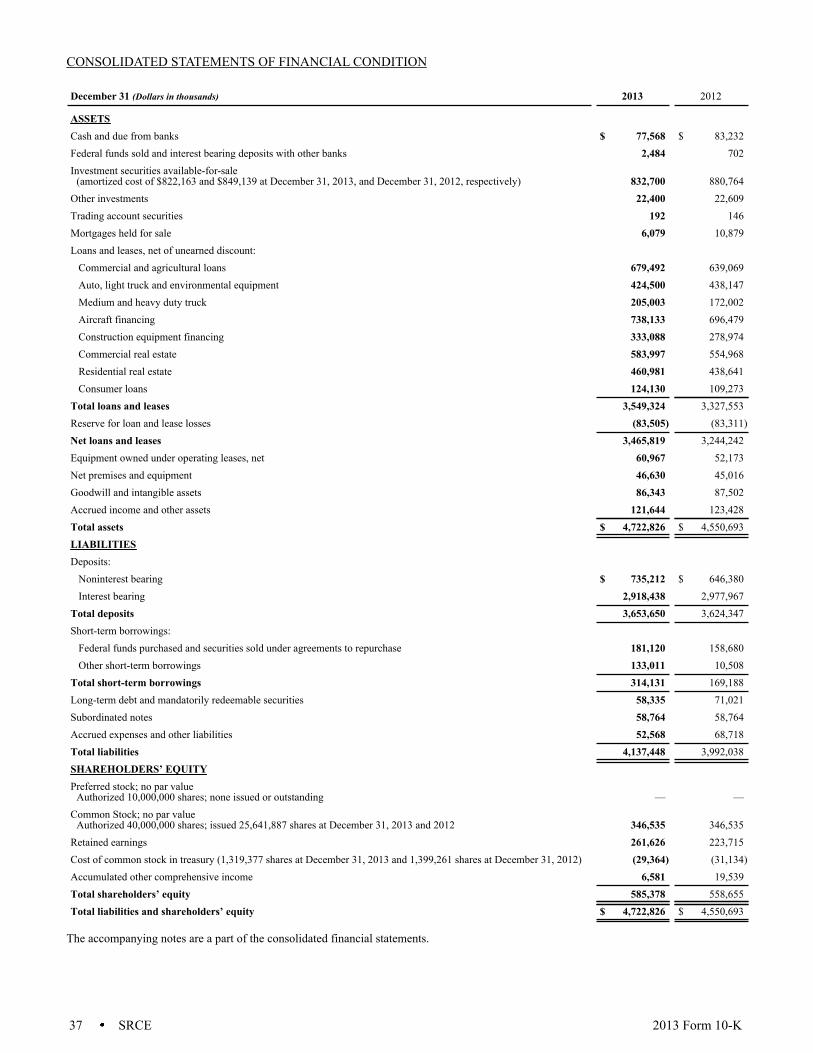
37 SRCE 2013 Form 10-K
CONSOLIDATED STATEMENTS OF FINANCIAL CONDITION
December 31 (Dollars in thousands) 2013 2012
ASSETS Cash and due from banks $ 77,568 $ 83,232Federal funds sold and interest bearing deposits with other banks 2,484 702Investment securities available-for-sale
(amortized cost of $822,163 and $849,139 at December 31, 2013, and December 31, 2012, respectively) 832,700 880,764Other investments 22,400 22,609Trading account securities 192 146Mortgages held for sale 6,079 10,879Loans and leases, net of unearned discount:
Commercial and agricultural loans 679,492 639,069Auto, light truck and environmental equipment 424,500 438,147Medium and heavy duty truck 205,003 172,002Aircraft financing 738,133 696,479Construction equipment financing 333,088 278,974Commercial real estate 583,997 554,968Residential real estate 460,981 438,641Consumer loans 124,130 109,273
Total loans and leases 3,549,324 3,327,553Reserve for loan and lease losses (83,505) (83,311)Net loans and leases 3,465,819 3,244,242Equipment owned under operating leases, net 60,967 52,173Net premises and equipment 46,630 45,016Goodwill and intangible assets 86,343 87,502Accrued income and other assets 121,644 123,428Total assets $ 4,722,826 $ 4,550,693LIABILITIES Deposits: Noninterest bearing $ 735,212 $ 646,380Interest bearing 2,918,438 2,977,967
Total deposits 3,653,650 3,624,347Short-term borrowings:
Federal funds purchased and securities sold under agreements to repurchase 181,120 158,680Other short-term borrowings 133,011 10,508
Total short-term borrowings 314,131 169,188Long-term debt and mandatorily redeemable securities 58,335 71,021Subordinated notes 58,764 58,764Accrued expenses and other liabilities 52,568 68,718Total liabilities 4,137,448 3,992,038SHAREHOLDERS’ EQUITY Preferred stock; no par value
Authorized 10,000,000 shares; none issued or outstanding — —Common Stock; no par value
Authorized 40,000,000 shares; issued 25,641,887 shares at December 31, 2013 and 2012 346,535 346,535Retained earnings 261,626 223,715Cost of common stock in treasury (1,319,377 shares at December 31, 2013 and 1,399,261 shares at December 31, 2012) (29,364) (31,134)Accumulated other comprehensive income 6,581 19,539Total shareholders’ equity 585,378 558,655Total liabilities and shareholders’ equity $ 4,722,826 $ 4,550,693
The accompanying notes are a part of the consolidated financial statements.
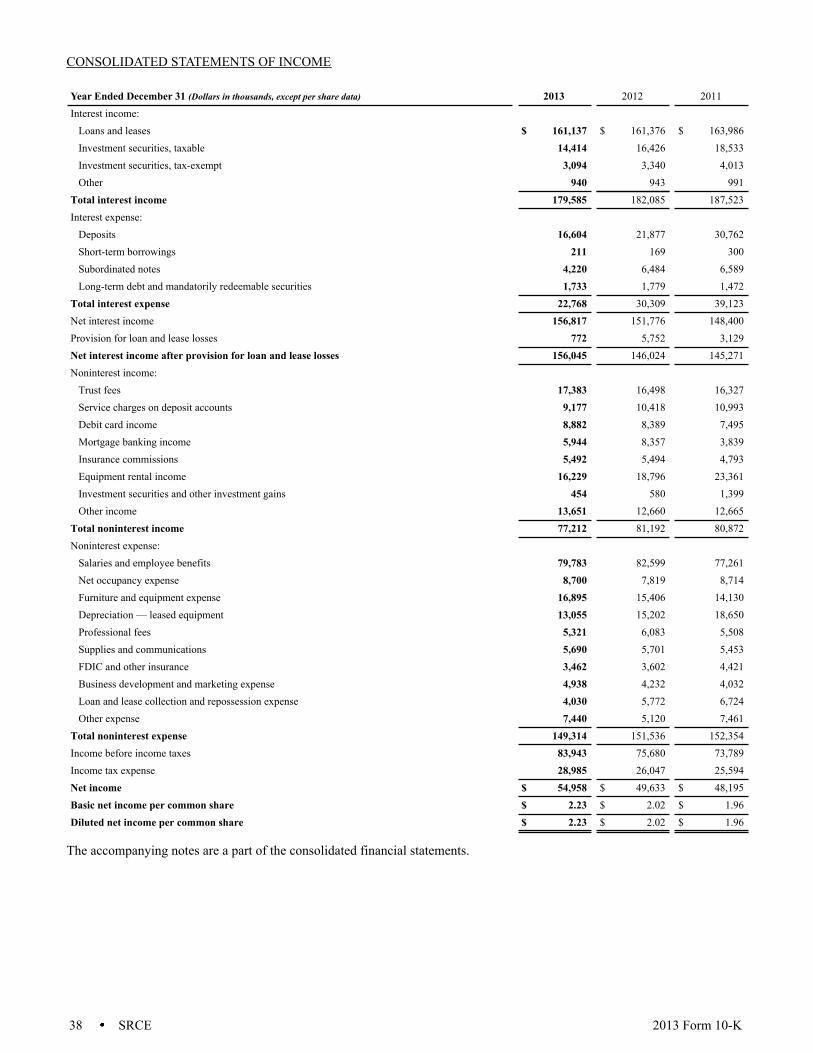
38 SRCE 2013 Form 10-K
CONSOLIDATED STATEMENTS OF INCOME
Year Ended December 31 (Dollars in thousands, except per share data) 2013 2012 2011Interest income:
Loans and leases $ 161,137 $ 161,376 $ 163,986Investment securities, taxable 14,414 16,426 18,533Investment securities, tax-exempt 3,094 3,340 4,013Other 940 943 991
Total interest income 179,585 182,085 187,523Interest expense:
Deposits 16,604 21,877 30,762Short-term borrowings 211 169 300Subordinated notes 4,220 6,484 6,589Long-term debt and mandatorily redeemable securities 1,733 1,779 1,472
Total interest expense 22,768 30,309 39,123Net interest income 156,817 151,776 148,400Provision for loan and lease losses 772 5,752 3,129Net interest income after provision for loan and lease losses 156,045 146,024 145,271Noninterest income:
Trust fees 17,383 16,498 16,327Service charges on deposit accounts 9,177 10,418 10,993Debit card income 8,882 8,389 7,495Mortgage banking income 5,944 8,357 3,839Insurance commissions 5,492 5,494 4,793Equipment rental income 16,229 18,796 23,361Investment securities and other investment gains 454 580 1,399Other income 13,651 12,660 12,665
Total noninterest income 77,212 81,192 80,872Noninterest expense:
Salaries and employee benefits 79,783 82,599 77,261Net occupancy expense 8,700 7,819 8,714Furniture and equipment expense 16,895 15,406 14,130Depreciation — leased equipment 13,055 15,202 18,650Professional fees 5,321 6,083 5,508Supplies and communications 5,690 5,701 5,453FDIC and other insurance 3,462 3,602 4,421Business development and marketing expense 4,938 4,232 4,032Loan and lease collection and repossession expense 4,030 5,772 6,724Other expense 7,440 5,120 7,461
Total noninterest expense 149,314 151,536 152,354Income before income taxes 83,943 75,680 73,789Income tax expense 28,985 26,047 25,594Net income $ 54,958 $ 49,633 $ 48,195Basic net income per common share $ 2.23 $ 2.02 $ 1.96Diluted net income per common share $ 2.23 $ 2.02 $ 1.96
The accompanying notes are a part of the consolidated financial statements.
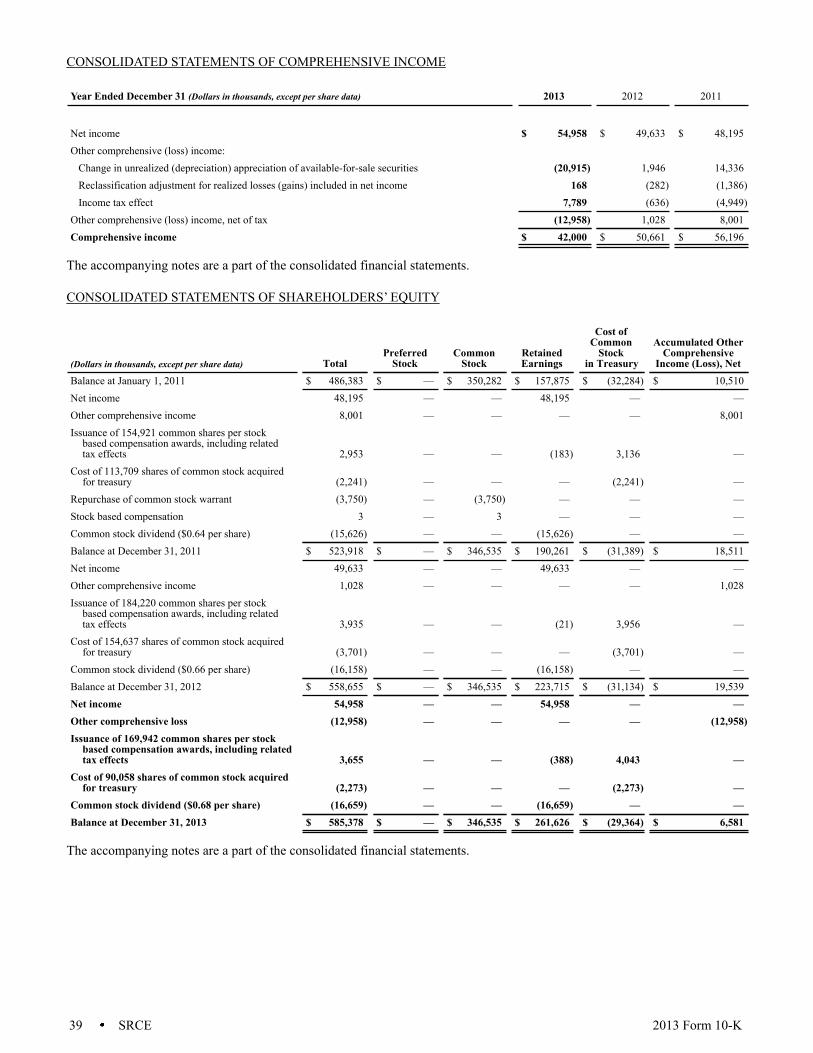
39 SRCE 2013 Form 10-K
CONSOLIDATED STATEMENTS OF COMPREHENSIVE INCOME
Year Ended December 31 (Dollars in thousands, except per share data) 2013 2012 2011
Net income $ 54,958 $ 49,633 $ 48,195Other comprehensive (loss) income:
Change in unrealized (depreciation) appreciation of available-for-sale securities (20,915) 1,946 14,336Reclassification adjustment for realized losses (gains) included in net income 168 (282) (1,386)Income tax effect 7,789 (636) (4,949)
Other comprehensive (loss) income, net of tax (12,958) 1,028 8,001Comprehensive income $ 42,000 $ 50,661 $ 56,196
The accompanying notes are a part of the consolidated financial statements.
CONSOLIDATED STATEMENTS OF SHAREHOLDERS’ EQUITY
(Dollars in thousands, except per share data) TotalPreferred
StockCommon
StockRetainedEarnings
Cost ofCommon
Stockin Treasury
Accumulated OtherComprehensive
Income (Loss), NetBalance at January 1, 2011 $ 486,383 $ — $ 350,282 $ 157,875 $ (32,284) $ 10,510Net income 48,195 — — 48,195 — —Other comprehensive income 8,001 — — — — 8,001Issuance of 154,921 common shares per stock
based compensation awards, including relatedtax effects 2,953 — — (183) 3,136 —
Cost of 113,709 shares of common stock acquiredfor treasury (2,241) — — — (2,241) —
Repurchase of common stock warrant (3,750) — (3,750) — — —Stock based compensation 3 — 3 — — —Common stock dividend ($0.64 per share) (15,626) — — (15,626) — —Balance at December 31, 2011 $ 523,918 $ — $ 346,535 $ 190,261 $ (31,389) $ 18,511Net income 49,633 — — 49,633 — —Other comprehensive income 1,028 — — — — 1,028Issuance of 184,220 common shares per stock
based compensation awards, including relatedtax effects 3,935 — — (21) 3,956 —
Cost of 154,637 shares of common stock acquiredfor treasury (3,701) — — — (3,701) —
Common stock dividend ($0.66 per share) (16,158) — — (16,158) — —Balance at December 31, 2012 $ 558,655 $ — $ 346,535 $ 223,715 $ (31,134) $ 19,539Net income 54,958 — — 54,958 — —Other comprehensive loss (12,958) — — — — (12,958)Issuance of 169,942 common shares per stock
based compensation awards, including relatedtax effects 3,655 — — (388) 4,043 —
Cost of 90,058 shares of common stock acquiredfor treasury (2,273) — — — (2,273) —
Common stock dividend ($0.68 per share) (16,659) — — (16,659) — —Balance at December 31, 2013 $ 585,378 $ — $ 346,535 $ 261,626 $ (29,364) $ 6,581
The accompanying notes are a part of the consolidated financial statements.
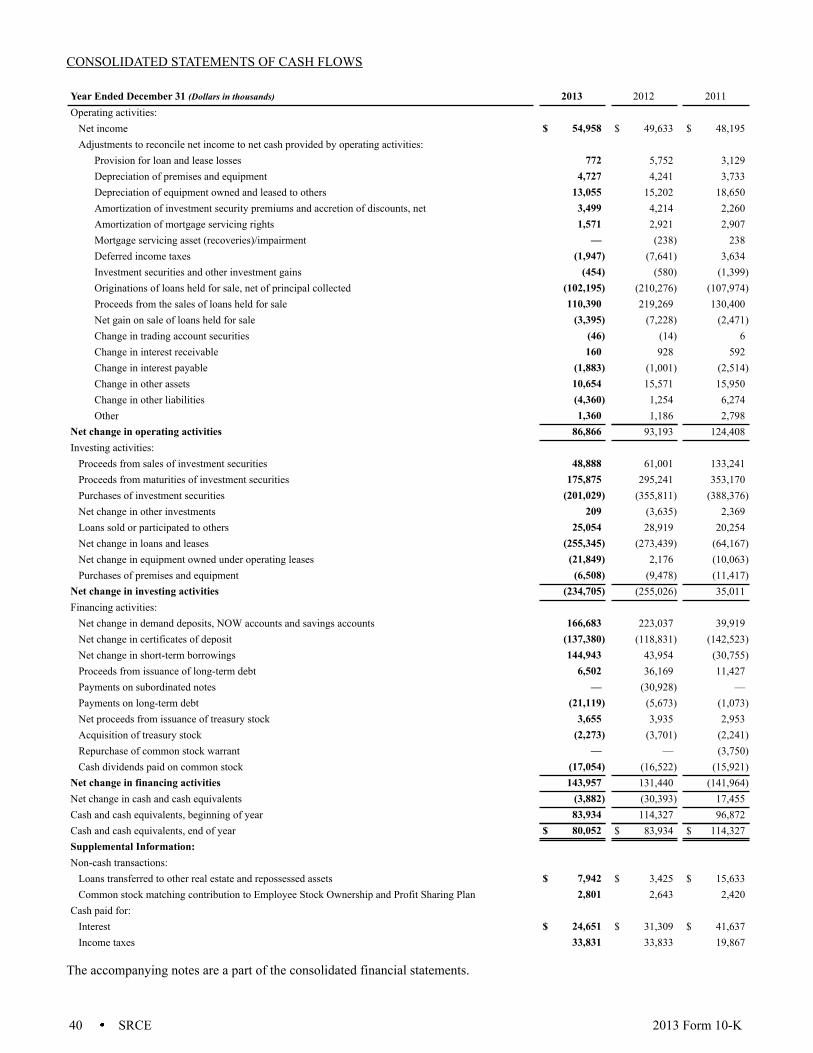
40 SRCE 2013 Form 10-K
CONSOLIDATED STATEMENTS OF CASH FLOWS
Year Ended December 31 (Dollars in thousands) 2013 2012 2011Operating activities: Net income $ 54,958 $ 49,633 $ 48,195Adjustments to reconcile net income to net cash provided by operating activities:
Provision for loan and lease losses 772 5,752 3,129Depreciation of premises and equipment 4,727 4,241 3,733Depreciation of equipment owned and leased to others 13,055 15,202 18,650Amortization of investment security premiums and accretion of discounts, net 3,499 4,214 2,260Amortization of mortgage servicing rights 1,571 2,921 2,907Mortgage servicing asset (recoveries)/impairment — (238) 238Deferred income taxes (1,947) (7,641) 3,634Investment securities and other investment gains (454) (580) (1,399)Originations of loans held for sale, net of principal collected (102,195) (210,276) (107,974)Proceeds from the sales of loans held for sale 110,390 219,269 130,400Net gain on sale of loans held for sale (3,395) (7,228) (2,471)Change in trading account securities (46) (14) 6Change in interest receivable 160 928 592Change in interest payable (1,883) (1,001) (2,514)Change in other assets 10,654 15,571 15,950Change in other liabilities (4,360) 1,254 6,274Other 1,360 1,186 2,798
Net change in operating activities 86,866 93,193 124,408Investing activities:
Proceeds from sales of investment securities 48,888 61,001 133,241Proceeds from maturities of investment securities 175,875 295,241 353,170Purchases of investment securities (201,029) (355,811) (388,376)Net change in other investments 209 (3,635) 2,369Loans sold or participated to others 25,054 28,919 20,254Net change in loans and leases (255,345) (273,439) (64,167)Net change in equipment owned under operating leases (21,849) 2,176 (10,063)Purchases of premises and equipment (6,508) (9,478) (11,417)Net change in investing activities (234,705) (255,026) 35,011Financing activities: Net change in demand deposits, NOW accounts and savings accounts 166,683 223,037 39,919Net change in certificates of deposit (137,380) (118,831) (142,523)Net change in short-term borrowings 144,943 43,954 (30,755)Proceeds from issuance of long-term debt 6,502 36,169 11,427Payments on subordinated notes — (30,928) —Payments on long-term debt (21,119) (5,673) (1,073)Net proceeds from issuance of treasury stock 3,655 3,935 2,953Acquisition of treasury stock (2,273) (3,701) (2,241)Repurchase of common stock warrant — — (3,750)Cash dividends paid on common stock (17,054) (16,522) (15,921)Net change in financing activities 143,957 131,440 (141,964)Net change in cash and cash equivalents (3,882) (30,393) 17,455Cash and cash equivalents, beginning of year 83,934 114,327 96,872Cash and cash equivalents, end of year $ 80,052 $ 83,934 $ 114,327Supplemental Information: Non-cash transactions:
Loans transferred to other real estate and repossessed assets $ 7,942 $ 3,425 $ 15,633Common stock matching contribution to Employee Stock Ownership and Profit Sharing Plan 2,801 2,643 2,420
Cash paid for: Interest $ 24,651 $ 31,309 $ 41,637Income taxes 33,831 33,833 19,867
The accompanying notes are a part of the consolidated financial statements.
41 SRCE 2013 Form 10-K
NOTES TO CONSOLIDATED FINANCIAL STATEMENTS
Note 1 — Accounting Policies
1st Source Corporation is a bank holding company headquartered in South Bend, Indiana that provides, through its subsidiaries (collectively referred to as “1st Source” or “the Company”), a broad array of financial products and services. 1st Source Bank (“Bank”), its banking subsidiary, offers commercial and consumer banking services, trust and investment management services, and insurance to individual and business clients in Indiana and Michigan. The following is a summary of significant accounting policies followed in the preparation of the consolidated financial statements.
Basis of Presentation — The financial statements consolidate 1st Source and its subsidiaries (principally the Bank). All significant intercompany balances and transactions have been eliminated. For purposes of the parent company only financial information presented in Note 22, investments in subsidiaries are carried at equity in the underlying net assets.
Use of Estimates in the Preparation of Financial Statements — Financial statements prepared in accordance with U.S. generally accepted accounting principles (GAAP) require the Company to make estimates and assumptions that affect the reported amounts of assets and liabilities and disclosure of contingent assets and liabilities at the date of the financial statements and the reported amounts of income and expenses during the reporting period. Actual results could differ from those estimates.
Business Combinations — Business combinations are accounted for under the purchase method of accounting. Under the purchase method, assets and liabilities of the business acquired are recorded at their estimated fair values as of the date of acquisition with any excess of the cost of the acquisition over the fair value of the net tangible and intangible assets acquired recorded as goodwill. Results of operations of the acquired business are included in the income statement from the date of acquisition.
Cash Flows — For purposes of the consolidated and parent company only statements of cash flows, the Company considers cash and due from banks, federal funds sold and interest bearing deposits with other banks with original maturities of three months or less as cash and cash equivalents.
Securities — Securities that the Company has the ability and positive intent to hold to maturity are classified as investment securities held-to-maturity. Held-to-maturity investment securities, when present, are carried at amortized cost. As of December 31, 2013 and 2012, the Company held no securities classified as held-to-maturity. Securities that may be sold in response to, or in anticipation of, changes in interest rates and resulting prepayment risk, or for other factors, are classified as available-for-sale and are carried at fair value. Unrealized gains and losses on these securities are reported, net of applicable taxes, as a separate component of accumulated other comprehensive income (loss) in shareholders’ equity.
The initial indication of other-than-temporary impairment (OTTI) for both debt and equity securities is a decline in fair value below amortized cost. Quarterly, any impaired securities are analyzed on a qualitative and quantitative basis in determining OTTI. Declines in the fair value of available-for-sale debt securities below their cost that are deemed to be other-than-temporary are reflected in earnings as realized losses to the extent the impairment is related to credit losses. The amount of impairment related to other factors is recognized in other comprehensive income. In estimating OTTI impairment losses, the Company considers among other things, (i) the length of time and the extent to which fair value has been less than cost, (ii) the financial condition and near-term prospects of the issuer, and (iii) whether it is more likely than not that the Company will not have to sell any such securities before an anticipated recovery of cost.
Debt and equity securities that are purchased and held principally for the purpose of selling them in the near term are classified as trading account securities and are carried at fair value with unrealized gains and losses reported in earnings. Realized gains and losses on the sales of all securities are reported in earnings and computed using the specific identification cost basis.
Other investments consist of shares of Federal Home Loan Bank of Indianapolis (FHLBI) and Federal Reserve Bank stock. As restricted member stocks, these investments are carried at cost. Both cash and stock dividends received on the stocks are reported as income. Quarterly, the Company reviews its investment in FHLBI for impairment. Factors considered in determining impairment are: history of dividend payments; determination of cause for any net loss; adequacy of capital; and review of the most recent financial statements. As of December 31, 2013 and 2012, it was determined that the Company’s investment in FHLBI stock is appropriately valued at cost, which equates to par value. In addition, other investments include interest bearing deposits with other banks with original maturities of greater than three months. These investments are in denominations, including accrued interest, that are fully insured by the FDIC.
Loans and Leases — Loans are stated at the principal amount outstanding, net of unamortized deferred loan origination fees and costs and net of unearned income. Interest income is accrued as earned based on unpaid principal balances. Origination fees and direct loan and lease origination costs are deferred and the net amount amortized to interest income over the estimated life of the related loan or lease. Loan commitment fees are deferred and amortized into other income over the commitment period.
Direct financing leases are carried at the aggregate of lease payments plus estimated residual value of the leased property, net of unamortized deferred lease origination fees and costs and unearned income. Interest income on direct financing leases is recognized over the term of the lease to achieve a constant periodic rate of return on the outstanding investment.
42 SRCE 2013 Form 10-K
The accrual of interest on loans and leases is discontinued when a loan or lease becomes contractually delinquent for 90 days, or when an individual analysis of a borrower’s credit worthiness indicates a credit should be placed on nonperforming status, except for residential mortgage loans and consumer loans that are well secured and in the process of collection. Residential mortgage loans are placed on nonaccrual at the time the loan is placed in foreclosure. When interest accruals are discontinued, interest credited to income in the current year is reversed and interest accrued in the prior year is charged to the reserve for loan and lease losses. However, in some cases, the Company may elect to continue the accrual of interest when the net realizable value of collateral is sufficient to cover the principal and accrued interest. When a loan or lease is classified as nonaccrual and the future collectibility of the recorded loan or lease balance is doubtful, collections on interest and principal are applied as a reduction to principal outstanding. Loans are returned to accrual status when all principal and interest amounts contractually due are brought current and future payments are reasonably assured, which is typically evidenced by a sustained repayment performance of at least six months.
A loan or lease is considered impaired, based on current information and events, if it is probable that the Company will be unable to collect the scheduled payments of principal or interest when due according to the contractual terms of the loan or lease agreement. Interest on impaired loans and leases, which are not classified as nonaccrual, is recognized on the accrual basis. The Company evaluates loans and leases exceeding $100,000 for impairment and establishes a specific reserve as a component of the reserve for loan and lease losses when it is probable all amounts due will not be collected pursuant to the contractual terms of the loan or lease and the recorded investment in the loan or lease exceeds its fair value.
Loans and leases that have been modified and economic concessions have been granted to borrowers who have experienced financial difficulties are considered a troubled debt restructuring (TDR) and, by definition, are deemed an impaired loan. These concessions typically result from the Company’s loss mitigation activities and may include reductions in the interest rate, payment extensions, forgiveness of principal, forbearance or other actions. Certain TDRs are classified as nonperforming at the time of restructuring and typically are returned to performing status after considering the borrower’s sustained repayment performance for a reasonable period of at least six months.
When the Company modifies loans and leases in a TDR, it evaluates any possible impairment similar to other impaired loans based on the present value of expected future cash flows, discounted at the contractual interest rate of the original loan or lease agreement, or uses the current fair value of the collateral, less selling costs for collateral dependent loans. If the Company determines that the value of the modified loan is less than the recorded investment in the loan (net of previous charge-offs, deferred loan fees or costs and unamortized premium or discount), impairment is recognized through a reserve for loan and lease losses estimate or a charge-off to the reserve for loan and lease losses. In periods subsequent to modification, the Company evaluates all TDRs, including those that have payment defaults, for possible impairment and recognizes impairment through the reserve for loan and lease losses.
The Company sells mortgage loans to the Government National Mortgage Association (GNMA) in the normal course of business and retains the servicing rights. The GNMA programs under which the loans are sold allow the Company to repurchase individual delinquent loans that meet certain criteria from the securitized loan pool. At its option, and without GNMA’s prior authorization, the Company may repurchase a delinquent loan for an amount equal to 100% of the remaining principal balance on the loan. Once the Company has the unconditional ability to repurchase a delinquent loan, the Company is deemed to have regained effective control over the loan and the Company is required to recognize the loan on its balance sheet and record an offsetting liability, regardless of its intent to repurchase the loan. At December 31, 2013 and 2012, residential real estate portfolio loans included $6.73 million and $7.04 million, respectively, of loans available for repurchase under the GNMA optional repurchase programs with the offsetting liability recorded within other short-term borrowings.
Mortgage Banking Activities — Loans held for sale are composed of performing one-to-four family residential mortgage loans originated for resale. Mortgage loans originated with the intent to sell are carried at fair value.
The Company recognizes the rights to service mortgage loans for others as separate assets, whether the servicing rights are acquired through a separate purchase or through the sale of originated loans with servicing rights retained. The Company allocates a portion of the total proceeds of a mortgage loan to servicing rights based on the relative fair value. These assets are amortized as reductions of mortgage servicing fee income over the estimated servicing period in proportion to the estimated servicing income to be received. Gains and losses on the sale of mortgage servicing rights are recognized in Noninterest Income on the Statements of Income in the period in which such rights are sold.
Mortgage servicing assets are evaluated for impairment at each reporting date. For purposes of impairment measurement, mortgage servicing assets are stratified based on the predominant risk characteristics of the underlying servicing, principally by loan type. If temporary impairment exists within a tranche, a valuation allowance is established through a charge to income equal to the amount by which the carrying value exceeds the fair value. If it is later determined all or a portion of the temporary impairment no longer exists for a particular tranche, the valuation allowance is reduced through a recovery of income.
43 SRCE 2013 Form 10-K
Mortgage servicing assets are also reviewed for other-than-temporary impairment. Other-than-temporary impairment exists when recoverability of a recorded valuation allowance is determined to be remote considering historical and projected interest rates, prepayments, and loan pay-off activity. When this situation occurs, the unrecoverable portion of the valuation allowance is applied as a direct write-down to the carrying value of the mortgage servicing asset. Unlike a valuation allowance, a direct write-down permanently reduces the carrying value of the mortgage servicing asset and the valuation allowance, precluding subsequent recoveries.
As part of mortgage banking operations, the Company enters into commitments to originate loans whereby the interest rate on these loans is determined prior to funding (“rate lock commitments”). Similar to loans held for sale, the fair value of rate lock commitments is subject to change primarily due to changes in interest rates. Under the Company’s risk management policy, these fair values are hedged primarily by selling forward contracts on agency securities. The rate lock commitments on mortgage loans intended to be sold and the related hedging instruments are recorded at fair value with changes in fair value recorded in current earnings.
Reserve for Loan and Lease Losses — The reserve for loan and lease losses is maintained at a level believed to be appropriate by the Company to absorb probable losses inherent in the loan and lease portfolio. The determination of the reserve requires significant judgment reflecting the Company’s best estimate of probable loan and lease losses related to specifically identified impaired loans and leases as well as probable losses in the remainder of the various loan and lease portfolios. For purposes of determining the reserve, the Company has segmented loans and leases into classes based on the associated risk within these segments. The Company has determined that eight classes exist within the loan and lease portfolio. The methodology for assessing the appropriateness of the reserve consists of several key elements, which include: specific reserves for impaired loans, formula reserves for each business lending division portfolio including percentage allocations for special attention loans and leases not deemed impaired, and reserves for pooled homogenous loans and leases. The Company’s evaluation is based upon a continuing review of these portfolios, estimates of customer performance, collateral values and dispositions, and assessments of economic and geopolitical events, all of which are subject to judgment and will change.
Specific reserves are established for certain business and specialty finance credits based on a regular analysis of special attention loans and leases. This analysis is performed by the Credit Policy Committee, the Loan Review Department, Credit Administration, and the Loan Workout Departments. The specific reserves are based on an analysis of underlying collateral values, cash flow considerations and, if applicable, guarantor capacity. Sources for determining collateral values include appraisals, evaluations, auction values and industry guides. Generally, for loans secured by commercial real estate and dependent on cash flows from the underlying collateral to service the debt, a new appraisal is obtained at the time the credit is deemed to be impaired. For non-income producing commercial real estate, an appraisal or evaluation is ordered depending on an analysis of the underlying factors, including an assessment of the overall credit worthiness of the borrower, the value of non-real estate collateral supporting the transaction and the date of the most recent existing appraisal or evaluation. An evaluation may be performed in lieu of obtaining a new appraisal for less complex transactions secured by local market properties. Values based on evaluations are discounted more heavily than those determined by appraisals when calculating loan impairment. Appraisals, evaluations and industry guides are used to determine aircraft values. Appraisals, industry guides and auction values are used to determine construction equipment, truck and auto values.
The formula reserves determined for each business lending division portfolio are calculated quarterly by applying loss factors to outstanding loans and leases based upon a review of historical loss experience and qualitative factors, which include but are not limited to, economic trends, current market risk assessment by industry, recent loss experience in particular segments of the portfolios, movement in equipment values collateralizing specialized industry portfolios, concentrations of credit, delinquencies, trends in volume, experience and depth of relationship managers and division management, and the effects of changes in lending policies and practices, including changes in quality of the loan and lease origination, servicing and risk management processes. Special attention loans and leases without specific reserves receive a higher percentage allocation ratio than credits not considered special attention.
Pooled loans and leases are smaller credits and are homogenous in nature, such as consumer credits and residential mortgages. Pooled loan and lease loss reserves are based on historical net charge-offs, adjusted for delinquencies, the effects of lending practices and programs and current economic conditions, and current trends in the geographic markets which the Company serves.
A comprehensive analysis of the reserve is performed on a quarterly basis by reviewing all loans and leases over a fixed dollar amount ($100,000) where the internal credit quality grade is at or below a predetermined classification. Although the Company determines the amount of each element of the reserve separately and relies on this process as an important credit management tool, the entire reserve is available for the entire loan and lease portfolio. The actual amount of losses incurred can vary significantly from the estimated amounts both positively and negatively. The Company’s methodology includes several factors intended to minimize the difference between estimated and actual losses. These factors allow the Company to adjust its estimate of losses based on the most recent information available.
44 SRCE 2013 Form 10-K
Impaired loans are reviewed quarterly to assess the probability of being able to collect the portion considered impaired. When a review and analysis of the underlying credit and collateral indicates ultimate collection is improbable, the deficiency is charged-off and deducted from the reserve. Loans and leases, which are deemed uncollectible or have a low likelihood of collection, are charged off and deducted from the reserve, while recoveries of amounts previously charged off are credited to the reserve. A (recovery of) provision for loan and lease losses is credited or charged to operations based on the Company’s periodic evaluation of the factors previously mentioned, as well as other pertinent factors.
Equipment Owned Under Operating Leases — The Company finances various types of construction equipment, medium and heavy duty trucks, automobiles and other equipment under leases classified as operating leases. The equipment underlying the operating leases is reported at cost, net of accumulated depreciation, in the Statements of Financial Condition. These operating lease arrangements require the lessee to make a fixed monthly rental payment over a specified lease term generally ranging from three to seven years. Revenue consists of the contractual lease payments and is recognized on a straight-line basis over the lease term and reported as noninterest income. Leased assets are being depreciated on a straight-line method over the lease term to the estimate of the equipment’s fair market value at lease termination, also referred to as “residual” value. The depreciation of these operating lease assets is reported as Noninterest Expense on the Statements of Income. For automobile leases, fair value is based upon published industry market guides. For other equipment leases, fair value may be based upon observable market prices, third-party valuations, or prices received on sales of similar assets at the end of the lease term. These residual values are reviewed periodically to ensure the recorded amount does not exceed the fair market value at the lease termination. At the end of the lease, the operating lease asset is either purchased by the lessee or returned to the Company.
Other Real Estate — Other real estate acquired through partial or total satisfaction of nonperforming loans is included in Other Assets and recorded at fair value less anticipated selling costs based upon the property’s appraised value at the date of transfer, with any difference between the fair value of the property less cost to sell, and the carrying value of the loan charged to the reserve for loan losses or other income, if a positive adjustment. Other real estate also includes bank premises qualifying as held for sale. Bank premises are transferred at the lower of fair value less anticipated selling costs. Subsequent fair value write-downs or write-ups, to the extent of previous write-downs, property maintenance costs, and gains or losses recognized upon the sale of other real estate are recognized in Noninterest Expense on the Statements of Income. Gains or losses resulting from the sale of other real estate are recognized on the date of sale. As of December 31, 2013 and 2012, other real estate had carrying values of $5.49 million and $5.35 million, respectively, and is included in Other Assets in the Statements of Financial Condition.
Repossessed Assets — Repossessed assets may include fixtures and equipment, inventory and receivables, aircraft, construction equipment, and vehicles acquired from business banking and specialty finance activities. Repossessed assets are included in Other Assets at fair value of the equipment or vehicle less estimated selling costs. At the time of repossession, the recorded amount of the loan or lease is written down to the fair value of the equipment or vehicle by a charge to the reserve for loan and lease losses or other income, if a positive adjustment. Subsequent fair value write-downs or write-ups, to the extent of previous write-downs, equipment maintenance costs, and gains or losses recognized upon the sale of repossessions are recognized in Noninterest Expense on the Statements of Income. Gains or losses resulting from the sale of repossessed assets are recognized on the date of sale. Repossessed assets totaled $4.26 million and $0.06 million, as of December 31, 2013 and 2012, respectively, and are included in Other Assets in the Statements of Financial Condition.
Premises and Equipment — Premises and equipment are stated at cost, less accumulated depreciation and amortization. The provision for depreciation is computed by the straight-line method, primarily with useful lives ranging from three to 31.5 years. Maintenance and repairs are charged to expense as incurred, while improvements, which extend the useful life, are capitalized and depreciated over the estimated remaining life.
Goodwill and Intangibles — Goodwill represents the excess of the cost of businesses acquired over the fair value of the net assets acquired. Other intangible assets represent purchased assets that also lack physical substance but can be distinguished from goodwill because of contractual or other legal rights or because the asset is capable of being sold or exchanged either on its own or in combination with a related contract, asset, or liability. Goodwill is reviewed for impairment at least annually or on an interim basis if an event occurs or circumstances change that would more likely than not reduce the carrying amount. Goodwill is allocated into two reporting units. Fair value for each reporting unit is estimated using stock price multiples or revenue multiples. Intangible assets that have finite lives are amortized over their estimated useful lives and are subject to impairment testing. All of the Company’s other intangible assets have finite lives and are amortized on a straight-line basis over varying periods not exceeding eleven years. The Company performed the required annual impairment test of goodwill during the fourth quarter of 2013 and determined that no impairment exists.
Partnership Investment — The Company accounts for its investments in partnerships for which it owns three percent or more of the partnership on the equity method. The partnerships which the Company has investments in account for their investments at fair value. As a result, the Company’s investments in these partnerships reflect the underlying fair value of the partnerships’ investments. The Company accounts for its investments in partnerships of which it owns less than three percent at the lower of cost or fair value. Investments in partnerships are included in Other Assets in the Statements of Financial Condition. The balances as of December 31, 2013 and 2012 were $4.28 million and $3.21 million, respectively.
45 SRCE 2013 Form 10-K
Short-Term Borrowings — Short-term borrowings consist of Federal funds purchased, securities sold under agreements to repurchase, commercial paper, Federal Home Loan Bank notes, and borrowings from non-affiliated banks. Federal funds purchased, securities sold under agreements to repurchase, and other short-term borrowings mature within one to 365 days of the transaction date. Commercial paper matures within seven to 270 days. Other short-term borrowings in the Statements of Financial Condition include the Company’s liability related to mortgage loans available for repurchase under GNMA optional repurchase programs.
Securities purchased under agreements to resell and securities sold under agreements to repurchase are treated as collateralized financing transactions and are recorded at the amounts at which the securities were acquired or sold plus accrued interest. The fair value of collateral either received from or provided to a third party is continually monitored and additional collateral obtained or requested to be returned to the Company as deemed appropriate.
Trust Fees — Trust fees are recognized on the accrual basis.
Income Taxes — 1st Source and its subsidiaries file a consolidated Federal income tax return. The provision for incomes taxes is based upon income in the consolidated financial statements, rather than amounts reported on the income tax return. Deferred tax assets and liabilities are recognized for the future tax consequences attributable to differences between the financial statement carrying amounts of existing assets and liabilities and their respective tax bases. Deferred tax assets and liabilities are measured using enacted tax rates expected to apply to taxable income in the years in which those temporary differences are expected to be recovered or settled. The effect on deferred tax assets and liabilities of a change in tax rates is recognized as income or expense in the period that includes the enactment date. A valuation allowance, if needed, reduces deferred tax assets to the expected amount most likely to be realized. Realization of deferred tax assets is dependent upon the generation of a sufficient level of future taxable income and recoverable taxes paid in prior years. Although realization is not assured, the Company believes it is more likely than not that all of the deferred tax assets will be realized.
Positions taken in the tax returns may be subject to challenge by the taxing authorities upon examination. Uncertain tax positions are initially recognized in the financial statements when it is more likely than not the position will be sustained upon examination by the tax authorities. Such tax positions are both initially and subsequently measured as the largest amount of tax benefit that is greater than 50% likely of being realized upon settlement with the tax authority, assuming full knowledge of the position and all relevant facts. The Company provides for interest and, in some cases, penalties on tax positions that may be challenged by the taxing authorities. Interest expense is recognized beginning in the first period that such interest would begin accruing. Penalties are recognized in the period that the Company claims the position in the tax return. Interest and penalties on income tax uncertainties are classified within Income Tax Expense in the Statements of Income.
Net Income Per Common Share — Basic earnings per common share is computed by dividing net income available to common shareholders by the weighted-average number of shares of common stock outstanding. Diluted earnings per common share is computed by dividing net income available to common shareholders by the weighted-average number of shares of common stock outstanding, plus the dilutive effect of outstanding stock options, stock warrants and nonvested stock-based compensation awards.
Stock-Based Employee Compensation — The Company recognizes stock-based compensation as compensation cost in the Statements of Income based on their fair values on the measurement date, which, for its purposes, is the date of grant. The Company accounts for stock-based compensation using the modified prospective transition method.
Segment Information — 1st Source has one principal business segment, commercial banking. While our chief decision makers monitor the revenue streams of various products and services, the identifiable segments’ operations are managed and financial performance is evaluated on a company-wide basis. Accordingly, all of the Company’s financial service operations are considered to be aggregated in one reportable operating segment.
Derivative Financial Instruments — The Company occasionally enters into derivative financial instruments as part of its interest rate risk and foreign currency risk management strategies. These derivative financial instruments consist primarily of interest rate swaps and foreign currency forward contracts. All derivative instruments are recorded on the Statements of Financial Condition, as either an asset or liability, at their fair value. The accounting for the gain or loss resulting from the change in fair value depends on the intended use of the derivative. For a derivative used to hedge changes in fair value of a recognized asset or liability, or an unrecognized firm commitment, the gain or loss on the derivative will be recognized in earnings together with the offsetting loss or gain on the hedged item. This results in an earnings impact only to the extent that the hedge is ineffective in achieving offsetting changes in fair value. If it is determined that the derivative instrument is not highly effective as a hedge, hedge accounting is discontinued and the adjustment to fair value of the derivative instrument is recorded in earnings. For a derivative used to hedge changes in cash flows associated with forecasted transactions, the gain or loss on the effective portion of the derivative will be deferred, and reported as accumulated other comprehensive income, a component of shareholders’ equity, until such time the hedged transaction affects earnings. For derivative instruments not accounted for as hedges, changes in fair value are recognized in noninterest income/expense. Deferred gains and losses from derivatives that are terminated and were in a cash flow hedge are amortized over the shorter of the original remaining term of the derivative or the remaining life of the underlying asset or liability.
46 SRCE 2013 Form 10-K
Fair Value Measurements — The Company records certain assets and liabilities at fair value. Fair value is defined as the price that would be received to sell an asset or paid to transfer a liability in an orderly transaction between market participants at the measurement date. Securities available for sale, trading securities, mortgage loans held for sale, and derivative instruments are carried at fair value on a recurring basis. Fair value measurements are also utilized to determine the initial value of certain assets and liabilities, to perform impairment assessments, and for disclosure purposes. The Company uses quoted market prices and observable inputs to the maximum extent possible when measuring fair value. In the absence of quoted market prices, various valuation techniques are utilized to measure fair value. When possible, observable market data for identical or similar financial instruments are used in the valuation. When market data is not available, fair value is determined using valuation models that incorporate management’s estimates of the assumptions a market participant would use in pricing the asset or liability.
Fair value measurements are classified within one of three levels based on the observability of the inputs used to determine fair value, as follows:
Level 1 — The valuation is based on quoted prices in active markets for identical instruments.
Level 2 — The valuation is based on observable inputs such as quoted prices for similar instruments in active markets, quoted prices for identical or similar instruments in markets that are not active, and model-based valuation techniques for which all significant assumptions are observable in the market.
Level 3 — The valuation is based on unobservable inputs that are supported by minimal or no market activity and that are significant to the fair value of the instrument. Level 3 valuations are typically performed using pricing models, discounted cash flow methodologies, or similar techniques that incorporate management’s own estimates of assumptions that market participants would use in pricing the instrument, or valuations that require significant management judgment or estimation.
Reclassifications — Certain amounts in the prior periods consolidated financial statements have been reclassified to conform with the current year presentation. These reclassifications had no effect on total assets, shareholders’ equity or net income as previously reported.
Note 2 — Recent Accounting Pronouncements
Reclassification of Residential Real Estate Collateralized Consumer Mortgage Loans Upon Foreclosure: In January 2014, the Financial Accounting Standards Board (FASB) issued Accounting Standards Update (ASU) No. 2014-04 "Receivables - Troubled Debt Restructurings by Creditors (Subtopic 310-40) - Reclassification of Residential Real Estate Collateralized Consumer Mortgage Loans upon Foreclosure." ASU No. 2014-04 clarifies when an in substance repossession or foreclosure occurs and requires interim and annual disclosures of the amount of foreclosed residential real estate property and the recorded investment in consumer mortgage loans collateralized by residential real estate property that are in the process of foreclosure. ASU 2014-04 is effective either on a modified retrospective transition method or a prospective transition method for interim and annual periods beginning after December 15, 2014. Early adoption is permitted. The Company is assessing the impact of ASU 2014-04 on its disclosures.
Accounting for Investments in Qualified Affordable Housing Projects: In January 2014, the FASB issued ASU No. 2014-01 "Investments - Equity Method and Joint Ventures (Topic 323) - Accounting for Investments in Qualified Affordable Housing Projects." ASU 2014-01 allows investors to use the proportional amortization method to account for investments in limited liability entities that manage or invest in affordable housing projects that qualify for low-income housing tax credits if certain conditions are met. ASU 2014-01 is effective retrospectively for interim and annual periods in fiscal years that begin after December 15, 2014. Early adoption is permitted. The Company is assessing the impact of ASU 2014-01 on its accounting for affordable housing projects.
Investment Companies: In June 2013, the FASB issued ASU No. 2013-08 "Financial Services-Investment Companies (Topic 946) - Amendments to the Scope, Measurement and Disclosure Requirements." ASU 2013-08 changes the approach to the investment company assessment in Topic 946, clarifies the characteristics of an investment company and provides comprehensive guidance for assessing whether an entity is an investment company. ASU 2013-08 is effective for interim and annual periods in fiscal years that begin after December 15, 2013. Early application is prohibited. The Company is assessing the impact of ASU 2013-08 on its disclosures.
Comprehensive Income: In February 2013, the FASB issued ASU No. 2013-02 "Comprehensive Income (Topic 220) - Reporting Amounts Reclassified Out of Accumulated Other Comprehensive Income." ASU 2013-02 requires an entity to provide information about the amounts reclassified out of accumulated other comprehensive income by component. ASU 2013-02 is effective prospectively during interim and annual periods beginning after December 15, 2012. The effect of applying this standard is reflected in Note 14 - Accumulated Other Comprehensive Income.
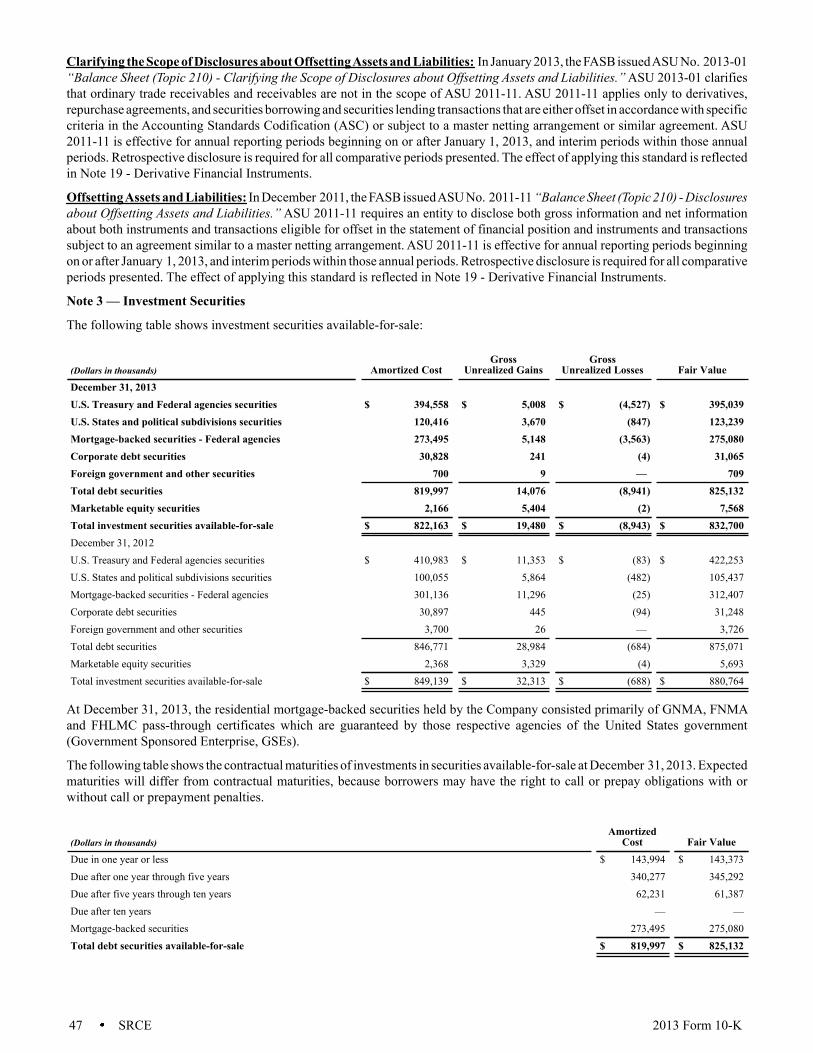
47 SRCE 2013 Form 10-K
Clarifying the Scope of Disclosures about Offsetting Assets and Liabilities: In January 2013, the FASB issued ASU No. 2013-01 “Balance Sheet (Topic 210) - Clarifying the Scope of Disclosures about Offsetting Assets and Liabilities.” ASU 2013-01 clarifies that ordinary trade receivables and receivables are not in the scope of ASU 2011-11. ASU 2011-11 applies only to derivatives, repurchase agreements, and securities borrowing and securities lending transactions that are either offset in accordance with specific criteria in the Accounting Standards Codification (ASC) or subject to a master netting arrangement or similar agreement. ASU 2011-11 is effective for annual reporting periods beginning on or after January 1, 2013, and interim periods within those annual periods. Retrospective disclosure is required for all comparative periods presented. The effect of applying this standard is reflected in Note 19 - Derivative Financial Instruments.
Offsetting Assets and Liabilities: In December 2011, the FASB issued ASU No. 2011-11 “Balance Sheet (Topic 210) - Disclosures about Offsetting Assets and Liabilities.” ASU 2011-11 requires an entity to disclose both gross information and net information about both instruments and transactions eligible for offset in the statement of financial position and instruments and transactions subject to an agreement similar to a master netting arrangement. ASU 2011-11 is effective for annual reporting periods beginning on or after January 1, 2013, and interim periods within those annual periods. Retrospective disclosure is required for all comparative periods presented. The effect of applying this standard is reflected in Note 19 - Derivative Financial Instruments.
Note 3 — Investment Securities
The following table shows investment securities available-for-sale:
(Dollars in thousands) Amortized CostGross
Unrealized GainsGross
Unrealized Losses Fair ValueDecember 31, 2013 U.S. Treasury and Federal agencies securities $ 394,558 $ 5,008 $ (4,527) $ 395,039U.S. States and political subdivisions securities 120,416 3,670 (847) 123,239Mortgage-backed securities - Federal agencies 273,495 5,148 (3,563) 275,080Corporate debt securities 30,828 241 (4) 31,065Foreign government and other securities 700 9 — 709Total debt securities 819,997 14,076 (8,941) 825,132Marketable equity securities 2,166 5,404 (2) 7,568Total investment securities available-for-sale $ 822,163 $ 19,480 $ (8,943) $ 832,700December 31, 2012 U.S. Treasury and Federal agencies securities $ 410,983 $ 11,353 $ (83) $ 422,253U.S. States and political subdivisions securities 100,055 5,864 (482) 105,437Mortgage-backed securities - Federal agencies 301,136 11,296 (25) 312,407Corporate debt securities 30,897 445 (94) 31,248Foreign government and other securities 3,700 26 — 3,726Total debt securities 846,771 28,984 (684) 875,071Marketable equity securities 2,368 3,329 (4) 5,693Total investment securities available-for-sale $ 849,139 $ 32,313 $ (688) $ 880,764
At December 31, 2013, the residential mortgage-backed securities held by the Company consisted primarily of GNMA, FNMA and FHLMC pass-through certificates which are guaranteed by those respective agencies of the United States government (Government Sponsored Enterprise, GSEs).
The following table shows the contractual maturities of investments in securities available-for-sale at December 31, 2013. Expected maturities will differ from contractual maturities, because borrowers may have the right to call or prepay obligations with or without call or prepayment penalties.
(Dollars in thousands)Amortized
Cost Fair ValueDue in one year or less $ 143,994 $ 143,373Due after one year through five years 340,277 345,292Due after five years through ten years 62,231 61,387Due after ten years — —Mortgage-backed securities 273,495 275,080Total debt securities available-for-sale $ 819,997 $ 825,132
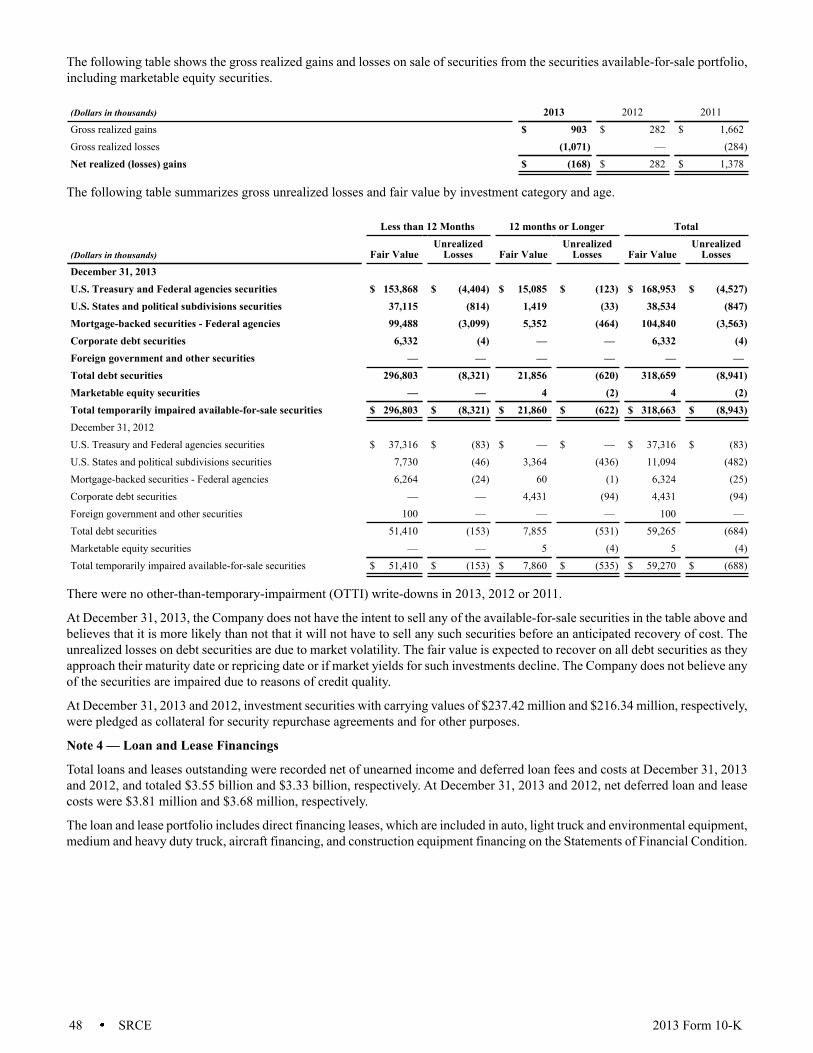
48 SRCE 2013 Form 10-K
The following table shows the gross realized gains and losses on sale of securities from the securities available-for-sale portfolio, including marketable equity securities.
(Dollars in thousands) 2013 2012 2011Gross realized gains $ 903 $ 282 $ 1,662Gross realized losses (1,071) — (284)Net realized (losses) gains $ (168) $ 282 $ 1,378
The following table summarizes gross unrealized losses and fair value by investment category and age.
Less than 12 Months 12 months or Longer Total
(Dollars in thousands) Fair ValueUnrealized
Losses Fair ValueUnrealized
Losses Fair ValueUnrealized
LossesDecember 31, 2013 U.S. Treasury and Federal agencies securities $ 153,868 $ (4,404) $ 15,085 $ (123) $ 168,953 $ (4,527)U.S. States and political subdivisions securities 37,115 (814) 1,419 (33) 38,534 (847)Mortgage-backed securities - Federal agencies 99,488 (3,099) 5,352 (464) 104,840 (3,563)Corporate debt securities 6,332 (4) — — 6,332 (4)Foreign government and other securities — — — — — —Total debt securities 296,803 (8,321) 21,856 (620) 318,659 (8,941)Marketable equity securities — — 4 (2) 4 (2)Total temporarily impaired available-for-sale securities $ 296,803 $ (8,321) $ 21,860 $ (622) $ 318,663 $ (8,943)December 31, 2012 U.S. Treasury and Federal agencies securities $ 37,316 $ (83) $ — $ — $ 37,316 $ (83)U.S. States and political subdivisions securities 7,730 (46) 3,364 (436) 11,094 (482)Mortgage-backed securities - Federal agencies 6,264 (24) 60 (1) 6,324 (25)Corporate debt securities — — 4,431 (94) 4,431 (94)Foreign government and other securities 100 — — — 100 —Total debt securities 51,410 (153) 7,855 (531) 59,265 (684)Marketable equity securities — — 5 (4) 5 (4)Total temporarily impaired available-for-sale securities $ 51,410 $ (153) $ 7,860 $ (535) $ 59,270 $ (688)
There were no other-than-temporary-impairment (OTTI) write-downs in 2013, 2012 or 2011.
At December 31, 2013, the Company does not have the intent to sell any of the available-for-sale securities in the table above and believes that it is more likely than not that it will not have to sell any such securities before an anticipated recovery of cost. The unrealized losses on debt securities are due to market volatility. The fair value is expected to recover on all debt securities as they approach their maturity date or repricing date or if market yields for such investments decline. The Company does not believe any of the securities are impaired due to reasons of credit quality.
At December 31, 2013 and 2012, investment securities with carrying values of $237.42 million and $216.34 million, respectively, were pledged as collateral for security repurchase agreements and for other purposes.
Note 4 — Loan and Lease Financings
Total loans and leases outstanding were recorded net of unearned income and deferred loan fees and costs at December 31, 2013 and 2012, and totaled $3.55 billion and $3.33 billion, respectively. At December 31, 2013 and 2012, net deferred loan and lease costs were $3.81 million and $3.68 million, respectively.
The loan and lease portfolio includes direct financing leases, which are included in auto, light truck and environmental equipment, medium and heavy duty truck, aircraft financing, and construction equipment financing on the Statements of Financial Condition.
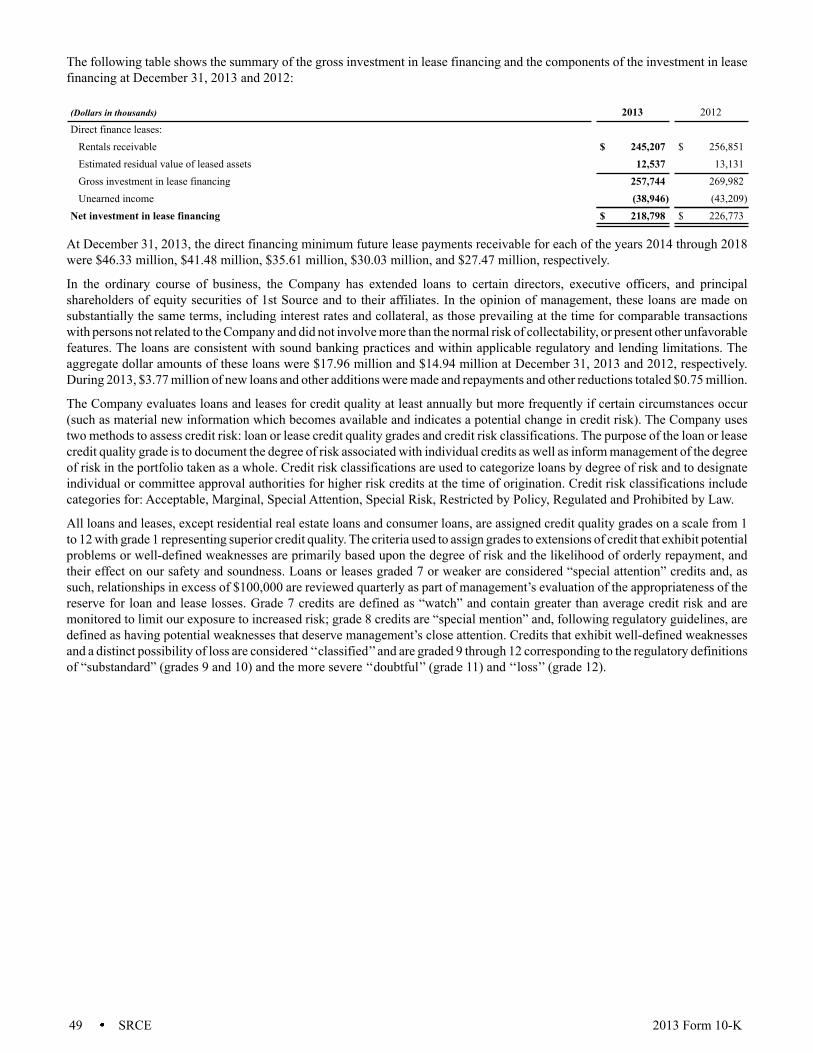
49 SRCE 2013 Form 10-K
The following table shows the summary of the gross investment in lease financing and the components of the investment in lease financing at December 31, 2013 and 2012:
(Dollars in thousands) 2013 2012Direct finance leases:
Rentals receivable $ 245,207 $ 256,851Estimated residual value of leased assets 12,537 13,131Gross investment in lease financing 257,744 269,982Unearned income (38,946) (43,209)Net investment in lease financing $ 218,798 $ 226,773
At December 31, 2013, the direct financing minimum future lease payments receivable for each of the years 2014 through 2018 were $46.33 million, $41.48 million, $35.61 million, $30.03 million, and $27.47 million, respectively.
In the ordinary course of business, the Company has extended loans to certain directors, executive officers, and principal shareholders of equity securities of 1st Source and to their affiliates. In the opinion of management, these loans are made on substantially the same terms, including interest rates and collateral, as those prevailing at the time for comparable transactions with persons not related to the Company and did not involve more than the normal risk of collectability, or present other unfavorable features. The loans are consistent with sound banking practices and within applicable regulatory and lending limitations. The aggregate dollar amounts of these loans were $17.96 million and $14.94 million at December 31, 2013 and 2012, respectively. During 2013, $3.77 million of new loans and other additions were made and repayments and other reductions totaled $0.75 million.
The Company evaluates loans and leases for credit quality at least annually but more frequently if certain circumstances occur (such as material new information which becomes available and indicates a potential change in credit risk). The Company uses two methods to assess credit risk: loan or lease credit quality grades and credit risk classifications. The purpose of the loan or lease credit quality grade is to document the degree of risk associated with individual credits as well as inform management of the degree of risk in the portfolio taken as a whole. Credit risk classifications are used to categorize loans by degree of risk and to designate individual or committee approval authorities for higher risk credits at the time of origination. Credit risk classifications include categories for: Acceptable, Marginal, Special Attention, Special Risk, Restricted by Policy, Regulated and Prohibited by Law.
All loans and leases, except residential real estate loans and consumer loans, are assigned credit quality grades on a scale from 1 to 12 with grade 1 representing superior credit quality. The criteria used to assign grades to extensions of credit that exhibit potential problems or well-defined weaknesses are primarily based upon the degree of risk and the likelihood of orderly repayment, and their effect on our safety and soundness. Loans or leases graded 7 or weaker are considered “special attention” credits and, as such, relationships in excess of $100,000 are reviewed quarterly as part of management’s evaluation of the appropriateness of the reserve for loan and lease losses. Grade 7 credits are defined as “watch” and contain greater than average credit risk and are monitored to limit our exposure to increased risk; grade 8 credits are “special mention” and, following regulatory guidelines, are defined as having potential weaknesses that deserve management’s close attention. Credits that exhibit well-defined weaknesses and a distinct possibility of loss are considered ‘‘classified’’ and are graded 9 through 12 corresponding to the regulatory definitions of “substandard” (grades 9 and 10) and the more severe ‘‘doubtful’’ (grade 11) and ‘‘loss’’ (grade 12).
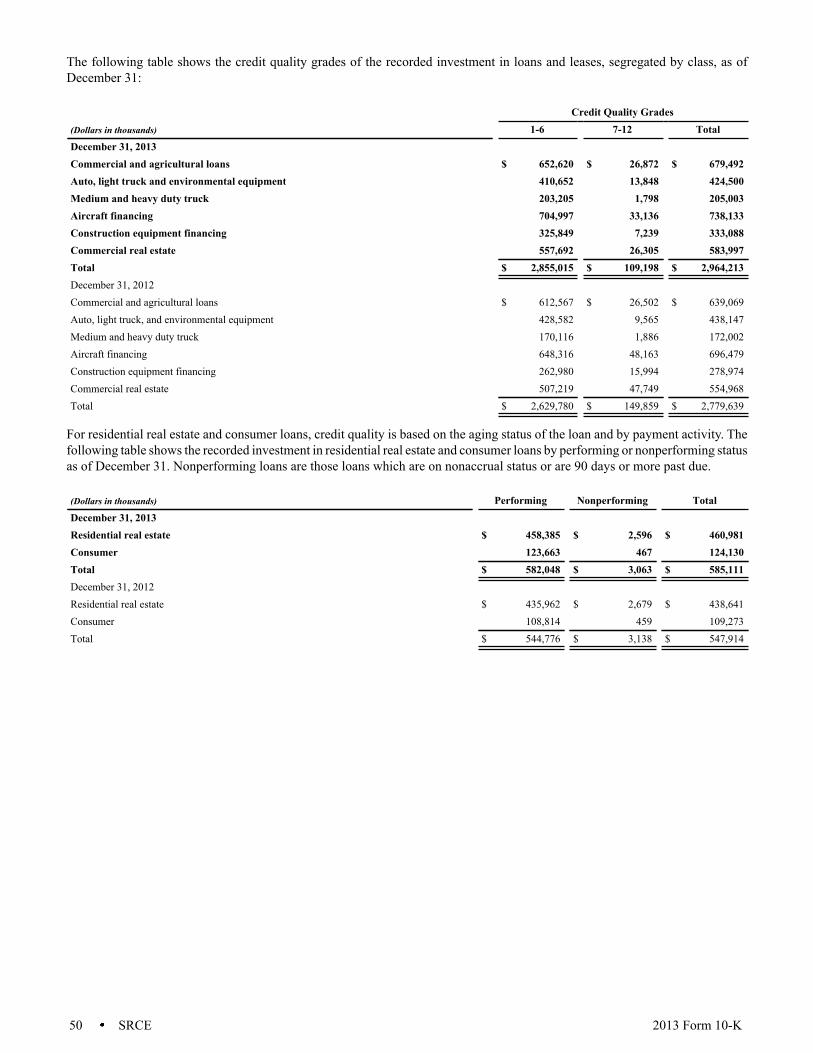
50 SRCE 2013 Form 10-K
The following table shows the credit quality grades of the recorded investment in loans and leases, segregated by class, as of December 31:
Credit Quality Grades
(Dollars in thousands) 1-6 7-12 TotalDecember 31, 2013 Commercial and agricultural loans $ 652,620 $ 26,872 $ 679,492Auto, light truck and environmental equipment 410,652 13,848 424,500Medium and heavy duty truck 203,205 1,798 205,003Aircraft financing 704,997 33,136 738,133Construction equipment financing 325,849 7,239 333,088Commercial real estate 557,692 26,305 583,997Total $ 2,855,015 $ 109,198 $ 2,964,213December 31, 2012 Commercial and agricultural loans $ 612,567 $ 26,502 $ 639,069Auto, light truck, and environmental equipment 428,582 9,565 438,147Medium and heavy duty truck 170,116 1,886 172,002Aircraft financing 648,316 48,163 696,479Construction equipment financing 262,980 15,994 278,974Commercial real estate 507,219 47,749 554,968Total $ 2,629,780 $ 149,859 $ 2,779,639
For residential real estate and consumer loans, credit quality is based on the aging status of the loan and by payment activity. The following table shows the recorded investment in residential real estate and consumer loans by performing or nonperforming status as of December 31. Nonperforming loans are those loans which are on nonaccrual status or are 90 days or more past due.
(Dollars in thousands) Performing Nonperforming TotalDecember 31, 2013 Residential real estate $ 458,385 $ 2,596 $ 460,981Consumer 123,663 467 124,130Total $ 582,048 $ 3,063 $ 585,111December 31, 2012 Residential real estate $ 435,962 $ 2,679 $ 438,641Consumer 108,814 459 109,273Total $ 544,776 $ 3,138 $ 547,914
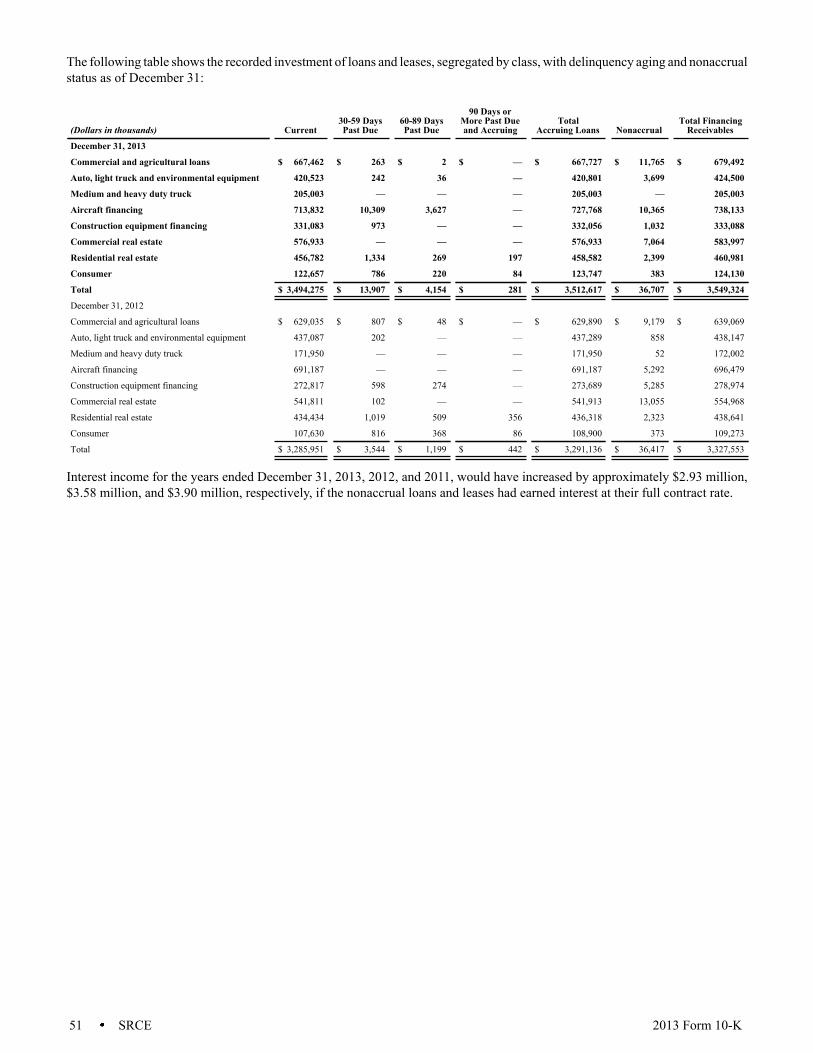
51 SRCE 2013 Form 10-K
The following table shows the recorded investment of loans and leases, segregated by class, with delinquency aging and nonaccrual status as of December 31:
(Dollars in thousands) Current30-59 DaysPast Due
60-89 DaysPast Due
90 Days orMore Past Dueand Accruing
TotalAccruing Loans Nonaccrual
Total FinancingReceivables
December 31, 2013
Commercial and agricultural loans $ 667,462 $ 263 $ 2 $ — $ 667,727 $ 11,765 $ 679,492
Auto, light truck and environmental equipment 420,523 242 36 — 420,801 3,699 424,500
Medium and heavy duty truck 205,003 — — — 205,003 — 205,003
Aircraft financing 713,832 10,309 3,627 — 727,768 10,365 738,133
Construction equipment financing 331,083 973 — — 332,056 1,032 333,088
Commercial real estate 576,933 — — — 576,933 7,064 583,997
Residential real estate 456,782 1,334 269 197 458,582 2,399 460,981
Consumer 122,657 786 220 84 123,747 383 124,130
Total $ 3,494,275 $ 13,907 $ 4,154 $ 281 $ 3,512,617 $ 36,707 $ 3,549,324
December 31, 2012
Commercial and agricultural loans $ 629,035 $ 807 $ 48 $ — $ 629,890 $ 9,179 $ 639,069
Auto, light truck and environmental equipment 437,087 202 — — 437,289 858 438,147
Medium and heavy duty truck 171,950 — — — 171,950 52 172,002
Aircraft financing 691,187 — — — 691,187 5,292 696,479
Construction equipment financing 272,817 598 274 — 273,689 5,285 278,974
Commercial real estate 541,811 102 — — 541,913 13,055 554,968
Residential real estate 434,434 1,019 509 356 436,318 2,323 438,641
Consumer 107,630 816 368 86 108,900 373 109,273
Total $ 3,285,951 $ 3,544 $ 1,199 $ 442 $ 3,291,136 $ 36,417 $ 3,327,553
Interest income for the years ended December 31, 2013, 2012, and 2011, would have increased by approximately $2.93 million, $3.58 million, and $3.90 million, respectively, if the nonaccrual loans and leases had earned interest at their full contract rate.
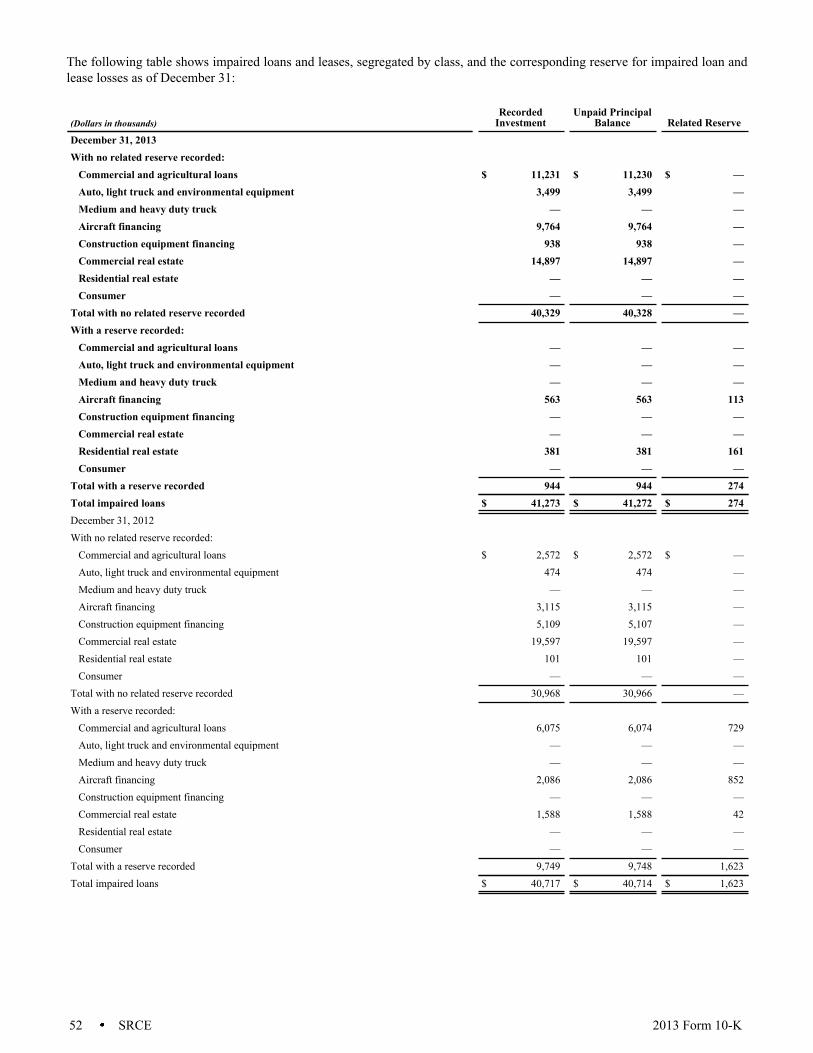
52 SRCE 2013 Form 10-K
The following table shows impaired loans and leases, segregated by class, and the corresponding reserve for impaired loan and lease losses as of December 31:
(Dollars in thousands) Recorded
InvestmentUnpaid Principal
Balance Related ReserveDecember 31, 2013 With no related reserve recorded:
Commercial and agricultural loans $ 11,231 $ 11,230 $ —Auto, light truck and environmental equipment 3,499 3,499 —Medium and heavy duty truck — — —Aircraft financing 9,764 9,764 —Construction equipment financing 938 938 —Commercial real estate 14,897 14,897 —Residential real estate — — —Consumer — — —
Total with no related reserve recorded 40,329 40,328 —With a reserve recorded:
Commercial and agricultural loans — — —Auto, light truck and environmental equipment — — —Medium and heavy duty truck — — —Aircraft financing 563 563 113Construction equipment financing — — —Commercial real estate — — —Residential real estate 381 381 161Consumer — — —
Total with a reserve recorded 944 944 274Total impaired loans $ 41,273 $ 41,272 $ 274December 31, 2012 With no related reserve recorded:
Commercial and agricultural loans $ 2,572 $ 2,572 $ —Auto, light truck and environmental equipment 474 474 —Medium and heavy duty truck — — —Aircraft financing 3,115 3,115 —Construction equipment financing 5,109 5,107 —Commercial real estate 19,597 19,597 —Residential real estate 101 101 —Consumer — — —
Total with no related reserve recorded 30,968 30,966 —With a reserve recorded:
Commercial and agricultural loans 6,075 6,074 729Auto, light truck and environmental equipment — — —Medium and heavy duty truck — — —Aircraft financing 2,086 2,086 852Construction equipment financing — — —Commercial real estate 1,588 1,588 42Residential real estate — — —Consumer — — —
Total with a reserve recorded 9,749 9,748 1,623Total impaired loans $ 40,717 $ 40,714 $ 1,623
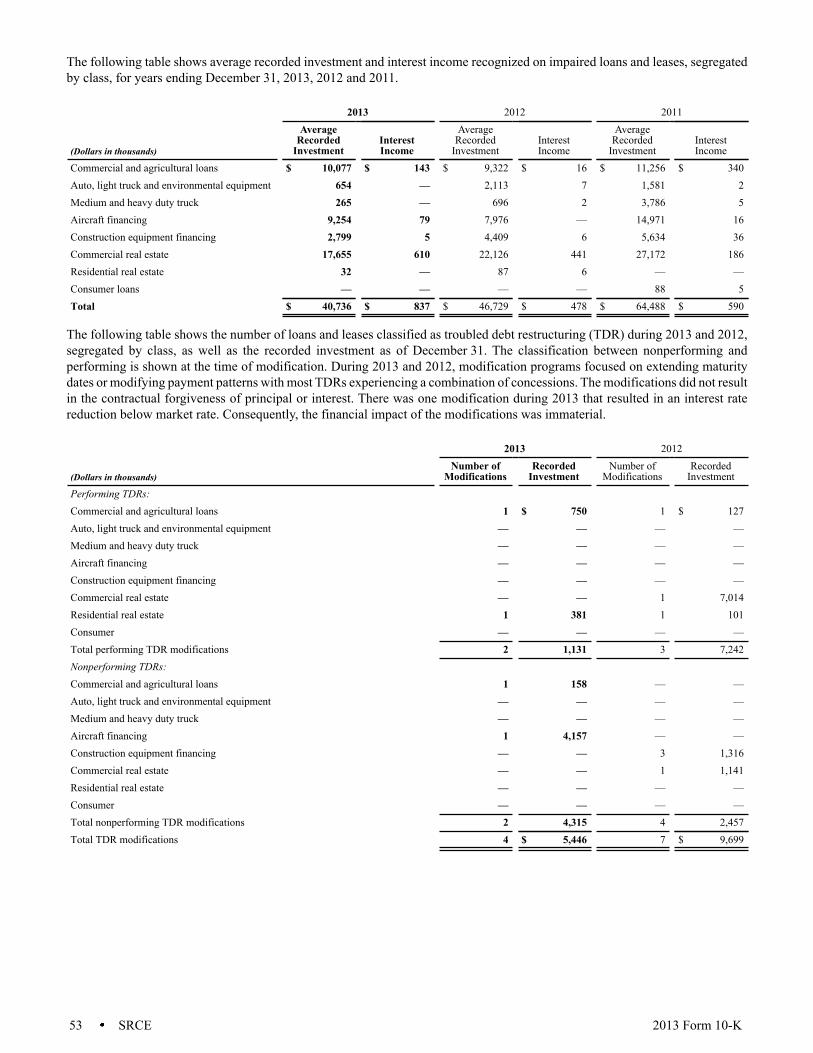
53 SRCE 2013 Form 10-K
The following table shows average recorded investment and interest income recognized on impaired loans and leases, segregated by class, for years ending December 31, 2013, 2012 and 2011.
2013 2012 2011
(Dollars in thousands)
AverageRecorded
InvestmentInterestIncome
AverageRecorded
InvestmentInterestIncome
AverageRecorded
InvestmentInterestIncome
Commercial and agricultural loans $ 10,077 $ 143 $ 9,322 $ 16 $ 11,256 $ 340Auto, light truck and environmental equipment 654 — 2,113 7 1,581 2Medium and heavy duty truck 265 — 696 2 3,786 5Aircraft financing 9,254 79 7,976 — 14,971 16Construction equipment financing 2,799 5 4,409 6 5,634 36Commercial real estate 17,655 610 22,126 441 27,172 186Residential real estate 32 — 87 6 — —Consumer loans — — — — 88 5Total $ 40,736 $ 837 $ 46,729 $ 478 $ 64,488 $ 590
The following table shows the number of loans and leases classified as troubled debt restructuring (TDR) during 2013 and 2012, segregated by class, as well as the recorded investment as of December 31. The classification between nonperforming and performing is shown at the time of modification. During 2013 and 2012, modification programs focused on extending maturity dates or modifying payment patterns with most TDRs experiencing a combination of concessions. The modifications did not result in the contractual forgiveness of principal or interest. There was one modification during 2013 that resulted in an interest rate reduction below market rate. Consequently, the financial impact of the modifications was immaterial.
2013 2012
(Dollars in thousands)Number of
ModificationsRecorded
InvestmentNumber of
ModificationsRecorded
InvestmentPerforming TDRs: Commercial and agricultural loans 1 $ 750 1 $ 127Auto, light truck and environmental equipment — — — —Medium and heavy duty truck — — — —Aircraft financing — — — —Construction equipment financing — — — —Commercial real estate — — 1 7,014Residential real estate 1 381 1 101Consumer — — — —Total performing TDR modifications 2 1,131 3 7,242Nonperforming TDRs: Commercial and agricultural loans 1 158 — —Auto, light truck and environmental equipment — — — —Medium and heavy duty truck — — — —Aircraft financing 1 4,157 — —Construction equipment financing — — 3 1,316Commercial real estate — — 1 1,141Residential real estate — — — —Consumer — — — —Total nonperforming TDR modifications 2 4,315 4 2,457Total TDR modifications 4 $ 5,446 7 $ 9,699
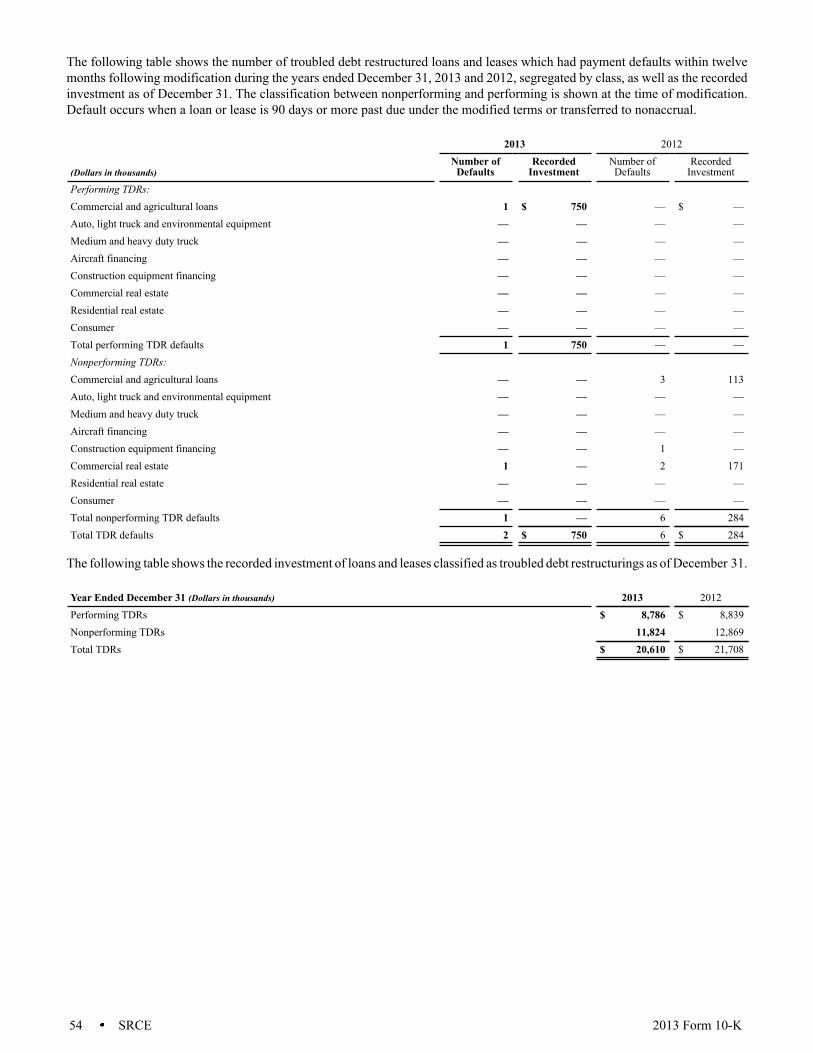
54 SRCE 2013 Form 10-K
The following table shows the number of troubled debt restructured loans and leases which had payment defaults within twelve months following modification during the years ended December 31, 2013 and 2012, segregated by class, as well as the recorded investment as of December 31. The classification between nonperforming and performing is shown at the time of modification. Default occurs when a loan or lease is 90 days or more past due under the modified terms or transferred to nonaccrual.
2013 2012
(Dollars in thousands)Number of
DefaultsRecorded
InvestmentNumber ofDefaults
RecordedInvestment
Performing TDRs: Commercial and agricultural loans 1 $ 750 — $ —Auto, light truck and environmental equipment — — — —Medium and heavy duty truck — — — —Aircraft financing — — — —Construction equipment financing — — — —Commercial real estate — — — —Residential real estate — — — —Consumer — — — —Total performing TDR defaults 1 750 — —Nonperforming TDRs: Commercial and agricultural loans — — 3 113Auto, light truck and environmental equipment — — — —Medium and heavy duty truck — — — —Aircraft financing — — — —Construction equipment financing — — 1 —Commercial real estate 1 — 2 171Residential real estate — — — —Consumer — — — —Total nonperforming TDR defaults 1 — 6 284Total TDR defaults 2 $ 750 6 $ 284
The following table shows the recorded investment of loans and leases classified as troubled debt restructurings as of December 31.
Year Ended December 31 (Dollars in thousands) 2013 2012Performing TDRs $ 8,786 $ 8,839Nonperforming TDRs 11,824 12,869Total TDRs $ 20,610 $ 21,708
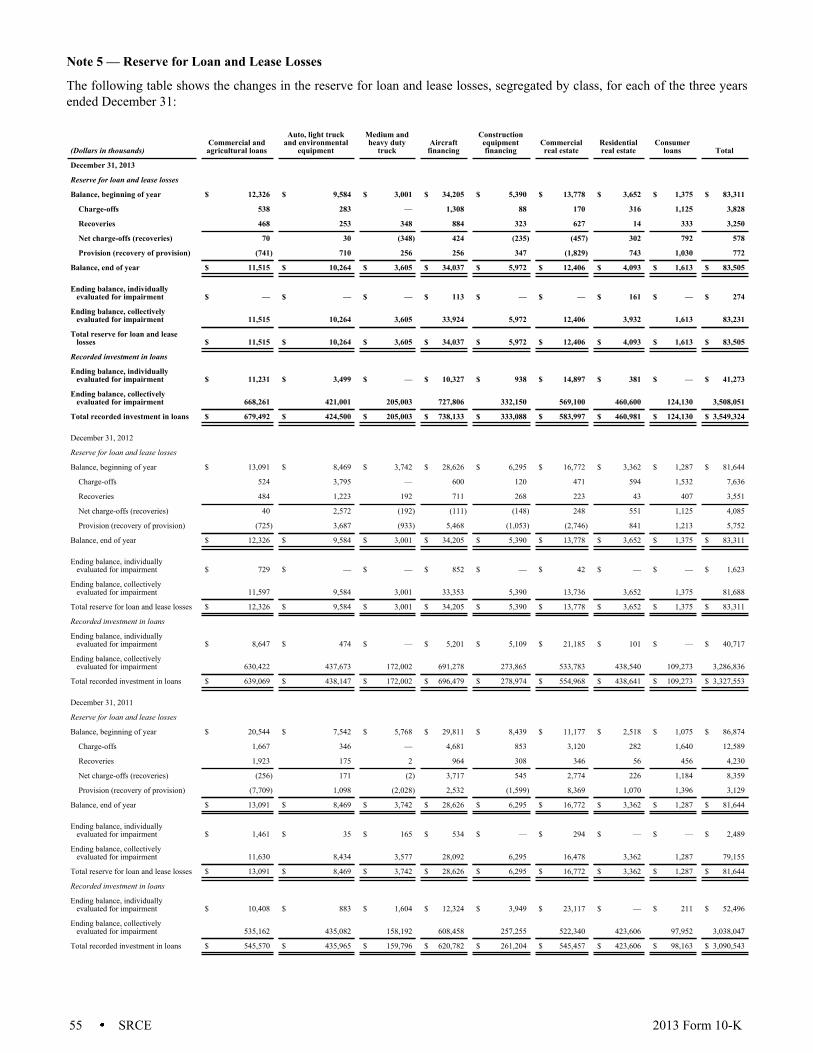
55 SRCE 2013 Form 10-K
Note 5 — Reserve for Loan and Lease Losses
The following table shows the changes in the reserve for loan and lease losses, segregated by class, for each of the three years ended December 31:
(Dollars in thousands) Commercial andagricultural loans
Auto, light truckand environmental
equipment
Medium andheavy duty
truckAircraft
financing
Constructionequipmentfinancing
Commercialreal estate
Residentialreal estate
Consumerloans Total
December 31, 2013
Reserve for loan and lease losses
Balance, beginning of year $ 12,326 $ 9,584 $ 3,001 $ 34,205 $ 5,390 $ 13,778 $ 3,652 $ 1,375 $ 83,311
Charge-offs 538 283 — 1,308 88 170 316 1,125 3,828
Recoveries 468 253 348 884 323 627 14 333 3,250
Net charge-offs (recoveries) 70 30 (348) 424 (235) (457) 302 792 578
Provision (recovery of provision) (741) 710 256 256 347 (1,829) 743 1,030 772
Balance, end of year $ 11,515 $ 10,264 $ 3,605 $ 34,037 $ 5,972 $ 12,406 $ 4,093 $ 1,613 $ 83,505
Ending balance, individuallyevaluated for impairment $ — $ — $ — $ 113 $ — $ — $ 161 $ — $ 274
Ending balance, collectivelyevaluated for impairment 11,515 10,264 3,605 33,924 5,972 12,406 3,932 1,613 83,231
Total reserve for loan and leaselosses $ 11,515 $ 10,264 $ 3,605 $ 34,037 $ 5,972 $ 12,406 $ 4,093 $ 1,613 $ 83,505
Recorded investment in loans
Ending balance, individuallyevaluated for impairment $ 11,231 $ 3,499 $ — $ 10,327 $ 938 $ 14,897 $ 381 $ — $ 41,273
Ending balance, collectivelyevaluated for impairment 668,261 421,001 205,003 727,806 332,150 569,100 460,600 124,130 3,508,051
Total recorded investment in loans $ 679,492 $ 424,500 $ 205,003 $ 738,133 $ 333,088 $ 583,997 $ 460,981 $ 124,130 $ 3,549,324
December 31, 2012
Reserve for loan and lease losses
Balance, beginning of year $ 13,091 $ 8,469 $ 3,742 $ 28,626 $ 6,295 $ 16,772 $ 3,362 $ 1,287 $ 81,644
Charge-offs 524 3,795 — 600 120 471 594 1,532 7,636
Recoveries 484 1,223 192 711 268 223 43 407 3,551
Net charge-offs (recoveries) 40 2,572 (192) (111) (148) 248 551 1,125 4,085
Provision (recovery of provision) (725) 3,687 (933) 5,468 (1,053) (2,746) 841 1,213 5,752
Balance, end of year $ 12,326 $ 9,584 $ 3,001 $ 34,205 $ 5,390 $ 13,778 $ 3,652 $ 1,375 $ 83,311
Ending balance, individuallyevaluated for impairment $ 729 $ — $ — $ 852 $ — $ 42 $ — $ — $ 1,623
Ending balance, collectivelyevaluated for impairment 11,597 9,584 3,001 33,353 5,390 13,736 3,652 1,375 81,688
Total reserve for loan and lease losses $ 12,326 $ 9,584 $ 3,001 $ 34,205 $ 5,390 $ 13,778 $ 3,652 $ 1,375 $ 83,311
Recorded investment in loans
Ending balance, individuallyevaluated for impairment $ 8,647 $ 474 $ — $ 5,201 $ 5,109 $ 21,185 $ 101 $ — $ 40,717
Ending balance, collectivelyevaluated for impairment 630,422 437,673 172,002 691,278 273,865 533,783 438,540 109,273 3,286,836
Total recorded investment in loans $ 639,069 $ 438,147 $ 172,002 $ 696,479 $ 278,974 $ 554,968 $ 438,641 $ 109,273 $ 3,327,553
December 31, 2011
Reserve for loan and lease losses
Balance, beginning of year $ 20,544 $ 7,542 $ 5,768 $ 29,811 $ 8,439 $ 11,177 $ 2,518 $ 1,075 $ 86,874
Charge-offs 1,667 346 — 4,681 853 3,120 282 1,640 12,589
Recoveries 1,923 175 2 964 308 346 56 456 4,230
Net charge-offs (recoveries) (256) 171 (2) 3,717 545 2,774 226 1,184 8,359
Provision (recovery of provision) (7,709) 1,098 (2,028) 2,532 (1,599) 8,369 1,070 1,396 3,129
Balance, end of year $ 13,091 $ 8,469 $ 3,742 $ 28,626 $ 6,295 $ 16,772 $ 3,362 $ 1,287 $ 81,644
Ending balance, individuallyevaluated for impairment $ 1,461 $ 35 $ 165 $ 534 $ — $ 294 $ — $ — $ 2,489
Ending balance, collectivelyevaluated for impairment 11,630 8,434 3,577 28,092 6,295 16,478 3,362 1,287 79,155
Total reserve for loan and lease losses $ 13,091 $ 8,469 $ 3,742 $ 28,626 $ 6,295 $ 16,772 $ 3,362 $ 1,287 $ 81,644
Recorded investment in loans
Ending balance, individuallyevaluated for impairment $ 10,408 $ 883 $ 1,604 $ 12,324 $ 3,949 $ 23,117 $ — $ 211 $ 52,496
Ending balance, collectivelyevaluated for impairment 535,162 435,082 158,192 608,458 257,255 522,340 423,606 97,952 3,038,047
Total recorded investment in loans $ 545,570 $ 435,965 $ 159,796 $ 620,782 $ 261,204 $ 545,457 $ 423,606 $ 98,163 $ 3,090,543

56 SRCE 2013 Form 10-K
Note 6 — Operating Leases
Operating lease equipment at December 31, 2013 and 2012 was $60.97 million and $52.17 million, respectively, net of accumulated depreciation of $26.99 million and $33.51 million, respectively.
The minimum future lease rental payments due from clients on operating lease equipment at December 31, 2013, totaled $42.88 million, of which $13.99 million is due in 2014, $11.15 million in 2015, $8.91 million in 2016, $5.72 million in 2017, $2.60 million in 2018, and $0.51 million thereafter. Depreciation expense related to operating lease equipment for the years ended December 31, 2013, 2012 and 2011 was $13.06 million, $15.20 million and $18.65 million, respectively.
Note 7 — Premises and Equipment
The following table shows premises and equipment as of December 31:
(Dollars in thousands) 2013 2012Land $ 14,029 $ 13,944Buildings and improvements 48,149 44,601Furniture and equipment 37,564 36,667Total premises and equipment 99,742 95,212Accumulated depreciation and amortization (53,112) (50,196)Net premises and equipment $ 46,630 $ 45,016
On December 28, 2010, the Company entered into an agreement with the City of South Bend for the sale of the South Bend headquarters building parking garage for $1.95 million. Although the City of South Bend took possession of the parking garage on that date, the proceeds were placed in an escrow account. Under the terms of the agreement, receipt of the proceeds from the escrow was contingent upon the Company investing $5.40 million into its properties within the City of South Bend by December 31, 2013. In the third quarter 2012, the proceeds for the parking garage were received from escrow and a gain on sale of $1.61 million (or $1.00 million net of tax) was recognized in Other Expense on the Statements of Income.
Depreciation and amortization of properties and equipment totaled $4.73 million in 2013, $4.24 million in 2012, and $3.73 million in 2011.
Note 8 — Mortgage Servicing Assets
The unpaid principal balance of residential mortgage loans serviced for third parties was $839.26 million at December 31, 2013, compared to $921.20 million at December 31, 2012, and $995.09 million at December 31, 2011.
Amortization expense on mortgage servicing rights is expected to total $0.74 million, $0.63 million, $0.54 million, $0.46 million, and $0.40 million in 2014, 2015, 2016, 2017 and 2018, respectively. Projected amortization excludes the impact of future asset additions or disposals.
The following table shows changes in the carrying value of mortgage servicing assets and the associated valuation allowance:
(Dollars in thousands) 2013 2012Mortgage servicing assets:
Balance at beginning of year $ 4,645 $ 5,610Additions 1,770 1,956Amortization (1,571) (2,921)Sales — —
Carrying value before valuation allowance at end of year 4,844 4,645Valuation allowance:
Balance at beginning of year — (238)Impairment recoveries — 238
Balance at end of year $ — $ —Net carrying value of mortgage servicing assets at end of year $ 4,844 $ 4,645Fair value of mortgage servicing assets at end of year $ 8,127 $ 5,760
During 2013 and 2012, the Company determined that it was not necessary to permanently write-down any previously established valuation allowance. At December 31, 2013, the fair value of mortgage servicing assets exceeded the carrying value reported in the Statements of Financial Condition by $3.28 million. This difference represents increases in the fair value of certain mortgage servicing assets that could not be recorded above cost basis.
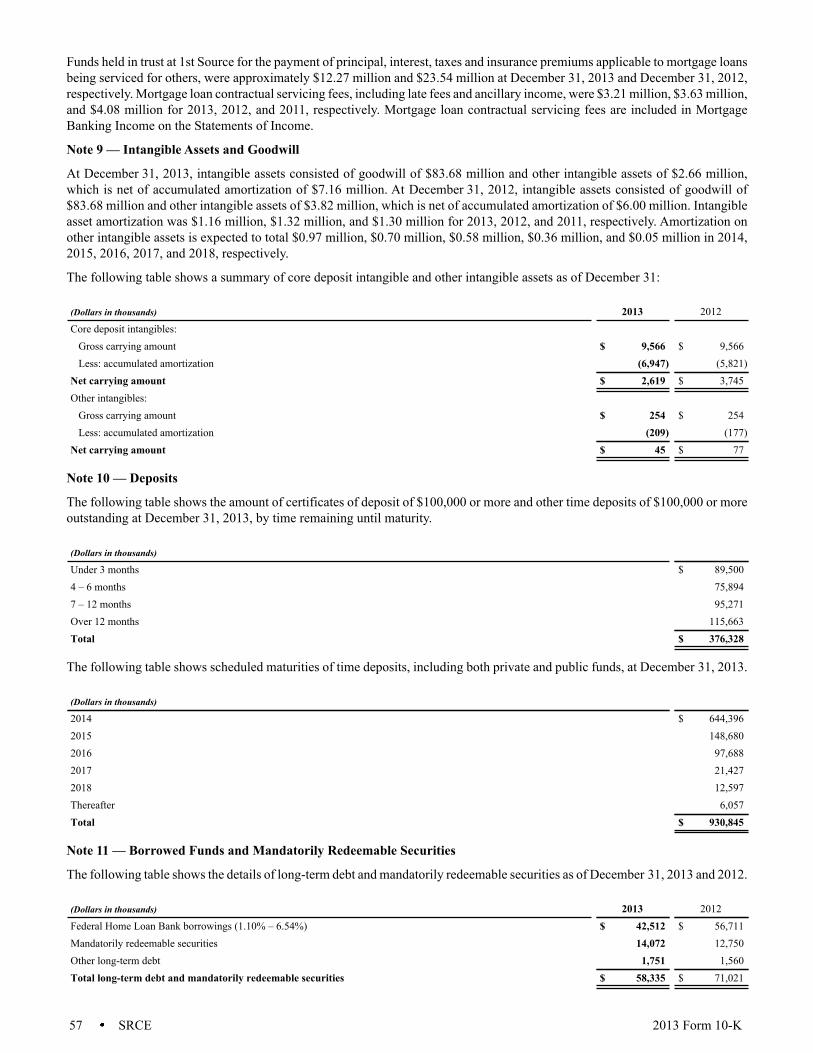
57 SRCE 2013 Form 10-K
Funds held in trust at 1st Source for the payment of principal, interest, taxes and insurance premiums applicable to mortgage loans being serviced for others, were approximately $12.27 million and $23.54 million at December 31, 2013 and December 31, 2012, respectively. Mortgage loan contractual servicing fees, including late fees and ancillary income, were $3.21 million, $3.63 million, and $4.08 million for 2013, 2012, and 2011, respectively. Mortgage loan contractual servicing fees are included in Mortgage Banking Income on the Statements of Income.
Note 9 — Intangible Assets and Goodwill
At December 31, 2013, intangible assets consisted of goodwill of $83.68 million and other intangible assets of $2.66 million, which is net of accumulated amortization of $7.16 million. At December 31, 2012, intangible assets consisted of goodwill of $83.68 million and other intangible assets of $3.82 million, which is net of accumulated amortization of $6.00 million. Intangible asset amortization was $1.16 million, $1.32 million, and $1.30 million for 2013, 2012, and 2011, respectively. Amortization on other intangible assets is expected to total $0.97 million, $0.70 million, $0.58 million, $0.36 million, and $0.05 million in 2014, 2015, 2016, 2017, and 2018, respectively.
The following table shows a summary of core deposit intangible and other intangible assets as of December 31:
(Dollars in thousands) 2013 2012Core deposit intangibles:
Gross carrying amount $ 9,566 $ 9,566Less: accumulated amortization (6,947) (5,821)Net carrying amount $ 2,619 $ 3,745Other intangibles:
Gross carrying amount $ 254 $ 254Less: accumulated amortization (209) (177)Net carrying amount $ 45 $ 77
Note 10 — Deposits
The following table shows the amount of certificates of deposit of $100,000 or more and other time deposits of $100,000 or more outstanding at December 31, 2013, by time remaining until maturity.
(Dollars in thousands)
Under 3 months $ 89,5004 – 6 months 75,8947 – 12 months 95,271Over 12 months 115,663Total $ 376,328
The following table shows scheduled maturities of time deposits, including both private and public funds, at December 31, 2013.
(Dollars in thousands)
2014 $ 644,3962015 148,6802016 97,6882017 21,4272018 12,597Thereafter 6,057Total $ 930,845
Note 11 — Borrowed Funds and Mandatorily Redeemable Securities
The following table shows the details of long-term debt and mandatorily redeemable securities as of December 31, 2013 and 2012.
(Dollars in thousands) 2013 2012Federal Home Loan Bank borrowings (1.10% – 6.54%) $ 42,512 $ 56,711Mandatorily redeemable securities 14,072 12,750Other long-term debt 1,751 1,560Total long-term debt and mandatorily redeemable securities $ 58,335 $ 71,021
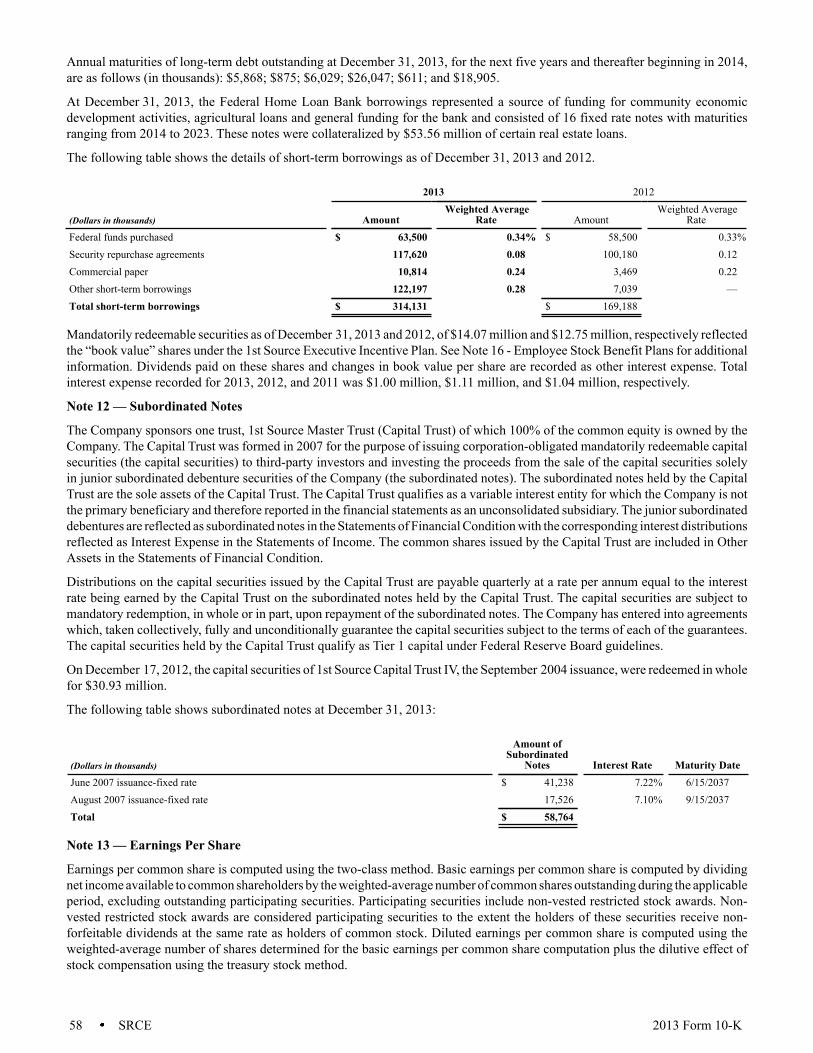
58 SRCE 2013 Form 10-K
Annual maturities of long-term debt outstanding at December 31, 2013, for the next five years and thereafter beginning in 2014, are as follows (in thousands): $5,868; $875; $6,029; $26,047; $611; and $18,905.
At December 31, 2013, the Federal Home Loan Bank borrowings represented a source of funding for community economic development activities, agricultural loans and general funding for the bank and consisted of 16 fixed rate notes with maturities ranging from 2014 to 2023. These notes were collateralized by $53.56 million of certain real estate loans.
The following table shows the details of short-term borrowings as of December 31, 2013 and 2012.
2013 2012
(Dollars in thousands) AmountWeighted Average
Rate AmountWeighted Average
RateFederal funds purchased $ 63,500 0.34% $ 58,500 0.33%Security repurchase agreements 117,620 0.08 100,180 0.12Commercial paper 10,814 0.24 3,469 0.22Other short-term borrowings 122,197 0.28 7,039 —Total short-term borrowings $ 314,131 $ 169,188
Mandatorily redeemable securities as of December 31, 2013 and 2012, of $14.07 million and $12.75 million, respectively reflected the “book value” shares under the 1st Source Executive Incentive Plan. See Note 16 - Employee Stock Benefit Plans for additional information. Dividends paid on these shares and changes in book value per share are recorded as other interest expense. Total interest expense recorded for 2013, 2012, and 2011 was $1.00 million, $1.11 million, and $1.04 million, respectively.
Note 12 — Subordinated Notes
The Company sponsors one trust, 1st Source Master Trust (Capital Trust) of which 100% of the common equity is owned by the Company. The Capital Trust was formed in 2007 for the purpose of issuing corporation-obligated mandatorily redeemable capital securities (the capital securities) to third-party investors and investing the proceeds from the sale of the capital securities solely in junior subordinated debenture securities of the Company (the subordinated notes). The subordinated notes held by the Capital Trust are the sole assets of the Capital Trust. The Capital Trust qualifies as a variable interest entity for which the Company is not the primary beneficiary and therefore reported in the financial statements as an unconsolidated subsidiary. The junior subordinated debentures are reflected as subordinated notes in the Statements of Financial Condition with the corresponding interest distributions reflected as Interest Expense in the Statements of Income. The common shares issued by the Capital Trust are included in Other Assets in the Statements of Financial Condition.
Distributions on the capital securities issued by the Capital Trust are payable quarterly at a rate per annum equal to the interest rate being earned by the Capital Trust on the subordinated notes held by the Capital Trust. The capital securities are subject to mandatory redemption, in whole or in part, upon repayment of the subordinated notes. The Company has entered into agreements which, taken collectively, fully and unconditionally guarantee the capital securities subject to the terms of each of the guarantees. The capital securities held by the Capital Trust qualify as Tier 1 capital under Federal Reserve Board guidelines.
On December 17, 2012, the capital securities of 1st Source Capital Trust IV, the September 2004 issuance, were redeemed in whole for $30.93 million.
The following table shows subordinated notes at December 31, 2013:
(Dollars in thousands)
Amount ofSubordinated
Notes Interest Rate Maturity DateJune 2007 issuance-fixed rate $ 41,238 7.22% 6/15/2037August 2007 issuance-fixed rate 17,526 7.10% 9/15/2037Total $ 58,764
Note 13 — Earnings Per Share
Earnings per common share is computed using the two-class method. Basic earnings per common share is computed by dividing net income available to common shareholders by the weighted-average number of common shares outstanding during the applicable period, excluding outstanding participating securities. Participating securities include non-vested restricted stock awards. Non-vested restricted stock awards are considered participating securities to the extent the holders of these securities receive non-forfeitable dividends at the same rate as holders of common stock. Diluted earnings per common share is computed using the weighted-average number of shares determined for the basic earnings per common share computation plus the dilutive effect of stock compensation using the treasury stock method.
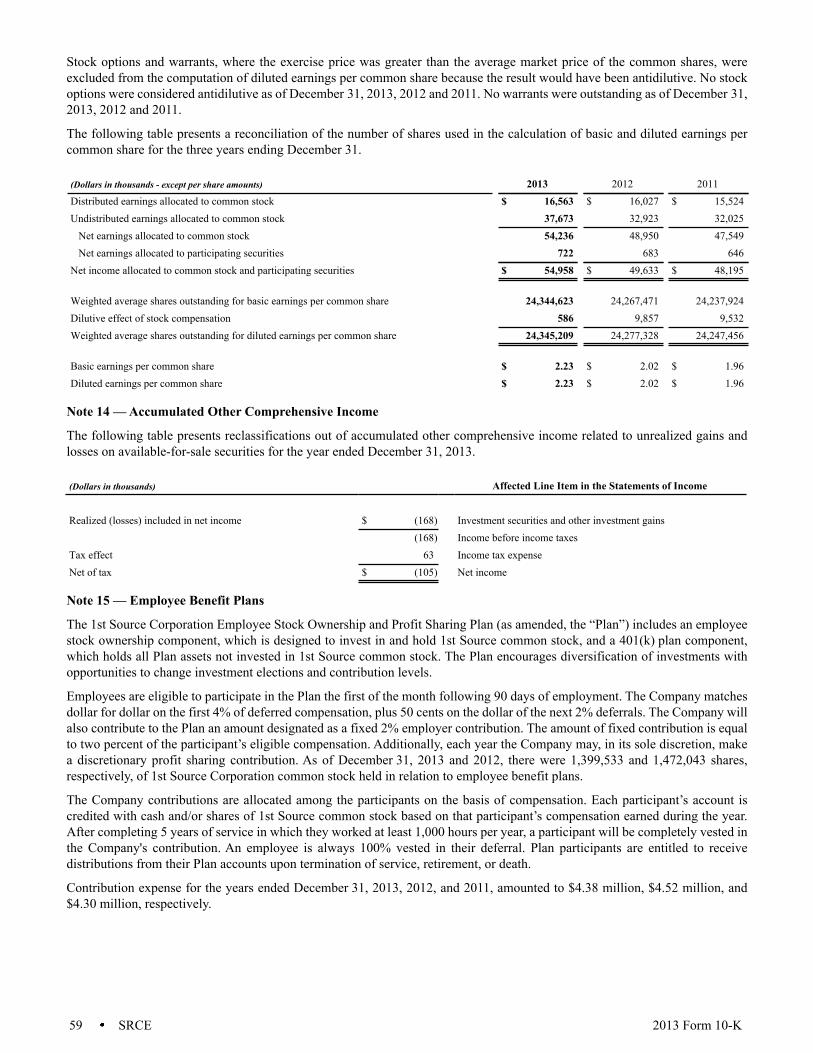
59 SRCE 2013 Form 10-K
Stock options and warrants, where the exercise price was greater than the average market price of the common shares, were excluded from the computation of diluted earnings per common share because the result would have been antidilutive. No stock options were considered antidilutive as of December 31, 2013, 2012 and 2011. No warrants were outstanding as of December 31, 2013, 2012 and 2011.
The following table presents a reconciliation of the number of shares used in the calculation of basic and diluted earnings per common share for the three years ending December 31.
(Dollars in thousands - except per share amounts) 2013 2012 2011Distributed earnings allocated to common stock $ 16,563 $ 16,027 $ 15,524Undistributed earnings allocated to common stock 37,673 32,923 32,025Net earnings allocated to common stock 54,236 48,950 47,549Net earnings allocated to participating securities 722 683 646Net income allocated to common stock and participating securities $ 54,958 $ 49,633 $ 48,195
Weighted average shares outstanding for basic earnings per common share 24,344,623 24,267,471 24,237,924Dilutive effect of stock compensation 586 9,857 9,532Weighted average shares outstanding for diluted earnings per common share 24,345,209 24,277,328 24,247,456
Basic earnings per common share $ 2.23 $ 2.02 $ 1.96Diluted earnings per common share $ 2.23 $ 2.02 $ 1.96
Note 14 — Accumulated Other Comprehensive Income
The following table presents reclassifications out of accumulated other comprehensive income related to unrealized gains and losses on available-for-sale securities for the year ended December 31, 2013.
(Dollars in thousands) Affected Line Item in the Statements of Income
Realized (losses) included in net income $ (168) Investment securities and other investment gains(168) Income before income taxes
Tax effect 63 Income tax expenseNet of tax $ (105) Net income
Note 15 — Employee Benefit Plans
The 1st Source Corporation Employee Stock Ownership and Profit Sharing Plan (as amended, the “Plan”) includes an employee stock ownership component, which is designed to invest in and hold 1st Source common stock, and a 401(k) plan component, which holds all Plan assets not invested in 1st Source common stock. The Plan encourages diversification of investments with opportunities to change investment elections and contribution levels.
Employees are eligible to participate in the Plan the first of the month following 90 days of employment. The Company matches dollar for dollar on the first 4% of deferred compensation, plus 50 cents on the dollar of the next 2% deferrals. The Company will also contribute to the Plan an amount designated as a fixed 2% employer contribution. The amount of fixed contribution is equal to two percent of the participant’s eligible compensation. Additionally, each year the Company may, in its sole discretion, make a discretionary profit sharing contribution. As of December 31, 2013 and 2012, there were 1,399,533 and 1,472,043 shares, respectively, of 1st Source Corporation common stock held in relation to employee benefit plans.
The Company contributions are allocated among the participants on the basis of compensation. Each participant’s account is credited with cash and/or shares of 1st Source common stock based on that participant’s compensation earned during the year. After completing 5 years of service in which they worked at least 1,000 hours per year, a participant will be completely vested in the Company's contribution. An employee is always 100% vested in their deferral. Plan participants are entitled to receive distributions from their Plan accounts upon termination of service, retirement, or death.
Contribution expense for the years ended December 31, 2013, 2012, and 2011, amounted to $4.38 million, $4.52 million, and $4.30 million, respectively.
60 SRCE 2013 Form 10-K
In addition to the 1st Source Corporation Employee Stock Ownership and Profit Sharing Plan, the Company provides a limited health care and life insurance benefit for some of its retired employees. Effective March 31, 2009, the Company amended the plan so that no new retirees would be covered by the plan. The amendment will have no effect on the coverage for retirees covered at the time of the amendment. Prior to amendment, all full-time employees became eligible for these retiree benefits upon reaching age 55 with 20 years of credited service. The retiree medical plan pays a stated percentage of eligible medical expenses reduced by any deductibles and payments made by government programs and other group coverage. The lifetime maximum benefit payable under the medical plan is $15,000 and for life insurance is $3,000.
The Company’s net periodic post retirement benefit cost (recovery) recognized in the Statements of Income for the years ended December 31, 2013, 2012 and 2011, amounted to $(0.04) million, $(0.01) million, and $(0.03) million, respectively. The accrued post retirement benefit cost was not material at December 31, 2013, 2012, and 2011.
Note 16 — Employee Stock Benefit Plans
As of December 31, 2013, the Company had four active stock-based employee compensation plans. These plans include three executive stock award plans, namely, the Executive Incentive Plan (EIP), the Restricted Stock Award Plan (RSAP), and the 1998 Performance Compensation Plan (PCP); and the Employee Stock Purchase Plan (ESPP). The 2011 Stock Option Plan was approved by the shareholders on April 21, 2011 but the Company had not made any grants through December 31, 2013. These stock-based employee compensation plans were established to help retain and motivate key employees. All of the plans have been approved by the shareholders of 1st Source Corporation. The Executive Compensation and Human Resources Committee (the “Committee”) of the 1st Source Corporation Board of Directors has sole authority to select the employees, establish the awards to be issued, and approve the terms and conditions of each award under the stock-based compensation plans.
Stock-based compensation to employees is recognized as compensation cost in the Statements of Income based on their fair values on the measurement date, which, for 1st Source, is the date of grant. Stock-based compensation expense is recognized ratably over the requisite service period for all awards. The total fair value of share awards vested was $1.97 million during 2013, $4.30 million in 2012, and $2.45 million in 2011.
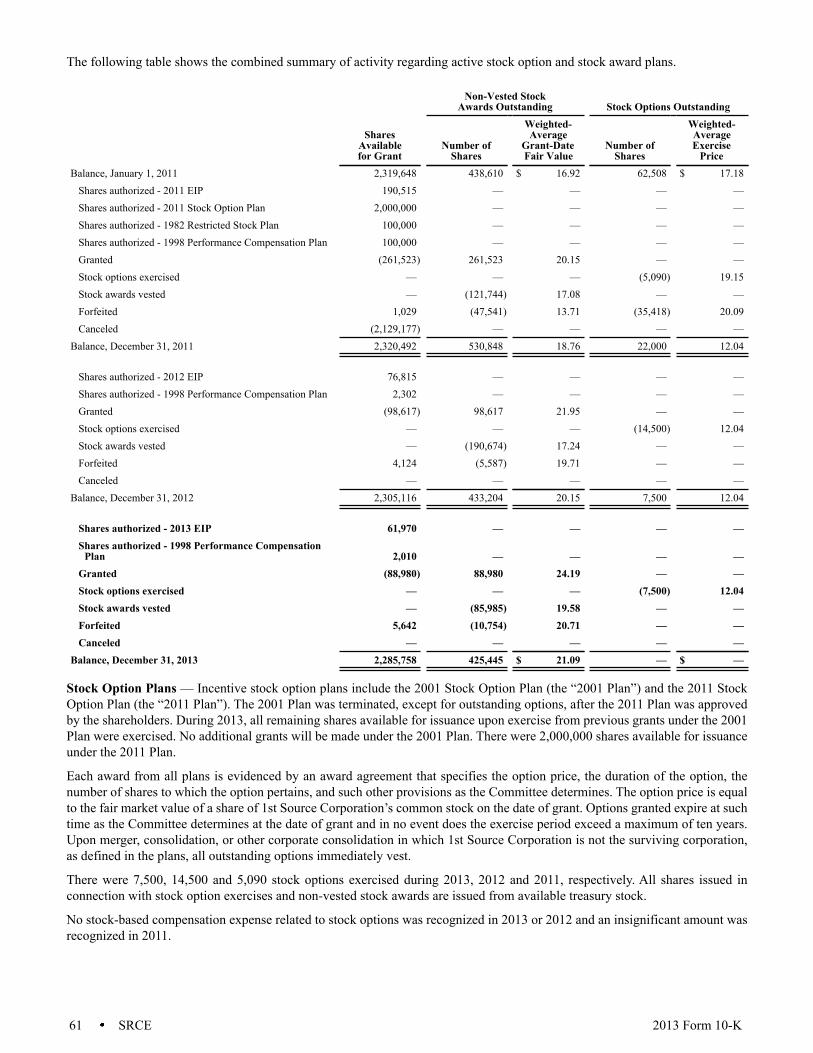
61 SRCE 2013 Form 10-K
The following table shows the combined summary of activity regarding active stock option and stock award plans.
Non-Vested StockAwards Outstanding Stock Options Outstanding
SharesAvailablefor Grant
Number ofShares
Weighted-Average
Grant-DateFair Value
Number ofShares
Weighted-AverageExercise
PriceBalance, January 1, 2011 2,319,648 438,610 $ 16.92 62,508 $ 17.18
Shares authorized - 2011 EIP 190,515 — — — —Shares authorized - 2011 Stock Option Plan 2,000,000 — — — —Shares authorized - 1982 Restricted Stock Plan 100,000 — — — —Shares authorized - 1998 Performance Compensation Plan 100,000 — — — —Granted (261,523) 261,523 20.15 — —Stock options exercised — — — (5,090) 19.15Stock awards vested — (121,744) 17.08 — —Forfeited 1,029 (47,541) 13.71 (35,418) 20.09Canceled (2,129,177) — — — —
Balance, December 31, 2011 2,320,492 530,848 18.76 22,000 12.04
Shares authorized - 2012 EIP 76,815 — — — —Shares authorized - 1998 Performance Compensation Plan 2,302 — — — —Granted (98,617) 98,617 21.95 — —Stock options exercised — — — (14,500) 12.04Stock awards vested — (190,674) 17.24 — —Forfeited 4,124 (5,587) 19.71 — —Canceled — — — — —
Balance, December 31, 2012 2,305,116 433,204 20.15 7,500 12.04
Shares authorized - 2013 EIP 61,970 — — — —Shares authorized - 1998 Performance Compensation
Plan 2,010 — — — —Granted (88,980) 88,980 24.19 — —Stock options exercised — — — (7,500) 12.04Stock awards vested — (85,985) 19.58 — —Forfeited 5,642 (10,754) 20.71 — —Canceled — — — — —
Balance, December 31, 2013 2,285,758 425,445 $ 21.09 — $ —
Stock Option Plans — Incentive stock option plans include the 2001 Stock Option Plan (the “2001 Plan”) and the 2011 Stock Option Plan (the “2011 Plan”). The 2001 Plan was terminated, except for outstanding options, after the 2011 Plan was approved by the shareholders. During 2013, all remaining shares available for issuance upon exercise from previous grants under the 2001 Plan were exercised. No additional grants will be made under the 2001 Plan. There were 2,000,000 shares available for issuance under the 2011 Plan.
Each award from all plans is evidenced by an award agreement that specifies the option price, the duration of the option, the number of shares to which the option pertains, and such other provisions as the Committee determines. The option price is equal to the fair market value of a share of 1st Source Corporation’s common stock on the date of grant. Options granted expire at such time as the Committee determines at the date of grant and in no event does the exercise period exceed a maximum of ten years. Upon merger, consolidation, or other corporate consolidation in which 1st Source Corporation is not the surviving corporation, as defined in the plans, all outstanding options immediately vest.
There were 7,500, 14,500 and 5,090 stock options exercised during 2013, 2012 and 2011, respectively. All shares issued in connection with stock option exercises and non-vested stock awards are issued from available treasury stock.
No stock-based compensation expense related to stock options was recognized in 2013 or 2012 and an insignificant amount was recognized in 2011.

62 SRCE 2013 Form 10-K
The fair value of each option on the date of grant is estimated using the Black-Scholes option pricing model. Expected volatility is based on the historical volatility estimated over a period equal to the expected life of the options. In estimating the fair value of stock options under the Black-Scholes valuation model, separate groups of employees that have similar historical exercise behavior are considered separately. The expected life of the options granted is derived based on past experience and represents the period of time that options granted are expected to be outstanding.
Stock Award Plans — Incentive stock award plans include the EIP, the PCP and the RSAP. The EIP is administered by the Committee. Awards under the EIP and PCP include “book value” shares and “market value” shares of common stock. These shares are awarded annually based on weighted performance criteria and generally vest over a period of five years. The EIP book value shares may only be sold to 1st Source and such sale is mandatory in the event of death, retirement, disability, or termination of employment. The RSAP is designed for key employees. Awards under the RSAP are made to employees recommended by the Chief Executive Officer and approved by the Committee. Shares granted under the RSAP vest over a two to ten year period and vesting is based upon meeting certain various criteria, including continued employment with 1st Source.
Stock-based compensation expense relating to the EIP, PCP and RSAP totaled $2.90 million in 2013, $2.07 million in 2012, and $2.09 million in 2011. The total income tax benefit recognized in the accompanying Statements of Income related to stock-based compensation was $1.10 million in 2013, $0.78 million in 2012, and $0.79 million in 2011. Unrecognized stock-based compensation expense related to non-vested stock awards (EIP/PCP/RSAP) was $6.09 million at December 31, 2013. At such date, the weighted-average period over which this unrecognized expense was expected to be recognized was 3.08 years.
The fair value of non-vested stock awards for the purposes of recognizing stock-based compensation expense is market price of the stock on the measurement date, which, for the Company’s purposes is the date of the award.
Employee Stock Purchase Plan — The Company offers an ESPP for substantially all employees with at least two years of service on the effective date of an offering under the plan. Eligible employees may elect to purchase any dollar amount of stock, so long as such amount does not exceed 25% of their base rate of pay and the aggregate stock accrual rate for all offerings does not exceed $25,000 in any calendar year. The purchase price for shares offered is the lower of the closing market bid price for the offering date or the average market bid price for the five business days preceding the offering date. The purchase price and discount to the actual market closing price on the offering date for the 2013, 2012, and 2011 offerings were $24.32 (1.82%), $20.54 (0.15%), and $20.29 (0.00%), respectively. Payment for the stock is made through payroll deductions over the offering period, and employees may discontinue the deductions at any time and exercise the option or take the funds out of the program. The most recent offering began June 3, 2013 and runs through June 1, 2015, with $180,190 in stock value to be purchased at $24.32 per share.
Note 17 — Income Taxes
The following table shows the composition of income tax expense:
Year Ended December 31 (Dollars in thousands) 2013 2012 2011Current:
Federal $ 28,634 $ 30,041 $ 18,985State 2,298 3,647 2,975
Total current 30,932 33,688 21,960Deferred:
Federal (2,337) (7,087) 3,596State 390 (554) 38
Total deferred (1,947) (7,641) 3,634Total provision $ 28,985 $ 26,047 $ 25,594
The following table shows the reasons for the difference between income tax expense and the amount computed by applying the statutory federal income tax rate (35%) to income before income taxes:
2013 2012 2011
Year Ended December 31 (Dollars in thousands) Amount
Percent ofPretaxIncome Amount
Percent ofPretaxIncome Amount
Percent ofPretaxIncome
Statutory federal income tax $ 29,380 35.0% $ 26,488 35.0% $ 25,826 35.0%(Decrease) increase in income taxes resulting from:
Tax-exempt interest income (1,219) (1.5) (1,370) (1.8) (1,668) (2.3)State taxes, net of federal income tax benefit 1,747 2.1 2,010 2.7 1,958 2.7Other (923) (1.1) (1,081) (1.5) (522) (0.7)
Total $ 28,985 34.5% $ 26,047 34.4% $ 25,594 34.7%
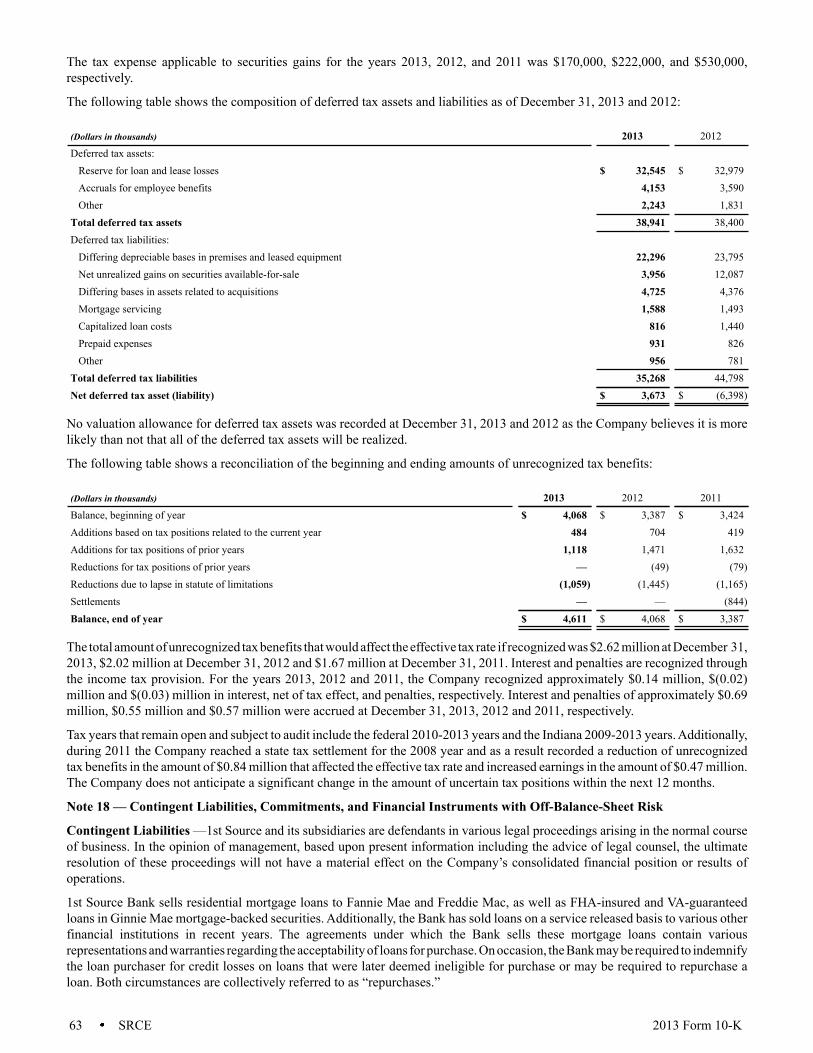
63 SRCE 2013 Form 10-K
The tax expense applicable to securities gains for the years 2013, 2012, and 2011 was $170,000, $222,000, and $530,000, respectively.
The following table shows the composition of deferred tax assets and liabilities as of December 31, 2013 and 2012:
(Dollars in thousands) 2013 2012Deferred tax assets:
Reserve for loan and lease losses $ 32,545 $ 32,979Accruals for employee benefits 4,153 3,590Other 2,243 1,831
Total deferred tax assets 38,941 38,400Deferred tax liabilities:
Differing depreciable bases in premises and leased equipment 22,296 23,795Net unrealized gains on securities available-for-sale 3,956 12,087Differing bases in assets related to acquisitions 4,725 4,376Mortgage servicing 1,588 1,493Capitalized loan costs 816 1,440Prepaid expenses 931 826Other 956 781
Total deferred tax liabilities 35,268 44,798Net deferred tax asset (liability) $ 3,673 $ (6,398)
No valuation allowance for deferred tax assets was recorded at December 31, 2013 and 2012 as the Company believes it is more likely than not that all of the deferred tax assets will be realized.
The following table shows a reconciliation of the beginning and ending amounts of unrecognized tax benefits:
(Dollars in thousands) 2013 2012 2011Balance, beginning of year $ 4,068 $ 3,387 $ 3,424Additions based on tax positions related to the current year 484 704 419Additions for tax positions of prior years 1,118 1,471 1,632Reductions for tax positions of prior years — (49) (79)Reductions due to lapse in statute of limitations (1,059) (1,445) (1,165)Settlements — — (844)Balance, end of year $ 4,611 $ 4,068 $ 3,387
The total amount of unrecognized tax benefits that would affect the effective tax rate if recognized was $2.62 million at December 31, 2013, $2.02 million at December 31, 2012 and $1.67 million at December 31, 2011. Interest and penalties are recognized through the income tax provision. For the years 2013, 2012 and 2011, the Company recognized approximately $0.14 million, $(0.02) million and $(0.03) million in interest, net of tax effect, and penalties, respectively. Interest and penalties of approximately $0.69 million, $0.55 million and $0.57 million were accrued at December 31, 2013, 2012 and 2011, respectively.
Tax years that remain open and subject to audit include the federal 2010-2013 years and the Indiana 2009-2013 years. Additionally, during 2011 the Company reached a state tax settlement for the 2008 year and as a result recorded a reduction of unrecognized tax benefits in the amount of $0.84 million that affected the effective tax rate and increased earnings in the amount of $0.47 million. The Company does not anticipate a significant change in the amount of uncertain tax positions within the next 12 months.
Note 18 — Contingent Liabilities, Commitments, and Financial Instruments with Off-Balance-Sheet Risk
Contingent Liabilities —1st Source and its subsidiaries are defendants in various legal proceedings arising in the normal course of business. In the opinion of management, based upon present information including the advice of legal counsel, the ultimate resolution of these proceedings will not have a material effect on the Company’s consolidated financial position or results of operations.
1st Source Bank sells residential mortgage loans to Fannie Mae and Freddie Mac, as well as FHA-insured and VA-guaranteed loans in Ginnie Mae mortgage-backed securities. Additionally, the Bank has sold loans on a service released basis to various other financial institutions in recent years. The agreements under which the Bank sells these mortgage loans contain various representations and warranties regarding the acceptability of loans for purchase. On occasion, the Bank may be required to indemnify the loan purchaser for credit losses on loans that were later deemed ineligible for purchase or may be required to repurchase a loan. Both circumstances are collectively referred to as “repurchases.”
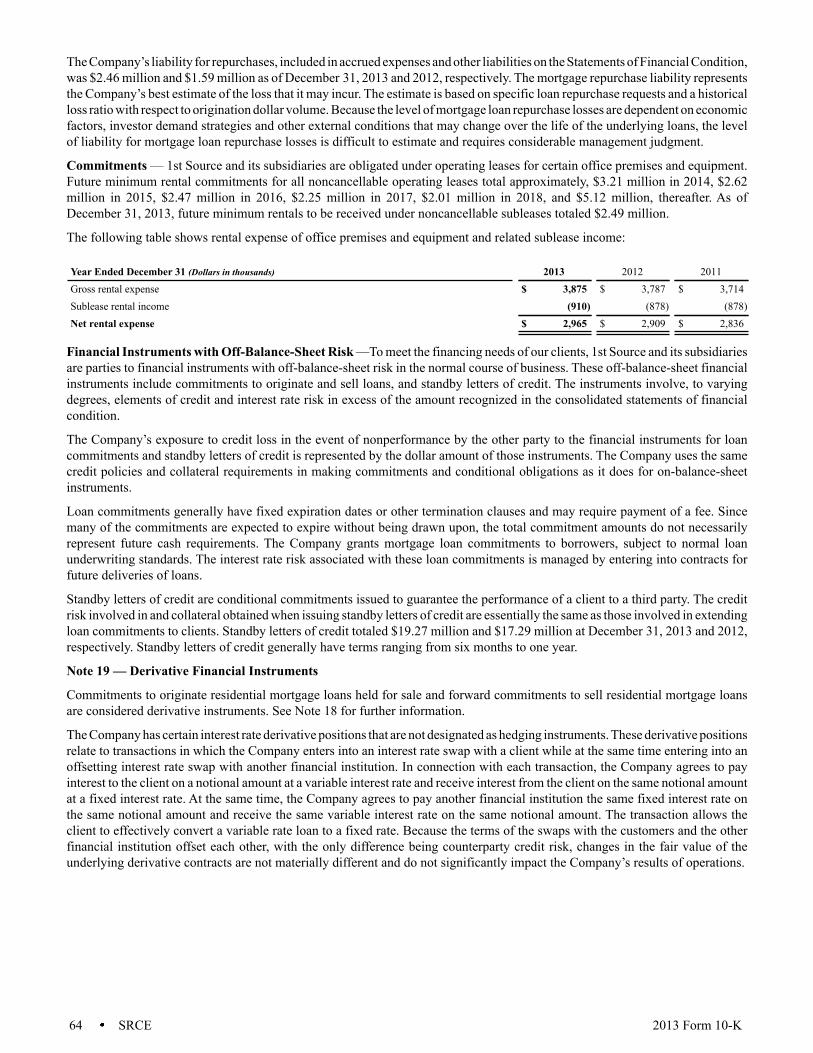
64 SRCE 2013 Form 10-K
The Company’s liability for repurchases, included in accrued expenses and other liabilities on the Statements of Financial Condition, was $2.46 million and $1.59 million as of December 31, 2013 and 2012, respectively. The mortgage repurchase liability represents the Company’s best estimate of the loss that it may incur. The estimate is based on specific loan repurchase requests and a historical loss ratio with respect to origination dollar volume. Because the level of mortgage loan repurchase losses are dependent on economic factors, investor demand strategies and other external conditions that may change over the life of the underlying loans, the level of liability for mortgage loan repurchase losses is difficult to estimate and requires considerable management judgment.
Commitments — 1st Source and its subsidiaries are obligated under operating leases for certain office premises and equipment. Future minimum rental commitments for all noncancellable operating leases total approximately, $3.21 million in 2014, $2.62 million in 2015, $2.47 million in 2016, $2.25 million in 2017, $2.01 million in 2018, and $5.12 million, thereafter. As of December 31, 2013, future minimum rentals to be received under noncancellable subleases totaled $2.49 million.
The following table shows rental expense of office premises and equipment and related sublease income:
Year Ended December 31 (Dollars in thousands) 2013 2012 2011Gross rental expense $ 3,875 $ 3,787 $ 3,714Sublease rental income (910) (878) (878)Net rental expense $ 2,965 $ 2,909 $ 2,836
Financial Instruments with Off-Balance-Sheet Risk —To meet the financing needs of our clients, 1st Source and its subsidiaries are parties to financial instruments with off-balance-sheet risk in the normal course of business. These off-balance-sheet financial instruments include commitments to originate and sell loans, and standby letters of credit. The instruments involve, to varying degrees, elements of credit and interest rate risk in excess of the amount recognized in the consolidated statements of financial condition.
The Company’s exposure to credit loss in the event of nonperformance by the other party to the financial instruments for loan commitments and standby letters of credit is represented by the dollar amount of those instruments. The Company uses the same credit policies and collateral requirements in making commitments and conditional obligations as it does for on-balance-sheet instruments.
Loan commitments generally have fixed expiration dates or other termination clauses and may require payment of a fee. Since many of the commitments are expected to expire without being drawn upon, the total commitment amounts do not necessarily represent future cash requirements. The Company grants mortgage loan commitments to borrowers, subject to normal loan underwriting standards. The interest rate risk associated with these loan commitments is managed by entering into contracts for future deliveries of loans.
Standby letters of credit are conditional commitments issued to guarantee the performance of a client to a third party. The credit risk involved in and collateral obtained when issuing standby letters of credit are essentially the same as those involved in extending loan commitments to clients. Standby letters of credit totaled $19.27 million and $17.29 million at December 31, 2013 and 2012, respectively. Standby letters of credit generally have terms ranging from six months to one year.
Note 19 — Derivative Financial Instruments
Commitments to originate residential mortgage loans held for sale and forward commitments to sell residential mortgage loans are considered derivative instruments. See Note 18 for further information.
The Company has certain interest rate derivative positions that are not designated as hedging instruments. These derivative positions relate to transactions in which the Company enters into an interest rate swap with a client while at the same time entering into an offsetting interest rate swap with another financial institution. In connection with each transaction, the Company agrees to pay interest to the client on a notional amount at a variable interest rate and receive interest from the client on the same notional amount at a fixed interest rate. At the same time, the Company agrees to pay another financial institution the same fixed interest rate on the same notional amount and receive the same variable interest rate on the same notional amount. The transaction allows the client to effectively convert a variable rate loan to a fixed rate. Because the terms of the swaps with the customers and the other financial institution offset each other, with the only difference being counterparty credit risk, changes in the fair value of the underlying derivative contracts are not materially different and do not significantly impact the Company’s results of operations.
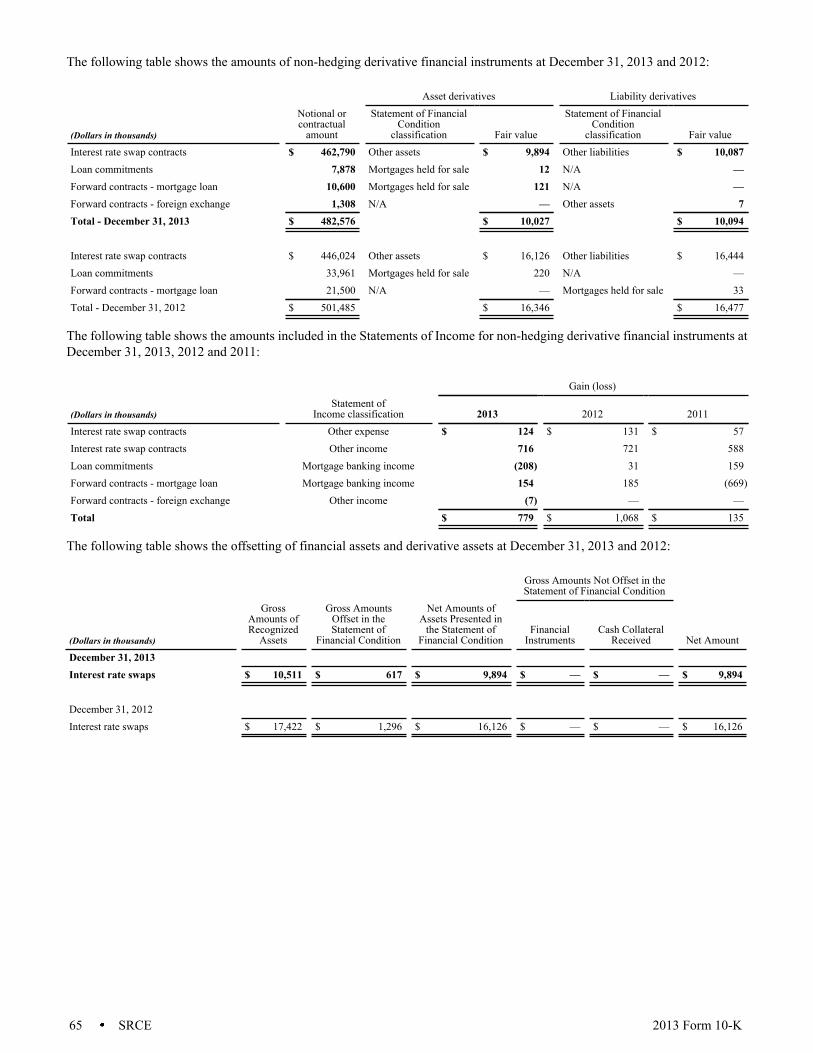
65 SRCE 2013 Form 10-K
The following table shows the amounts of non-hedging derivative financial instruments at December 31, 2013 and 2012:
Asset derivatives Liability derivatives
(Dollars in thousands)
Notional orcontractual
amount
Statement of FinancialCondition
classification Fair value
Statement of FinancialCondition
classification Fair valueInterest rate swap contracts $ 462,790 Other assets $ 9,894 Other liabilities $ 10,087Loan commitments 7,878 Mortgages held for sale 12 N/A —Forward contracts - mortgage loan 10,600 Mortgages held for sale 121 N/A —Forward contracts - foreign exchange 1,308 N/A — Other assets 7Total - December 31, 2013 $ 482,576
$ 10,027
$ 10,094
Interest rate swap contracts $ 446,024 Other assets $ 16,126 Other liabilities $ 16,444Loan commitments 33,961 Mortgages held for sale 220 N/A —Forward contracts - mortgage loan 21,500 N/A — Mortgages held for sale 33Total - December 31, 2012 $ 501,485
$ 16,346
$ 16,477
The following table shows the amounts included in the Statements of Income for non-hedging derivative financial instruments at December 31, 2013, 2012 and 2011:
Gain (loss)
(Dollars in thousands)Statement of
Income classification 2013 2012 2011Interest rate swap contracts Other expense $ 124 $ 131 $ 57Interest rate swap contracts Other income 716 721 588Loan commitments Mortgage banking income (208) 31 159Forward contracts - mortgage loan Mortgage banking income 154 185 (669)Forward contracts - foreign exchange Other income (7) — —Total $ 779 $ 1,068 $ 135
The following table shows the offsetting of financial assets and derivative assets at December 31, 2013 and 2012:
Gross Amounts Not Offset in theStatement of Financial Condition
(Dollars in thousands)
GrossAmounts ofRecognized
Assets
Gross AmountsOffset in theStatement of
Financial Condition
Net Amounts ofAssets Presented in
the Statement ofFinancial Condition
FinancialInstruments
Cash CollateralReceived Net Amount
December 31, 2013Interest rate swaps $ 10,511 $ 617 $ 9,894 $ — $ — $ 9,894
December 31, 2012Interest rate swaps $ 17,422 $ 1,296 $ 16,126 $ — $ — $ 16,126
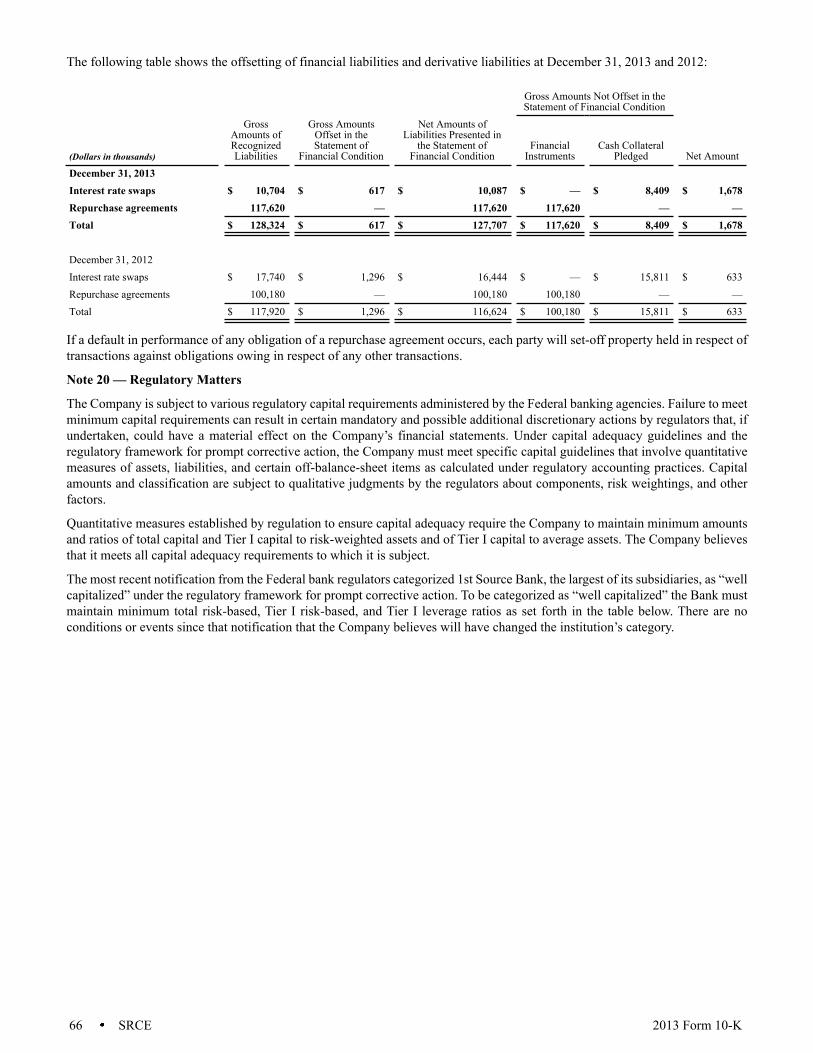
66 SRCE 2013 Form 10-K
The following table shows the offsetting of financial liabilities and derivative liabilities at December 31, 2013 and 2012:
Gross Amounts Not Offset in theStatement of Financial Condition
(Dollars in thousands)
GrossAmounts ofRecognizedLiabilities
Gross AmountsOffset in theStatement of
Financial Condition
Net Amounts ofLiabilities Presented in
the Statement ofFinancial Condition
FinancialInstruments
Cash CollateralPledged Net Amount
December 31, 2013Interest rate swaps $ 10,704 $ 617 $ 10,087 $ — $ 8,409 $ 1,678Repurchase agreements 117,620 — 117,620 117,620 — —Total $ 128,324 $ 617 $ 127,707 $ 117,620 $ 8,409 $ 1,678
December 31, 2012Interest rate swaps $ 17,740 $ 1,296 $ 16,444 $ — $ 15,811 $ 633Repurchase agreements 100,180 — 100,180 100,180 — —Total $ 117,920 $ 1,296 $ 116,624 $ 100,180 $ 15,811 $ 633
If a default in performance of any obligation of a repurchase agreement occurs, each party will set-off property held in respect of transactions against obligations owing in respect of any other transactions.
Note 20 — Regulatory Matters
The Company is subject to various regulatory capital requirements administered by the Federal banking agencies. Failure to meet minimum capital requirements can result in certain mandatory and possible additional discretionary actions by regulators that, if undertaken, could have a material effect on the Company’s financial statements. Under capital adequacy guidelines and the regulatory framework for prompt corrective action, the Company must meet specific capital guidelines that involve quantitative measures of assets, liabilities, and certain off-balance-sheet items as calculated under regulatory accounting practices. Capital amounts and classification are subject to qualitative judgments by the regulators about components, risk weightings, and other factors.
Quantitative measures established by regulation to ensure capital adequacy require the Company to maintain minimum amounts and ratios of total capital and Tier I capital to risk-weighted assets and of Tier I capital to average assets. The Company believes that it meets all capital adequacy requirements to which it is subject.
The most recent notification from the Federal bank regulators categorized 1st Source Bank, the largest of its subsidiaries, as “well capitalized” under the regulatory framework for prompt corrective action. To be categorized as “well capitalized” the Bank must maintain minimum total risk-based, Tier I risk-based, and Tier I leverage ratios as set forth in the table below. There are no conditions or events since that notification that the Company believes will have changed the institution’s category.
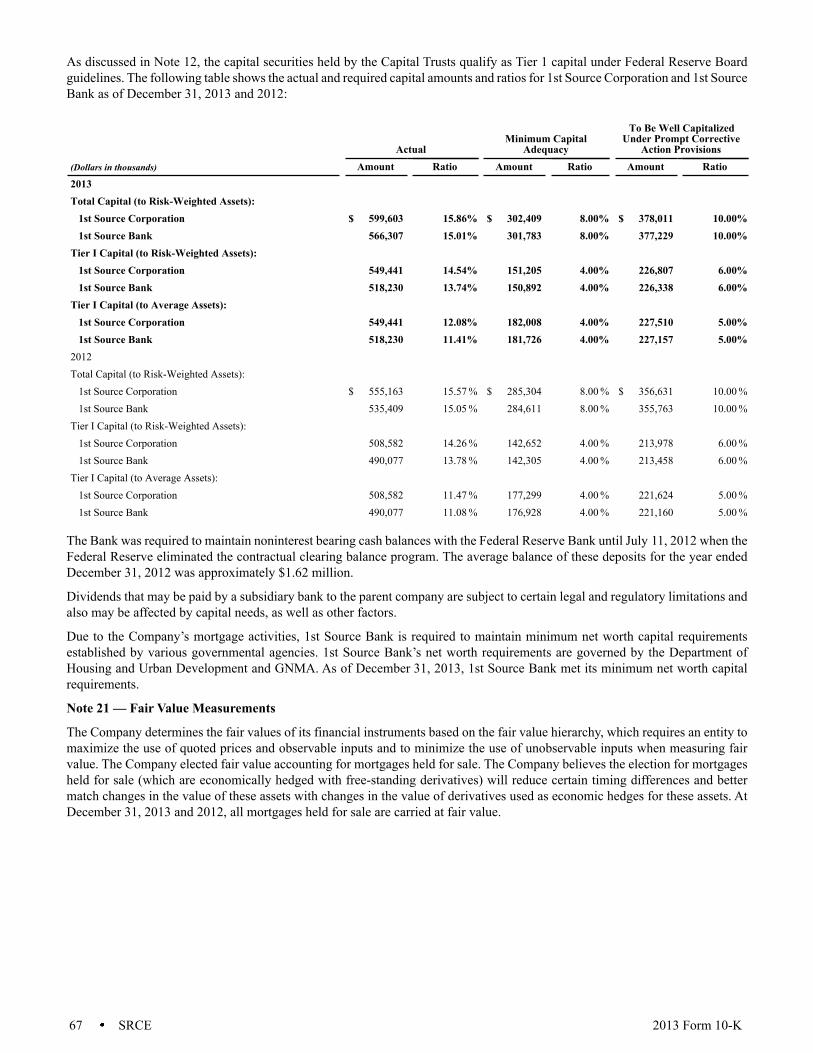
67 SRCE 2013 Form 10-K
As discussed in Note 12, the capital securities held by the Capital Trusts qualify as Tier 1 capital under Federal Reserve Board guidelines. The following table shows the actual and required capital amounts and ratios for 1st Source Corporation and 1st Source Bank as of December 31, 2013 and 2012:
Actual
Minimum CapitalAdequacy
To Be Well CapitalizedUnder Prompt Corrective
Action Provisions(Dollars in thousands) Amount Ratio Amount Ratio Amount Ratio2013 Total Capital (to Risk-Weighted Assets):
1st Source Corporation $ 599,603 15.86% $ 302,409 8.00% $ 378,011 10.00%1st Source Bank 566,307 15.01% 301,783 8.00% 377,229 10.00%
Tier I Capital (to Risk-Weighted Assets): 1st Source Corporation 549,441 14.54% 151,205 4.00% 226,807 6.00%1st Source Bank 518,230 13.74% 150,892 4.00% 226,338 6.00%
Tier I Capital (to Average Assets): 1st Source Corporation 549,441 12.08% 182,008 4.00% 227,510 5.00%1st Source Bank 518,230 11.41% 181,726 4.00% 227,157 5.00%
2012 Total Capital (to Risk-Weighted Assets):
1st Source Corporation $ 555,163 15.57 % $ 285,304 8.00 % $ 356,631 10.00 %1st Source Bank 535,409 15.05 % 284,611 8.00 % 355,763 10.00 %
Tier I Capital (to Risk-Weighted Assets): 1st Source Corporation 508,582 14.26 % 142,652 4.00 % 213,978 6.00 %1st Source Bank 490,077 13.78 % 142,305 4.00 % 213,458 6.00 %
Tier I Capital (to Average Assets): 1st Source Corporation 508,582 11.47 % 177,299 4.00 % 221,624 5.00 %1st Source Bank 490,077 11.08 % 176,928 4.00 % 221,160 5.00 %
The Bank was required to maintain noninterest bearing cash balances with the Federal Reserve Bank until July 11, 2012 when the Federal Reserve eliminated the contractual clearing balance program. The average balance of these deposits for the year ended December 31, 2012 was approximately $1.62 million.
Dividends that may be paid by a subsidiary bank to the parent company are subject to certain legal and regulatory limitations and also may be affected by capital needs, as well as other factors.
Due to the Company’s mortgage activities, 1st Source Bank is required to maintain minimum net worth capital requirements established by various governmental agencies. 1st Source Bank’s net worth requirements are governed by the Department of Housing and Urban Development and GNMA. As of December 31, 2013, 1st Source Bank met its minimum net worth capital requirements.
Note 21 — Fair Value Measurements
The Company determines the fair values of its financial instruments based on the fair value hierarchy, which requires an entity to maximize the use of quoted prices and observable inputs and to minimize the use of unobservable inputs when measuring fair value. The Company elected fair value accounting for mortgages held for sale. The Company believes the election for mortgages held for sale (which are economically hedged with free-standing derivatives) will reduce certain timing differences and better match changes in the value of these assets with changes in the value of derivatives used as economic hedges for these assets. At December 31, 2013 and 2012, all mortgages held for sale are carried at fair value.

68 SRCE 2013 Form 10-K
The following table shows the differences between fair value carrying amount of mortgages held for sale measured at fair value and the aggregate unpaid principal amount the Company is contractually entitled to receive at maturity on December 31, 2013 and 2012:
(Dollars in thousands) Fair value carrying
amountAggregate unpaid
principal
Excess of fair valuecarrying amount
over (under) unpaidprincipal
December 31, 2013 Mortgages held for sale reported at fair value:
Total Loans $ 6,079 $ 5,974 $ 105 (1)December 31, 2012 Mortgages held for sale reported at fair value:
Total Loans $ 10,879 $ 10,293 $ 586 (1)
(1)The excess of fair value carrying amount over unpaid principal is included in mortgage banking income and includes changes in fair value at and subsequent to funding and gains and losses on the related loan commitment prior to funding.
Financial Instruments on Recurring Basis:
The following is a description of the valuation methodologies used for financial instruments measured at fair value on a recurring basis:
Investment securities available for sale are valued primarily by a third party pricing agent. Prices supplied by the independent pricing agent, as well as their pricing methodologies and assumptions, are reviewed by the Company for reasonableness and to ensure such prices are aligned with market levels. In general, the Company’s investment securities do not possess a complex structure that could introduce greater valuation risk. The portfolio mainly consists of traditional investments including U.S. Treasury and Federal agencies securities, federal agency mortgage pass-through securities, and general obligation and revenue municipal bonds. Pricing for such instruments is fairly generic and is easily obtained. On a quarterly basis, prices supplied by the pricing agent are validated by comparison to prices obtained from other third party sources for a material portion of the portfolio.
The valuation policy and procedures for Level 3 fair value measurements of available for sale debt securities are decided through collaboration between management of the Corporate Accounting and Funds Management departments. The changes in fair value measurement for Level 3 securities are analyzed on a periodic basis under a collaborative framework with the aforementioned departments. The methodology and variables used for input are derived from the combination of observable and unobservable inputs. The unobservable inputs are determined through internal assumptions that may vary from period to period due to external factors, such as market movement and credit rating adjustments.
Both the market and income valuation approaches are implemented using the following types of inputs:
• U.S. treasuries are priced using the market approach and utilizing live data feeds from active market exchanges for identical securities.
• Government-sponsored agency debt securities and corporate bonds are primarily priced using available market information through processes such as benchmark curves, market valuations of like securities, sector groupings and matrix pricing.
• Other government-sponsored agency securities, mortgage-backed securities and some of the actively traded REMICs and CMOs, are primarily priced using available market information including benchmark yields, prepayment speeds, spreads and volatility of similar securities.
• Other inactive government-sponsored agency securities are primarily priced using consensus pricing and dealer quotes.
• State and political subdivisions are largely grouped by characteristics, i.e., geographical data and source of revenue in trade dissemination systems. Since some securities are not traded daily and due to other grouping limitations, active market quotes are often obtained using benchmarking for like securities. Local direct placement municipal securities, with very little market activity, are priced using an appropriate market yield curve.
• Marketable equity (common) securities are primarily priced using the market approach and utilizing live data feeds from active market exchanges for identical securities.
Trading account securities are priced using the market approach and utilizing live data feeds from active market exchanges for identical securities.
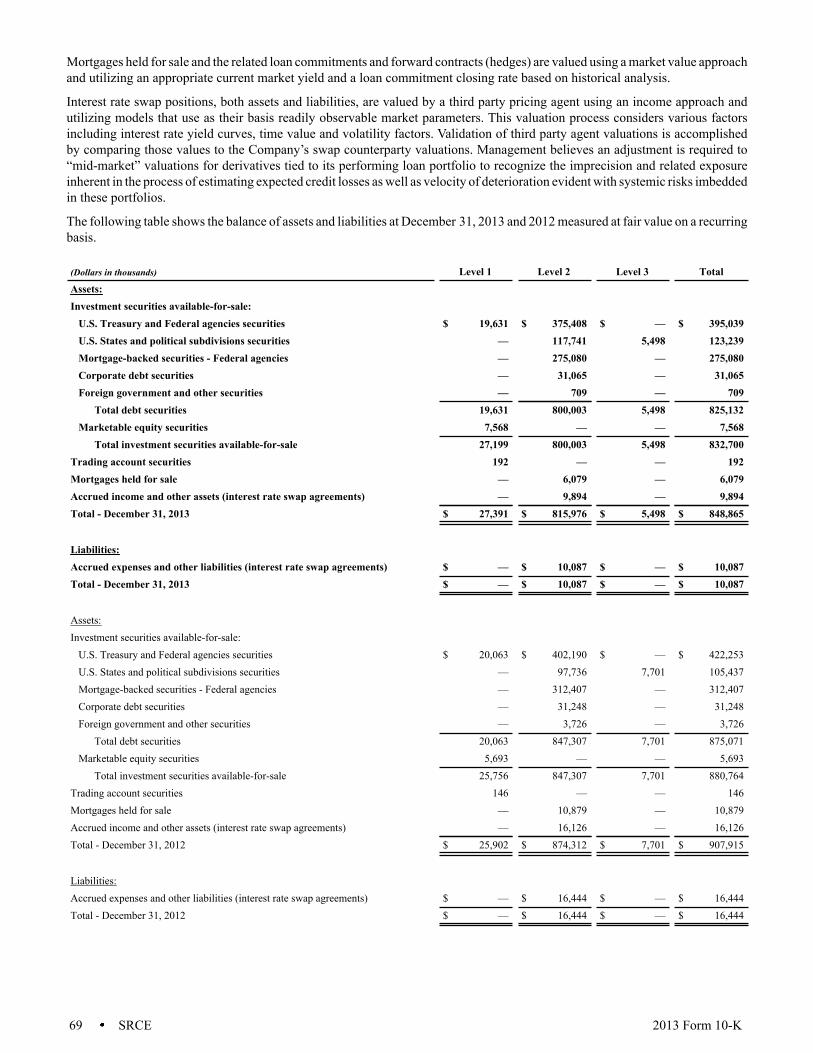
69 SRCE 2013 Form 10-K
Mortgages held for sale and the related loan commitments and forward contracts (hedges) are valued using a market value approach and utilizing an appropriate current market yield and a loan commitment closing rate based on historical analysis.
Interest rate swap positions, both assets and liabilities, are valued by a third party pricing agent using an income approach and utilizing models that use as their basis readily observable market parameters. This valuation process considers various factors including interest rate yield curves, time value and volatility factors. Validation of third party agent valuations is accomplished by comparing those values to the Company’s swap counterparty valuations. Management believes an adjustment is required to “mid-market” valuations for derivatives tied to its performing loan portfolio to recognize the imprecision and related exposure inherent in the process of estimating expected credit losses as well as velocity of deterioration evident with systemic risks imbedded in these portfolios.
The following table shows the balance of assets and liabilities at December 31, 2013 and 2012 measured at fair value on a recurring basis.
(Dollars in thousands) Level 1 Level 2 Level 3 TotalAssets: Investment securities available-for-sale:
U.S. Treasury and Federal agencies securities $ 19,631 $ 375,408 $ — $ 395,039U.S. States and political subdivisions securities — 117,741 5,498 123,239Mortgage-backed securities - Federal agencies — 275,080 — 275,080Corporate debt securities — 31,065 — 31,065Foreign government and other securities — 709 — 709
Total debt securities 19,631 800,003 5,498 825,132Marketable equity securities 7,568 — — 7,568
Total investment securities available-for-sale 27,199 800,003 5,498 832,700Trading account securities 192 — — 192Mortgages held for sale — 6,079 — 6,079Accrued income and other assets (interest rate swap agreements) — 9,894 — 9,894Total - December 31, 2013 $ 27,391 $ 815,976 $ 5,498 $ 848,865
Liabilities: Accrued expenses and other liabilities (interest rate swap agreements) $ — $ 10,087 $ — $ 10,087Total - December 31, 2013 $ — $ 10,087 $ — $ 10,087
Assets: Investment securities available-for-sale:
U.S. Treasury and Federal agencies securities $ 20,063 $ 402,190 $ — $ 422,253U.S. States and political subdivisions securities — 97,736 7,701 105,437Mortgage-backed securities - Federal agencies — 312,407 — 312,407Corporate debt securities — 31,248 — 31,248Foreign government and other securities — 3,726 — 3,726
Total debt securities 20,063 847,307 7,701 875,071Marketable equity securities 5,693 — — 5,693
Total investment securities available-for-sale 25,756 847,307 7,701 880,764Trading account securities 146 — — 146Mortgages held for sale — 10,879 — 10,879Accrued income and other assets (interest rate swap agreements) — 16,126 — 16,126Total - December 31, 2012 $ 25,902 $ 874,312 $ 7,701 $ 907,915
Liabilities: Accrued expenses and other liabilities (interest rate swap agreements) $ — $ 16,444 $ — $ 16,444Total - December 31, 2012 $ — $ 16,444 $ — $ 16,444
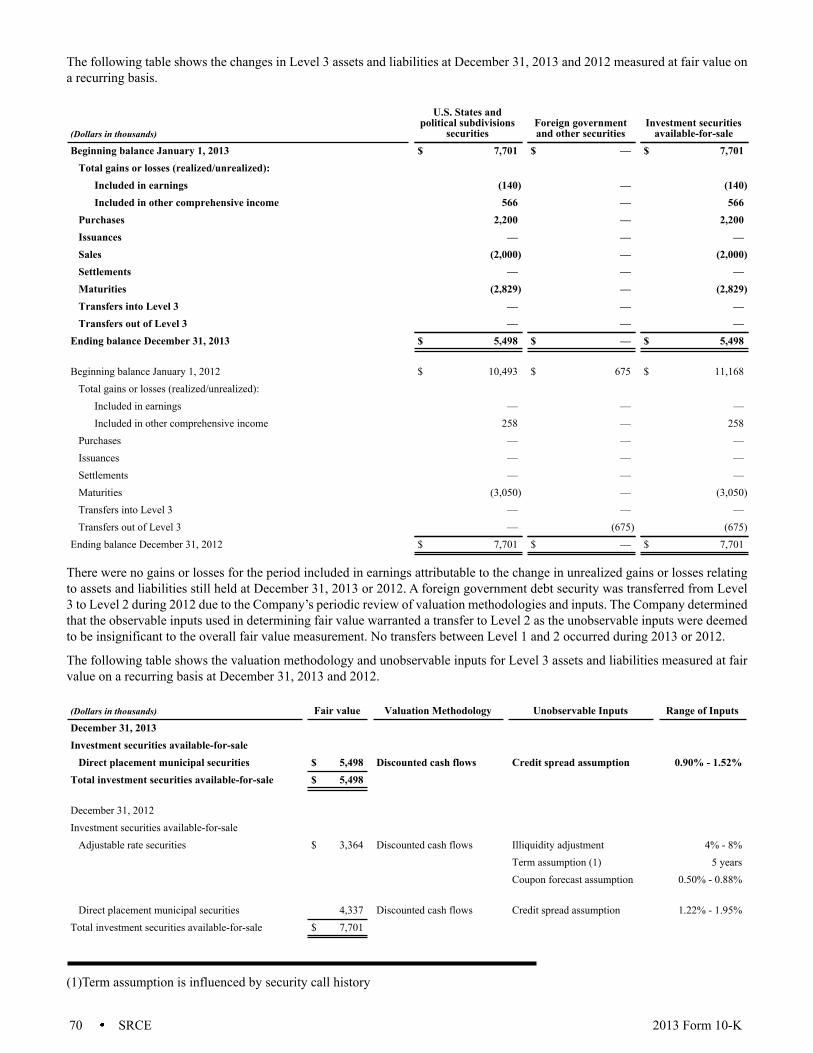
70 SRCE 2013 Form 10-K
The following table shows the changes in Level 3 assets and liabilities at December 31, 2013 and 2012 measured at fair value on a recurring basis.
(Dollars in thousands)
U.S. States andpolitical subdivisions
securitiesForeign governmentand other securities
Investment securitiesavailable-for-sale
Beginning balance January 1, 2013 $ 7,701 $ — $ 7,701Total gains or losses (realized/unrealized):
Included in earnings (140) — (140)Included in other comprehensive income 566 — 566
Purchases 2,200 — 2,200Issuances — — —Sales (2,000) — (2,000)Settlements — — —Maturities (2,829) — (2,829)Transfers into Level 3 — — —Transfers out of Level 3 — — —
Ending balance December 31, 2013 $ 5,498 $ — $ 5,498
Beginning balance January 1, 2012 $ 10,493 $ 675 $ 11,168Total gains or losses (realized/unrealized):
Included in earnings — — —Included in other comprehensive income 258 — 258
Purchases — — —Issuances — — —Settlements — — —Maturities (3,050) — (3,050)Transfers into Level 3 — — —Transfers out of Level 3 — (675) (675)
Ending balance December 31, 2012 $ 7,701 $ — $ 7,701
There were no gains or losses for the period included in earnings attributable to the change in unrealized gains or losses relating to assets and liabilities still held at December 31, 2013 or 2012. A foreign government debt security was transferred from Level 3 to Level 2 during 2012 due to the Company’s periodic review of valuation methodologies and inputs. The Company determined that the observable inputs used in determining fair value warranted a transfer to Level 2 as the unobservable inputs were deemed to be insignificant to the overall fair value measurement. No transfers between Level 1 and 2 occurred during 2013 or 2012.
The following table shows the valuation methodology and unobservable inputs for Level 3 assets and liabilities measured at fair value on a recurring basis at December 31, 2013 and 2012.
(Dollars in thousands) Fair value Valuation Methodology Unobservable Inputs Range of InputsDecember 31, 2013Investment securities available-for-sale
Direct placement municipal securities $ 5,498 Discounted cash flows Credit spread assumption 0.90% - 1.52%Total investment securities available-for-sale $ 5,498
December 31, 2012Investment securities available-for-sale
Adjustable rate securities $ 3,364 Discounted cash flows Illiquidity adjustment 4% - 8%Term assumption (1) 5 yearsCoupon forecast assumption 0.50% - 0.88%
Direct placement municipal securities 4,337 Discounted cash flows Credit spread assumption 1.22% - 1.95%Total investment securities available-for-sale $ 7,701
(1)Term assumption is influenced by security call history

71 SRCE 2013 Form 10-K
The sensitivity to changes in the unobservable inputs and their impact on the fair value measurement can be significant. The significant unobservable input for direct placement municipal securities is the underlying market level used to determine the fair value measure. An increase (decrease) in the estimated yield level of the market will decrease (increase) the fair value measure of the securities. The significant unobservable inputs for Adjustable Rate Securities are illiquidity, term and coupon forecast assumptions. The illiquidity adjustment is negatively correlated to the fair value measure. An increase (decrease) in the determined illiquidity adjustment will lower (increase) the fair value measure. The term assumption is negatively correlated to the fair value measure. An increase (decrease) in the determined term adjustment will decrease (increase) the fair value measure. The coupon forecast is positively correlated to the fair value measure. An increase (decrease) in the determined coupon forecast will increase (decrease) the fair value measure. A permutation that includes a change in the coupon forecast with a change in either or both of the two variables will mitigate the significance of the change to the fair value measure.
Financial Instruments on Non-recurring Basis:
The Company may be required, from time to time, to measure certain other financial assets at fair value on a non-recurring basis in accordance with GAAP. These adjustments to fair value usually result from application of lower of cost or market accounting or impairment charges of individual assets.
The Credit Policy Committee, a management committee, is responsible for overseeing the valuation processes and procedures for Level 3 measurements of impaired loans, other real estate and repossessions. The Credit Policy Committee reviews these assets on a quarterly basis to determine the accuracy of the observable inputs, generally third party appraisals, auction values, values derived from trade publications and data submitted by the borrower, and the appropriateness of the unobservable inputs, generally discounts due to current market conditions and collection issues. The Credit Policy Committee establishes discounts based on asset type and valuation source; deviations from the standard are documented. The discounts are reviewed periodically, annually at a minimum, to determine they remain appropriate. Consideration is given to current trends in market values for the asset categories and gain and losses on sales of similar assets. The Loan and Funds Management Committee of the Board of Directors is responsible for overseeing the Credit Policy Committee.
Discounts vary depending on the nature of the assets and the source of value. Aircraft are generally valued using quarterly trade publications adjusted for engine time, condition, maintenance programs, discounted by 10%. Likewise, autos are valued using current auction values, discounted by 10%; medium and heavy duty trucks are valued using trade publications and auction values, discounted by 15%. Construction equipment and environmental equipment is generally valued using trade publications and auction values, discounted by 20%. Real estate is valued based on appraisals or evaluations, discounted by 20% at a minimum with higher discounts for property in poor condition or property with characteristics which may make it more difficult to market. Commercial loans subject to borrowing base certificates are generally discounted by 20% for receivables and 40-75% for inventory with higher discounts when monthly borrowing base certificates are not required or received.
Impaired loans and related write-downs are based on the fair value of the underlying collateral if repayment is expected solely from the collateral. Collateral values are reviewed quarterly and estimated using customized discounting criteria, appraisals and dealer and trade magazine quotes which are used in a market valuation approach. In accordance with fair value measurements, only impaired loans for which a reserve for loan loss has been established based on the fair value of collateral require classification in the fair value hierarchy. As a result, only a portion of the Company's impaired loans are classified in the fair value hierarchy.
Partnership investments and the adjustments to fair value primarily result from application of lower of cost or fair value accounting. The partnership investments are priced using financial statements provided by the partnerships. Quantitative unobservable inputs are not reasonably available for reporting purposes.
The Company has established mortgage servicing rights (MSRs) valuation policies and procedures based on industry standards and to ensure valuation methodologies are consistent and verifiable. MSRs and related adjustments to fair value result from application of lower of cost or fair value accounting. For purposes of impairment, MSRs are stratified based on the predominant risk characteristics of the underlying servicing, principally by loan type. The fair value of each tranche of the servicing portfolio is estimated by calculating the present value of estimated future net servicing cash flows, taking into consideration actual and expected mortgage loan prepayment rates, discount rates, servicing costs, and other economic factors. Prepayment rates and discount rates are derived through a third party pricing agent. Changes in the most significant inputs, including prepayment rates and discount rates, are compared to the changes in the fair value measurements and appropriate resolution is made. A fair value analysis is also obtained from an independent third party agent and compared to the internal valuation for reasonableness. MSRs do not trade in an active, open market with readily observable prices and though sales of MSRs do occur, precise terms and conditions typically are not readily available and the characteristics of the Company’s servicing portfolio may differ from those of any servicing portfolios that do trade.
Other real estate is based on the lower of cost or fair value of the underlying collateral less expected selling costs. Collateral values are estimated primarily using appraisals and reflect a market value approach. Fair values are reviewed quarterly and new appraisals are obtained annually. Repossessions are similarly valued.
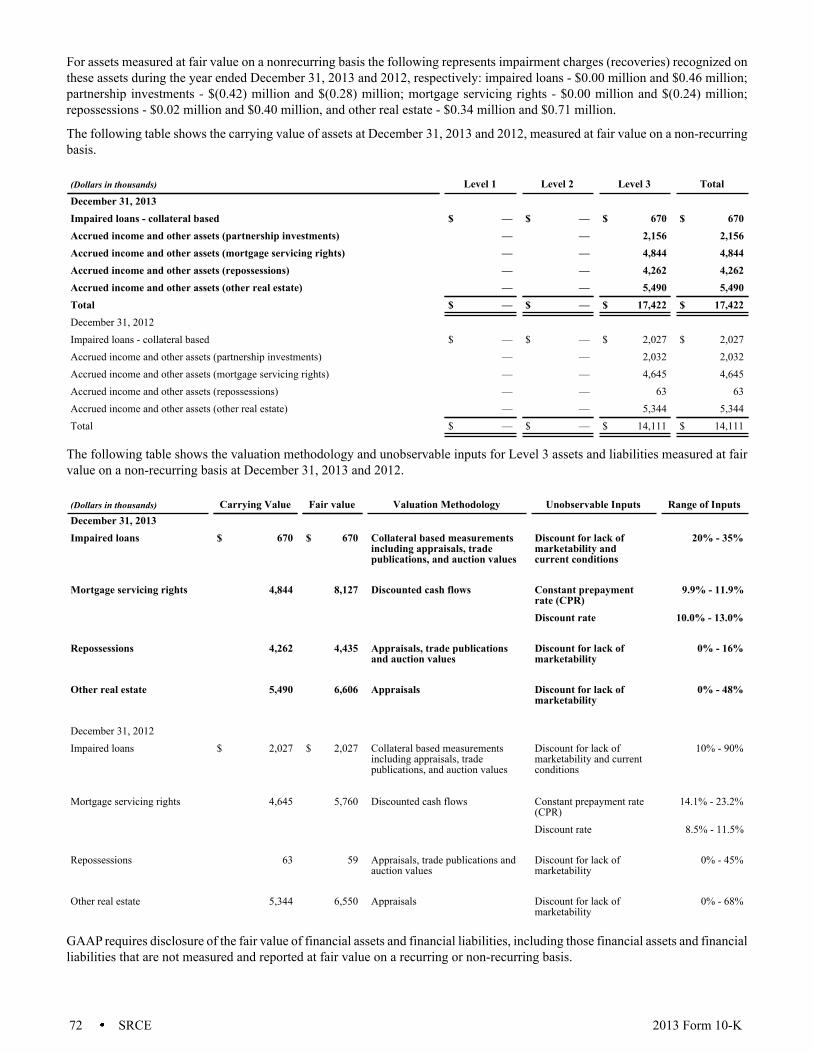
72 SRCE 2013 Form 10-K
For assets measured at fair value on a nonrecurring basis the following represents impairment charges (recoveries) recognized on these assets during the year ended December 31, 2013 and 2012, respectively: impaired loans - $0.00 million and $0.46 million; partnership investments - $(0.42) million and $(0.28) million; mortgage servicing rights - $0.00 million and $(0.24) million; repossessions - $0.02 million and $0.40 million, and other real estate - $0.34 million and $0.71 million.
The following table shows the carrying value of assets at December 31, 2013 and 2012, measured at fair value on a non-recurring basis.
(Dollars in thousands) Level 1 Level 2 Level 3 TotalDecember 31, 2013 Impaired loans - collateral based $ — $ — $ 670 $ 670Accrued income and other assets (partnership investments) — — 2,156 2,156Accrued income and other assets (mortgage servicing rights) — — 4,844 4,844Accrued income and other assets (repossessions) — — 4,262 4,262Accrued income and other assets (other real estate) — — 5,490 5,490Total $ — $ — $ 17,422 $ 17,422December 31, 2012 Impaired loans - collateral based $ — $ — $ 2,027 $ 2,027Accrued income and other assets (partnership investments) — — 2,032 2,032Accrued income and other assets (mortgage servicing rights) — — 4,645 4,645Accrued income and other assets (repossessions) — — 63 63Accrued income and other assets (other real estate) — — 5,344 5,344Total $ — $ — $ 14,111 $ 14,111
The following table shows the valuation methodology and unobservable inputs for Level 3 assets and liabilities measured at fair value on a non-recurring basis at December 31, 2013 and 2012.
(Dollars in thousands) Carrying Value Fair value Valuation Methodology Unobservable Inputs Range of InputsDecember 31, 2013Impaired loans $ 670 $ 670 Collateral based measurements
including appraisals, tradepublications, and auction values
Discount for lack ofmarketability andcurrent conditions
20% - 35%
Mortgage servicing rights 4,844 8,127 Discounted cash flows Constant prepaymentrate (CPR)
9.9% - 11.9%
Discount rate 10.0% - 13.0%
Repossessions 4,262 4,435 Appraisals, trade publicationsand auction values
Discount for lack ofmarketability
0% - 16%
Other real estate 5,490 6,606 Appraisals Discount for lack ofmarketability
0% - 48%
December 31, 2012Impaired loans $ 2,027 $ 2,027 Collateral based measurements
including appraisals, tradepublications, and auction values
Discount for lack ofmarketability and currentconditions
10% - 90%
Mortgage servicing rights 4,645 5,760 Discounted cash flows Constant prepayment rate(CPR)
14.1% - 23.2%
Discount rate 8.5% - 11.5%
Repossessions 63 59 Appraisals, trade publications andauction values
Discount for lack ofmarketability
0% - 45%
Other real estate 5,344 6,550 Appraisals Discount for lack ofmarketability
0% - 68%
GAAP requires disclosure of the fair value of financial assets and financial liabilities, including those financial assets and financial liabilities that are not measured and reported at fair value on a recurring or non-recurring basis.
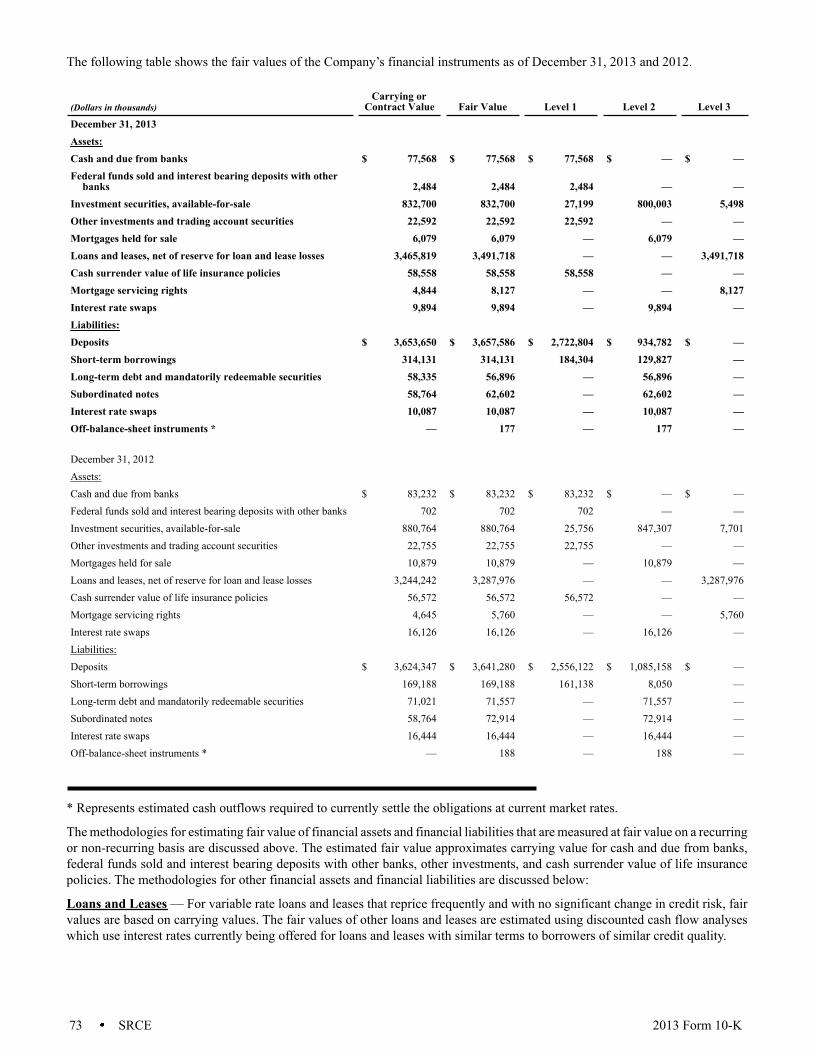
73 SRCE 2013 Form 10-K
The following table shows the fair values of the Company’s financial instruments as of December 31, 2013 and 2012.
(Dollars in thousands)Carrying or
Contract Value Fair Value Level 1 Level 2 Level 3December 31, 2013 Assets: Cash and due from banks $ 77,568 $ 77,568 $ 77,568 $ — $ —Federal funds sold and interest bearing deposits with other
banks 2,484 2,484 2,484 — —Investment securities, available-for-sale 832,700 832,700 27,199 800,003 5,498Other investments and trading account securities 22,592 22,592 22,592 — —Mortgages held for sale 6,079 6,079 — 6,079 —Loans and leases, net of reserve for loan and lease losses 3,465,819 3,491,718 — — 3,491,718Cash surrender value of life insurance policies 58,558 58,558 58,558 — —Mortgage servicing rights 4,844 8,127 — — 8,127Interest rate swaps 9,894 9,894 — 9,894 —Liabilities: Deposits $ 3,653,650 $ 3,657,586 $ 2,722,804 $ 934,782 $ —Short-term borrowings 314,131 314,131 184,304 129,827 —Long-term debt and mandatorily redeemable securities 58,335 56,896 — 56,896 —Subordinated notes 58,764 62,602 — 62,602 —Interest rate swaps 10,087 10,087 — 10,087 —Off-balance-sheet instruments * — 177 — 177 —
December 31, 2012 Assets: Cash and due from banks $ 83,232 $ 83,232 $ 83,232 $ — $ —Federal funds sold and interest bearing deposits with other banks 702 702 702 — —Investment securities, available-for-sale 880,764 880,764 25,756 847,307 7,701Other investments and trading account securities 22,755 22,755 22,755 — —Mortgages held for sale 10,879 10,879 — 10,879 —Loans and leases, net of reserve for loan and lease losses 3,244,242 3,287,976 — — 3,287,976Cash surrender value of life insurance policies 56,572 56,572 56,572 — —Mortgage servicing rights 4,645 5,760 — — 5,760Interest rate swaps 16,126 16,126 — 16,126 —Liabilities: Deposits $ 3,624,347 $ 3,641,280 $ 2,556,122 $ 1,085,158 $ —Short-term borrowings 169,188 169,188 161,138 8,050 —Long-term debt and mandatorily redeemable securities 71,021 71,557 — 71,557 —Subordinated notes 58,764 72,914 — 72,914 —Interest rate swaps 16,444 16,444 — 16,444 —Off-balance-sheet instruments * — 188 — 188 —
* Represents estimated cash outflows required to currently settle the obligations at current market rates.
The methodologies for estimating fair value of financial assets and financial liabilities that are measured at fair value on a recurring or non-recurring basis are discussed above. The estimated fair value approximates carrying value for cash and due from banks, federal funds sold and interest bearing deposits with other banks, other investments, and cash surrender value of life insurance policies. The methodologies for other financial assets and financial liabilities are discussed below:
Loans and Leases — For variable rate loans and leases that reprice frequently and with no significant change in credit risk, fair values are based on carrying values. The fair values of other loans and leases are estimated using discounted cash flow analyses which use interest rates currently being offered for loans and leases with similar terms to borrowers of similar credit quality.
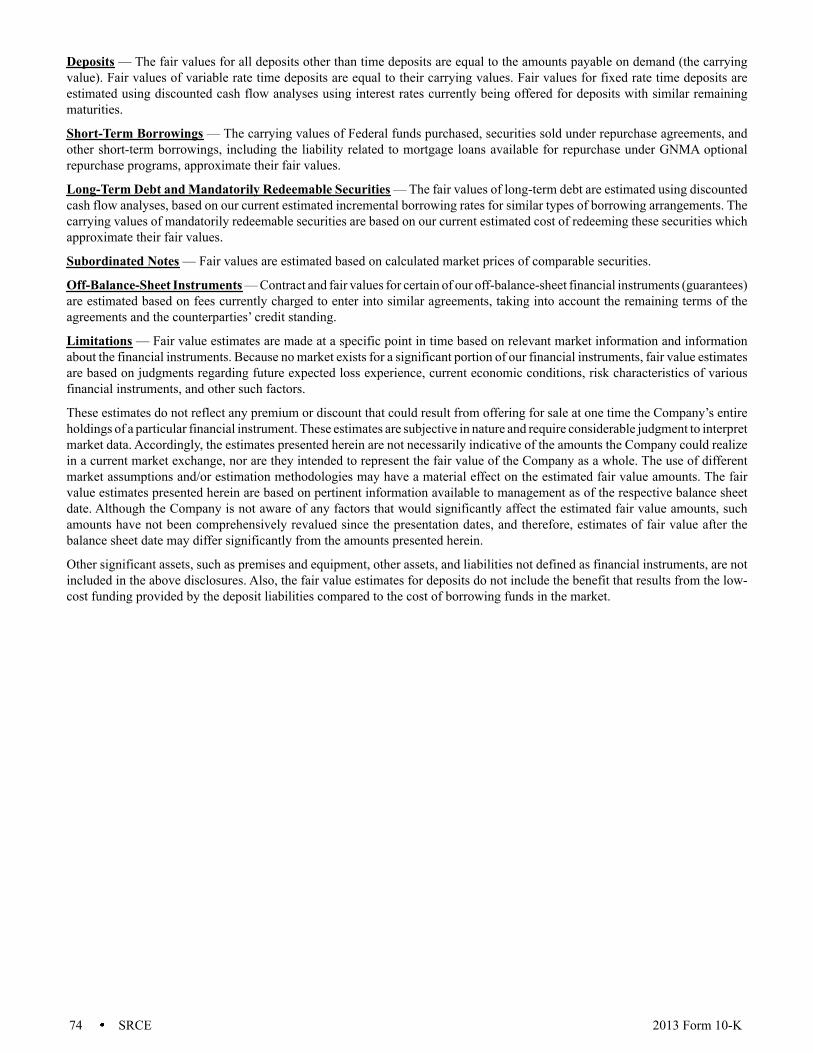
74 SRCE 2013 Form 10-K
Deposits — The fair values for all deposits other than time deposits are equal to the amounts payable on demand (the carrying value). Fair values of variable rate time deposits are equal to their carrying values. Fair values for fixed rate time deposits are estimated using discounted cash flow analyses using interest rates currently being offered for deposits with similar remaining maturities.
Short-Term Borrowings — The carrying values of Federal funds purchased, securities sold under repurchase agreements, and other short-term borrowings, including the liability related to mortgage loans available for repurchase under GNMA optional repurchase programs, approximate their fair values.
Long-Term Debt and Mandatorily Redeemable Securities — The fair values of long-term debt are estimated using discounted cash flow analyses, based on our current estimated incremental borrowing rates for similar types of borrowing arrangements. The carrying values of mandatorily redeemable securities are based on our current estimated cost of redeeming these securities which approximate their fair values.
Subordinated Notes — Fair values are estimated based on calculated market prices of comparable securities.
Off-Balance-Sheet Instruments — Contract and fair values for certain of our off-balance-sheet financial instruments (guarantees) are estimated based on fees currently charged to enter into similar agreements, taking into account the remaining terms of the agreements and the counterparties’ credit standing.
Limitations — Fair value estimates are made at a specific point in time based on relevant market information and information about the financial instruments. Because no market exists for a significant portion of our financial instruments, fair value estimates are based on judgments regarding future expected loss experience, current economic conditions, risk characteristics of various financial instruments, and other such factors.
These estimates do not reflect any premium or discount that could result from offering for sale at one time the Company’s entire holdings of a particular financial instrument. These estimates are subjective in nature and require considerable judgment to interpret market data. Accordingly, the estimates presented herein are not necessarily indicative of the amounts the Company could realize in a current market exchange, nor are they intended to represent the fair value of the Company as a whole. The use of different market assumptions and/or estimation methodologies may have a material effect on the estimated fair value amounts. The fair value estimates presented herein are based on pertinent information available to management as of the respective balance sheet date. Although the Company is not aware of any factors that would significantly affect the estimated fair value amounts, such amounts have not been comprehensively revalued since the presentation dates, and therefore, estimates of fair value after the balance sheet date may differ significantly from the amounts presented herein.
Other significant assets, such as premises and equipment, other assets, and liabilities not defined as financial instruments, are not included in the above disclosures. Also, the fair value estimates for deposits do not include the benefit that results from the low-cost funding provided by the deposit liabilities compared to the cost of borrowing funds in the market.
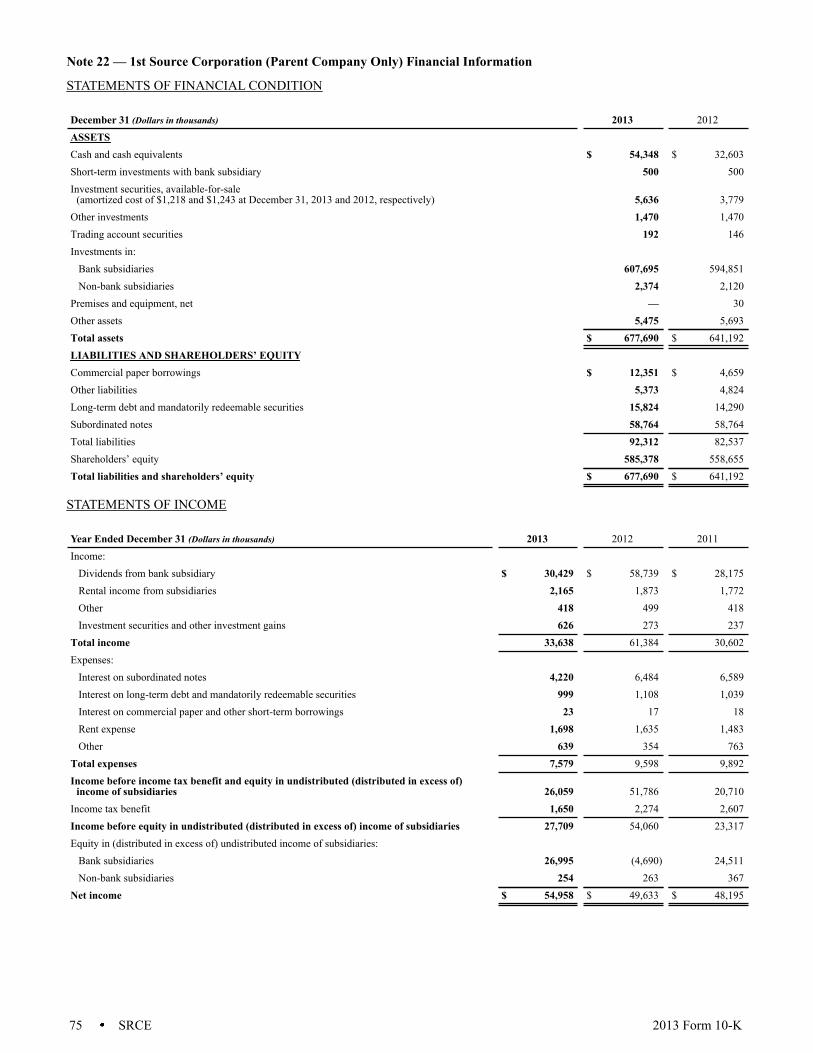
75 SRCE 2013 Form 10-K
Note 22 — 1st Source Corporation (Parent Company Only) Financial Information
STATEMENTS OF FINANCIAL CONDITION
December 31 (Dollars in thousands) 2013 2012ASSETS Cash and cash equivalents $ 54,348 $ 32,603Short-term investments with bank subsidiary 500 500Investment securities, available-for-sale
(amortized cost of $1,218 and $1,243 at December 31, 2013 and 2012, respectively) 5,636 3,779Other investments 1,470 1,470Trading account securities 192 146Investments in:
Bank subsidiaries 607,695 594,851Non-bank subsidiaries 2,374 2,120
Premises and equipment, net — 30Other assets 5,475 5,693Total assets $ 677,690 $ 641,192LIABILITIES AND SHAREHOLDERS’ EQUITY Commercial paper borrowings $ 12,351 $ 4,659Other liabilities 5,373 4,824Long-term debt and mandatorily redeemable securities 15,824 14,290Subordinated notes 58,764 58,764Total liabilities 92,312 82,537Shareholders’ equity 585,378 558,655Total liabilities and shareholders’ equity $ 677,690 $ 641,192
STATEMENTS OF INCOME
Year Ended December 31 (Dollars in thousands) 2013 2012 2011Income:
Dividends from bank subsidiary $ 30,429 $ 58,739 $ 28,175Rental income from subsidiaries 2,165 1,873 1,772Other 418 499 418Investment securities and other investment gains 626 273 237
Total income 33,638 61,384 30,602Expenses:
Interest on subordinated notes 4,220 6,484 6,589Interest on long-term debt and mandatorily redeemable securities 999 1,108 1,039Interest on commercial paper and other short-term borrowings 23 17 18Rent expense 1,698 1,635 1,483Other 639 354 763
Total expenses 7,579 9,598 9,892Income before income tax benefit and equity in undistributed (distributed in excess of)
income of subsidiaries 26,059 51,786 20,710Income tax benefit 1,650 2,274 2,607Income before equity in undistributed (distributed in excess of) income of subsidiaries 27,709 54,060 23,317Equity in (distributed in excess of) undistributed income of subsidiaries:
Bank subsidiaries 26,995 (4,690) 24,511Non-bank subsidiaries 254 263 367Net income $ 54,958 $ 49,633 $ 48,195
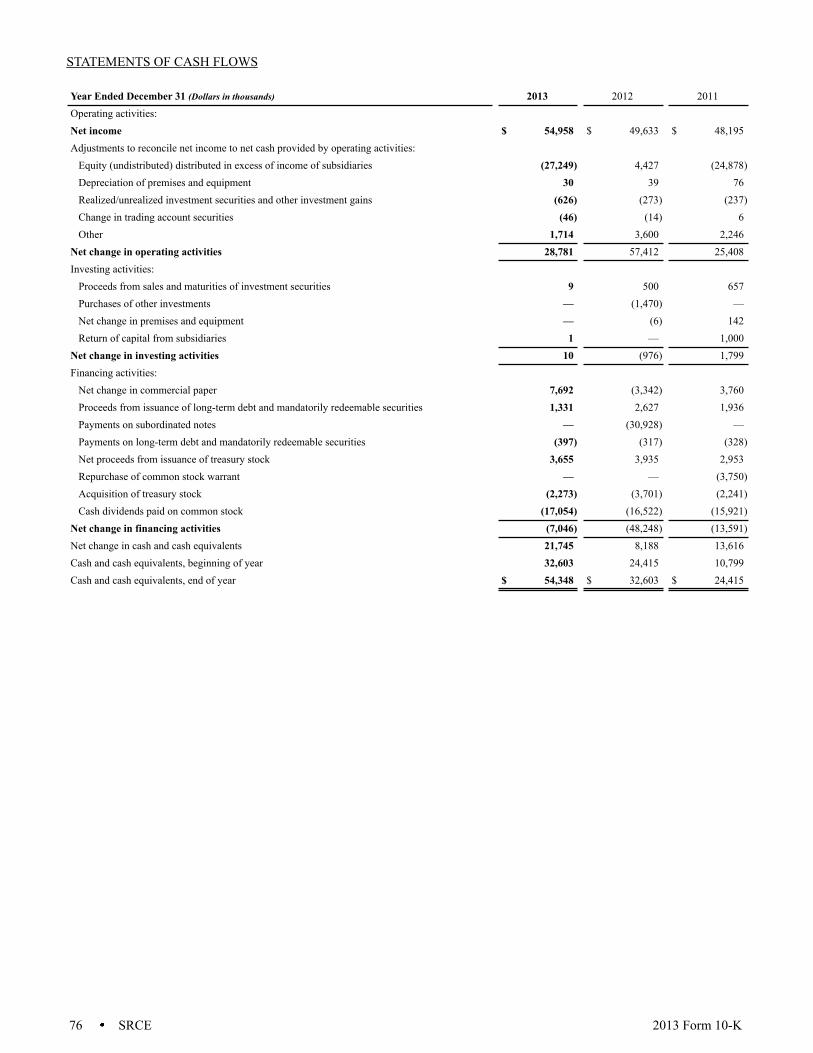
76 SRCE 2013 Form 10-K
STATEMENTS OF CASH FLOWS
Year Ended December 31 (Dollars in thousands) 2013 2012 2011Operating activities: Net income $ 54,958 $ 49,633 $ 48,195Adjustments to reconcile net income to net cash provided by operating activities:
Equity (undistributed) distributed in excess of income of subsidiaries (27,249) 4,427 (24,878)Depreciation of premises and equipment 30 39 76Realized/unrealized investment securities and other investment gains (626) (273) (237)Change in trading account securities (46) (14) 6Other 1,714 3,600 2,246Net change in operating activities 28,781 57,412 25,408Investing activities:
Proceeds from sales and maturities of investment securities 9 500 657Purchases of other investments — (1,470) —Net change in premises and equipment — (6) 142Return of capital from subsidiaries 1 — 1,000Net change in investing activities 10 (976) 1,799Financing activities: Net change in commercial paper 7,692 (3,342) 3,760Proceeds from issuance of long-term debt and mandatorily redeemable securities 1,331 2,627 1,936Payments on subordinated notes — (30,928) —Payments on long-term debt and mandatorily redeemable securities (397) (317) (328)Net proceeds from issuance of treasury stock 3,655 3,935 2,953Repurchase of common stock warrant — — (3,750)Acquisition of treasury stock (2,273) (3,701) (2,241)Cash dividends paid on common stock (17,054) (16,522) (15,921)Net change in financing activities (7,046) (48,248) (13,591)Net change in cash and cash equivalents 21,745 8,188 13,616Cash and cash equivalents, beginning of year 32,603 24,415 10,799Cash and cash equivalents, end of year $ 54,348 $ 32,603 $ 24,415
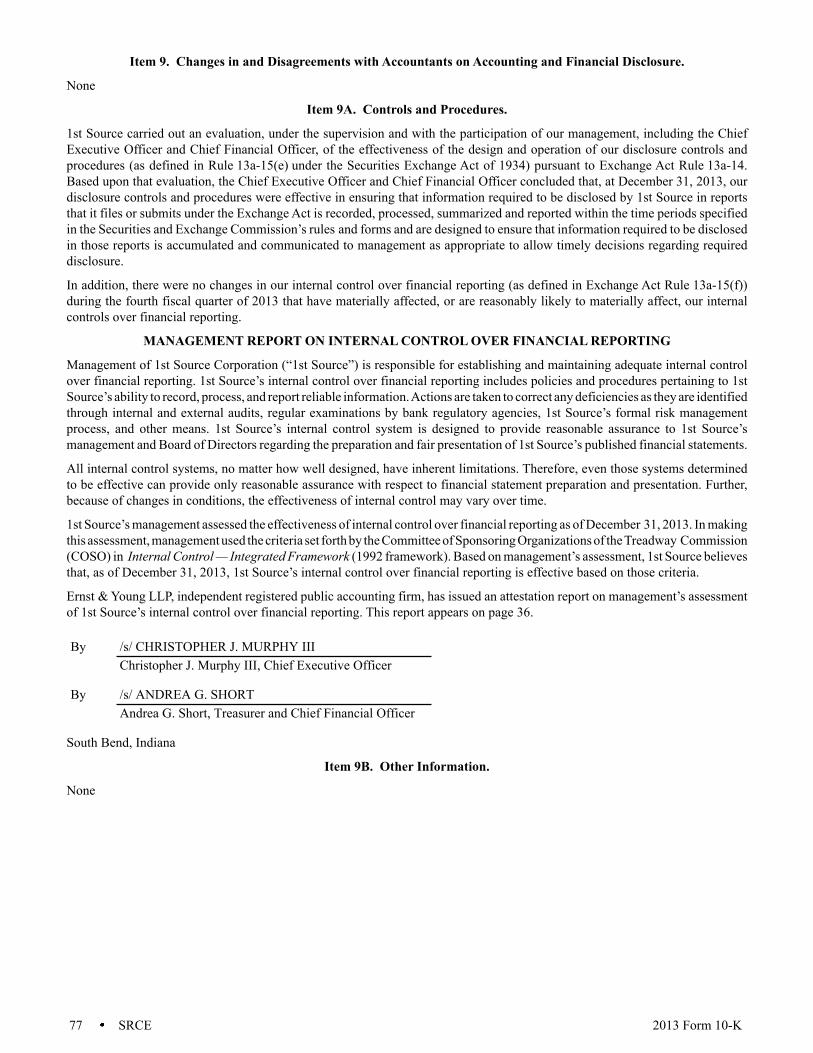
77 SRCE 2013 Form 10-K
Item 9. Changes in and Disagreements with Accountants on Accounting and Financial Disclosure.
None
Item 9A. Controls and Procedures.
1st Source carried out an evaluation, under the supervision and with the participation of our management, including the Chief Executive Officer and Chief Financial Officer, of the effectiveness of the design and operation of our disclosure controls and procedures (as defined in Rule 13a-15(e) under the Securities Exchange Act of 1934) pursuant to Exchange Act Rule 13a-14. Based upon that evaluation, the Chief Executive Officer and Chief Financial Officer concluded that, at December 31, 2013, our disclosure controls and procedures were effective in ensuring that information required to be disclosed by 1st Source in reports that it files or submits under the Exchange Act is recorded, processed, summarized and reported within the time periods specified in the Securities and Exchange Commission’s rules and forms and are designed to ensure that information required to be disclosed in those reports is accumulated and communicated to management as appropriate to allow timely decisions regarding required disclosure.
In addition, there were no changes in our internal control over financial reporting (as defined in Exchange Act Rule 13a-15(f)) during the fourth fiscal quarter of 2013 that have materially affected, or are reasonably likely to materially affect, our internal controls over financial reporting.
MANAGEMENT REPORT ON INTERNAL CONTROL OVER FINANCIAL REPORTING
Management of 1st Source Corporation (“1st Source”) is responsible for establishing and maintaining adequate internal control over financial reporting. 1st Source’s internal control over financial reporting includes policies and procedures pertaining to 1st Source’s ability to record, process, and report reliable information. Actions are taken to correct any deficiencies as they are identified through internal and external audits, regular examinations by bank regulatory agencies, 1st Source’s formal risk management process, and other means. 1st Source’s internal control system is designed to provide reasonable assurance to 1st Source’s management and Board of Directors regarding the preparation and fair presentation of 1st Source’s published financial statements.
All internal control systems, no matter how well designed, have inherent limitations. Therefore, even those systems determined to be effective can provide only reasonable assurance with respect to financial statement preparation and presentation. Further, because of changes in conditions, the effectiveness of internal control may vary over time.
1st Source’s management assessed the effectiveness of internal control over financial reporting as of December 31, 2013. In making this assessment, management used the criteria set forth by the Committee of Sponsoring Organizations of the Treadway Commission (COSO) in Internal Control — Integrated Framework (1992 framework). Based on management’s assessment, 1st Source believes that, as of December 31, 2013, 1st Source’s internal control over financial reporting is effective based on those criteria.
Ernst & Young LLP, independent registered public accounting firm, has issued an attestation report on management’s assessment of 1st Source’s internal control over financial reporting. This report appears on page 36.
By /s/ CHRISTOPHER J. MURPHY III
Christopher J. Murphy III, Chief Executive Officer
By /s/ ANDREA G. SHORT
Andrea G. Short, Treasurer and Chief Financial Officer
South Bend, Indiana
Item 9B. Other Information.
None
78 SRCE 2013 Form 10-K
Part III
Item 10. Directors, Executive Officers and Corporate Governance.
The information under the caption “Proposal Number 1: Election of Directors,” “Board Committees and Other Corporate Governance Matters,” and “Section 16(a) Beneficial Ownership Reporting Compliance” of the 2014 Proxy Statement is incorporated herein by reference.
Item 11. Executive Compensation.
The information under the caption “Compensation Discussion & Analysis” of the 2014 Proxy Statement is incorporated herein by reference.
Item 12. Security Ownership of Certain Beneficial Owners and Management and Related Stockholder Matters.
The information under the caption “Voting Securities and Principal Holders Thereof” and “Proposal Number 1: Election of Directors” of the 2014 Proxy Statement is incorporated herein by reference.
The following table shows Equity Compensation Plan Information as of December 31, 2013:
(A)Number of Securities to be
Issued upon Exercise ofOutstanding Options,Warrants and Rights
Weighted-averageExercise Price of
Outstanding Options,Warrants and Rights
Number of SecuritiesRemaining Availablefor Future Issuance
Under EquityCompensation Plans[excluding securities
reflected in column (A)]Equity compensation plans approved by shareholders
2011 stock option plan — $ — 2,000,000 1997 employee stock purchase plan 17,372 21.74 126,529 1982 executive incentive plan — — 148,454 (1)(2)1982 restricted stock award plan — — 47,627 (1)1998 performance compensation plan — — 89,677 (1)(2)
Total plans approved by shareholders 17,372 $ 21.74 2,412,287 Equity compensation plans not approved by
shareholders — — — Total equity compensation plans 17,372 $ 21.74 2,412,287
(1) Amount is to be awarded by grants administered by the Executive Compensation Committee of the 1st Source Board of Directors.
(2) Amount includes market value stock only. Book value shares used for annual awards may only be sold to 1st Source.
Item 13. Certain Relationships and Related Transactions, and Director Independence.
The information under the caption “Proposal Number 1: Election of Directors,” “Board Committees and Other Corporate Governance Matters,” and “Transactions with Related Persons” of the 2014 Proxy Statement is incorporated herein by reference.
Item 14. Principal Accounting Fees and Services.
The information under the caption “Relationship with Independent Registered Public Accounting Firm” of the 2014 Proxy Statement is incorporated herein by reference.
79 SRCE 2013 Form 10-K
Part IV
Item 15. Exhibits and Financial Statement Schedules.
(a) Financial Statements and Schedules:
The following Financial Statements and Supplementary Data are filed as part of this annual report:
Financial statement schedules required by Article 9 of Regulation S-X are not required under the related instructions, or are inapplicable and, therefore, have been omitted.
(b) Exhibits (numbered in accordance with Item 601 of Regulation S-K):
3(a) Articles of Incorporation of Registrant, as amended April 30, 1996, and filed as exhibit to Form 10-K, dated December 31, 1996, and incorporated herein by reference.
3(b) By-Laws of Registrant, as amended July 25, 2013, filed as exhibit to Form 8-K, dated July 25, 2013, and incorporated herein by reference.
3(c) Certificate of Designations for Series A Preferred Stock, dated January 23, 2009, filed as exhibit to Form 8-K, dated January 23, 2009, and incorporated herein by reference.
4(a) Form of Common Stock Certificates of Registrant filed as exhibit to Registration Statement 2-40481 and incorporated herein by reference.
4(b) 1st Source agrees to furnish to the Commission, upon request, a copy of each instrument defining the rights of holders of Senior and Subordinated debt of 1st Source.
10(a)(1) Employment Agreement of Christopher J. Murphy III, dated January 1, 2008, filed as exhibit to Form 8-K, dated March 17, 2008, and incorporated herein by reference.
10(a)(2) Employment Agreement of Andrea G. Short dated January 1, 2013, filed as exhibit to Form 10-K, dated December 31, 2012, and incorporated herein by reference.
10(a)(3) Employment Agreement of John B. Griffith, dated January 1, 2008, filed as exhibit to Form 8-K, dated March 17, 2008, and incorporated herein by reference.
10(a)(4) Employment Agreement of Steven J. Wessell, dated June 1, 2011, filed as exhibit to Form 10-Q, dated March 31, 2012, and incorporated herein by reference.
10(b) 1st Source Corporation Employee Stock Purchase Plan dated April 17, 1997, filed as exhibit to Form 10-K, dated December 31, 1997, and incorporated herein by reference.
10(c) 1st Source Corporation 1982 Executive Incentive Plan, amended February 3, 2011, filed as exhibit to Form 10-K, dated December 31, 2010, and incorporated herein by reference.
10(d) 1st Source Corporation 1982 Restricted Stock Award Plan, amended January 17, 2003, and filed as exhibit to Form 10-K, dated December 31, 2003, and incorporated herein by reference.
10(e) 1st Source Corporation 1998 Performance Compensation Plan, amended January 20, 2011, filed as exhibit to Form 10-K, dated December 31, 2010, and incorporated herein by reference.
10(f) Contract with Fiserv Solutions, Inc. dated November 23, 2005, filed as exhibit to Form 10-K, dated, December 31, 2005, and incorporated herein by reference.
10 (g) 1st Source Corporation 2011 Stock Option Plan, dated January 20, 2011, filed as exhibit to Form 10-K, dated December 31, 2010, and incorporated herein by reference.
10 (h) 1st Source Corporation Director Retainer Stock Plan, dated May 1, 2013, filed as an exhibit to Form 10-K, dated December 31, 2013.
Reports of Independent Registered Public Accounting FirmConsolidated Statements of Financial Condition — December 31, 2013 and 2012Consolidated Statements of Income — Years ended December 31, 2013, 2012, and 2011Consolidated Statements of Comprehensive Income — Years ended December 31, 2013, 2012, and 2011Consolidated Statements of Shareholders’ Equity — Years ended December 31, 2013, 2012, and 2011Consolidated Statements of Cash Flows — Years ended December 31, 2013, 2012, and 2011Notes to Consolidated Financial Statements — December 31, 2013, 2012, and 2011
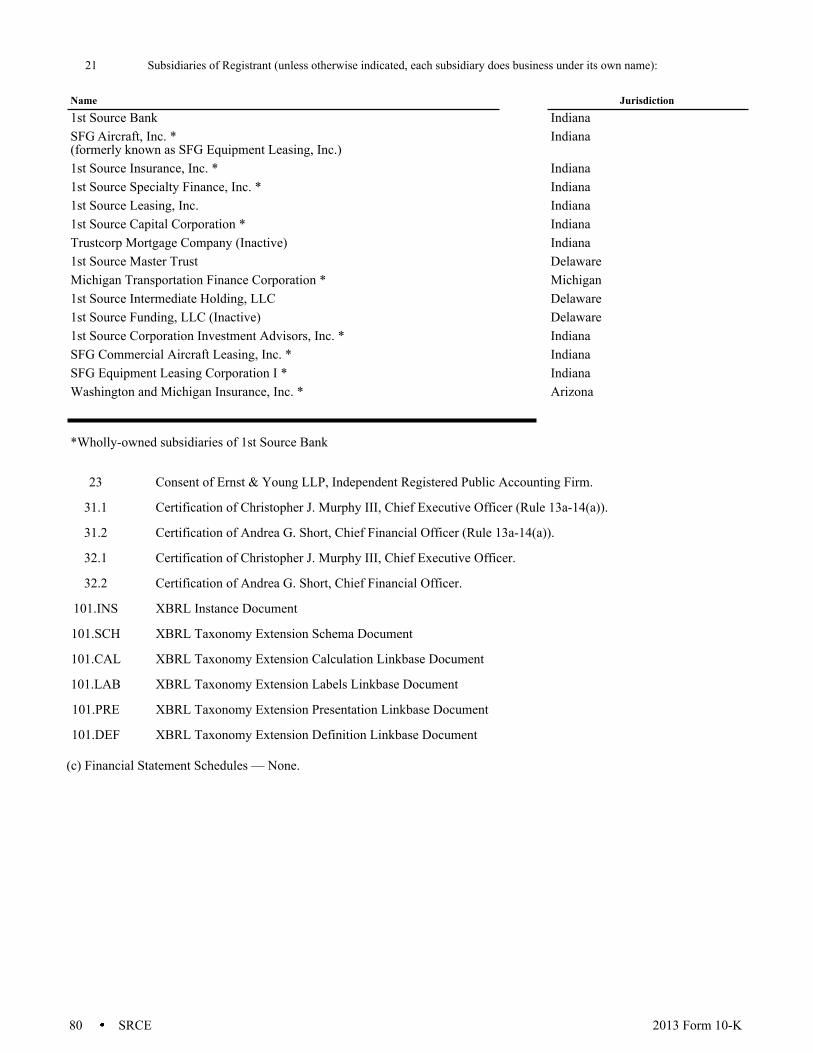
80 SRCE 2013 Form 10-K
21 Subsidiaries of Registrant (unless otherwise indicated, each subsidiary does business under its own name):
Name
Jurisdiction
1st Source Bank
IndianaSFG Aircraft, Inc. *(formerly known as SFG Equipment Leasing, Inc.)
Indiana
1st Source Insurance, Inc. *
Indiana1st Source Specialty Finance, Inc. *
Indiana1st Source Leasing, Inc.
Indiana1st Source Capital Corporation *
IndianaTrustcorp Mortgage Company (Inactive)
Indiana1st Source Master Trust
DelawareMichigan Transportation Finance Corporation *
Michigan1st Source Intermediate Holding, LLC
Delaware1st Source Funding, LLC (Inactive)
Delaware1st Source Corporation Investment Advisors, Inc. *
IndianaSFG Commercial Aircraft Leasing, Inc. *
IndianaSFG Equipment Leasing Corporation I *
IndianaWashington and Michigan Insurance, Inc. *
Arizona
*Wholly-owned subsidiaries of 1st Source Bank
23 Consent of Ernst & Young LLP, Independent Registered Public Accounting Firm.
31.1 Certification of Christopher J. Murphy III, Chief Executive Officer (Rule 13a-14(a)).
31.2 Certification of Andrea G. Short, Chief Financial Officer (Rule 13a-14(a)).
32.1 Certification of Christopher J. Murphy III, Chief Executive Officer.
32.2 Certification of Andrea G. Short, Chief Financial Officer.
101.INS XBRL Instance Document
101.SCH XBRL Taxonomy Extension Schema Document
101.CAL XBRL Taxonomy Extension Calculation Linkbase Document
101.LAB XBRL Taxonomy Extension Labels Linkbase Document
101.PRE XBRL Taxonomy Extension Presentation Linkbase Document
101.DEF XBRL Taxonomy Extension Definition Linkbase Document
(c) Financial Statement Schedules — None.

81 SRCE 2013 Form 10-K
Signatures
Pursuant to the requirements of Section 13 or 15(d) of the Securities Exchange Act of 1934, the registrant has duly caused this report to be signed on its behalf by the undersigned, thereunto duly authorized.
1st SOURCE CORPORATION
By /s/ CHRISTOPHER J. MURPHY III
Christopher J. Murphy III, Chairman of the Board,
President and Chief Executive Officer
Date: February 21, 2014
82 SRCE 2013 Form 10-K
Pursuant to the requirements of the Securities Exchange Act of 1934, this report has been signed below by the following persons on behalf of the registrant and in the capacities and on the dates indicated.
Signature
Title
Date
/s/ CHRISTOPHER J. MURPHY III
Chairman of the Board,
February 21, 2014Christopher J. Murphy III
President and Chief Executive Officer
/s/ WELLINGTON D. JONES III
Vice Chairman of the Board
February 21, 2014Wellington D. Jones III
and Director
/s/ ANDREA G. SHORT
Treasurer, Chief Financial Officer
February 21, 2014Andrea G. Short
and Principal Accounting Officer
/s/ JOHN B. GRIFFITH
Secretary
February 21, 2014John B. Griffith
and General Counsel
/s/ ALLISON N. EGIDI
Director
February 21, 2014Allison N. Egidi
/s/ DANIEL B. FITZPATRICK
Director
February 21, 2014Daniel B. Fitzpatrick
/s/ TRACY D. GRAHAM
Director
February 21, 2014Tracy D. Graham
/s/ CRAIG A. KAPSON
Director
February 21, 2014Craig A. Kapson
/s/ NAJEEB A. KHAN
Director
February 21, 2014Najeeb A. Khan
/s/ VINOD M. KHILNANI Director February 21, 2014Vinod M. Khilnani
/s/ REX MARTIN
Director
February 21, 2014Rex Martin
/s/ CHRISTOPHER J. MURPHY IV
Director
February 21, 2014Christopher J. Murphy IV
/s/ TIMOTHY K. OZARK
Director
February 21, 2014Timothy K. Ozark
/s/ JOHN T. PHAIR
Director
February 21, 2014John T. Phair
/s/ MARK D. SCHWABERO
Director
February 21, 2014Mark D. Schwabero
83 SRCE 2013 Form 10-K
EXHIBIT 31.1
CERTIFICATIONS
I, Christopher J. Murphy III, Chief Executive Officer, certify that:1. I have reviewed this annual report on Form 10-K of 1st Source Corporation;2. Based on my knowledge, this report does not contain any untrue statement of a material fact or omit to state a material fact
necessary to make the statements made, in light of the circumstances under which such statements were made, not misleading with respect to the period covered by this report;
3. Based on my knowledge, the financial statements, and other financial information included in this report, fairly present in all material respects the financial condition, results of operations and cash flows of the registrant as of, and for, the periods presented in this report;
4. The registrant’s other certifying officer and I are responsible for establishing and maintaining disclosure controls and procedures (as defined in Exchange Act Rules 13a-15(e) and 15d-15(e)) and internal control over financial reporting (as defined in Exchange Act Rules 13a-15(f) and 15d-15(f)) for the registrant and have:a) Designed such disclosure controls and procedures, or caused such disclosure controls and procedures to be designed
under our supervision, to ensure that material information relating to the registrant, including its consolidated subsidiaries, is made known to us by others within those entities, particularly during the period in which this report is being prepared;
b) Designed such internal control over financial reporting, or caused such internal control over financial reporting to be designed under our supervision, to provide reasonable assurance regarding the reliability of financial reporting and the preparation of financial statements for external purposes in accordance with generally accepted accounting principles;
c) Evaluated the effectiveness of the registrant’s disclosure controls and procedures and presented in this report our conclusions about the effectiveness of the disclosure controls and procedures, as of the end of the period covered by this report based on such evaluation; and
d) Disclosed in this report any change in the registrant’s internal control over financial reporting that occurred during the registrant’s most recent fiscal quarter that has materially affected, or is reasonably likely to materially affect, the registrant’s internal control over financial reporting; and
5. The registrant’s other certifying officer and I have disclosed, based on our most recent evaluation of internal control over financial reporting, to the registrant’s auditors and the audit committee of the registrant’s Board of Directors:a) All significant deficiencies and material weaknesses in the design or operation of internal control over financial reporting
which are reasonably likely to adversely affect the registrant’s ability to record, process, summarize and report financial information; and
b) Any fraud, whether or not material, that involves management or other employees who have a significant role in the registrant’s internal control over financial reporting.
Date: February 21, 2014
By /s/ CHRISTOPHER J. MURPHY IIIChristopher J. Murphy III, Chief Executive Officer
EXHIBIT 32.1CERTIFICATION PURSUANT TO 18 U.S.C. SECTION 1350 AS ADOPTED PURSUANT TO SECTION 906 OF THE
SARBANES-OXLEY ACT OF 2002In connection with the Annual Report of 1st Source Corporation (1st Source) on Form 10-K for the fiscal year ended December 31, 2013, as filed with the Securities and Exchange Commission on the date hereof (the “Report”), I, Christopher J. Murphy III, Chief Executive Officer of 1st Source, certify, pursuant to 18 U.S.C. Section 1350, as adopted pursuant to Section 906 of the Sarbanes-Oxley Act of 2002, that to my knowledge:
(1) The Report fully complies with the requirements of sections 13(a) or 15(d) of the Securities and Exchange Act of 1934; and
(2) The information contained in the Report fairly presents, in all material respects, the financial condition and results of operations of 1st Source.
Date: February 21, 2014
By /s/ CHRISTOPHER J. MURPHY IIIChristopher J. Murphy III, Chief Executive Officer
84 SRCE 2013 Form 10-K
EXHIBIT 31.2CERTIFICATIONS
I, Andrea G. Short, Chief Financial Officer, certify that:1. I have reviewed this annual report on Form 10-K of 1st Source Corporation;2. Based on my knowledge, this report does not contain any untrue statement of a material fact or omit to state a material fact
necessary to make the statements made, in light of the circumstances under which such statements were made, not misleading with respect to the period covered by this report;
3. Based on my knowledge, the financial statements, and other financial information included in this report, fairly present in all material respects the financial condition, results of operations and cash flows of the registrant as of, and for, the periods presented in this report;
4. The registrant’s other certifying officer and I are responsible for establishing and maintaining disclosure controls and procedures (as defined in Exchange Act Rules 13a-15(e) and 15d-15(e)) and internal control over financial reporting (as defined in Exchange Act Rules 13a-15(f) and 15d-15(f)) for the registrant and have:a) Designed such disclosure controls and procedures, or caused such disclosure controls and procedures to be designed
under our supervision, to ensure that material information relating to the registrant, including its consolidated subsidiaries, is made known to us by others within those entities, particularly during the period in which this report is being prepared;
b) Designed such internal control over financial reporting, or caused such internal control over financial reporting to be designed under our supervision, to provide reasonable assurance regarding the reliability of financial reporting and the preparation of financial statements for external purposes in accordance with generally accepted accounting principles;
c) Evaluated the effectiveness of the registrant’s disclosure controls and procedures and presented in this report our conclusions about the effectiveness of the disclosure controls and procedures, as of the end of the period covered by this report based on such evaluation; and
d) Disclosed in this report any change in the registrant’s internal control over financial reporting that occurred during the registrant’s most recent fiscal quarter that has materially affected, or is reasonably likely to materially affect, the registrant’s internal control over financial reporting; and
5. The registrant’s other certifying officer and I have disclosed, based on our most recent evaluation of internal control over financial reporting, to the registrant’s auditors and the audit committee of the registrant’s Board of Directors:a) All significant deficiencies and material weaknesses in the design or operation of internal control over financial reporting
which are reasonably likely to adversely affect the registrant’s ability to record, process, summarize and report financial information; and
b) Any fraud, whether or not material, that involves management or other employees who have a significant role in the registrant’s internal control over financial reporting.
Date: February 21, 2014
By /s/ ANDREA G. SHORTAndrea G. Short, Chief Financial Officer
EXHIBIT 32.2CERTIFICATION PURSUANT TO 18 U.S.C. SECTION 1350 AS ADOPTED PURSUANT TO SECTION 906 OF THE
SARBANES-OXLEY ACT OF 2002In connection with the Annual Report of 1st Source Corporation (1st Source) on Form 10-K for the fiscal year ended December 31, 2013, as filed with the Securities and Exchange Commission on the date hereof (the “Report”), I, Andrea G. Short, Chief Financial Officer of 1st Source, certify, pursuant to 18 U.S.C. Section 1350, as adopted pursuant to Section 906 of the Sarbanes-Oxley Act of 2002, that to my knowledge:
(1) The Report fully complies with the requirements of sections 13(a) or 15(d) of the Securities and Exchange Act of 1934; and
(2) The information contained in the Report fairly presents, in all material respects, the financial condition and results of operations of 1st Source.
Date: February 21, 2014
By /s/ ANDREA G. SHORTAndrea G. Short, Chief Financial Officer
Justin Reames Kaley Carter Kami Bunch Kamie Tomasek Kamika Guthrie Kandis Tubb Kanetha Speck Karah Leach Karen Burgess Karen Hicks Karen Karason Karen King Karen Pal Karen Shearer Kari Albert Karin Jenczalik Karissa Hickey Karl Smith Karla Elett Karlie Pazdur Karrie Remmo Kate Seramur Katherine Thompson Katherine Wesner Kathleen Faust Kathleen Solomon Kathy Bohan Kathy Boles Kathy Carlson Kathy Hoffa Kathy Kline Kathy Rupert Kathy Schoff Kathy Volheim Katie Mc Fadden Katie Riley Katrina Edling Katrina James Katy Turner Kaydi Mc Mahan Kayla Ciesiolka Kayla Darnell Kayla Miller Kayla Vincent Keith Henderson Keith Strong Keith Termont Kelly Engle Kelly Heatherly Kelly Ruffolo Kelly Schulz Kelly Walters-Franklin Kelly Woloszyn Kelly Wunder Kelsey Dixon Kelsey Manson Kelsie Mc Daniel Kelton Dickey Ken Nowacki Kendra Hicks Kenneth Carbiener Kenneth Fisher Kevin Kettle Kevin Little Kevin Murphy Kevin Putz Kim Bennett Kim Clanton Kim Cornelis Kim Davis Kim Keever Kim Mock Kim Rice Kim Richardson Kim Tagliaferri Kim Webb Kimberlee Lewis Kimberly De Cook Kimberly Johnson Kip Edwards Kirsten Amussen Kirsten Klupp Kris Phillips Kris Sieczko Krista Porman Krista Walsh Kristin Bivens Kristin Tulledge Kristina Sheedy Kristina Walker Krysti Yuen Kurt Thompson Kym Pennell Lacey Perkins Lana Matthews Lane Sexton Lanny Scoby Larisa Yates Larry Bauer Larry Cripe Larry Holston Larry Mayers Larry Shute Larry Solyom Larry Tepe Latoya Yarber Laura Fonce Laura Jeter Laura Navarro Laura Shumate Laura Sniadecki Laura Strzelecki Laura Vaughn Laurie Harbison Laurie Main Leah Farmwald Lee Goehring Lee Hoffman Lee Morton Lee Rose Leigh Mc Crorey Leila Moon Len Buszkiewicz Les Gallup Leslie Pazdur Leticia Chavez Liberty DiGiacomo Linda Dombrowski Linda Green Linda Hurst Linda Nelund Linda Price Linda Relos Linda Shafer Wilson Linda Smith Linda Wojciechowski Lindsay Davis Lindsay Utnik Lindsey Schlemmer Linsey Barkowski Lisa Balazsi Williams Lisa BurchLisa Christensen Lisa Dieringer Lisa Dutoi Lisa Kleckner Lisa Misch Lisa Pesaresi Lisa Shroyer Lisa Snyder Liz Hawkins Liz Jackson Liz Kruk Liz Zarzecki Lorelei Siddall Lori Cuson Lori Hammonds Lori Jean Lori Klimek Lori Memsic Lori Moulton Lori Ryman Lori Tierce Lorra Junk Lorraine Cochran Lou Ann Chelminiak Loveda Jones Lu Ann Evans Luis Zapata Luke Squires Luping Mc Ginness Lyle Juillerat Lynda Vandervinne Lynn Morris Madeline Morgan Mady Beggs Mai Chabon Mallorie Johnson Mallory Getty Malorie Smith Mar Kulesia Marchelle Watt Marci Dixon Marcia Hayes Marcia Holmes Marcia Mc Carthy Marcus Giden Marcus Zarembka Margaret Thomas Maria Varela Garcia Maribel Delbrey Maribel Santamaria Marie Alvarez Marilyn Swartz Mario Teixeira Marion Rankin Marissa Kay Mark Andrews Mark Bemenderfer Mark Dougherty Mark Gould Mark Lane Mark Manering Mark Szymanski Mark Taylor Mark Waldron Marlene Taiclet Marshall Williams Martha Gilmer Mary Andrews Mary Benson Mary ChmielMary Goodhew Mary Hayden Mary Hektor Mary Niedbalski Mary Thomas Mary Wenzel Matt Wold Matt Zakrowski Matthew Kavanaugh Matthew Mackowiak Matthew Todt Meagen Hunsaker Meg Ferrara Megan Ballock Megan Graber Megan Sheets Megan Wroblewski Mel Wilson Melani Andres Melinda Bowmar Melinda Overmyer Melissa Brunner Melissa Carper Melissa Chase Melissa Collins Melissa Harmon Melissa Mc Caughey Melissa Tobias Melodie Mc Farland Melody Hooley Mercedes Vest Meredith Herman Michael Bradberry Michael Spencer Micheal Bauer Michele Miller Michele Torzewski Michelle Evans Michelle Stesiak Michelle SumerixMichelle Williams Mickey Fell Mike Arnett Mike Beaton Mike Dutton Mike Hinds Mike Horvath Mike Mc Keough Mike Niezgodski Mike Szymanski Mindie Colanese Mindy Beier Monica Gates Monique Price Monty Peden Myrtle Crespo Nancy Bourlier Nancy Buss Nancy Cooks Nancy Coughlin Nancy Culp Nancy Deneen Nancy Jones Nancy Romo Nancy Schroder Nancy Stoutenour Nancy Wagenblast Natasha Akers Neil Miller Nichole Mammolenti Nick Matthews Nicole Braddock Nicole Moseley Nicole ThorsonNikki Teske Nora Hall Noreen Kazi Norena Kazmierczak Oscar Lopez Page Hoover Paige Mayers Pam Austin Pam Borton Pam Cecchi Pam Clowers Pam Creech Pam Garrett Pam Green Pam Stalbaum Pam Stump Pam Weaver Pamela Shirtz Pamela Staples Pamela Stearns Pamela Weesner Pat Chodzinski Pat Hayes Pat Jackowiak Pat Kruszka Pat Mc Cullough Pat Novitzki Pat Skaggs Pat Swihart Patrick Jordan Patrick Sawyer Patti Nemeth Patti O Toole Patti Powers Patty Birk Patty Randall Paul Gifford Paul Tipps Paula Monell Peg Kelley Peggy Adams Peggy Voorheis Penney Pruett Phil Allen Phil Hollett Phil Wiseman Philip Witges Phillip Witt Priscilla Warwick Rachel Alford Lipsey Rachel Goings Rachel Solmos Rae Hodgson Raeanna Lane Randy Crozier Randy Thornton Raquel Holdgrafer Ray Yarber Raychel Minasian Rebecca Puente Rebecca Schultz-Maniel Regina Kring Rene Mesaros Rene Pipp Renee Fleming Renee Hayes Retta Plantinga Rhonda Cox Rhonda Longley Rich Brubaker Rich Keel Richard Curran Richard Rogers Richard Russell Rick Lewis Rick Michalski Rick Piechocki Rick Rozenboom Ricky Mc Gee Riley Teeters RitaMolengraft Rob Hamilton Rob Nelson Rob Patrick Rob Romano Rob Triplett Robert Bartos Robert Mater Robin Koziczynski Robyn Minix Roger DePoy Romulo Nobrega Ron Zeltwanger Ronald Morrison Roni Schimmel Rose Cabanaw Rose Gutierrez Roxanne Bralick Ruben Cavazos Ruth Brittain Ryan Bell Ryan Burkhart Ryan Culp Ryan Fenstermaker Ryan Hough Sabrina Keel Sade Neal Saira Puga Resendiz Sally Arnold Sam Hicks Sam Kemp Samantha Jordan Samantha Luke Samantha Studt Samuel Gutierrez Rangel Sandra Blasko Sandra Marks Sandy Fisher Sandy Sharkey Sara Nelson Sara Zolman Sarah Engler Sarah Folk Sarah Harting Sarah Hodum Sarah Johnston Sarah Jurgenson Sarah Olsen Sarah Schrader Sarah Vanderreyden Scott Carter Scott Christner Scott Cramer Scott Geik Scott Shelly Sean Brady Sean Kearns Seth Zimmerman Shanda Ezell Shane Pippenger Shane Shidaker Shannon Franko Shannon Kesvormas Shannon Thompson Shannon Welborn Shanon Barnhart Shantel Knuth Sharon Colburn Sharon Meadows Sharon Nelson Sharon Tompkins Sharon Tucker Shawn Bradshaw Shawn Carlton Shayla Shembarger Shayna Miller Shea Wallace Sheila Borr Shelley Buck Shelley Connors Shelli Alexander Shelli Gulas Shelly Brown Shelly Pleasant Sheri Bartoli Sherrie Suddarth Sherry Kalk Sherry Little Sherry Martinkowski Sheryll Enright Solomon Anderson Sonia Turk Sonya Lee Sonya Marshall Stacey Lawton Stacey Watkins Stacey Wing Stacie Mills Stephanie Baeske Stephanie Becvar Stephanie Gonzales Stephanie Kuruzar Stephanie Schmucker Stephanie Siglawski Stephanie Swaby Stephen Rider Stephen Wood Steve Bush Steve Deck Steve Deranek Steve Dieringer Steve Hall Steve Neeser Steve Turcotte Steve Wessell Steven Perlewitz Sue Bowers Sue Ceglarek Sue Cybulski Sue Losievski SueNowicki Sue Richmond Susan May Susan Miller Susan Rettig Susan Rudecki Susie Berger Tabitha Rowe Tamara Goodwin Tamara Nees Tamara Simon Tami Baney Tammy Butler Tammy Litzkow Tammy Miller Tanisha Jones Tanya Vermande Tara Antonucci Tara Casper Tara Daniel Tara Hitt Taylor Zahrt Telesia Ealey Teresa Harwood Teresa Schwelnus Teri Whittington Terresa Younkin Terri Belcher Terri Day Terri Hynek Terri Scott Terry Batchelor Terry Dickerson Terry Fike Terry Freyer Terry Seely Tessah Venderlic Thelma Dell Theresa Bell Theresa Lough Tim Rice Tim Vander Plaats Timothy Gilleand Timothy Noble Tina Dougherty Tina Perkins Tina Scott Tirang Chaudhary Todd Bemenderfer Todd Franks Todd Pequignot Todd Smith Tom Bowman Tom Brown Tom Gerencser Tom Mc Carthy Tom Nowicki Tom Pietrzak Tom Shaw Tom Siddons Toni Mezzei Tonia Albright Tony Obringer Traci Gordon Traci Veschak Tracy Bishop Tracy Bradford Tracy Edwards Tracy Foreman Tracy Harvey Tracy Jones Tracy Karafa-Chrzan Tracy Leopold Tracy Wise Trina Swank Trish Klein Trish Lahey Trish Sarkisian Trisha Freyer Valerie Weis Velda Davidson Vicki Sikora Vicki Warner Vickie Pinckert Vicky Conrad Victoria Keldsen Victoria Stanley Virginia Blythe Wayne Hawn Wayne Roller Weijia Qu William Rohwer
OFFICERS
Christopher J. Murphy III _____________________________________ Chairman of the Board, President and Chief Executive Officer
James R. Seitz _____________________________________________ Executive Vice President
Andrea G. Short ____________________________________________ Treasurer and Chief Financial Officer
John B. Griffith _____________________________________________ Secretary and General Counsel
DIRECTORS
Allison N. Egidi _____________________________________________ Director of Development, University of Virginia
Daniel B. Fitzpatrick _________________________________________ Chairman and Chief Executive Officer, Quality Dining, Inc.
Tracy D. Graham ____________________________________________ Managing Principal, Graham Allen Partners
Wellington D. Jones III _______________________________________ Vice Chairman of the Board
Craig A. Kapson ____________________________________________ President, Jordan Automotive Group
Najeeb A. Khan ____________________________________________ Chairman and Chief Executive Officer, Interlogic Outsourcing, Inc.
Vinod M. Khlinani ____________________________________________ Retired Executive Chairman of the Board, CTS Corporation
Rex Martin ________________________________________________ Chairman and Chief Executive Officer, NIBCO, Inc.
Christopher J. Murphy III _____________________________________ Chairman, President and Chief Executive Officer
Christopher J. Murphy IV _____________________________________ Chief Operating Officer, Owner and Executive Director, Catharsis Productions, LLC
Timothy K. Ozark ___________________________________________ Chairman and Chief Executive Officer, Aim Financial Corporation
John T. Phair _______________________________________________ President, Holladay Properties
Mark D. Schwabero _________________________________________ President, Mercury Marine
OFFICERS
Christopher J. Murphy III _____________________________________ Chairman of the Board and Chief Executive Officer
James R. Seitz _____________________________________________ President, 1st Source Bank
Andrea G. Short ____________________________________________ Treasurer and Chief Financial Officer
Jeffrey L. Buhr _____________________________________________ Chief Credit Officer
John B. Griffith _____________________________________________ Executive Vice President, Secretary and General Counsel
Steven J. Wessell ___________________________________________ Executive Vice President, Private Banking, Wealth Management, Insurance, Information Technology
Allen R. Qualey _____________________________________________ President, Specialty Finance Group

P.O. Box 1602, South Bend, IN 46634© 2014 1st Source Corporation all rights reserved.